


Abstract
Investigating the spatial correlation characteristics and configurational pathways of ecological space service value (ESSV) is of importance for alleviating urban ecological pressure. This study, focusing on the northern slope of the Tianshan Mountains in China, employs the modified value equivalent method, gravity model, and configurational analysis model to elucidate the spatiotemporal evolution mechanisms of ESSV. The results demonstrate that: (1) The extent of ecological space decreased sharply (328.25 km2), primarily converting to other ecological space. Among these, the grassland ecological space experienced the largest reduction (215.34 km2), whereas the decline in forest ecological space was relatively modest (58.85 km2). (2) ESSV showed a fluctuating but overall increasing trend, with ΔESSV dominated by negative changes. Spatially, the pattern was characterized by higher values in the west, lower values in the east, and a contiguous high-value area in the central region. (3) The network of ESSV exhibited multiple connections and multiple cores, with the strength of network linkages continuously strengthening and showing a trend of expansion from the central region toward the south and north. (4) High ESSV depends on the configurational effects of multidimensional resilience factors. Several configurational modes were identified, including single-core resilience-driven and multi-dimensional resilience synergy-driven modes.
1. Introduction
Defined as a spatial entity primarily composed of natural ecosystems, ecological space integrates both ecosystem service functions and socio-cultural values [1]. It plays a critical role in alleviating urban resource and environmental pressures, enhancing resilience, and facilitating urban green transitions and sustainable societal development [2]. Rapid urban expansion and accelerated industrialization have led to a sharp decline in the extent of ecological space, a precipitous drop in its service capacity, and frequent ecological risks—issues that have become urgent challenges for urban development [3]. In arid regions, where ecological endowments are particularly scarce, ecological space not only serves as the foundational base for conserving scarce water and soil resources but also acts as a key barrier against land desertification and ecological risks [4].
To accurately assess ecosystem service capacity, the academic community has predominantly adopted the value equivalent method. This approach, grounded in standardized equivalent factors, offers advantages such as minimal parameter requirements and strong cross-regional comparability [5]. Building upon this foundation, and distinguishing itself from research paradigms that focus on the feedback between ecological network patterns and ecological functions [6,7], this study integrates a gravity model with the fsQCA model to systematically investigate the spatiotemporal network evolution characteristics and multi-factor composite driving mechanisms of ecological space service value (ESSV) in arid zones.
Although substantial research has been conducted on ecosystem service value (ESV) [8,9], existing valuation frameworks remain predominantly homogenized, failing to capture the heterogeneous characteristics of service values across distinct ecological space types such as forest ecological space, grassland ecological space, and water ecological space. Furthermore, the characterization of inter-regional interactions in service value remains insufficient, and the exploration of configurational pathways linking multiple factors is still lacking.
Addressing ecological fragility in arid zones, accurately elucidating the evolutionary mechanisms of ESSV has become central to improving urban ecological governance. On the northern slope of the Tianshan Mountains, where ecological vulnerability and disordered urban expansion have led to increasingly severe grassland degradation, land desertification, and imbalanced water resource distribution under typical arid climate conditions, this study takes this region as its research area. We investigate the spatiotemporal evolution characteristics of its ESSV and, from multidimensional perspectives including social, economic, and ecological factors, explore the configurational pathways through which different combinations of elements influence ESV. Our findings aim to provide a scientific basis for ecological environmental management and the development of resilient cities on the northern slope of the Tianshan Mountains.
2. Literature Review
Ecological spaces provide diverse ecosystem services, including regulating, provisioning, supporting, and cultural services, and are central to urban environmental governance [10]. Research on ecological spaces has evolved beyond the traditional, static analytical frameworks of landscape ecology [11]. It increasingly integrates theories of urban resilience, ecosystem service assessment frameworks, and spatial planning principles [12], progressively moving towards a multi-scale and multifunctional understanding of ecological space systems [13].
As a key attribute of ecological space, ESV serves not only as a monetary metric of its economic utility but also as a foundational source of urban system resilience [14]. Substantial research progress has been made in this field. For ESV quantification, prevalent methodologies include the value equivalent method [15], the ecological footprint approach [16], and the market valuation method [17], among others. Among these, the value equivalent method quantifies and enables spatial comparison of diverse ecosystem services by applying standardized equivalent factors to a baseline of relative value per unit area. Pioneered by Costanza [18] and later refined for Chinese ecosystems by Xie Gaodi’s research team, this method has become a mainstream paradigm for ecological valuation globally. Its core strengths lie in enabling comprehensive assessment of ecosystem service functions, facilitating spatiotemporal comparative analyses of ESV across regions [19]. However, existing research has largely focused on the ecosystem as a whole, while studies on service value measurement centered on “ecological space” as a core theme remain relatively scarce [20,21]. ESSV refers to the utility provided by natural ecosystem-dominated areas, including forest ecological space, grassland ecological space, and water ecological space, in aspects such as climate regulation and water conservation, thereby contributing to sustainable societal development. It represents the quantitative characterization of the value inherent in the synergy of production, living, and ecological functions within ecological space.
The spatiotemporal patterns and supply–demand relationships of ESV exhibit marked spatial scale dependence. Both the driving mechanisms and differentiation patterns of ESV vary across spatial scales, and the development priorities and policy contexts of different cities further shape the spatiotemporal evolution of ESV [22,23]. Building on this foundation, research on the network of ESSV has further advanced beyond the conventional scale analysis that tends to downplay inter-regional interactions. By constructing a spatial correlation network of service value, such studies reveal the flow pathways, spillover effects, and network topological structures of service value across regions. This provides a novel analytical paradigm for understanding the supply–demand balance of ecosystem services under multi-scale, multi-region coordination [24,25].
Beyond scale, substantial research has focused on delineating the relationships between ESV and individual drivers, including land use change [26], industrialization level, intensity of human activities [27], and urban expansion [28]. Zhang et al. employed the Futures model to simulate long-term urban expansion in Hohhot and examined the relationship between urbanization and ESV across past and future periods [29]. Other scholars, based on value gain-loss analysis, have calculated regional ecological compensation funds to delineate multi-level ecological compensation zones and formulate differentiated compensation strategies [30]. Regarding the interactive effects of multiple factors, many scholars have adopted methods such as multiple regression [31], geographical detector [32], geographically weighted regression [33], and elasticity analysis models [34] to explore the spatiotemporal effects of social, economic, and other factors on ESV. In contrast to the aforementioned approaches that emphasize the effects of individual factors or pairwise interactions, fsQCA adopts a configurational perspective. It enables the identification of configurational pathways through which various combinations of social, economic, and ecological factors influence ESV, while also detecting causal asymmetry and multiple concurrent causalities. This provides a suitable analytical tool for understanding the multi-factor composite driving mechanisms in arid zones [35].
Within the domain of spatial planning, research centers on the optimization and governance of ecological spaces during urbanization [36]. The scientific basis for identifying and planning ecological spaces is enhanced through frameworks such as the “dual-assessment” technical system and the delineation of ecological conservation redlines. This integrated approach synergistically couples baseline constraints with development guidance, while the subsequent demarcation of ecological redlines further strengthens the regulatory control over these spaces [37].
In summary, while substantial research has advanced the understanding of ecosystem services, critical knowledge gaps remain in the following areas: 1. Current valuation frameworks predominantly focus on ecosystems as a whole, failing to capture the heterogeneous characteristics of service values across distinct ecological space types such as forest ecological space, grassland ecological space, and water ecological space. 2. There is a lack of research on inter-regional interactions of ecological service value, leaving the spatiotemporal network evolution mechanisms poorly understood. 3. Analyses of influencing factors are largely confined to single factors or linear interactions, with insufficient exploration of configurational pathways involving multiple factors.
3. Materials and Methods
3.1. Study Area
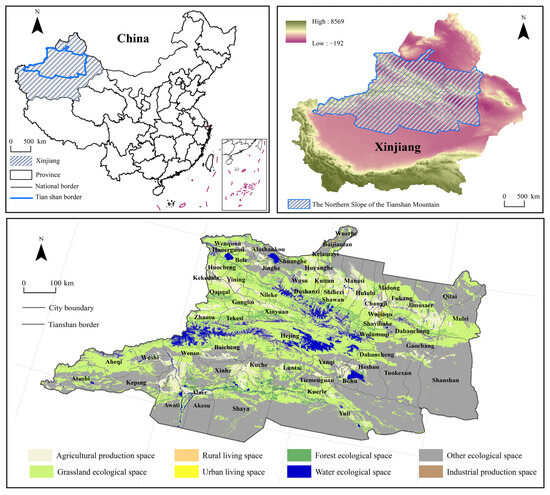
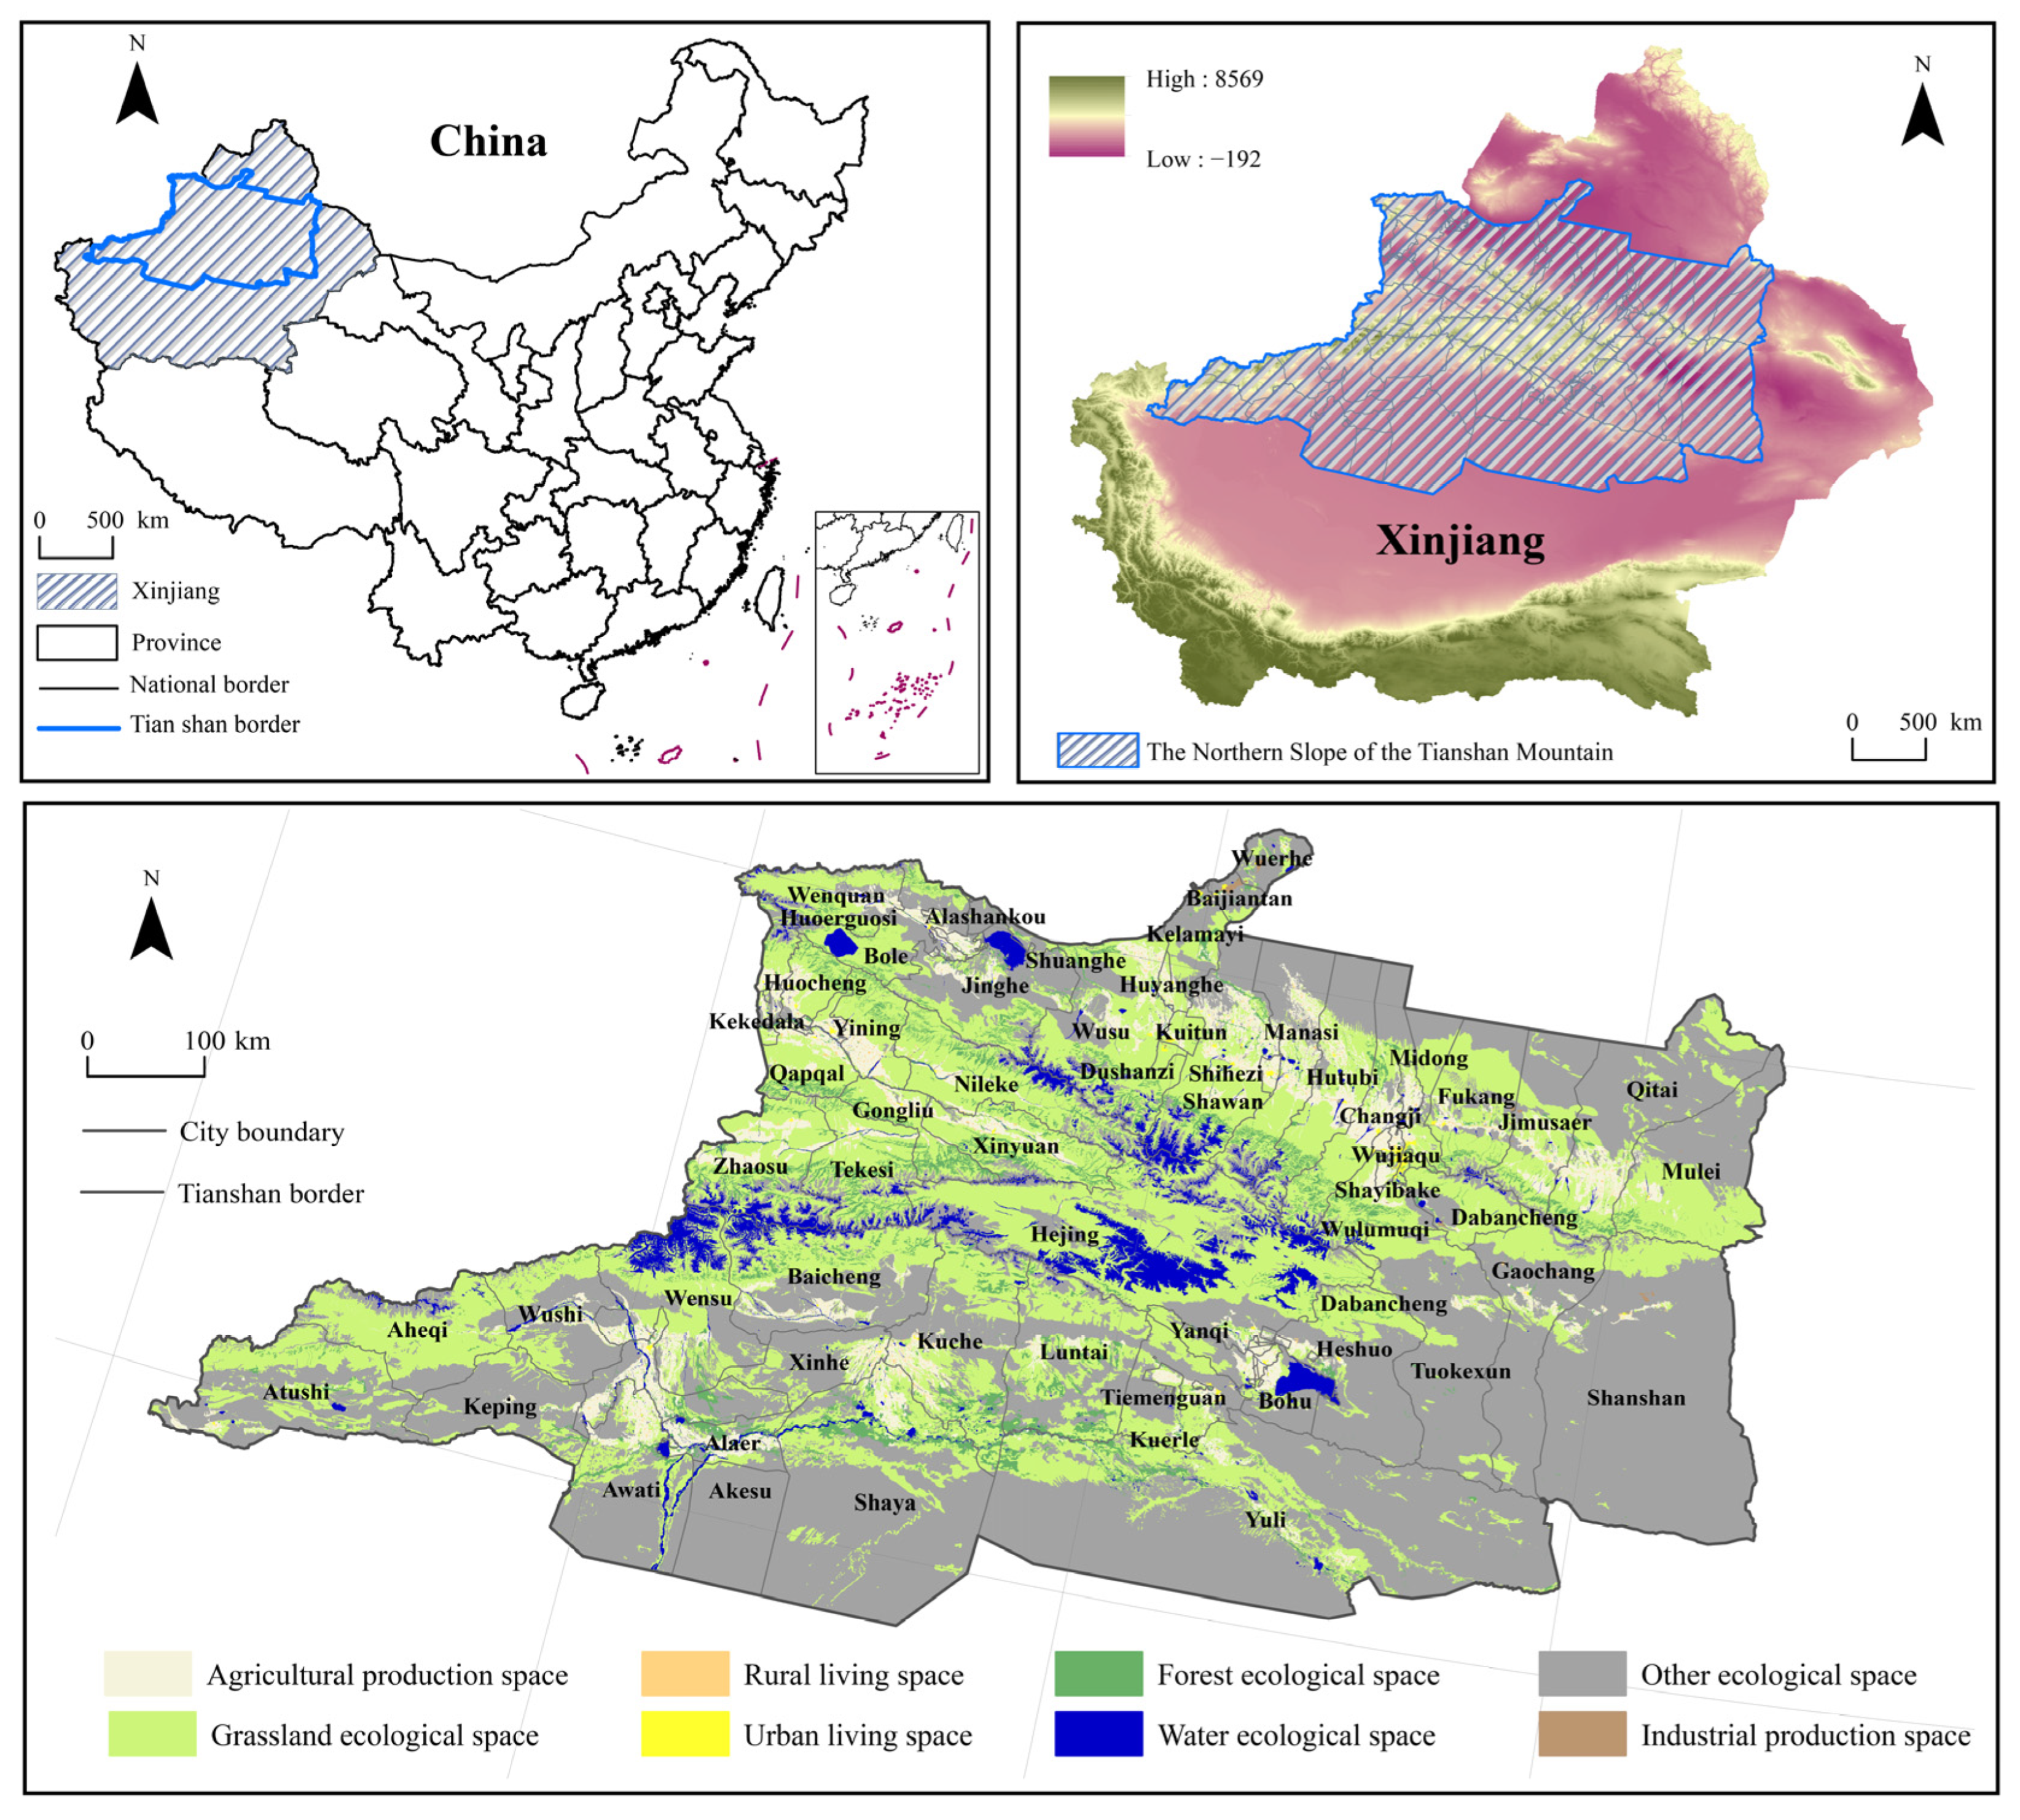
Situated in the central and northern parts of China’s Xinjiang Uygur Autonomous Region (Figure 1), the northern slope of the Tianshan Mountains features high altitude and significant topographical relief, encompassing major cities such as Urumqi, Changji, and Shihezi. The region experiences a temperate continental climate, characterized by cold, dry winters and warm, humid summers, which typifies its arid zone attributes [38]. Serving as a vital industrial, agricultural, and transportation hub in Xinjiang, it exhibits a relatively high level of economic development and well-developed infrastructure. However, due to ecological fragility and disordered urban expansion, the area is confronted with severe environmental challenges, including intensified soil erosion, grassland degradation, land desertification, and imbalanced water resource distribution.
Figure 1.
The northern slope of the Tianshan Mountains.
3.2. Research Framework
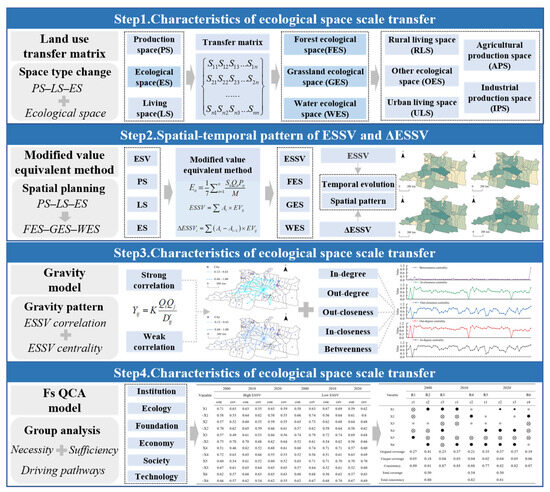
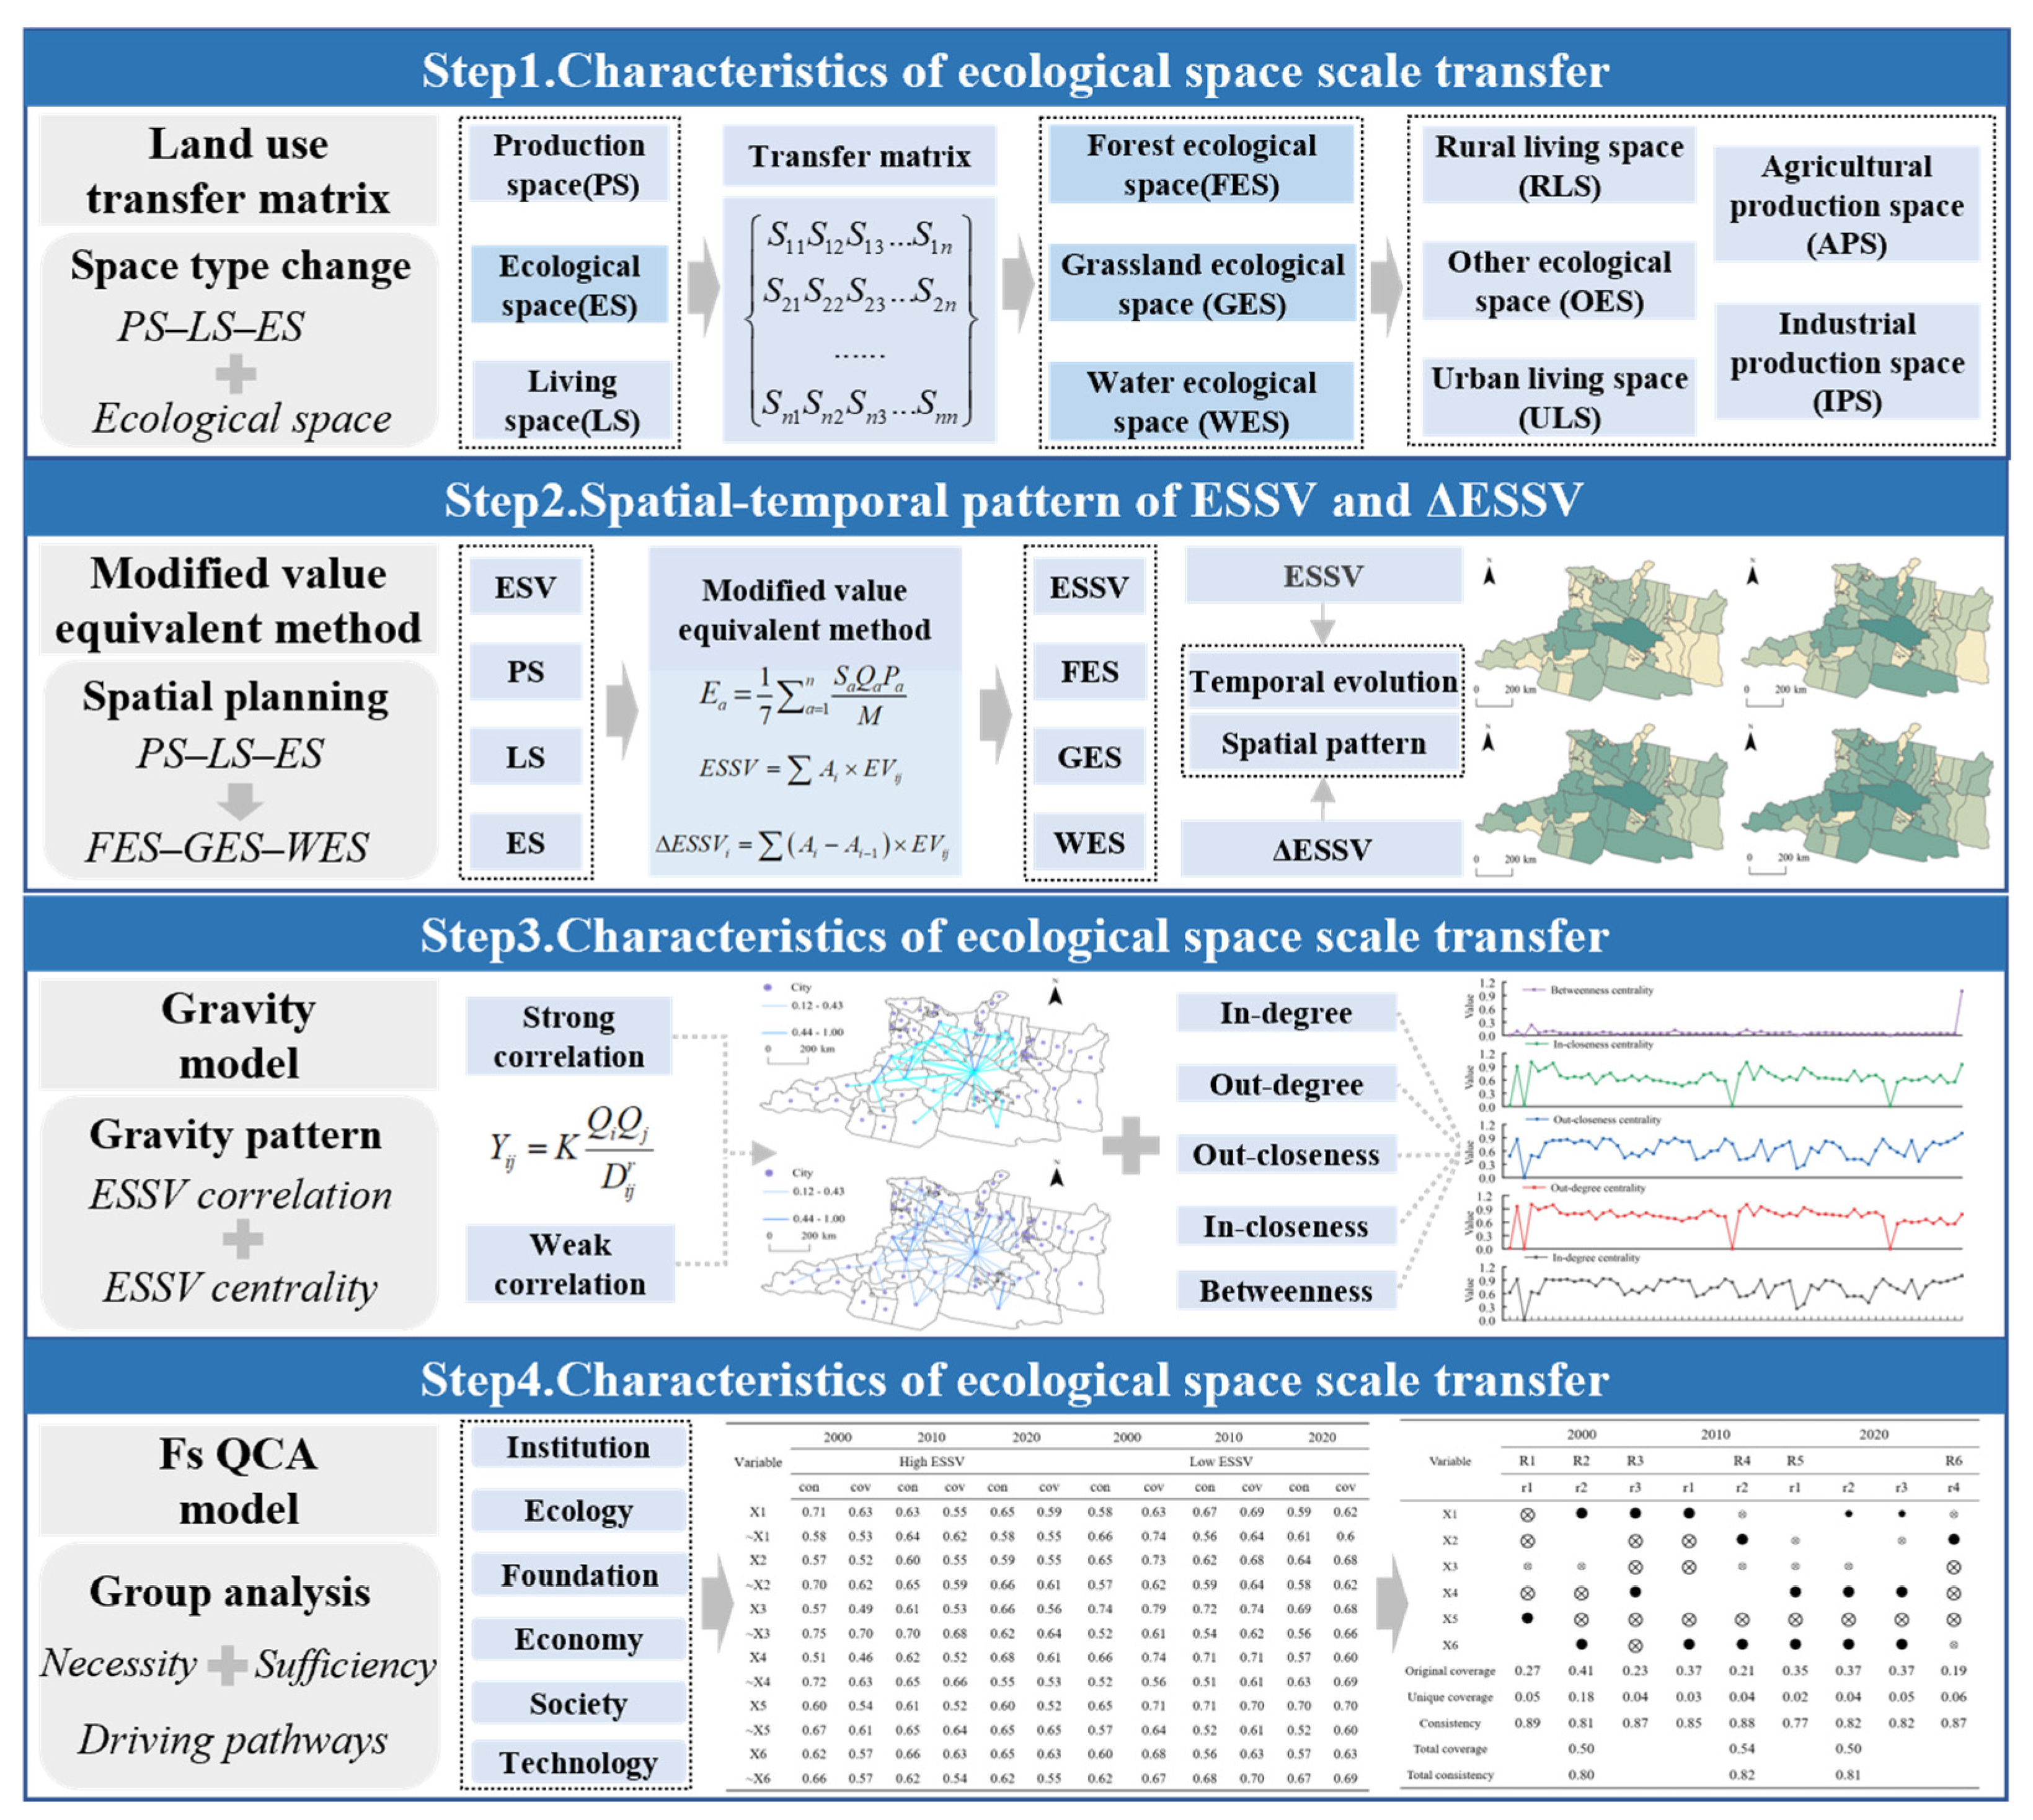
This study investigates the dynamic evolution mechanisms of ESSV in arid zones by establishing an analytical framework encompassing scale conversion, value assessment, network analysis, and driver identification (Figure 2). Based on the “Production–living–ecological space” (PLES) classification system, we deconstruct the ecosystem service value equivalent table and develop a valuation system incorporating forest ecological space (FES), grassland ecological space (GES), and water ecological space (WES). Employing the modified value equivalent method, we accurately assess the ESSV within the study area and analyze the spatiotemporal dynamics of both ecological space extent and its service value. Utilizing a gravity model, we characterize the topological structure and evolutionary patterns of the spatial correlation network for inter-regional ESSV. Finally, applying the fsQCA configurational approach, we systematically elucidate the impact pathways of diverse factor combinations on ESSV from multidimensional perspectives—social, economic, ecological, and infrastructural—thereby offering scientific insights for ecological space governance in arid zones.
Figure 2.
Research framework.
3.3. Research Methods
- Land use transfer matrix
The land use transfer matrix quantitatively represents the conversion relationships between land use types over a defined period in a matrix format. In this matrix, the rows denote the initial land use types, and the columns denote the resultant land use types [39]. The calculation formula is as follows:
where Sij is the total area of land use conversion across all land use types; i is the initial land use type in the study area; j is the final land use type in the study area; n is the number of land use categories before and after conversion.
- Measurement of ESSV
Based on existing research results [40], the land use types in the northern slope of the Tianshan Mountains were reclassified, and the value equivalence table was revised (Table 1) based on the actual ecological characteristics of the region and the main ecological spaces classified by the classification of PLES (Table 2) [41,42,43]. At the same time, based on agricultural production circumstances, the value of various types of ecological spaces in the middle Tianshan Mountain region was assessed, and the loss of ESSV was computed. The particular formula is as follows:
Table 1.
ESSV equivalence table.
Table 2.
PLES classification system.
Among them, ESSV is the ecological space service value of the research region, essentially containing three categories of ecological space: forest ecological space (FES), grassland ecological space (GES), and water ecological space (WES), excluding other ecological space (OES). Ea is the value equivalent modified according to the production state of agricultural goods. Sa is the planting area (hm2) of a-th grain crop. Pa is the average price of a-th grain crop. Qa is the average yield of a-th grain crop. M is the total sowing area of grain crops in the research region, which comprises four types of grain crops: maize, wheat, soybeans, and rice. The findings derived using formula 1 reveal that the Ea values for the years 2000, 2005, 2010, 2015, and 2020 were 749.85, 1122.27, 1942.21, 2377.65, and 2364.93, respectively; EVij is the unit area value equivalent of the j-th ecological service function of i-th ecological space type; Ai is the area of i-th ecological space type; ΔESSVi is the change in the value of ecological space in i-th year.
- Gravity model
The gravity model derives from the idea of universal gravitation and follows the development law of attenuation with distance and increase with mass. It is widely used to measure the interrelationships between geographical objects [44]. Therefore, this work employs the gravity model to characterize the attraction features of the ESSV between cities on the northern slope of the Tianshan Mountains. The formula is as follows:
where Yij represents the strength of the ESSV correlation between the i-th city and j-th city; Qi and Qj are the ESSV of the i-th city and j-th city, respectively; Dij represents the shortest distance between cities, r is the friction coefficient, generally taken as 2, and Kij is the gravitational coefficient, taken as 1.
- fsQCA model
fsQCA constitutes a novel research paradigm in social science that transcends conventional qualitative and quantitative dichotomies. By employing principles from Boolean algebra and set theory, it delineates differentiated causal pathways to an outcome, thereby enabling the effective identification and clarification of the configurational impact of independent variables on a dependent variable [45,46].
The dependent variable in this study is the ESSV on the northern slope of the Tianshan Mountains, the sustainability of which is contingent upon urban resilience. Resilience, defined as the capacity of an urban system to withstand disturbances and maintain functionality, encompasses multiple dimensions, including ecological, economic, infrastructural, technological, social, and institutional resilience. Accordingly, this study selects core indicators to represent these six resilience dimensions [47,48,49] as the independent variables within the fsQCA analytical framework. Detailed descriptions of these indicators are provided in Table 3.
Table 3.
Antecedent variables of multidimensional resilience.
3.4. Data Sources
The study period spans from 2000 to 2020. The data primarily consist of three categories: land use data, socioeconomic data, and administrative boundary data. (1) Land use data were obtained from the 30 m resolution land use remote sensing monitoring dataset provided by the Resource and Environment Science and Data Center, Chinese Academy of Sciences. Available online: https://www.resdc.cn (accessed on 12 November 2025). (2) Socioeconomic data were sourced from the China Urban Statistical Yearbook, China Urban Construction Statistical Yearbook, China Statistical Yearbook on Environment, and various provincial and municipal statistical yearbooks. Data on agricultural product prices were derived from the Compilation of Cost–Benefit Data of National Agricultural Products for the years 2000–2020. (3) Administrative boundary vector data were acquired from the Resource and Environment Science and Data Center, Chinese Academy of Sciences. Available online: https://www.resdc.cn (accessed on 12 November 2025). For partially missing data, the ordinary kriging interpolation method was applied, and mean values were calculated to fill the gaps [50,51].
4. Results
4.1. Characteristics of Ecological Space Scale Transfer
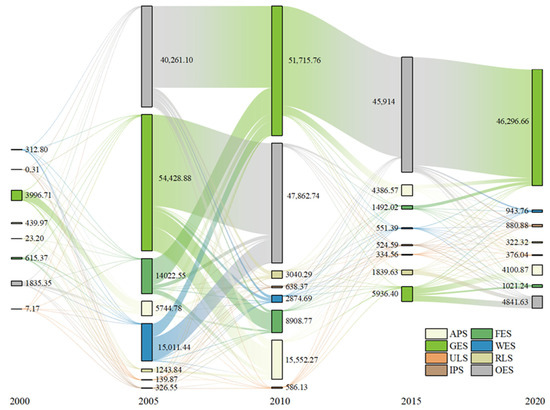
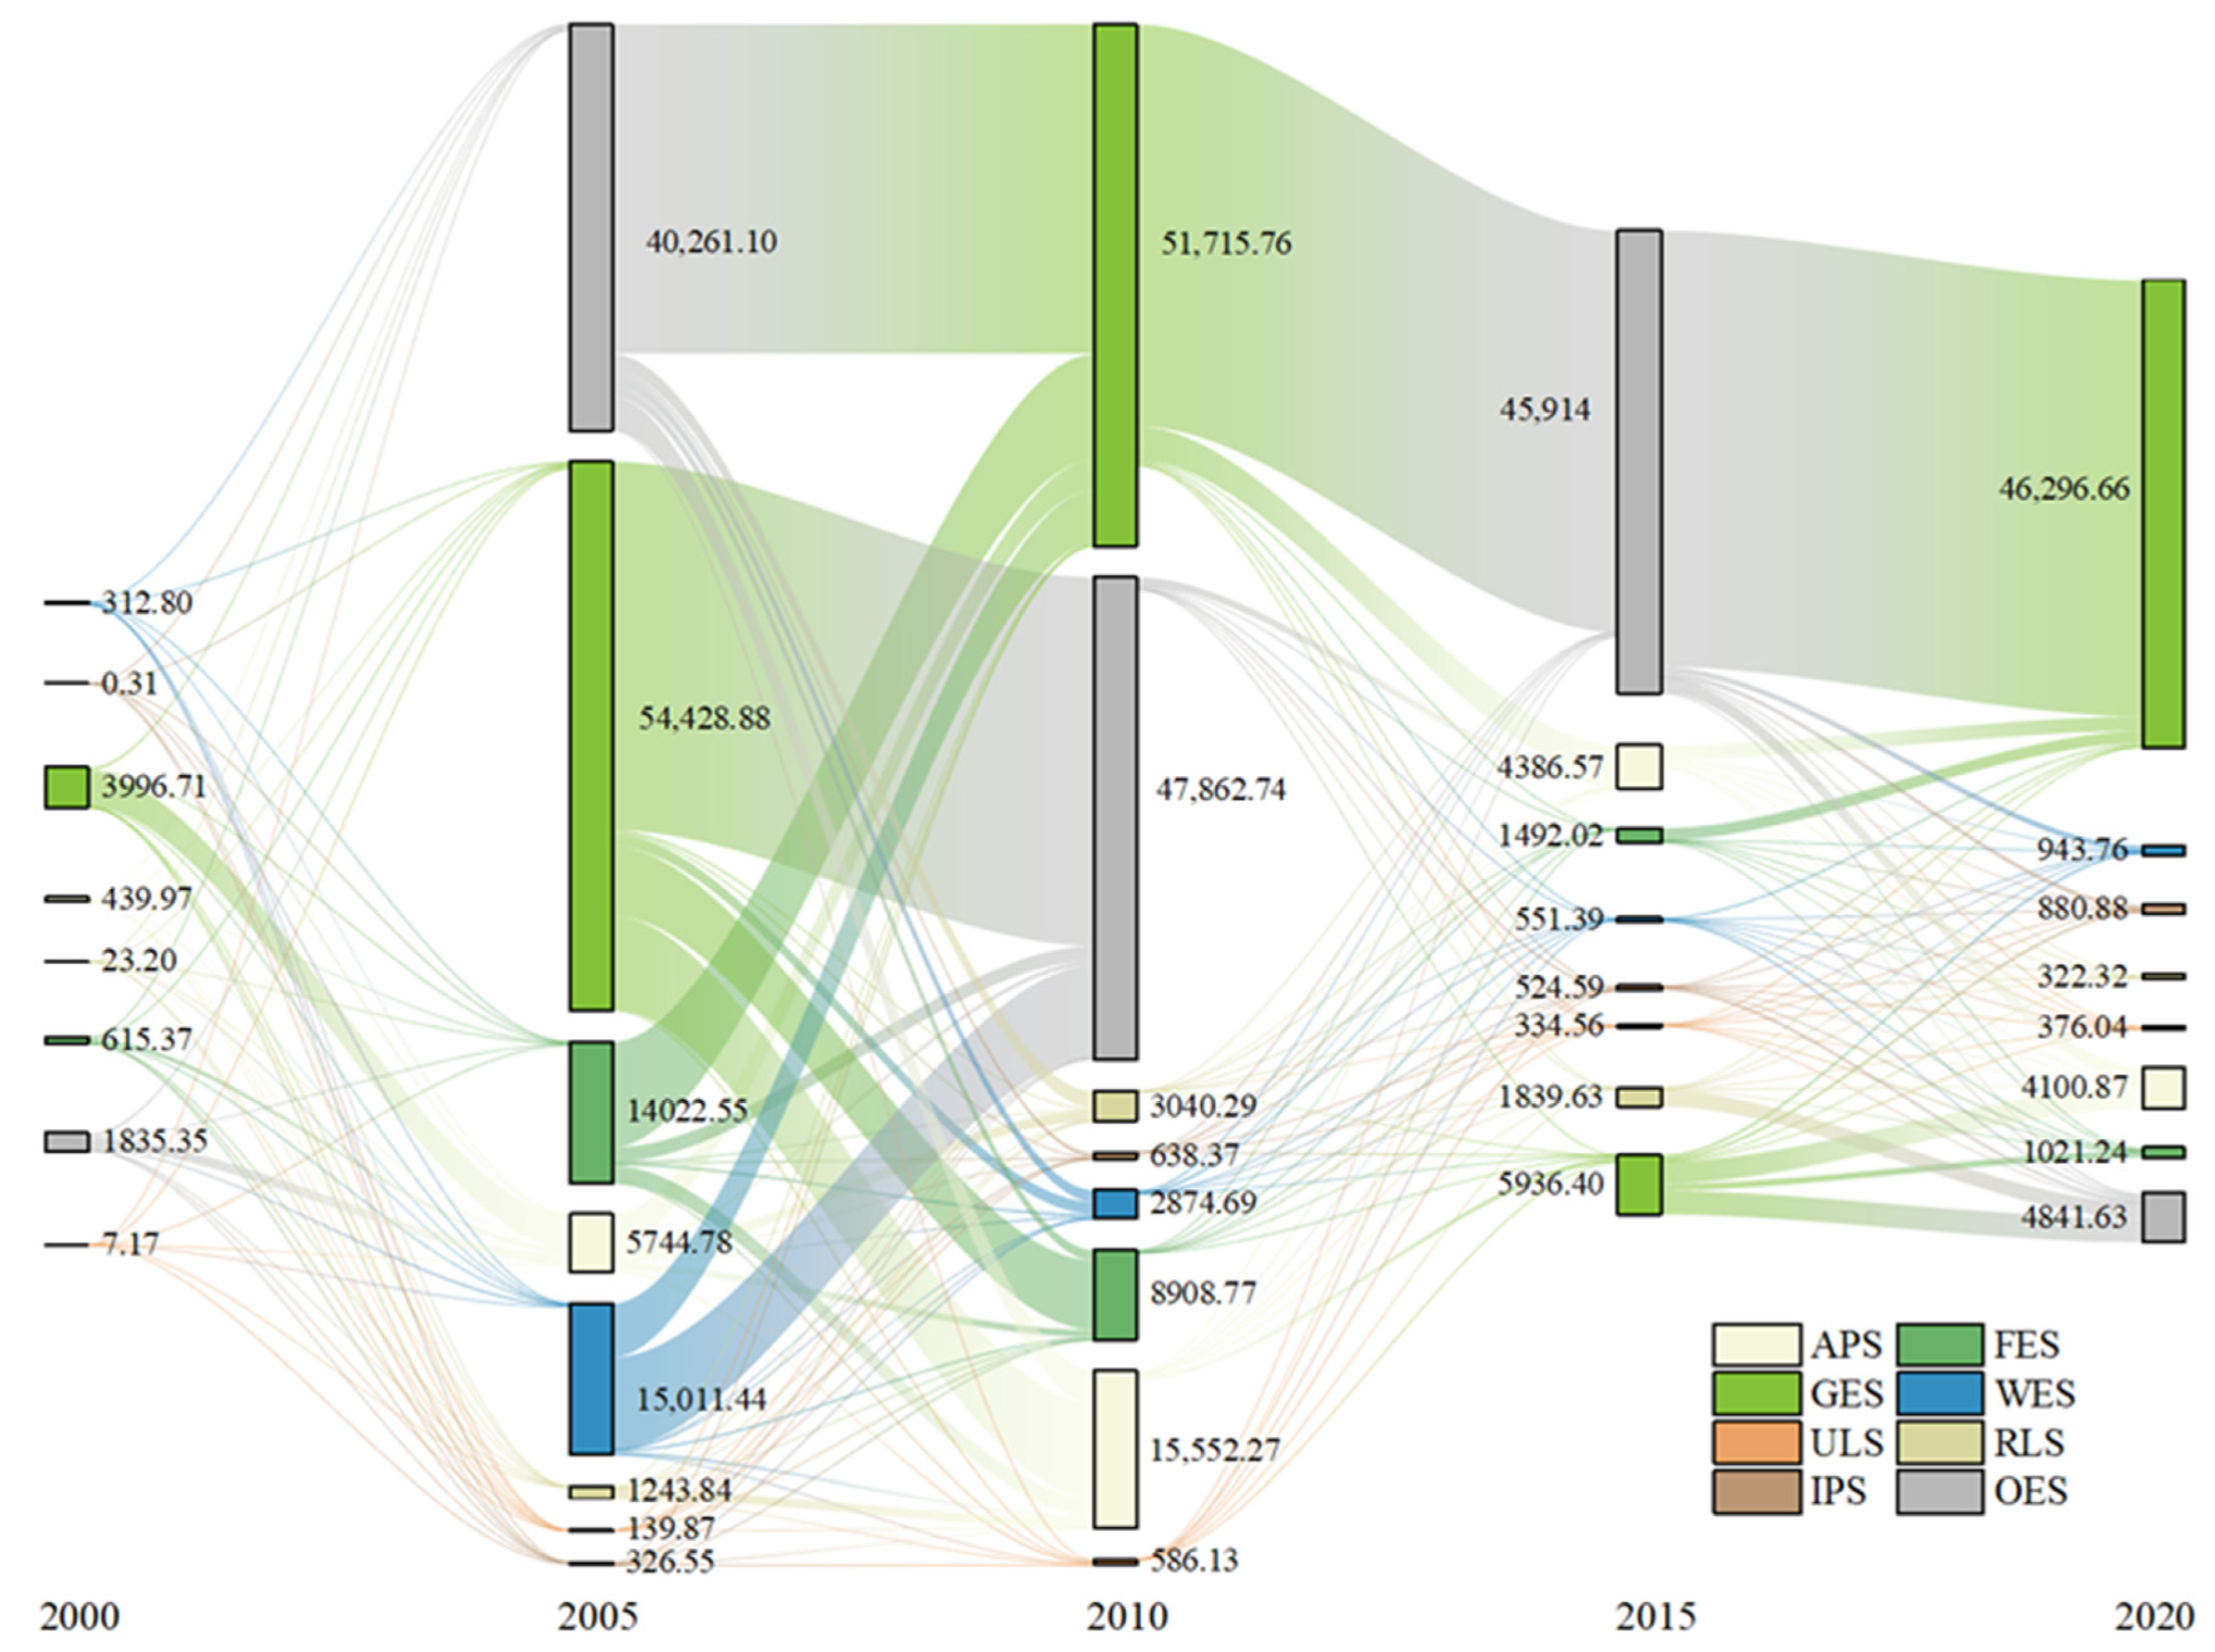
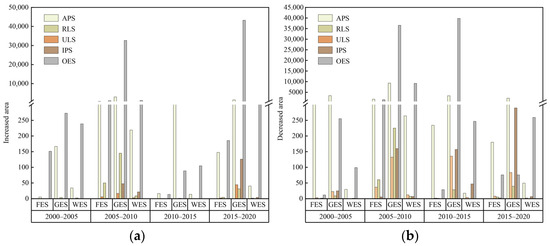
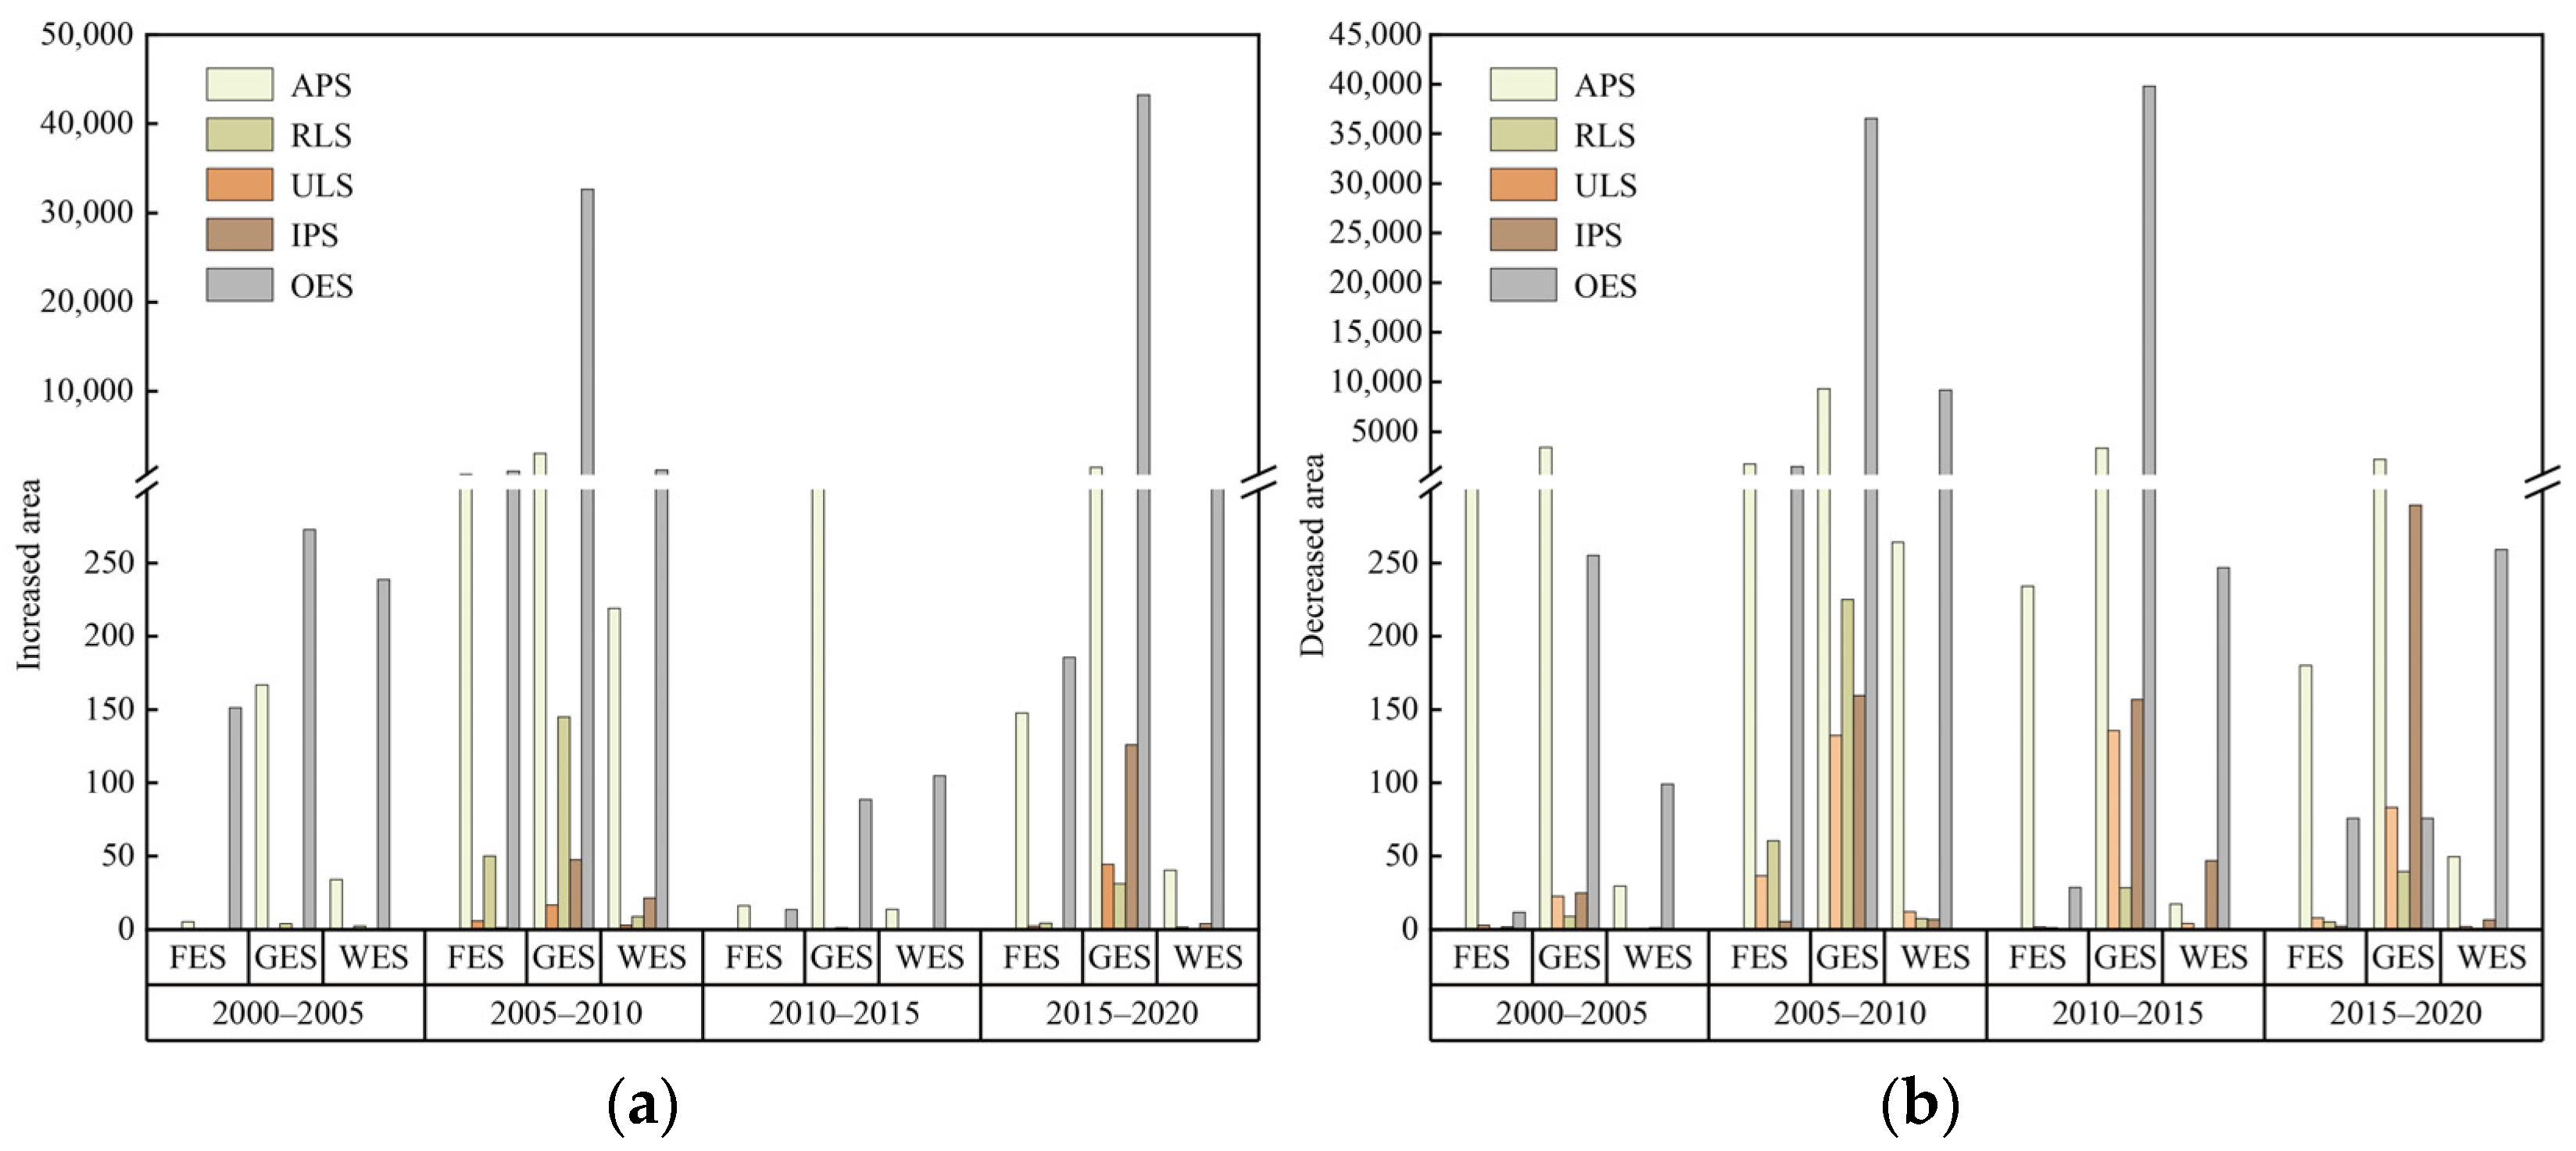
Utilizing a land use transfer matrix, we analyzed the conversion scales of various space types on the northern slope of the Tianshan Mountains from 2000 to 2020, with the scale conversions visualized using Sankey diagrams. The results are shown in Figure 3 and Figure 4: From 2000 to 2005, the extent of GES decreased sharply by 3268.43 km2, while IPS expanded rapidly by 172.18 km2. The lost GES was converted primarily to APS and OES. Concurrently, the newly gained IPS originated mainly from OES (137.65 km2). From 2005 to 2010, the reduction in GES continued, with a net loss of 2713.12 km2. This decrease was predominantly converted to OES (36523.17 km2) and APS (9299.49 km2).
Figure 3.
PLES transfer Sang Ki chart.
Figure 4.
Scale of ecological space conversion: (a) Increase in ecological space area during 2000–2020; (b) Decrease in ecological space area during 2000–2020.
Notably, a substantial reduction occurred in WES (12,136.76 km2), which was primarily converted to GES (5355.17 km2) and OES (9161.32 km2). During 2010–2015, the extent of GES continued to decline markedly (42,951.72 km2), while the contraction rate of WES (137.93 km2) decelerated compared to the preceding period. Concurrently, FES (798.42 km2) shifted from a state of relative stability to a decreasing trend. From 2015 to 2020, the area of FES continued to diminish. In contrast, both GES and WES exhibited significant expansion. Specifically, GES increased by 40,360.26 km2, predominantly originating from conversions of OES. However, due to the inherently poor ecological baseline conditions of source areas such as sandy land and bare land, the resulting grassland ecosystems are characterized by simple structure and weak functionality. Consequently, their ecological quality and stability remain substantially lower than those of the original natural grasslands.
4.2. Spatial-Temporal Pattern of ESSV
4.2.1. Characteristics of Temporal Changes in ESSV
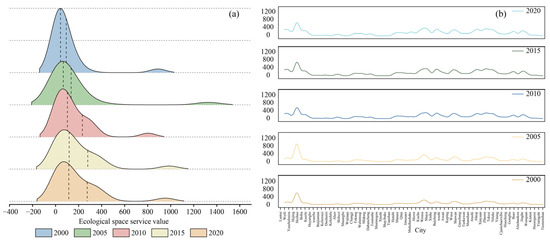
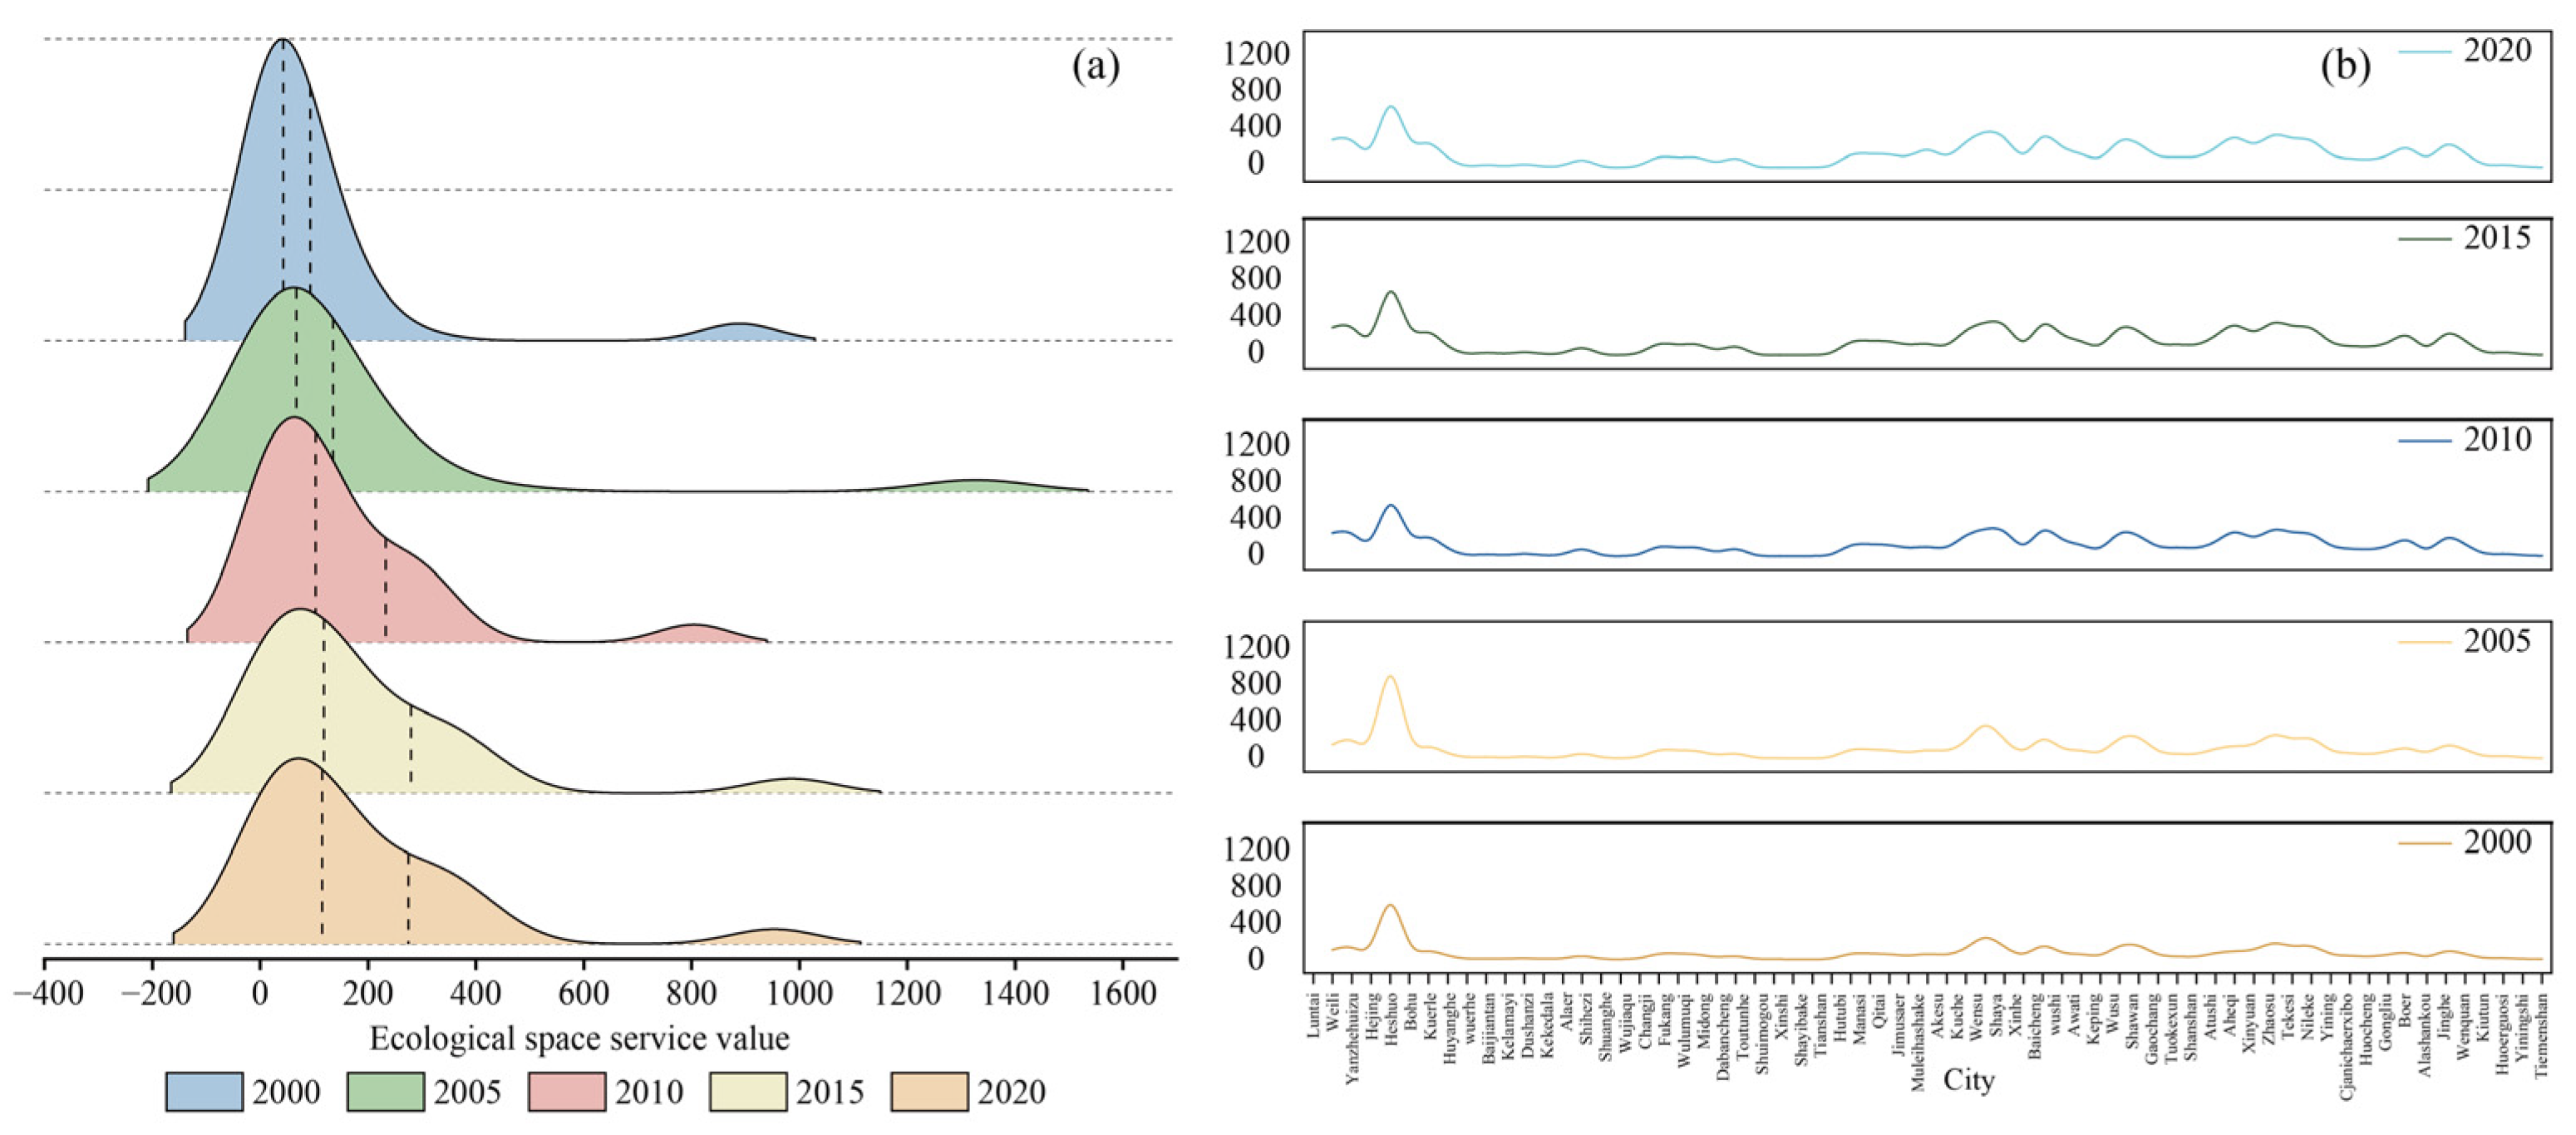
The ESSV on the northern slope of the Tianshan Mountains was quantified using the value equivalent method, with results presented in Figure 5. The horizontal axis represents ESSV, and the two vertical dashed lines denote the 50th and 75th percentiles, respectively, illustrating the central tendency and spread of the value distribution for the northern slope of the Tianshan Mountains. A rightward shift in these percentile lines, coupled with a continuous decrease in peak height and a gradual increase in curve coverage width, indicates a gradual increase in ESSV and an emerging clustering of high values across the region. At the city level, ESSV exhibits fluctuating temporal characteristics, revealing significant spatial heterogeneity and persistence: some cities consistently maintain high values, such as Hejing (804.14–1326.87) and Wensu (292.98–448.25), while others remain at persistently low levels, such as Tiemenguan (2.62–7.29) and Yining (4.73–12.66), demonstrating a pronounced regional lock-in effect.
Figure 5.
Temporal variation characteristics of ESSV during 2000–2020: (a) Kernel density curve of ESSV; (b) Change curve of ESSV in the city.
4.2.2. Characteristics of Spatial Changes in ESSV
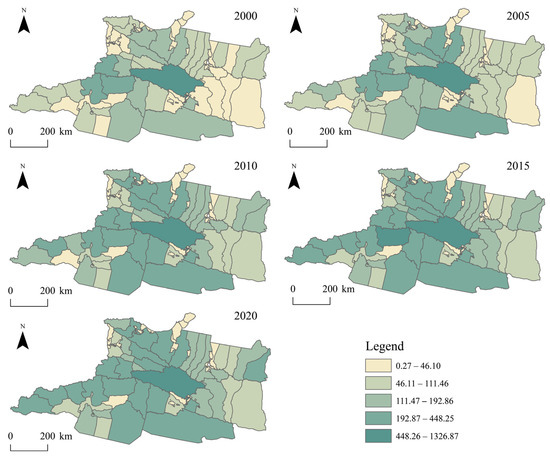
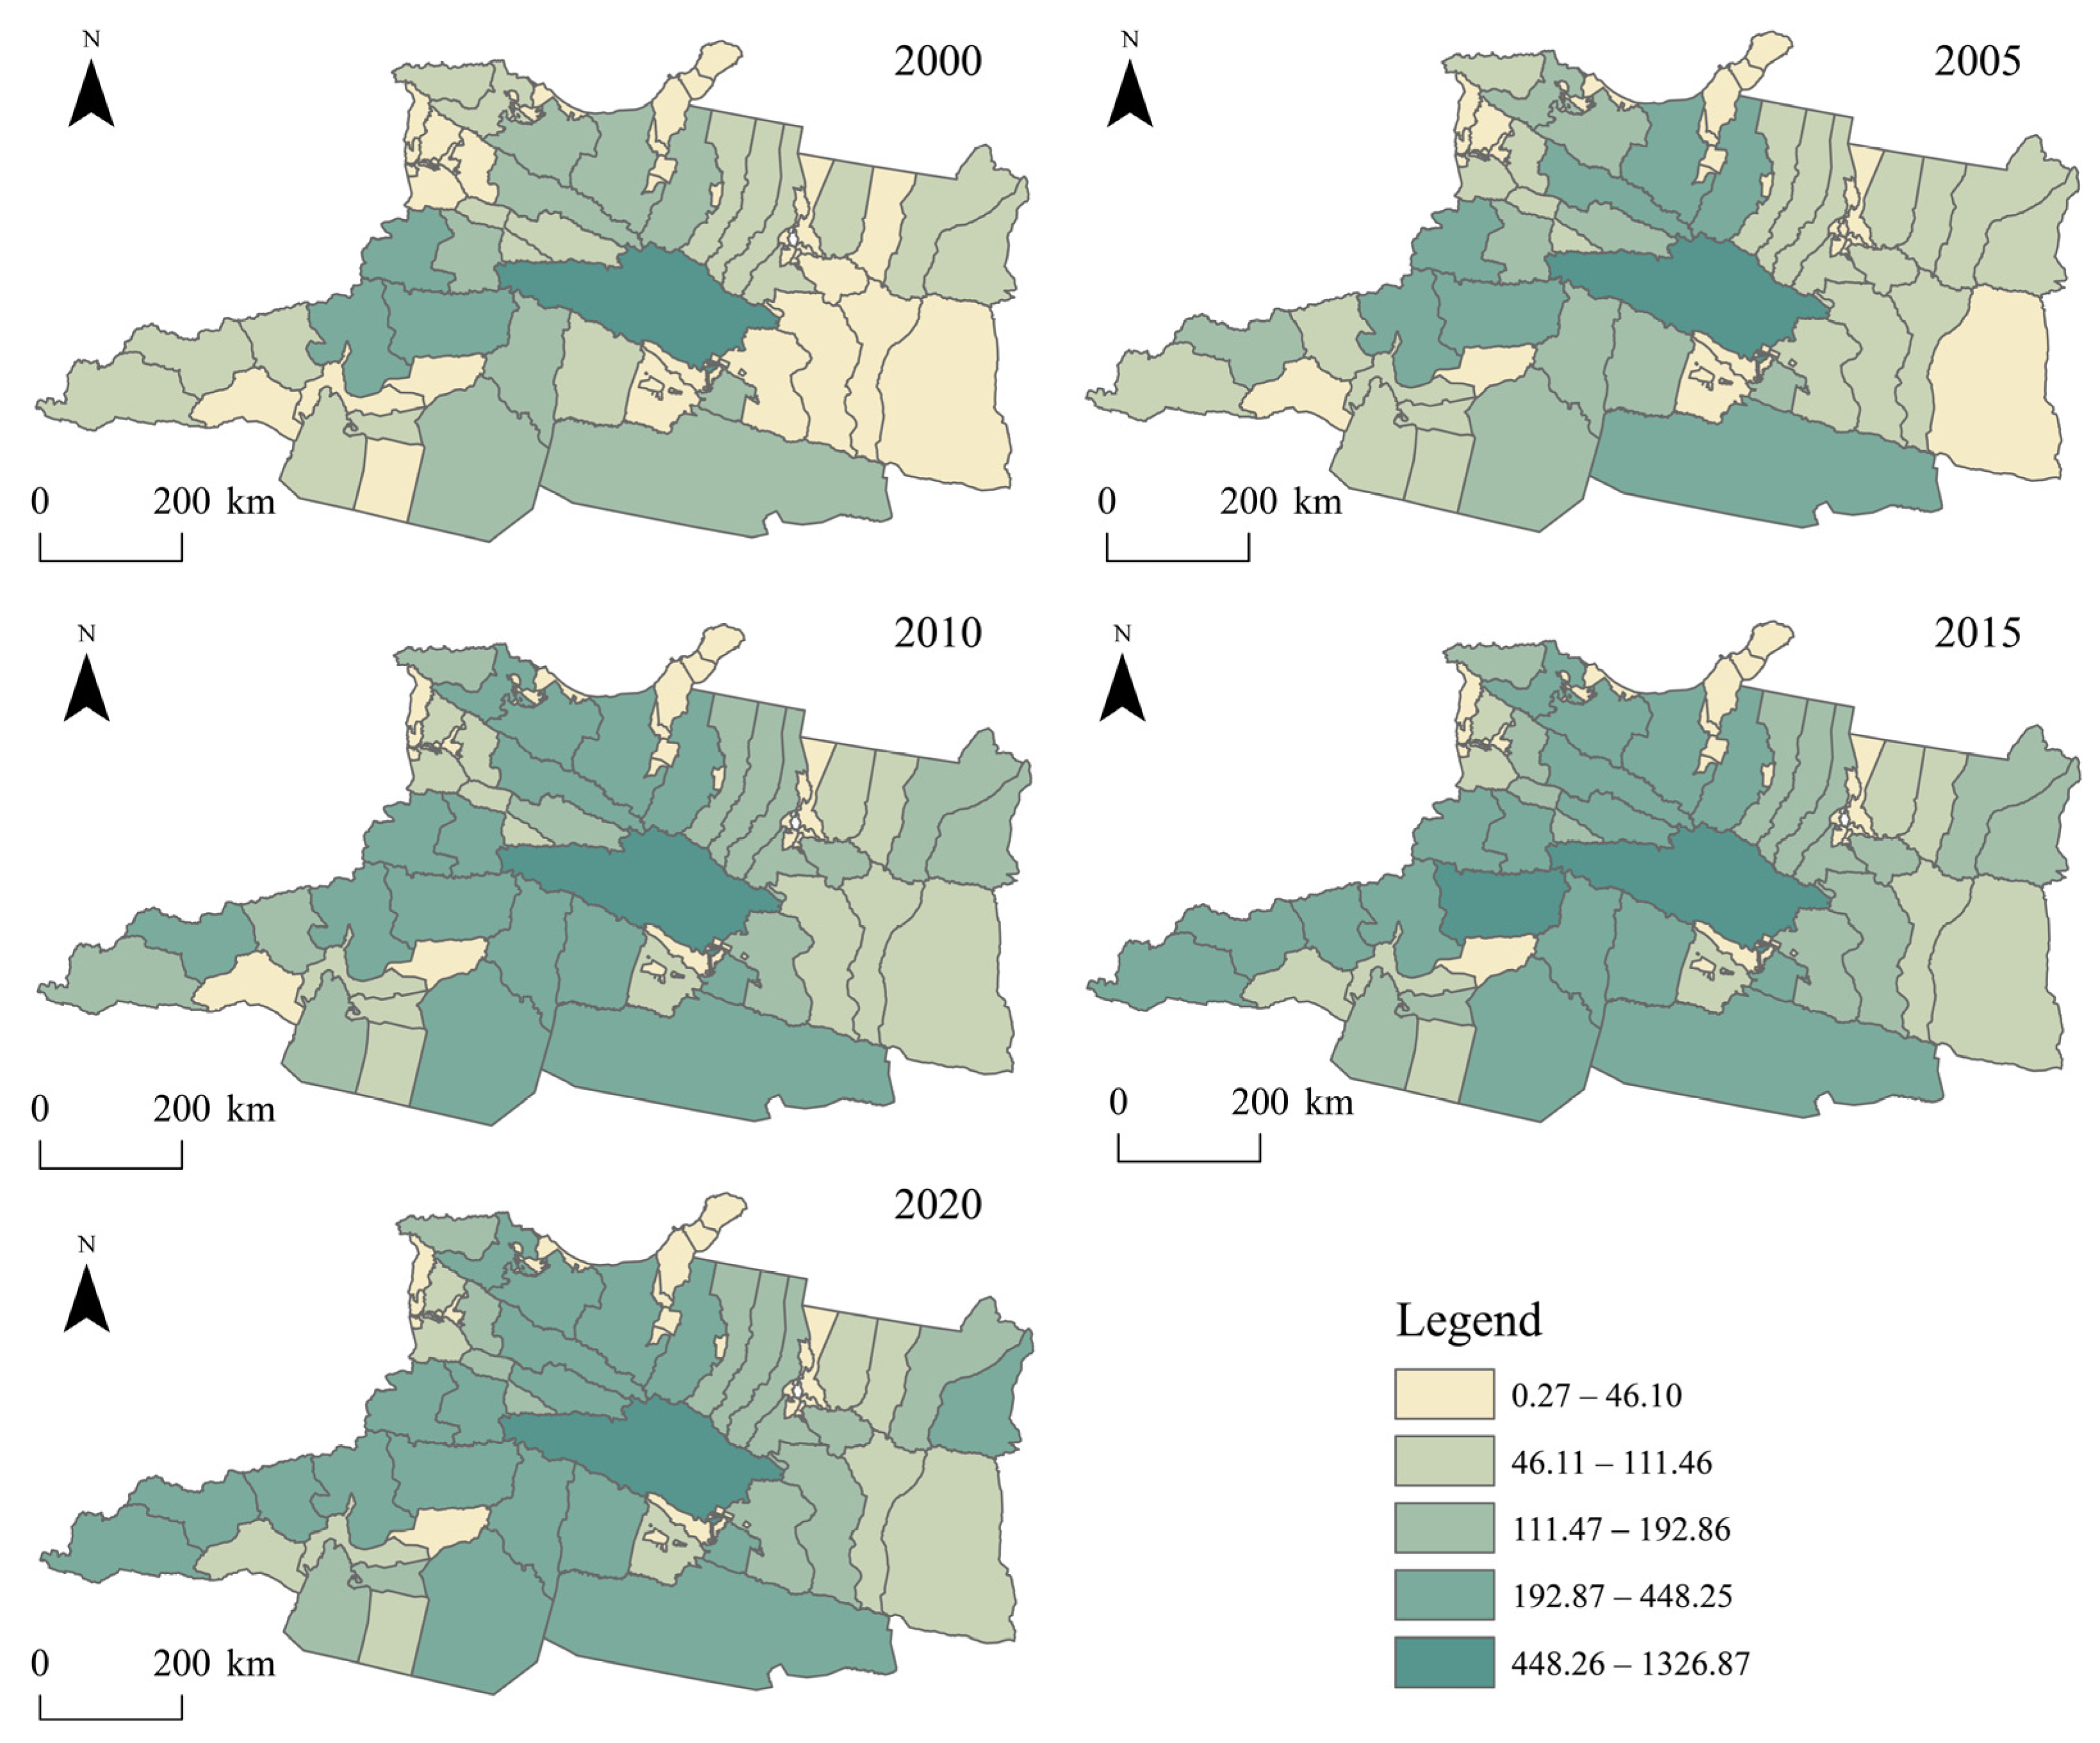
During the study period, the ESSV on the northern slope of the Tianshan Mountains exhibited an overall increasing trend alongside a distinct spatial differentiation pattern (Figure 6).
Figure 6.
Spatial distribution characteristics of ESSV during 2000–2020.
Initially, high-ESSV areas were primarily concentrated in central cities and gradually expanded outward. By 2005, cities such as Wusu and Shawan had also become high-value zones. Between 2010 and 2015, these cities maintained their high ESSV status, exerting a radiating influence that fostered the gradual formation of contiguous high-value clusters in surrounding areas. Concurrently, ESSV in the eastern cities of the northern Tianshan slope showed improvement, albeit at a slower growth rate. In contrast, cities like Xinhe and Tiemenguan consistently remained at low ESSV levels. By 2020, only some eastern cities exhibited relatively low ESSV, while most cities experienced significant enhancement. Overall, a stable spatial pattern emerged, characterized by higher values in the west, lower values in the east, and a contiguous central high-value area.
4.2.3. Temporal Characteristics of ΔESSV
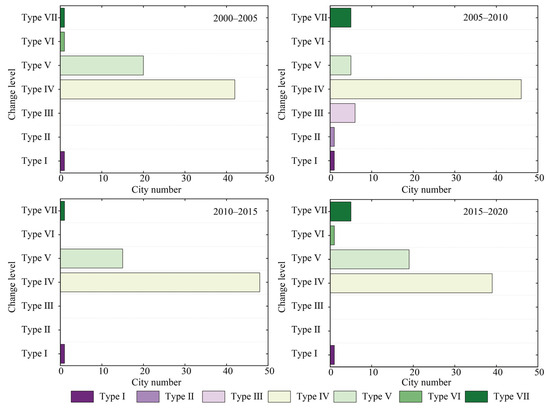
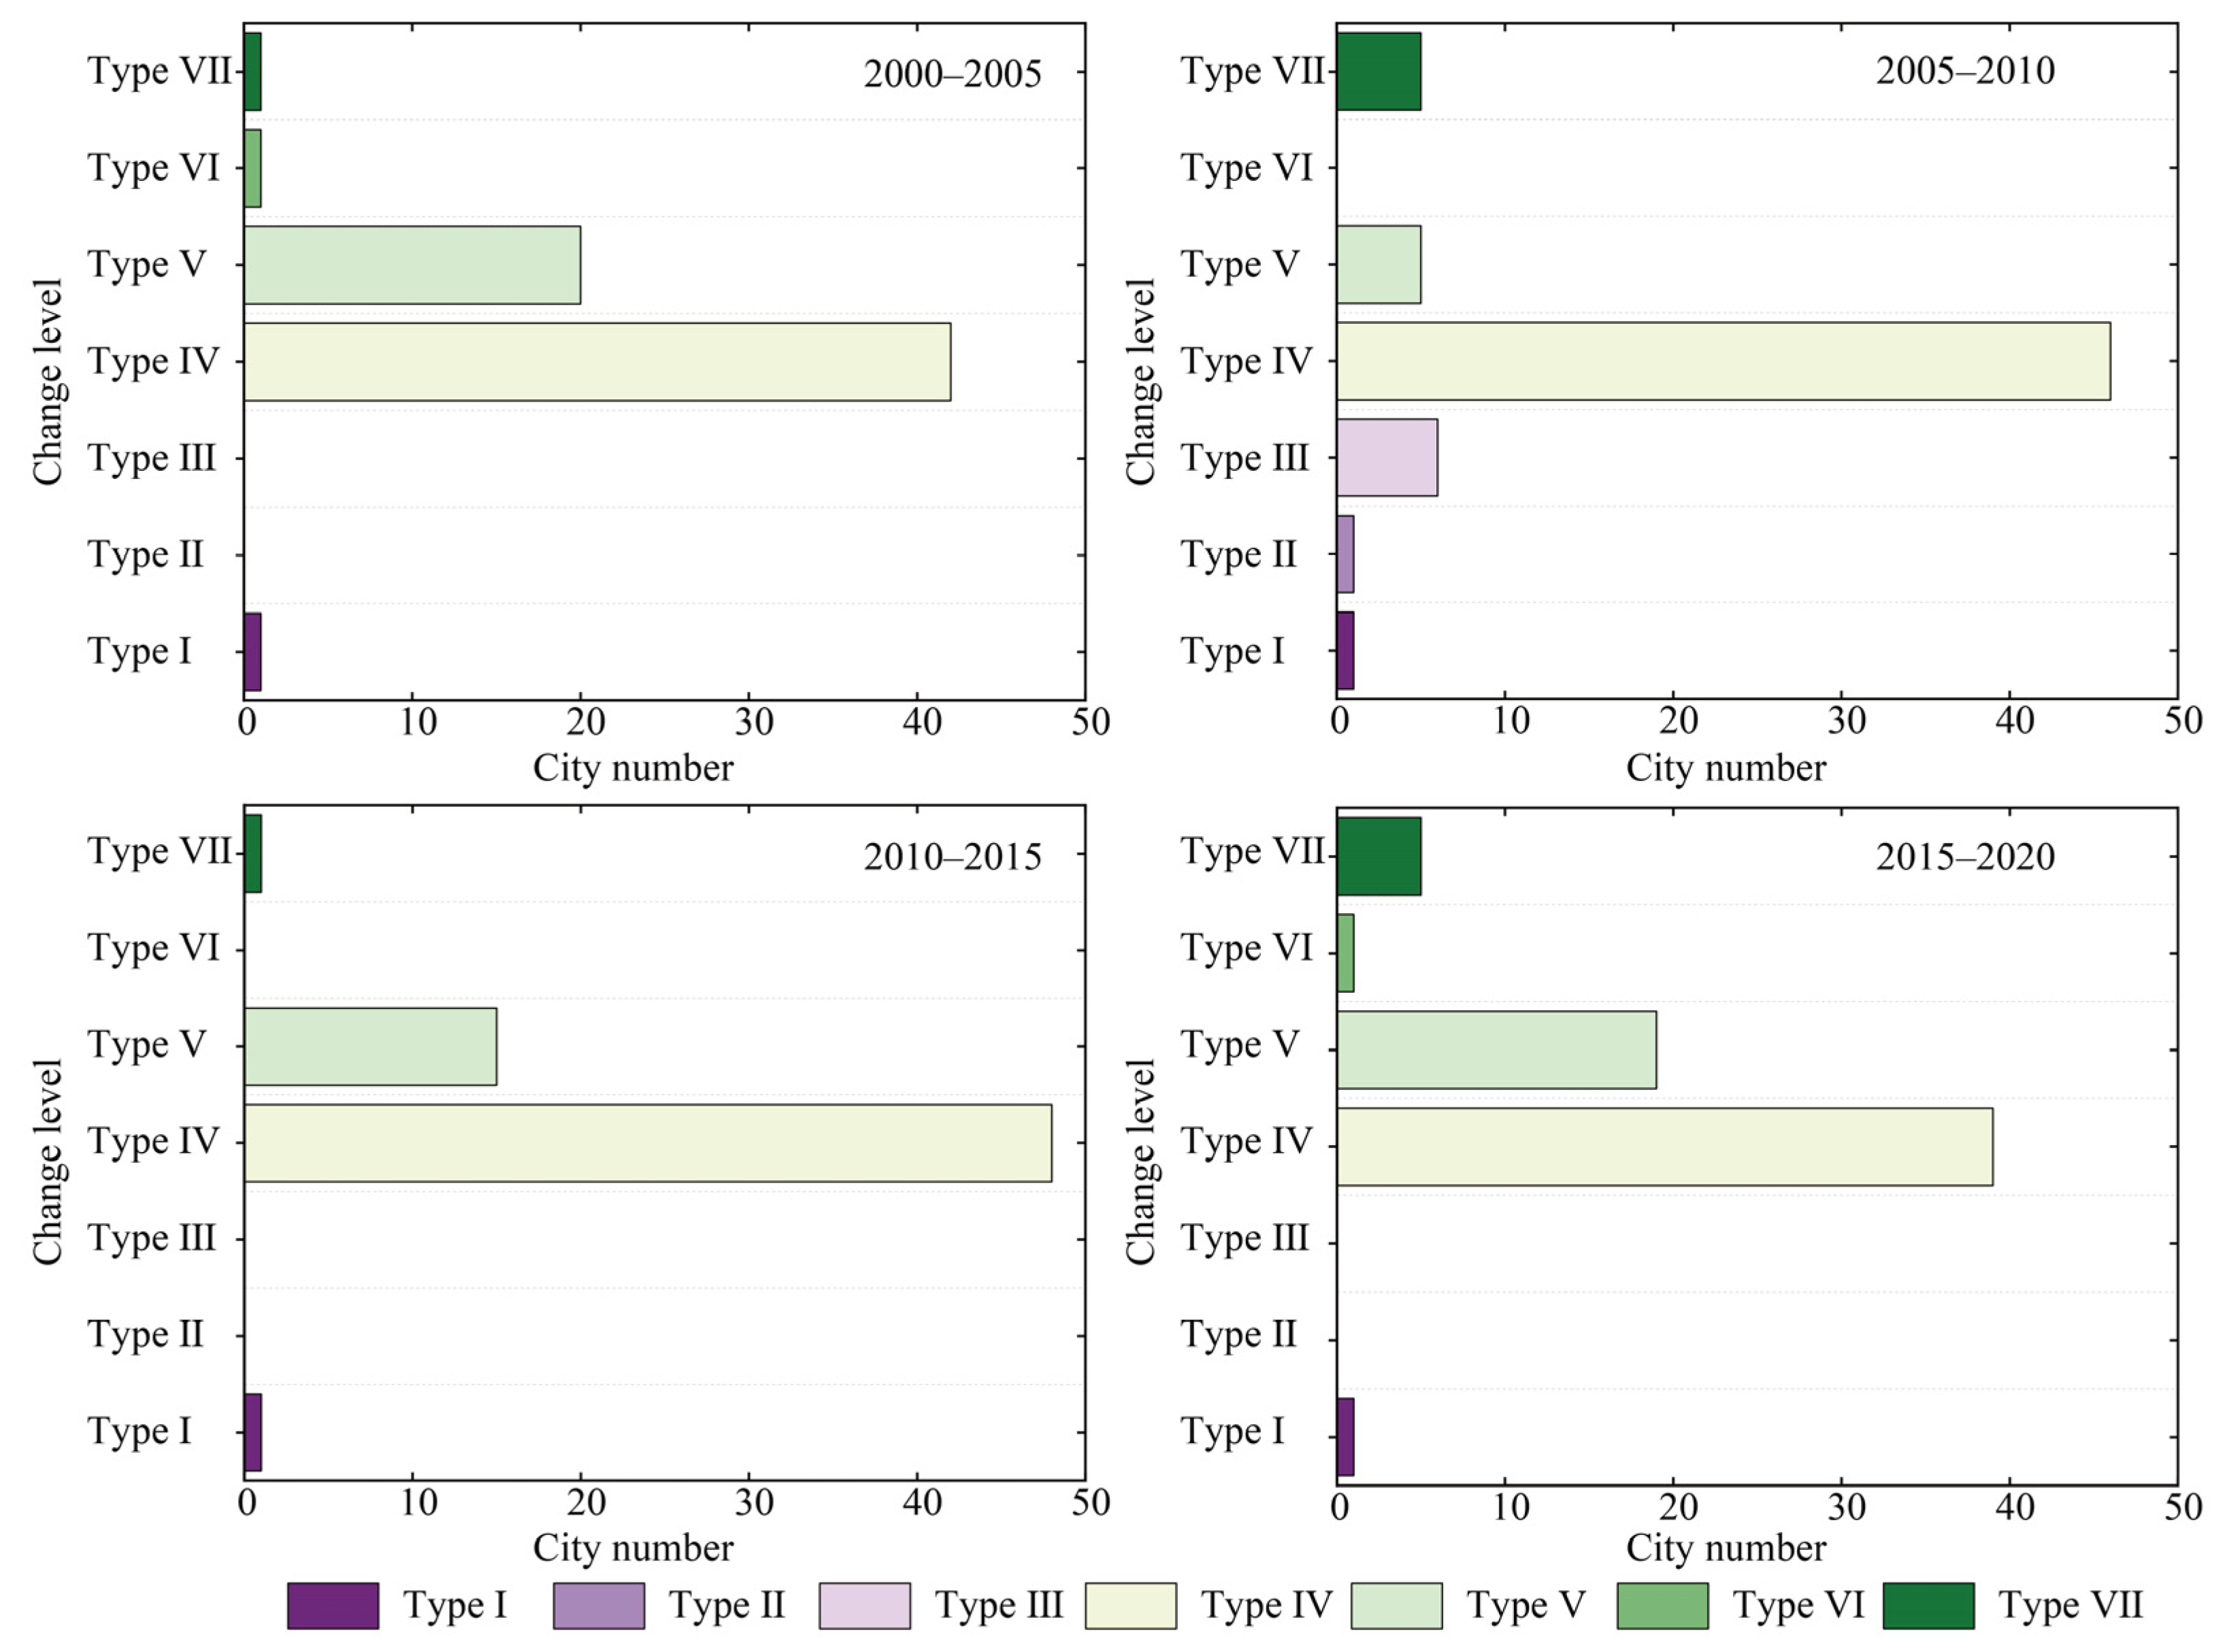
Using the natural breaks method, the ΔESSV was classified into seven tiers: Type I (−1492.16 to −683.26), Type II (−638.20 to −468.33), Type III (−468.30 to −114.28), Type IV (−114.27 to 0), Type V (0.01 to 7.79), Type VI (7.80 to 15.37), and Type VII (15.38 to 105.33), as illustrated (Figure 7).
Figure 7.
Number of cities in ΔESSV levels during 2000–2020.
Regarding negative ΔESSV, the number of cities in Types I, II, and III remained consistently low, while cities in Type IV were the most numerous, albeit displaying a gradual downward trend. For positive ΔESSV, the number of cities in Types V, VI, and VII exhibited fluctuating trends. Specifically, the count of Type VII cities increased from 1 to 5, whereas Type V cities decreased from 20 to 5 before rising again to 19. Evidently, the number of cities experiencing a decline (average 46) in ESSV significantly outnumbered those showing an increase (average 18).
4.2.4. Spatial Characteristics of ΔESSV
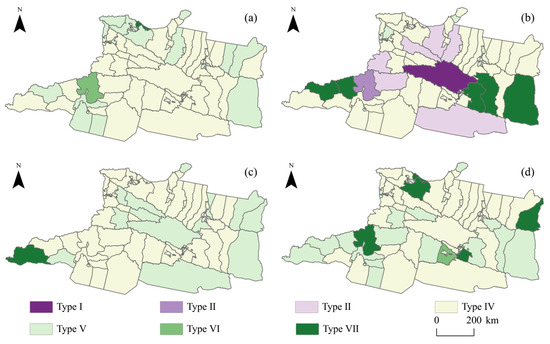
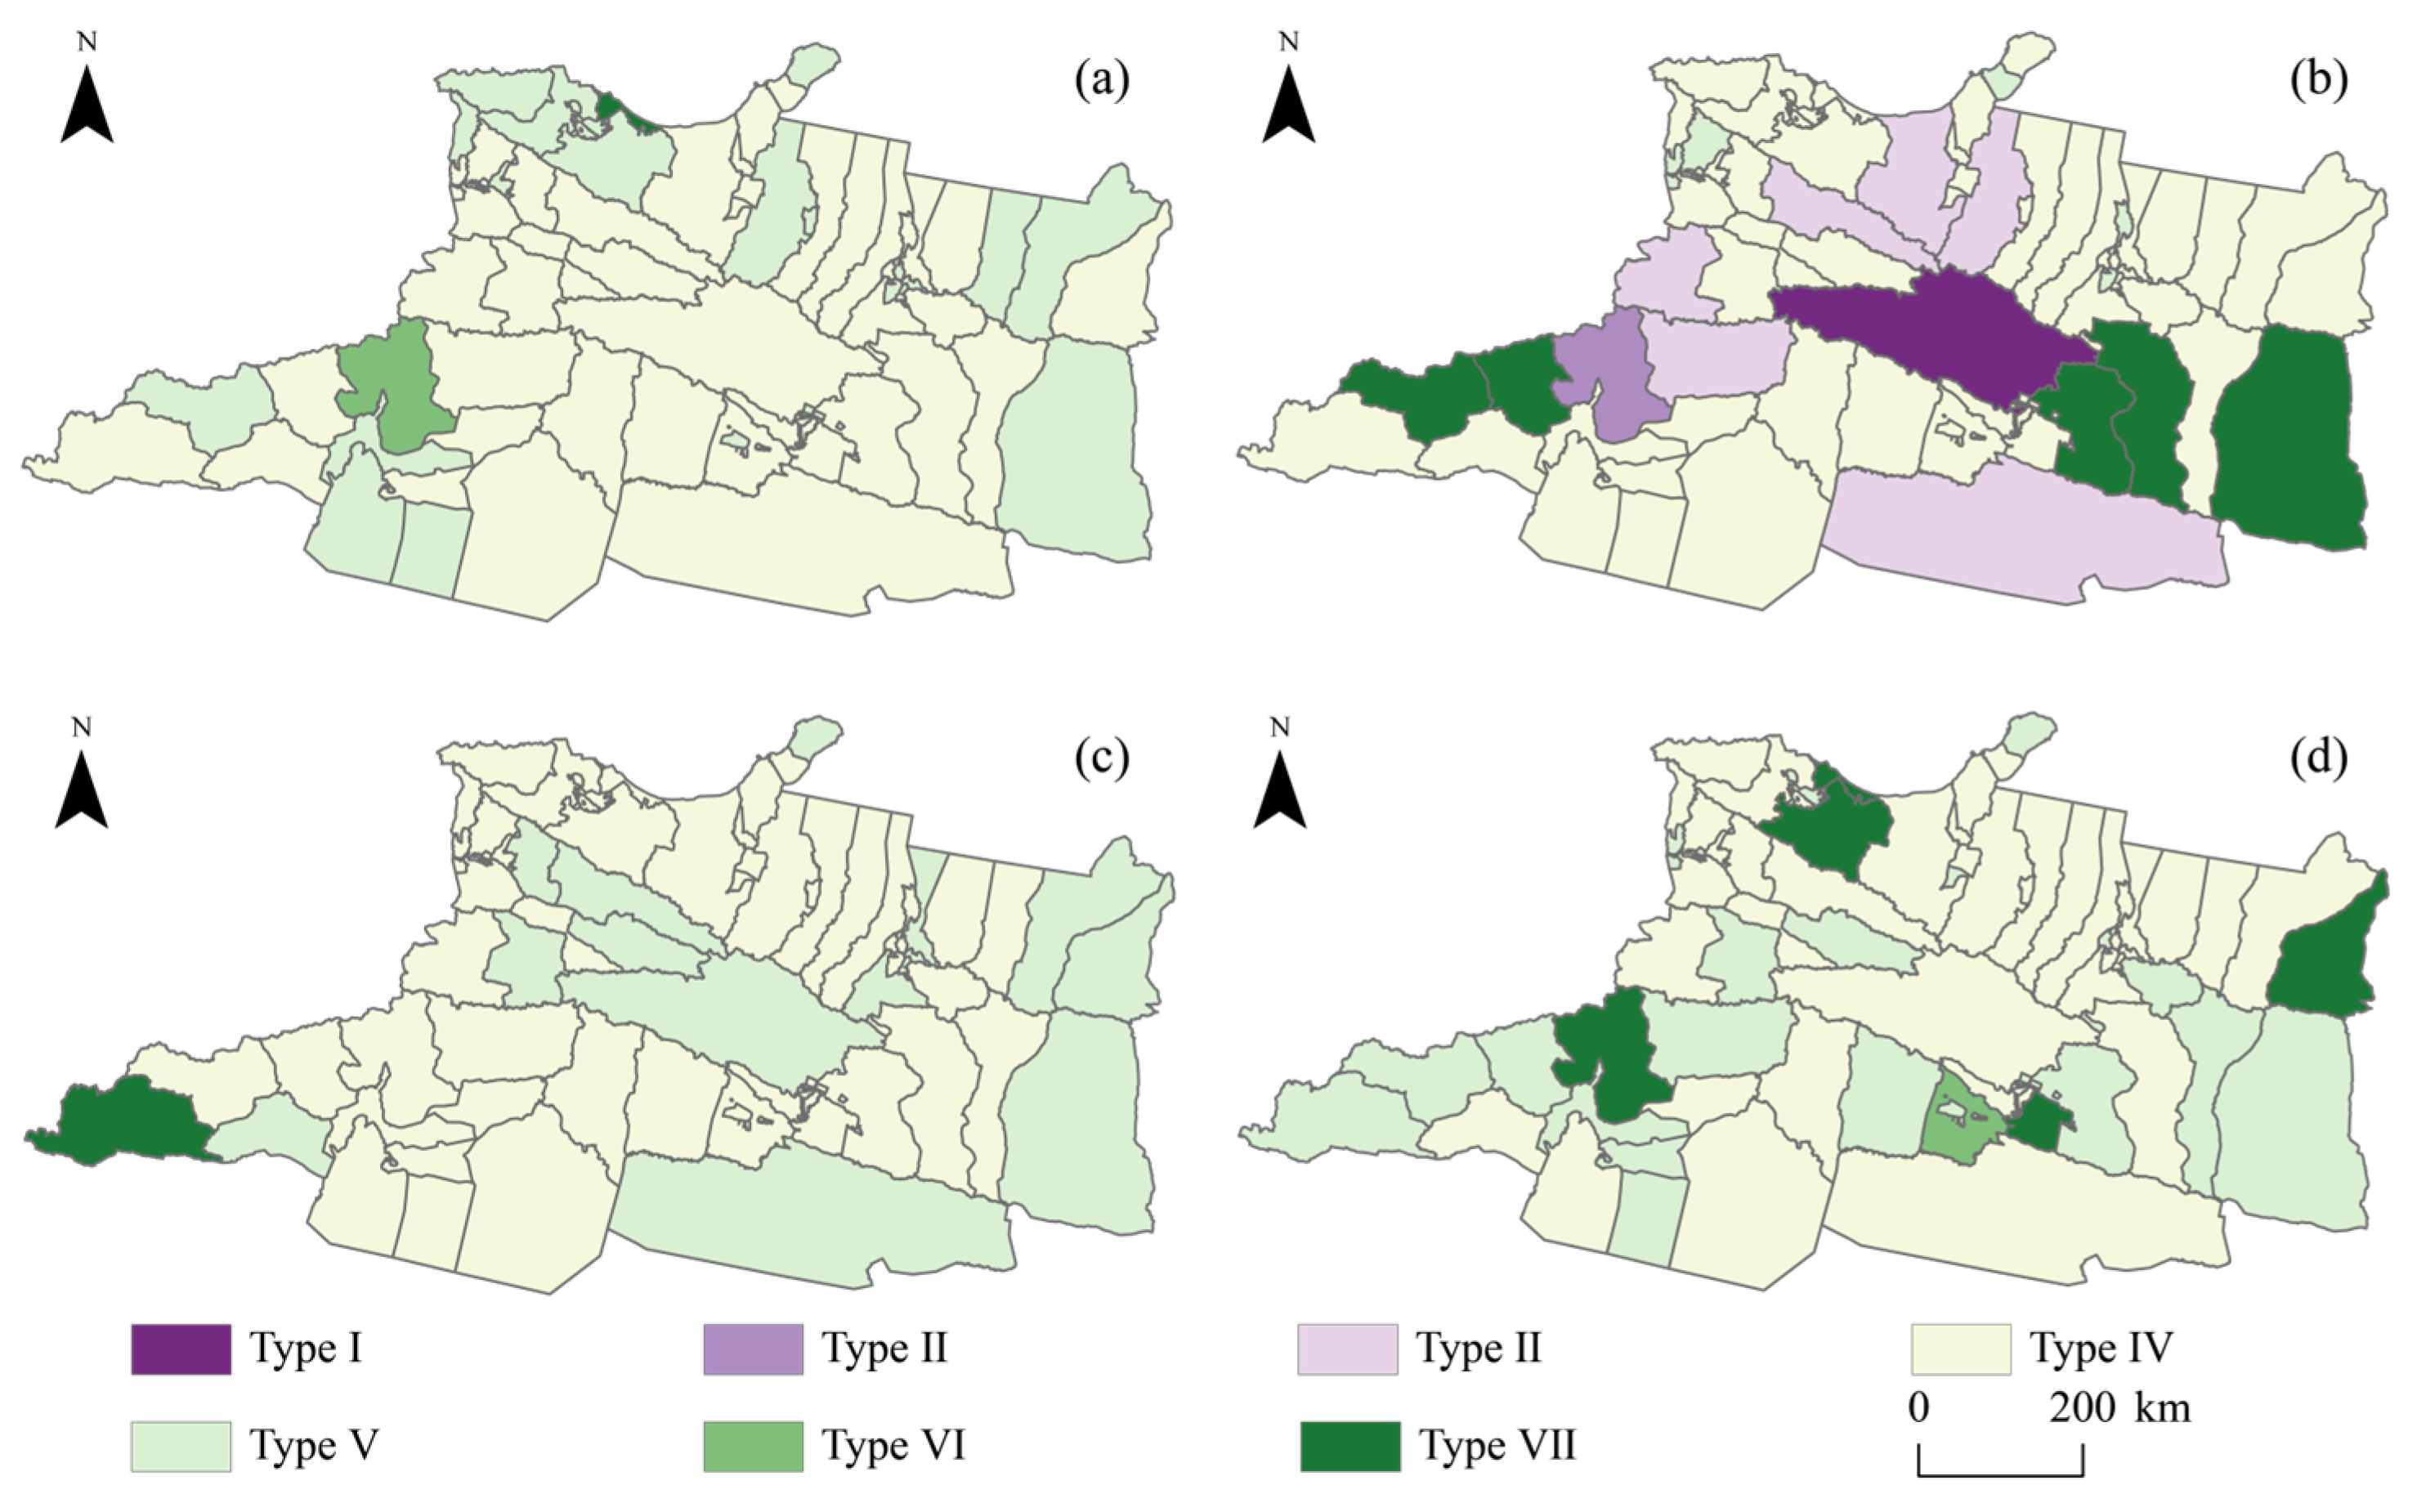
The spatial variation characteristics of ΔESSV across cities are shown in Figure 8.
Figure 8.
Spatial pattern of ΔESSV: (a) 2000–2005; (b) 2005–2010; (c) 2010–2015; (d) 2015–2020.
During 2000–2005, Type V cities were predominantly located in the central and eastern regions. Their number increased gradually over time, establishing this type as the primary contributor to positive ΔESSV growth. In contrast, Type VII cities were scarce and sporadically distributed across the eastern and western areas. On the other hand, Type IV cities were largely concentrated in the northeastern and southwestern parts. Their count exhibited a gradual decline while simultaneously showing a spatial pattern of diffusion from the central zones toward the periphery, making this type the primary category for negative ΔESSV growth. Notably, between 2005 and 2010, the number of Type I, Type II, and Type III cities increased markedly, primarily distributed across the central and western regions. From 2010 to 2020, despite some recovery in ESSV for certain cities, overall negative growth remained dominant.
4.3. ESSV Network Pattern
4.3.1. Analysis of the ESSV Network Structure
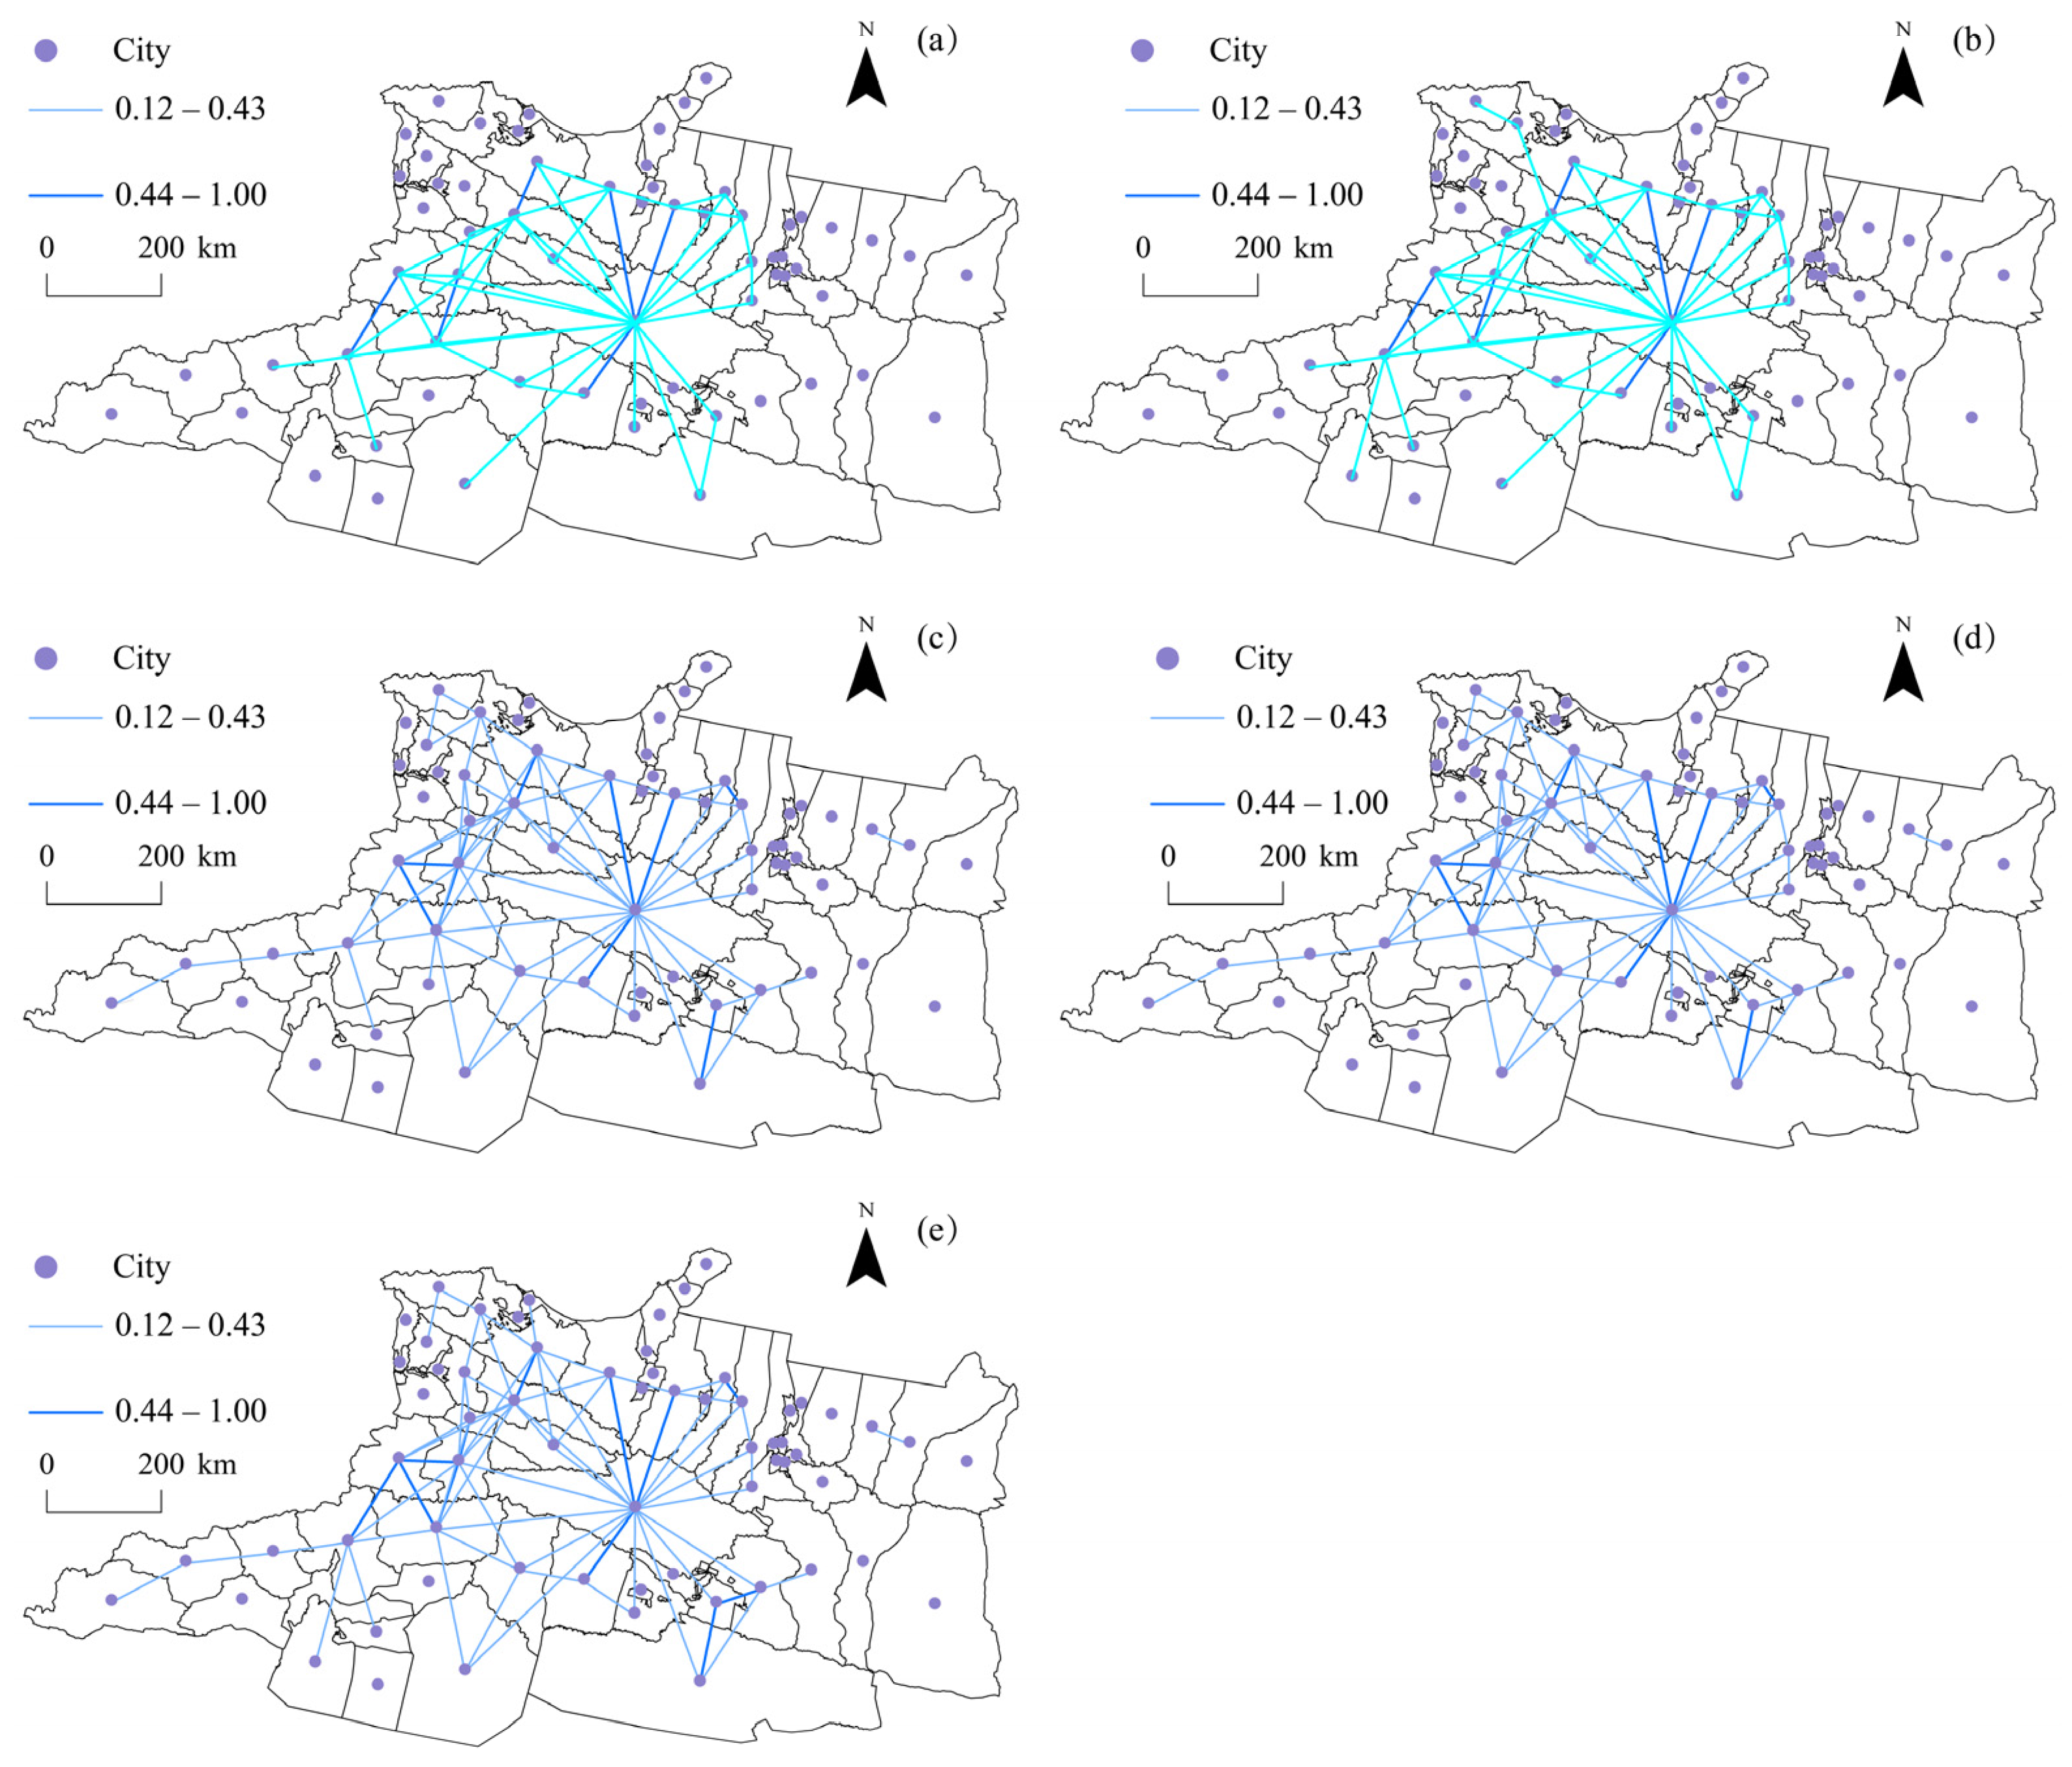
The spatial correlation strength of ESSV among cities is shown in Figure 9. The overall network on the northern slope of the Tianshan Mountains exhibits characteristics of multiple connections and multiple cores. Over time, the network has evolved towards a spatial pattern described as “expansion driven from the central region, extending northward and southward,” showing a consistent trend of strengthening gravitational linkages. Specifically, connections between other cities and core counties such as Hejing, Zhaosu, and Luntai were the strongest, with gravitational values increasing annually. This indicates a growing radiative influence of these core areas on the ESSV of surrounding cities. Furthermore, driven by this influence, counties like Yuli, Shaya, and Shawan have progressively emerged as new cores, leading to increased complexity in regional network connectivity. Consequently, a multi-core-driven development pattern for ESSV is gradually taking shape. Additionally, cities in the southern and northern regions have actively absorbed the driving effects from the central core areas, becoming new catalysts for the development of regional ESSV.
Figure 9.
ESSV gravity network: (a) ESSV gravity pattern in 2000; (b) ESSV gravity pattern in 2005; (c) ESSV gravity pattern in 2010; (d) ESSV gravity pattern in 2015; (e) ESSV gravity pattern in 2020.
4.3.2. Analysis of the Individual Characteristics of the ESSV Correlation Network
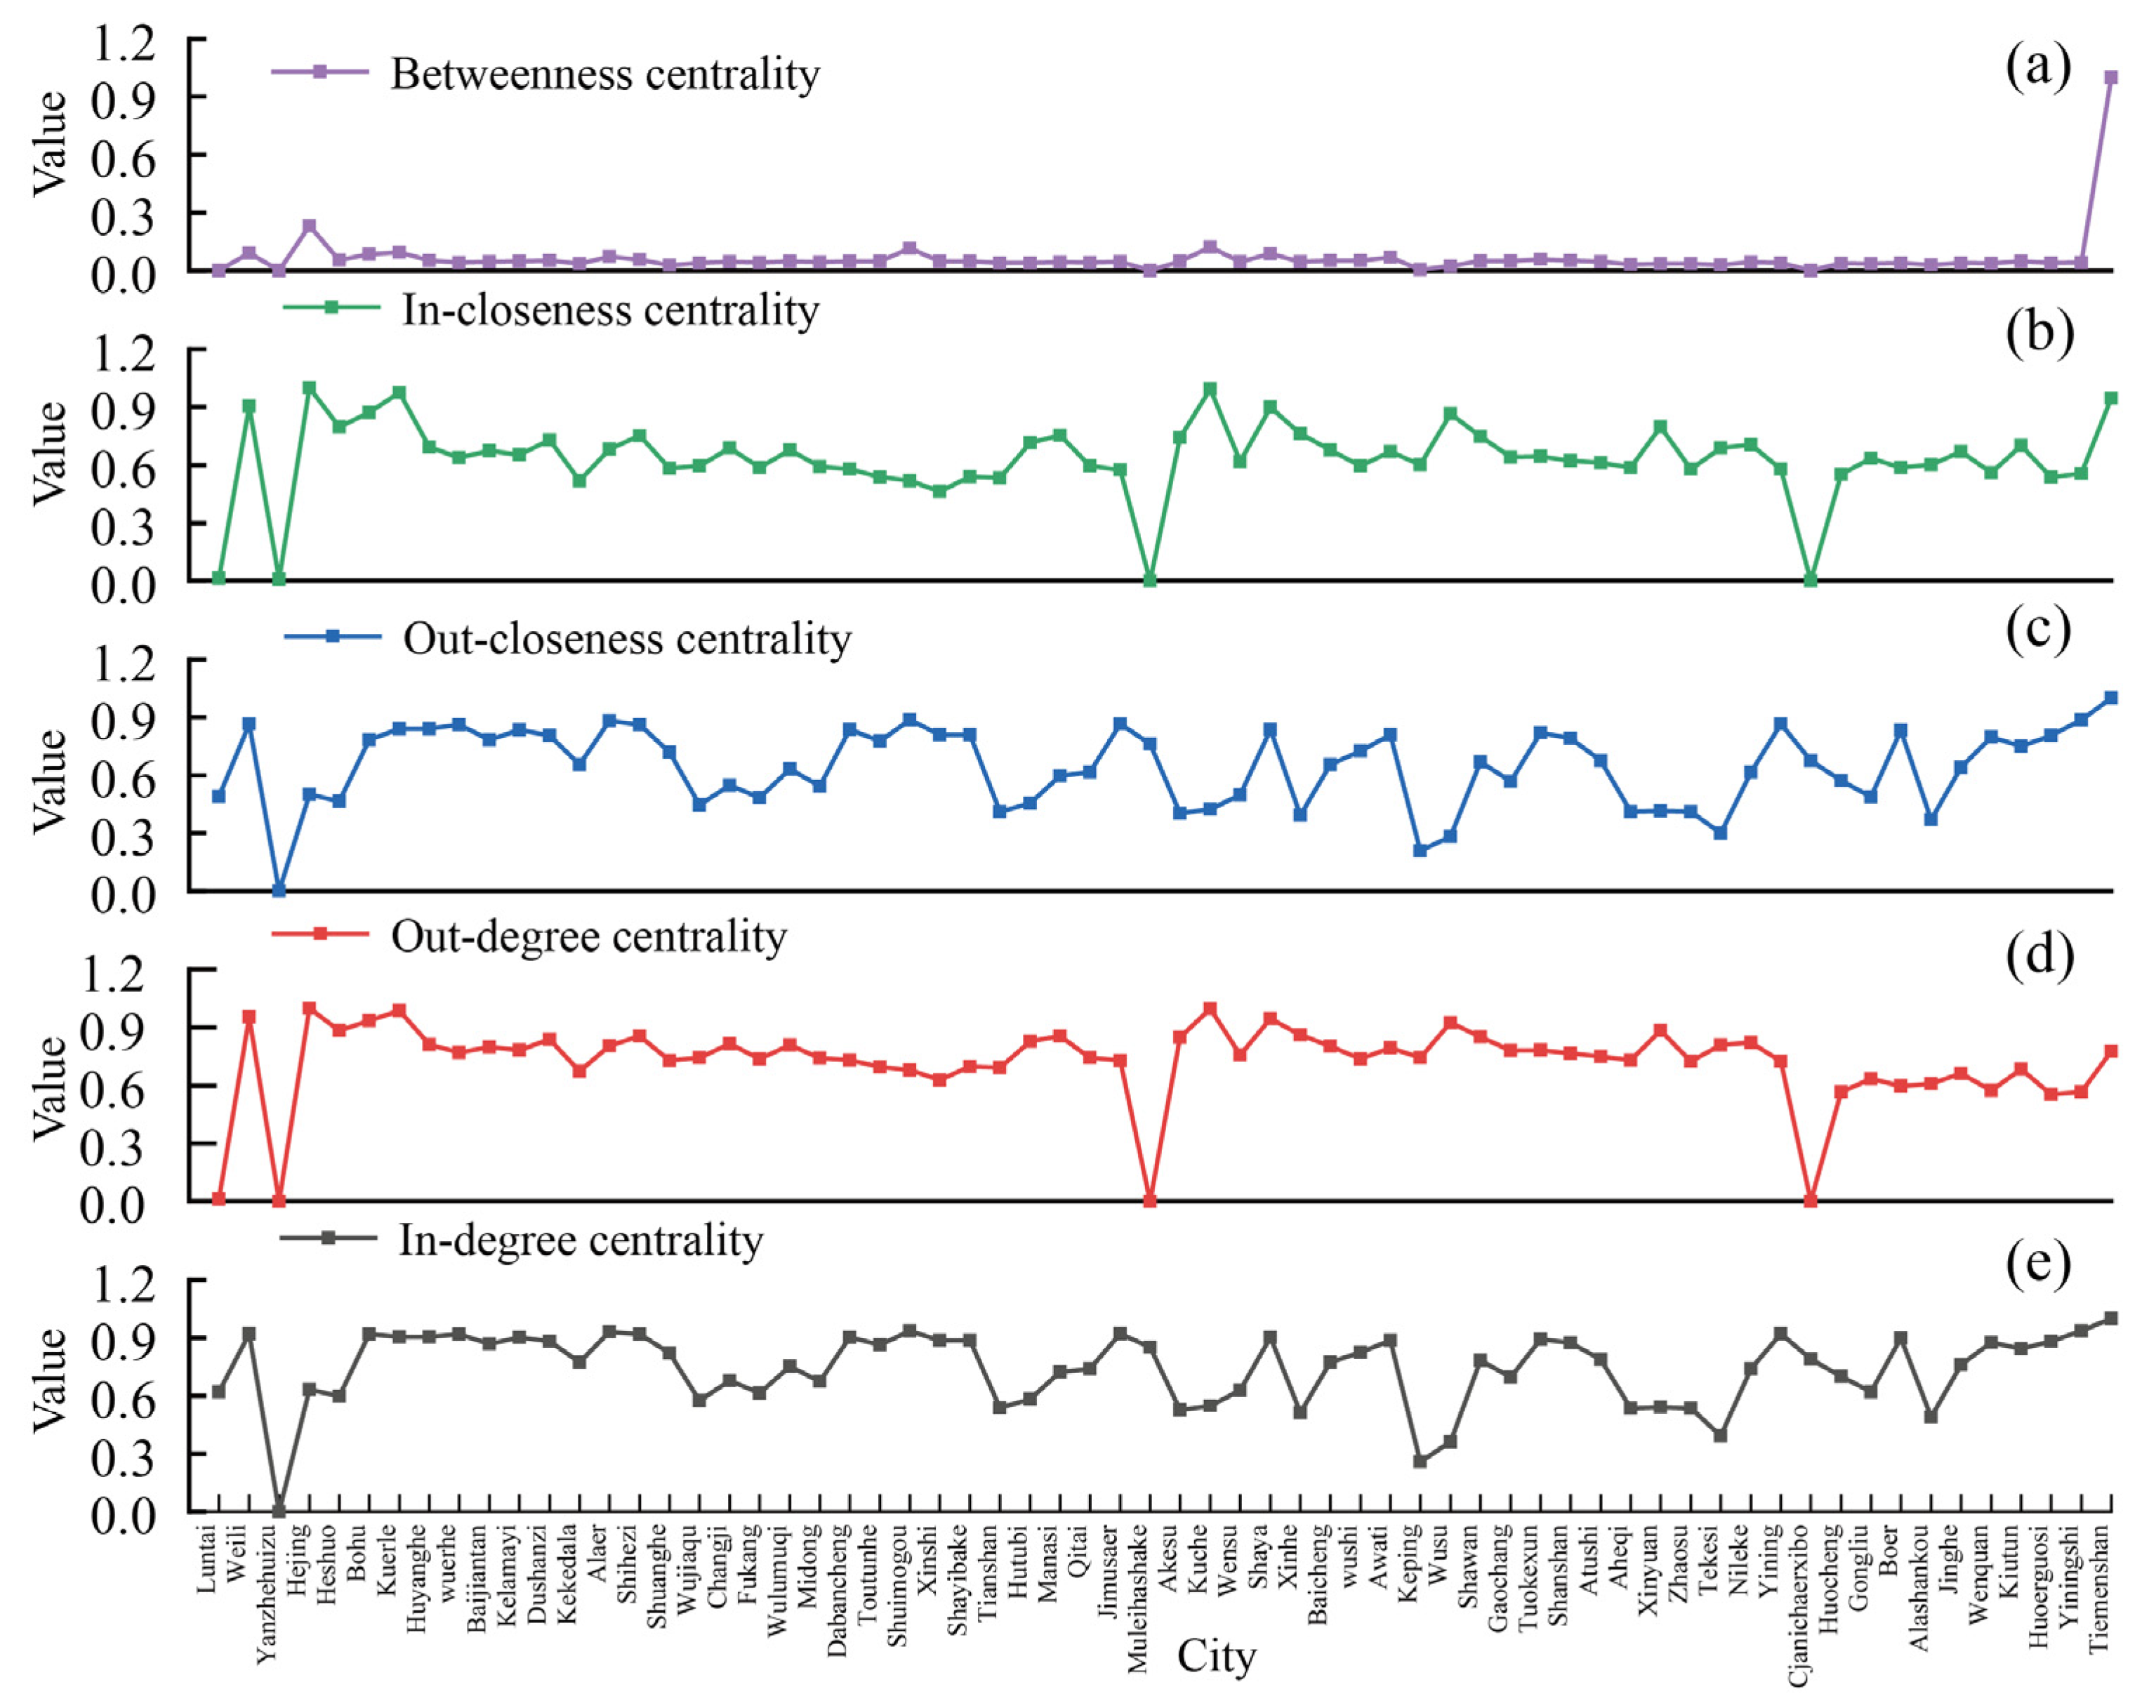
To comprehensively characterize the evolution of the ESSV network on the northern slope of the Tianshan Mountains, we evaluated key structural indices of the network (Figure 10). Analysis of degree centrality revealed that Tiemenguan (1.00), Alaer (0.93), and Shuimogou (0.93) exhibited high out-degree, identifying them as pivotal core output nodes within the regional value network. Conversely, Hejing (1.00), Kuche (0.99), and Korla (0.98) demonstrated high in-degree, indicating a strong reliance on external ecological inputs. Regarding closeness centrality, the high out-closeness centrality of Tiemenguan (0.99), Weili (0.87), and Yining (0.87) reflects their superior capacity for diffusing ecological value. For example, as a transportation and hydrological hub, Tiemenguan facilitates the transfer of ecological elements to the fringe of the Taklimakan Desert, supporting the formation of desert oases. On the other hand, the high In-closeness centrality of Jinghe (0.9), Weili (0.8), and Yining (0.98) indicates their efficiency in receiving and integrating ecological resources from external sources. It is noteworthy that Weili and Yining possess high In-closeness centrality and out-closeness centrality, demonstrating that they are not only hubs for receiving and integrating ecological functions but also key nodes for outward radiation, thus serving a bidirectional regulatory role in the ecological network. Regarding betweenness centrality, the high values for Baicheng (0.12) and Luntai (0.09) indicate that they occupy pivotal positions in the pathways of value flow, enabling them to effectively control and regulate the transfer of ecological value elements across different regions. Damage to these critical nodes would severely impair the overall network connectivity of the region, leading to the fragmentation of the ecological value network.
Figure 10.
Centrality analysis of ESSV: (a) Betweenness centrality; (b) In-closeness centrality; (c) Out-closeness centrality analysis; (d) Out-degree centrality analysis; (e) In-degree centrality analysis.
4.4. Multidimensional Configurations Analysis of ESSV
4.4.1. Necessity Analysis
Necessity analysis of antecedent conditions determines whether a specific condition is necessary for a given level of ESSV. A condition is deemed necessary if it is invariably present whenever the outcome occurs. Using the fsQCA 3.0 software, we tested for necessary conditions leading to both high and low levels of ESSV (Table 4). The consistency scores (con) for all antecedent conditions were below the 0.9 threshold, indicating that none constituted a necessary condition for ESSV. Furthermore, the coverage values (cov) for the infrastructure and technological dimensions in some years were slightly below 0.5, while coverage for all variables in other years exceeded 0.5. This suggests that the selected indicators possess a certain degree of explanatory power for the observed ESSV.
Table 4.
Analysis of the necessity of antecedent variables.
4.4.2. Sufficiency Analysis
Sufficiency analysis of conditional configurations elucidates the extent to which different combinations of antecedent conditions enhance ESSV. A truth table, generated using the Quine–McCluskey algorithm, displays all configurational states within the dataset. Setting a consistency threshold of 0.8 and a frequency threshold of 1 for the sufficiency analysis yielded multiple configurational pathways leading to high ESSV for the years 2000, 2010, and 2020 (Table 5). The consistency scores for both the individual solutions and the overall solution for high ESSV exceeded the 0.75 threshold, confirming the validity of the configurational results. The coverage values for the overall solution in 2000, 2010, and 2020 were 0.50, 0.54, and 0.50, respectively, indicating that the identified configurational pathways possess strong explanatory power for high ESSV.
Table 5.
Configuration paths for high ESSV levels.
4.4.3. Configuration Pathways for High ESSV Levels
As shown in Table 5, three configurational pathways (R1, R2, and R3) led to high ESSV on the northern slope of the Tianshan Mountains in 2000. In 2010, two pathways (R2 and R4) were identified, followed by two pathways (R5 and R6) in 2020. Specifically, for 2000, pathway R1 centers on social resilience as its core driver. It emphasizes the foundational support provided by community cohesion, cultural identity, and public participation for sustaining ESSV. By fostering capacities for collective action and cultural awareness, this pathway facilitates a shift in ecological conservation from a model of passive response to one of proactive stewardship. Pathway R2 represents an ecological–institutional resilience dual-drive model. It relies on the deep coupling between ecosystem regulatory capacity and institutional constraint force. Ecological resilience maintains system stability through resource regeneration and buffering capacity, while institutional resilience delineates the boundaries of human activities via rule-making, supervision, and enforcement. Pathway R3 constitutes an ecological-technological resilience dual-drive model. In this pathway, ecological governance and technological innovation synergistically enhance each other. Ecological resilience establishes natural thresholds for technological application, thereby preventing technological interventions from inducing ecosystem imbalance. Conversely, technological resilience bolsters the adaptive capacity of ecosystems to disturbances through enhanced efficiency and risk early-warning systems.
The r1 pathway for 2010 is consistent with the r2 pathway for 2000 and will not be elaborated upon here. Pathway R4 constitutes an economic–institutional resilience dual-drive model. The resistance capacity of the economic system and the orchestrating ability of the institutional system jointly construct channels for resource redistribution. Economic resilience provides the material foundation for ecological conservation through capital reserves and flows, while institutional resilience facilitates the transformation of economic resources into ecological value via the optimization of governance structures.
As pathways r1, r2, and r3 in 2020 were identical, they were consolidated into pathway R5. It represents a technological-institutional resilience dual-drive, characterized by the highly efficient coupling of technological innovation and institutional safeguards. Within this pathway, technological resilience optimizes the efficiency of ecological management through instrument innovation, while institutional resilience provides the necessary guarantees for technological progress, thereby helping to mitigate the pressure of imbalance between urban ecology and development. Pathway R6 constitutes an economic resilience single-core drive model. Here, economic resilience acts as a lever, utilizing green investment efficiency and industrial elasticity to drive the conversion of ecological resources towards higher value-added sectors. This pathway showcases the capacity of the economic system to reshape the ecological space through industrial transformation and capital mobility.
5. Discussion
5.1. ESSV Measurement and Configuration Analysis
A large-scale reduction in ecological space has occurred on the northern slope of the Tianshan Mountains, with GES experiencing the most severe decline [52,53]. The primary drivers of this trend are agricultural development and urban expansion that continually encroach upon ecological space in exchange for short-term economic growth, converting large areas of grassland into built-up land. On the other hand, the spatiotemporal imbalance of regional water resources exacerbates drought stress, leading to grassland vegetation degradation and reduced productivity. Concurrently, rising temperatures and fluctuating precipitation under climate change further weaken the ecosystem’s self-recovery capacity, thereby accelerating the loss of ecological space [54].
A paradoxical phenomenon exists whereby the extent of ecological space declines while the ESSV exhibits an upward trend [55]. This can be mainly attributed to the fact that the value equivalent method uses agricultural product prices as its core accounting benchmark. Continuously rising agricultural product prices increased the value equivalent per unit area of ecological space. The resulting price effect partially offset the value loss caused by the reduction in ecological space area and might even lead to an overall increase in total service value [56].
The evolutionary pattern of the network of ESSV aligns with the laws of social development, exhibiting spatial heterogeneity related to economic development levels and infrastructure construction [57,58]. Nevertheless, under the dual support of the radiating influence of cities with high ESSV and regional ecological protection policies, the overall level of ecological space value has shown a slow recovery trend. New core cities (high degree centrality), hub cities (high betweenness centrality), and ecological diffusion cities (high closeness centrality) have gradually emerged. The ecological connectivity of the value network has steadily strengthened, and the linkages among urban nodes have become increasingly close.
The evolutionary pathway of ESSV has undergone a phased transition from dominance by social resilience, through co-dominance by economic–institutional resilience, to leadership by economic resilience coupled with synergy between technological and ecological resilience [59,60]. This trajectory adheres to the basic laws of urban development. In the early stage of urbanization, social resilience sustained and enhanced ecosystem service functions by strengthening the stability and adaptability of social structures and coordinating the allocation of natural and social resources. As industrialization accelerated, urban economic levels rose significantly, and institutional systems became increasingly refined, gradually forming a dual-drive mechanism of institutional–economic resilience that jointly promoted the steady increase in ESSV. In the new era, underpinned by both technological empowerment and institutional innovation, economic resilience has injected sustained momentum into the enhancement of ESSV.
5.2. Innovation Points, Limitations, and Future Prospects
Accelerated urbanization and industrialization are exerting severe pressure on the service capacity of ecological spaces. Quantifying ESSV offers an effective means to assess this capacity. The ecosystem comprises diverse spaces, including urban, agricultural, and ecological zones. Accurately measuring the service capacity of ecological spaces and elucidating the characteristics of their value depletion constitute a critical foundation for ecological space governance. Furthermore, resilience-informed governance serves as a vital strategy for achieving high-quality urban ecological development, with the configurational effects of multidimensional resilience being key to addressing ecological degradation. Accordingly, this study first employs the modified value equivalent method to measure the level of ESSV and conducts visual analyses of its annual characteristics and losses. Second, a gravity model is applied to investigate the strength of inter-city connections in ESSV. Finally, using fsQCA, we explore the configurational effects of urban resilience—across institutional, social, technological, infrastructural, economic, and ecological dimensions—on enhancing ESSV. Collectively, this approach provides a scientific basis for urban ecological governance on the northern slope of the Tianshan Mountains.
Due to data availability constraints, missing values exist for some antecedent variables, making it difficult to accurately characterize the configurational effects of resilience dimensions. Furthermore, the land use types covered by the value equivalent table do not fully represent actual land use categories, potentially introducing bias into the estimation of ESSV. Although the gravity model can delineate the spatial correlation network of value, it still simplifies the actual physical pathways of ecological service flows. Future research should focus on refining the value equivalent factors for various land use types, calibrating them according to regional land use realities, and integrating higher-resolution remote sensing data with field survey data to improve the accuracy of ecosystem service capacity assessment. At the same time, a multi-scale comparative analytical framework should be explored to reveal the scale effects and driving mechanisms of ESSV across different administrative and natural scales. Moreover, studies should further concentrate on the integration mechanisms between the resilience concept and ecosystem service functions, identify the internal pathways through which resilience empowers ecological governance, and introduce dynamic simulation models to test the temporal stability of configurational pathways, thereby enhancing the accuracy of ecosystem evolution outcomes.
5.3. Policy Implications
Based on the aforementioned debate and analysis, the following policy proposals are offered to support the optimum and sustainable development of the regional ecological space.
(1) Establishing a differentiated regional ecological compensation mechanism: For regions on the northern slope of the Tianshan Mountains that have experienced severe losses in ESSV, such as the northeastern and southwestern areas, a tiered compensation standard based on ecological fragility assessments should be established. Compensation efforts should be prioritized for GES and WES. Furthermore, integrating the results of gain-loss analysis of ESSV, compensation standards should be regularly reviewed and calculated, taking into account the decoupling of agricultural product value growth from ecological function quality [61]. In addition, drawing on ecosystem service flow theory, a cross-regional horizontal compensation mechanism should be built between core cities and ecologically degraded areas, enabling value redistribution through fiscal transfers or joint ecological projects. (2) Synergistic optimization of the ESSV network: To mitigate the risk of fragmentation of the network of ESSV, cities with high betweenness centrality (Tiemenguan, Kuche) should be identified, and their ecological functions strengthened. These cities should be included in priority control zones under the ecological conservation redline, and their connective roles should be fully leveraged to enhance the linkage among all nodes of the network of ESSV. Based on the evolutionary trends of the network of ESSV, existing core cities and emerging core cities should be rationally planned to facilitate cross-regional flows of ecological elements, thereby strengthening the overall resilience of the value network [62]. (3) Designing resilience-synergistic ecological policy mixes: From the perspective of urban multidimensional resilience synergy, a four-in-one ecological policy mix integrating social, institutional, technological, and market-based instruments should be constructed to achieve steady improvement and comprehensive governance of ESSV levels [63]. In traditional pastoral areas on the northern slope of the Tianshan Mountains, a community co-management model should be implemented to integrate grassroots governance networks with ecological conservation efforts. Incentive mechanisms for ecological technology innovation should be optimized to promote synergistic innovation between agricultural mechanization and ecological governance institutions, thereby forming an ecological governance pattern in which diverse resilience elements complement each other.
6. Conclusions
This study investigated the ESSV on the northern slope of the Tianshan Mountains by employing the modified value equivalent method, a gravity model, and configurational analysis. The principal conclusions are as follows:
- (1)
- During the study period, the extent of regional ecological space exhibited a significant decreasing trend, predominantly through conversion to OES types. Notably, the reduction in GES was the most pronounced, while the decline in FES was relatively moderate. Furthermore, frequent conversions of GES and WES to OES constituted the primary source of loss in regional ESSV.
- (2)
- The ESSV exhibited an overall fluctuating yet upward trend, coupled with a distinct spatial heterogeneity pattern characterized as “higher in the west, lower in the east, and spatially contiguous in the central region.” Some cities showed a regional lock-in effect regarding their ESSV levels. In terms of the ΔESSV, negative growth dominated across the region, with central cities being most severely affected. This negative trend displayed a diffusion pattern emanating outward from the central area.
- (3)
- The regional ESSV network exhibits structural characteristics of multiple connections and multiple cores. Its spatial linkages demonstrate a trend of “central traction with north–south extension.” The overall connectivity strength of the network has been continuously increasing, gradually giving rise to a spatial pattern characterized by multi-core-driven and synergistic linkage.
- (4)
- The formation of high ESSV stems from the complex interactions among multidimensional resilience factors. The configurational pathways can be categorized into six models: social resilience-dominant (R1), ecological–institutional dual-core (R2), ecological-technological dual-core (R3), economic–institutional dual-core (R4), technological-institutional dual-core (R5), and economic resilience-dominant (R6).
Author Contributions
Chunbo Zhu: Conceptualization, Data curation, Formal analysis; Guozheng Gu: Writing—original draft, Project administration, Resources; Peijun Wang: Writing—review and editing. All authors have read and agreed to the published version of the manuscript.
Funding
This research was funded by the National Natural Science Foundation of China (Grants No. 41901229) and the National Natural Science Foundation of China (Grants No. 42501231).
Data Availability Statement
The data used in this study are publicly available. (1) Land use data were obtained from the 30 m resolution land use remote sensing monitoring dataset provided by the Resource and Environment Science and Data Center, Chinese Academy of Sciences. Available online: https://www.resdc.cn (accessed on 12 November 2025). (2) Socioeconomic data were sourced from the China Urban Statistical Yearbook, China Urban Construction Statistical Yearbook, China Statistical Yearbook on Environment, and various provincial and municipal statistical yearbooks. Data on agricultural product prices were derived from the Compilation of Cost–Benefit Data of National Agricultural Products for the years 2000–2020. (3) Administrative boundary vector data were acquired from the Resource and Environment Science and Data Center, Chinese Academy of Sciences (https://www.resdc.cn).
Conflicts of Interest
The authors declare no conflicts of interest.
Abbreviations
The following abbreviations are used in this manuscript:
| ESSV | Ecological Space Service Value |
| ESV | Ecosystem Service Value |
| FES | Forest Ecological Space |
| GES | Grassland Ecological Space |
| WES | Water Ecological Space |
| PLES | Production–Living–Ecological Space |
| OES | Other Ecological Space |
| IPS | Industrial Production Space |
| APS | Agricultural Production Space |
| ULS | Urban Living Space |
| RLS | Rural Living Space |
| con | Consistency Scores |
| cov | Coverage Values |
References
- Zhang, J.; Yi, M.; Zhang, G.; Tang, G.; Liu, J. A Review of Roadside Green Space Ecological Benefits Using Citespace: Research Hotspots and Future Trends. Urban Ecosyst. 2026, 29, 96. [Google Scholar] [CrossRef] [Scilit]
- Chen, B.; Jing, X.; Liu, S.; Jiang, J.; Wang, Y. Intermediate Human Activities Maximize Dryland Ecosystem Services in the Long-Term Land-Use Change: Evidence from the Sangong River Watershed, Northwest China. J. Environ. Manag. 2022, 319, 115708. [Google Scholar] [CrossRef] [Scilit] [PubMed]
- Li, R.; Shi, Y.; Feng, C.; Guo, L. The Spatial Relationship Between Ecosystem Service Scarcity Value and Urbanization from the Perspective of Heterogeneity in Typical Arid and Semiarid Regions of China. Ecol. Indic. 2021, 132, 108299. [Google Scholar] [CrossRef] [Scilit]
- Pan, N.; Guan, Q.; Wang, Q.; Sun, Y.; Li, H.; Ma, Y. Spatial Differentiation and Driving Mechanisms in Ecosystem Service Value of Arid Region: A Case Study in the Middle and Lower Reaches of Shule River Basin, NW China. J. Clean. Prod. 2021, 319, 128718. [Google Scholar] [CrossRef] [Scilit]
- Song, D.; Wang, L.; Wang, Y.; Zhao, B.; Jin, Q.; Yang, J. Disagreements in Equivalent-Factor-Based Valuation of County-Level Ecosystem Services in China: Insights from Comparison Among Ten LULC Datasets. Remote Sens. 2025, 17, 2320. [Google Scholar] [CrossRef] [Scilit]
- Liu, H.; Niu, T.; Yu, Q.; Yang, L.; Ma, J.; Qiu, S. Evaluation of the Spatiotemporal Evolution of China’s Ecological Spatial Network Function-Structure and Its Pattern Optimization. Remote Sens. 2022, 14, 4593. [Google Scholar] [CrossRef] [Scilit]
- Wang, Y.; Yu, Q.; Avirmed, B.; Zhao, J.; Sun, W.; Liu, Y.; Cui, H.; Khishigjargal, M.; Oyuntuya, S.; Dambadarjaa, N.; et al. The Response of Ecosystem Services to Ecological Spatial Network Patterns in China’s Arid and Semi-Arid Regions. Ecol. Indic. 2025, 172, 113300. [Google Scholar] [CrossRef] [Scilit]
- Lei, J.; Liu, X.; Wang, L.; Li, X.; Ma, J.; Zhang, L.; Yang, H. Study on the Relationship Between Intensive Land Use and Ecosystem Service Value in Gansu Province. Ecol. Model. 2025, 511, 111379. [Google Scholar] [CrossRef] [Scilit]
- Niu, J.; Jin, G.; Zhang, L. Territorial Spatial Zoning Based on Suitability Evaluation and Its Impact on Ecosystem Services in Ezhou City. J. Geogr. Sci. 2023, 33, 2278–2294. [Google Scholar] [CrossRef] [Scilit]
- Wang, Y.; Sun, J.; Liu, C.; Liu, L. Exploring the Nexus between Perceived Ecosystem Services and Well-Being of Rural Residents in a Mountainous Area, China. Appl. Geogr. 2024, 164, 103215. [Google Scholar] [CrossRef] [Scilit]
- Hu, J.; Qiu, S.; Luo, N.; Qing, G.; Huang, C. Multi-Dimensional Spatial and Temporal Variations of Ecosystem Service Values in the Li River Basin, 1990–2020. Remote Sens. 2023, 15, 2996. [Google Scholar] [CrossRef] [Scilit]
- Zhao, J.; Zhao, Y. Synergy/Trade-Offs and Differential Optimization of Production, Living, and Ecological Functions in the Yangtze River Economic Belt, China. Ecol. Indic. 2023, 147, 109925. [Google Scholar] [CrossRef] [Scilit]
- Dennis, M.; Armitage, R.P.; James, P. Social-Ecological Innovation: Adaptive Responses to Urban Environmental Conditions. Urban Ecosyst. 2016, 19, 1063–1082. [Google Scholar] [CrossRef] [Scilit]
- Liu, D.; Ren, Q. Dynamic Interactions and Mechanisms Between High-Quality Urbanization and Ecosystem Service Value in Shandong Province: Trends, Coordination, and Implications for Sustainable Development. Land Degrad. Dev. 2024, 35, 2781–2799. [Google Scholar] [CrossRef] [Scilit]
- Wang, J.; Gao, D.; Shi, W.; Du, J.; Huang, Z.; Liu, B. Spatio-Temporal Changes in Ecosystem Service Value: Evidence from the Economic Development of Urbanised Regions. Technol. Forecast. Soc. Change 2023, 193, 122626. [Google Scholar] [CrossRef] [Scilit]
- Mancini, M.S.; Galli, A.; Coscieme, L.; Niccolucci, V.; Lin, D.; Pulselli, F.M.; Bastianoni, S.; Marchettini, N. Exploring Ecosystem Services Assessment Through Ecological Footprint Accounting. Ecosyst. Serv. 2018, 30, 228–235. [Google Scholar] [CrossRef] [Scilit]
- Tang, Y.; Xiao, W.; Yuan, F. Evaluating Objective and Perceived Ecosystem Service in Urban Context: An Indirect Method Based on Housing Market. Landsc. Urban Plan. 2025, 254, 105245. [Google Scholar] [CrossRef] [Scilit]
- Costanza, R.; d’Arge, R.; de Groot, R.; Farber, S.; Grasso, M.; Hannon, B.; Limburg, K.; Naeem, S.; O’Neill, R.V.; Paruelo, J.; et al. The Value of the World’s Ecosystem Services and Natural Capital. Nature 1997, 387, 253–260. [Google Scholar] [CrossRef] [Scilit]
- Schaefer, M. Between Vision and Action: The Predicted Effects of Co-Designed Green Infrastructure Solutions on Environmental Burdens. Urban Ecosyst. 2022, 25, 1805–1824. [Google Scholar] [CrossRef] [Scilit]
- Zhang, X.; He, S.; Yang, Y. Evaluation of Wetland Ecosystem Services Value of the Yellow River Delta. Environ. Monit. Assess. 2021, 193, 353. [Google Scholar] [CrossRef] [Scilit] [PubMed]
- Ma, Q.; He, S.; Jing, H.; Wang, W.; Zhang, S.; Liang, X. Spatiotemporal Evolution and PLUS Simulation Prediction of Ecosystem Service Value in the Southern Jiangsu Urban Agglomeration Based on Land Use Changes. Appl. Sci. 2025, 15, 195. [Google Scholar] [CrossRef] [Scilit]
- Zhang, P.; Wang, Q.; Liu, Y.; Zhang, J. Potential Ecological Risk Assessment Based on Loss of Ecosystem Services Due to Land Use and Land Cover Change: A Case Study of Beijing-Tianjin-Hebei Region. Appl. Geogr. 2024, 171, 103389. [Google Scholar] [CrossRef] [Scilit]
- He, S.; Wang, D.; Zhao, P.; Li, Y.; Lan, H.; Chen, W.; Chen, X. Quantification of Basin-Scale Multiple Ecosystem Services in Ecologically Fragile Areas. Catena 2021, 202, 105247. [Google Scholar] [CrossRef] [Scilit]
- Zhang, M.; Ma, L.; Wang, Y.; Luo, J.; Peng, M.; Jize, D.; Jiao, C.; Huang, P.; Deng, Y. Spatiotemporal Dynamics and Driving Mechanisms of Ecosystem Service Values in China’s Southern Collective Forest Region. Forests 2026, 17, 501. [Google Scholar] [CrossRef] [Scilit]
- Wang, X.; Xu, Z.; Huang, J.; Zhang, Z. Spatiotemporal Evolution and Factors Influencing Regional Ecological Land in a Multidimensional Perspective: A Case Study of the Beijing-Tianjin-Hebei Region. Remote Sens. 2024, 16, 1714. [Google Scholar] [CrossRef] [Scilit]
- Zafar, Z.; Zubair, M.; Zha, Y.; Mehmood, M.; Rehman, A.; Fahd, S.; Nadeem, A. Predictive Modeling of Regional Carbon Storage Dynamics in Response to Land Use/Land Cover Changes: An InVEST-Based Analysis. Ecol. Inform. 2024, 82, 102701. [Google Scholar] [CrossRef] [Scilit]
- Ai, M.; Chen, X.; Yu, Q. Spatial Correlation Analysis Between Human Disturbance Intensity (HDI) and Ecosystem Services Value (ESV) in the Chengdu-Chongqing Urban Agglomeration. Ecol. Indic. 2024, 158, 111555. [Google Scholar] [CrossRef] [Scilit]
- Guo, X.; Fang, C.; Mu, X.; Chen, D. Coupling and Coordination Analysis of Urbanization and Ecosystem Service Value in Beijing-Tianjin-Hebei Urban Agglomeration. Ecol. Indic. 2022, 137, 108782. [Google Scholar] [CrossRef] [Scilit]
- Zhang, Z.; Shen, Z.; Liu, L.; Zhang, Y.; Yu, C.; Cui, L.; Gao, Y. Integrating Ecosystem Services Conservation into the Optimization of Urban Planning Policies in Eco-Fragile Areas: A Scenario-Based Case Study. Cities 2023, 134, 104200. [Google Scholar] [CrossRef] [Scilit]
- Du, H.; Zhao, L.; Zhang, P.; Li, J.; Yu, S. Ecological Compensation in the Beijing-Tianjin-Hebei Region Based on Ecosystem Services Flow. J. Environ. Manag. 2023, 331, 117230. [Google Scholar] [CrossRef] [Scilit] [PubMed]
- Wu, L.; Fan, F. Assessment of Ecosystem Services in New Perspective: A Comprehensive Ecosystem Service Index (CESI) as a Proxy to Integrate Multiple Ecosystem Services. Ecol. Indic. 2022, 138, 108800. [Google Scholar] [CrossRef] [Scilit]
- Chen, Y.; Duo, L.; Zhao, D.; Zeng, Y.; Guo, X. The Response of Ecosystem Vulnerability to Climate Change and Human Activities in the Poyang Lake City Group, China. Environ. Res. 2023, 233, 116473. [Google Scholar] [CrossRef] [Scilit] [PubMed]
- Su, S.; Li, D.; Hu, Y.; Xiao, R.; Zhang, Y. Spatially Non-Stationary Response of Ecosystem Service Value Changes to Urbanization in Shanghai, China. Ecol. Indic. 2014, 45, 332–339. [Google Scholar] [CrossRef] [Scilit]
- Wang, H.; Wang, L.; Jiang, A.; Wei, B.; Song, C. Assessing Impact of Land Use Change on Ecosystem Service Value in Dasi River Basin of China Based on an Improved Evaluation Model. Environ. Sci. Pollut. Res. 2023, 30, 6965–6985. [Google Scholar] [CrossRef] [Scilit] [PubMed]
- Mendel, J.M.; Korjani, M.M. A New Method for Calibrating the Fuzzy Sets Used in fsQCA. Inf. Sci. 2018, 468, 155–171. [Google Scholar] [CrossRef] [Scilit]
- Qian, M.; Huang, Y.; Cao, Y.; Wu, J.; Xiong, Y. Ecological Network Construction and Optimization in Guangzhou from the Perspective of Biodiversity Conservation. J. Environ. Manag. 2023, 336, 117692. [Google Scholar] [CrossRef] [Scilit] [PubMed]
- Deng, H.; Zhou, X.; Liao, Z. Ecological Redline Delineation Based on the Supply and Demand of Ecosystem Services. Land Use Policy 2024, 140, 107109. [Google Scholar] [CrossRef] [Scilit]
- Zhang, S.; Lei, J.; Tong, Y.; Zhang, X.; Lu, D.; Fan, L.; Duan, Z. Temporal and Spatial Responses of Ecological Resilience to Climate Change and Human Activities in the Economic Belt on the Northern Slope of the Tianshan Mountains, China. J. Arid. Land 2023, 15, 1245–1268. [Google Scholar] [CrossRef] [Scilit]
- Zhang, L.; Hu, B.; Zhang, Z.; Liang, G. Research on the Spatiotemporal Evolution and Mechanism of Ecosystem Service Value in the Mountain-River-Sea Transition Zone Based on? Production-Living-Ecological Space?—Taking the Karst-Beibu Gulf in Southwest Guangxi, China as an Example. Ecol. Indic. 2023, 148, 109889. [Google Scholar] [CrossRef] [Scilit]
- Xie, G.; Lu, C.-X.; Leng, Y.-F.; Zheng, D.; Li, S. Ecological Assets Valuation of the Tibetan Plateau. J. Nat. Resour. 2003, 18, 189–196. [Google Scholar]
- Zhang, L.; Yu, X.; Jiang, M.; Xue, Z.; Lu, X.; Zou, Y. A Consistent Ecosystem Services Valuation Method Based on Total Economic Value and Equivalent Value Factors: A Case Study in the Sanjiang Plain, Northeast China. Ecol. Complex. 2017, 29, 41–48. [Google Scholar] [CrossRef] [Scilit]
- Pascoe, S.; Van Landeghem, K.; Scheufele, G.; Abrahams, S. Rethinking the Use of the Residual Value Method for Ecosystem Services Valuation. Ecol. Econ. 2026, 248, 109060. [Google Scholar] [CrossRef] [Scilit]
- Fu, H.; Yan, Y. Ecosystem Service Value Assessment in Downtown for Implementing the “Mountain-River-Forest-Cropland-Lake-Grassland System Project”. Ecol. Indic. 2023, 154, 110751. [Google Scholar] [CrossRef] [Scilit]
- Yang, W.; Chen, J.; Ding, T.; Yan, X.; Gong, W. Supply-Demand Security Assessment of Water-Energy-Food Systems: A Perspective on Intra-City Coupling and Inter-City Linkages of Ecosystem Services. Sustain. Cities Soc. 2024, 117, 105964. [Google Scholar] [CrossRef] [Scilit]
- Greckhamer, T.; Furnari, S.; Fiss, P.C.; Aguilera, R.V. Studying Configurations with Qualitative Comparative Analysis: Best Practices in Strategy and Organization Research. Strateg. Organ. 2018, 16, 482–495. [Google Scholar] [CrossRef] [Scilit]
- Sukhov, A.; Sihvonen, A.; Netz, J.; Magnusson, P.; Olsson, L.E. How Experts Screen Ideas: The Complex Interplay of Intuition, Analysis and Sensemaking. J. Prod. Innov. Manag. 2021, 38, 248–270. [Google Scholar] [CrossRef] [Scilit]
- Li, C.; Fang, S.; Geng, X.; Yuan, Y.; Zheng, X.; Zhang, D.; Li, R.; Sun, W.; Wang, X. Coastal Ecosystem Service in Response to Past and Future Land Use and Land Cover Change Dynamics in the Yangtze River Estuary. J. Clean. Prod. 2023, 385, 135601. [Google Scholar] [CrossRef] [Scilit]
- Marre, J.-B.; Bille, R. A Demand-Driven Approach to Ecosystem Services Economic Valuation: Lessons from Pacific Island Countries and Territories. Ecosyst. Serv. 2019, 39, 100975. [Google Scholar] [CrossRef] [Scilit]
- Mumtaz, F.; Li, J.; Liu, Q.; Dong, Y.; Liu, C.; Gu, C.; Zhang, H.; Zhao, J.; Akhtar, M.; Bashir, B.; et al. A Comprehensive Framework for Evaluating Ecosystem Quality Changes and Human Activity Contributions in Inner Mongolia and Xinjiang, China. Land Use Policy 2025, 151, 107494. [Google Scholar] [CrossRef] [Scilit]
- Deng, X.; Fang, Y.; Lin, Y.; Yuan, Y. Non-Parametric Method for Filling in the Missing Value for Cross-Sectional Dataset: A Validation on the per Capita GDP Data at County Level in China. J. Food Agric. Environ. 2012, 10, 1351–1354. [Google Scholar]
- Jiang, L.; Chen, J.; Zhang, C.; Tian, Y.; Wu, G.; Luo, J. Study on Spatial Evolution and Mechanism of County Economic Differences in Hubei Province from 2005 to 2020. Front. Earth Sci. 2022, 10, 918123. [Google Scholar] [CrossRef] [Scilit]
- Yang, R.; Chen, H.; Chen, S.; Ye, Y. Spatiotemporal Evolution and Prediction of Land Use/Land Cover Changes and Ecosystem Service Variation in the Yellow River Basin, China. Ecol. Indic. 2022, 145, 109579. [Google Scholar] [CrossRef] [Scilit]
- Zhang, B.; Li, L. Evaluation of Ecosystem Service Value and Vulnerability Analysis of China National Nature Reserves: A Case Study of Shennongjia Forest Region. Ecol. Indic. 2023, 149, 110188. [Google Scholar] [CrossRef] [Scilit]
- Cao, Y.; Kong, L.; Zhang, L.; Ouyang, Z. The Balance Between Economic Development and Ecosystem Service Value in the Process of Land Urbanization: A Case Study of China’s Land Urbanization from 2000 to 2015. Land Use Policy 2021, 108, 105536. [Google Scholar] [CrossRef] [Scilit]
- Wang, A.; Liao, X.; Tong, Z.; Du, W.; Zhang, J.; Liu, X.; Liu, M. Spatial-Temporal Dynamic Evaluation of the Ecosystem Service Value from the Perspective of “Production-Living-Ecological” Spaces: A Case Study in Dongliao River Basin, China. J. Clean. Prod. 2022, 333, 130218. [Google Scholar] [CrossRef] [Scilit]
- Chen, Y.; Wang, L.; Yu, P.; Cheng, C. Linkages between Digital Economy and Ecosystem Services: Revealing the Spatiotemporal Relationship Based on U-Shaped Effect. Technol. Forecast. Soc. Change 2024, 207, 123601. [Google Scholar] [CrossRef] [Scilit]
- Qu, H.; You, C.; Feng, C.-C.; Guo, L. The Spatial Spillover Effects of Ecosystem Services: A Case Study in Yangtze River Economic Belt in China. Ecol. Indic. 2024, 168, 112741. [Google Scholar] [CrossRef] [Scilit]
- Wang, M.; Lu, X.; Xie, Y. Measurement and Spatio-Temporal Characteristics of Ecosystem Service Value Flow in Yangtze River Basin during 2010–2023: A Network Perspective. Front. Environ. Sci. 2025, 13, 1710854. [Google Scholar] [CrossRef] [Scilit]
- Liu, X.; Hu, Z.; Wang, Y.; Wang, M.; Hou, W. Resilience Assessment and Spatial Optimization of Urban Ecological Network Based on Complex Network Theory and PLUS Model. Urban Ecosyst. 2025, 28, 170. [Google Scholar] [CrossRef] [Scilit]
- Yang, X.; Luo, Z.; Luo, S. Multi-Scenario Ecosystem Risk Identification and Early Warning Coupling “Pattern-Service-Stability”: A Case Study of the Poyang Lake Plain, China. Environ. Res. Lett. 2025, 20, 084030. [Google Scholar] [CrossRef] [Scilit]
- Nie, X.; Li, X.; Lyu, C.; Su, Y.; Wang, H. Can Ecological Compensation Based on the Transfer of Development Rights (TDR) Improve Ecosystem Service Value? A Multi-Scenario Simulation. Land Use Policy 2024, 138, 107024. [Google Scholar] [CrossRef] [Scilit]
- Xing, X.; Yang, X.; Guo, J.; Chen, A.; Zhang, M.; Yang, D.; Hou, Z.; Zhang, H.; Wang, X. Response of Ecosystem Services in Beijing-Tianjin Sandstorm Source Control Project to Differing Engineering Measures Scenarios. J. Clean. Prod. 2023, 384, 135573. [Google Scholar] [CrossRef] [Scilit]
- Xing, L.; Xue, M.; Wang, X. Spatial Correction of Ecosystem Service Value and the Evaluation of Eco-Efficiency: A Case for China’s Provincial Level. Ecol. Indic. 2018, 95, 841–850. [Google Scholar] [CrossRef] [Scilit]

Disclaimer/Publisher’s Note: The statements, opinions and data contained in all publications are solely those of the individual author(s) and contributor(s) and not of MDPI and/or the editor(s). MDPI and/or the editor(s) disclaim responsibility for any injury to people or property resulting from any ideas, methods, instructions or products referred to in the content. |
© 2026 by the authors. Published by MDPI on behalf of the International Society for Photogrammetry and Remote Sensing. Licensee MDPI, Basel, Switzerland. This article is an open access article distributed under the terms and conditions of the Creative Commons Attribution (CC BY) license.