


Abstract
Low-altitude logistics is increasingly considered a promising solution for urban last-mile delivery, yet how urban morphology is associated with the simulated cost of drone logistics networks across cities remains unclear. This study examines model-based relationships between urban spatial form and the cost performance of drone logistics networks under unified simulation assumptions. A multi-tier facility location model is developed and applied to 101 Chinese cities, with simulated annealing used to obtain cost-minimizing configurations of drone take-off and landing facilities. An XGBoost model with SHAP analysis is employed to interpret nonlinear associations and interaction patterns between urban morphology indicators and simulated network cost, while K-means clustering is used to identify representative morphology–cost patterns. The results show that built-up area and landscape shape index are the most influential predictors in the adopted modeling setting, both exhibiting threshold-like sensitivity ranges. Simulated network costs increase more rapidly when built-up area exceeds approximately 1000 km2 and when landscape shape index falls within 5–15, with a notable interaction between them. Three morphology–cost types are further identified, reflecting systematic differences in simulated network organization. These findings provide simulation-derived evidence for morphology-sensitive planning of low-altitude logistics infrastructure, while actual deployment decisions still require calibration with local demand, operational, regulatory, and airspace conditions.
1. Introduction
With the acceleration of global urbanization and the explosive growth of e-commerce, last-mile urban logistics is facing unprecedented pressure. Traditional ground-based delivery systems have long been constrained by traffic congestion, rising labor costs, and environmental externalities [1,2]. According to reports by the United Nations and UN-Habitat, global urban populations and urban activities are projected to continue rapid growth over the coming decade, with cities absorbing the majority of demographic and consumption increases, thereby further intensifying both the scale and spatial complexity of last-mile logistics demand [3]. In response to these challenges, drone-enabled low-altitude logistics, as a core component of the emerging low-altitude economy, is increasingly recognized as a promising solution for reconfiguring urban logistics and building smarter transportation networks [4,5]. However, the scalability and economic efficiency of drone logistics depend not only on vehicle performance or scheduling strategies but also on the structural constraints imposed by the physical environment in which they operate. Urban spatial morphology, characterized by the size of built-up areas, boundary complexity, spatial continuity and internal connectivity, influences the organization of flight routes, the spatial coverage efficiency of take-off and landing facilities, and overall network operating costs. Evidence from ground logistics research suggests that urban sprawl and fragmentation can increase route detours and service costs [6,7], implying that spatial morphological structure may likewise be a key external driver of drone logistics network cost. Despite the growing interest in low-altitude logistics as a complement to traditional ground modes, the operational logic of such systems and the nature of their spatial constraints remain insufficiently explored. Against this backdrop, uncovering how urban morphology influences the cost dynamics of drone logistics networks and identifying the spatial adaptation characteristics between different urban forms and drone network layouts are pressing research challenges.
This study is related to three bodies of literature: drone logistics network planning, urban morphology–transport efficiency relationships, and explainable machine learning in urban studies. Existing studies on drone logistics networks have primarily focused on operations research and system-level scheduling, generating a substantial body of methodological contributions, yet often relying on simplified spatial representations. Drawing on classical optimization frameworks, prior research has concentrated on two core themes. The first concerns facility location, where models based on the p-median problem, set-covering formulations, and mixed-integer programming are widely employed to optimize the number and spatial distribution of drone take-off and landing facilities [8]. The objective functions of these models have gradually expanded beyond cost minimization to incorporate multiple sustainability-related criteria, including service coverage, customer satisfaction, energy consumption, and carbon emissions [9]. The second major theme involves route planning and coordinated scheduling, with research efforts devoted to optimizing drone flight paths to reduce energy consumption and operational risk [10]. In particular, truck–drone cooperative delivery systems have attracted growing attention, as they combine the high payload capacity and long endurance of ground vehicles with the flexibility of drones in last-mile delivery, and have been shown to effectively extend service ranges while reducing total delivery costs [11,12]. Despite these advances, urban spatial morphology is still often treated as a contextual backdrop rather than an explicit explanatory dimension in drone logistics network studies. Most models abstract cities into discrete demand points, candidate sites, and operational networks, thereby providing limited insight into how built-up area structure may be associated with facility coverage efficiency, route organization, and cross-city differences in simulated drone logistics network costs. Although some studies have acknowledged that urban spatial heterogeneity plays an important role in shaping drone operational patterns, it has yet to be systematically incorporated into city-scale simulation and evaluation frameworks [13,14].
Meanwhile, a substantial body of empirical and review studies in urban planning and geography has shown that urban form is closely associated with ground transportation efficiency, transport-related energy consumption, and infrastructure accessibility. In general, compact development, mixed land use, high network connectivity, and polycentric spatial organization tend to reduce reliance on private motorized travel, shorten average commuting distances, increase the shares of public and active transport, and lower transport-related energy consumption and carbon emissions [14,15,16]. However, these effects are not always linear. Moderate levels of land-use mix and development density may improve travel efficiency, whereas excessive concentration may generate congestion, compounded travel demand, excess commuting, or detours, thereby weakening the expected efficiency gains [17,18,19]. From a spatial-structural perspective, polycentric urban forms can alleviate pressure on a single urban core by dispersing employment, services, and travel flows across multiple centers [20]. In contrast, morphological fragmentation and discontinuities in street networks tend to reduce accessibility, increase route circuity and vehicle kilometers traveled, and amplify transport energy consumption and emissions [21,22]. These findings suggest that urban form affects transportation efficiency not only through the spatial distribution of population and activities, but also by shaping accessibility, connectivity, and the siting efficiency of transport and public-service facilities [23,24]. Nevertheless, most of these conclusions are grounded in ground transportation systems, which are constrained by road networks, route circuity, and node-based congestion [25]. Drone logistics, by contrast, relies more heavily on point-to-point flight, service-radius coverage, and low-altitude facility organization. Therefore, the morphological effects identified in ground transportation contexts cannot be directly transferred to drone logistics network layout and cost simulation, but they provide an important theoretical basis for examining whether urban form is also associated with simulated drone logistics network costs.
To clarify the position of this study within the existing literature, Table 1 summarizes related research along three dimensions: spatial representation, scale of analysis, and the extent to which urban morphology is incorporated into optimization or explanatory frameworks. The comparison suggests that the main gap does not lie in the lack of drone logistics optimization methods, but in the limited integration of city-scale morphology, comparable network cost simulation, interpretable nonlinear analysis, and typology-oriented planning across a broad multi-city sample.
Table 1.
Comparison of Related Research Streams and Identification of Research Gaps.
Based on the above review and comparison, three research gaps remain. First, urban spatial morphology has rarely been systematically incorporated into city-scale simulations of drone take-off and landing facility networks. As a result, existing studies provide limited evidence on how morphology is associated with cross-city variation in simulated drone logistics network costs. Second, although nonlinear and threshold-like relationships between urban form and ground transportation efficiency have been widely discussed, few studies have examined whether similar nonlinear sensitivity ranges exist in drone logistics network cost simulations. Third, most existing drone logistics studies focus on single cities, operational routes, or hypothetical scenarios, while broader multi-city comparisons remain limited. This constrains the development of differentiated planning insights for drone logistics facility deployment under different urban morphological conditions.
Accordingly, this study is guided by three research questions: (1) Which urban morphology indicators most strongly explain cross-city differences in drone logistics network costs? (2) Do the effects of urban morphology on network costs exhibit nonlinear thresholds or interaction patterns, and if so, where do these sensitivity ranges occur? (3) What representative morphology-cost types can be identified across major Chinese cities, and how can they inform differentiated planning strategies for drone take-off and landing facilities? The remainder of this paper is organized as follows. Section 2 introduces the study area, data sources, research framework, facility-location simulation model, morphology indicator system, and analytical methods. Section 3 reports the main results, including morphology–cost associations, XGBoost–SHAP interpretation, and K-means-based morphology–cost typologies. Section 4 discusses the nonlinear relationships, spatial adaptation patterns, planning implications, and limitations of the study. Section 5 summarizes the main findings and suggests directions for future research.
2. Methodology
2.1. Study Area
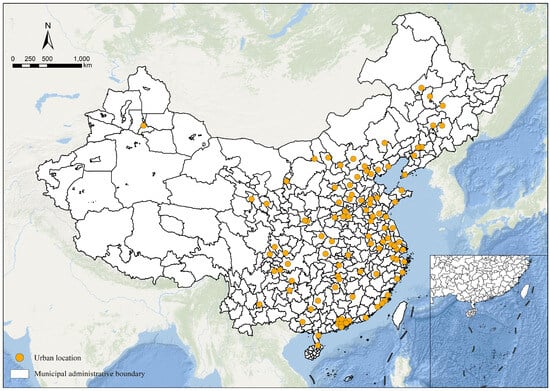
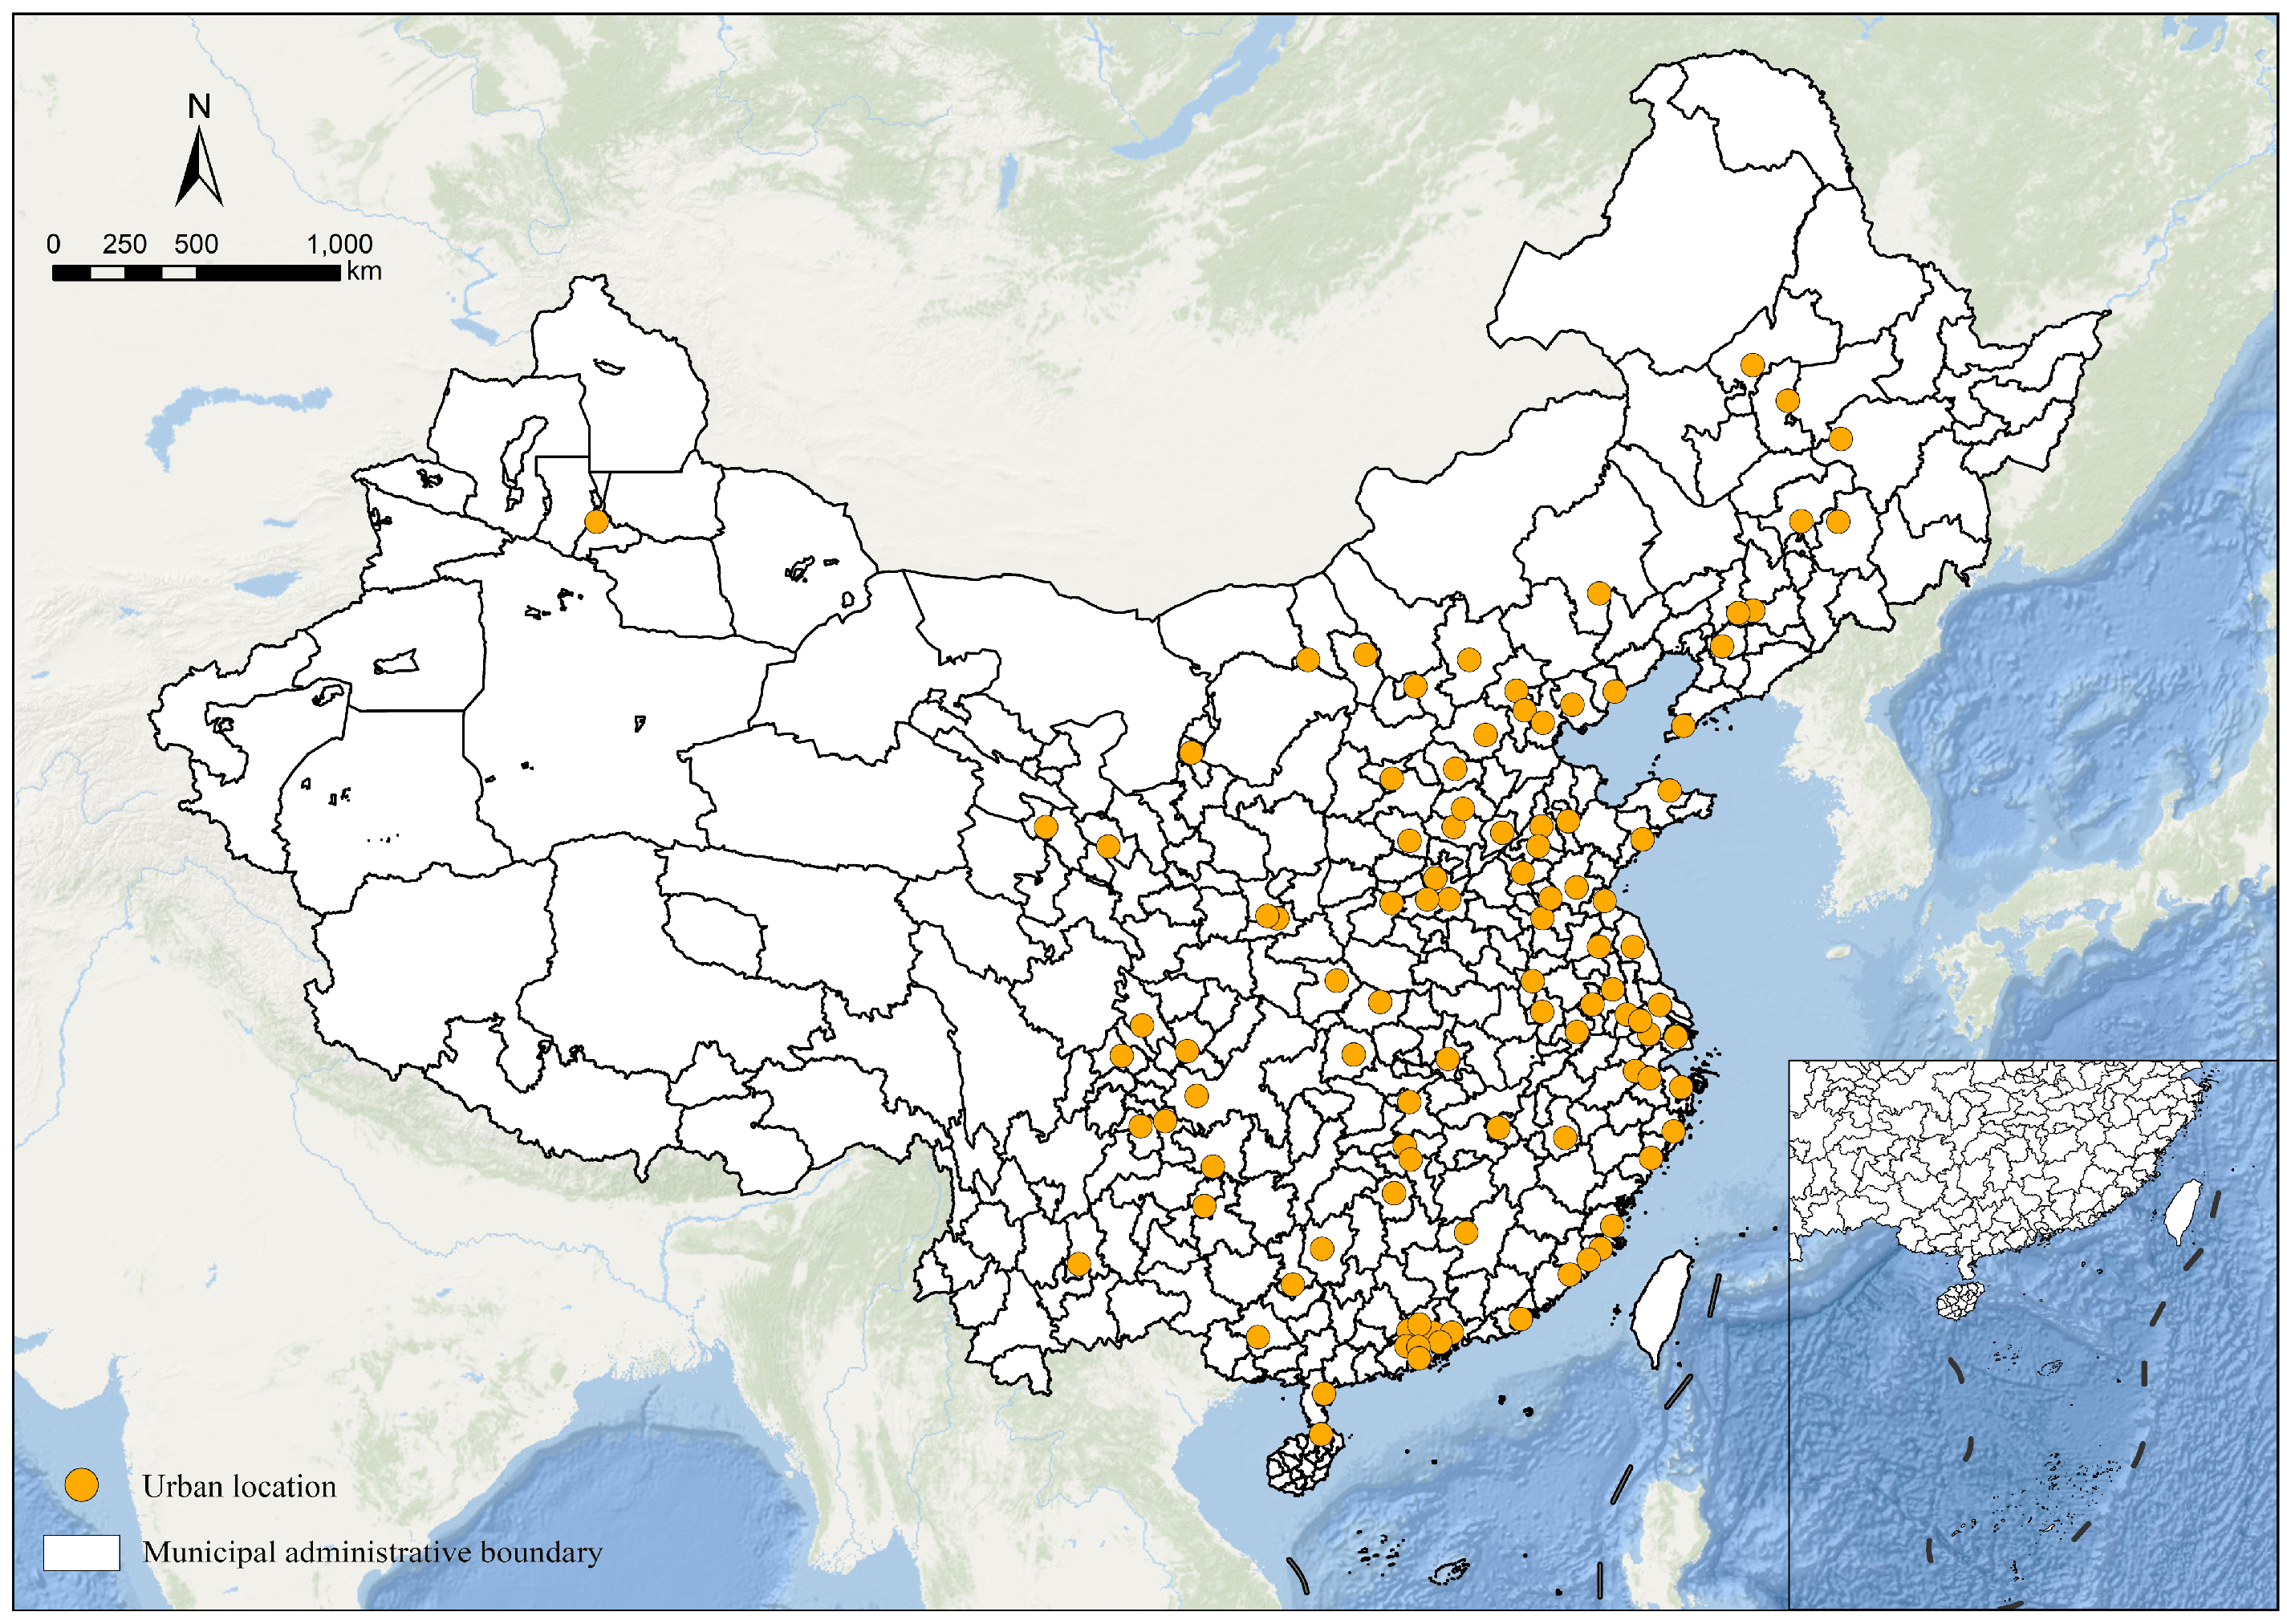
This study uses the County-Level Data from the Seventh National Population Census of China (2020) released by the State Council Census Office as the primary basis for sample selection. The initial sample consisted of 105 large cities in China’s urban system, including megacities, super-large cities, Type I large cities, and Type II large cities. These cities were selected because they concentrate large populations, relatively strong economic activity, and extensive built-up areas, and therefore constitute the urban contexts in which low-altitude logistics demand, facility siting pressure, and network deployment needs are most likely to emerge first and most intensively. In particular, several leading cities, such as Shenzhen, Shanghai, and Hangzhou, have already become important frontiers for the exploration of urban aerial logistics and drone-based delivery in localized scenarios, further highlighting the relevance of large cities as the key observational units for this study. From a comparative perspective, restricting the sample to nationally recognized large cities also ensures a more consistent basis for examining how differences in urban spatial morphology translate into differences in drone logistics network costs. Four county-level cities were excluded because their administrative status, statistical caliber, and urban governance context differ from those of prefecture-level and above cities, which could introduce bias into cross-city morphology–cost comparisons. The final dataset therefore includes 101 large cities (Figure 1). Overall, the most important criteria for inclusion were membership in the national large-city classification under the 2020 Census, consistency in administrative hierarchy, and the availability of comparable spatial data. This sample captures substantial variation in population size, economic intensity, and built-up form across major Chinese cities, providing a robust empirical basis for investigating how urban spatial structure shapes the efficiency and cost characteristics of drone logistics networks.
Figure 1.
Spatial distribution of the 101 large cities in China.
2.2. Data Sources and Preprocessing
This study integrates multiple sources of spatial data, including Chinese built-up area datasets, WorldPop population density raster data, and road and building vector data from Amap to characterize urban built-up morphology, the spatial distribution of logistics demand, and internal spatial structure, as summarized in Table 2. The built-up area data are used to delineate urbanized boundaries and serve as the basis for calculating morphological indicators. Population density data are employed as a proxy for the spatial distribution of logistics demand, while road and building datasets support the analysis of intra-urban structure and the computation of related indicators. To ensure spatial consistency and comparability across cities, each study unit is assigned an appropriate coordinate reference system according to its geographic location. Built-up area clipping, spatial resampling, and data cleaning are then conducted sequentially. Through these preprocessing steps, a unified and comparable city-scale database is constructed, providing a reliable data foundation for subsequent model development and empirical analysis of drone logistics networks.
Table 2.
Data sources and descriptions.
2.3. Overall Research Framework
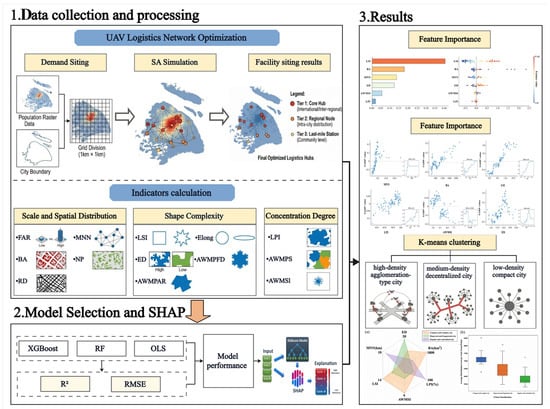
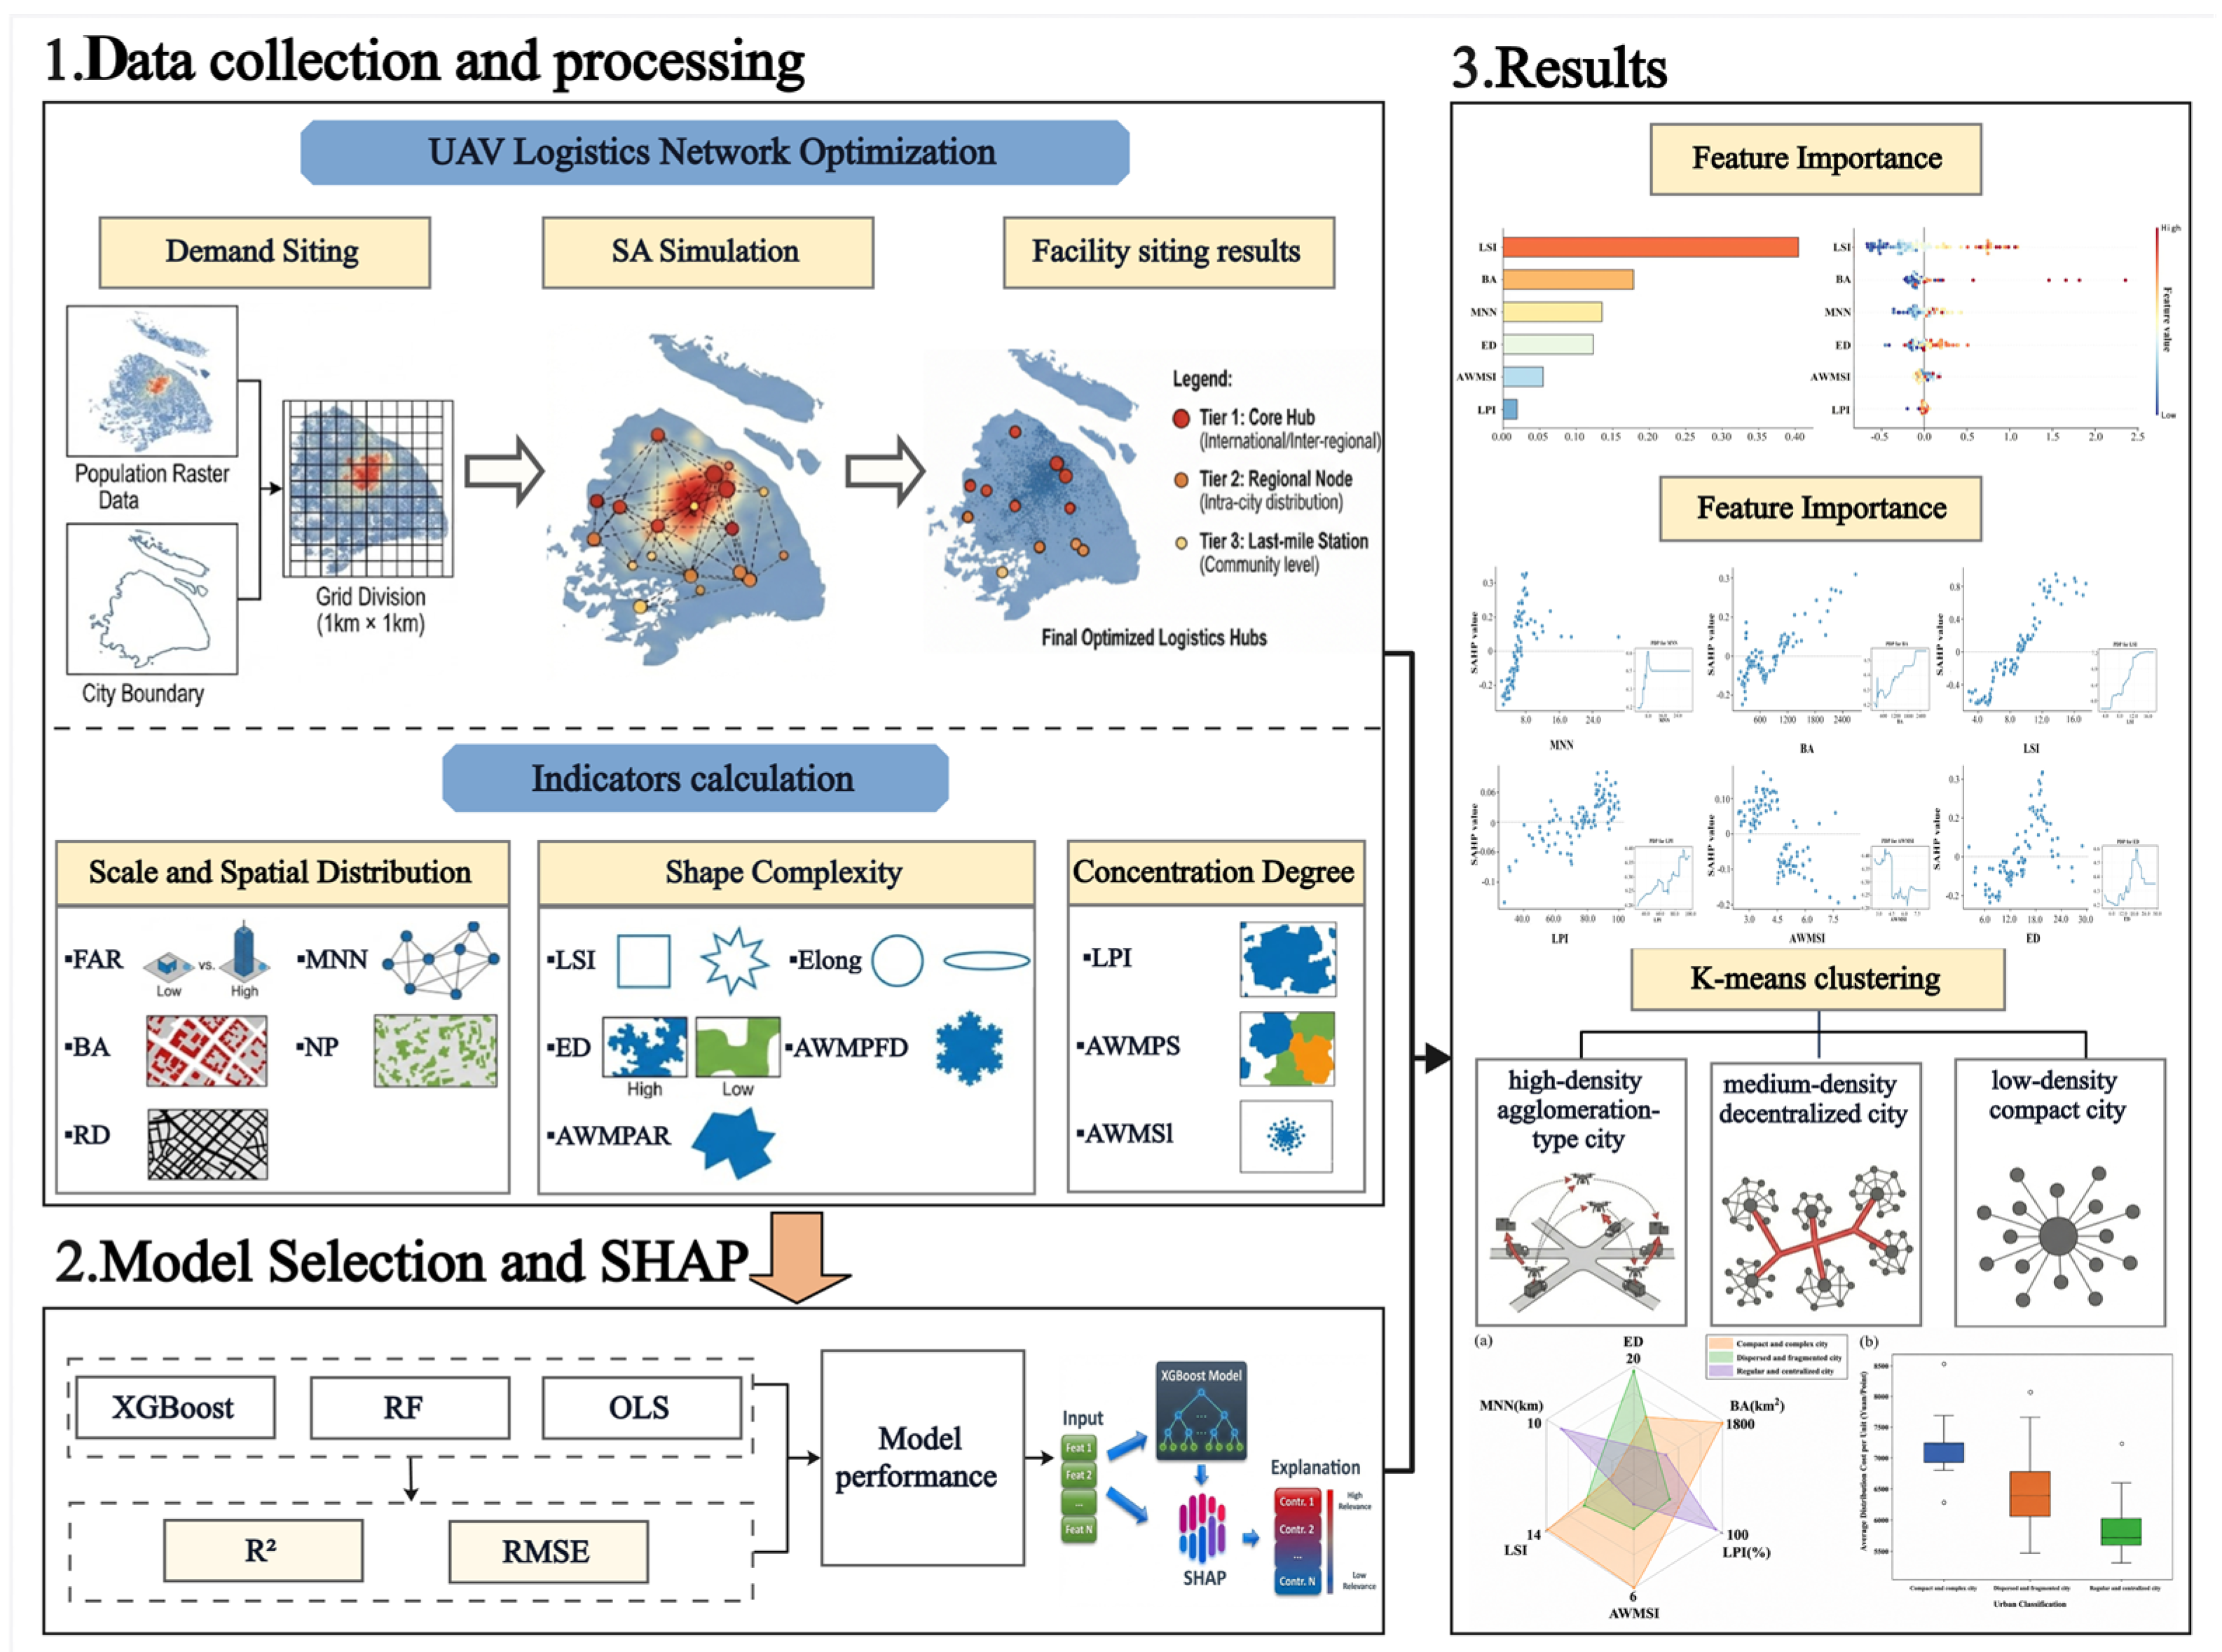
The overall research framework is illustrated in Figure 2 and consists of four interconnected components. First, multi-source spatial data are collected and processed for 101 major Chinese cities, including built-up area boundaries, population raster data, road networks, and building information. Based on these datasets, urban logistics demand is spatialized by dividing each built-up area into 1 km × 1 km grids and allocating demand according to population distribution. Candidate take-off and landing facilities are then optimized using a multi-level location model solved by a simulated annealing algorithm, generating cost-minimizing drone logistics networks under a unified set of assumptions regarding service radius, facility capacity, and operating cost. Second, an urban morphology indicator system is constructed to characterize three complementary dimensions of urban form: scale and spatial distribution, shape complexity, and concentration degree. Representative indicators include built-up area (BA), floor area ratio (FAR), road density (RD), nearest-neighbor distance (MNN), landscape shape index (LSI), edge density (ED), and largest patch index (LPI). Third, model selection and nonlinear interpretation are conducted by comparing OLS, Random Forest, and XGBoost models using R2 and RMSE as evaluation metrics. The best-performing model is then interpreted using SHAP to quantify feature importance, nonlinear threshold effects, and interaction relationships among morphology indicators. Fourth, K-means clustering is applied to classify cities into representative morphology–cost types, which are further interpreted through comparative visual analysis. Together, these steps link data preparation, drone logistics network optimization, nonlinear mechanism identification, and typological interpretation, providing a systematic framework for understanding how urban spatial morphology shapes the cost and configuration of drone logistics networks across cities.
Figure 2.
Research framework.
2.4. Drone Logistics Network Siting Model
This section integrates multi-source urban spatial data to develop a quantitative modeling framework that spans from demand representation to facility siting. First, high-resolution population distribution data are used to simulate the discrete spatial distribution of last-mile urban logistics demand. Next, a mathematical optimization model is formulated with the objective of minimizing total system cost, incorporating multiple constraints related to multi-level take-off and landing facilities, service capacity, and flight range. Finally, a simulated annealing algorithm is employed to derive cost-optimal spatial configurations of drone take-off and landing facilities for each city. The resulting solutions provide a data-driven basis for examining the intrinsic relationships between urban spatial morphology and the economic efficiency of drone logistics networks.
2.4.1. Urban Last-Mile Logistics Demand Modeling
This study focuses on small-parcel instant delivery and conventional parcel pickup and drop-off scenarios in urban last-mile logistics. Given the advantages of low-altitude drone transportation in terms of timeliness and spatial flexibility, service demand is defined primarily as that generated by permanent urban residents and commercial and office users within built-up areas whose delivery time sensitivity is relatively high and whose parcel sizes are compatible with typical drone payload constraints. At the city scale, direct observations of parcel orders are generally unavailable and are difficult to obtain in a consistent manner across a large sample of cities. For this reason, population density is used as a proxy for demand intensity. This choice is based on the fact that urban last-mile logistics demand is fundamentally rooted in the spatial distribution of people and daily activities. Areas with higher population concentration generally correspond to denser residential consumption, more frequent parcel reception, and stronger demand for time-sensitive delivery services. At the macroscopic scale, the purpose of demand representation is not to predict the exact number of orders in each location, but to capture the relative spatial distribution of potential demand in a comparable way across cities. In this context, population density provides a stable, transparent, and spatially continuous approximation of where demand is more likely to concentrate. It is therefore particularly suitable for cross-city comparative analysis under a unified modeling framework. Previous studies have similarly shown that population-based indicators can effectively approximate aggregate delivery demand patterns, especially when the focus is on relative spatial structure rather than platform-specific order volumes [26,27,28]. Based on this logic, high-resolution population raster data are used to construct a demand intensity surface centered on end consumers, thereby providing a consistent basis for the hierarchical design of drone take-off and landing facilities and for the simulation of cross-city differences in drone logistics network costs. Although population density cannot fully capture temporal fluctuations, behavioral heterogeneity, or differences among business types, it remains a robust proxy for representing the broad spatial gradients of urban last-mile delivery demand.
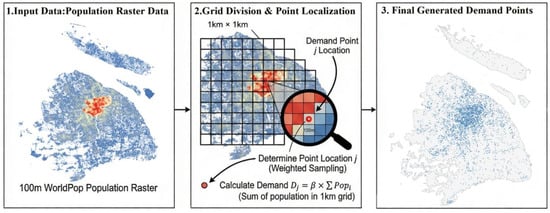
First, population raster cells are clipped by the built-up area boundary to obtain the effective population grid set S. To ensure comparability across cities while controlling the computational scale of subsequent siting optimization, the built-up area is further partitioned into regular grids of 1 km × 1 km, forming a grid set G. A demand point is generated for each grid cell; therefore, the total number of demand points satisfies:
Let Sg ⊆ S denote the set of population raster cells contained within grid cell g ∈ G, and let Popi represent the population count of raster cell i ∈ Sg. To determine the specific location of the demand point within each grid cell, a population-weighted sampling approach is employed to select a representative raster cell. The probability that raster cell i is selected is defined as:
According to Equation (2), one raster cell is randomly sampled from Sg and denoted as i′. The geometric center of raster cell i′ is then taken as the spatial coordinate of the corresponding demand point j:
The set of demand points J obtained through the above procedures represents the spatial distribution of urban last-mile logistics demand and serves as the input for the drone facility siting optimization model described in Section 3.3. A schematic illustration of the demand point generation process is presented in Figure 3.
Figure 3.
Schematic illustration of demand point generation.
2.4.2. Drone Logistics Network Siting and Cost Simulation
This study formulates the construction of a drone logistics network as a facility location optimization problem under given operational constraints. Within the study area, a set of spatially distributed logistics demand points and candidate locations for drone take-off and landing facilities is defined. The objective is to optimize the number, hierarchical levels, and spatial configuration of facilities so as to construct a drone logistics network that fully covers all demand points while minimizing total configuration cost, subject to constraints on drone flight range and service coverage. To ensure comparability across cities, drone technical parameters and service rules are uniformly specified, and facility siting and network organization are treated as the main decision variables. Network cost is defined as the combined investment in drone take-off and landing facility deployment and logistics delivery operations, and average cost per facility is adopted as a comparative indicator to mitigate the direct influence of city size on total cost while preserving the pathways through which urban spatial structure affects drone logistics network cost.
Under this problem setting, several simplifying assumptions are adopted to reduce computational complexity and emphasize spatial structural effects on the drone logistics network. Drones are assumed to perform straight-line point-to-point delivery tasks, with each flight serving a single order and payload characteristics remaining within drone performance limits. Potential conflicts, queuing, and delivery delays are not considered, and all candidate facility locations are assumed to be equipped with vertical take-off and landing capabilities and necessary supporting infrastructure. In addition, to reflect the spatial heterogeneity of urban last-mile logistics demand, drone take-off and landing facilities are classified into three hierarchical levels, which differ in construction cost, service capacity, and service range, thereby representing functional differentiation within the drone logistics network.
- (1)
- Model Notation and Parameter Definition
Based on the urban last-mile logistics demand distribution constructed in Section 2.4, this subsection formulates a drone logistics network siting optimization model from the perspective of multi-level drone take-off and landing facilities. For each city, the set of demand points obtained in Section 2.4 is denoted as J, where each demand point j ∈ J is associated with a demand quantity Dj. Candidate take-off and landing facility locations are generated according to predefined siting rules, forming a candidate facility set I. Each candidate location can be developed as a drone take-off and landing facility of different hierarchical levels, denoted by the set K. The main symbols and parameters involved in the model and their corresponding definitions are summarized in Table 3.
Table 3.
Notation and definitions.
To ensure the comparability of simulation results across cities, this study adopts unified specifications for drone technical parameters and facility hierarchy rules. Parameter values are drawn from commonly used settings in existing studies on drone logistics network siting and last-mile delivery and are kept constant across all city samples, as summarized in Table 4 [26,27].
Table 4.
Model parameter settings.
- (2)
- Objective function
The objective is to minimize the total economic cost C of the drone logistics network, expressed as:
where Cf denotes the fixed construction cost and Cv denotes the transportation operating cost, respectively, expressed as:
To facilitate cross-city comparison, the average total cost per take-off and landing facility is further defined as:
- (3)
- Constraints
1. Service coverage constraint: Each demand point j ∈ J must be served by one and only one drone take-off and landing facility, expressed as:
2. Capacity constraint: The total demand served by each drone take-off and landing facility i ∈ I shall not exceed the service capacity Qk of its corresponding facility level k, expressed as:
3. Service radius and flight range constraint: Each demand point j ∈ J must be located within the service radius Rk of the drone take-off and landing facility i assigned to serve it, and the one-way flight distance between the facility and the demand point shall not exceed half of the maximum allowable flight range Lmax expressed as:
4. Facility level uniqueness constraint: At each candidate location i ∈ I, at most one facility level can be selected for construction, expressed as:
5. Binary decision variable constraint: Decision variables xij and yik are binary and can only take values of 0 or 1, expressed as:
2.4.3. Solution Algorithm: Simulated Annealing
Simulated annealing (SA) is an iterative heuristic optimization method that employs a temperature parameter T to probabilistically accept inferior solutions, thereby balancing global exploration and local refinement in complex combinatorial problems [28,29,30]. In this study, SA is applied to solve the drone logistics network siting problem by iteratively generating neighborhood solutions through operations such as opening or closing facilities, adjusting facility levels, and replacing facility locations. Each trial solution is evaluated using the objective function, with constraint violations related to service coverage, capacity, or flight range discouraged via penalty terms [31]. As the temperature decreases, the search process gradually shifts from stochastic exploration toward localized improvement, and the algorithm terminates when further iterations yield no meaningful improvement. The best solution obtained represents a near-optimal spatial configuration of drone take-off and landing facilities, providing stable cost estimates for subsequent cross-city analysis of urban form effects.
To improve methodological transparency, the SA procedure is further described in terms of its main search components. The algorithm starts from an initial feasible or near-feasible facility configuration and generates neighborhood solutions through facility opening or closing, facility-level adjustment, and candidate-location replacement. The same search logic, parameter settings, and stopping rule are applied across all cities to ensure cross-city comparability. In the parameter-setting stage, multiple combinations of initial temperature and cooling coefficient were tested by jointly considering solution quality and computational efficiency. Based on these experiments, and were selected as the final parameter setting. Under this setting, the objective function generally stabilized after approximately 2000 iterations, suggesting that this iteration scale was sufficient for the algorithm to obtain a stable near-optimal solution.
Because SA is a heuristic algorithm, an additional multi-random-seed stability check was conducted to examine whether the simulated cost results were sensitive to stochastic search initialization. Six representative cities from the study dataset were rerun five times using different SA random seeds while keeping the demand samples, model parameters, and input data unchanged. The average coefficient of variation of unit cost was 3.14%, with a maximum of 6.75%, and all runs achieved complete demand coverage. The number of selected facilities showed slightly higher variation, reflecting the existence of multiple near-equivalent spatial layouts under similar cost levels. Overall, these results indicate that the SA-derived unit cost estimates are sufficiently stable for subsequent comparative analysis of morphology–cost relationships across cities.
2.5. Construction of the Urban Spatial Form Indicator System
Urban morphology indicators provide quantitative descriptions of the spatial structure and geometric characteristics of urban built-up areas, capturing differences in development scale, spatial configuration, boundary complexity, and degrees of concentration [32,33]. In the context of drone logistics networks, urban morphology is not merely a background condition but a structural factor that may influence the spatial distribution of demand, the effective utilization of service radii, and the organization of network coverage paths, thereby shaping facility layout efficiency and overall cost performance. To support cross-city comparisons and to quantify how variations in urban form contribute to differences in drone logistics network costs under unified operational constraints, this study constructs an urban morphology indicator system by synthesizing commonly adopted indicators from landscape ecology, urban geography, and related empirical research. The resulting multidimensional framework is organized along three core dimensions, namely scale and spatial distribution, shape complexity, and concentration, and is designed to comprehensively capture key spatial characteristics of urban built-up areas. The resulting multidimensional framework is organized along three core dimensions, namely scale and spatial distribution, shape complexity, and concentration, and is designed to comprehensively capture key spatial characteristics of urban built-up areas. Detailed definitions of the selected indicators and their calculation methods are provided in Table 5.
Table 5.
Urban morphology indicators.
2.6. Driving Mechanism Analysis
2.6.1. Preliminary Association Analysis and OLS Benchmark
Before the nonlinear mechanism analysis, a preliminary association analysis is conducted to explain the rationale and method of the results reported in Section 3.1. Pearson correlation analysis is first used to evaluate the pairwise association between each candidate urban morphology indicator and simulated unit cost. Because many morphology indicators are conceptually related and may produce unstable estimates if entered simultaneously, VIF diagnostics are then applied to identify and reduce multicollinearity. Indicators meeting both statistical significance and multicollinearity criteria are retained for OLS regression. The OLS model is used as a baseline because it provides an interpretable estimate of the average linear relationship between urban morphology and drone logistics network costs, thereby clarifying whether the selected indicators have explanatory value before more flexible machine-learning models are introduced.
2.6.2. XGBoost–SHAP Analysis
Extreme Gradient Boosting (XGBoost) is an ensemble learning framework based on gradient boosting that combines multiple regression trees to model complex nonlinear relationships among variables [34,35]. Owing to its strong predictive performance and robustness, XGBoost has been widely adopted in urban and transportation studies. In this study, XGBoost is employed to model the relationship between urban morphology indicators and the cost of drone logistics networks, with the aim of capturing nonlinear effects and interaction patterns that are difficult to identify using conventional linear models. To ensure a comprehensive comparison of modeling approaches, Ordinary Least Squares (OLS), Support Vector Regression (SVR), Gradient Boosting Regression (GBR), Random Forest (RF), and XGBoost are evaluated under the same training and validation settings. These models represent a progression from linear regression to increasingly flexible nonlinear and ensemble-based methods. Model performance is assessed using the coefficient of determination (R2) and root mean square error (RMSE) on the validation dataset, and the best-performing model is subsequently interpreted using SHAP to identify feature importance, nonlinear threshold effects, and interaction relationships among urban morphology indicators. In addition, SHAP consistency analysis is conducted as a supplementary robustness check to assess the stability of the interpretability results.
To improve the interpretability of the XGBoost model, this study adopts SHAP (Shapley Additive Explanations), an explainable machine-learning framework grounded in Shapley value theory from cooperative game theory [36,37]. SHAP quantifies the marginal contribution of each feature to the prediction outcome by assigning feature-specific contribution values. The Shapley value for feature iii is defined as:
where ϕi denotes the contribution of feature i, F represents the full set of features, and S denotes any subset of features excluding i. Based on these values, SHAP constructs an additive explanation model expressed as:
where g(z′) is the interpretable representation of the model output, ϕ0 is the baseline prediction, and z′j is a binary indicator denoting the presence of feature j. By computing SHAP values across all samples, this study systematically examines the relative importance, directional effects, and nonlinear response patterns of urban morphology indicators, thereby revealing the key driving mechanisms through which urban form influences the cost performance of drone logistics networks.
2.6.3. K-Means Clustering Analysis
K-means clustering is an unsupervised classification method that partitions samples into a predefined number of clusters by minimizing within-cluster variation and maximizing between-cluster differences, with the sum of squared errors (SSE) as the objective function. Given a specified number of clusters , the algorithm iteratively assigns observations to the nearest cluster centroid and updates centroids until convergence. In this study, the number of clusters is determined by combining the elbow method with silhouette analysis. The elbow method is used to examine the rate of decline in SSE across alternative values of , while silhouette coefficients are used to assess the degree of within-cluster compactness and between-cluster separation. Considering these statistical criteria together with the substantive interpretability of the resulting groups, the final clustering solution is selected for subsequent analysis. Based on this solution, the study identifies typical morphology–cost patterns across cities [34,38].
3. Results
3.1. Associations Between Drone Logistics Network Costs and Urban Morphology Indicators
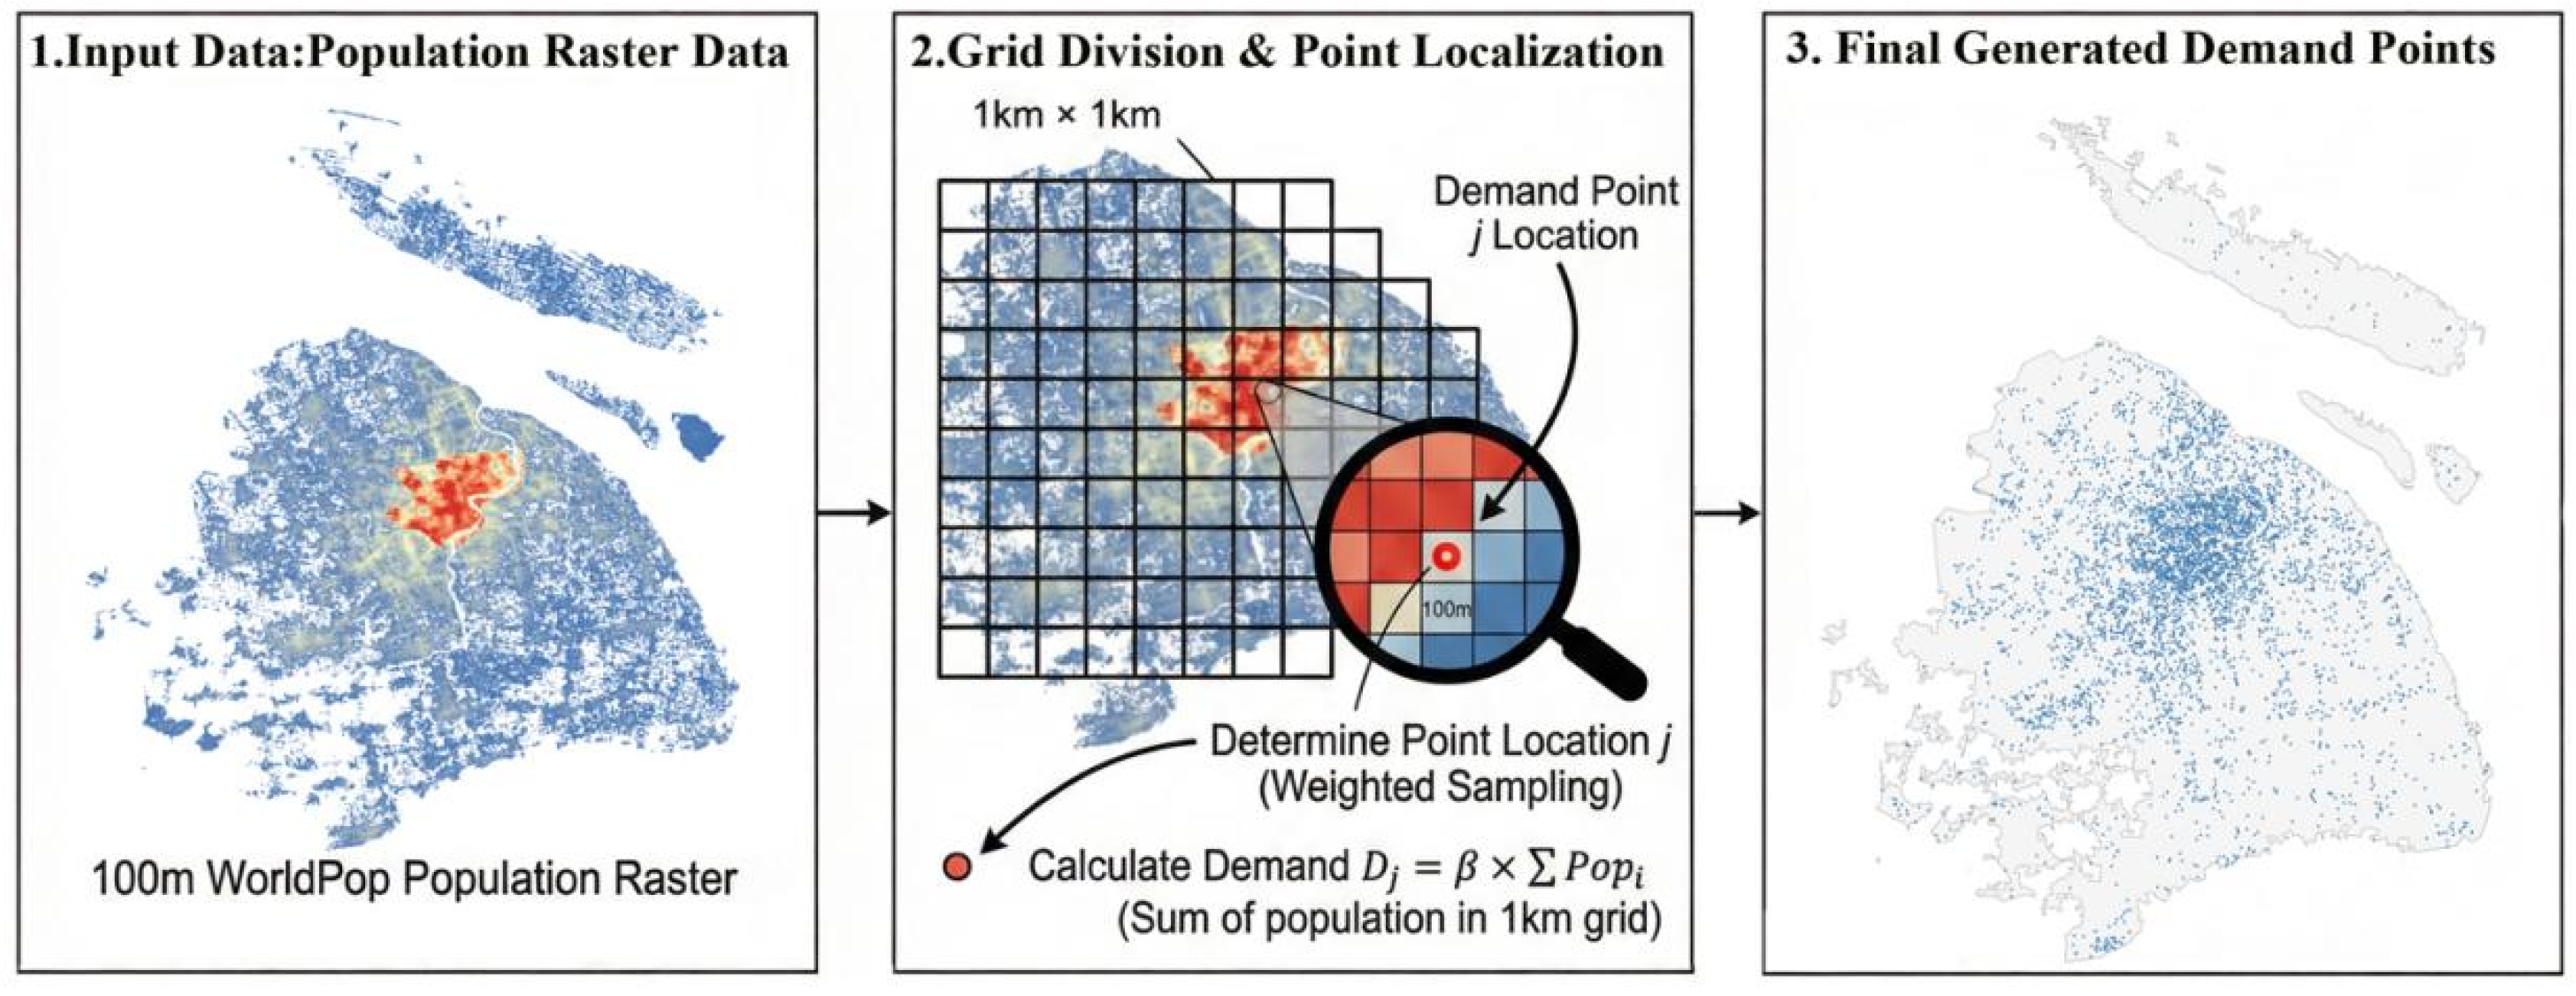
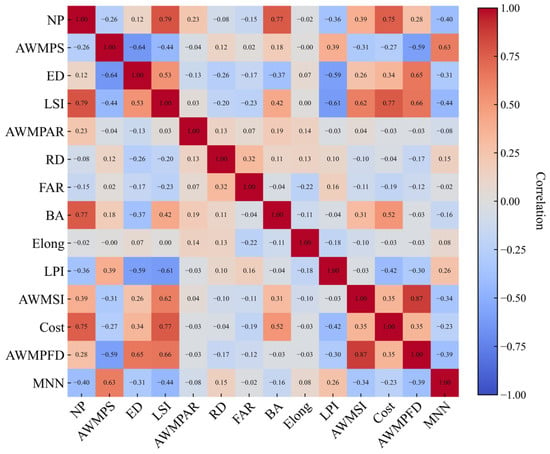
After the simulated annealing procedure generated cost-minimizing facility configurations for the 101 cities, this section first examines the statistical association between model-generated simulated unit cost and urban morphology indicators. The purpose of this step is twofold: to identify which morphology variables are sufficiently informative for subsequent nonlinear modeling and to establish a transparent linear benchmark before applying machine-learning interpretation. Pearson correlation analysis was used to examine pairwise relationships between candidate indicators and simulated unit cost, as illustrated in Figure 4, while VIF diagnostics were used to reduce multicollinearity among explanatory variables. Under the combined criteria of statistical significance (p < 0.05) and acceptable multicollinearity (VIF < 5), six core indicators were retained: BA, LSI, LPI, ED, MNN, and AWMSI. An OLS model based on these indicators achieved an R2 of 0.756 (Table 6), indicating that urban morphology explains a substantial share of inter-city variation in simulated unit cost. This result supports the relevance of morphology as an explanatory dimension within the adopted modeling framework and provides a clear baseline for the nonlinear XGBoost-SHAP analysis that follows.
Figure 4.
Distribution of Pearson correlation coefficients among variables.
Table 6.
OLS regression results.
3.2. Model Interpretability Analysis Based on XGBoost and SHAP
Table 7 compares the predictive performance of five models, including OLS, SVR, Gradient Boosting Regression, Random Forest, and XGBoost. XGBoost achieves the best overall performance (R2 = 0.795; RMSE = 0.266), moderately outperforming the OLS benchmark and Random Forest, while substantially exceeding the predictive accuracy of SVR and Gradient Boosting. These results do not indicate a general superiority of nonlinear models over the OLS benchmark. Rather, under the adopted evaluation setting, XGBoost achieved the best validation performance among the compared models, with a moderate improvement over OLS. Therefore, XGBoost was selected not only because of its predictive performance, but also because it provides a suitable basis for SHAP-based interpretation of nonlinear associations and interaction patterns between urban morphology indicators and simulated network cost.
Table 7.
Performance comparison of the five models.
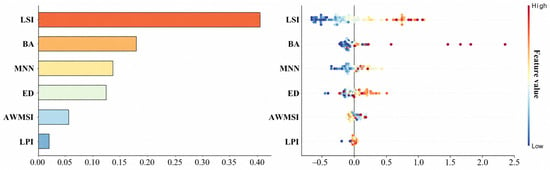
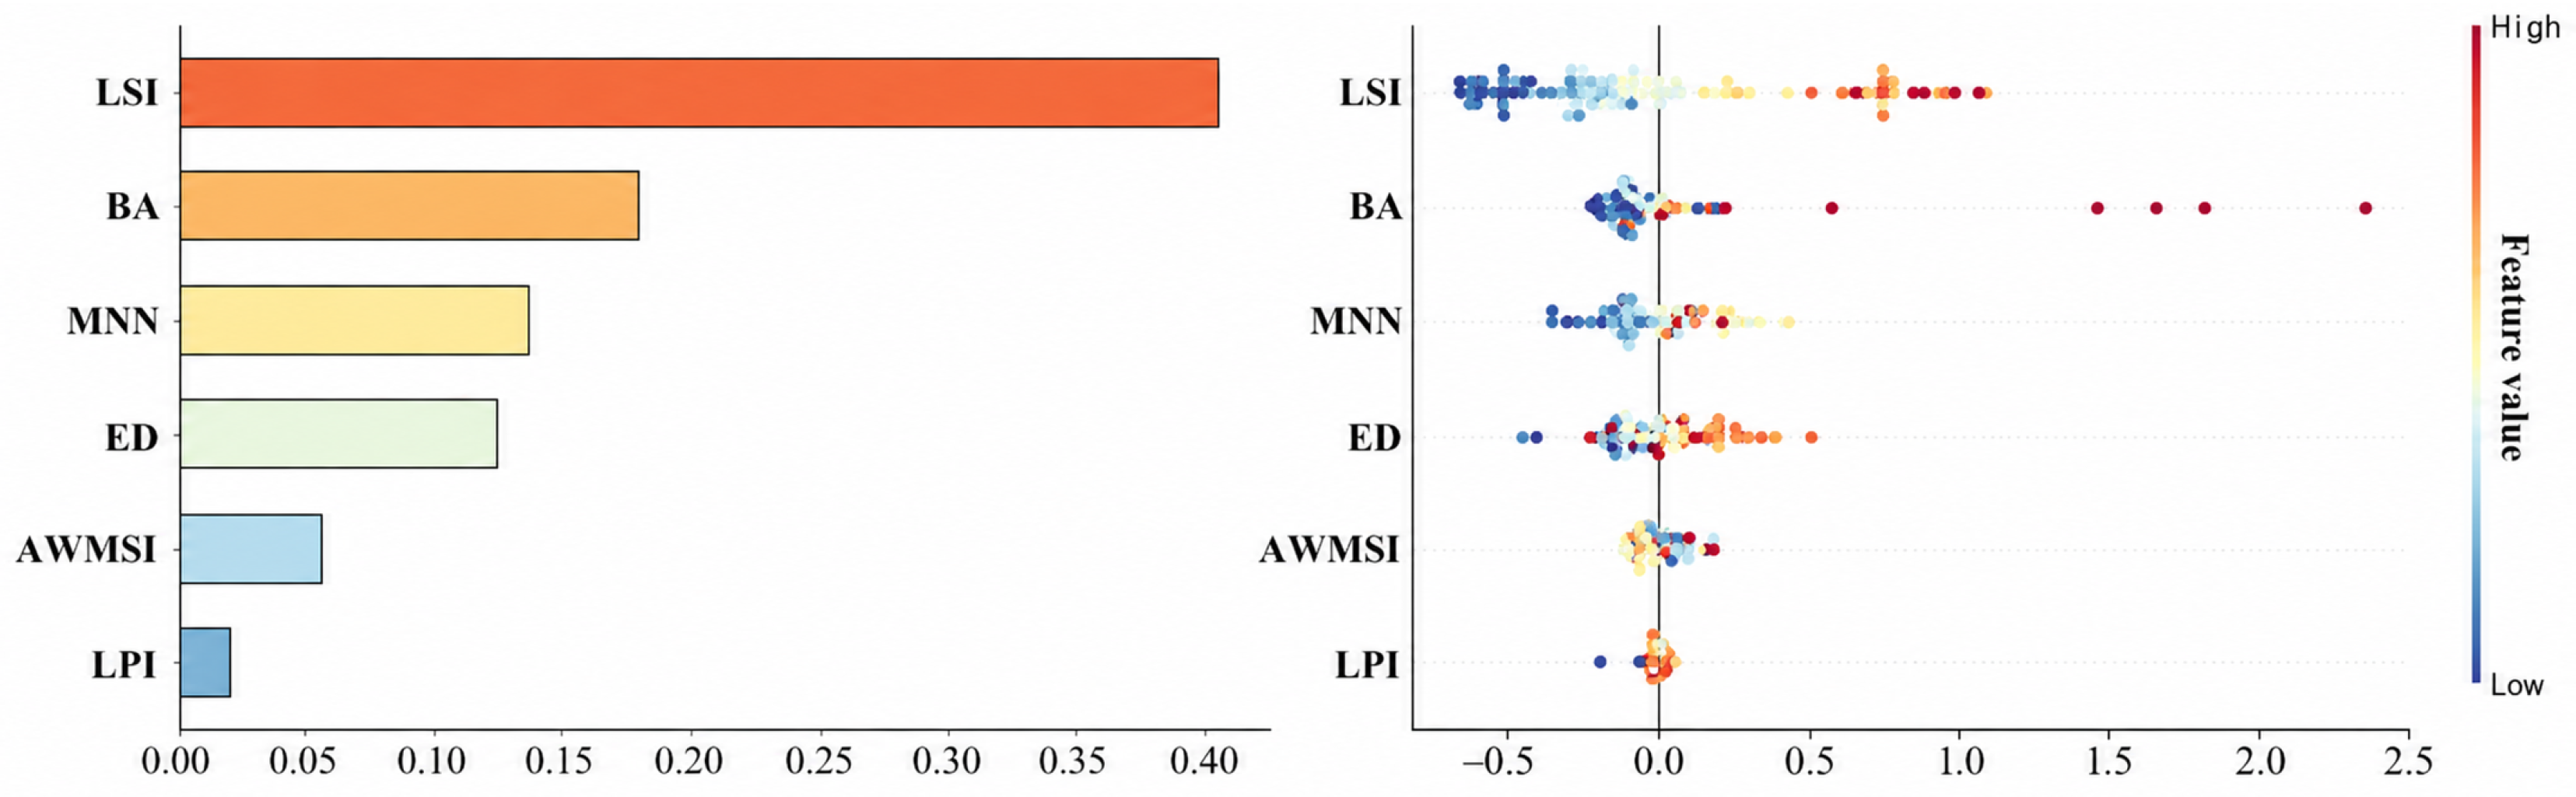
Figure 5 presents the SHAP-based importance ranking of urban morphology indicators and their sample-level contribution patterns to cost prediction. The results show that LSI has the highest mean absolute contribution, and observations with higher LSI values are more often associated with positive contributions, suggesting that greater boundary complexity of built-up areas is generally linked to higher drone logistics network configuration costs. BA ranks second, exhibiting a pronounced asymmetric contribution pattern: contributions are close to zero or negative at low values, whereas larger positive contributions emerge at higher values, indicating that urban scale expansion raises costs more substantially in some cities. By contrast, MNN and ED show weaker overall effects, with contributions clustered around zero, while AWMSI and LPI have the smallest marginal contributions. Overall, cost differences are primarily driven by the joint effects of built-up scale and shape complexity, whereas other morphology factors play a more secondary role.
Figure 5.
SHAP feature importance bar plot and beeswarm plot.
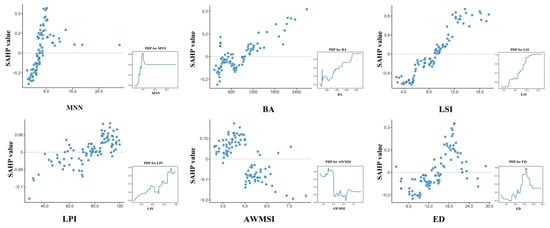
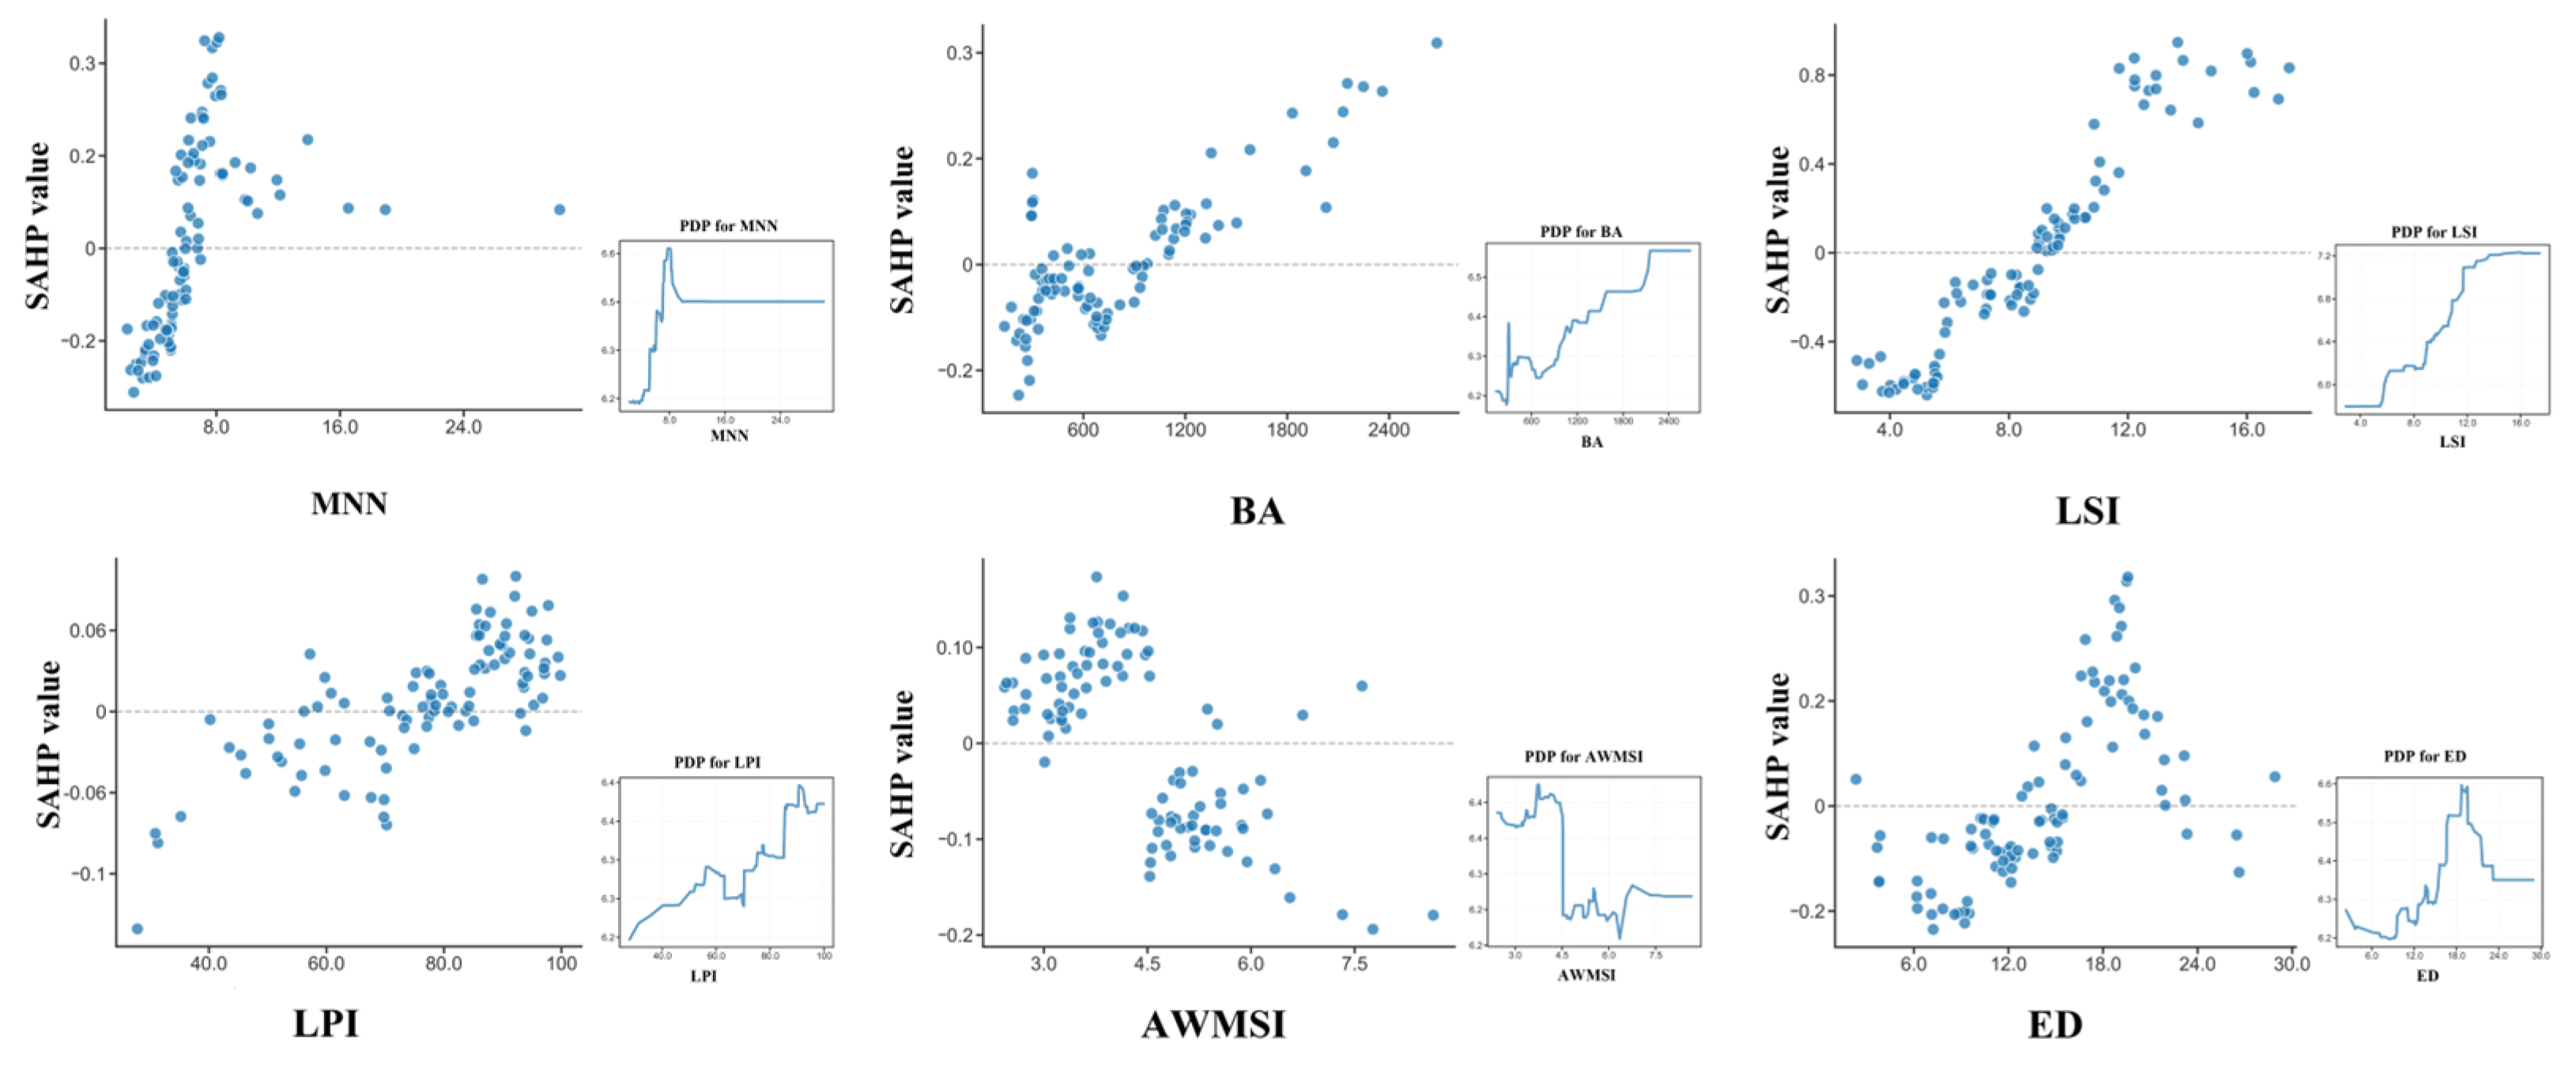
Figure 6 further clarifies that the effects of morphology on the simulated unit cost are nonlinear. LSI shows a distinct sensitivity interval: when LSI is approximately 5–15, simulated unit costs rise rapidly as boundary irregularity increases, suggesting that drone network layouts become especially sensitive when cities shift from relatively regular forms toward more complex outlines. BA also presents a threshold-like pattern under the adopted parameter setting. Below about 1000 km2, its marginal effect on cost is limited; above this level, larger built-up areas tend to increase baseline facility requirements and operating costs more clearly. ED further reflects the cost effect of fragmented or complex urban edges, while MNN, AWMSI, and LPI contribute more weakly to overall differentiation. These thresholds should be interpreted as model-based sensitivity ranges rather than universal real-world thresholds.
Figure 6.
SHAP dependence plots for the core urban morphology indicators.
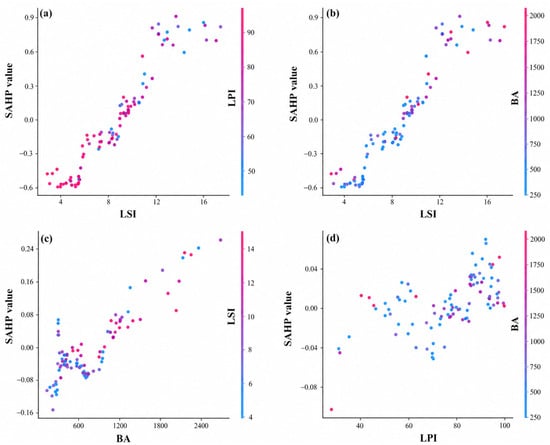
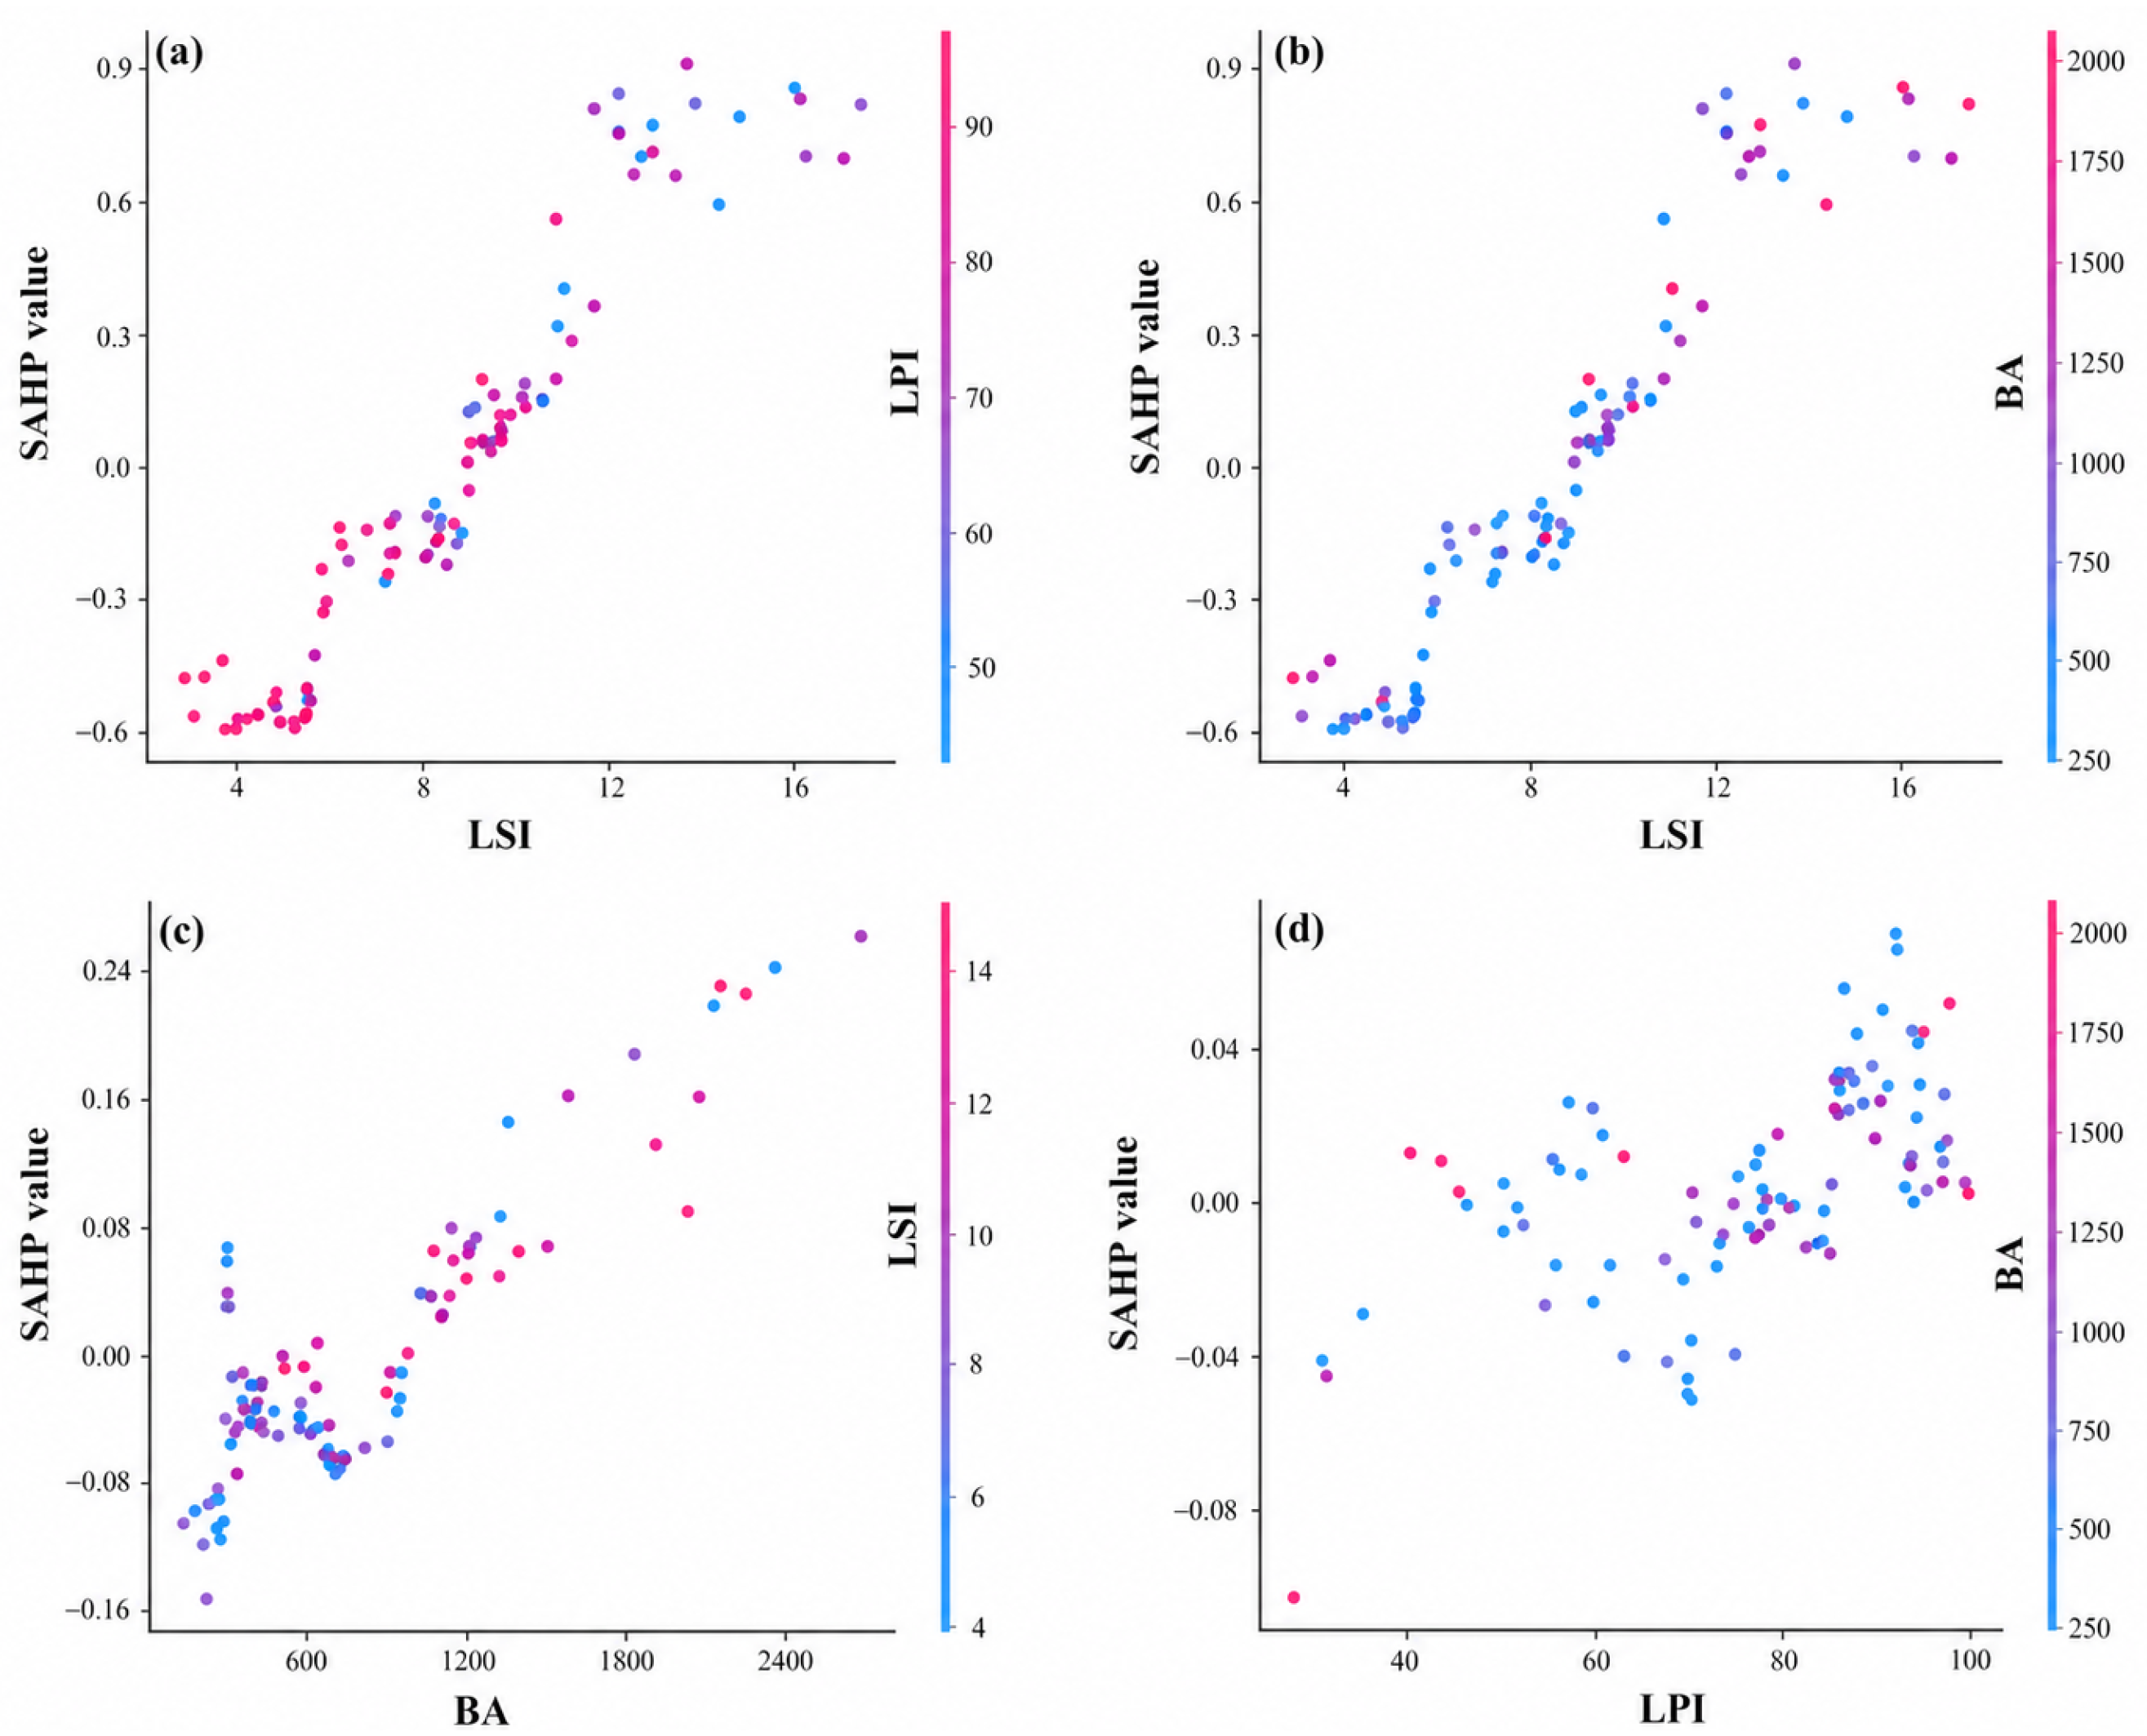
To further examine interaction patterns among key urban morphology indicators, three variable pairs were analyzed, namely LSI–BA, LSI–LPI, and LPI–BA, as shown in Figure 7. The results indicate that the effect of LSI on drone logistics network costs exhibits a clear piecewise pattern. At lower values, LSI is associated with negative or suppressive contributions to cost, and this negative contribution gradually attenuates toward zero as LSI increases. When LSI exceeds approximately 10, its contribution turns markedly positive and costs increase accordingly. Comparisons across cities of different scales further show that this positive effect is more pronounced in cities with larger BA, whereas it is relatively moderate in smaller cities, suggesting a stable synergistic relationship between LSI and BA. Consistently, from the perspective of BA, larger built-up areas are associated with higher costs, and this positive contribution is further amplified when LSI is high. By contrast, interactions involving LPI do not display stable or distinct patterns, implying a limited moderating role. Overall, the most robust and consistent interaction identified in this study occurs between LSI and BA, while LPI behaves more as a weak moderator.
Figure 7.
SHAP interaction dependence plots for key urban morphology indicators. (a) Dependence of SHAP values on LSI, with point colors representing LPI. (b) Dependence of SHAP values on LSI, with point colors representing BA. (c) Dependence of SHAP values on BA, with point colors representing LSI. (d) Dependence of SHAP values on LPI, with point colors representing BA.
3.3. K-Means Clustering of Three Urban Morphology Types
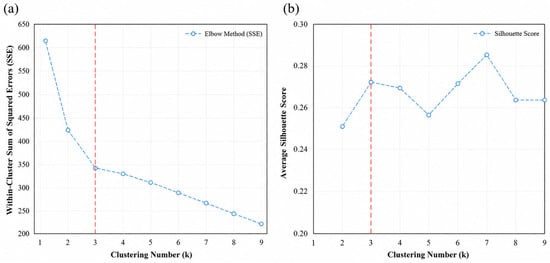
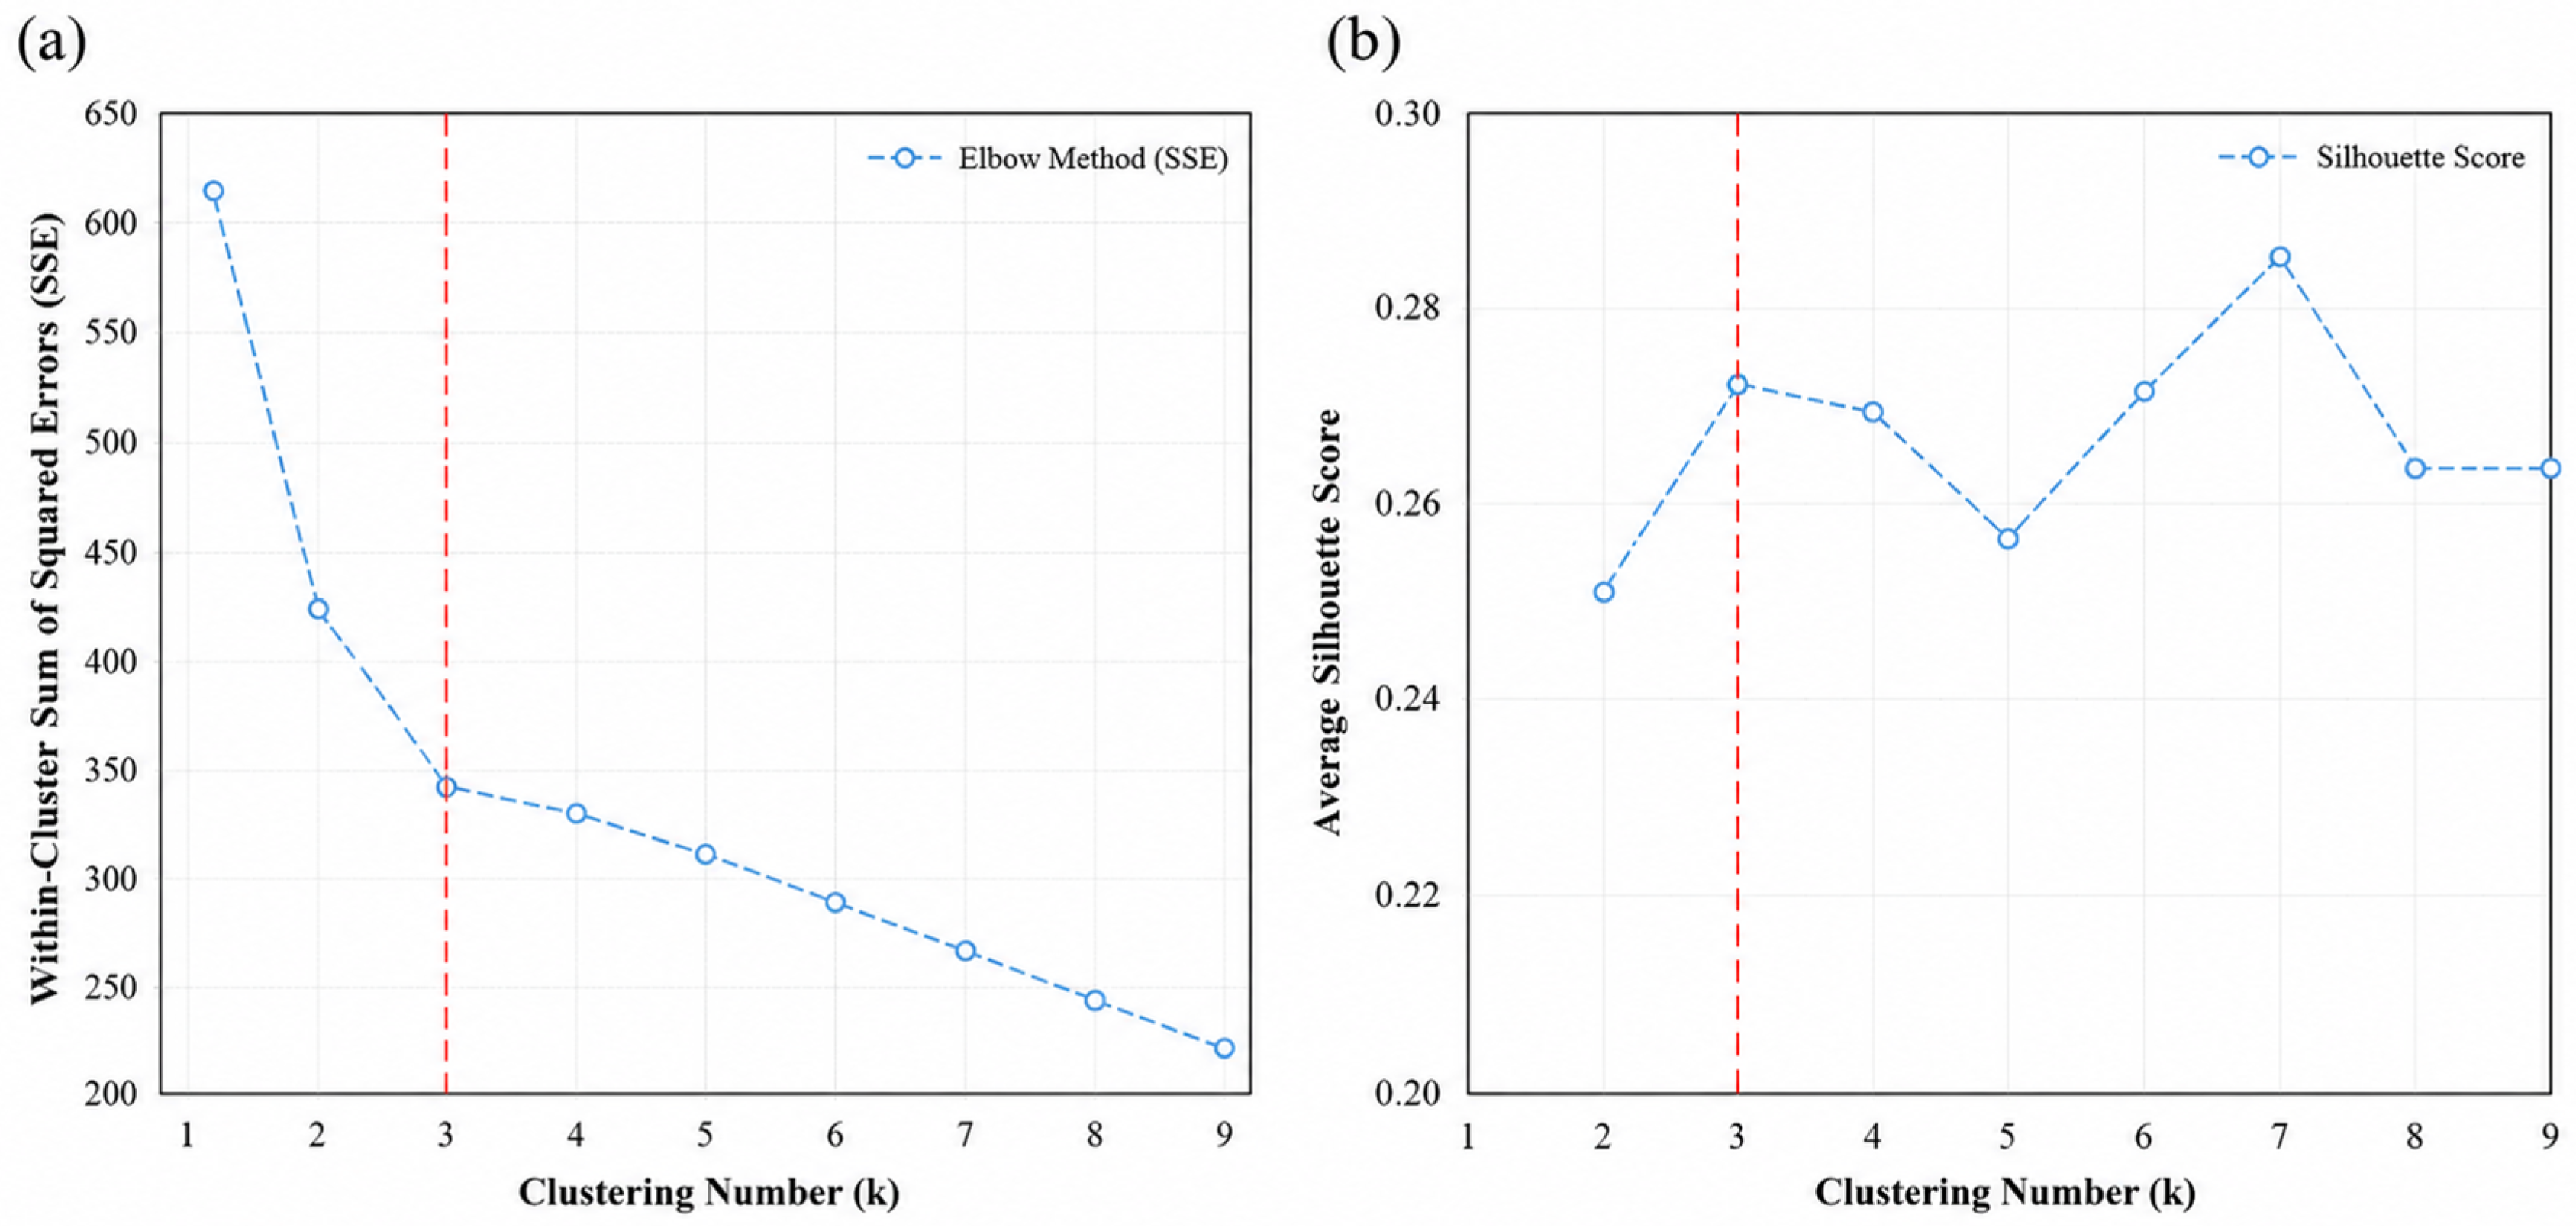
To comprehensively characterize overall differences among cities in terms of urban morphology and drone logistics network costs, this study applies K-means clustering to the sample cities using the selected core morphology indicators together with unit facility costs as clustering inputs. All variables are standardized prior to clustering to ensure comparability. To determine an appropriate number of clusters, the elbow method and silhouette analysis are used in combination. Specifically, K-means is conducted for a range of candidate values of k, and the corresponding within-cluster sums of squared errors (SSE) and average silhouette coefficients are calculated. As shown in Figure 8, the SSE decreases substantially as the number of clusters increases from one to three, whereas the rate of decline becomes noticeably smaller when k exceeds three, indicating a clear elbow point near k = 3. Meanwhile, the average silhouette coefficient at k = 3 is higher than those obtained for k = 2 and k = 4, suggesting a favorable balance between within-cluster compactness and between-cluster separation. Considering these statistical criteria together with the interpretability of the resulting typology, k = 3 is selected as the final clustering solution. Accordingly, the sample cities are classified into three distinct morphology–cost types, providing a basis for subsequent characterization of cluster features and the derivation of typology-oriented planning implications.
Figure 8.
Elbow method and silhouette analysis for selecting the optimal number of clusters (k = 3). (a) Elbow plot showing the within-cluster sum of squared errors (SSE) for different numbers of clusters. (b) Silhouette analysis showing the average silhouette score for different numbers of clusters.
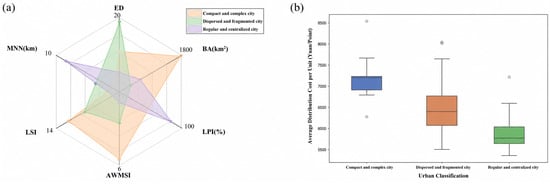
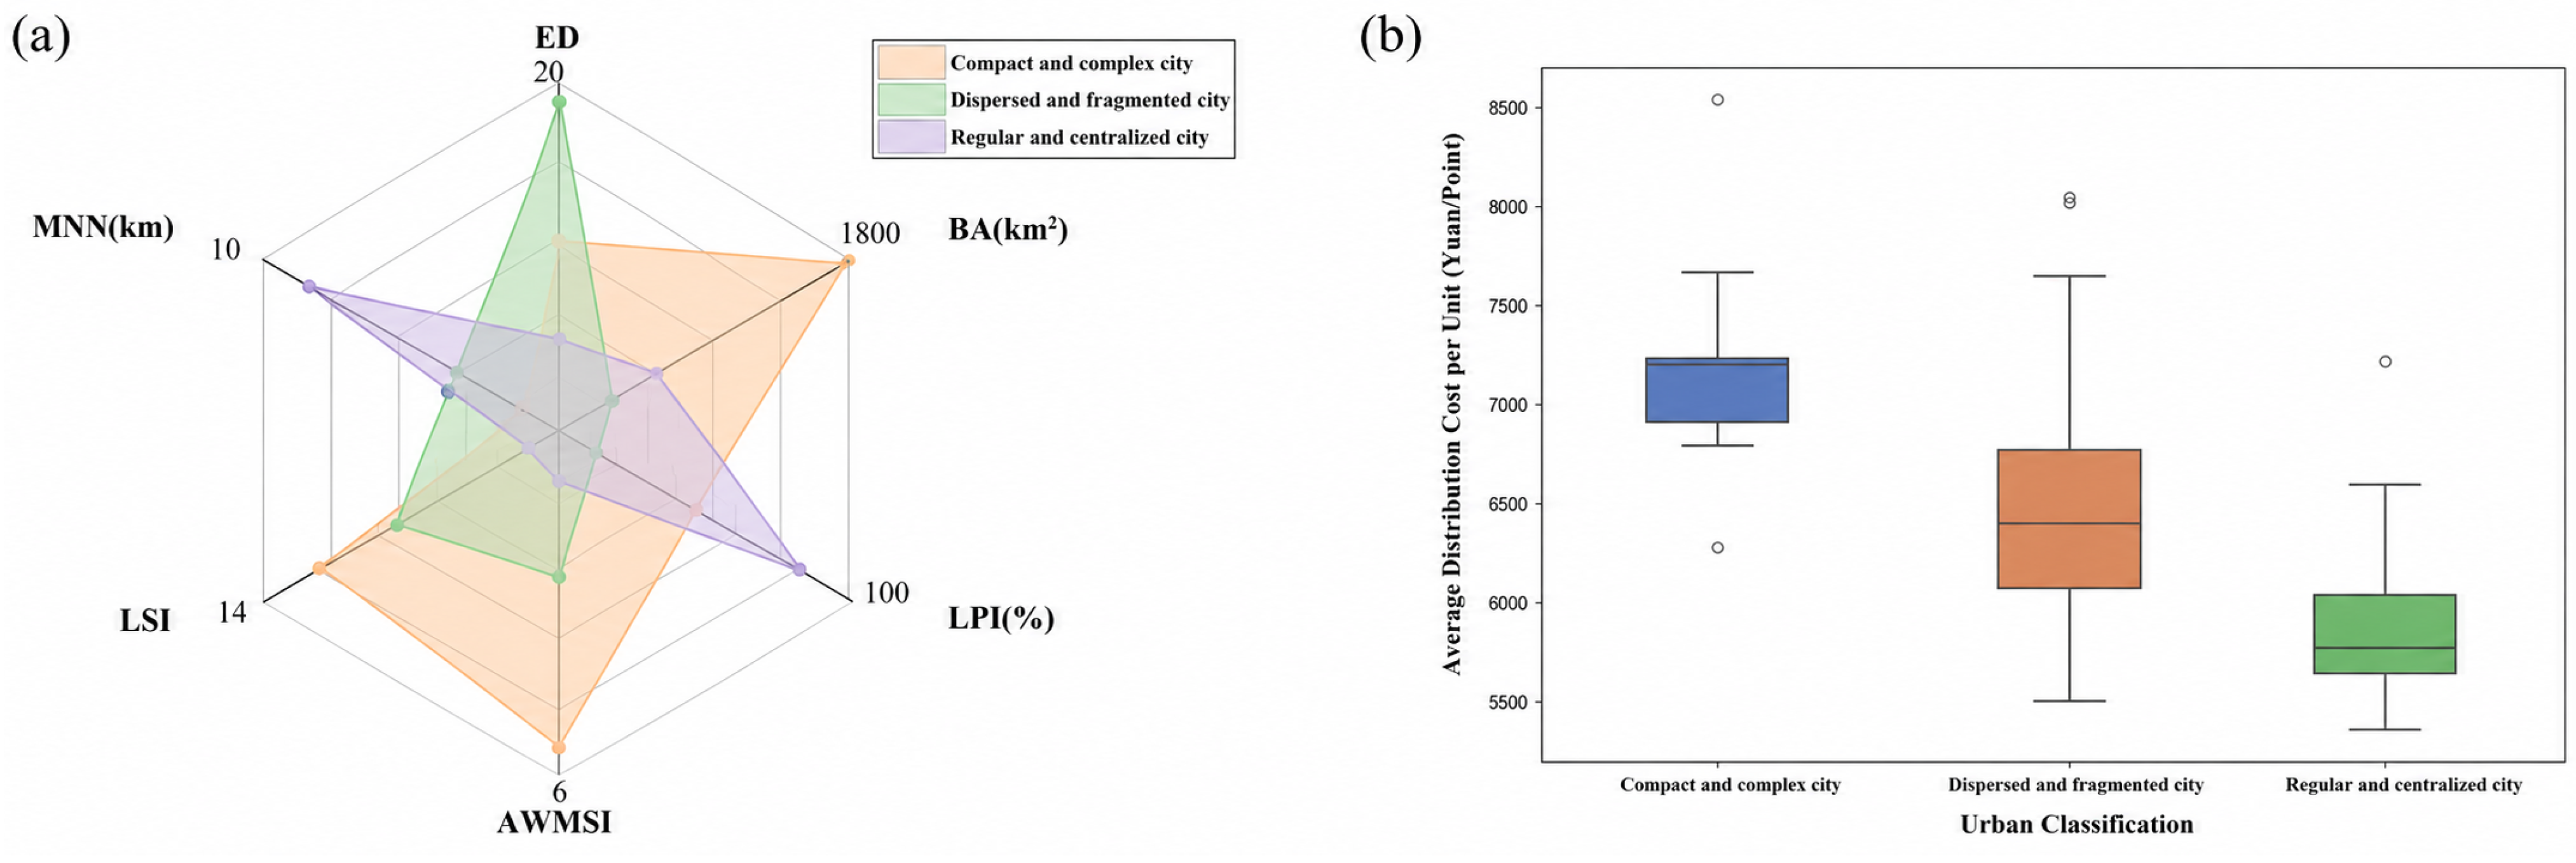
The clustering results indicate that the three groups of cities exhibit pronounced differentiation in terms of built-up area scale, morphological complexity, and drone logistics network cost levels, as illustrated in Figure 9 and summarized in Table 8. Cluster 0 is defined as the compact and complex city type, featuring the largest built-up area and the highest level of morphological complexity, and corresponding to the highest unit network costs. Cluster 1 is identified as the dispersed and fragmented city type, characterized by relatively fragmented and spatially dispersed built-up patterns, with network costs generally at an intermediate level but with substantial internal heterogeneity. Cluster 2 is classified as the compact and regular city type, distinguished by highly concentrated built-up areas and relatively regular spatial forms, and associated with the lowest unit network costs among the three clusters.
Figure 9.
Network costs and urban morphology indicator radar plots for different city types. (a) Radar plots of six urban morphology indicators for the three city types. (b) Boxplots of average distribution cost per unit for the three city types.
Table 8.
Characteristics of urban morphology types identified by K-means clustering.
3.3.1. Compact and Complex City Type
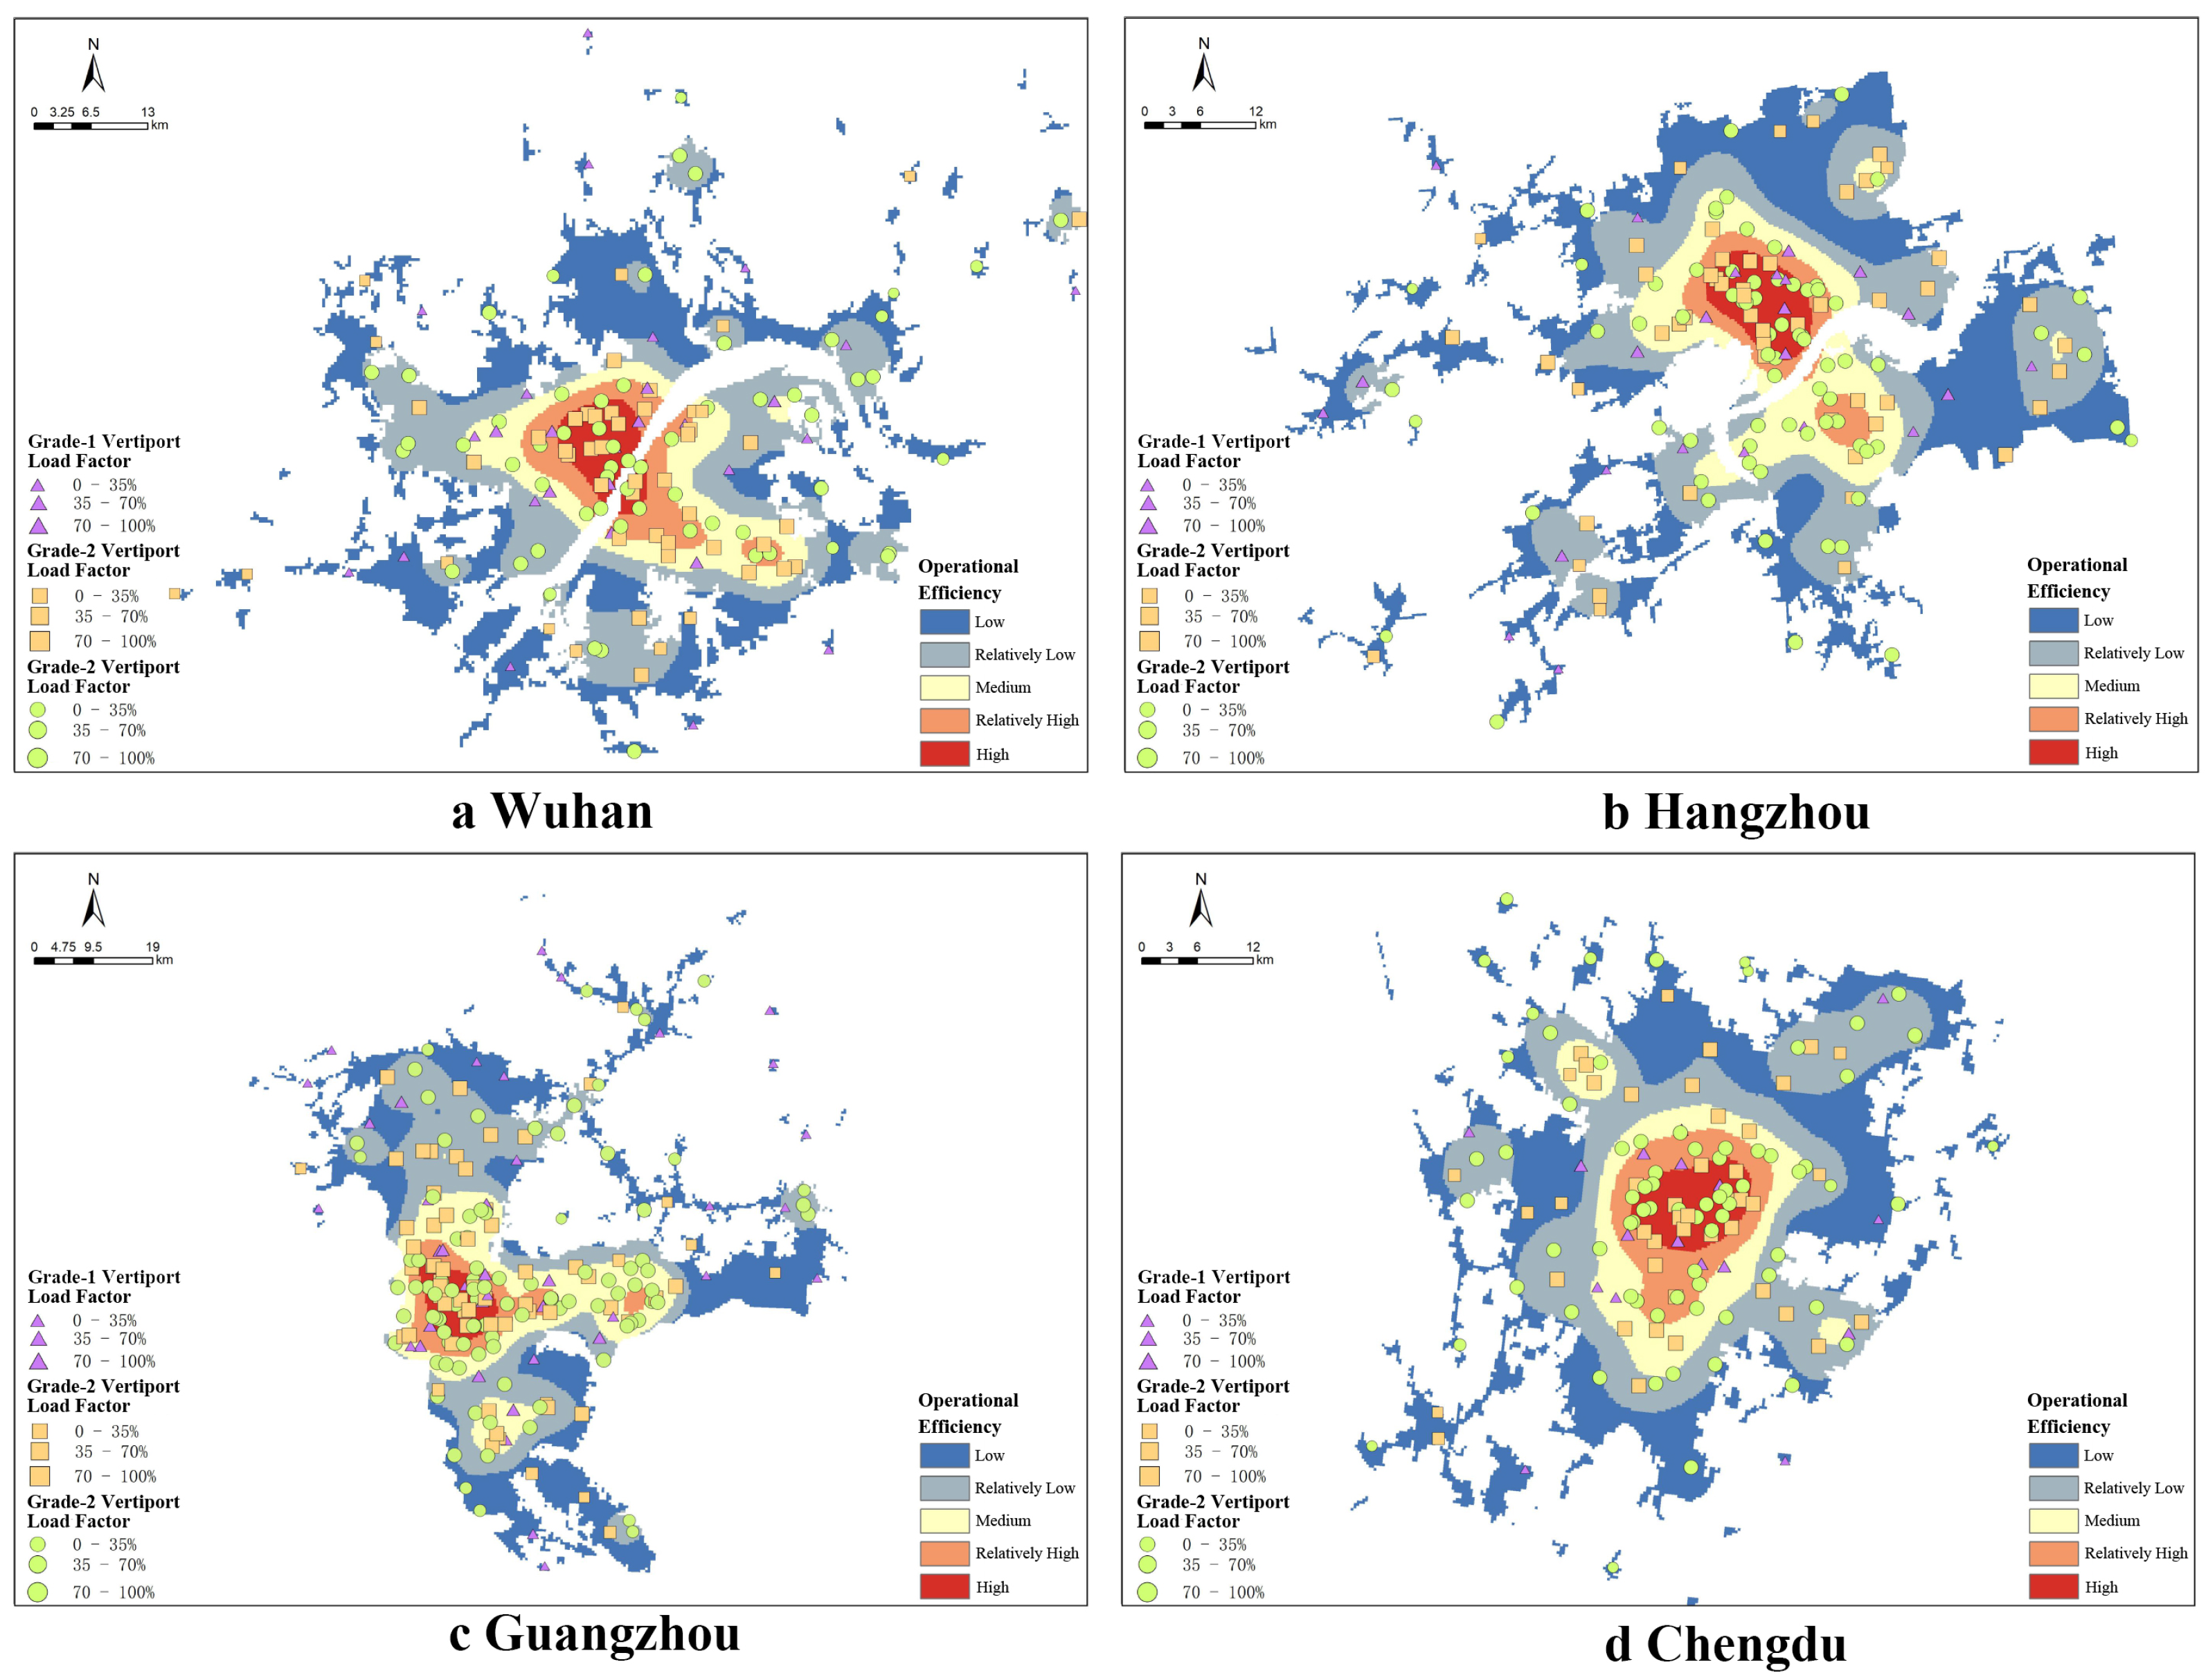
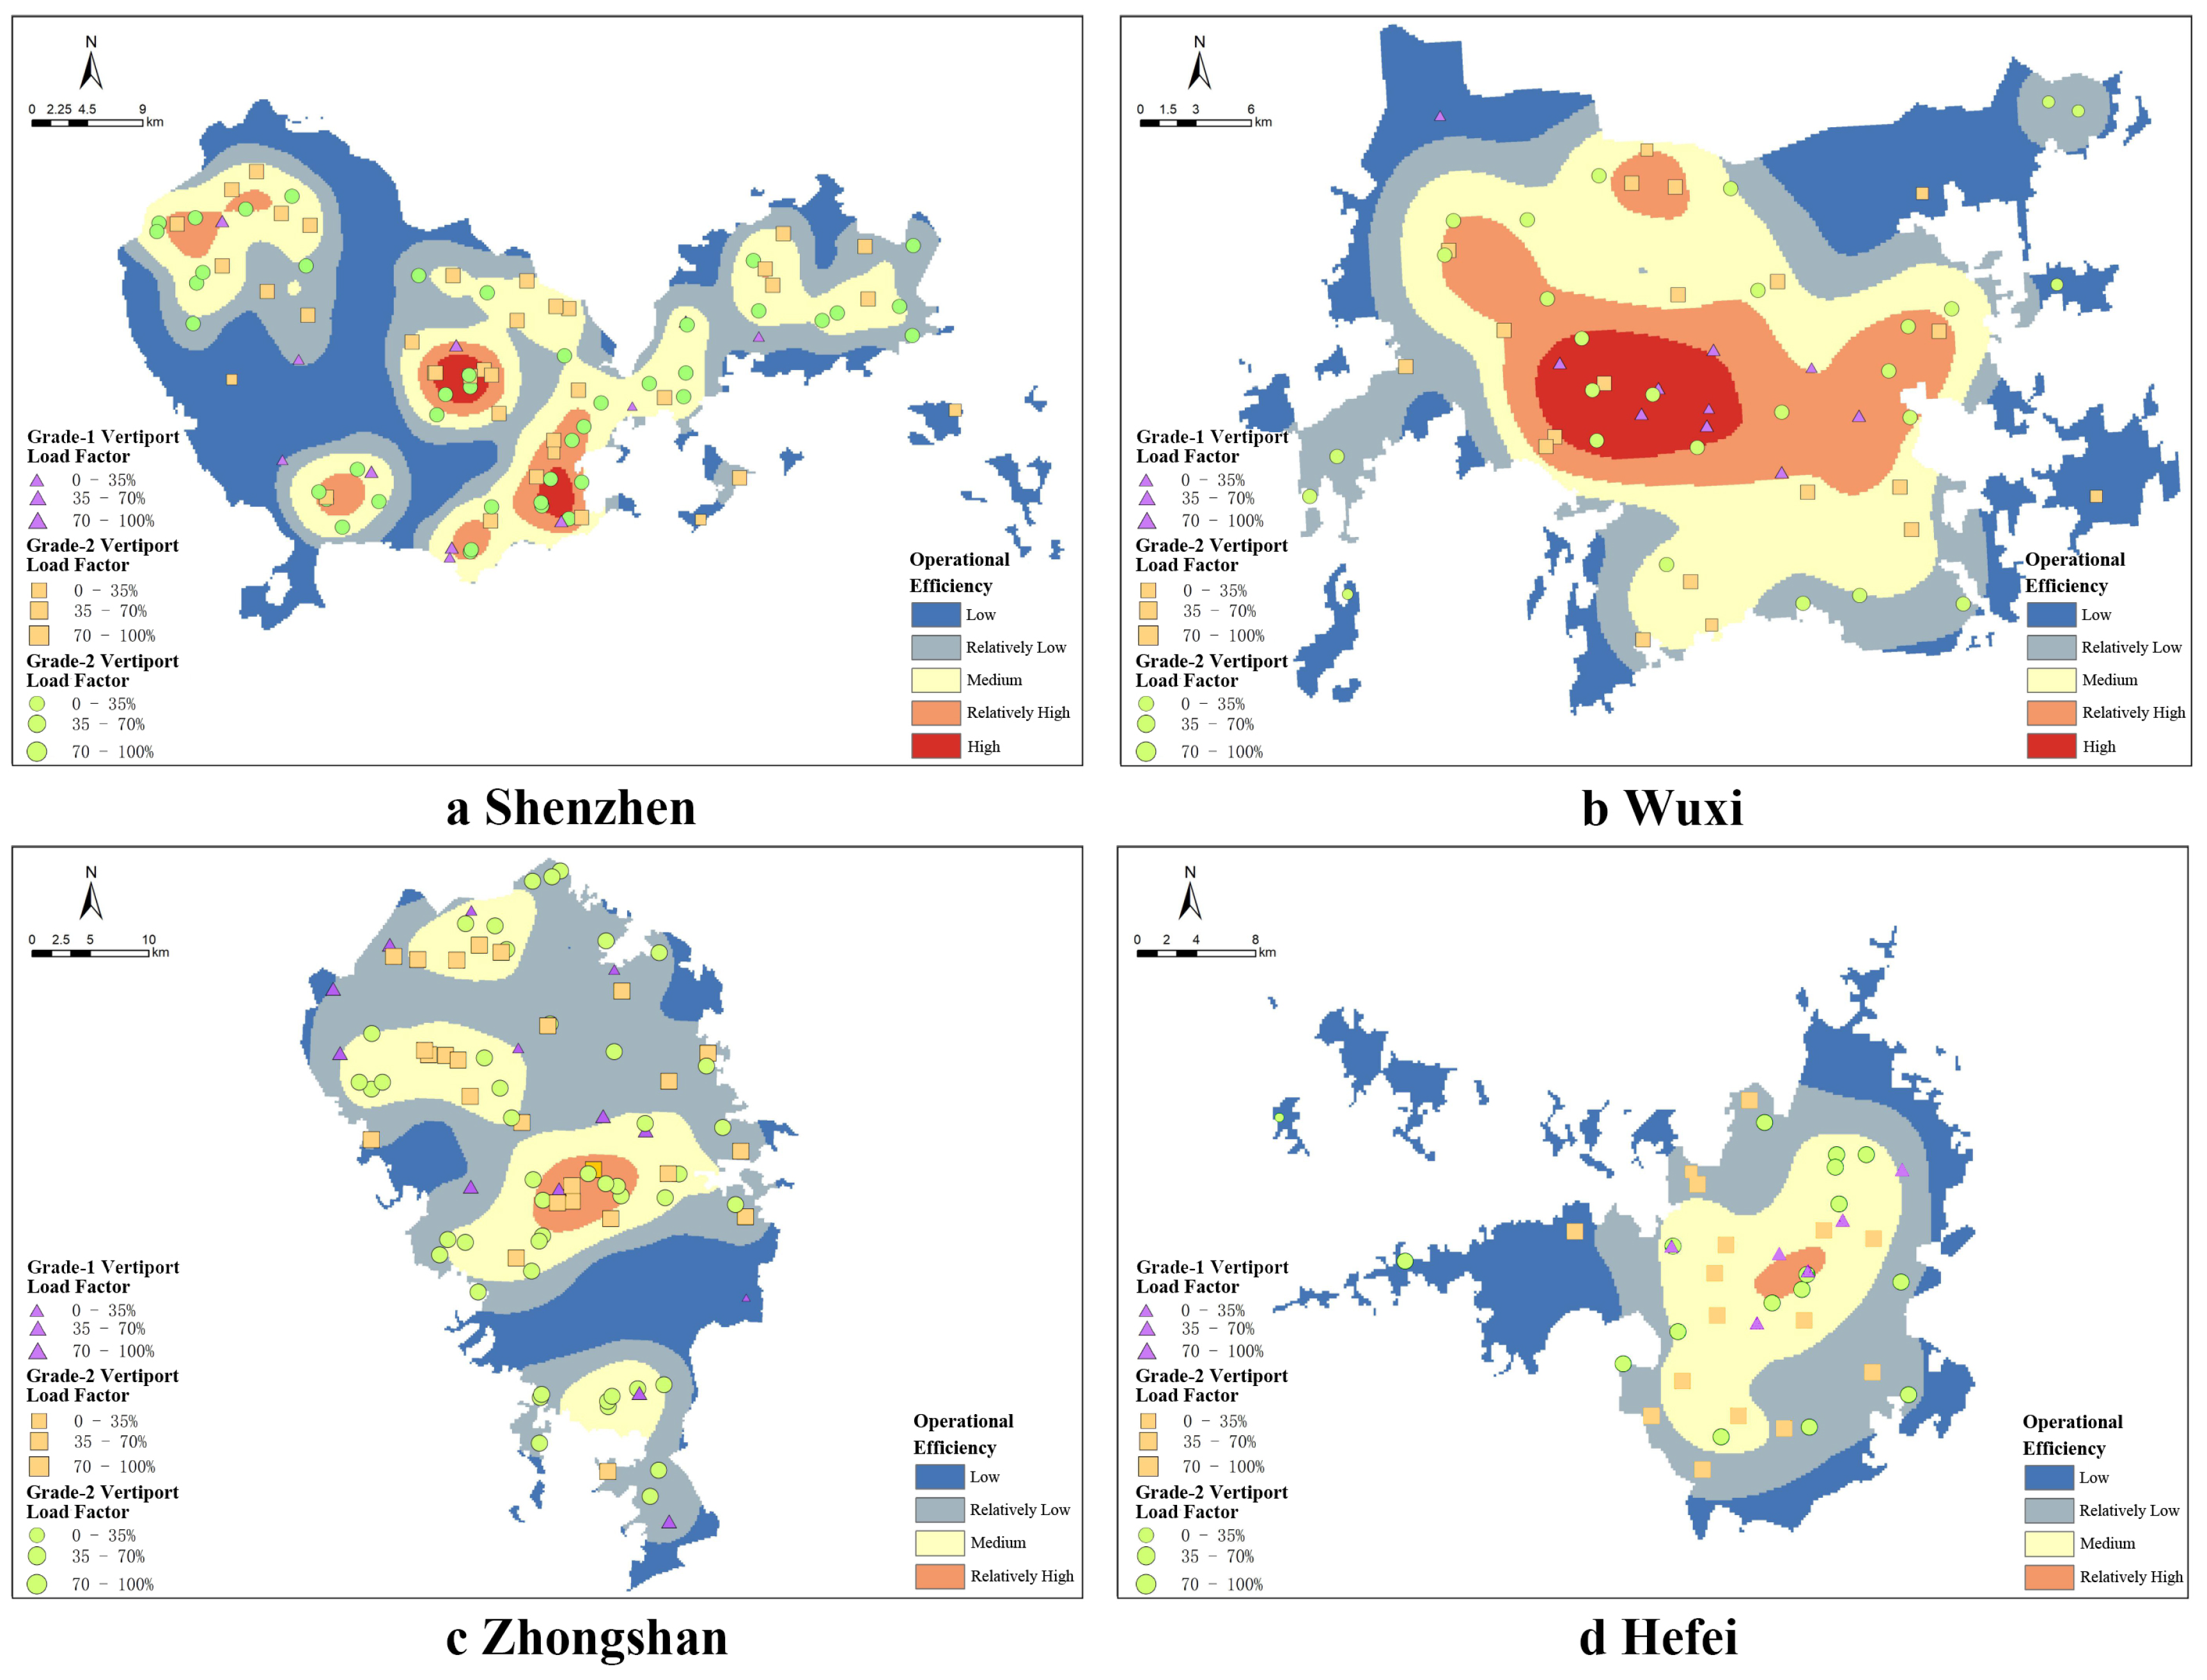
Cities classified as the compact and complex type exhibit a combination of large built-up scale, relatively close inter-patch spacing, and high morphological complexity. As shown in Table 8, this group has the largest average BA (1659.48 km2), the highest mean LSI (11.76), the highest AWMSI (5.65), and the lowest MNN (4.65 km). These characteristics indicate that this type is not simply spatially dispersed but rather consists of large and relatively contiguous built-up areas with complex boundaries and irregular shapes. Under the adopted simulation setting, the combination of large urban extent and high boundary complexity may increase coverage requirements and facility deployment intensity, especially in peripheral or irregularly shaped areas. As illustrated in Figure 10, such morphology may require additional facilities to maintain service coverage, thereby contributing to higher simulated construction and operating costs.
Figure 10.
Spatial distribution of take–off and landing facility network efficiency for representative compact and complex cities.
3.3.2. Dispersed and Fragmented City Type
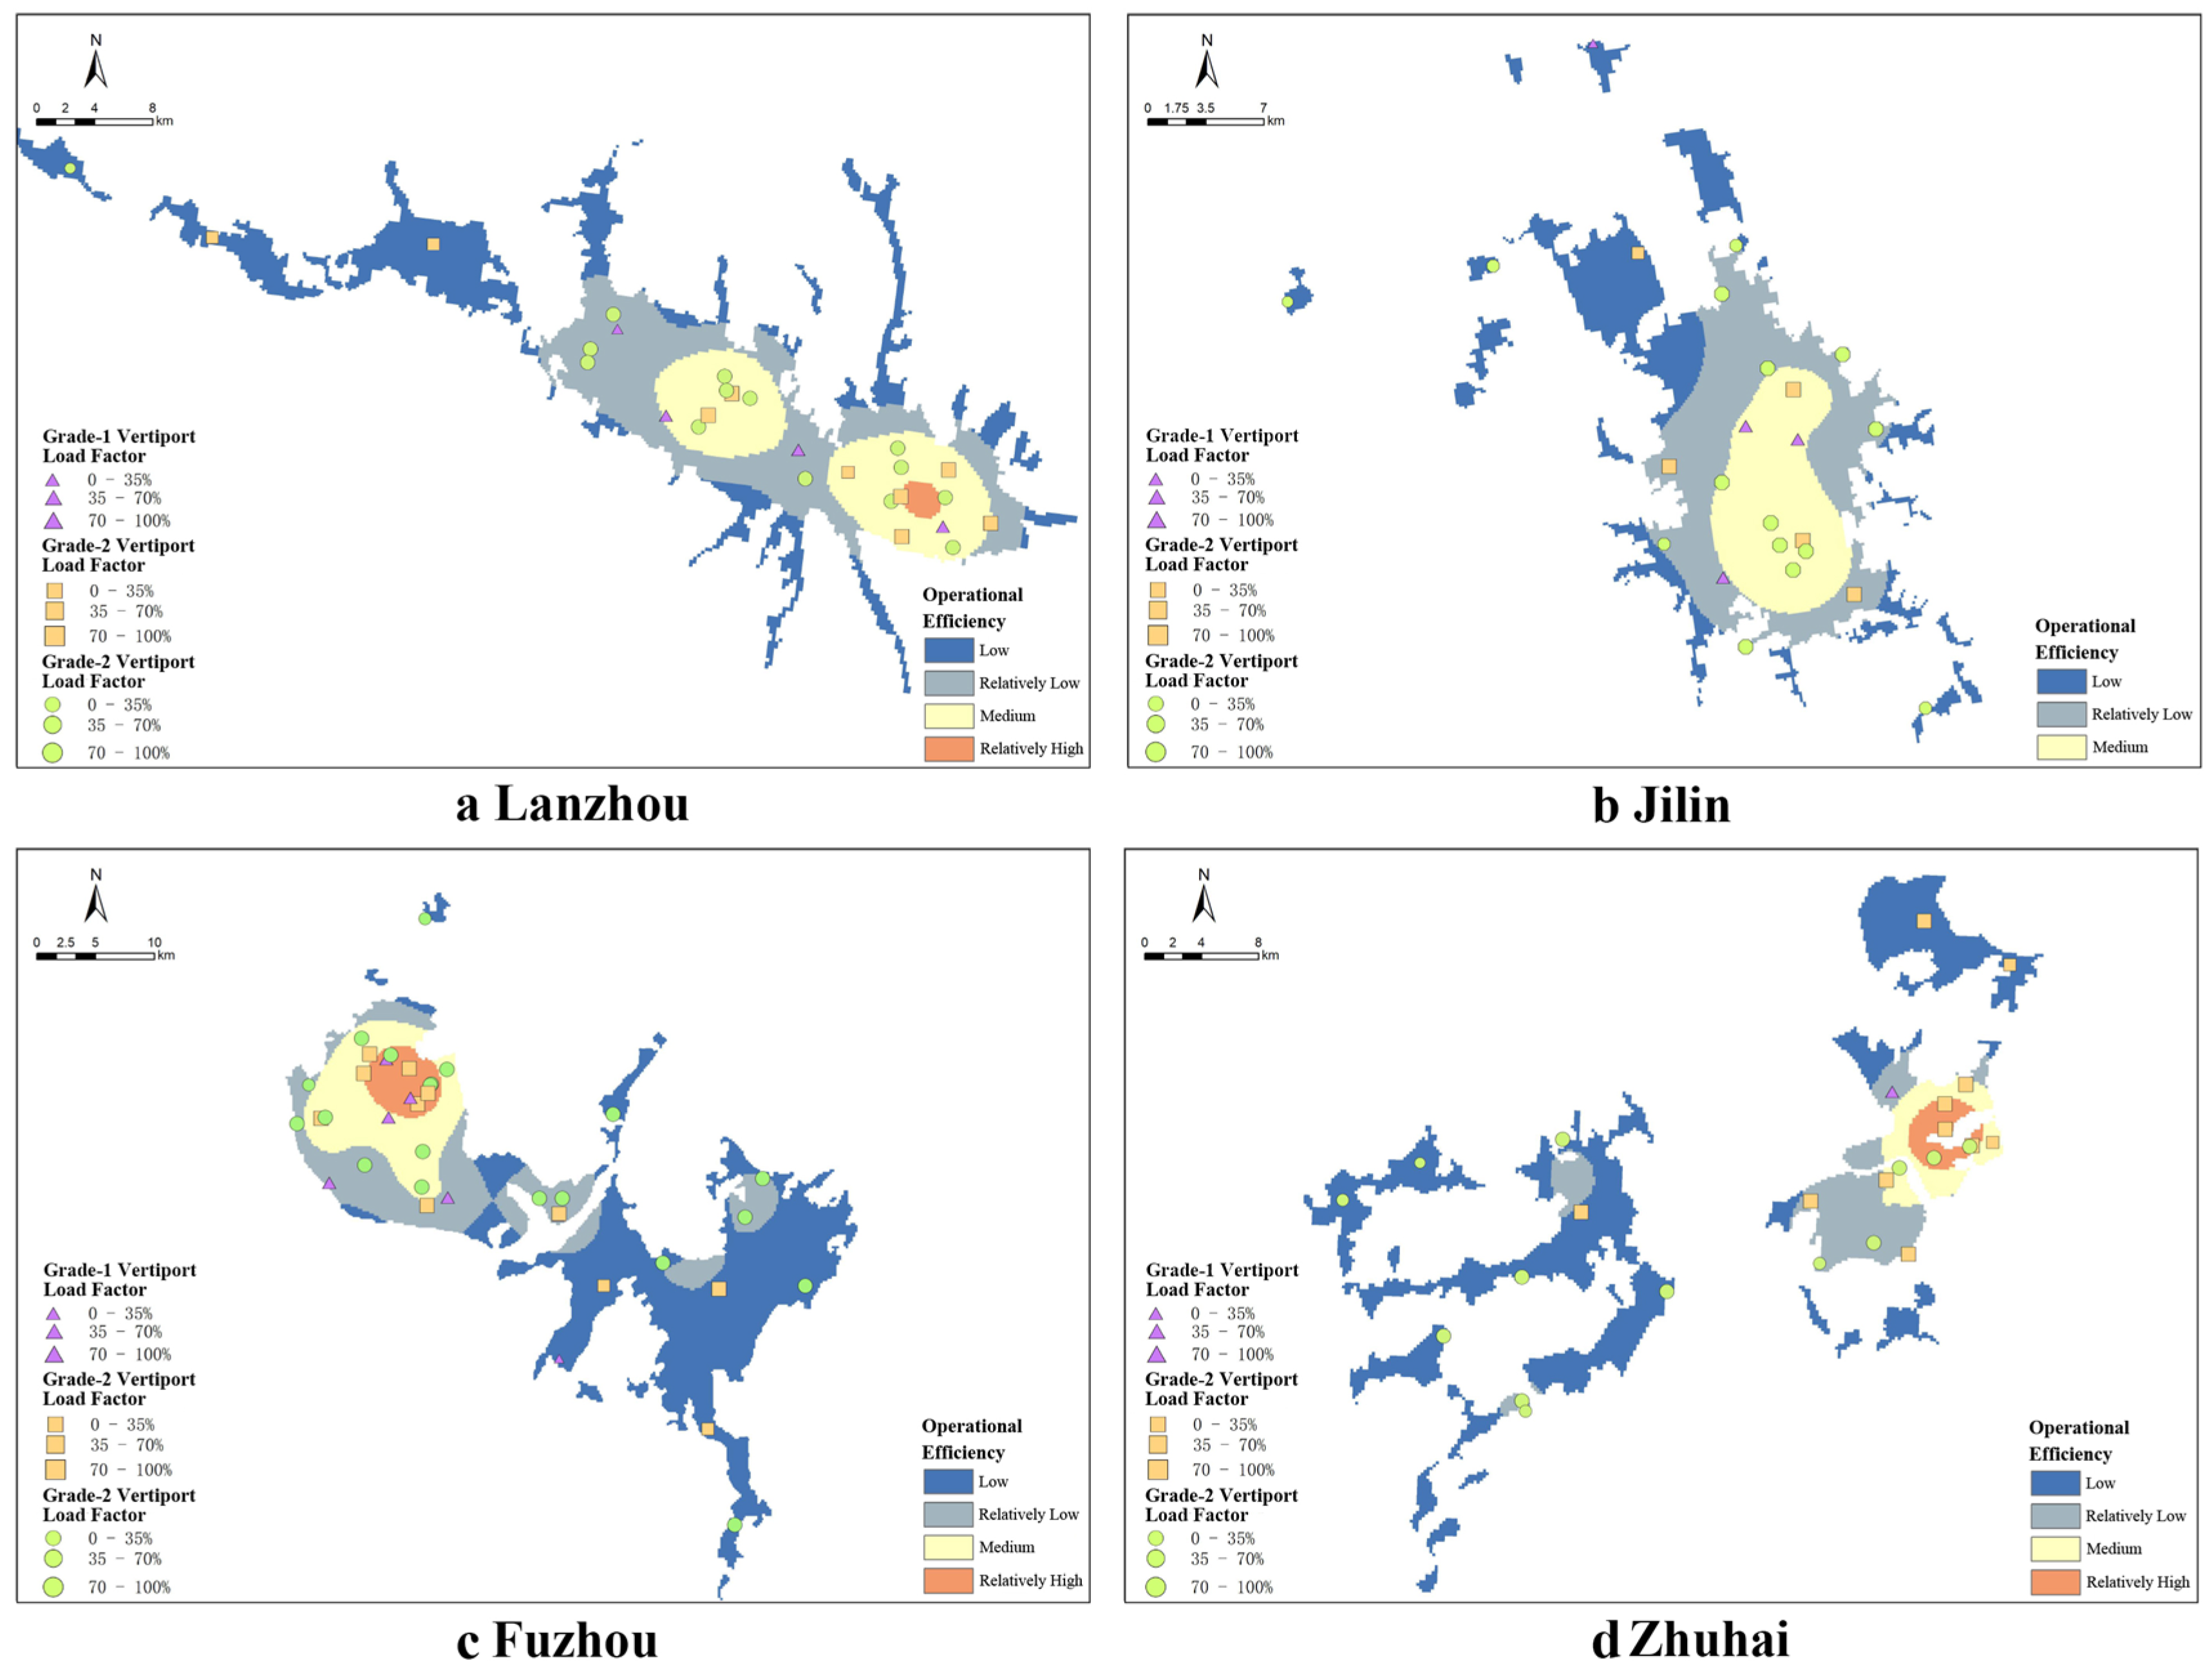
Cities classified as the dispersed and fragmented type are characterized by relatively small-to-moderate built-up scale, high edge fragmentation, and intermediate morphological complexity, as summarized in Table 8. This group has the highest ED value (18.69), the lowest LPI value (64.52%), and a relatively high LSI value (9.37), indicating that its built-up areas are more fragmented and less dominated by a single continuous patch. However, its mean MNN value is 6.04 km, which is higher than that of the compact and complex type but lower than that of the compact and regular type. Therefore, the dispersed and fragmented character of this group is mainly reflected in high edge density, lower spatial concentration, and relatively complex built-up boundaries, rather than in the largest inter-patch distance. Under the adopted simulation setting, such spatial fragmentation may increase the need for cross-patch coverage and localized facility allocation. Nevertheless, the relatively independent distribution of built-up clusters also allows drone logistics networks to adopt a zone-based coverage strategy, as illustrated in Figure 11. This localized organization may help reduce excessive concentration around a single core area. As a result, the simulated drone logistics network cost level of this city type generally lies between those of the compact and complex type and the compact and regular type.
Figure 11.
Spatial distribution of take–off and landing facility network efficiency for representative dispersed and fragmented cities.
3.3.3. Compact and Regular City Type
Cities in this category exhibit a spatial pattern characterized by moderate scale, high concentration, and regular morphology (Table 8). This type is distinguished by an exceptionally high LPI (mean = 90.75%) and the lowest LSI among all clusters (mean = 4.98), indicating a highly concentrated and geometrically regular urban form. Such spatial characteristics provide favorable operating conditions for drone logistics networks, as most delivery demands can be served within relatively short flight distances. Consequently, take-off and landing facilities can be organized into a compact and hierarchical network configuration (Figure 12). The median unit facility cost for this city type is 5738 CNY per site, substantially lower than that of the other clusters and approximately 14.1% lower than that of the compact and complex city type (Figure 9), highlighting the cost advantages associated with compact and regular urban morphology.
Figure 12.
Spatial distribution of take–off and landing facility network efficiency for representative compact and regular cities.
Overall, the cost efficiency of drone logistics networks exhibits a clear stratification across different urban morphology types. Cities with compact and regular spatial structures tend to reduce delivery path lengths and coverage redundancy, thereby enhancing system efficiency. In contrast, cities with more complex or fragmented spatial patterns generally face higher overall costs due to increased difficulties in route organization and resource coordination. These findings indicate that urban morphology not only shapes the organization of built-up areas but also constrains the economic performance of drone logistics systems by influencing network layout and operational mechanisms, underscoring its importance in drone logistics network planning and facility location optimization.
4. Discussion
4.1. Mechanism: Synergistic Amplification and Nonlinear Threshold Effects
From an urban spatial-structure perspective, this study provides a simulation-based explanation of how urban morphology may influence the configuration and cost characteristics of drone logistics networks under a unified set of operational assumptions. Unlike much of the existing drone logistics literature, which focuses primarily on facility location and dispatch optimization while representing cities as simplified demand points and candidate sites, this study explicitly incorporates city-scale morphological structure into a comparative modeling framework. The results suggest that cross-city differences in the simulated unit cost of drone logistics networks are associated not only with operational parameter settings, but also with morphology-related differences in coverage efficiency, facility hierarchy, and facility utilization. In particular, the analysis identifies a pronounced interaction between landscape shape index (LSI) and built-up area (BA). Under the assumptions adopted in this study, cities characterized by both large spatial extent and high boundary irregularity tend to exhibit higher simulated network costs. This pattern is broadly consistent with previous studies showing that urban sprawl and fragmentation are associated with increased transportation and infrastructure costs [35,39]. Within the present simulation framework, this relationship appears to operate through lower geometric coverage efficiency and a greater number of peripheral facilities required to satisfy service-radius and range constraints. Irregular built-up boundaries may reduce the efficiency of regular coverage patterns, leading the optimization model to allocate additional facilities in edge areas that serve relatively limited demand and exhibit lower average utilization, thereby increasing both fixed construction costs and modeled operating costs. The results also indicate that the influence of LSI is distinctly nonlinear, with stronger marginal effects observed when LSI is approximately between 5 and 15. Within the sample, this interval corresponds to a transition from relatively regular urban forms to more complex and fragmented spatial structures. Under the modeling assumptions, incremental increases in boundary complexity within this range are associated with disproportionately larger increases in simulated network cost. This finding is consistent with prior research suggesting that morphological transitions may coincide with nonlinear changes in infrastructure performance. Overall, the results suggest that the relationship between urban morphology and the simulated cost of drone logistics networks is nonlinear and context-dependent, and that linear models alone may not fully capture these patterns.
4.2. Spatial Adaptation: Layout Paradigms and Planning Strategies Under Typological Differences
The three morphology–cost types identified by clustering suggest that, within the simulation framework of this study, there is no universally optimal configuration of drone logistics networks across cities; instead, network organization may need to be adapted to the endogenous characteristics of urban morphology. This typology-based diagnosis–differentiated strategy logic is consistent with typological planning approaches commonly adopted in urban studies and provides a more operational decision framework for low-altitude logistics infrastructure planning [40]. For the compact and regular city type, highly concentrated built-up areas with relatively regular boundaries imply lower coverage redundancy and a more tractable hierarchical organization of facilities, resulting in substantially lower unit costs. This finding aligns with prior evidence that compact development or regular spatial form can improve transport or facility efficiency [41]. It also extends these insights to the drone logistics context, highlighting that the advantage primarily stems from more stable service-radius organization and reduced need for redundant peripheral facilities. For the compact and complex city type, the combination of large scale and high complexity is more likely to trigger synergistic amplification effects; optimizing internal network efficiency alone is often insufficient to offset the fixed-cost increases imposed by morphological constraints. Accordingly, planning priorities should not be limited to densifying nodes or fine-tuning facility placement within the drone network. Instead, a multimodal delivery system that integrates ground logistics with drones should be introduced, leveraging functional division to mitigate redundancy and low utilization under highly complex morphologies. This strategy is consistent with research on truck–drone cooperation and multimodal last-mile systems for improving overall efficiency and economic performance [42,43]. For logistics enterprises, this also suggests that such cities may be less suitable for immediate citywide rollout and more suitable for phased deployment focused on priority service zones and high-demand corridors [44]. For the dispersed and fragmented city type, where built-up areas exhibit clustered and polycentric structures, a “cluster-based, polycentric” layout paradigm is more suitable. By organizing several relatively independent subnetworks, local coverage efficiency can be improved and overall cost growth can be kept manageable. This interpretation is logically consistent with theories in transport geography suggesting that spatial fragmentation increases route-organization complexity and system redundancy. For logistics enterprises, this further implies that scenario-based deployment around relatively independent demand clusters may be more realistic than uniform citywide expansion. It also indicates that without morphology-informed spatial adaptation at the macro level, relying solely on micro-level algorithmic optimization may be insufficient to fully offset systematic cost disadvantages rooted in spatial structure.
4.3. Theoretical Implications and Study Limitations
From a theoretical perspective, this study complements drone logistics research that has largely focused on micro-level dispatch and routing optimization by emphasizing the role of city-scale two-dimensional morphology in shaping simulated cost differences. Conceptually, the findings extend transportation geography and facility-location discussions by formalizing two related ideas: morphology-driven facility redundancy and threshold-like cost response. The first refers to the additional facilities required when irregular or fragmented built-up patterns reduce the effective use of service radii; the second refers to the tendency for cost responses to intensify once spatial scale or boundary complexity enters specific sensitivity ranges under given operational assumptions. In this sense, the study provides a mechanism-oriented simulation framework for considering urban form in low-altitude logistics planning.
This study also has several limitations. First, the analysis is primarily based on two-dimensional planar morphology indicators and therefore does not fully capture vertical urban form, building-height variation, low-altitude obstacle density, or the energy costs associated with climbing, descending, and detouring around high-rise structures. Second, the facility-location model assumes straight-line point-to-point drone movement and does not explicitly incorporate no-fly zones, regulated corridors, weather disruptions, congestion in low-altitude airspace, queuing, or operational delays. Relaxing these assumptions would likely increase route length, energy consumption, and infrastructure requirements, especially in dense or highly regulated urban areas. Third, the study uses unified drone parameters, service radii, facility capacities, and cost coefficients across all 101 cities to ensure comparability; consequently, the results are most suitable for relative cross-city comparison rather than precise prediction of city-specific operating costs. Fourth, population density is used as the main demand proxy and does not fully reflect employment density, commercial activity, income structure, land-use mix, e-commerce intensity, or temporal demand variation. Future research should incorporate three-dimensional morphology, calibrated operational data, richer demand proxies, no-fly-zone and corridor constraints, and scenario-based sensitivity tests to improve real-world applicability.
5. Conclusions
This study investigates 101 major Chinese cities and conducts scenario-based simulations of cost-minimizing take-off and landing facility networks under unified technical parameters and operational constraints. The sample was selected from China’s national large-city system because these cities represent the principal settings in which low-altitude logistics infrastructure is likely to face substantial demand, spatial coverage pressure, and planning complexity. By comparing these cities under consistent assumptions, the study identifies morphology-sensitive patterns in simulated drone logistics network costs and provides a relative comparative basis for planning discussion.
The main findings are as follows. First, urban morphology significantly differentiates simulated drone logistics network costs across cities. LSI and BA provide the strongest explanatory power, indicating that boundary complexity and built-up scale are the two most important morphology factors under the adopted model setting. Second, morphology effects are nonlinear. Costs rise especially rapidly when BA exceeds about 1000 km2 and when LSI lies within the sensitive range of about 5–15, while the interaction between BA and LSI further amplifies cost pressure in large and irregular cities. These values should be interpreted as threshold-like sensitivity ranges within the simulation, not as universal operational thresholds. Third, the clustering results identify three representative morphology-cost types: compact and complex, dispersed and fragmented, and compact and regular. These types differ in facility deployment logic and cost levels, suggesting that low-altitude logistics infrastructure planning should consider city-type characteristics rather than applying a uniform layout template. The study also has limitations. It mainly uses two-dimensional morphology indicators, population density as a simplified demand proxy, straight-line flight assumptions, and unified operational parameters; therefore, the results should be interpreted as relative comparative indicators rather than direct forecasts of actual operating costs. Future research should incorporate three-dimensional urban morphology, calibrated demand and operational data, explicit airspace constraints, and richer sensitivity analyses to improve applicability for city-level implementation.
Author Contributions
Conceptualization, Weiwu Wang; Data curation, Weiwu Wang; Formal analysis, Zhaoyang Teng and Jie He; Funding acquisition, Weiwu Wang; Investigation, Zihao Guo; Methodology, Weiwu Wang and Zhaoyang Teng; Project administration, Weiwu Wang; Resources, Weiwu Wang; Software, Zhaoyang Teng and Zihao Guo; Supervision, Weiwu Wang; Validation, Zhaoyang Teng and Jie He; Visualization, Zhaoyang Teng; Writing—original draft, Weiwu Wang and Zhaoyang Teng; Writing—review & editing, Weiwu Wang, Zhaoyang Teng, Zihao Guo and Jie He. All authors have read and agreed to the published version of the manuscript.
Funding
This research was funded by the National Natural Science Foundation of China (Grant No. 51578482).
Data Availability Statement
The original contributions presented in this study are included in the article. Further inquiries can be directed to the corresponding author.
Conflicts of Interest
The authors declare no conflicts of interest.
References
- Peng, X.; Zhang, L.; Thompson, R.G.; Wang, K. A Three-Phase Heuristic for Last-Mile Delivery with Spatial-Temporal Consolidation and Delivery Options. Int. J. Prod. Econ. 2023, 266, 109044. [Google Scholar] [CrossRef] [Scilit]
- Xiao, Q.; Gao, J. Resilient Last-Mile Logistics in Smart Cities through Multi-Visit and Time-Dependent Drone–Truck Collaboration. Drones 2025, 9, 782. [Google Scholar] [CrossRef] [Scilit]
- United Nations Department of Economic and Social Affairs. World Urbanization Prospects: The 2018 Revision; UN: New York, NY, USA, 2019. [Google Scholar]
- Zhou, Y. Unmanned Aerial Vehicles Based Low-Altitude Economy with Lifecycle Techno-Economic-Environmental Analysis for Sustainable and Smart Cities. J. Clean. Prod. 2025, 499, 145050. [Google Scholar] [CrossRef] [Scilit]
- Garg, V.; Niranjan, S.; Prybutok, V.; Pohlen, T.; Gligor, D. Drones in Last-Mile Delivery: A Systematic Review on Efficiency, Accessibility, and Sustainability. Transp. Res. Part D Transp. Environ. 2023, 123, 103831. [Google Scholar] [CrossRef] [Scilit]
- Dukkanci, O.; Campbell, J.F.; Kara, B.Y. Facility Location Decisions for Drone Delivery: A Literature Review. Eur. J. Oper. Res. 2024, 316, 397–418. [Google Scholar] [CrossRef] [Scilit]
- Woudsma, C.; Jakubicek, P.; Dablanc, L. Logistics Sprawl in North America: Methodological Issues and a Case Study in Toronto. Transp. Res. Procedia 2016, 12, 474–488. [Google Scholar] [CrossRef] [Scilit]
- Mahmoodi, A.; Hashemi, L.; Laliberte, J.; Sajadi, S.M. Optimizing Energy and CO2 Efficiency in Last-Mile Delivery Using Hybrid Fleet Models. Sustain. Futures 2025, 10, 101089. [Google Scholar] [CrossRef] [Scilit]
- Meng, W.; Zhang, X.; Zhou, L.; Guo, H.; Hu, X. Advances in UAV Path Planning: A Comprehensive Review of Methods, Challenges, and Future Directions. Drones 2025, 9, 376. [Google Scholar] [CrossRef] [Scilit]
- Wang, Y.; Yang, S.; Wang, X.V.; Wang, L. Research on Truck-Drone Collaborative Route Planning for Rural Logistics Delivery Services. Sci. Rep. 2024, 14, 31815. [Google Scholar] [CrossRef] [Scilit]
- Murray, C.C.; Chu, A.G. The Flying Sidekick Traveling Salesman Problem: Optimization of Drone-Assisted Parcel Delivery. Transp. Res. Part C Emerg. Technol. 2015, 54, 86–109. [Google Scholar] [CrossRef] [Scilit]
- Agatz, N.; Bouman, P.; Schmidt, M. Optimization Approaches for the Traveling Salesman Problem with Drone. Transp. Sci. 2018, 52, 965–981. [Google Scholar] [CrossRef] [Scilit]
- Izco, I.; Serrano-Hernandez, A.; Faulin, J. Topology Effects in Drone Parcel Delivery. In Proceedings of the 36th European Modeling & Simulation Symposium, Tenerife, Spain, 18–20 September 2024. [Google Scholar]
- He, H.; Ye, H.; Xu, C.; Liao, X. Exploring the Spatial Heterogeneity and Driving Factors of UAV Logistics Network: Case Study of Hangzhou, China. ISPRS Int. J. Geo-Inf. 2022, 11, 419. [Google Scholar] [CrossRef] [Scilit]
- Liu, Q.; Zhao, P.; Zhang, Y.; Zhang, Z.; Yang, J. Estimating the Non-Linear Effects of Urban Built Environment at Residence and Workplace on Carbon Dioxide Emissions from Commuting. Front. Public Health 2022, 10, 1077560. [Google Scholar] [CrossRef] [Scilit]
- Ewing, R.; Cervero, R. Travel and the Built Environment: A Meta-Analysis. J. Am. Plan. Assoc. 2010, 76, 265–294. [Google Scholar] [CrossRef] [Scilit]
- Berrill, P.; Nachtigall, F.; Javaid, A.; Milojevic-Dupont, N.; Wagner, F.; Creutzig, F. Comparing Urban Form Influences on Travel Distance, Car Ownership, and Mode Choice. Transp. Res. Part D Transp. Environ. 2024, 128, 104087. [Google Scholar] [CrossRef] [Scilit]
- Lee, S.; Cho, K.; Jeon, Y. Travel Efficiency in Urban Space: The Role of Built Environment in Shaping Excess Travel Distance across Transport Modes. Sci. Rep. 2025, 15, 33372. [Google Scholar] [CrossRef] [Scilit]
- Zhang, W.; Lu, D.; Chen, Y.; Liu, C. Land Use Densification Revisited: Nonlinear Mediation Relationships with Car Ownership and Use. Transp. Res. Part D Transp. Environ. 2021, 98, 102985. [Google Scholar] [CrossRef] [Scilit]
- Cabrera-Arnau, C.; Zhong, C.; Batty, M.; Silva, R.; Kang, S.M. Inferring Urban Polycentricity from the Variability in Human Mobility Patterns. Sci. Rep. 2023, 13, 5751. [Google Scholar] [CrossRef] [Scilit] [PubMed]
- Zhang, Y.; Wang, R.; Wu, Y.; Chu, G.; Wu, X. The Influence of Built-Environment Factors on Connectivity of Road Networks in Residential Areas: A Study Based on 204 Samples in Nanjing, China. Buildings 2023, 13, 301. [Google Scholar] [CrossRef] [Scilit]
- Boeing, G.; Pilgram, C.; Lu, Y. Urban Street Network Design and Transport-Related Greenhouse Gas Emissions around the World. Transp. Res. Part D Transp. Environ. 2024, 127, 103961. [Google Scholar] [CrossRef] [Scilit]
- Boeing, G. Spatial Information and the Legibility of Urban Form: Big Data in Urban Morphology. Int. J. Inf. Manag. 2021, 56, 102013. [Google Scholar] [CrossRef] [Scilit]
- Moreno, C.; Allam, Z.; Chabaud, D.; Gall, C.; Pratlong, F. Introducing the “15-Minute City”: Sustainability, Resilience and Place Identity in Future Post-Pandemic Cities. Smart Cities 2021, 4, 93–111. [Google Scholar] [CrossRef] [Scilit]
- Huang, J.; Levinson, D.M. Circuity in Urban Transit Networks. J. Transp. Geogr. 2015, 48, 145–153. [Google Scholar] [CrossRef] [Scilit]
- Liu, G.; Ma, Y. Research on Location and Task Allocation of Urban Logistics UAV Distribution Centers. Flight Dyn. 2023, 41, 88–94. [Google Scholar] [CrossRef]
- Zhang, H.; Feng, D.; Zhang, X.; Liu, H.; Zhong, G.; Zhang, L. Urban Logistics Unmanned Aerial Vehicle Vertiports Layout Planning. J. Transp. Syst. Eng. Inf. Technol. 2022, 22, 207–214. [Google Scholar] [CrossRef]
- Deng, M.; Yang, Q.; Peng, Y. A Real-Time Path Planning Method for Urban Low-Altitude Logistics UAVs. Sensors 2023, 23, 7472. [Google Scholar] [CrossRef] [Scilit]
- Yu, V.F.; Lin, S.-W.; Jodiawan, P.; Lai, Y.-C. Solving the Flying Sidekick Traveling Salesman Problem by a Simulated Annealing Heuristic. Mathematics 2023, 11, 4305. [Google Scholar] [CrossRef] [Scilit]
- Kirkpatrick, S.; Gelatt, C.D.; Vecchi, M.P. Optimization by Simulated Annealing. Science 1983, 220, 671–680. [Google Scholar] [CrossRef] [Scilit]
- Metropolis, N.; Rosenbluth, A.W.; Rosenbluth, M.N.; Teller, A.H.; Teller, E. Equation of State Calculations by Fast Computing Machines. J. Chem. Phys. 1953, 21, 1087–1092. [Google Scholar] [CrossRef] [Scilit]
- Fleischmann, M.; Romice, O.; Porta, S. Measuring Urban Form: Overcoming Terminological Inconsistencies for a Quantitative and Comprehensive Morphologic Analysis of Cities. Environ. Plan. B Urban Anal. City Sci. 2021, 48, 2133–2150. [Google Scholar] [CrossRef] [Scilit]
- Azhdari, A.; Soltani, A.; Alidadi, M. Urban Morphology and Landscape Structure Effect on Land Surface Temperature: Evidence from Shiraz, a Semi-Arid City. Sustain. Cities Soc. 2018, 41, 853–864. [Google Scholar] [CrossRef] [Scilit]
- Zhou, S.; Jia, W.; Wang, M.; Liu, Z.; Wang, Y.; Wu, Z. Synergistic Assessment of Multi-Scenario Urban Waterlogging through Data-Driven Decoupling Analysis in High-Density Urban Areas: A Case Study in Shenzhen, China. J. Environ. Manag. 2024, 369, 122330. [Google Scholar] [CrossRef] [Scilit]
- Yang, Y.; Liu, Y.; Yue, H.; Dong, Z. Spatiotemporal Pattern of Urban Sprawl Based on the Weighted Urban Proliferation Model: A Case Study of the Bohai Rim Region in China. Land 2024, 13, 55. [Google Scholar] [CrossRef] [Scilit]
- Li, M.; Sun, H.; Huang, Y.; Chen, H. Shapley Value: From Cooperative Game to Explainable Artificial Intelligence. Auton. Intell. Syst. 2024, 4, 2. [Google Scholar] [CrossRef] [Scilit]
- Heuillet, A.; Couthouis, F.; Díaz-Rodríguez, N. Collective eXplainable AI: Explaining Cooperative Strategies and Agent Contribution in Multiagent Reinforcement Learning with Shapley Values. IEEE Comput. Intell. Mag. 2022, 17, 59–71. [Google Scholar] [CrossRef] [Scilit]
- Zeng, P.; Sun, F.; Liu, Y.; Wang, Y.; Li, G.; Che, Y. Mapping Future Droughts under Global Warming across China: A Combined Multi-Timescale Meteorological Drought Index and SOM-kMeans Approach. Weather. Clim. Extrem. 2021, 31, 100304. [Google Scholar] [CrossRef] [Scilit]
- Dong, Q.; Huang, Z.; Zhou, X.; Guo, Y.; Scheuer, B.; Liu, Y. How Building and Street Morphology Affect CO2 Emissions: Evidence from a Spatially Varying Relationship Analysis in Beijing. Build. Environ. 2023, 236, 110258. [Google Scholar] [CrossRef] [Scilit]
- Yang, L.; Song, X. TOD Typology Based on Urban Renewal: A Classification of Metro Stations for Ningbo City. Urban Rail Transit 2021, 7, 240–255. [Google Scholar] [CrossRef] [Scilit]
- Fan, T.; Chapman, A. Policy Driven Compact Cities: Toward Clarifying the Effect of Compact Cities on Carbon Emissions. Sustainability 2022, 14, 12634. [Google Scholar] [CrossRef] [Scilit]
- Jahani, H.; Khosravi, Y.; Kargar, B.; Ong, K.-L.; Arisian, S. Exploring the Role of Drones and UAVs in Logistics and Supply Chain Management: A Novel Text-Based Literature Review. Int. J. Prod. Res. 2025, 63, 1873–1897. [Google Scholar] [CrossRef] [Scilit]
- Chung, S.H.; Sah, B.; Lee, J. Optimization for Drone and Drone-Truck Combined Operations: A Review of the State of the Art and Future Directions. Comput. Oper. Res. 2020, 123, 105004. [Google Scholar] [CrossRef] [Scilit]
- Zieher, S.; Olcay, E.; Kefferpütz, K.; Salamat, B.; Olzem, S.; Elsbacher, G.; Meeß, H. Drones for Automated Parcel Delivery: Use Case Identification and Derivation of Technical Requirements. Transp. Res. Interdiscip. Perspect. 2024, 28, 101253. [Google Scholar] [CrossRef] [Scilit]

Disclaimer/Publisher’s Note: The statements, opinions and data contained in all publications are solely those of the individual author(s) and contributor(s) and not of MDPI and/or the editor(s). MDPI and/or the editor(s) disclaim responsibility for any injury to people or property resulting from any ideas, methods, instructions or products referred to in the content. |
© 2026 by the authors. Published by MDPI on behalf of the International Society for Photogrammetry and Remote Sensing. Licensee MDPI, Basel, Switzerland. This article is an open access article distributed under the terms and conditions of the Creative Commons Attribution (CC BY) license.