


Abstract
Rapid urbanization in megacities has exacerbated the spatial mismatch between employment and housing, necessitating effective spatial optimization strategies. However, classical optimization models often rely on the idealized assumption of “proximity maximization,” failing to account for the complex, nonlinear regularities of actual human mobility. To address this disconnect between theoretical modeling and real-world behavior, this study establishes a job–housing balance optimization framework integrated with empirical commuting patterns. Using Shenzhen as a case study, we analyze citywide commuting big data since 2024 to characterize the power law relationship between commuting population size and distance. We propose a novel optimization model that partitions residential areas into “commuting rings” on the basis of observed distance-decay functions rather than simple Euclidean proximity. We applied the proposed method to current and future planning scenarios and successfully generated spatial regulation schemes that decentralize employment functions to peripheral areas while strategically densifying residential zones. By respecting the “heavy-tailed” nature of commuting distributions, this approach offers urban planners a more robust tool for reducing aggregate commuting burdens without violating the behavioral realities of the workforce.
1. Introduction
The urban concentration of population and economic activities has become a defining feature of modern societal development [1]. As the cores of regional development, cities continuously attract an agglomeration of socioeconomic factors by leveraging distinct advantages, including well-developed public service facilities, abundant employment opportunities [2], convenient transportation networks [3], and diverse cultural life [4]. Shenzhen, a symbol of China’s reform and opening up and a designated pilot demonstration zone [5], provides a particularly striking case study. Since its designation as a Special Economic Zone in 1978, the city has undergone urbanization at a rate rarely seen globally [6]. Its population surged from approximately 33,000 in 1980 to 17 million by 2020 [7], creating a population characterized by a youthful demographic, a high degree of mobility, and significant structural disparities between registered and nonregistered residents [8]. Although this sustained urbanization has fueled profound economic and social progress, it has concurrently given rise to increasingly complex urban problems. Foremost among these is the spatial mismatch between jobs and housing, which has emerged as a major challenge to sustainable urban development [9].
The spatial imbalance between employment and housing leads directly to numerous problems, including traffic congestion, prolonged commuting times, increased energy consumption, and environmental pollution. The job–housing balance refers to the proportional alignment of employment opportunities and residential populations within a specific geographic unit [10]. Its core objective is to create an efficient spatial match between workplaces and residences, thereby shortening commutes, reducing unnecessary travel, and improving overall commuting efficiency [11]. Despite the importance of this concept, the research on optimization models for the job–housing balance has significant methodological limitations. Most models are predicated on the idealized assumption that workers invariably choose the nearest available job. Although such models can theoretically derive a minimum global average commuting distance, they neglect the complex patterns inherent in actual commuting behavior. This disconnection between theoretical assumptions and real-world activity severely constrains the practical value of research outcomes. Consequently, these models, with adjustments confined to proximity-based distributions, struggle to address effectively the profound job–housing challenges faced by China’s megacities.
To address this research gap, this study incorporates commuting behavior patterns into a job–housing balance optimization model. We develop a spatially optimized framework grounded in a quantitative analysis of the power-law relationship between commuting distance and population size, derived via a double-logarithmic transformation. The proposed model partitions the residential areas surrounding employment centers into “commuting rings,” each containing an equal population of commuters, on the basis of an observed distance-decay function. This methodology transcends the limitations of traditional proximity-based allocation, which assumes that workers select the nearest job, thereby yielding optimization results that more accurately reflect real-world conditions and enhance the practical applicability of the model’s outcomes.
This paper is structured as follows. The Section 2 reviews the research on the job–housing balance and the results it has attained through spatial optimization. The subsequent section, Section 3, outlines the research setting and describes the datasets used to analyze commuting patterns. Next, we present the job–housing balance optimization model and its application under various scenarios to derive distinct optimization outcomes. Finally, we discuss these results and present our conclusions.
2. Background
The concept of the job–housing balance traces its origins to the late 19th century, when Ebenezer Howard’s “garden city” model advocated for integrating employment and residential functions within moderately scaled urban units to enable short-distance commuting [12]. This idea was further advanced in the first half of the 20th century by Eliel Saarinen’s “organic decentralization theory” and Lewis Mumford’s principles of balanced development, which provided a theoretical foundation for post–World War II new town construction [13,14]. Following the war, the United Kingdom pioneered new town projects based on a self-sufficient, job–housing balanced development model; however, many of these settlements evolved into “sleeper towns” as employment opportunities remained concentrated in core urban areas [15]. Concurrently, major metropolitan areas such as Tokyo and Paris adopted polycentric development strategies, such as Japan’s “business core cities” initiative and Paris’s construction of new towns along transportation corridors, to mitigate problems associated with monocentric structures. Nevertheless, practical outcomes revealed that jobs and housing continued to be separated [16]. In the 1980s, as rapid urban development worldwide exacerbated issues such as traffic congestion, environmental pollution, and sprawl [17], Robert Cervero formally introduced the policy concept of the job–housing balance, focusing on the disjuncture between suburban job growth and increasing commuter travel distances [18]. However, this seminal work did not elaborate on specific experimental data or quantitative models.
Despite the intuitive appeal of proximity, the spatial separation of employment and housing is driven fundamentally by urban economic mechanisms. According to the classic bid rent theory [19], residential location choice is a trade-off between housing costs and commuting costs; individuals often accept longer commutes to access affordable housing or higher residential amenities at the urban periphery. Consequently, the “spatial mismatch hypothesis,” proposed by Kain [20], argues that a structural disconnect arises when employment growth centers shift to the suburbs while low-income populations remain trapped in inner cities, or, conversely, when housing affordability forces the workforce into distant locations. These economic drivers suggest that minimizing distance is rarely the sole objective of the commuter. This discrepancy has led scholars to distinguish between “wasteful commuting” (excess travel caused by an inefficient urban form) and “justifiable commuting” (travel necessitated by the heterogeneity of housing markets and employment specialization) [21].
In the context of Chinese urbanization, the job–housing relationship has undergone a profound transformation driven by institutional shifts. Under the preform planned economy, the danwei (work unit) system integrated housing and employment within enclosed compounds, achieving a state of nominal balance but low mobility [22]. The subsequent decomposition of this system, coupled with the monetization of housing and the marketization of land usage, decoupled the workplace rapidly from residential areas.
The concept of the job–housing balance traces its origins to the late 19th century, when Ebenezer Howard’s “garden city” model advocated for integrating employment and residential functions within moderately scaled urban units to enable short-distance commuting [23]. In megacities like Shenzhen, this transition was exacerbated by a “dual-track” urbanization process: the rapid gentrification of the central business districts pushed residents outward, while industrial agglomeration in the periphery attracted a different demographic of migrant labor. Unlike Western cities shaped largely by market sprawl, the spatial mismatch in Chinese megacities is arguably a product of this compressed urbanization and the structural friction between legacy administrative planning and emerging market forces [24].
As research on the job–housing balance has advanced, the focus has shifted from theoretical discourse to empirical and quantitative analyses. Early scholars often measure this balance using the “employment-to-housing ratio,” which is calculated as the number of jobs divided by the number of employed residents within a specific area. A ratio approaching 1.0 was considered indicative of an approximate equilibrium between employment opportunities and the labor force, implying a theoretically balanced jobs-housing relationship [25]. However, this simplistic metric has been criticized widely for its failure to account for the spatial dynamics between employment and housing or to measure employment accessibility adequately [26]. For example, a region may exhibit a balanced ratio while experiencing significant commuting burdens if the types of available jobs and the skills of the local workforce are fundamentally mismatched.
Minimizing commute distance is another primary objective in evaluating the job–housing balance. To this end, researchers have developed several benchmark models. The theoretical minimum commute model calculates the shortest possible aggregate commute by assigning workers to the nearest available jobs, although it disregards real-world constraints. Conversely, the theoretical maximum commute model establishes the upper bound of travel distance by simulating a scenario in which every commuter travels to the farthest possible job [27]. A third approach, the random-average-commute model, provides a baseline by calculating the average commute distance under a scenario of completely random job assignment [28]. Unlike these benchmarks, the optimal growth distribution model seeks to minimize the overall average commute distance by optimizing the spatial allocation of new population and employment, operating within the constraints of land-carrying capacity and without altering the existing urban structure [29].
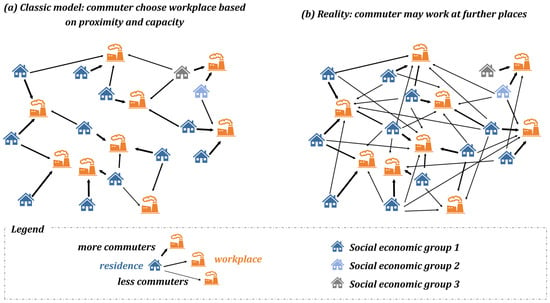
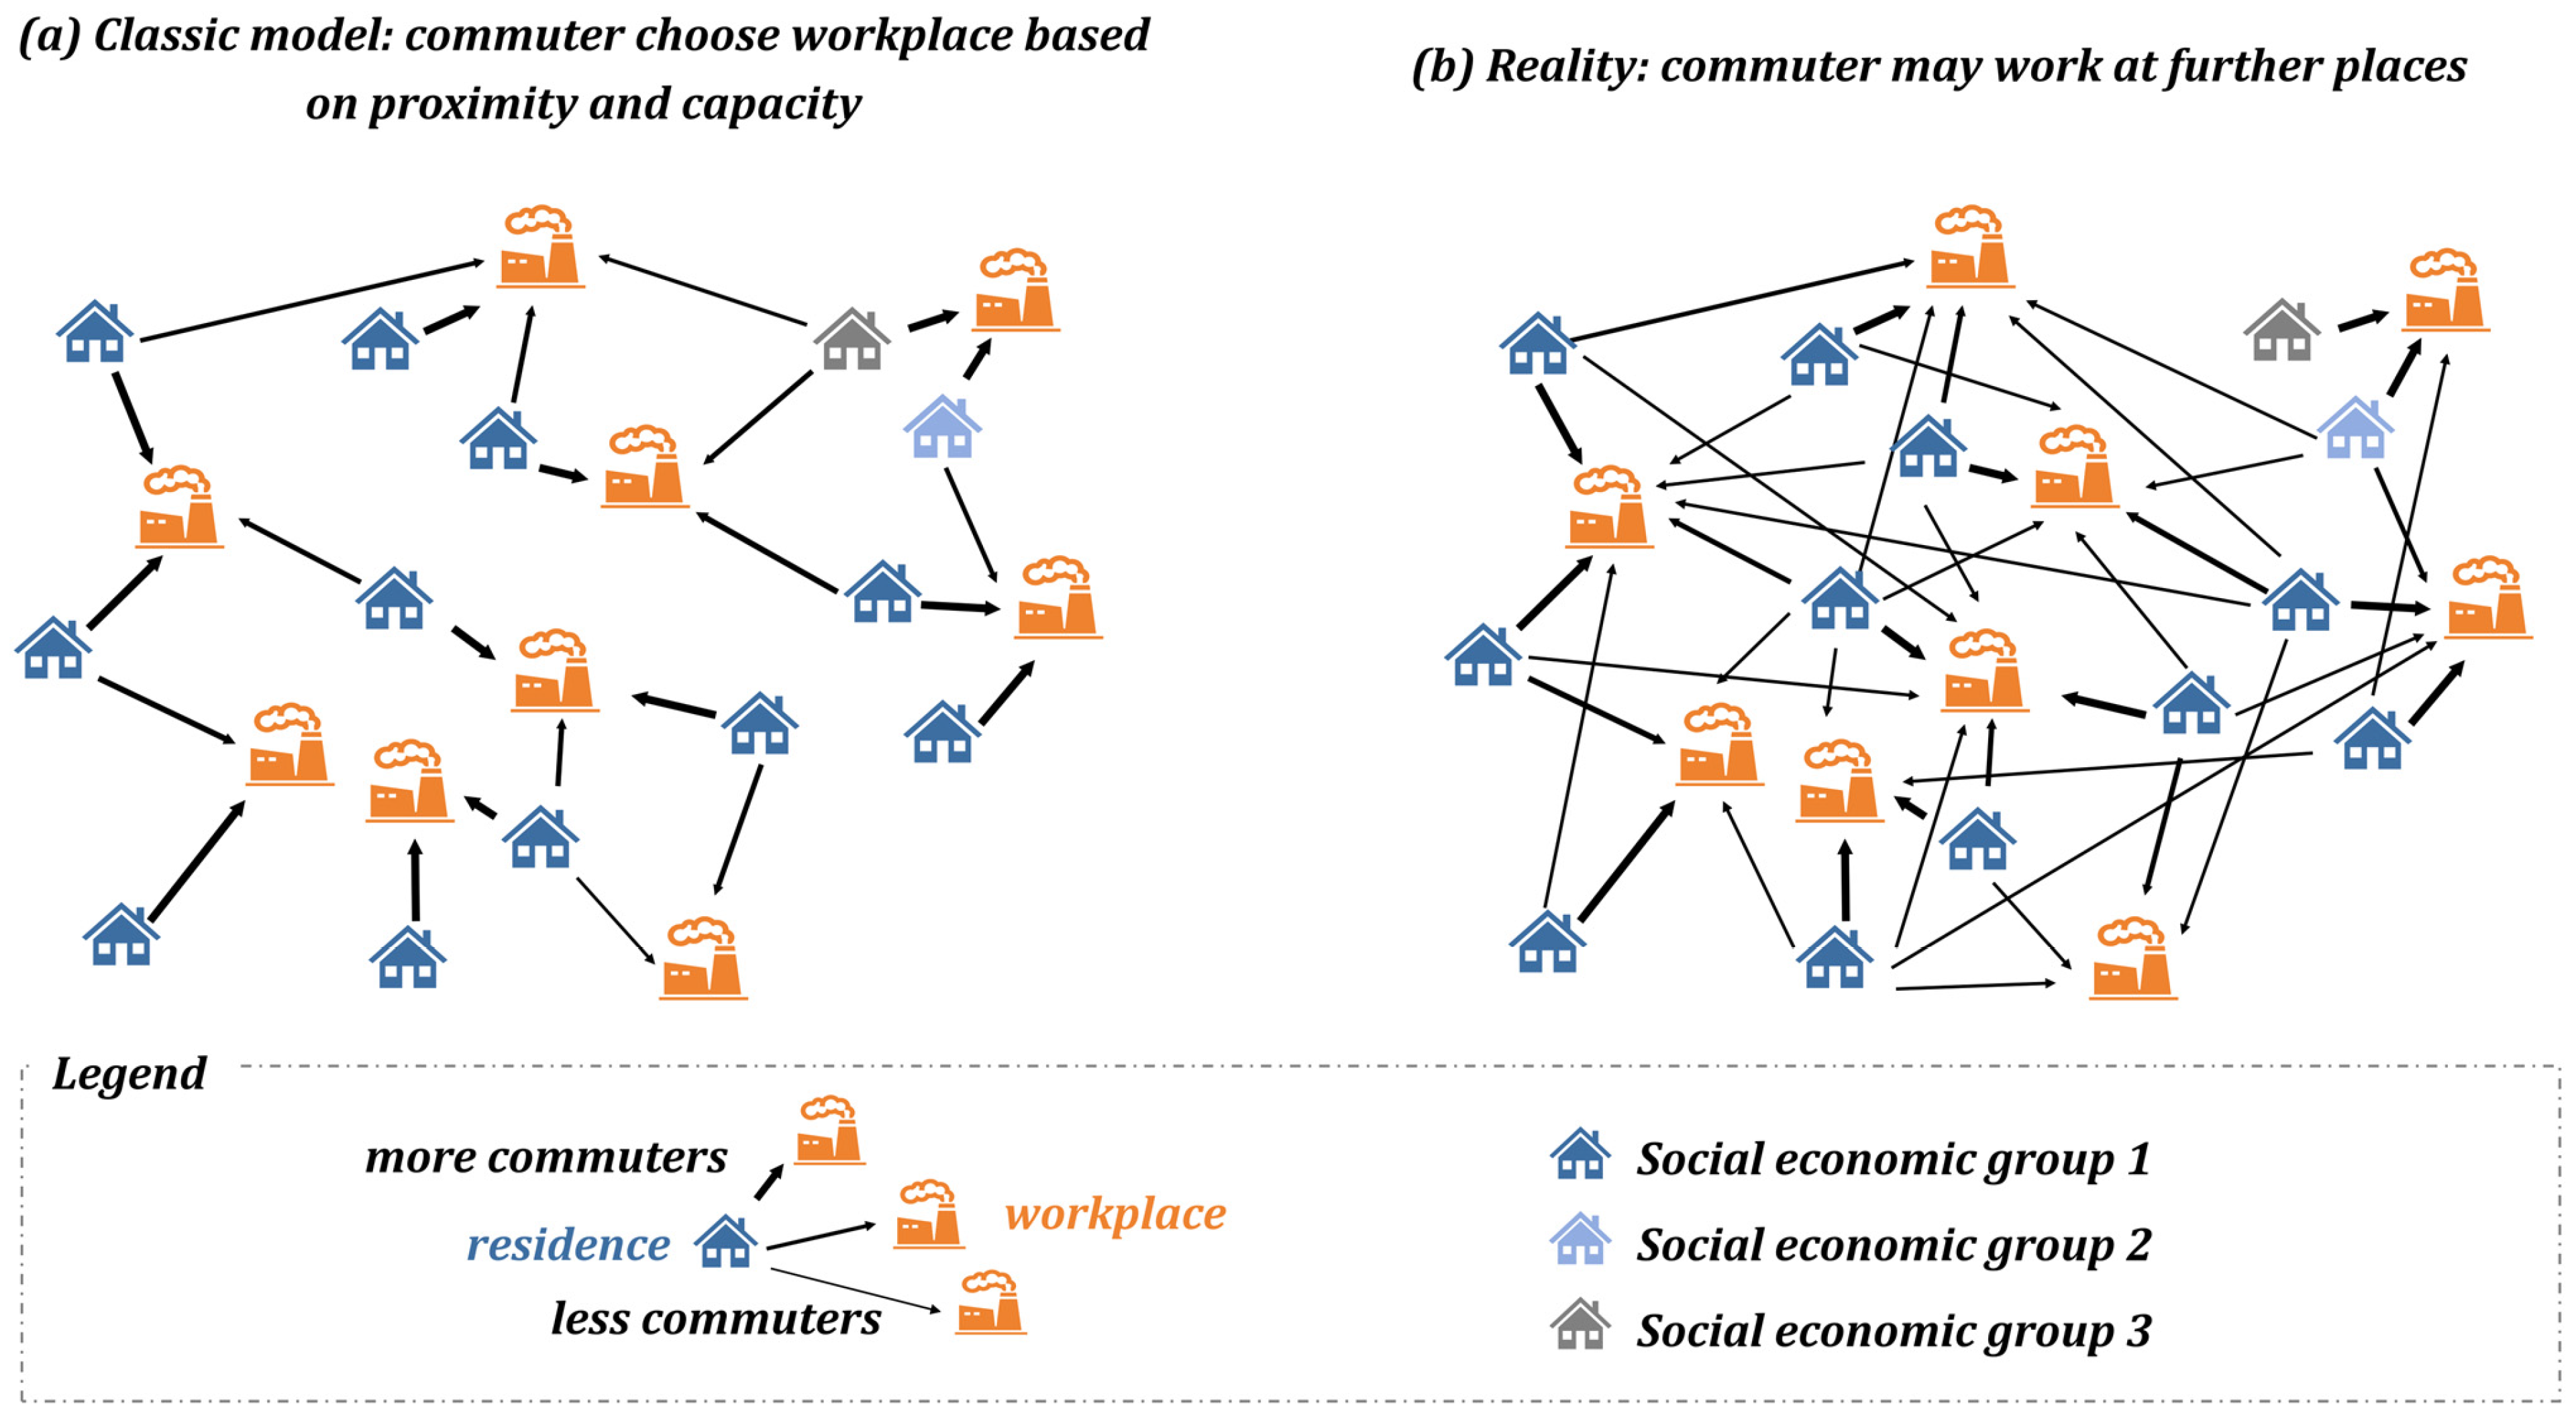
Although planners aim to reduce commuting distances through optimized spatial layouts, residents’ actual travel behaviors often diverge from the simple principle of proximity. This discrepancy is highlighted by comparing an idealized model in which residential allocation is determined solely by distance to employment (Figure 1a) with observed patterns (Figure 1b). In practice, individual decision-making is more nuanced; residents evaluate commute distances against a threshold of acceptability shaped by their socioeconomic status [30]. Furthermore, the prevalence of dual-earner households often necessitates residential location choices that represent a compromise between the commutes of both partners. These factors underscore that real-world commuting behavior is considerably more complex than the assumptions underpinning proximity-based models are. Although socioeconomic factors affect commuting, our research focuses on the aggregate distance-decay relationship and does not operationalize them. Therefore, Figure 1 uses “Social economic groups” only as a schematic label, without specific thresholds.
Figure 1.
Comparison of commuting distribution between ideal and actual scenarios.
Given this complex interplay of factors, the relationship between commuting distance and the number of commuters must be investigated. Traditional research has typically relied on large-scale residential travel surveys to develop travel distribution models, using sampled data to assess the job–housing spatial dynamics and their determinants [31]. More recently, the widespread availability of mobile phone–signaling data has vastly expanded the analytical scale, enabling more granular insights [32,33]. These large datasets have revealed a complex, nonlinear relationship: the number of commuters declines sharply as distance increases over shorter ranges, but this rate of decline decelerates markedly at longer distances.
Complexity theory offers a robust theoretical foundation for understanding commuting patterns, positing that many spatial phenomena follow power-law distributions. Unlike Gaussian or exponential distributions, which rely on characteristic scales such as mean and standard deviation, power law distributions are distinguished by their “scale-free” properties, in which the distributional shape is similar across all scales, and a significant “long-tail effect,” characterized by a higher probability of extreme values [34,35]. Commuting behavior exemplifies this complexity: although the majority of individuals make short-distance commutes because of cost constraints, factors such as high-paying jobs or specialized needs compel a minority to undertake exceptionally long journeys. This pattern creates a statistically “heavy-tailed” distribution consistent with power law characteristics. In contrast, conventional exponential models fail to account for the observed proportion of long-distance commutes [36]. Recent research further refines this understanding, proposing a model in which the number of visitors to any location is inversely proportional to the power of the product of that location’s visitation frequency and the travel distance required to reach it [37].
In this model, represents the population density visiting location i, which is a function of travel distance () and visitation frequency (), whereas and are empirically derived coefficients. The theoretical importance of this pattern is that, for a constant frequency, the number of visitors to a location decreases as a power function of distance. Consequently, when plotted on double-logarithmic axes, this relationship becomes linear, with population density clearly inversely proportional to travel distance, as evidenced by a negative slope. This shift from a Gaussian to a Paretian understanding of mobility implies that standard optimization models, which aggressively prune long-distance commutes to achieve a global mean, may fundamentally misrepresent the scale-free nature of human spatial behavior in complex metropolitan systems. This linearization provides a tractable mathematical framework for complex commuting phenomena, facilitating the integration of realistic travel patterns into job–housing balance models.
3. Study Area and Data
This chapter presents an overview of Shenzhen, describes the large-scale commuting data utilized in the analysis, and establishes the city’s fundamental commuting patterns derived from this dataset. As a premier example of rapid urbanization and economic transformation, Shenzhen provides a critical case study for examining the complex mobility dynamics of a modern metropolis. The chapter first contextualizes the study by outlining Shenzhen’s unique socioeconomic landscape, which shapes travel behaviors profoundly. It subsequently details the nature and scope of the anonymized, high-resolution commuting data, highlighting its advantages over traditional census or survey methods for capturing the nuances of daily commuting patterns. The core of the chapter is dedicated to the empirical analysis, where this dataset is used to calculate and visualize key metrics such as the population distribution, commuting pattern, and job–housing ratio distribution. By mapping these foundational patterns systematically, this chapter provides the essential empirical groundwork for subsequent optimization of job–housing relationships and the evaluation of urban planning policies.
3.1. Overview of Shenzhen: A Rapidly Urbanizing Megacity
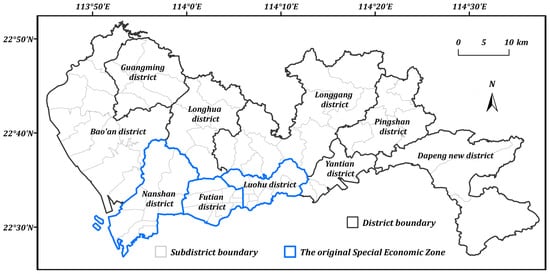
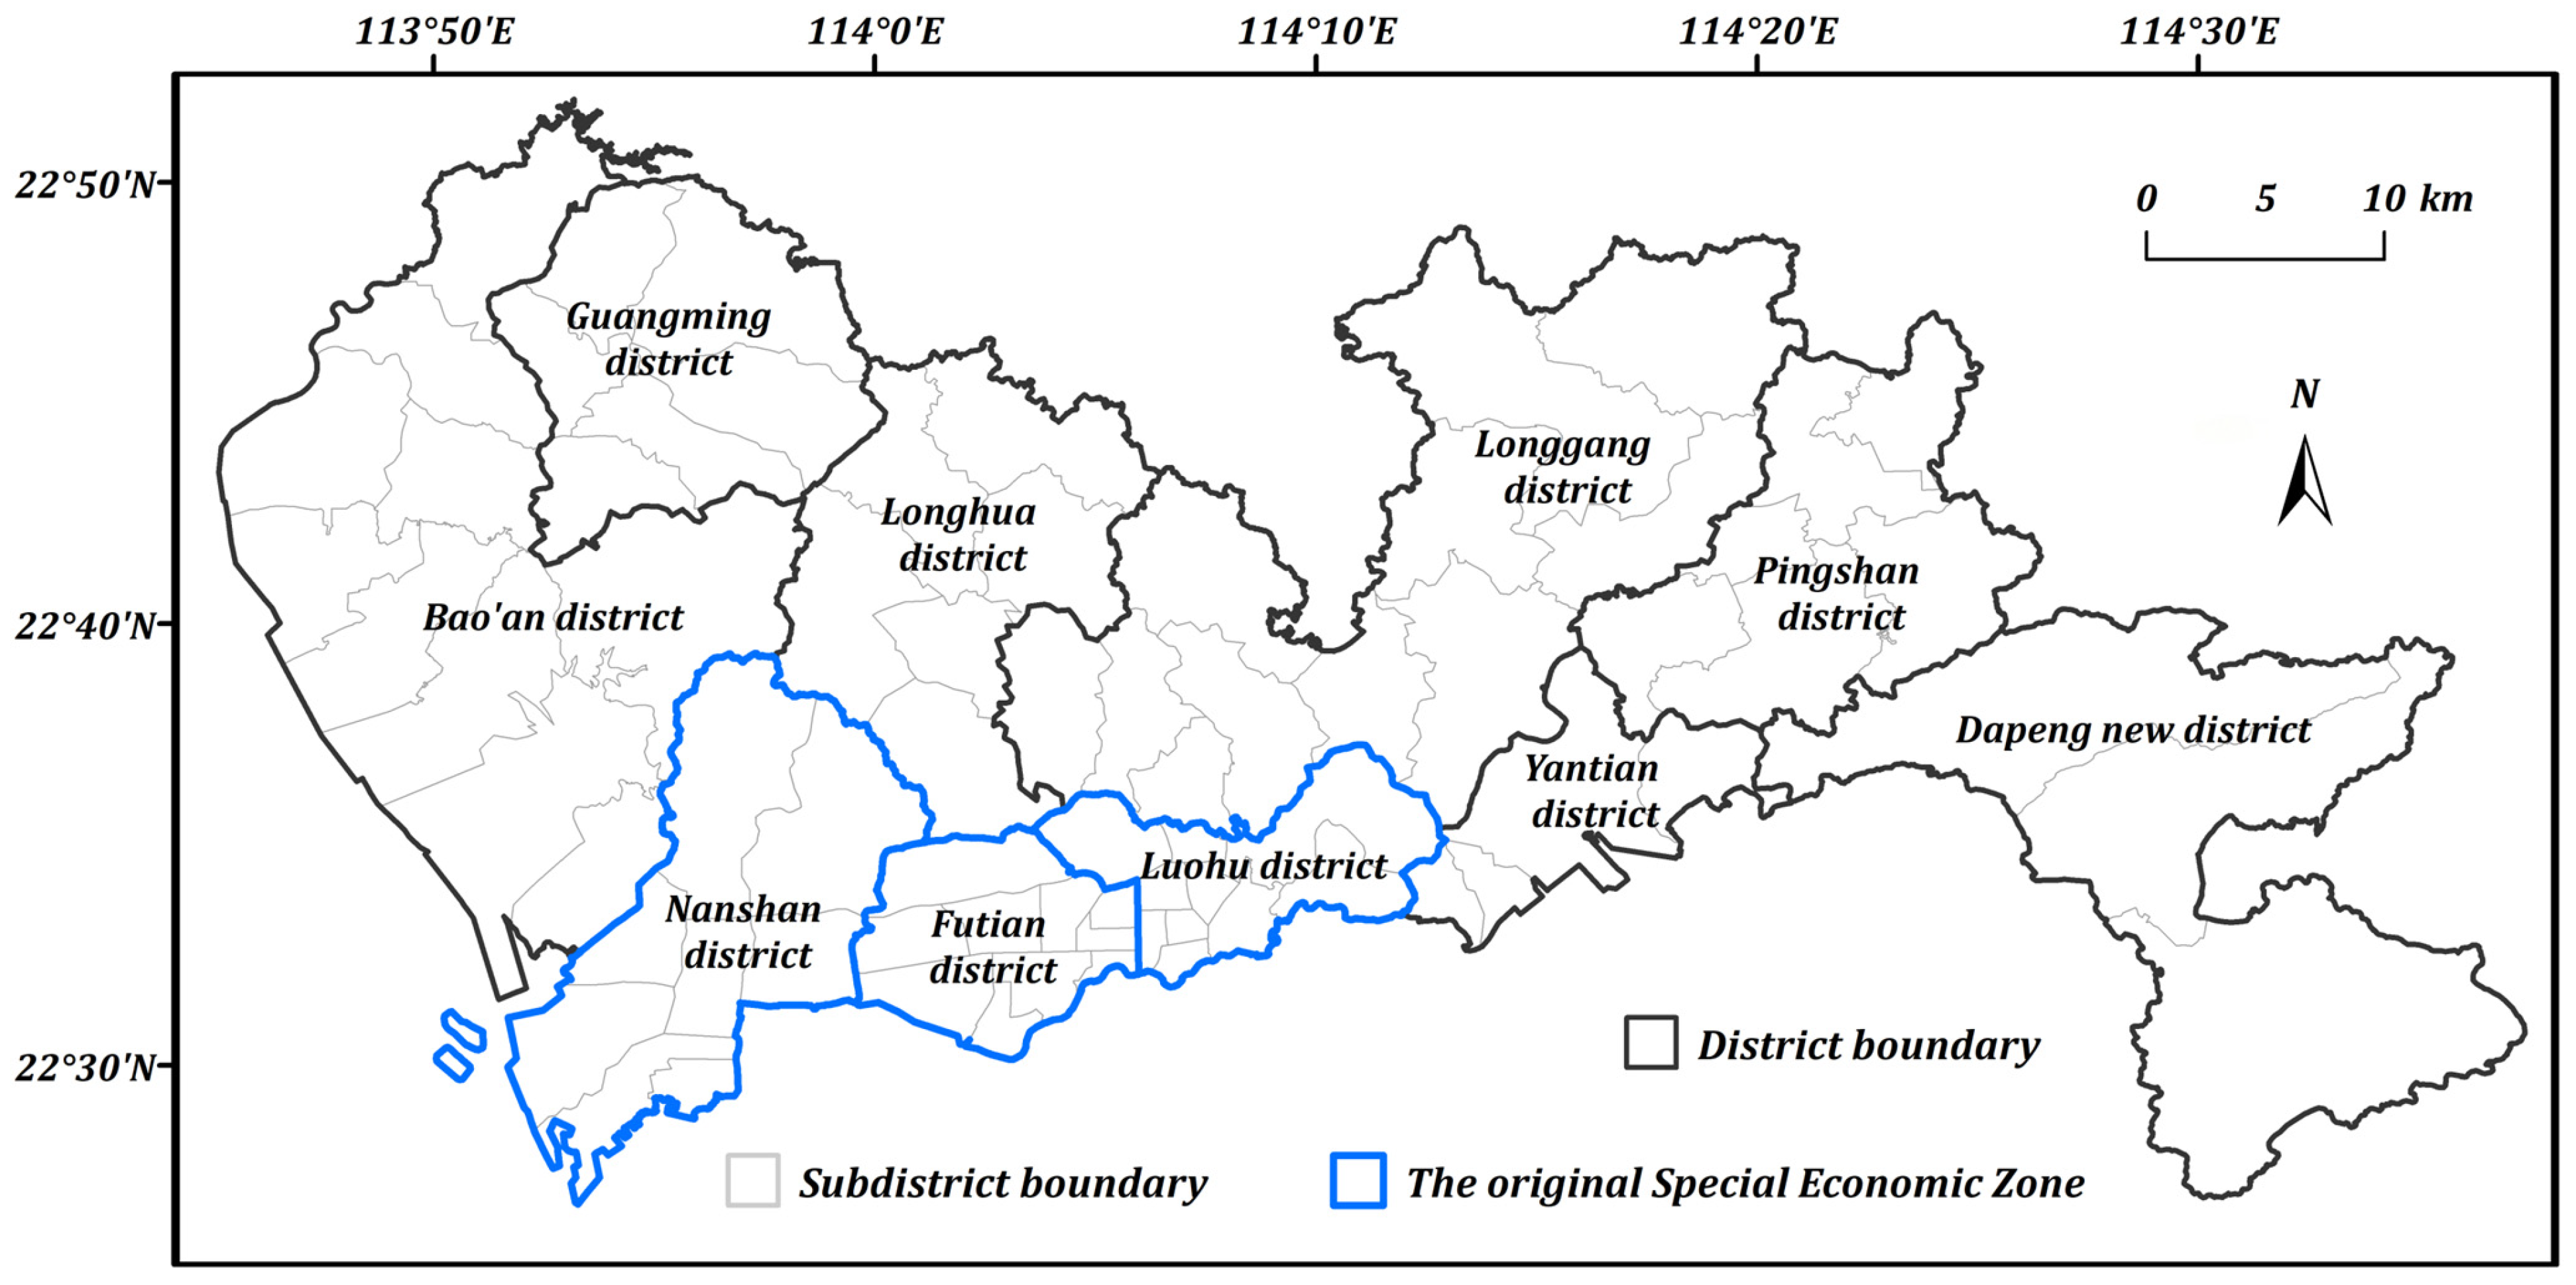
Shenzhen (Figure 2), a prototypical megacity located on the coast of the South China Sea adjacent to Hong Kong, benefits from excellent natural harbor conditions [38]. Its urban population has expanded at a rate that has consistently exceeded national averages, indicating a period of extraordinary growth [6]. However, this growth has not been uniform; the city is characterized by pronounced internal development imbalances rooted in the city’s administrative history. Until its expansion in July 2010, the Special Economic Zone (SEZ) was confined to the four southern districts of Nanshan, Futian, Luohu, and Yantian. Consequently, this core area evolved into a highly developed and densely populated hub, accommodating 67% of the city’s total population [39]. In response to increasing land constraints and the imperative for industrial upgrading within this original SEZ, the peripheral areas began to assume a critical role in the city’s ongoing urbanization and industrialization. These outer districts subsequently became the locus for extensive manufacturing and emerging industries, representing a pivotal new engine for Shenzhen’s continued development [40].
Figure 2.
The basic location and administrative divisions of Shenzhen.
3.2. Data Sources: Baidu Huiyan Platform and Processing Methods
This study utilizes a large-scale commuting dataset for Shenzhen in 2024 sourced from the Baidu Huiyan platform. The dataset, comprising 1.049 million anonymized commuting records, is derived from internet location-based services and features an initial spatial resolution of 100 m. It provides comprehensive information on commuter populations, including their habitual residence and workplace locations. An example of these data is shown in Table 1. Commuting distances were calculated using Baidu Maps’ proprietary road network data, employing a multimodal approach: trips of ≤ (≥) 2.5 km were calculated on the basis of bicycle (automobile) travel routes [41]. To enhance the robustness of the analysis and minimize the influence of measurement noise and idiosyncratic individual behaviors, the raw data were aggregated and resampled to a 500 m grid resolution for all subsequent calculations, thereby facilitating a more accurate characterization of broader commuting patterns.
Table 1.
Commuting record example from the Baidu Huiyan platform.
3.3. Spatial Analysis of Commuting Disparities in Shenzhen
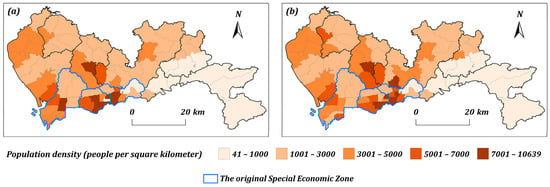
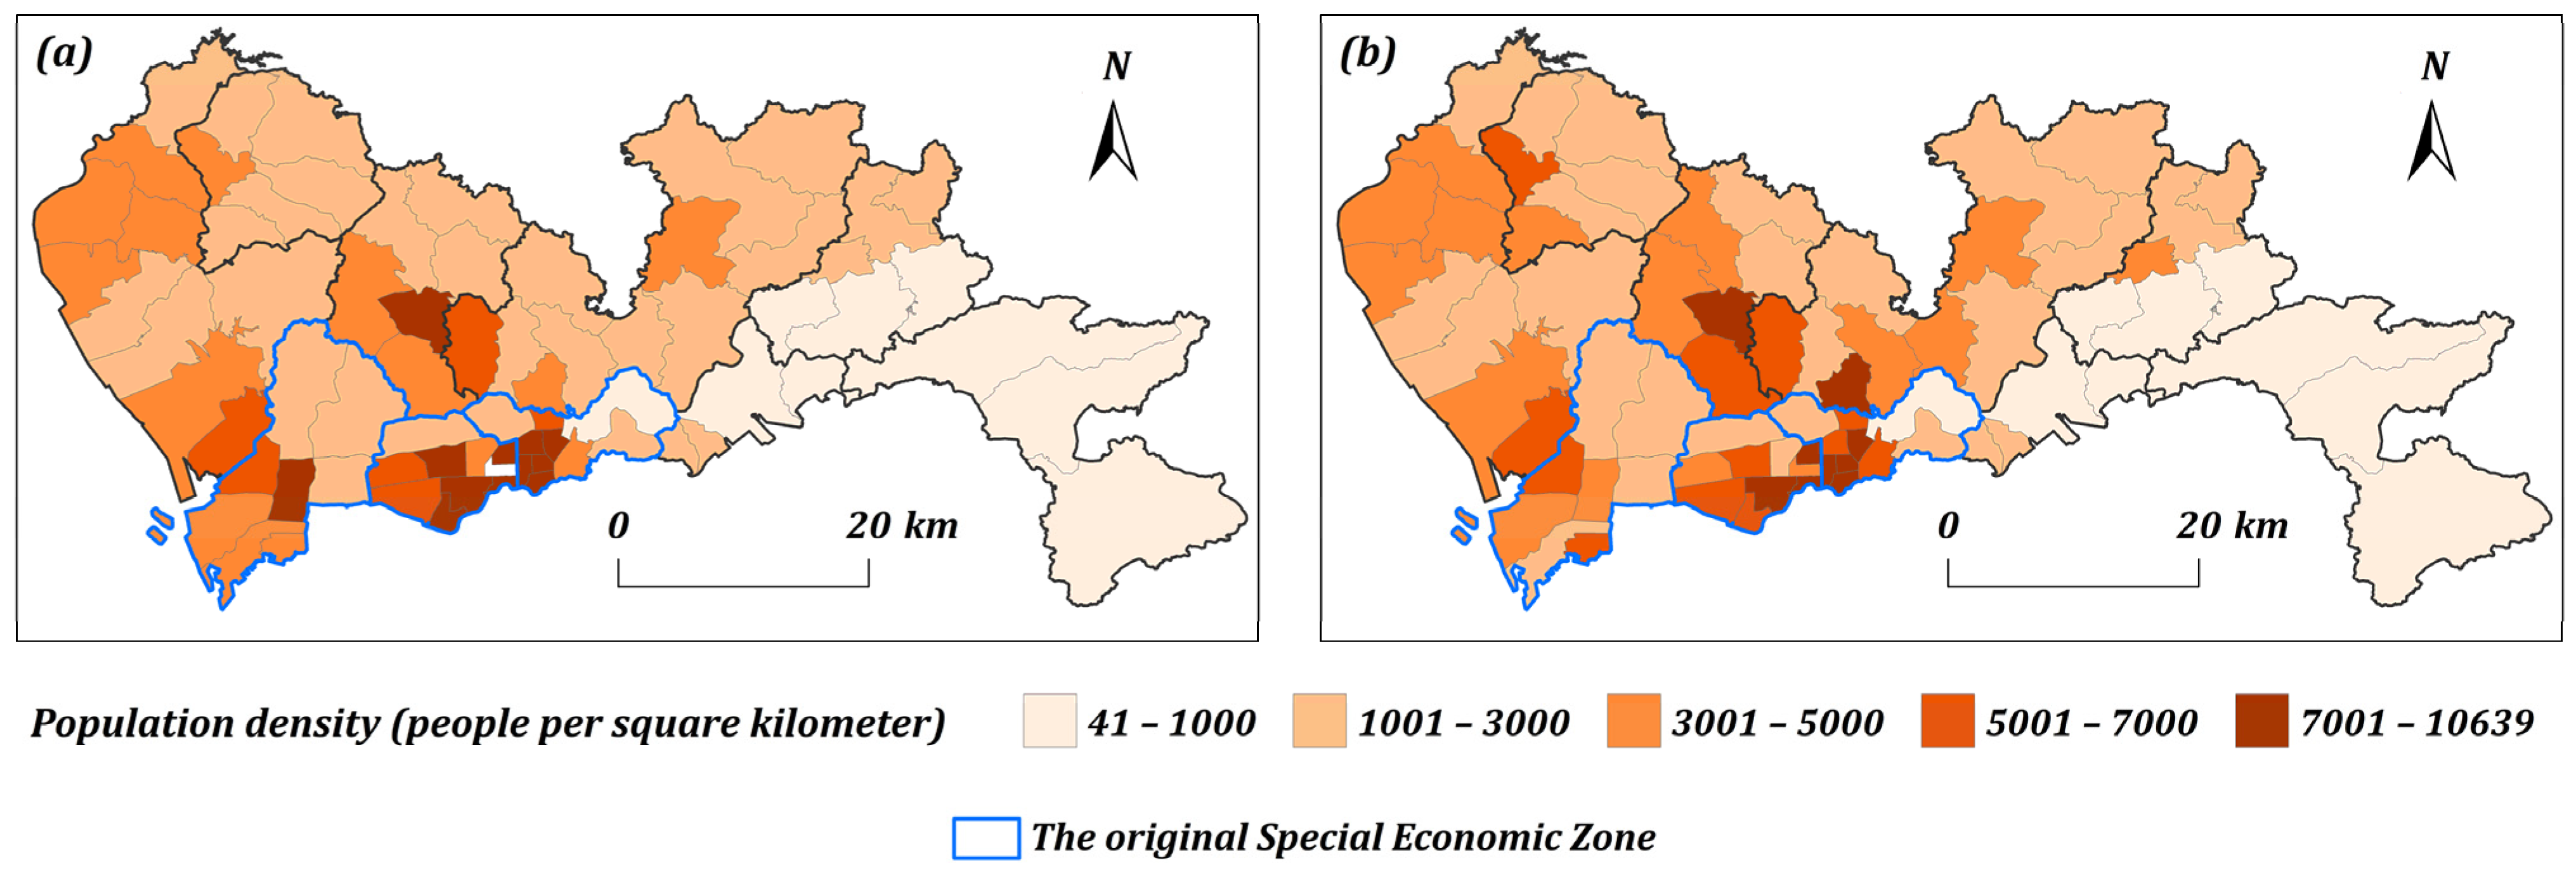
The analysis of the 2024 commuting data reveals a significant spatial disparity between residential and employment population densities at the subdistrict level in Shenzhen (Figure 3). This misalignment is particularly acute within and surrounding the former Special Economic Zone (SEZ), a pattern indicative of a substantial job–housing imbalance. The divergence between where people live and where they work is most pronounced in these core urban areas, underscoring the complex spatial legacies of the city’s phased development.
Figure 3.
Commuter population density statistics at street-level employment locations and commuting destinations in Shenzhen (where (a) represents workplace; (b) represents residence).
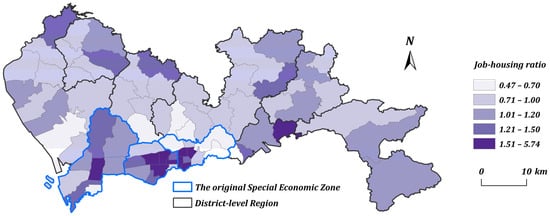
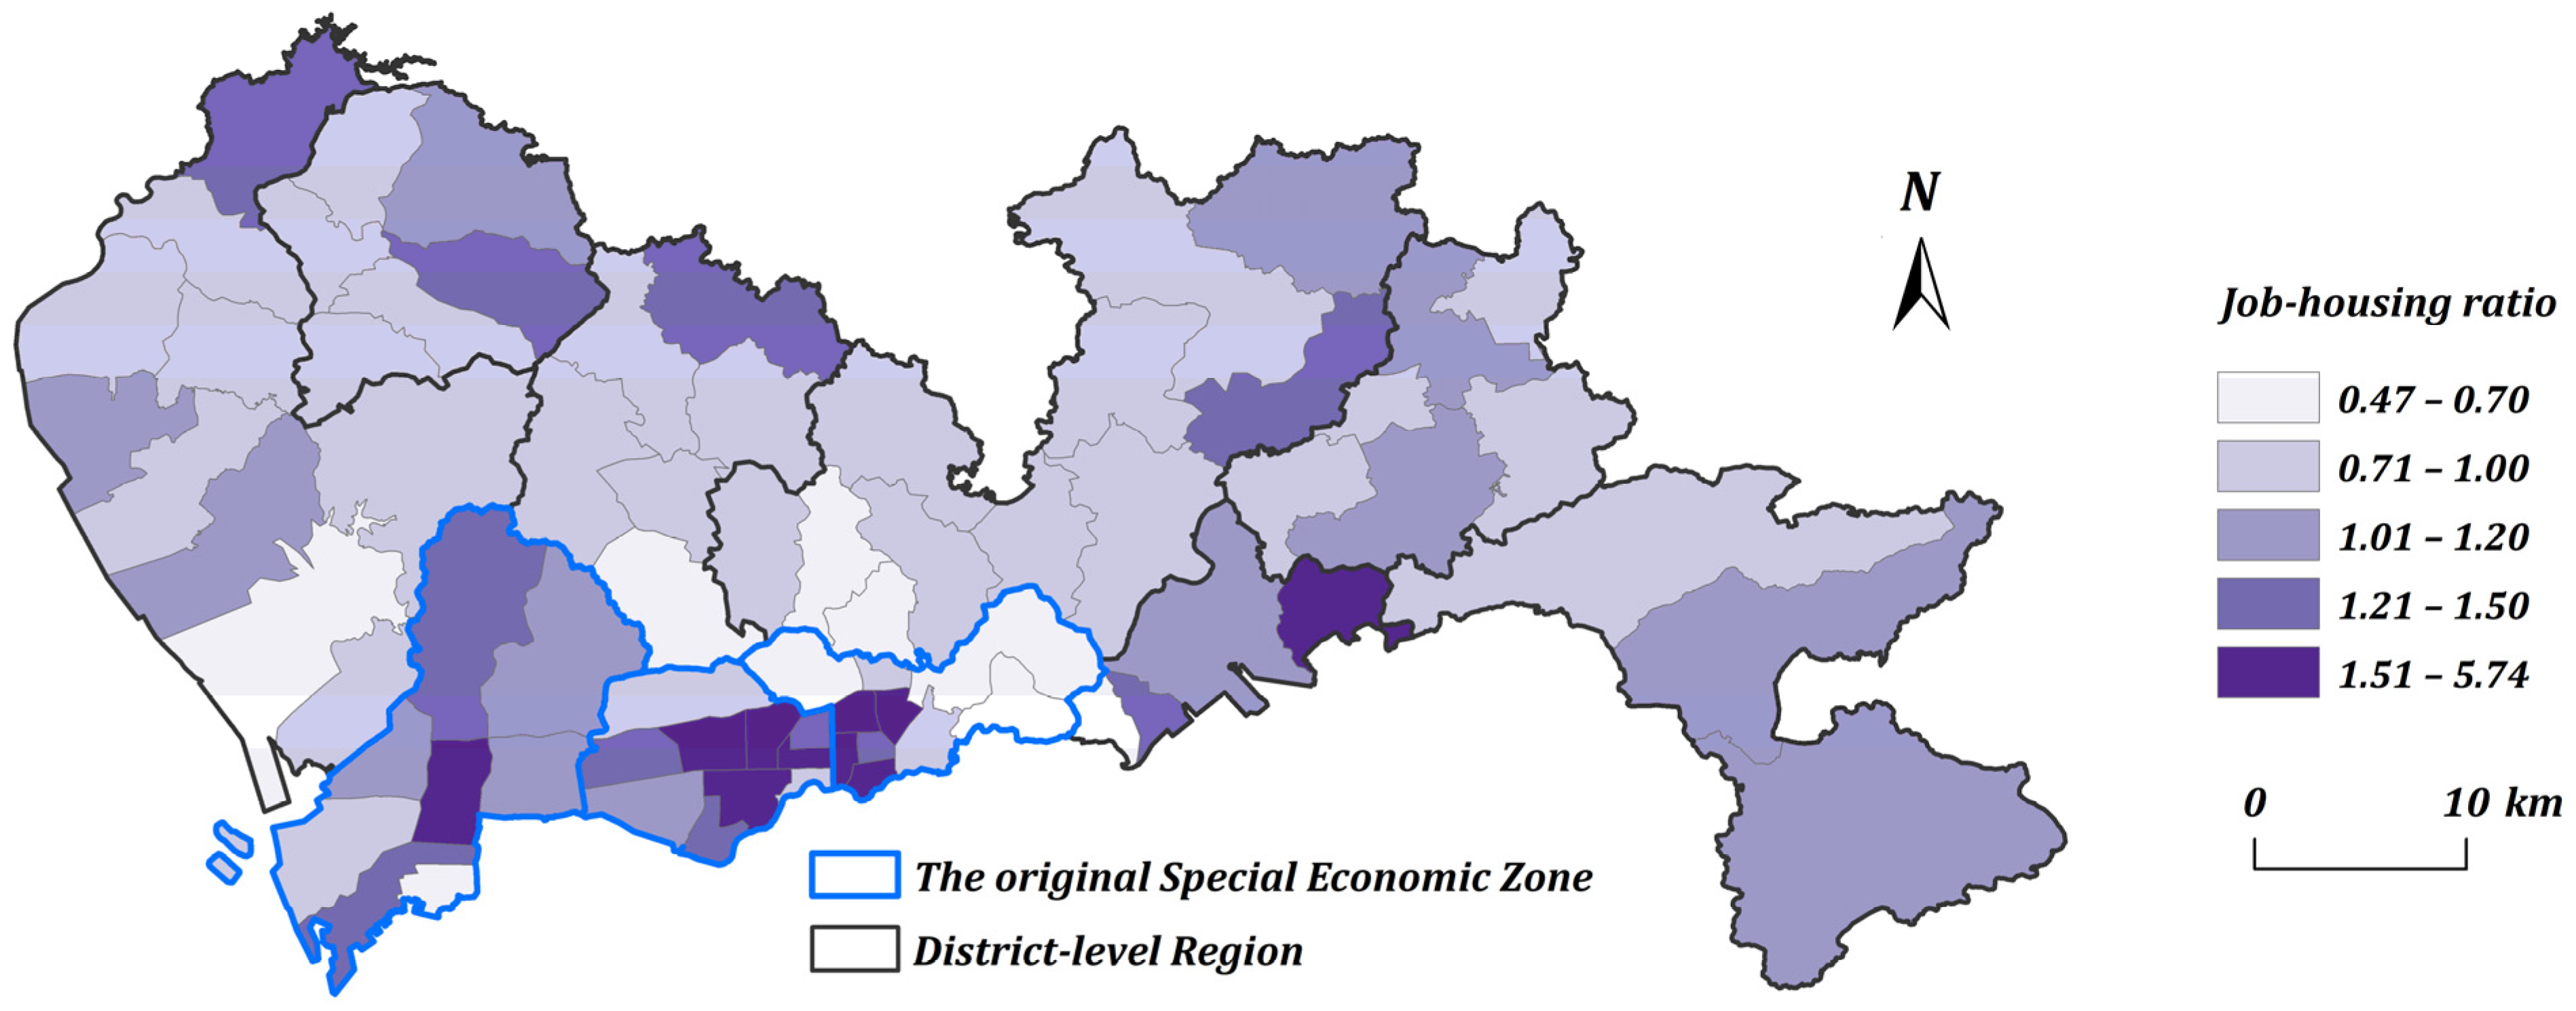
The job–housing ratio, a key metric for assessing the spatial equilibrium between employment and residence, is defined as the ratio of employment positions to employed residents within a specific geographic unit. A ratio approaching 1.0 is indicative of a relative balance, whereas significant deviations point to a job–housing mismatch [18]. As illustrated for Shenzhen at the subdistrict scale (Figure 4), the distribution of this ratio is spatially imbalanced. This imbalance manifests as a stark dichotomy between the job-rich districts of the former SEZ and the more residentially oriented areas beyond its boundary.
Figure 4.
Street-level job-housing ratio in Shenzhen.
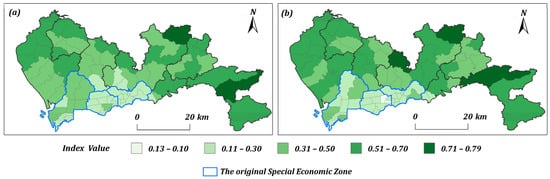
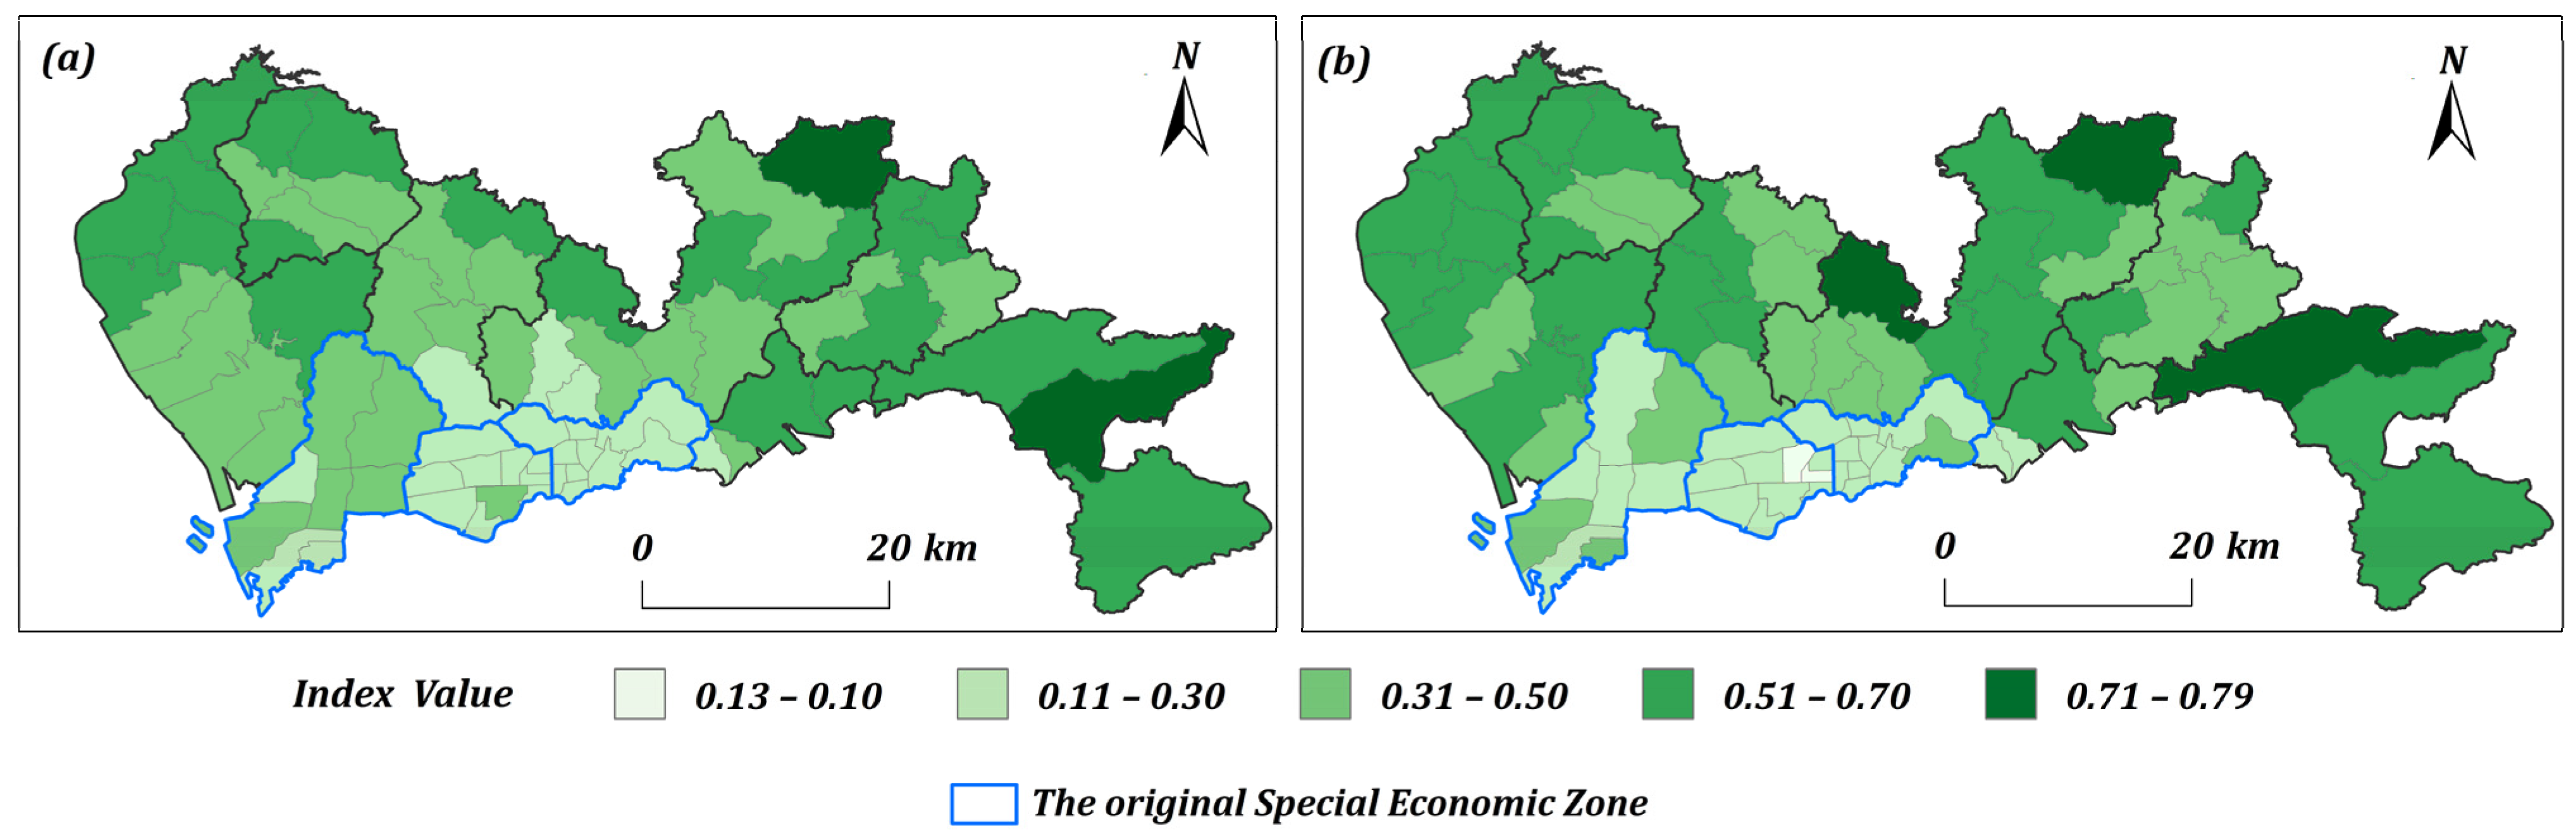
To provide a more nuanced characterization of the spatial mismatch between jobs and housing in Shenzhen, this study further introduces the Resident Employment Balance Index (REBI) and the Employment Residence Balance Index (ERBI). REBI measures the proportion of local residents employed locally, reflecting the job-housing self-containment of residential areas, while ERBI measures the proportion of local jobs filled by local residents, indicating the labor localization degree of employment centers. REBI is formally defined as the ratio of employed residents who both live and work in the same spatial unit to the total resident population of that unit. Conversely, ERBI is defined as the ratio of such matched workers to the total number of jobs in that unit. These indices are calculated as follows:
where and represent the two balance indices for region I; denotes the number of workers who both reside and work in region I; is the total resident population in region i; and is the total number of jobs in region i.
As shown in Figure 5, analysis at the subdistrict level reveals persistently low values for both indices within the core areas of the former Special Economic Zone (SEZ). This finding unveils a systemic decoupling of residential and employment geographies in these areas, indicating that although they serve as the city’s primary economic engines, they suffer from a severe job–housing imbalance. Local residents struggle to find work locally, and local jobs are highly dependent on an external workforce. This structural imbalance is the root cause of large-scale cross-district commuting and highlights the formidable challenges of achieving spatial equilibrium within Shenzhen’s rapidly evolving polycentric framework.
Figure 5.
Subdistrict-scale spatial distribution of REBI (a) and ERBI (b) indices in Shenzhen.
3.4. Empirical Identification of the Power Law Distribution in Shenzhen’s Commuting Patterns
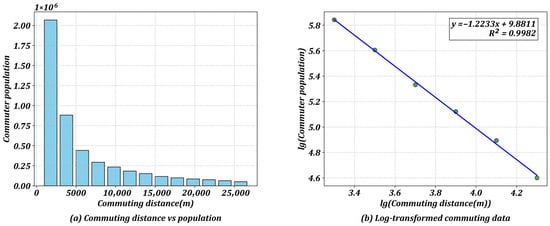
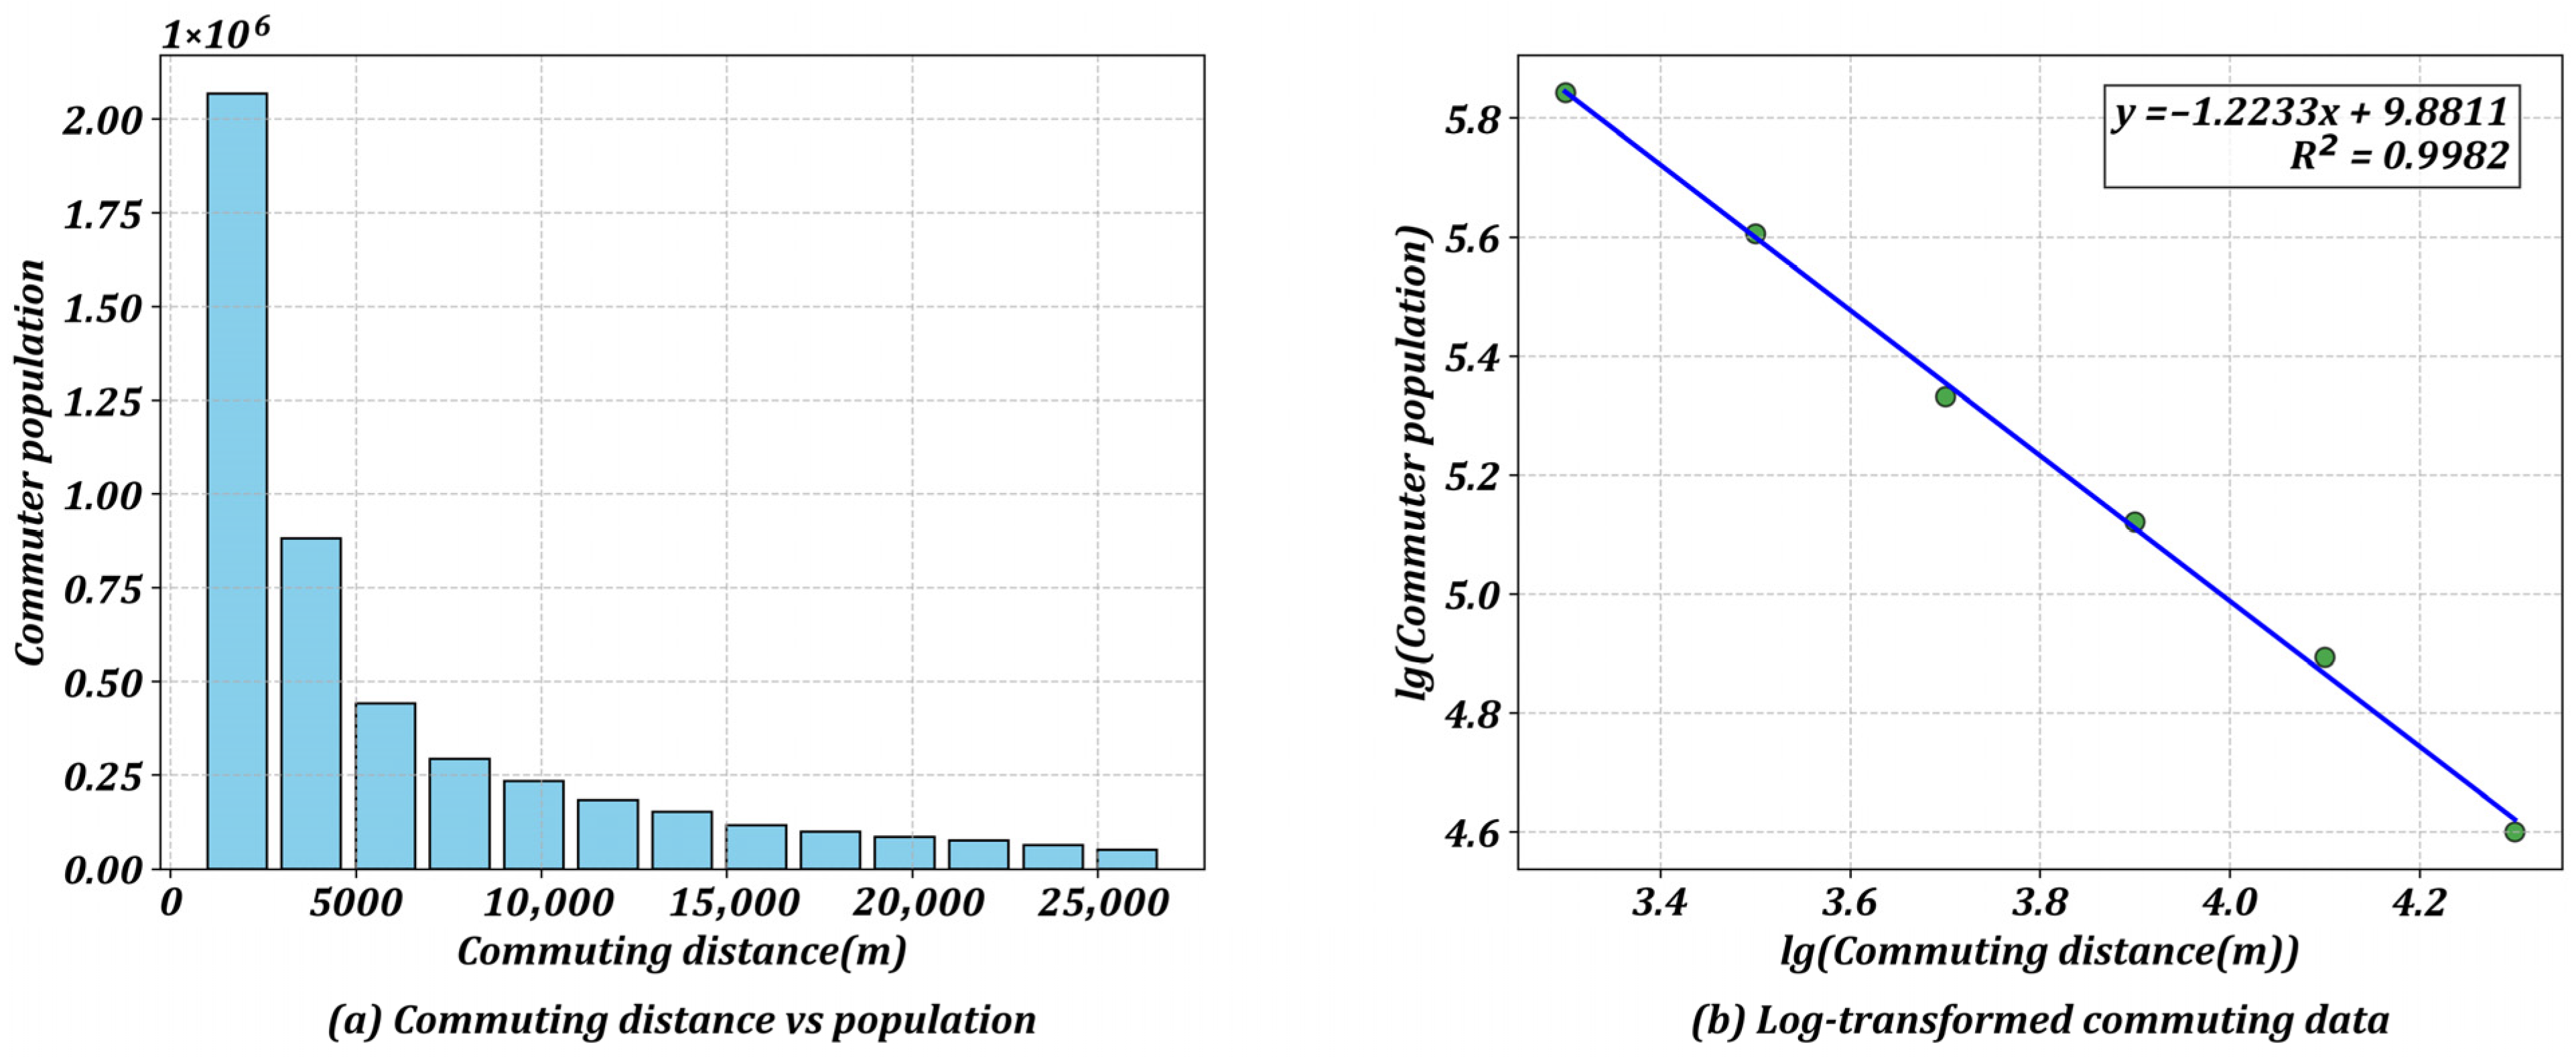
The statistical analysis of the relationship between commuting distance and the number of commuters in Shenzhen reveals a distinct power law distribution, as illustrated in Figure 6. To highlight the underlying relationship, Figure 6a shows the number of commuters plotted against their corresponding travel distances, whereas Figure 6b presents the same data on a log–log scale. The log–log plot demonstrates a strong linear correlation between the two variables, as evidenced by a coefficient of determination (R2) of 0.998. These findings indicate that as the commuting distance increases, the number of commuters decreases in a predictable, nonlinear fashion characteristic of a power law function.
Figure 6.
Examining the relationship between the commuter population and the commuting distance in Shenzhen.
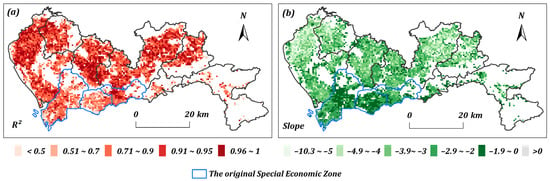
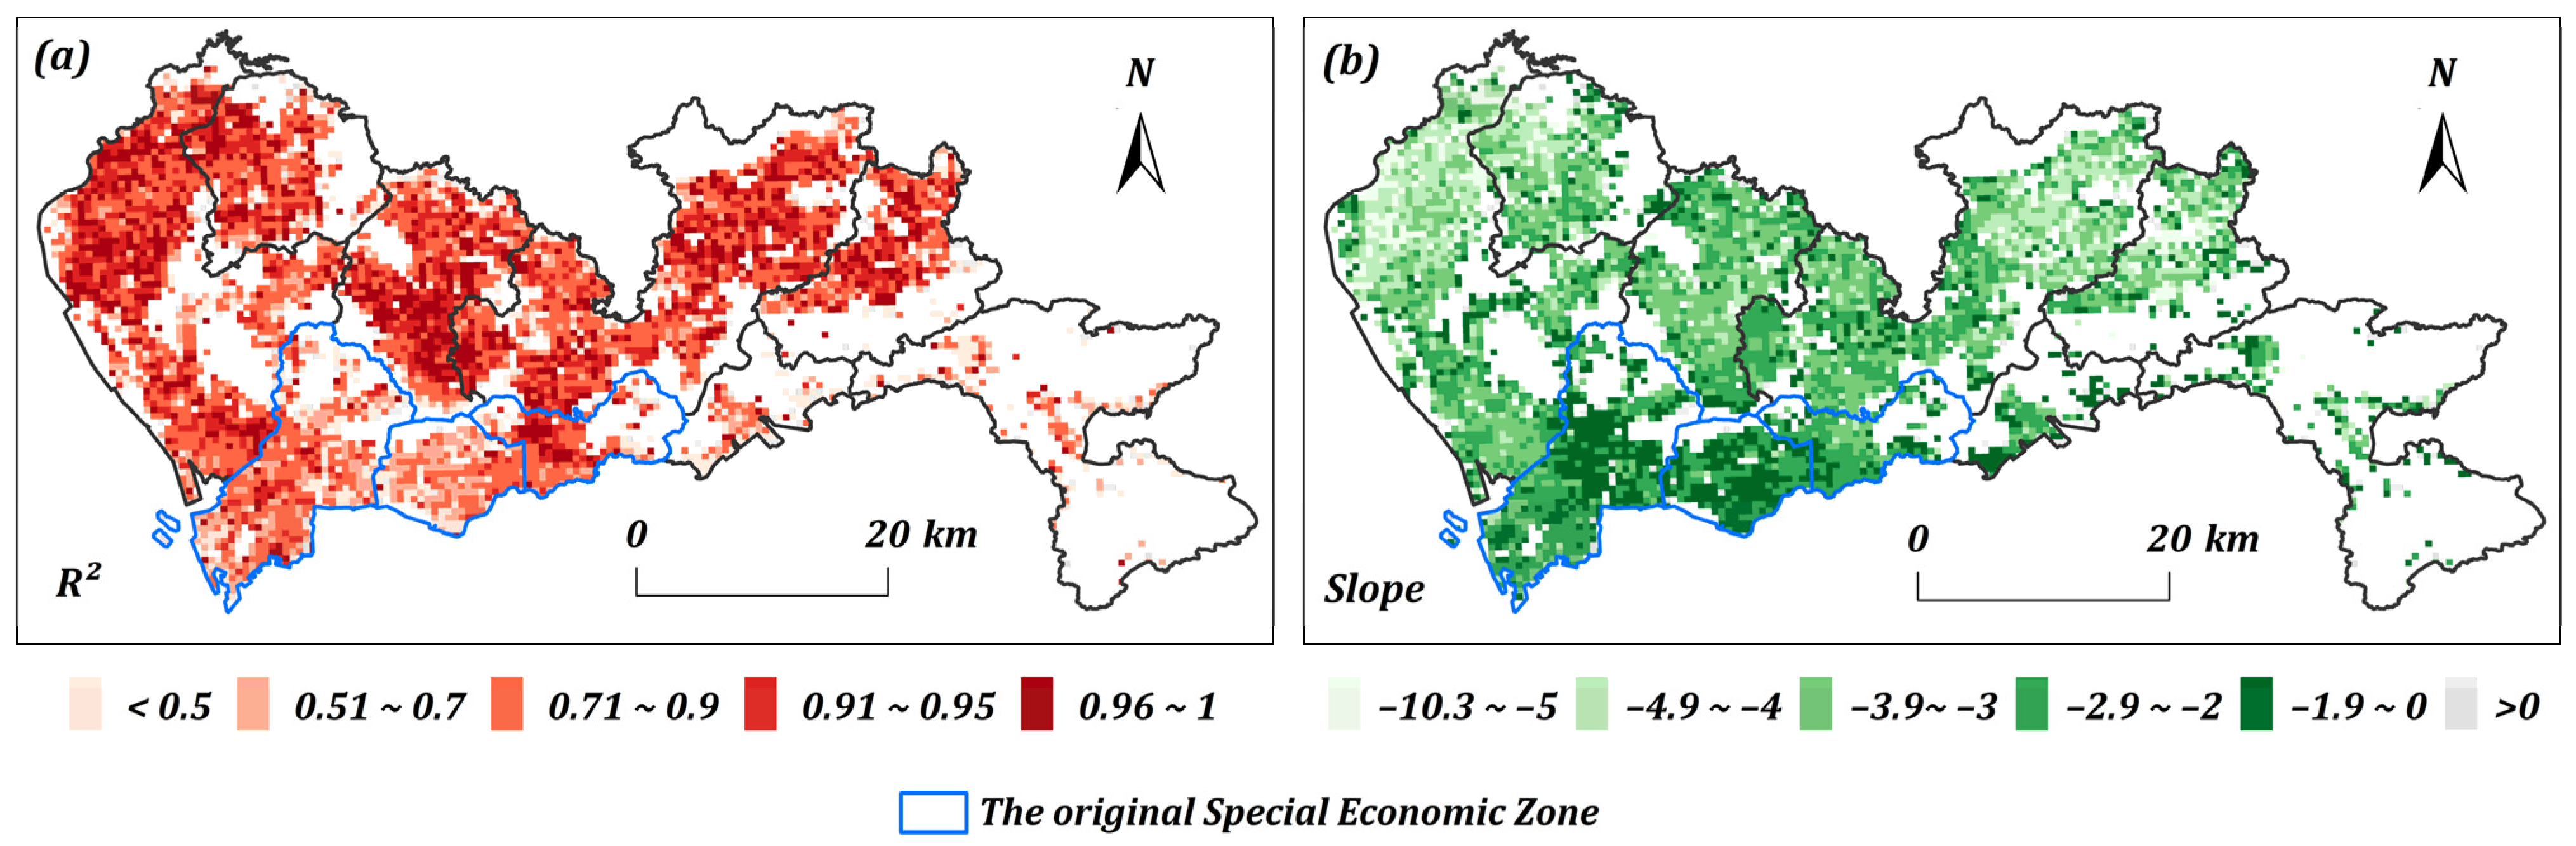
A further analysis at a finer spatial resolution, conducted by applying the same logarithmic transformation to 500 m grid cells, reveals significant regional variations in commuting patterns (Figure 7). The spatial distribution of both the coefficient of determination (R2) and the slope coefficients from the linear regression models demonstrates this heterogeneity. In general, the goodness-of-fit is stronger in areas outside the former Special Economic Zone, where R2 values typically exceed 0.70, than in those within it, which are predominantly above 0.50. Despite these variations, consistent adherence to a distance-decay effect across these microscale geographic units underscores the fundamental influence of distance on commuting behavior throughout Shenzhen.
Figure 7.
Commuting patterns at a 500 m scale in Shenzhen. (a) spatial distribution of R2; (b) spatial distribution of the slope coefficients.
The R2 value in Figure 7a reflects the strength of the power-law relationship between commuter number and distance, with values closer to 1 indicating greater stability; the absolute slope value in Figure 7b reflects the decay rate of employment center attractiveness and is used directly in subsequent optimization models.
4. Method
This section proposes the formulation of a job–housing balance optimization framework that fundamentally shifts from the deterministic assumption of “proximity maximization” to a reality-based integration of empirical commuting patterns. Unlike classical optimization models, which assume that workers invariably select the nearest available employment opportunity, thereby generating unrealistically compact solutions that ignore the “friction of distance”, our approach incorporates the complex, nonlinear regularities of actual human mobility.
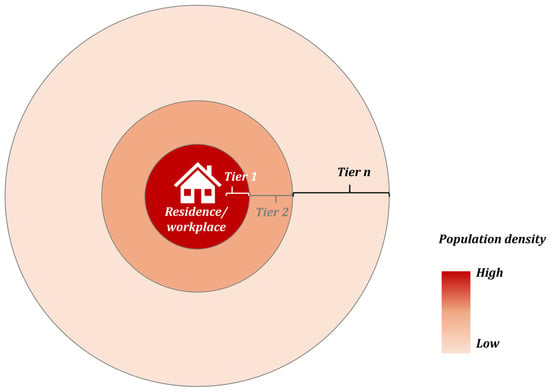
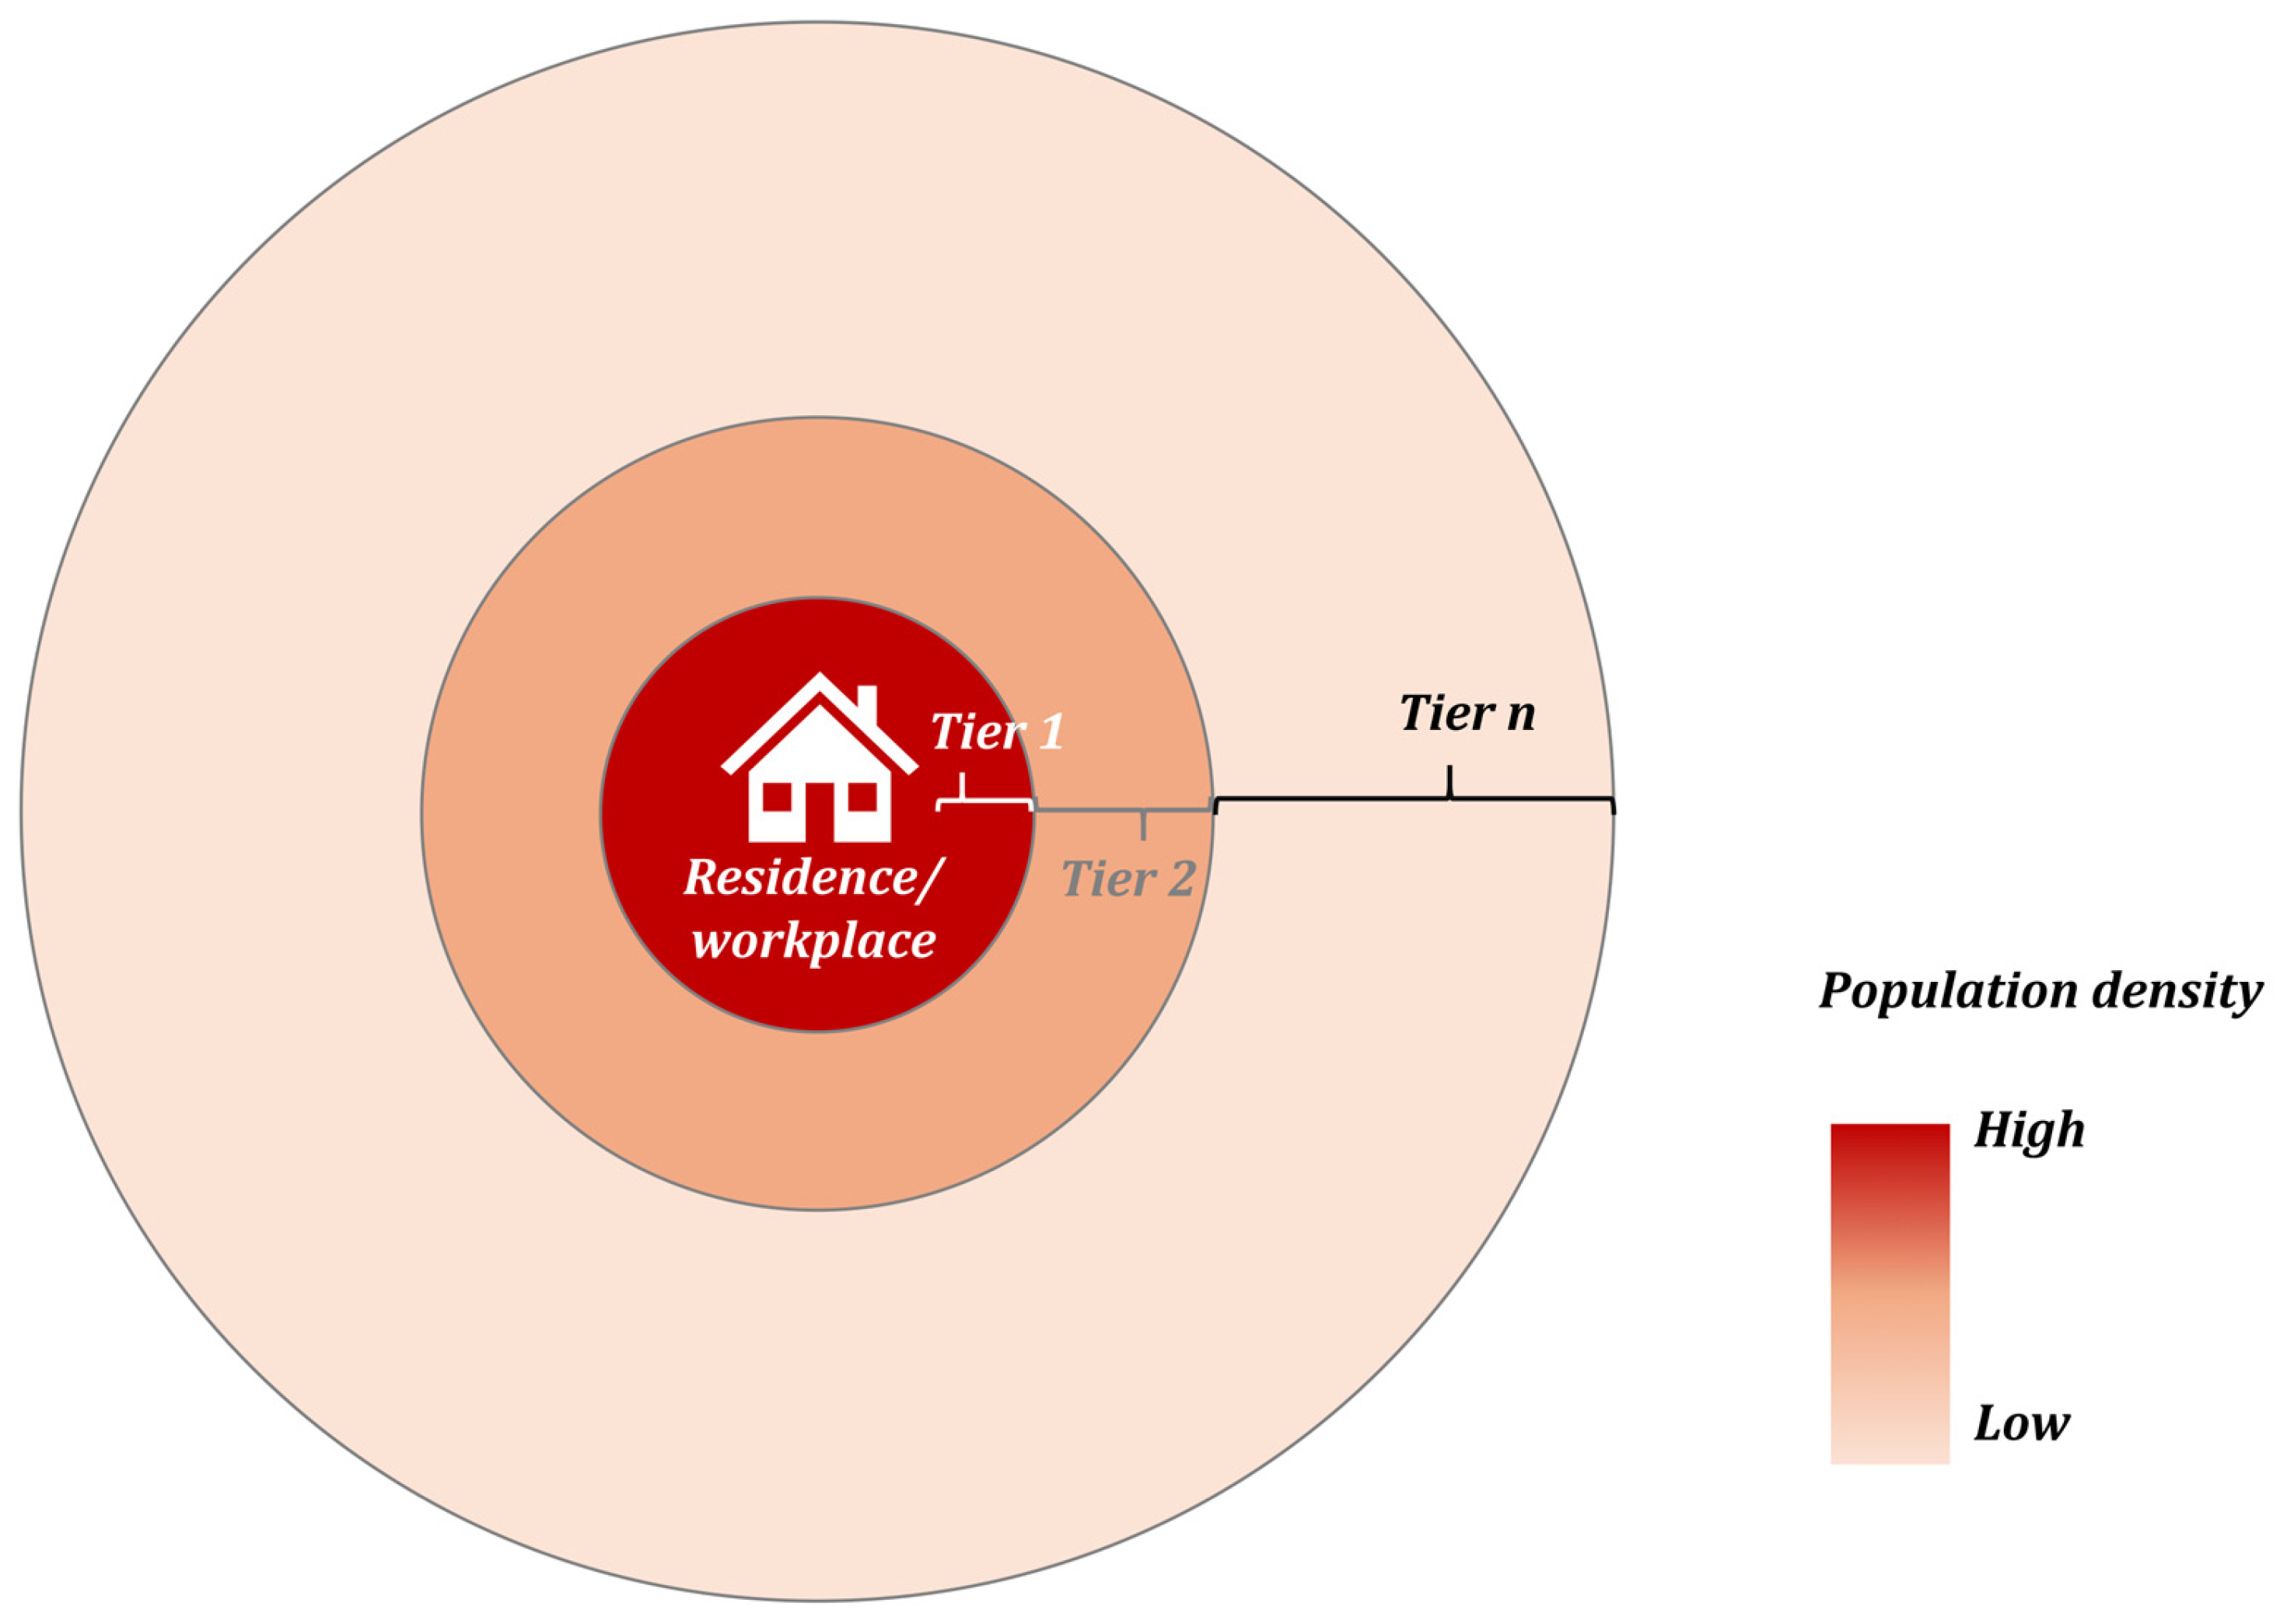
Conceptually, the method is anchored in the observation that urban commuting follows a “heavy-tailed” or power law distribution. To operationalize this behavior within a spatial planning tool, we designed a “commuting ring” structure. Instead of assigning the population solely on the basis of shortest-path distance, the model partitions residential space surrounding employment centers into concentric tiers with the same number of commuters to the employment center on the basis of an observed distance-decay function. As illustrated in the schematic diagram of the commuting patterns (Figure 6), each tier is designed to accommodate 1/n (n is the number of tiers) of the commuting population that mirrors the probability density of real-world travel (Figure 8). This method ensures that the resulting spatial regulation schemes reduce aggregate commuting burdens while respecting the structural necessity of long-distance connectivity inherent in complex metropolitan systems.
Figure 8.
Schematic diagram of the commuting rings in the optimization model.
4.1. Model Framework: Optimization Model Based on the Commuting Ring
To formalize the optimization model, we first introduce the notation used throughout this section. Table 2 summarizes all parameters and decision variables, including indices for residential and workplace locations, population totals, commuting distances, and adjustment bounds.
Table 2.
Glossary of parameters and decision variables.
To operationalize the model, commuter populations are allocated on the basis of the linear regression outputs for each 500 m employment grid cell. The process involves delineating concentric residential rings around each employment point, with each ring designed to contain an equal number of commuters, as determined by the model. Any subsequent adjustments to commuter populations are then distributed uniformly across these rings. This method avoids the oversimplification of proximity-based allocation by ensuring that adjustments reflect the established distance-decay relationship. The objective function and constraints for this integrated job-housing balance model are detailed below:
Minimize:
Subject to:
The model is formulated with residential and employment locations denoted by indices i and j, respectively. The objective function (4) is to minimize the global average commuting distance T resulting from the addition of a new working population p to the existing population W. This optimization is governed by a series of constraints. Constraint (5) ensures that the total commuter outflow from each residential location i equals its original population plus newly allocated commuters . Symmetrically, Constraint (6) mandates that the total commuter inflow to each employment location j matches its original job count plus the sum of new jobs, , which are stipulated to be added equally across its n tiers. System-wide balance is enforced by Constraints (7) and (8), which require that the total number of new commuters and new jobs both sum to the total regional new working population, p. Furthermore, Constraint (9) imposes a nonnegativity condition on all commuter flows. Finally, to ensure realistic outcomes, Constraints (10) and (11) cap the new population () and jobs () at their respective growth upper bounds. These capacity limits prevent the model from generating implausible concentrations of growth that would exceed local land-carrying capacities in pursuit of a theoretical optimum.
4.2. Model Implementation: Capacity and Spatial Constraints
Building on this foundational framework, the model incorporates additional constraints to align with practical planning realities. It prioritizes targeted interventions in high-need areas to optimize limited resources while restricting the magnitude of changes to safeguard the stability of existing communities. For example, to prevent excessive population or job reductions that could lead to the hollowing out of specific areas, lower adjustment limits ( and ) can be introduced for each 500 m grid cell. The specific formulations for incorporating such constraints are outlined below:
Furthermore, to enhance the practical feasibility of the solution and avoid excessively widespread modifications across the entire city, the model can be constrained by limiting the total number of adjustable grids. This is accomplished by introducing binary variables and and Constraints (13) and (14) to determine whether a given residential or employment grid, respectively, is selected for adjustment. The total count of adjusted grids in each category is then restricted by upper limit ratios and which represent the maximum allowable proportion of grids that can be altered. The constraints required to implement this control are formulated as follows:
Additionally, to enhance the practical feasibility of the solution, upper and lower bounds can be established for each individual commuter flow (). This constraint prevents the model from generating solutions in which specific travel corridors become either unrealistically saturated or entirely disused, thereby ensuring that the results remain within the realm of operational reality. The constraints that implement this are specified as follows:
5. Results
This section applies the integrated job–housing and commuting optimization model, incorporating the previously detailed constraints, to a series of specific scenarios. We conduct a case study of Shenzhen at a 500 m grid resolution. To establish valid commuting patterns, linear regression models were first run using 4843 employment locations across the city. Models with nonnegative slopes, which indicate an abnormal relationship, were excluded, resulting in a refined dataset of 4409 locations. Five concentric tiers were subsequently defined around each of these employment locations to delineate their corresponding residential zones. The analysis serves to evaluate the model’s performance, demonstrate its utility for practical planning, and interpret the resulting optimization outcomes. We solve all of the case studies using CPLEX 22.1 on a desktop computer with an Intel Core i7-12700 CPU and 64 GB of RAM. The results are then visualized in ArcMap 10.8.2.
5.1. Job–Housing Balance Optimization for the Current Total Population
The first test assumes that the total population of Shenzhen remains fixed, and we attempt to reconfigure the residential and job distributions to enhance the job–housing balance. To better approximate real-world applications, we introduce a constraint to moderate population variance across residential grids relative to the citywide average. For grids where the residential population already meets or exceeds this average, adjustments are constrained to a fluctuation of ±30% of the current value. Conversely, for grids with populations below the average, the number of residents is permitted to increase up to the citywide average, whereas its lower bound is set at 80% of the current value. To avoid theoretically optimal yet disruptive city-wide reallocations, these adjustments are applied to a maximum of 30% of the city’s total employment or residential grids.
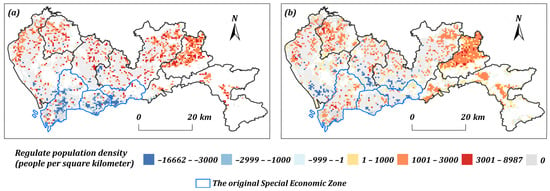
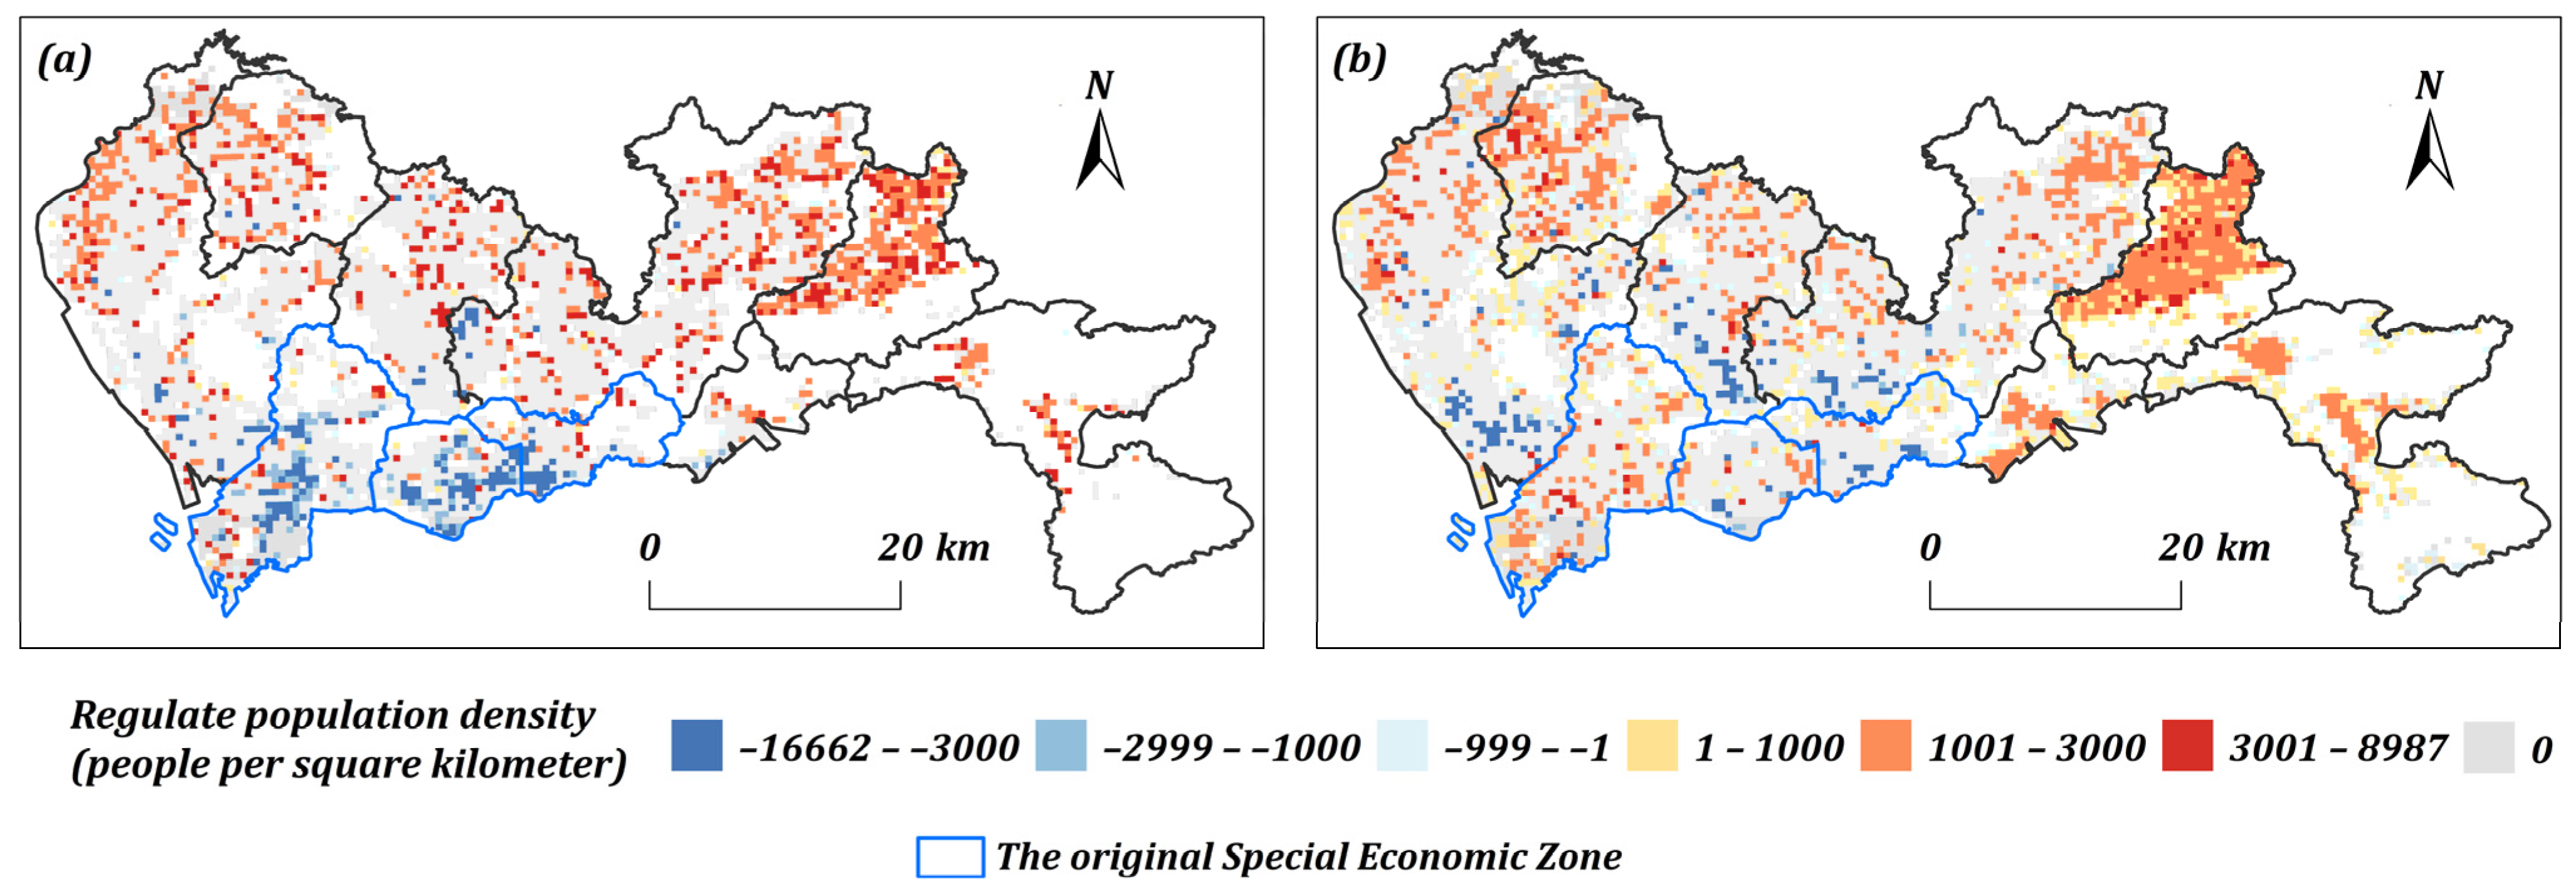
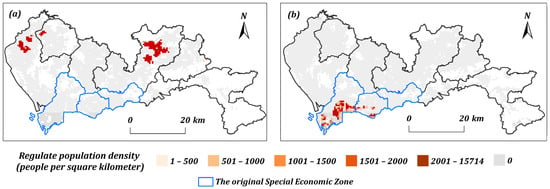
Figure 9 illustrates the spatial reorganization of employment and residential densities prescribed by the optimized job–housing balance model. For employment locations (Figure 9a), the model mandates job density reductions in the historic urban core (Guannei) and adjacent inner-suburban areas, including southern Bao’an, southern Longhua, and western Longgang. Concurrently, job density is increased in the city’s outer periphery. A parallel trend is observed for residential locations (Figure 9b), with population density decreases occurring across southern Bao’an, southern Longhua, western and southern Longgang, and portions of the urban core. Conversely, increases in residential density are predominantly allocated to peripheral regions, complemented by smaller-scale additions in the Nanshan and Futian districts. In aggregate, these adjustments achieve comprehensive citywide coverage, fostering a decentralized spatial pattern rather than concentrating development in isolated zones.
Figure 9.
Adjustment scheme of the commuting population density for employment and residential areas in each 500 m grid under the improved integrated commuting behavior pattern model (where (a) represents workplace; (b) represents residence).
5.2. Job–Housing Balance Optimization for an Additional 50,000 Commuters
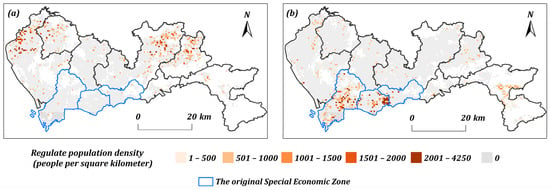
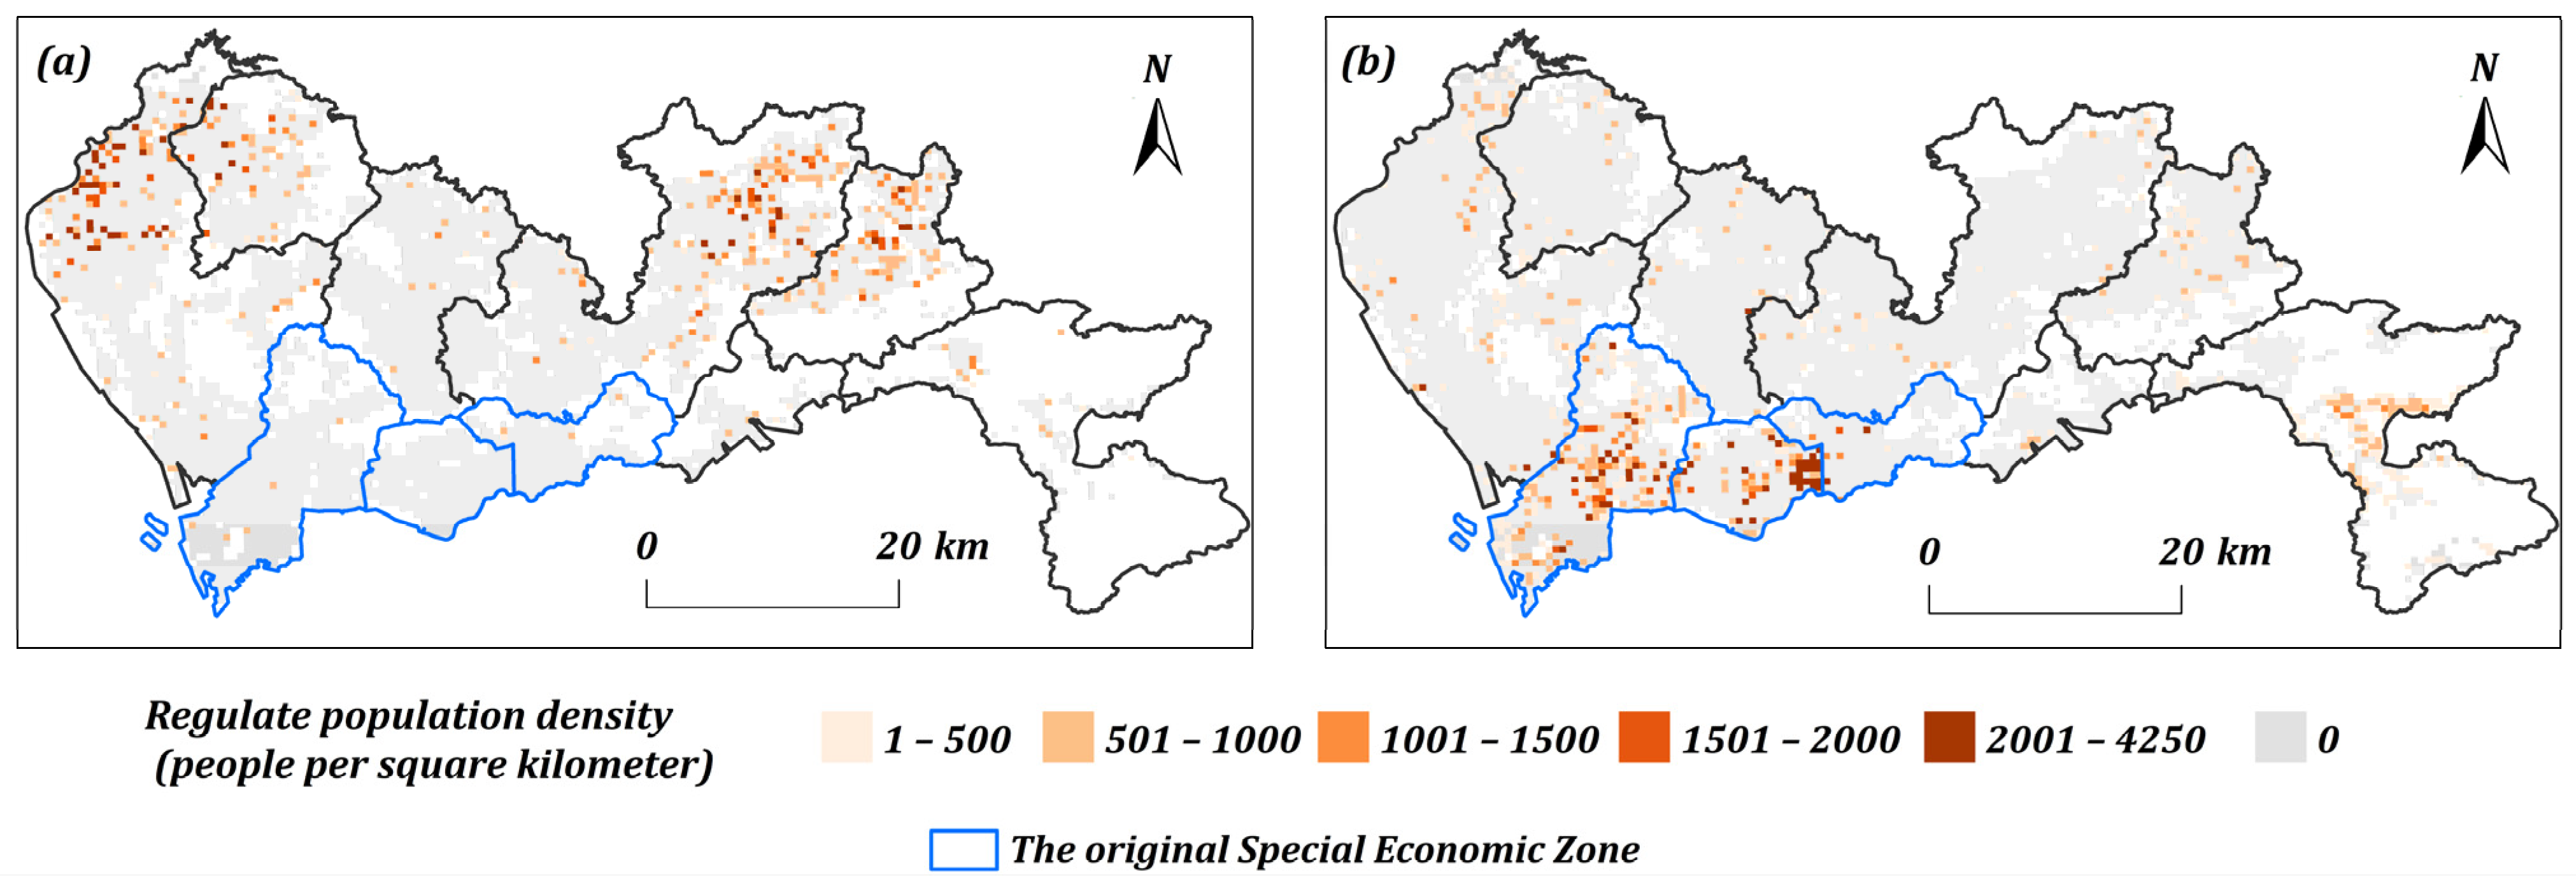
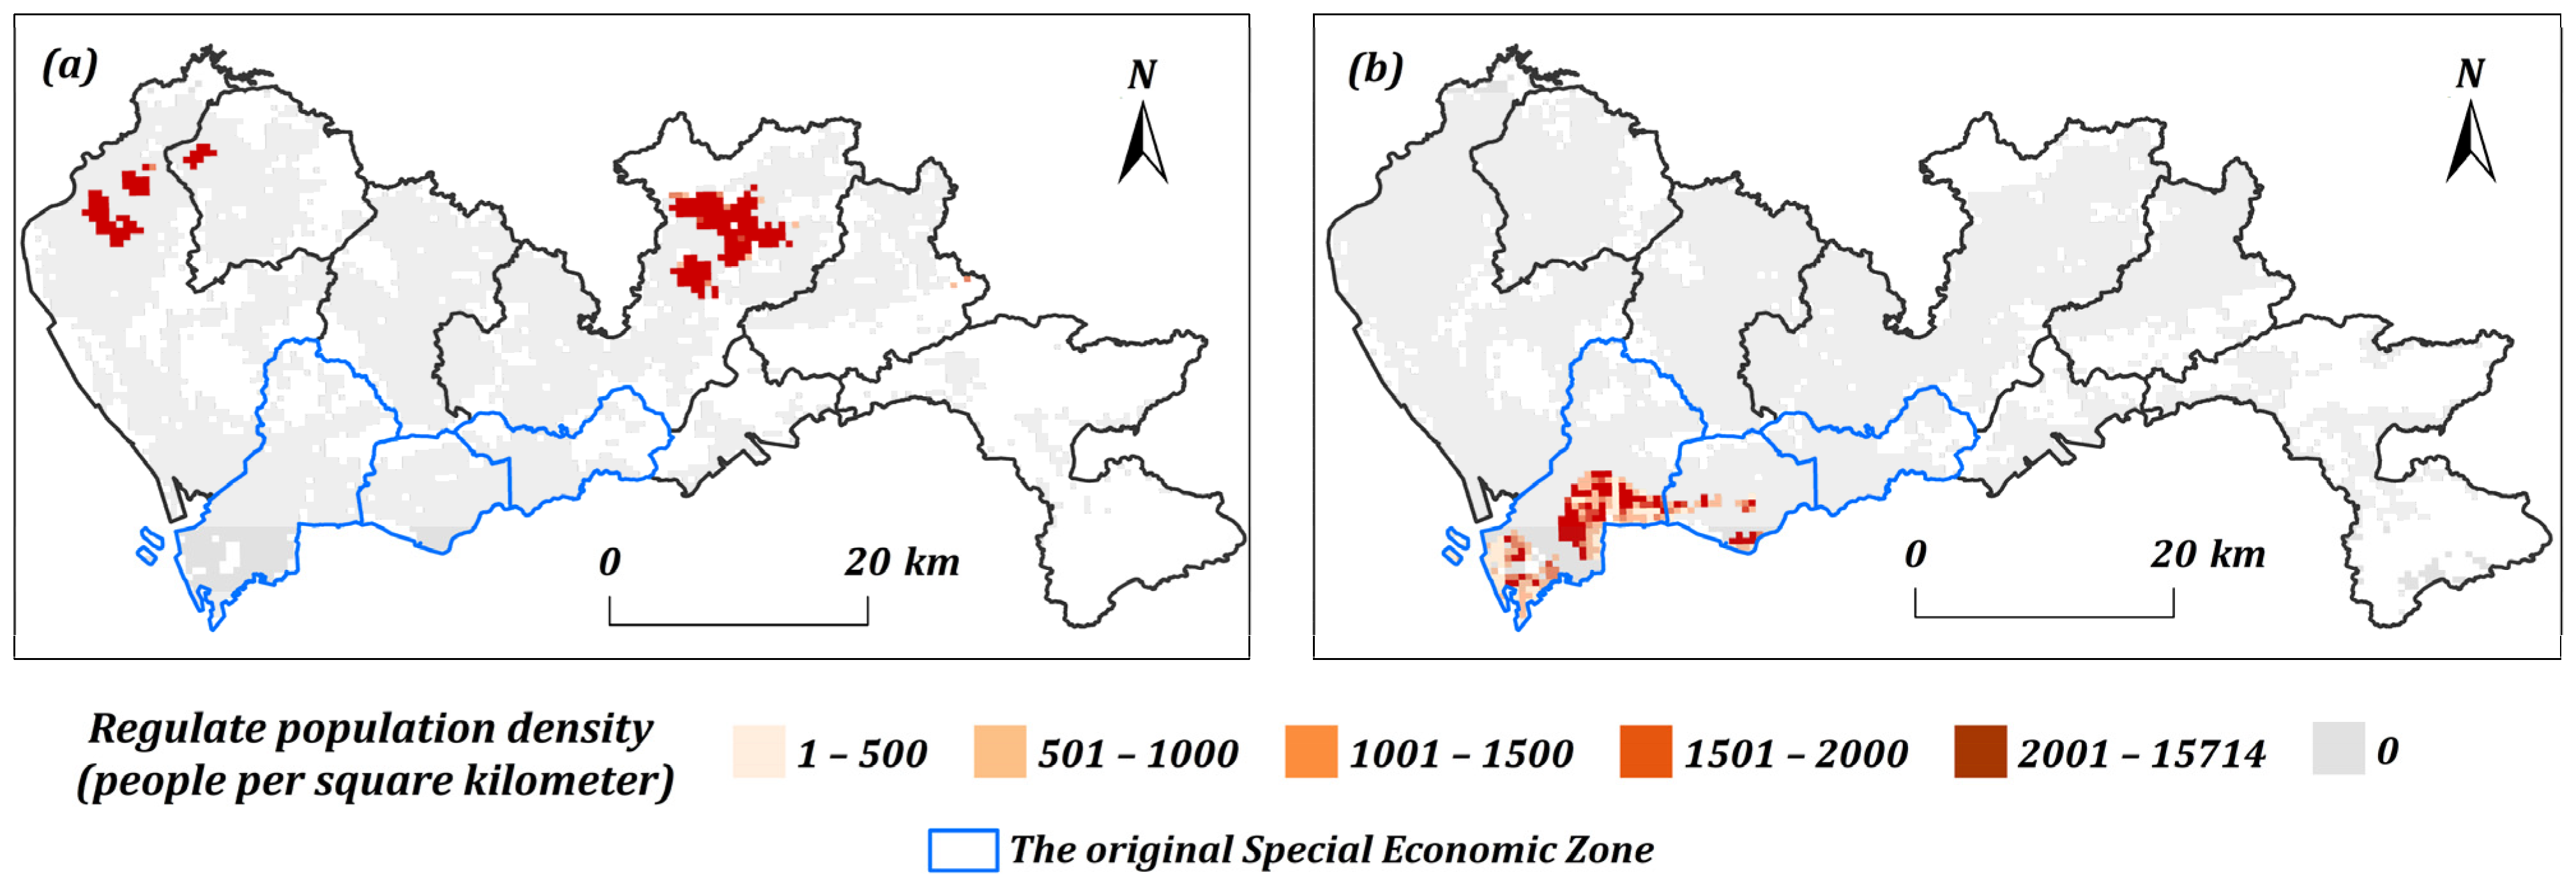
The second test assumes that Shenzhen has 50,000 additional commuters, and we try to find the best places for additional living and working. The optimization results reveal a distinct spatial dichotomy in the allocation of new jobs and residences (Figure 10). On the employment side, new jobs are channeled predominantly to peripheral “Guanwai” areas, strategically capitalizing on regions with a greater supply of available housing (Figure 10a). Conversely, new residents are concentrated within the established urban core (“Guannei”), thereby densifying the population around major employment hubs (Figure 10b). This complementary spatial strategy effectively curtails the need for long-distance travel and mitigates overall commuting burdens.
Figure 10.
Commuting population density adjustment scheme for employment and residential areas based on the integrated commuting behavior pattern model in Shenzhen (where (a) represents workplace; (b) represents residence).
We also conduct a comparative test based on the optimal growth distribution model with the same parameter settings. Adhering to the principle of “proximity-based allocation,” the model attempts to minimize commuting distances through spatial reconfiguration. The adjustments to the employment and residential distribution for Shenzhen’s commuting population are shown in Figure 11. It exhibits a distinct spatial complementarity characterized by “supplementing jobs in the former outer districts and supplementing housing in the former inner districts.”
Figure 11.
Commuting population density adjustment for employment and residential areas based on the optimal growth distribution model in Shenzhen (where (a) represents workplace; (b) represents residence).
Specifically, regarding employment adjustment, all newly added job positions were allocated to the former outer districts (predominantly in northern Longgang, northern Bao’an, and western Guangming). This strategy aims to leverage the abundant existing housing stock in these areas to enable residents to work locally. Conversely, in terms of residential adjustment, new housing spaces were concentrated entirely within the former inner districts (mainly in southeastern/southern Nanshan and central/southern Futian). This approach seeks to shorten the travel radius for long-distance commuters by increasing the housing supply within core employment centers. The spatial layout of the additional residents and jobs is clustered in very few locations, which is distinctively different from the dispersed patterns generated by our proposed model.
However, this idealized adjustment scheme deviates significantly from reality and struggles to resolve the job–housing balance issue effectively at the city-wide level. Influenced by factors such as industrial agglomeration effects and the prevalence of dual-income households, employment types are spatially uneven, and cross-district commuting is practically unavoidable. Merely increasing job positions in the former outer districts fails to meet actual matching demands for employment. In addition, although the former inner districts possess well-developed public services, high housing prices exceed the affordability threshold of most commuters. Solely increasing the housing stock in core areas such as Nanshan and Futian alleviates the challenges associated with commuting only for a minority of high-income groups. It fails to benefit the vast low- to middle-income commuting population, thereby limiting the model’s effectiveness in practical applications.
6. Discussion
The central contribution of this study lies in its departure from the deterministic tradition of “proximity maximization” that has long dominated the optimization of the job–housing balance. Classical models often treat a city as a frictionless surface or an isotropic plane upon which agents inevitably seek the nearest opportunity. However, our empirical analysis of Shenzhen confirms that urban mobility follows a “heavy-tailed” power law distribution. These findings align with complexity theory, suggesting that commuting is a scale-free phenomenon in which long-distance travel is not merely an anomaly to be eradicated but actually a structural characteristic of the metropolitan system.
By integrating this log-linear principle into the optimization framework, we bridge the gap between normative planning ideals (what planners want people to do) and behavioral realities (what people actually do). The proposed model acknowledges that although the friction of distance operates universally, it does not preclude long-range connectivity. Consequently, the resulting spatial regulation schemes—decentralizing employment to the periphery while densifying residential zones in the core—offer a more resilient strategy than the rigid proximity-based allocations seen in the optimal growth distribution model, which produced theoretically compact but operationally brittle outcomes.
Although the model provides a robust mathematical skeleton for spatial optimization, we must critically examine the socioeconomic status of this framework. The current formulation abstracts from individual heterogeneity, reducing the complex decision-making matrix of housing and employment to a function of distance and density. In reality, the “friction of distance” is highly stratified by socioeconomic status.
Shenzhen is characterized by significant structural disparities between registered and nonregistered residents, and the housing market drives a wedge between the “theoretical” optimal home and the “affordable” one. The proximity-based model’s failure in the comparative test, concentrating new housing in the high-cost districts of Nanshan and Futian, highlights a critical geographic truth: spatial accessibility does not equal economic accessibility. Simply increasing the housing stock in the core without addressing affordability merely benefits a minority of high-income groups, failing to alleviate the commuting burden for the vast low- to middle-income workforce. Therefore, future iterations of this model must treat the city not only as a set of coordinates but also as a landscape of varying land values and housing typologies.
From a methodological standpoint, the use of a distance-decay function to partition residential areas into “commuting rings” represents a significant advancement in discretizing the urban continuum. However, the model’s reliance on static constraints, limiting population adjustments to 30% or deviations from the mean, serves as a proxy for land carrying capacity rather than a true measure of it. In the context of “stock optimization” (optimizing existing urban footprints), simply assigning a mathematical upper bound to density risks ignoring the physical limitations of infrastructure and the “soft” constraints of public service provision, such as school districts and medical accessibility. Although the model does not incorporate detailed land use parameters explicitly, it captures urban polycentricity through spatially heterogeneous commuting patterns and sets adjustment caps to reflect land carrying capacity. Future work will integrate planning elements such as strategic development axes and subcenter policies to enhance policy relevance.
Furthermore, the model assumes an inverse double-logarithmic relationship across all 500 m grid cells. Although the R2 values were generally high, regional heterogeneity exists, particularly between the mature urban core and the developing periphery. This situation suggests that the “laws” of commuting may vary depending on the maturity of the urban context. A “one-size-fits-all” power law may need to be refined into piecewise functions to account for these local deviations.
Beyond the spatial heterogeneity of the distance-decay function, several additional limitations should be acknowledged. First, although the model leverages a globally fitted power-law relationship (R2 = 0.998), it does not explore the sensitivity of optimal allocations to alternative decay specifications. Owing to data sparsity at the local level, we were unable to calibrate segmented or neighborhood-specific functions, which may lead to suboptimal adjustments in areas where commuting behavior deviates from the citywide pattern. Second, the framework simplifies the transport system by assuming a uniform impedance surface and using distance as the sole cost metric. Although necessitated by the lack of multimodal trip data in the current dataset, this abstraction overlooks the role of transit accessibility, road hierarchies, and—crucially—commuting time, which often matters more for travelers than raw distance does. Third, the analysis does not differentiate among industrial sectors. The commuting data from the Baidu Huiyan platform lacks attributes on occupation or industry, preventing us from capturing systematic differences in travel behavior between, for example, manufacturing workers and high-tech employees, differences that are rooted in income levels, shift schedules, and location preferences. Finally, the optimization focuses exclusively on jobs and housing, omitting other essential urban functions such as education, health care, and leisure. This narrow scope is deliberate, as the study prioritizes the core issue of commuting efficiency; however, it neglects the multipurpose nature of daily travel. Future research should integrate service facility data to align with holistic planning concepts such as the “15 min city,” thereby transforming the current spatial optimization into a more comprehensive tool for creating livable, complete neighborhoods. A further limitation of this study is the lack of model validation and direct comparison of the optimization results with actual commuting data. This shortfall is primarily constrained by the unavailability of suitable real-world datasets at this stage.
Finally, the optimization results strongly support a shift toward a polycentric urban structure. The model consistently prescribed the decentralization of employment functions to peripheral areas (Guanwai). This is not merely a mathematical output but a geographical imperative for Shenzhen, where the historical monocentric focus on the Special Economic Zone has created acute congestion and spatial mismatch. By confirming that peripheral employment centers can be viable if they respect the natural commuting tolerance of the workforce, this study provides scientific support for the development of “subcenters” rather than isolated “sleeper towns” as the former are functionally integrated.
In summary, although this study successfully formulated the trade-off between aggregate efficiency and individual behavioral liberty, the next frontier in this research lies in moving from “spatial optimization” to “multidimensional spatial justice.” Doing so entails integrating economic data (housing prices and income levels) and dynamic feedback loops to ensure that the optimized city is not only efficient in terms of kilometers traveled but also equitable in terms of opportunities accessed.
7. Conclusions
This study introduces a job–housing optimization model grounded in empirical commuting behaviors and validates its utility across multiple predefined scenarios with varying constraints. When applied to the city of Shenzhen at a 500 m grid resolution, the model successfully generated distinct, optimized spatial configurations for each scenario. The resulting solutions are not only plausible and consistent with established principles of urban development but also demonstrate considerable practical feasibility. Consequently, the model provides urban planning and transportation authorities with a robust, data-driven tool for formulating targeted interventions and informing scientific decision-making.
This study provides a foundation for several promising future research avenues. The present work is based on a static, single-year (2024) dataset; subsequent research could employ longitudinal data, such as commuting records from 2015 to 2024, to trace the evolutionary dynamics of the job–housing relationship and thereby enhance the model’s predictive power. Furthermore, the optimization function could be expanded beyond its current focus on minimizing commuting distance. Future iterations could construct a more comprehensive cost function by integrating variables such as housing prices, enterprise locations, and land use classifications to account for factors such as rent, travel time, and opportunity costs. Finally, incorporating more granular datasets, such as mobile phone signaling and public transit records, would allow the model to capture complex travel behaviors, including multipurpose commuting chains (e.g., circuitous trips for school drop-offs), thus improving significantly the empirical grounding and verisimilitude of optimization outcomes.
Author Contributions
Conceptualization, Shuyan Yang and Wangshu Mu; methodology, Shuyan Yang and Wangshu Mu; writing—original draft preparation, Yuhong Bai; writing—review and editing, Yuhong Bai, Changfeng Li and Wangshu Mu; visualization, Yuhong Bai; funding acquisition, Wangshu Mu. All authors have read and agreed to the published version of the manuscript.
Funding
This research was funded by the National Key R&D Program of China (Grant No. 2022YFC3800105).
Data Availability Statement
Dataset available on request from the authors.
Acknowledgments
We would like to thank the Center for Geodata and Analysis, Faculty of Geographical Science, Beijing Normal University, for their high-performance computing support.
Conflicts of Interest
The authors declare no conflicts of interest.
References
- Fang, C.; Yu, D. Urban agglomeration: An evolving concept of an emerging phenomenon. Landsc. Urban Plan. 2017, 162, 126–136. [Google Scholar] [CrossRef] [Scilit]
- Guo, M.; Luo, D.; Liu, C. City civilization, employment creation and talent agglomeration: Empirical evidence from “National Civilized City” policy in China. China Econ. Rev. 2024, 87, 102215. [Google Scholar] [CrossRef] [Scilit]
- Wey, W.-M.; Zhang, H.; Chang, Y.-J. Alternative transit-oriented development evaluation in sustainable built environment planning. Habitat Int. 2016, 55, 109–123. [Google Scholar] [CrossRef] [Scilit]
- Lee, H.; Jacoby, N.; Hennequin, R.; Moussallam, M. Mechanisms of cultural diversity in urban populations. Nat. Commun. 2025, 16, 5192. [Google Scholar] [CrossRef] [Scilit] [PubMed]
- Cheng, J.; Chen, M.; Tang, S. Shenzhen—A typical benchmark of Chinese rapid urbanization miracle. Cities 2023, 140, 104421. [Google Scholar] [CrossRef] [Scilit]
- Ding, C.; He, X.; Zhu, Y. Megacity Growth, City System and Urban Strategy. Chin. J. Urban Environ. Stud. 2022, 10, 2250001. [Google Scholar] [CrossRef] [Scilit]
- Li, H.; Chen, P.; Grant, R. Built environment, special economic zone, and housing prices in Shenzhen, China. Appl. Geogr. 2021, 129, 102429. [Google Scholar] [CrossRef] [Scilit]
- Luo, Q.; Li, Z.; Li, Y.; Yang, Y.; Liu, J.; Liu, G.; Wu, H. Spatial disparities of population aging in Shenzhen: From China’s Hukou perspective. Front. Public Health 2025, 13, 1614007. [Google Scholar] [CrossRef] [Scilit]
- Xiao, W.; Wei, D.; Li, H. Understanding jobs-housing imbalance in urban China: A case study of Shanghai. J. Transp. Land Use 2021, 14, 89–415. [Google Scholar] [CrossRef] [Scilit]
- Wu, B.S.; Chieh, T.-C. Visualization of commuting areas and examination of jobs-housing balance with the adoption of excess commuting. Cities 2025, 156, 105541. [Google Scholar] [CrossRef] [Scilit]
- Ta, N.; Zhao, Y.; Chai, Y. Built environment, peak hours and route choice efficiency: An investigation of commuting efficiency using GPS data. J. Transp. Geogr. 2016, 57, 161–170. [Google Scholar] [CrossRef] [Scilit]
- Howard, E. Garden Cities of Tomorrow; Swan Sonnenschein & Co., Ltd.: London, UK, 1902. [Google Scholar]
- Saarinen, E. The City. Its Growth. Its Decay. Its Future; Reinhold Publishing Corporation: New York, NY, USA, 1945. [Google Scholar]
- Mumford, L. The Urban Prospect; Harcourt, Brace & World: New York, NY, USA, 1968; p. 255. [Google Scholar]
- Irani, M. Experiences, characteristics, and features of developing new towns between 1898 and 1970. Eur. J. Geogr. 2022, 13, 75–96. [Google Scholar] [CrossRef] [Scilit]
- Phelps, N.A.; Ohashi, H. Edge City Denied? The Rise and Fall of Tokyo’s Outer Suburban “Business Core Cities”. J. Plan. Educ. Res. 2020, 40, 379–391. [Google Scholar] [CrossRef] [Scilit]
- Hedman, L. The development of Helsinki metropolitan area and its future prospects. Cities 1989, 6, 289–293. [Google Scholar] [CrossRef] [Scilit]
- Cervero, R. Jobs-Housing Balancing and Regional Mobility. J. Am. Plan. Assoc. 1989, 55, 136–150. [Google Scholar] [CrossRef] [Scilit]
- Alonso, W. Location and Land Use: Toward a General Theory of Land Rent; Harvard University Press: Cambridge, MA, USA, 1964. [Google Scholar]
- Kain, J.F. Housing Segregation, Negro Employment, and Metropolitan Decentralization. Q. J. Econ. 1968, 82, 175–197. [Google Scholar] [CrossRef] [Scilit]
- Hamilton, B.W.; Röell, A. Wasteful Commuting. J. Political Econ. 1982, 90, 1035–1053. [Google Scholar] [CrossRef] [Scilit]
- Bray, D. Social Space and Governance in Urban China: The Danwei System from Origins to Reform; Stanford University Press: Redwood City, CA, USA, 2005. [Google Scholar]
- Wang, Y.P.; Murie, A. Commercial Housing Development in Urban China. Urban Stud. 1999, 36, 1475–1494. [Google Scholar] [CrossRef] [Scilit]
- Hu, X.; Kaplan, D.H. The Emergence of Affluence in Beijing: Residential Social Stratification in China’s Capital City. Urban Geogr. 2001, 22, 54–77. [Google Scholar] [CrossRef] [Scilit]
- Peng, Z.-R. The Jobs-Housing Balance and Urban Commuting. Urban Stud. 1997, 34, 1215–1235. [Google Scholar] [CrossRef] [Scilit]
- Horner, M.W.; Marion, B.M. A Spatial Dissimilarity-based Index of the Jobs-Housing Balance: Conceptual Framework and Empirical Tests. Urban Stud. 2009, 46, 499–517. [Google Scholar] [CrossRef] [Scilit]
- Layman, C.C.; Horner, M.W. Comparing Methods for Measuring Excess Commuting and Jobs-Housing Balance. Transp. Res. Rec. J. Transp. Res. Board 2010, 2174, 110–117. [Google Scholar] [CrossRef] [Scilit]
- Murphy, E.; Killen, J.E. Commuting Economy: An alternative Approach for Assessing Regional Commuting Efficiency. Urban Stud. 2011, 48, 1255–1272. [Google Scholar] [CrossRef] [Scilit]
- Zhang, P.; Zhou, J.; Zhang, T. Quantifying and visualizing jobs-housing balance with big data: A case study of Shanghai. Cities 2017, 66, 10–22. [Google Scholar] [CrossRef] [Scilit]
- Kang, L.; Liu, C.; Ma, X. How does geographical environment affect residents’ perception of social justice: An empirical study from low-income communities in Beijing. Cities 2025, 156, 105531. [Google Scholar] [CrossRef] [Scilit]
- Long, Y.; Thill, J.-C. Combining smart card data and household travel survey to analyze jobs–housing relationships in Beijing. Comput. Environ. Urban Syst. 2015, 53, 19–35. [Google Scholar] [CrossRef] [Scilit]
- Zheng, Z.; Zhou, S.; Deng, X. Exploring both home-based and work-based jobs-housing balance by distance decay effect. J. Transp. Geogr. 2021, 93, 103043. [Google Scholar] [CrossRef] [Scilit]
- Zhou, X.; Sun, C.; Niu, X.; Shi, C. The modifiable areal unit problem in the relationship between jobs–housing balance and commuting distance through big and traditional data. Travel Behav. Soc. 2022, 26, 270–278. [Google Scholar] [CrossRef] [Scilit]
- Castellani, B.; Rajaram, R. Past the power law: Complex systems and the limiting law of restricted diversity. Complexity 2016, 21, 99–112. [Google Scholar] [CrossRef] [Scilit]
- Yamashita, A.; Rothlein, D.; Kucyi, A.; Valera, E.M.; Germine, L.; Wilmer, J.; DeGutis, J.; Esterman, M. Variable rather than extreme slow reaction times distinguish brain states during sustained attention. Sci. Rep. 2021, 11, 14883. [Google Scholar] [CrossRef] [Scilit]
- Carra, G.; Mulalic, I.; Fosgerau, M.; Barthelemy, M. Modelling the relation between income and commuting distance. J. R. Soc. Interface 2016, 13, 20160306. [Google Scholar] [CrossRef] [Scilit]
- Schläpfer, M.; Dong, L.; O’Keeffe, K.; Santi, P.; Szell, M.; Salat, H.; Anklesaria, S.; Vazifeh, M.; Ratti, C.; West, G.B. The universal visitation law of human mobility. Nature 2021, 593, 522–527. [Google Scholar] [CrossRef] [Scilit] [PubMed]
- Zacharias, J.; Tang, Y. Restructuring and repositioning Shenzhen, China’s new mega city. Prog. Plan. 2010, 73, 209–249. [Google Scholar] [CrossRef] [Scilit]
- Li, B.; Jin, C.; Jansen, S.J.T.; van der Heijden, H.; Boelhouwer, P. Residential satisfaction of private tenants in China’s superstar cities: The case of Shenzhen, China. Cities 2021, 118, 103355. [Google Scholar] [CrossRef] [Scilit]
- Zhou, X.; Chen, X.; Zhang, T. Impact of Megacity Jobs-Housing Spatial Mismatch on Commuting Behaviors: A Case Study on Central Districts of Shanghai, China. Sustainability 2016, 8, 122. [Google Scholar] [CrossRef] [Scilit]
- Kan, C.; Yan, H.; Xiang, W.; Wan, T.; Fu, L. Mining commuter characteristics using internet-based location data. Urban Plan. Forum 2020, 61–67. [Google Scholar] [CrossRef]

Disclaimer/Publisher’s Note: The statements, opinions and data contained in all publications are solely those of the individual author(s) and contributor(s) and not of MDPI and/or the editor(s). MDPI and/or the editor(s) disclaim responsibility for any injury to people or property resulting from any ideas, methods, instructions or products referred to in the content. |
© 2026 by the authors. Published by MDPI on behalf of the International Society for Photogrammetry and Remote Sensing. Licensee MDPI, Basel, Switzerland. This article is an open access article distributed under the terms and conditions of the Creative Commons Attribution (CC BY) license.