


Abstract
With accelerating global urbanization and increasingly diverse demands for public spaces, promoting urban low-carbon transitions and enhancing residents’ quality of life have become central missions of modern urban development. As one of the city’s primary arteries, streets—through their green landscapes, slow-moving transportation systems, and public facilities—play an indispensable role in reducing carbon emissions, promoting healthy living, and improving residents’ well-being. In this study, the Yubei District of Chongqing was selected as the research area, and an automated evaluation framework was proposed for street visual quality, based on multi-source street view data and ensemble learning. PSP-Net semantic segmentation model was employed to extract eight key visual indicators from street view images, including green view index, Visual Entropy (Entropy), sky view factor (SVF), drivable space, sidewalk, safety facilities, buildings, and enclosure. Based on these features, a Stacking-based ensemble learning model was constructed, integrating multiple base models such as Random Forest, XGBoost, and LightGBM, with Linear Regression as the meta-learner, to predict street visual quality. The results demonstrate that the ensemble model significantly outperforms any single model, achieving a correlation coefficient (r) of 0.77 and effectively capturing the complex perceptual features of street environments. This study provides a reliable, intelligent, and quantitative method for large-scale evaluation of urban street visual quality, while supplying data support and decision-making references for street renewal and spatial optimization.
1. Introduction
As the backbone of urban public space, streets serve the functions of transportation, commerce, and fostering social interaction, making them a vital source of urban vitality. The quality of street space directly impacts residents’ convenience, comfort, and well-being. With urban development and spatial restructuring, the visual quality and spatial attributes of streets have undergone significant changes, gradually revealing geographical and social imbalances [1,2,3,4,5,6]. High visual quality in streets—such as tidy interfaces, pleasant greenery, harmonious architectural styles, and vibrant street life—can significantly enhance residents’ psychological comfort and social well-being, thereby strengthening place identity and community cohesion [7,8,9,10,11,12,13,14,15,16,17]. Therefore, it is of great significance to establish an objective and efficient assessment system for street visual quality for urban planning and spatial governance.
Research on the visual quality of street spaces began to emerge in the 1960s [18]. Early evaluation methods primarily relied on expert scoring and questionnaire surveys. However, these methods are often subjective and inefficient due to influences from individual experience, cultural background, and perceptual differences. Moreover, conventional techniques have been found to be inadequate in accurately quantifying human perception. This deficiency resulted in a restriction of progress in the field of quantitative analysis and the development of interdisciplinary collaboration [19]. Currently, the evaluation of street space visual quality has evolved from conventional techniques that employ static images to a big data analytics paradigm that integrates multi-source heterogeneous data. Long Ying noted that large-scale quantitative research on urban street space quality can be conducted on the basis of geographic information data and street view image measurements [20]. Compared to conventional image collection techniques, which are often limited by shooting perspectives and substantial expenses, street view images offer a comprehensive data set that facilitates the systematic understanding of street spaces. This stems from their extensive coverage, cost-effectiveness, and highly realistic scene representation. In recent years, the emergence of new technologies such as computer vision and deep learning has further advanced this field, thereby enabling researchers to quantify the visual characteristics of street spaces and correlate them with well-being indicators such as resident health and satisfaction [21,22,23,24,25,26,27,28]. The Place Pulse project, developed by Salesses et al., utilized crowdsourcing to obtain large-scale public perception ratings on street safety and vitality [1]. Wang et al. (2019, [29]) utilized street view images and mental health survey data to ascertain a significantly lower incidence of depressive symptoms among residents living in proximity to streets with elevated green view indices. Frank et al. [30] proposed a “Walkability Index” that integrates street view features with POI data to quantify the potential of streets to promote walking. Although data-driven methodologies undoubtedly enhance the scalability and precision of research and provide empirical evidence for urban planning and public policy, the core challenge in assessing street visual quality lies in constructing a quantitative model that links physical environmental indicators to subjective user experiences. Single models frequently demonstrate instability when confronted with highly heterogeneous urban environments and possess limited adaptability to different street types. Moreover, existing approaches have not sufficiently explored the nonlinear mapping relationships between complex visual elements and human perception, failing to capture the interactive effects of multi-level features and overlooking key constant features of human sensation in simulating perceptual processes [31,32,33]. Integrating human perceptual characteristics and developing evaluation models consistent with human logic could provide innovative approaches for assessing street visual quality.
The high complexity and heterogeneity of urban street environments render traditional single-model approaches incapable of fully capturing their inherent patterns. Ensemble Learning, a machine learning paradigm that combines multiple base learners for collaborative decision-making, offers a new perspective to address this challenge. Its fundamental premise is that by integrating predictions from multiple models, it can effectively compensate for the biases or errors of individual models. This, in turn, results in a significant improvement in the overall model’s generalization ability, robustness, and prediction accuracy. Ye et al. [34] employed an ensemble learning approach to integrate street view features from multiple sources, thereby achieving a substantial enhancement in the estimation accuracy of street green view indices. Zhang et al. (2023, [35]) combined feature extraction with ensemble learning to achieve cross-city transfer prediction of street quality. The effectiveness of ensemble learning as a sophisticated approach to tackling numerous machine learning challenges has been extensively demonstrated, particularly in supervised learning tasks such as classification and regression. A substantial body of research and experimentation (including extensive comparisons based on UCI datasets) [36,37,38,39,40,41,42,43,44] has demonstrated that ensemble methods consistently demonstrate superior performance in comparison to single models. They are well-suited for foundational models with minimal computational demands, such as decision trees, achieving a balance between efficiency and effectiveness.
At the present time, there are three mainstream paradigms in ensemble learning: bagging, boosting, and Stacking. Bagging employs a parallel bootstrap sampling strategy, constructing multiple independent models and aggregating their results to reduce variance, with Random Forest as a representative example. Boosting achieves effective bias reduction through serial iterative adjustments to sample weights, enabling subsequent models to focus on previous errors. The Stacking algorithmic framework comprises two layers. The primary layer utilizes heterogeneous base models to generate predictive features, while the secondary layer employs a meta-learner to optimize the combination strategy. Street view data is inherently characterized by multi-source and heterogeneous properties. The stacking method is a flexible integration of diverse visual recognition models, each leveraging its strengths in feature extraction to form more robust feature representations. Furthermore, complex nonlinear mapping relationships exist between visual elements and human perception. The meta-learner employs quadratic modeling to enable Stacking to capture these deep correlations more accurately, thereby enhancing prediction precision. The analysis of the contributions of the base models in the first layer, in conjunction with the weights of the meta-learners, also affords a certain degree of model interpretability. This approach facilitates a more nuanced understanding of the specific impact of various visual features on street quality evaluation, thereby enhancing the insights derived from research conclusions. Given its comprehensive advantages in integrating heterogeneous models, capturing complex relationships, and offering interpretability, the study adopts the Stacking ensemble learning method to construct a robust, precise, and interpretable street scene quality assessment model.
In the current work, an automated street visual quality assessment framework was proposed based on multi-source street view data and ensemble learning methods. Its objectives are to address the following challenges: First, the paper introduces and validates a Stacking-based ensemble learning framework for automated visual quality evaluation of streets in mountainous cities. Second, compare and demonstrate that the performance of this integrated framework surpasses that of a single model. Thirdly, to identify key visual elements influencing street visual quality, providing decision support for refined renewal strategies tailored to different street types.
2. Study Area and Data
2.1. Study Area
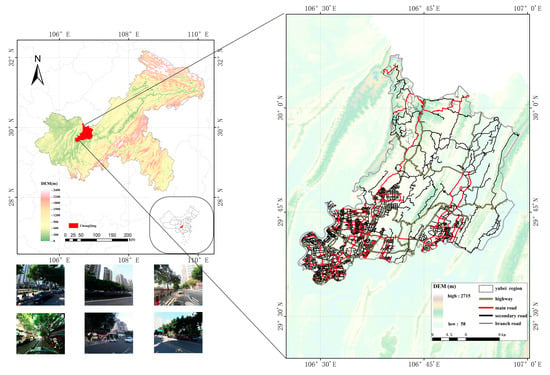
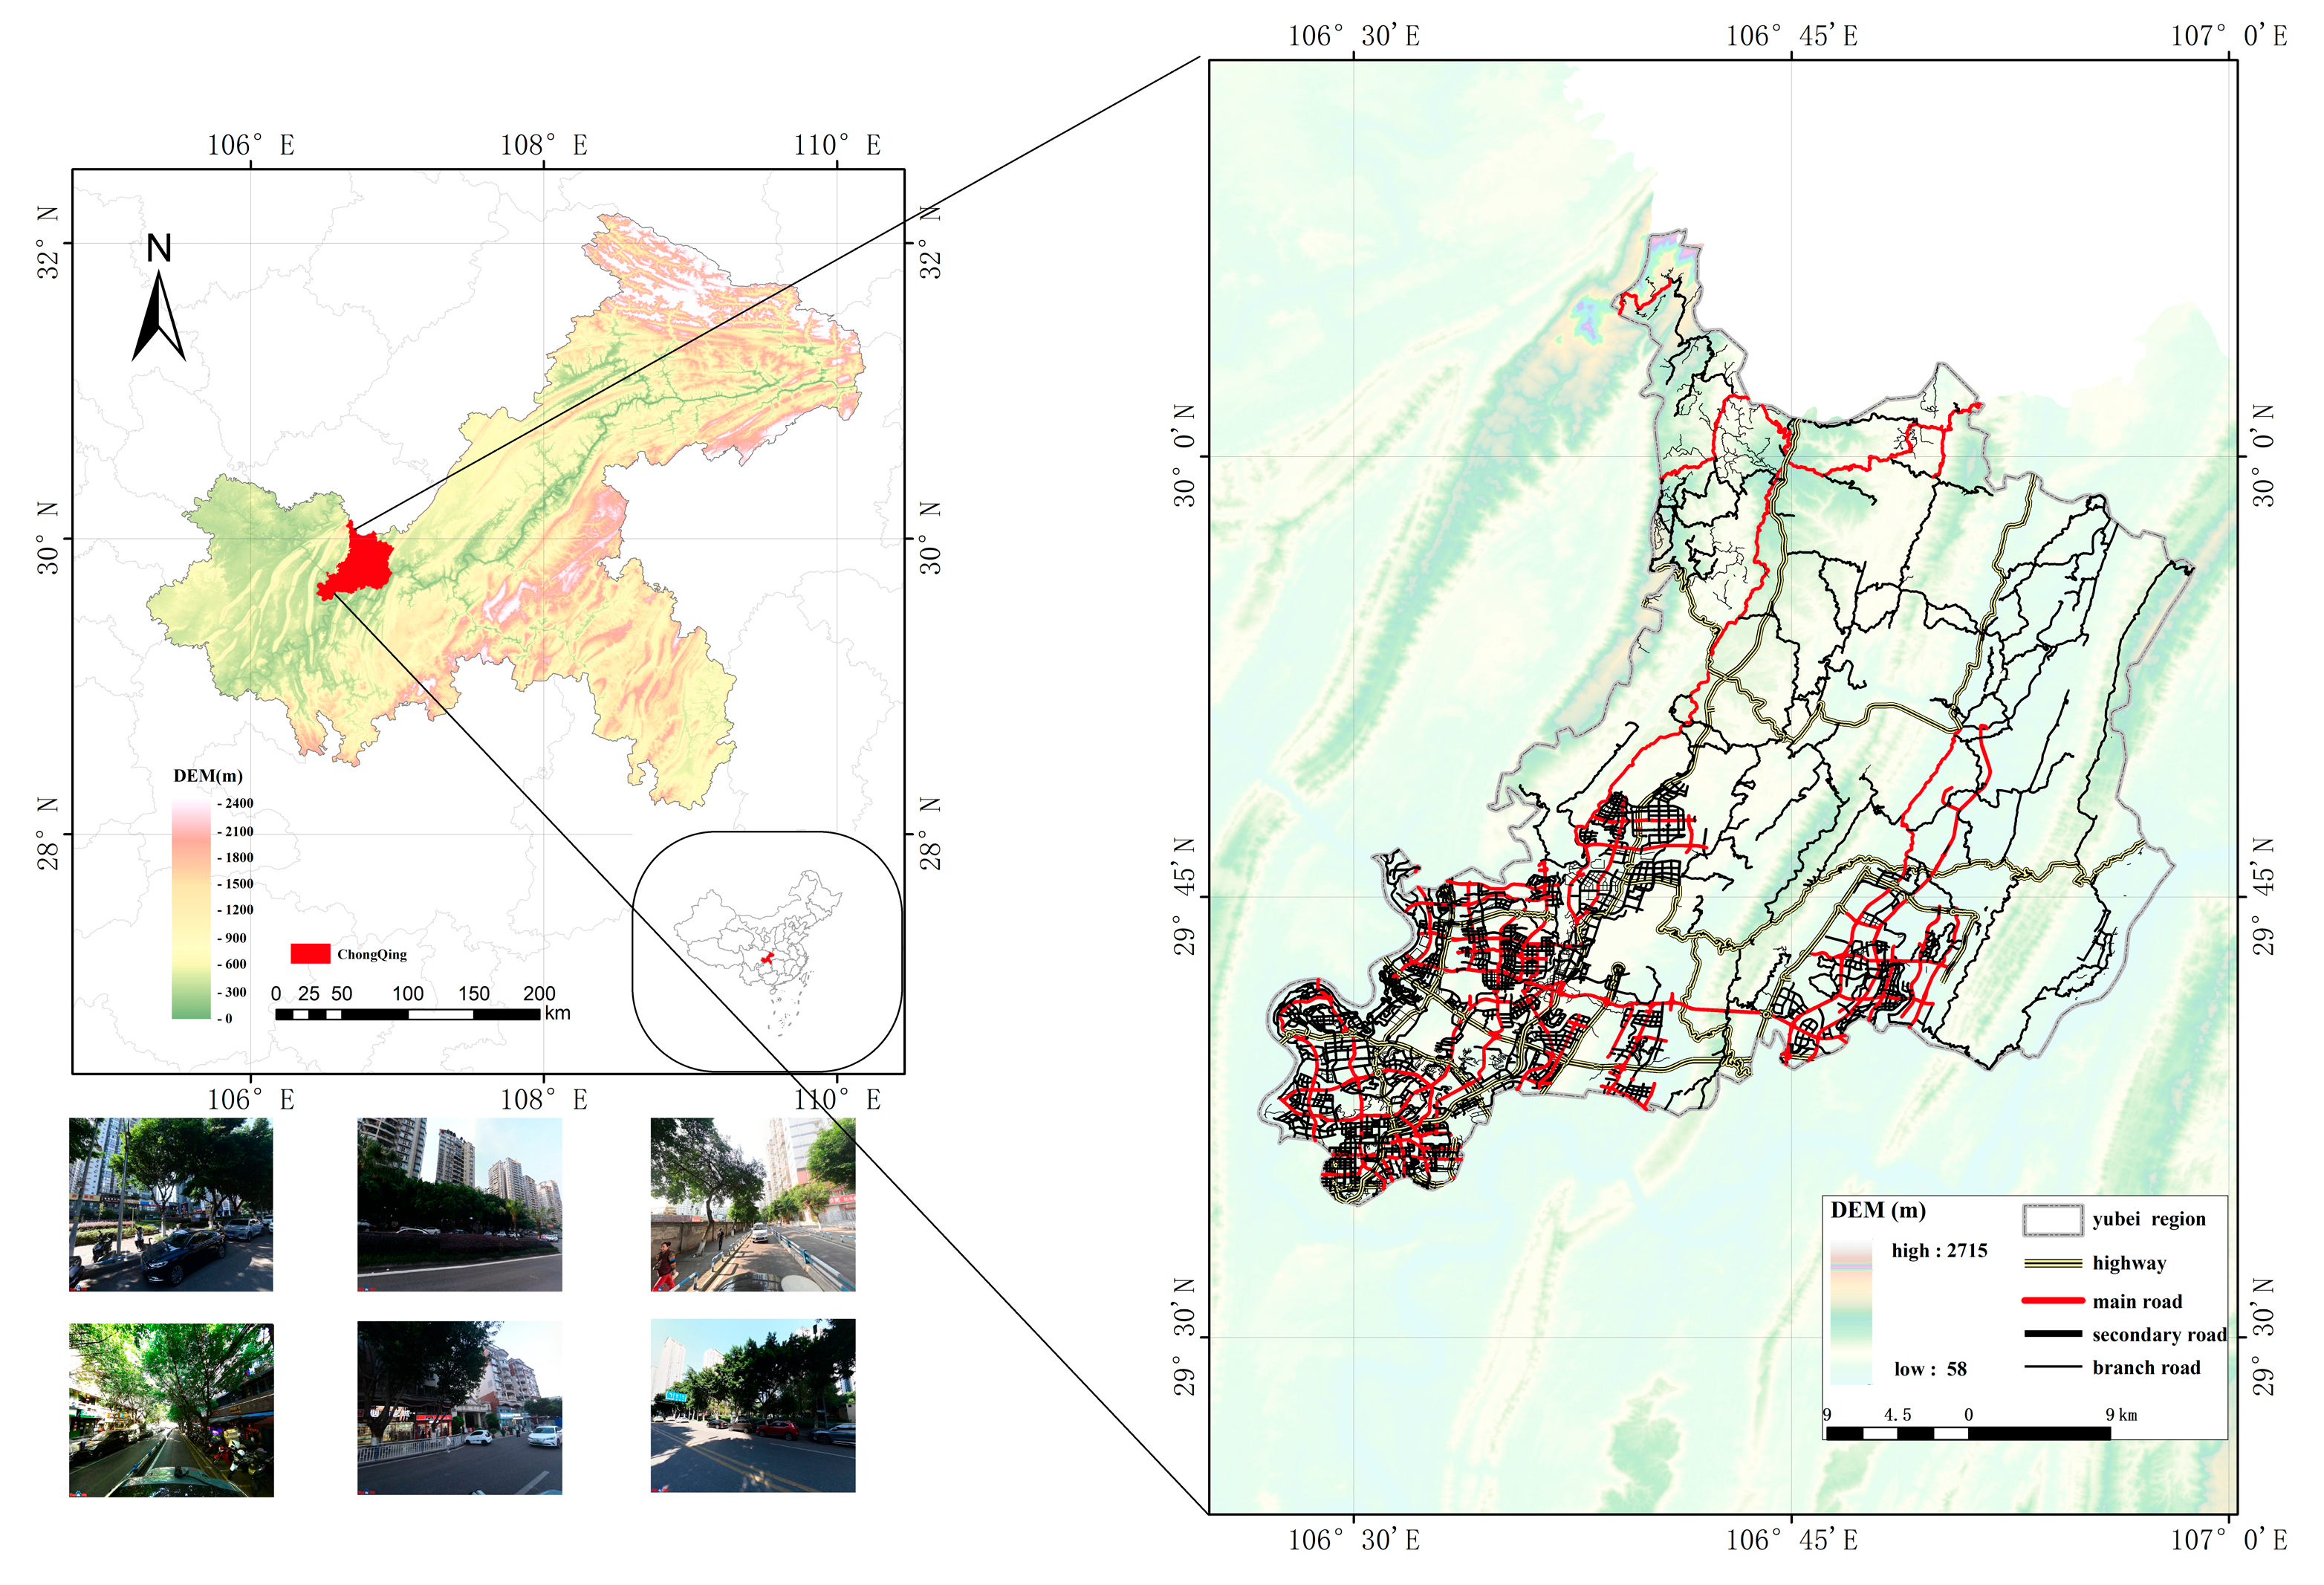
Yubei District, located in the northern part of Chongqing’s primary urban area, covers a total area of 1457 km2 and was selected as the targeted geographical area. Yubei District is a typical example of a mountainous urban area, characterized by diverse and complex topography. The road network design follows the natural contours of the terrain, while the arrangement of buildings adheres to an interlaced, undulating pattern, creating a unique urban landscape. The complex topography results in street visual characteristics markedly different from those of plain cities, thereby imposing higher demands on the generalization capability of visual quality models. As one of Chongqing’s fastest-growing and most densely populated districts, its distinctive urban development pattern and spatial heterogeneity encompass a wide range of spatial types—from built-up areas and urban expansion zones to designated ecological conservation areas. This diversity provides a rich sample of scenarios for investigating the relationship between street spatial quality, functional layout, and residential site selection. The geographical location of the study area is delineated in Figure 1.
Figure 1.
Schematic map of the study area.
2.2. Data Collection and Preprocessing
Three data sources were utilized: road network data, street view imagery (SVI) for predicting street visual quality scores, and MIT’s Place Pulse (PP) data for model training.
2.2.1. Road Network Data
OpenStreetMap (OSM) was utilized as the road network data source for the study area. Preprocessing of the road network data included topology correction, road merging, and sample point generation. The latitude and longitude coordinates of the sample points were calculated based on the processed road network data, serving as parameters for collecting street view data.
2.2.2. Street View Data
This study aims to evaluate human perceptual characteristics of urban environments. Thus, urban street view image data was collected. Street view images of the study area were obtained through the API interface provided by BaiDu Street View Service (https://map.baidu.com/ (accessed on 27 October 2024)). The distribution of sampling points along the road network was uniform, with each point situated at intervals of 50 m. Street view images were captured at each sampling point using preset parameters: image size of 480 × 600 pixels, camera azimuth angles set to 0°, 60°, 120°, 180°, 240°, and 300°, with the horizontal field of view set to default values. SVI data was collected from July to October 2021–2022. In cases where images were unavailable or of substandard quality, the study utilized images collected in 2017 and 2019 as substitutes. Invalid images were excluded, such as winter images to avoid seasonal factors, as well as images with overexposure or underexposure, obstructions, or construction activities. The total number of sample images obtained for Yubei District was 60,800.
2.2.3. MIT Place Pulse Dataset
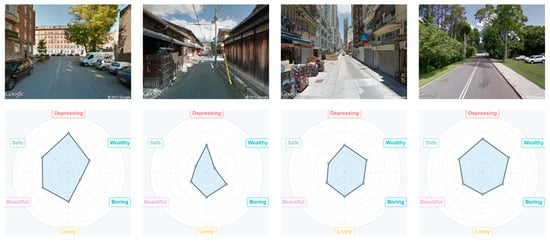
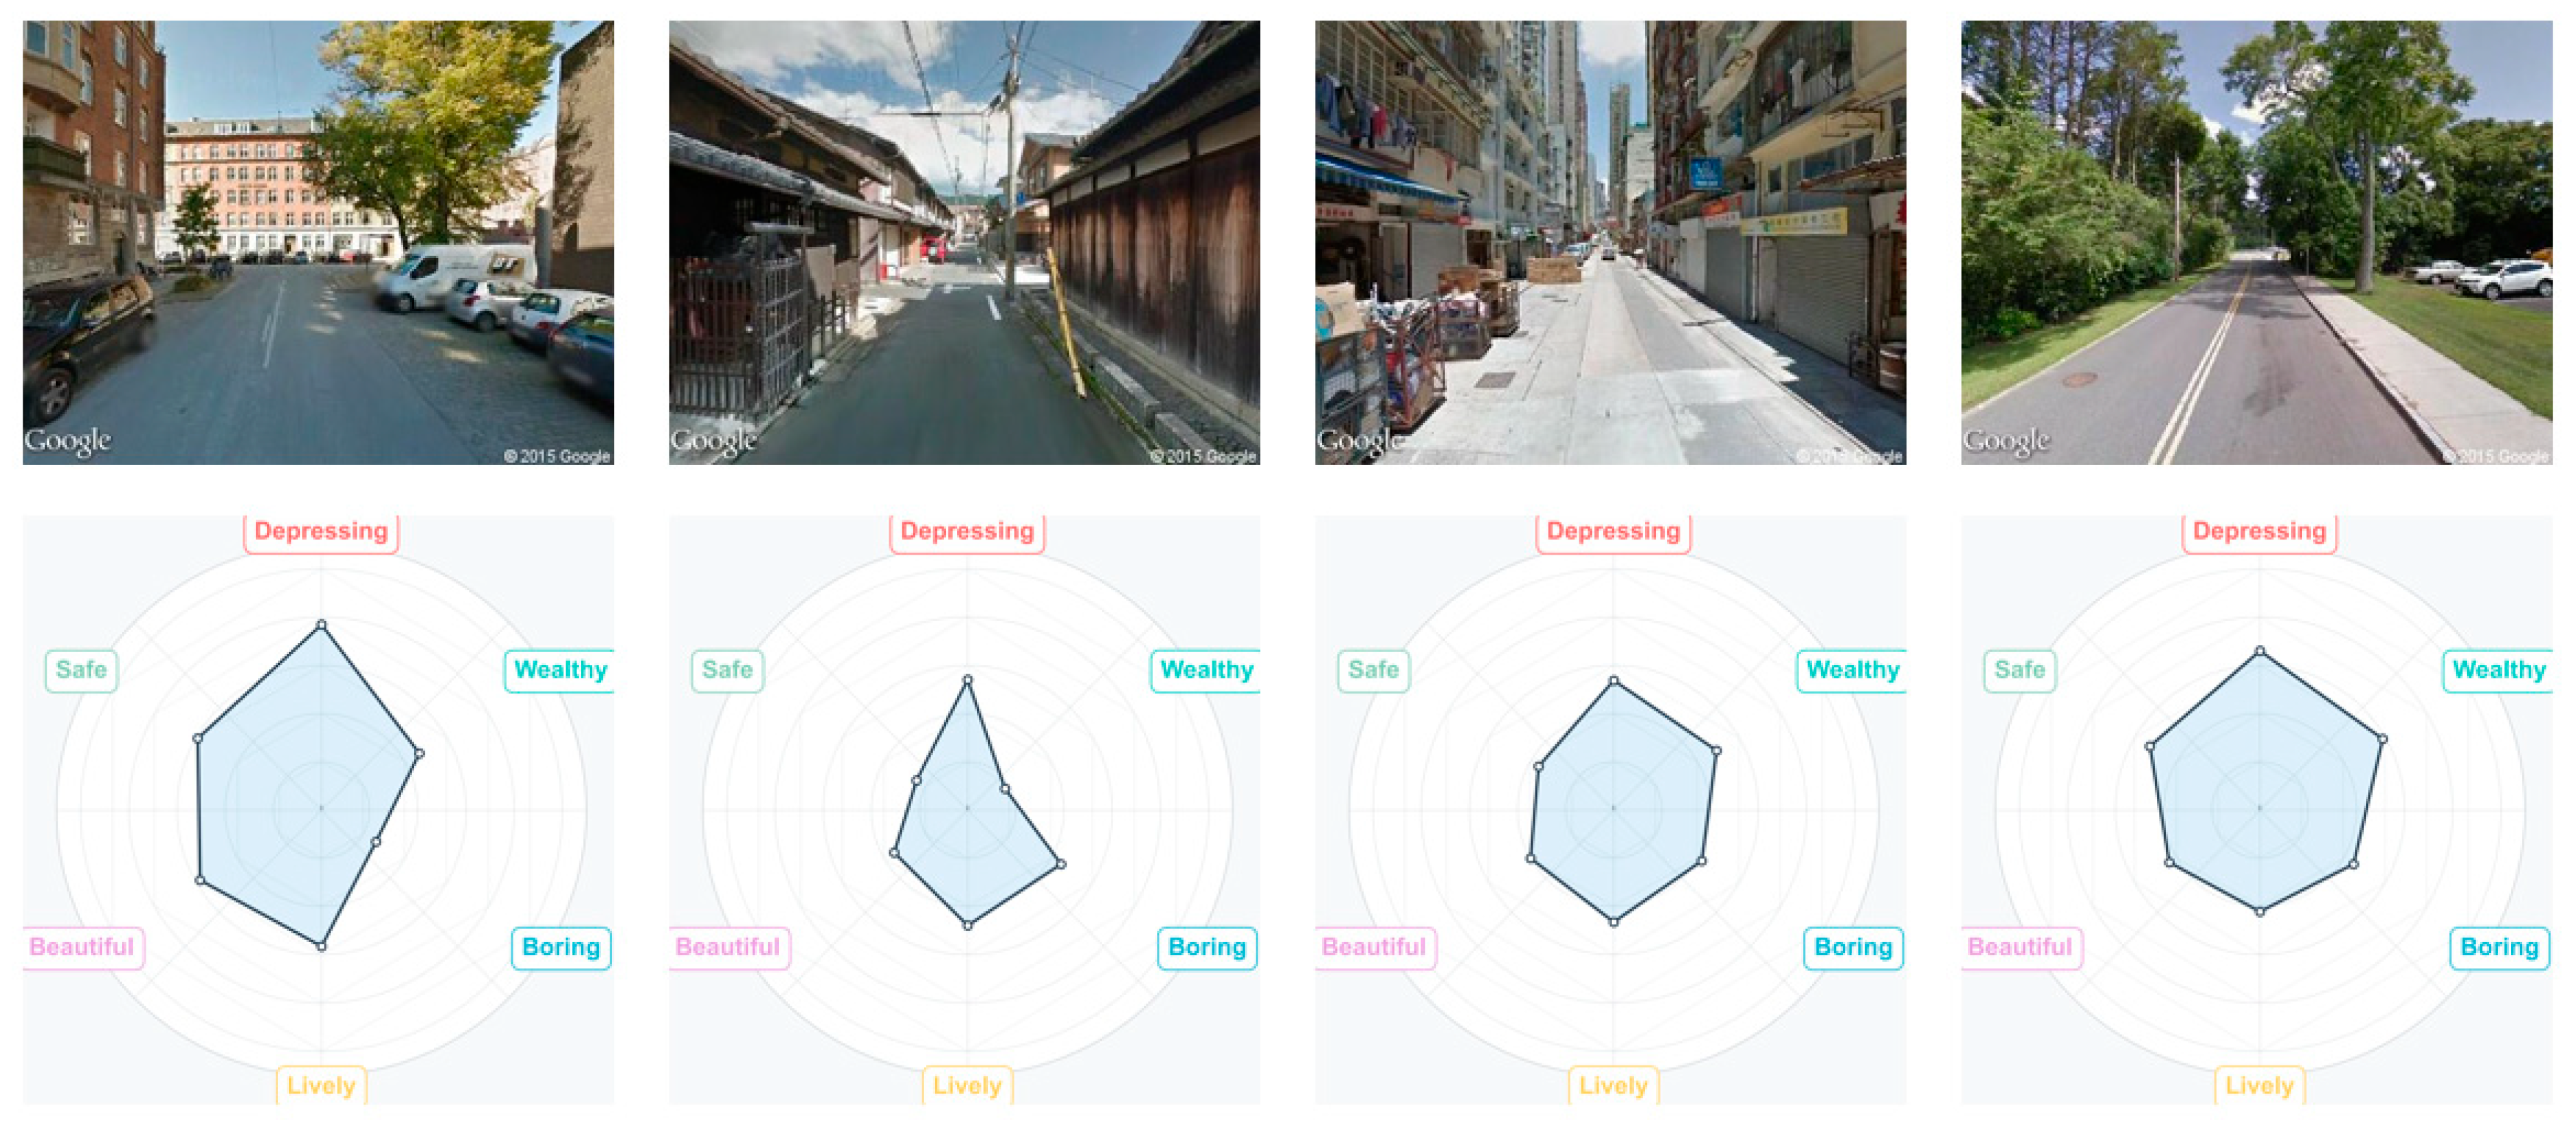
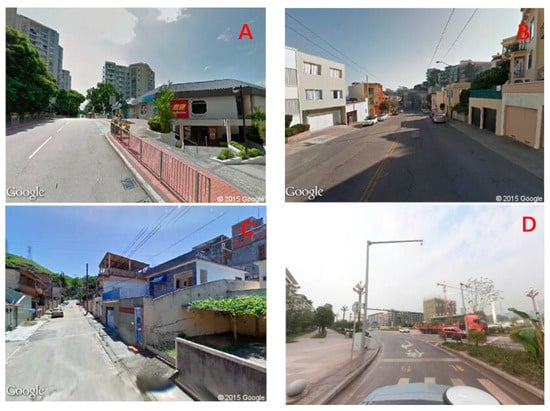
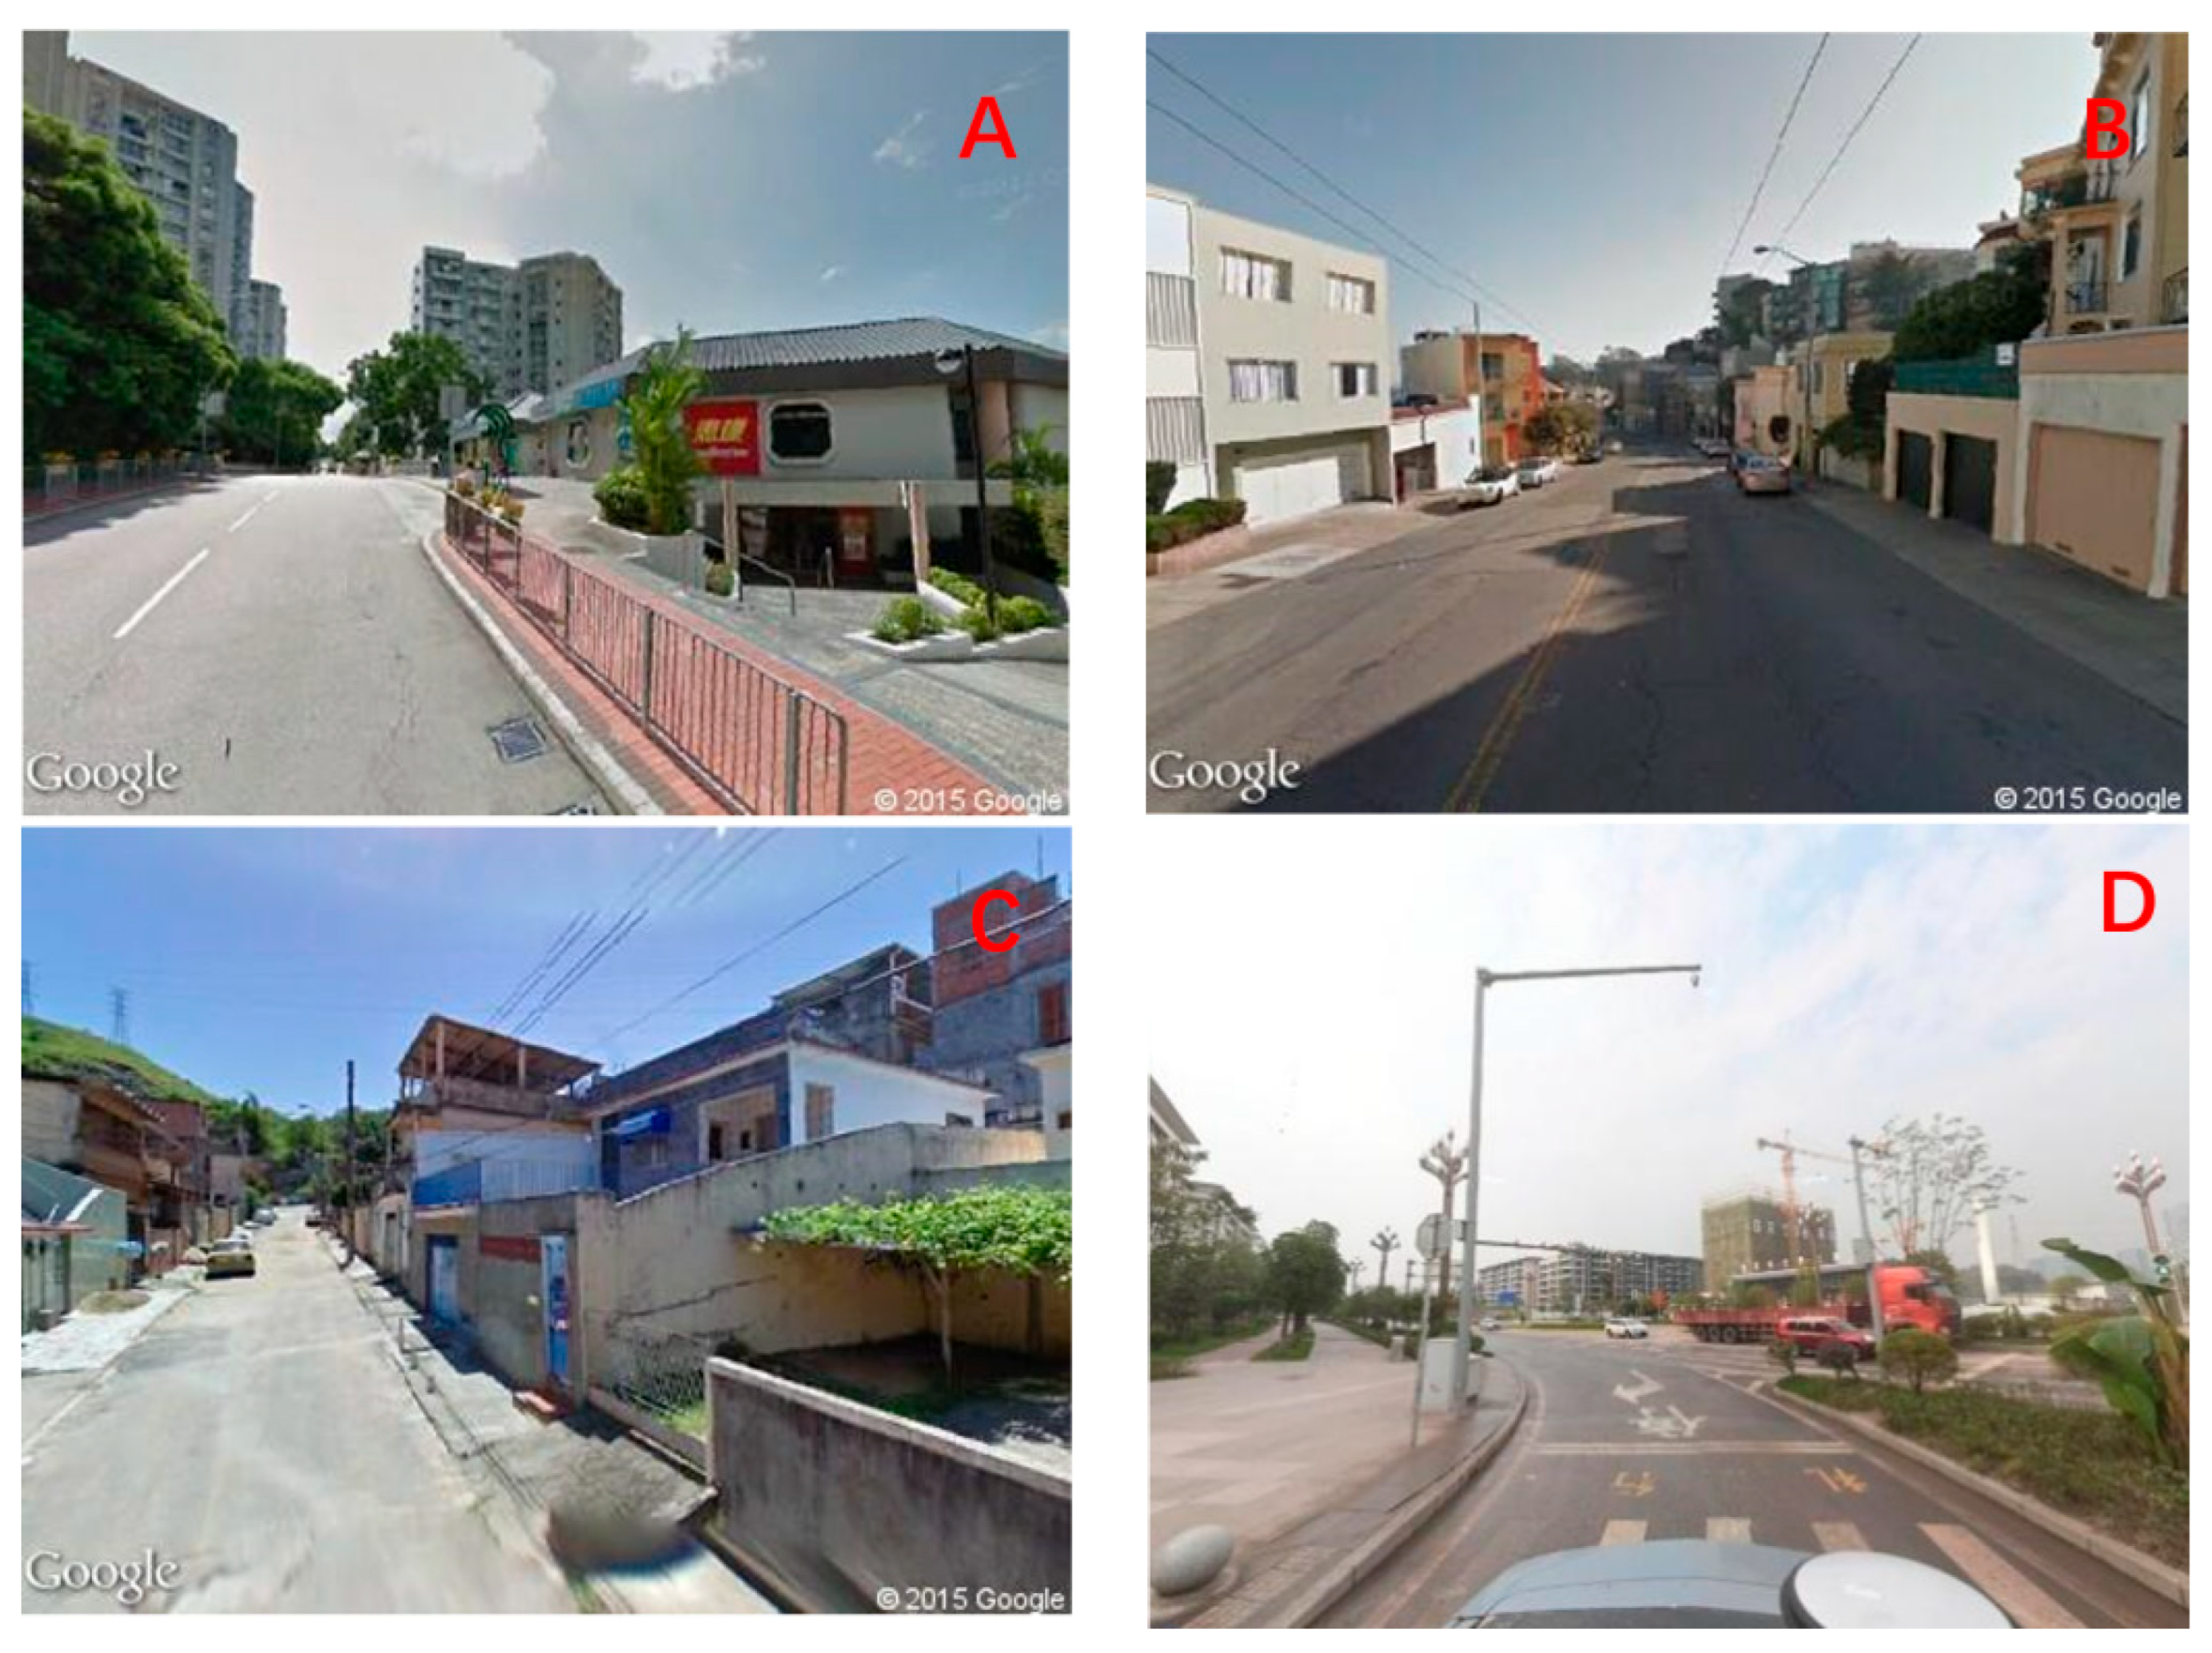
The Place Pulse project was initiated in 2013 at the MIT Media Lab. The image dataset under consideration is composed of 110,988 street-level photographs. As demonstrated in Figure 2, each image carries six-dimensional scores (“Safety,” “Beauty,” “Pressure,” “Liveliness,” “Wealth,” “Boredom”), captured between 2007 and 2012 across 56 cities in 28 countries spanning six continents, as shown in Table 1 [10]. Within each urban area, point samples were generated from specific spatial regions using dense random sampling methods. The dataset also provides metadata for each image, including geographic coordinates and camera azimuth. As of October 2016, the platform had accumulated 1,169,078 valid pairwise comparison results from 81,630 online participants. Figure 3 presents a series of street view photographs captured from multiple mountainous cities within the PP dataset, exhibiting notable similarities to the Yubei District.
Figure 2.
Image samples in Place Pulse.
Table 1.
Statistical summary of image data in the Place Pulse dataset.
Figure 3.
Mountainous city street scene images: (A). Hong Kong; (B). San Francisco; (C). Rio de Janeiro; (D). Yubei District, Chongqing.
Perceptual visual quality scores for the Place Pulse dataset were calculated based on a two-image comparison format, implemented using Microsoft’s Trueskill algorithm [45]. In this study, the visual quality of an image is defined as follows [46]:
Here, Q represents the visual quality score of an image, while , , , , , and denote the scores for the six dimensions of “Safety”, “Beauty”, “Pressure”, “Liveliness”, “Wealth”, and “Boredom” respectively. The semantic meanings of the “Pressure” and “Boredom” dimensions are opposite to positive evaluations; therefore, the scores for these two dimensions must be inverted before summation. Based on this, we can objectively quantify the visual quality of an image through its perceived score.
3. Methods
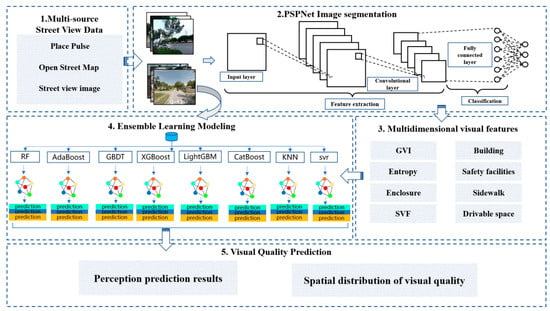
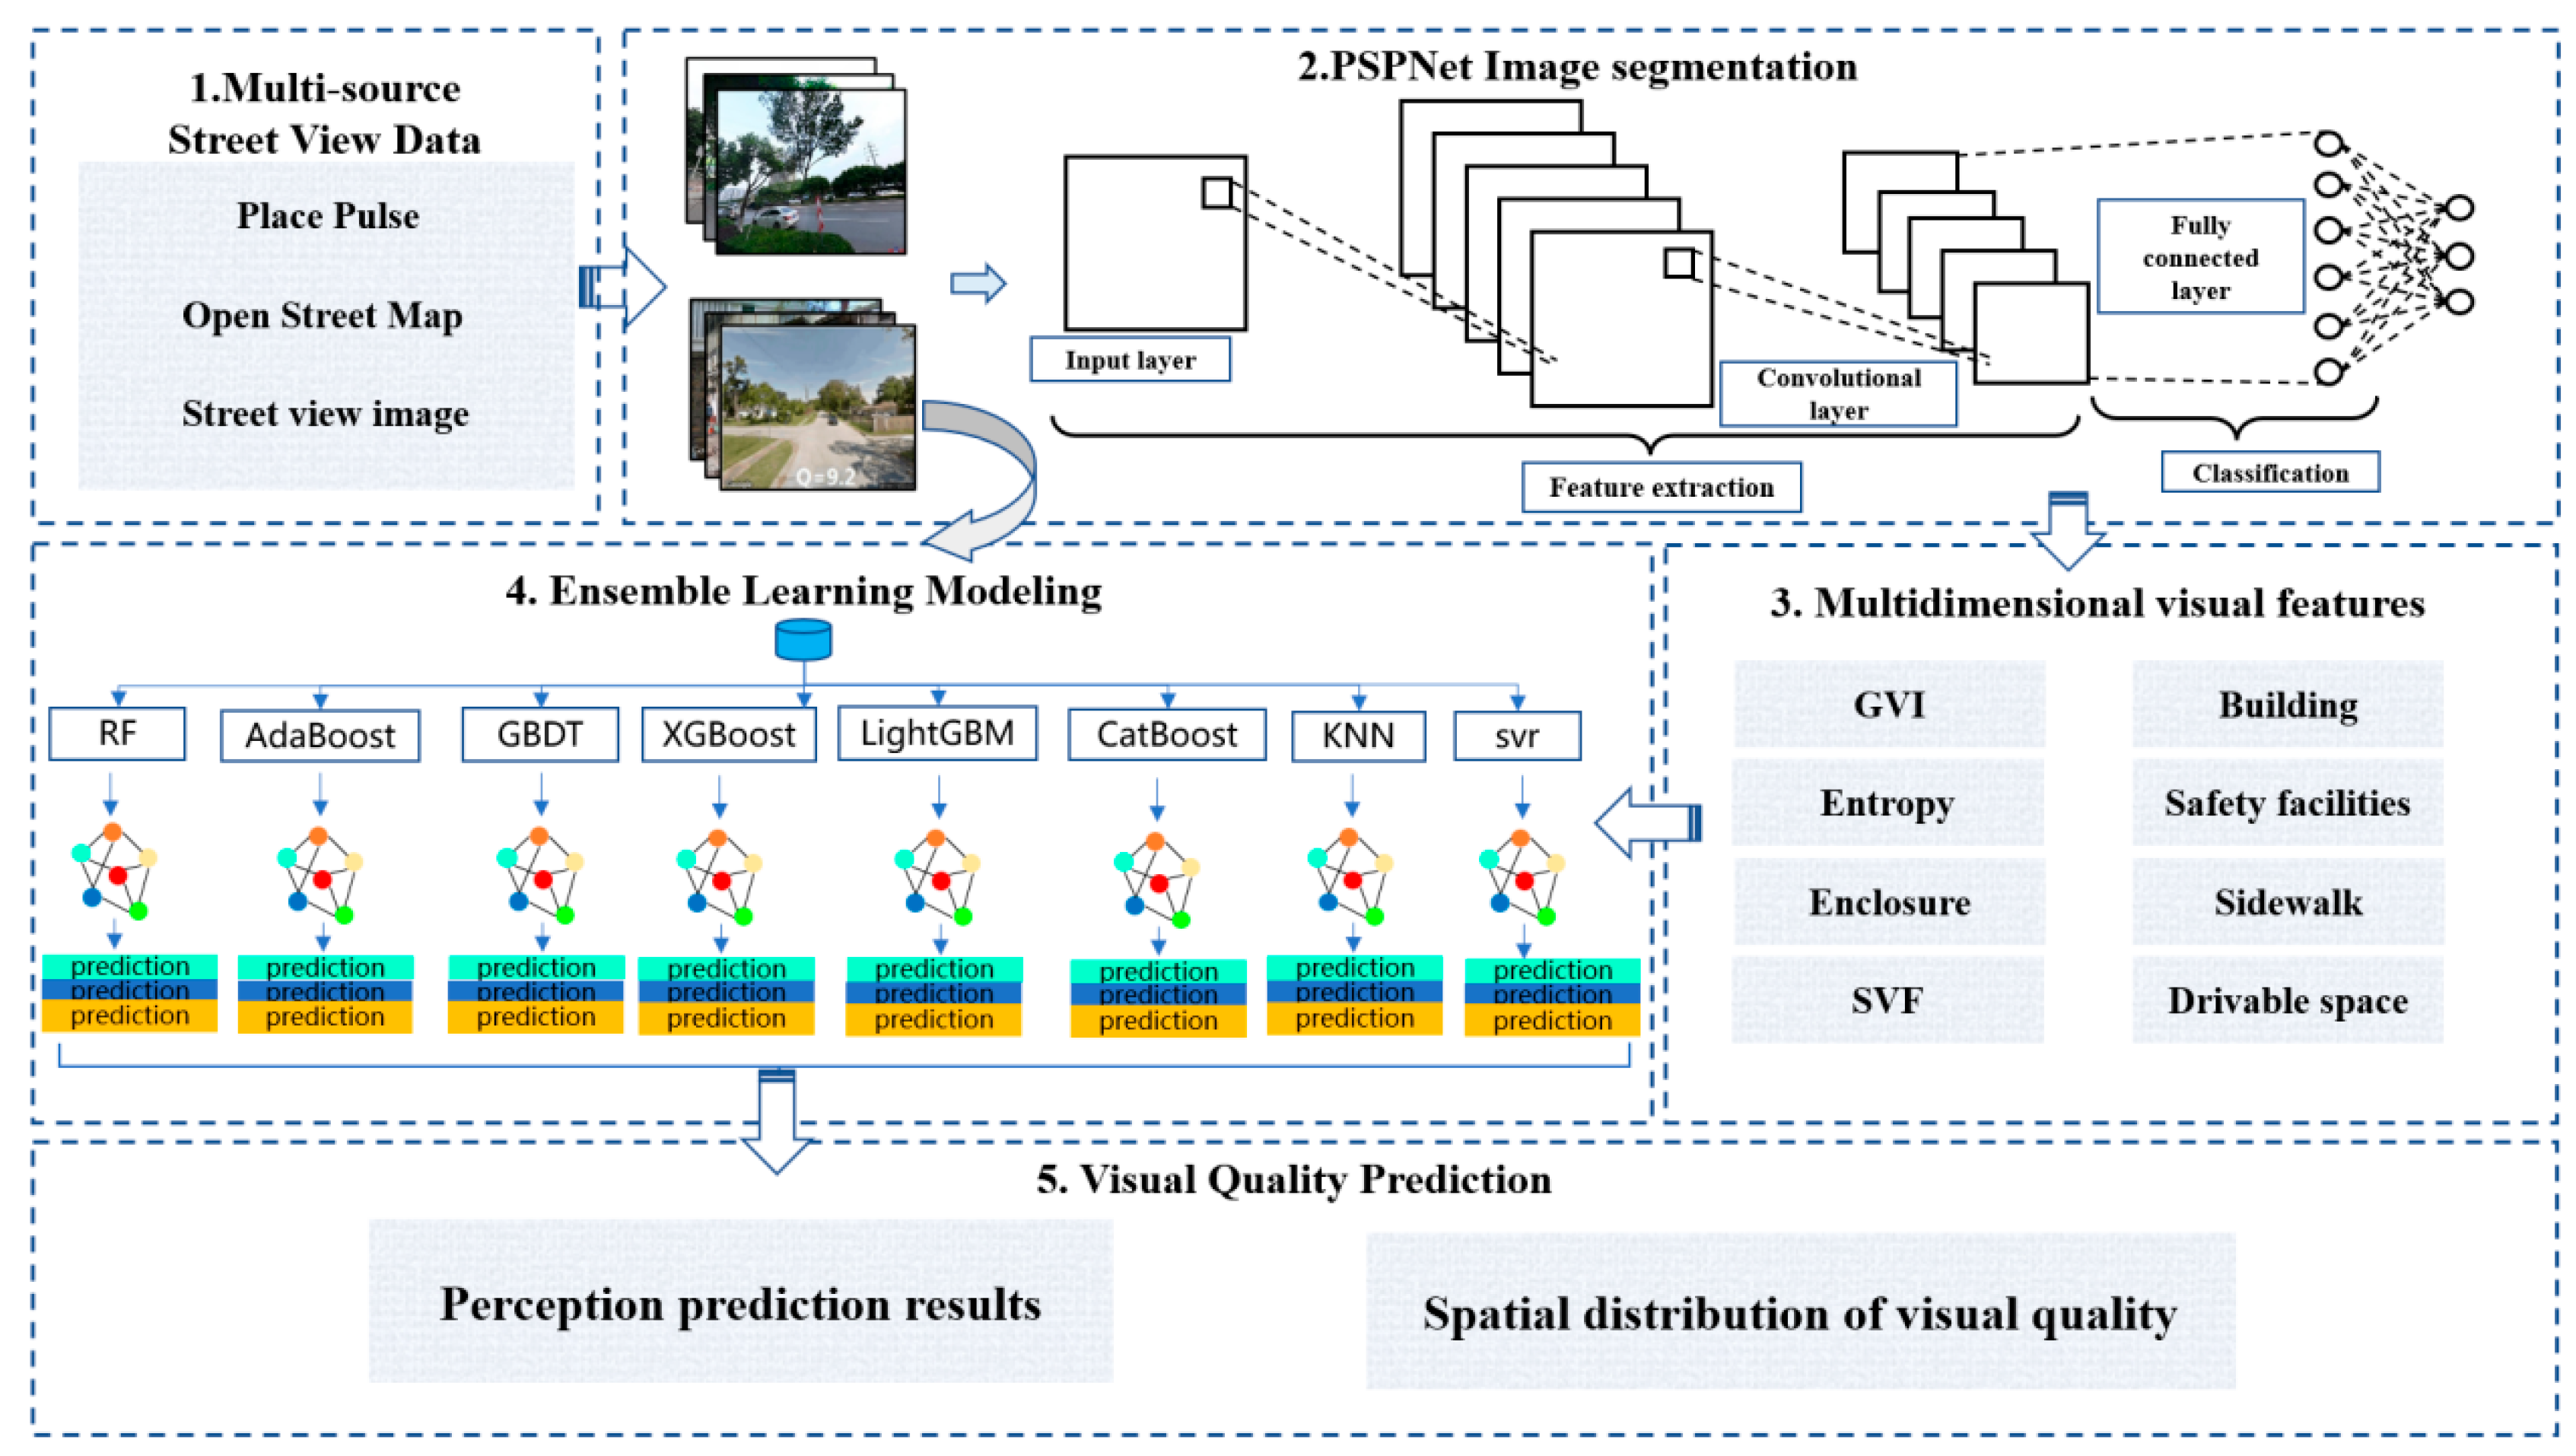
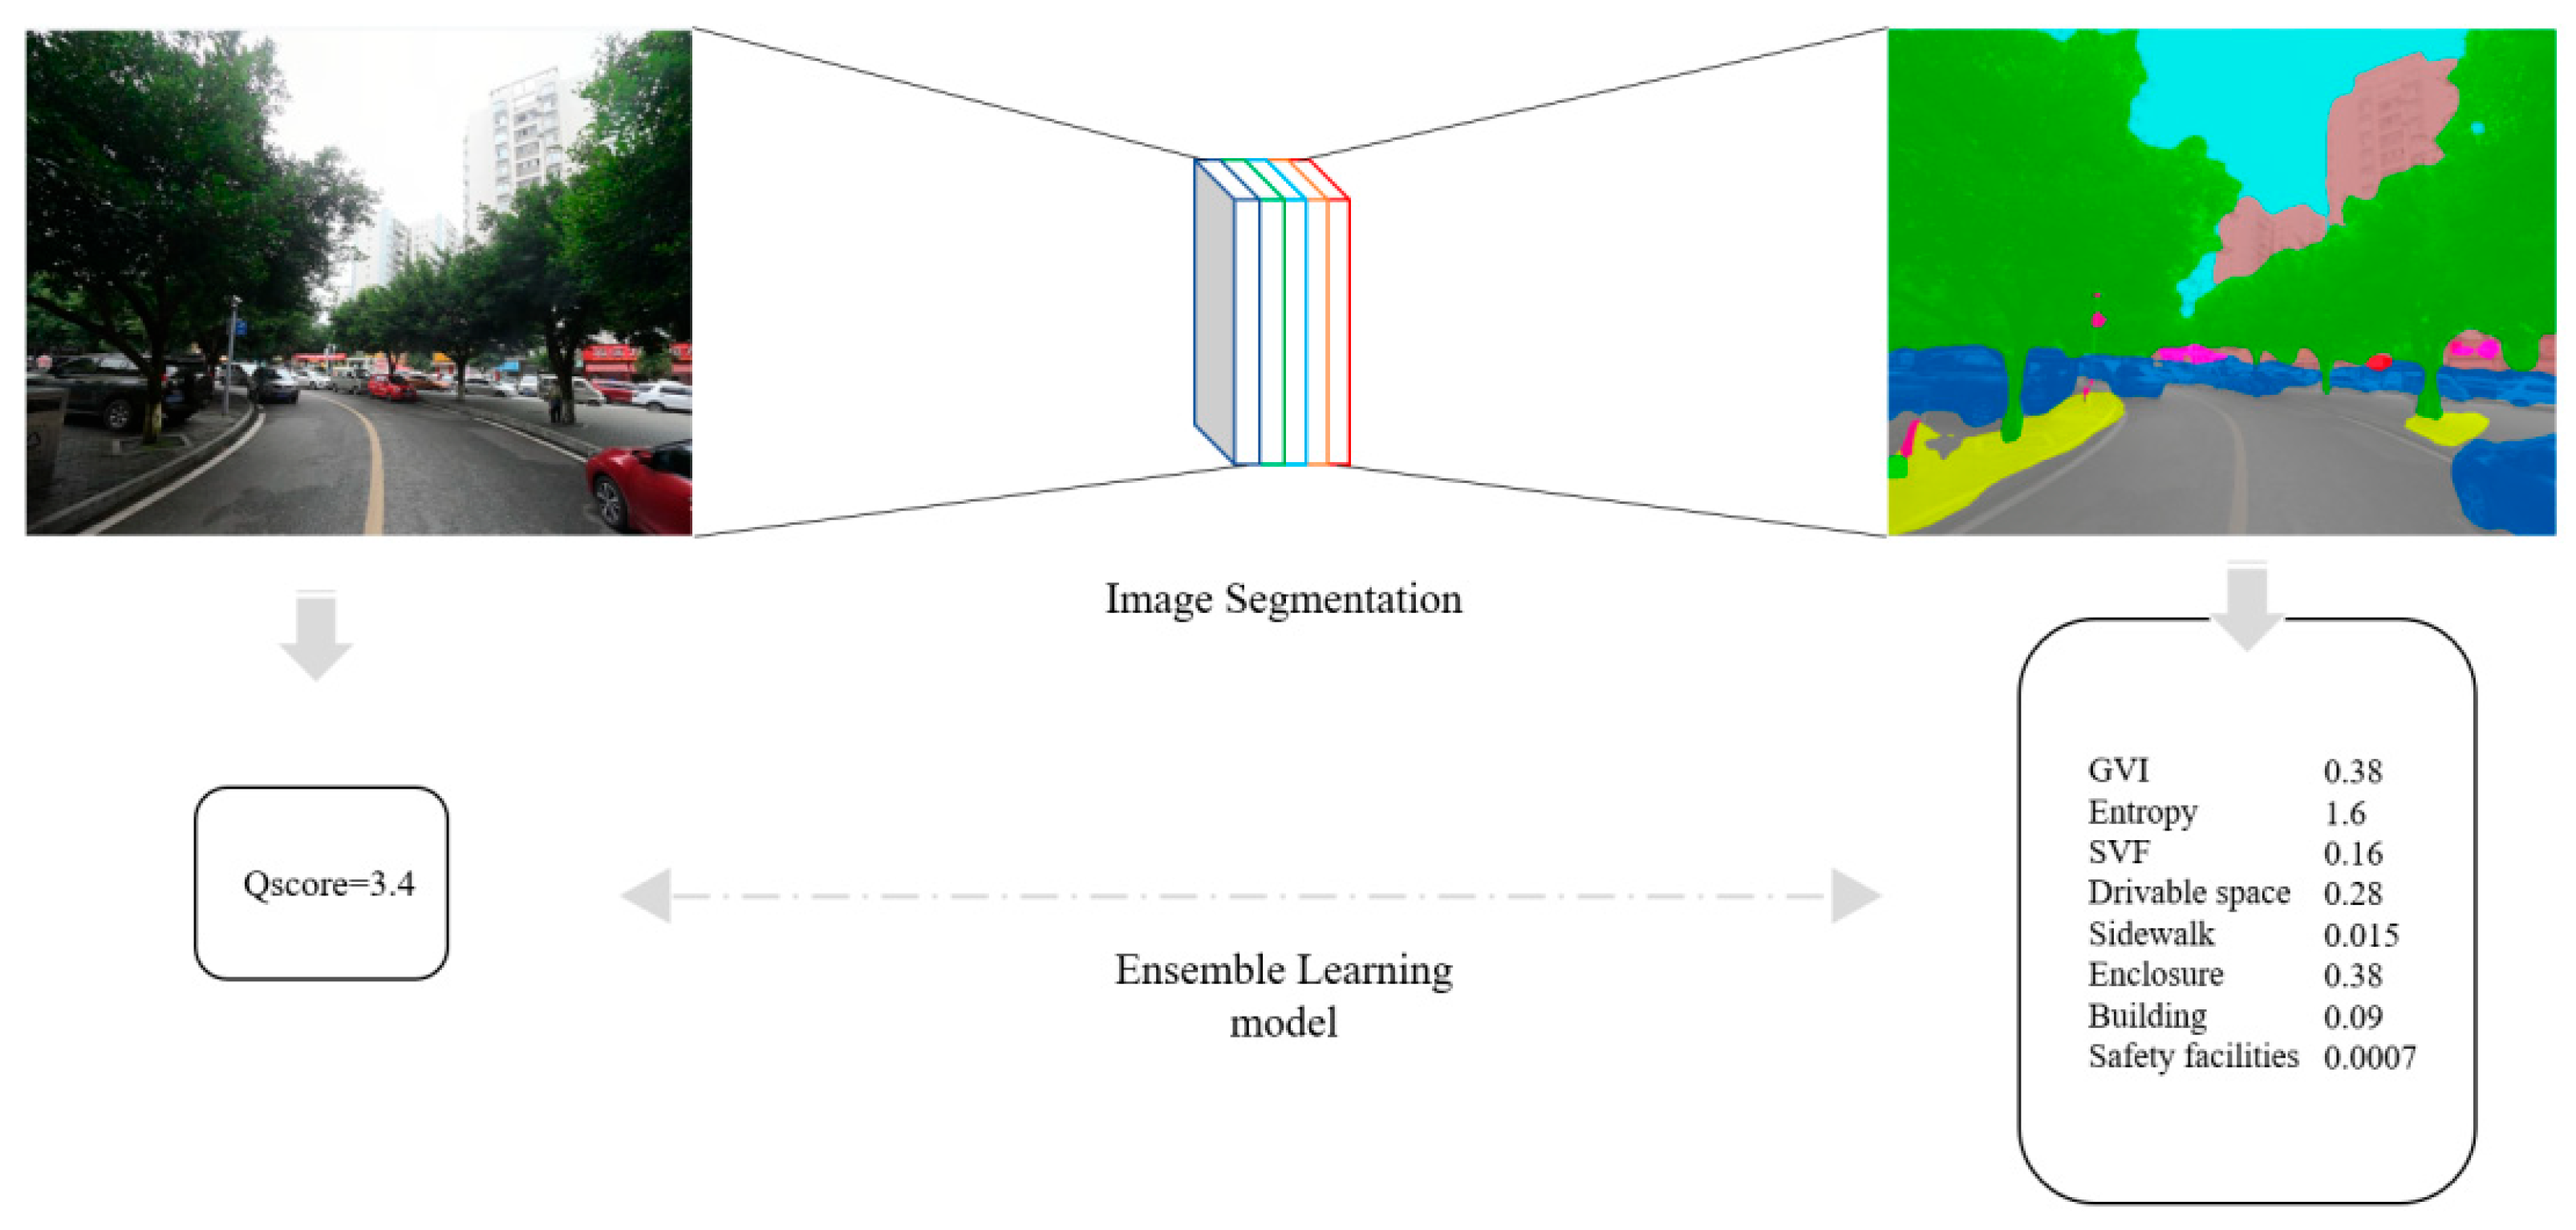
An ensemble learning approach was adopted to construct an automated visual quality assessment model for streets, with the technical framework illustrated in Figure 4 and with the implementation steps detailed below: Step 1: Utilize PSP-Net image semantic segmentation technology to extract fundamental elements constituting the street visual environment from the PP dataset. Based on these elements, calculate eight key visual feature metrics to serve as input variables for subsequent modeling.
Figure 4.
Research flowchart.
Step 2: Using the manually rated street visual perception scores from the PP dataset as labels and the aforementioned eight visual features as inputs, a Stacking ensemble regression model is trained. For base learner selection, adhering to the principle of prioritizing heterogeneity while balancing performance and efficiency, eight algorithms were chosen: RF, AdaBoost, GBDT, XGBoost, LightGBM, CatBoost, KNN, and SVR. This combination ensures the model learns data from multiple perspectives: the tree model family effectively captures nonlinear relationships and complex interactions among high-dimensional features; KNN, as a nonparametric model, excels at identifying locally similar samples; while SVR exhibits robustness to outliers, enhancing overall model resilience. These base learners were fused through multi-layer stacking to construct a powerful and stable ensemble evaluation model. Step three involved applying the trained model to Yubei District: visual features were extracted from street-level imagery, the model predicted visual quality scores, and the spatial distribution patterns of street visual quality across Yubei District were visualized.
3.1. Feature Selection
In establishing objective evaluation metrics, various scholars have proposed diverse standards based on multiple perspectives. Here, a set of quantifiable, computable physical indicators closely related to street spatial quality was selected. These indicators are grounded in machine learning methodologies and the existing literature consensus. The selection process was guided by the following principles: firstly, the inclusion of indicators that are frequently referenced in relevant street landscape research; secondly, the incorporation of indicators that possess established calculation methods and data acquisition pathways; and finally, the selection of indicators whose significance aligns with current urban street assessment frameworks. Guided by these principles and referencing core elements from the Chongqing Municipal Comprehensive Design Guidelines for Urban Roads, this study ultimately selected eight indicators: Green View Index (GVI), Visual Entropy (Entropy), Sky View Factor (SVF), Drivable Space, Sidewalk, Safety Facilities, Buildings, and Enclosure. The calculation formulas for these indicators are as follows:
Here, represents the seven computational metrics excluding Visual Entropy, and denotes the pixel category corresponding to each metric. For example, when calculating the GVI, represents the total number of pixels occupied by vegetation (including trees, shrubs, and grassland). When calculating SVF, represents the total number of pixels occupied by sky. When calculating Enclosure, represents the total number of pixels occupied by buildings, fences and walls.
The calculation method for Visual Entropy (Entropy) differs from other metrics. Visual Entropy is a subjective measure of information and reflects the richness of image information and visual complexity:
where n represents the total number of categories of segmentation features in an image, and denotes the probability of a certain category element appearing within that region. All metric calculations were performed using Python version 3.9.
It has been reported that these metrics exhibit high frequency and empirical foundations in street quality evaluations. Pendola et al. highlighted that factors such as street scale, traffic volume, and building height critically influence street perception [47]; and Ye et al. incorporated variables such as green visibility, sky openness, building interface attributes, and motorization levels into their street spatial quality evaluation model [34].
As previously mentioned, the metrics under discussion in this study possess clear physical meanings and theoretical correspondences. In particular, the green view index is correlated with the visual permeability of greenery and human-scale design; Visual Entropy reflects scene complexity and information richness; sky view factor affects spatial openness; drivable space and sidewalk respectively represent traffic efficiency and pedestrian experience; safety facilities reflect street security performance; and building and enclosure directly shape spatial visual definition and continuity. Collectively, these indicators form a multidimensional, quantifiable framework for evaluating street quality.
3.2. Modeling
3.2.1. PSP-Net Image Segmentation
Street scenes are complex, containing objects of different sizes (e.g., sky, buildings, trees, pedestrians, vehicles). Standard CNN models have been observed to demonstrate deficiencies in their capacity to effectively perceive global information and to capture contextual relationships between distant objects. In the domain of urban street scene semantic recognition, widely employed semantic segmentation frameworks encompass Fully Convolutional Networks (FCN), SegNet, and PSP-Net. In 2016, the PSP-Net model won the ImageNet Segmentation Challenge, achieving the highest classification accuracy on the PASCAL VOC 2012 and Cityscapes datasets. This feat established a new benchmark, with an accuracy of 80.2%, surpassing the performance of both the FCN and SegNet models. PSP-Net model is predicated on a pyramid pooling module, which serves as its fundamental architectural component. The integration of multi-scale feature fusion mechanisms enables the capture of global contextual information, thereby reducing misclassifications that are caused by the FCN’s tendency to overlook contextual details during segmentation. Built upon an encoder–decoder architecture, the model fuses low-level and high-level features. It performs upsampling before final predictions, generating segmented results with clear boundaries and rich details. During data preprocessing, input images are uniformly cropped to a standardized 256 × 256 pixel size and undergo channel normalization to ensure consistent data distribution. Training employs a learning rate of 1 × 10⁻⁴ dynamically adjusted over 100 training iterations and uses an 80% training and 20% validation split for model training. As illustrated in Figure 5, PSP-Net adopts a specific workflow.
Figure 5.
PSP-Net network operation diagram.
3.2.2. Stacking Strategy
Stacking is an advanced ensemble learning method that combines the predictive capabilities of multiple base learners through a hierarchical structure. The fundamental premise of this approach is the need to train a meta-learner tasked with optimizing the fusion of base model outputs. This process involves systematically adding layers while initializing new layers based on the parameters of the preceding layer. This approach has proven highly successful in enhancing the efficiency of training deep neural networks. In the context of deep linear residual networks, this property facilitates accelerated convergence during the training process [44].
The initial layer of Stacking typically selects a high-performance model for the training of the input dataset. In this scenario, the aforementioned concept may be expressed as follows:
Here, represents the -th learner, denotes the feature vector of the -th input sample, and signifies the prediction result of the -th model for the -th sample. After training the first-layer models, all prediction results are compiled into a meta-feature matrix:
Here, is an × feature matrix, where each column represents one model’s predictions across all samples, and each row represents the prediction results of a sample across all models. To prevent data leakage, each model undergoes K-fold cross-validation during training, with K set to 5 in this study. The meta-feature matrix generated from all data after K-fold training of the first-layer models serves as the input features for the second layer—the meta-learner. The training principle of the meta-learner is as follows:
In Equation (6), is the final prediction function of the ensemble model, and is the meta-learner. To prevent overall data overfitting, a simple model is typically chosen as the meta-learner. In Equation (7), represents the final prediction error, denotes the true label of the -th sample, and is the root mean square error. The optimal combination of meta-learner weights is obtained when minimizing in Equation (7).
The options for the first-layer base learners include: RF, AdaBoost, GBDT, XGBoost, LightGBM, CatBoost, KNN, and SVR. Table 2 shows the parameter settings for the tree models. KNN is a non-parametric model; its advantage lies in the fact that it makes no assumptions about the data distribution and performs well in recognizing similar local samples. SVR maps the data using a kernel function, resulting in a more compact model representation. For these two models, we use the default settings. For all models, we allocate 80% of the data for training and 20% for validation.
Table 2.
Parameters setting for tree models.
3.2.3. Ablation Experiment
To verify the contributions of each component in the proposed framework, we will conduct ablation experiments to assess their importance, comparing the complete Stacking integrated model with the following configurations: (1) each individual base model; (2) Stacking with all tree models removed; (3) Stacking with KNN and SVR removed; and (4) Stacking using only the top three models. The Pearson correlation coefficient (r) will be used as the evaluation metric.
3.3. Visual Quality Prediction
An automated evaluation method was introduced, utilising the Place Pulse dataset as the foundational data source. The dataset is renowned for its comprehensive collection of street-level imagery, supplemented by corresponding perceptual ratings. Advanced semantic scene parsing technology was incorporated to accurately quantify the visual elements of street scenes. This technology constitutes a fundamental approach to scene understanding. It facilitates precise identification and pixel-level segmentation of object instances within natural images. The present study employs the scene parsing model PSP-Net (Pyramid Scene Parsing Network), constructed based on a deep convolutional neural network (DCNN) architecture. Street images of the study area undergo image segmentation to compute eight metrics: green landscape index, Visual Entropy, sky landscape factor, drivable space, sidewalks, safety facilities, buildings, and enclosure.
In the field of machine learning, the Pearson Correlation Coefficient (PCC), a statistical measure, was employed to quantify the degree of linear association between variables. The coefficient varies between −1 and 1. A value of 1 indicates a perfect positive correlation, meaning that the variables exhibit perfectly aligned linear growth trends. A value of −1 indicates perfect negative correlation, where one variable decreases linearly as the other increases. A value of 0 indicates an absence of a linear relationship between the variables (Equation (8)):
In Equation (8), and represent the values of two variables, while and denote the average values of two parameters. For each input feature, its correlation with the target score was calculated to determine its impact on visual quality.
In Section 3.2.2, Stacking training was employed to obtain the optimal regression model. For street view images in Yubei District, visual quality prediction is achieved by calculating visual feature 1factors through image segmentation and then inputting these eight factors into the model. Figure 6 illustrates the entire regression analysis process.
Figure 6.
Ensemble learning regression analysis of perception scores and factors.
4. Results and Analysis
4.1. Spatial Distribution of Characteristic Factors
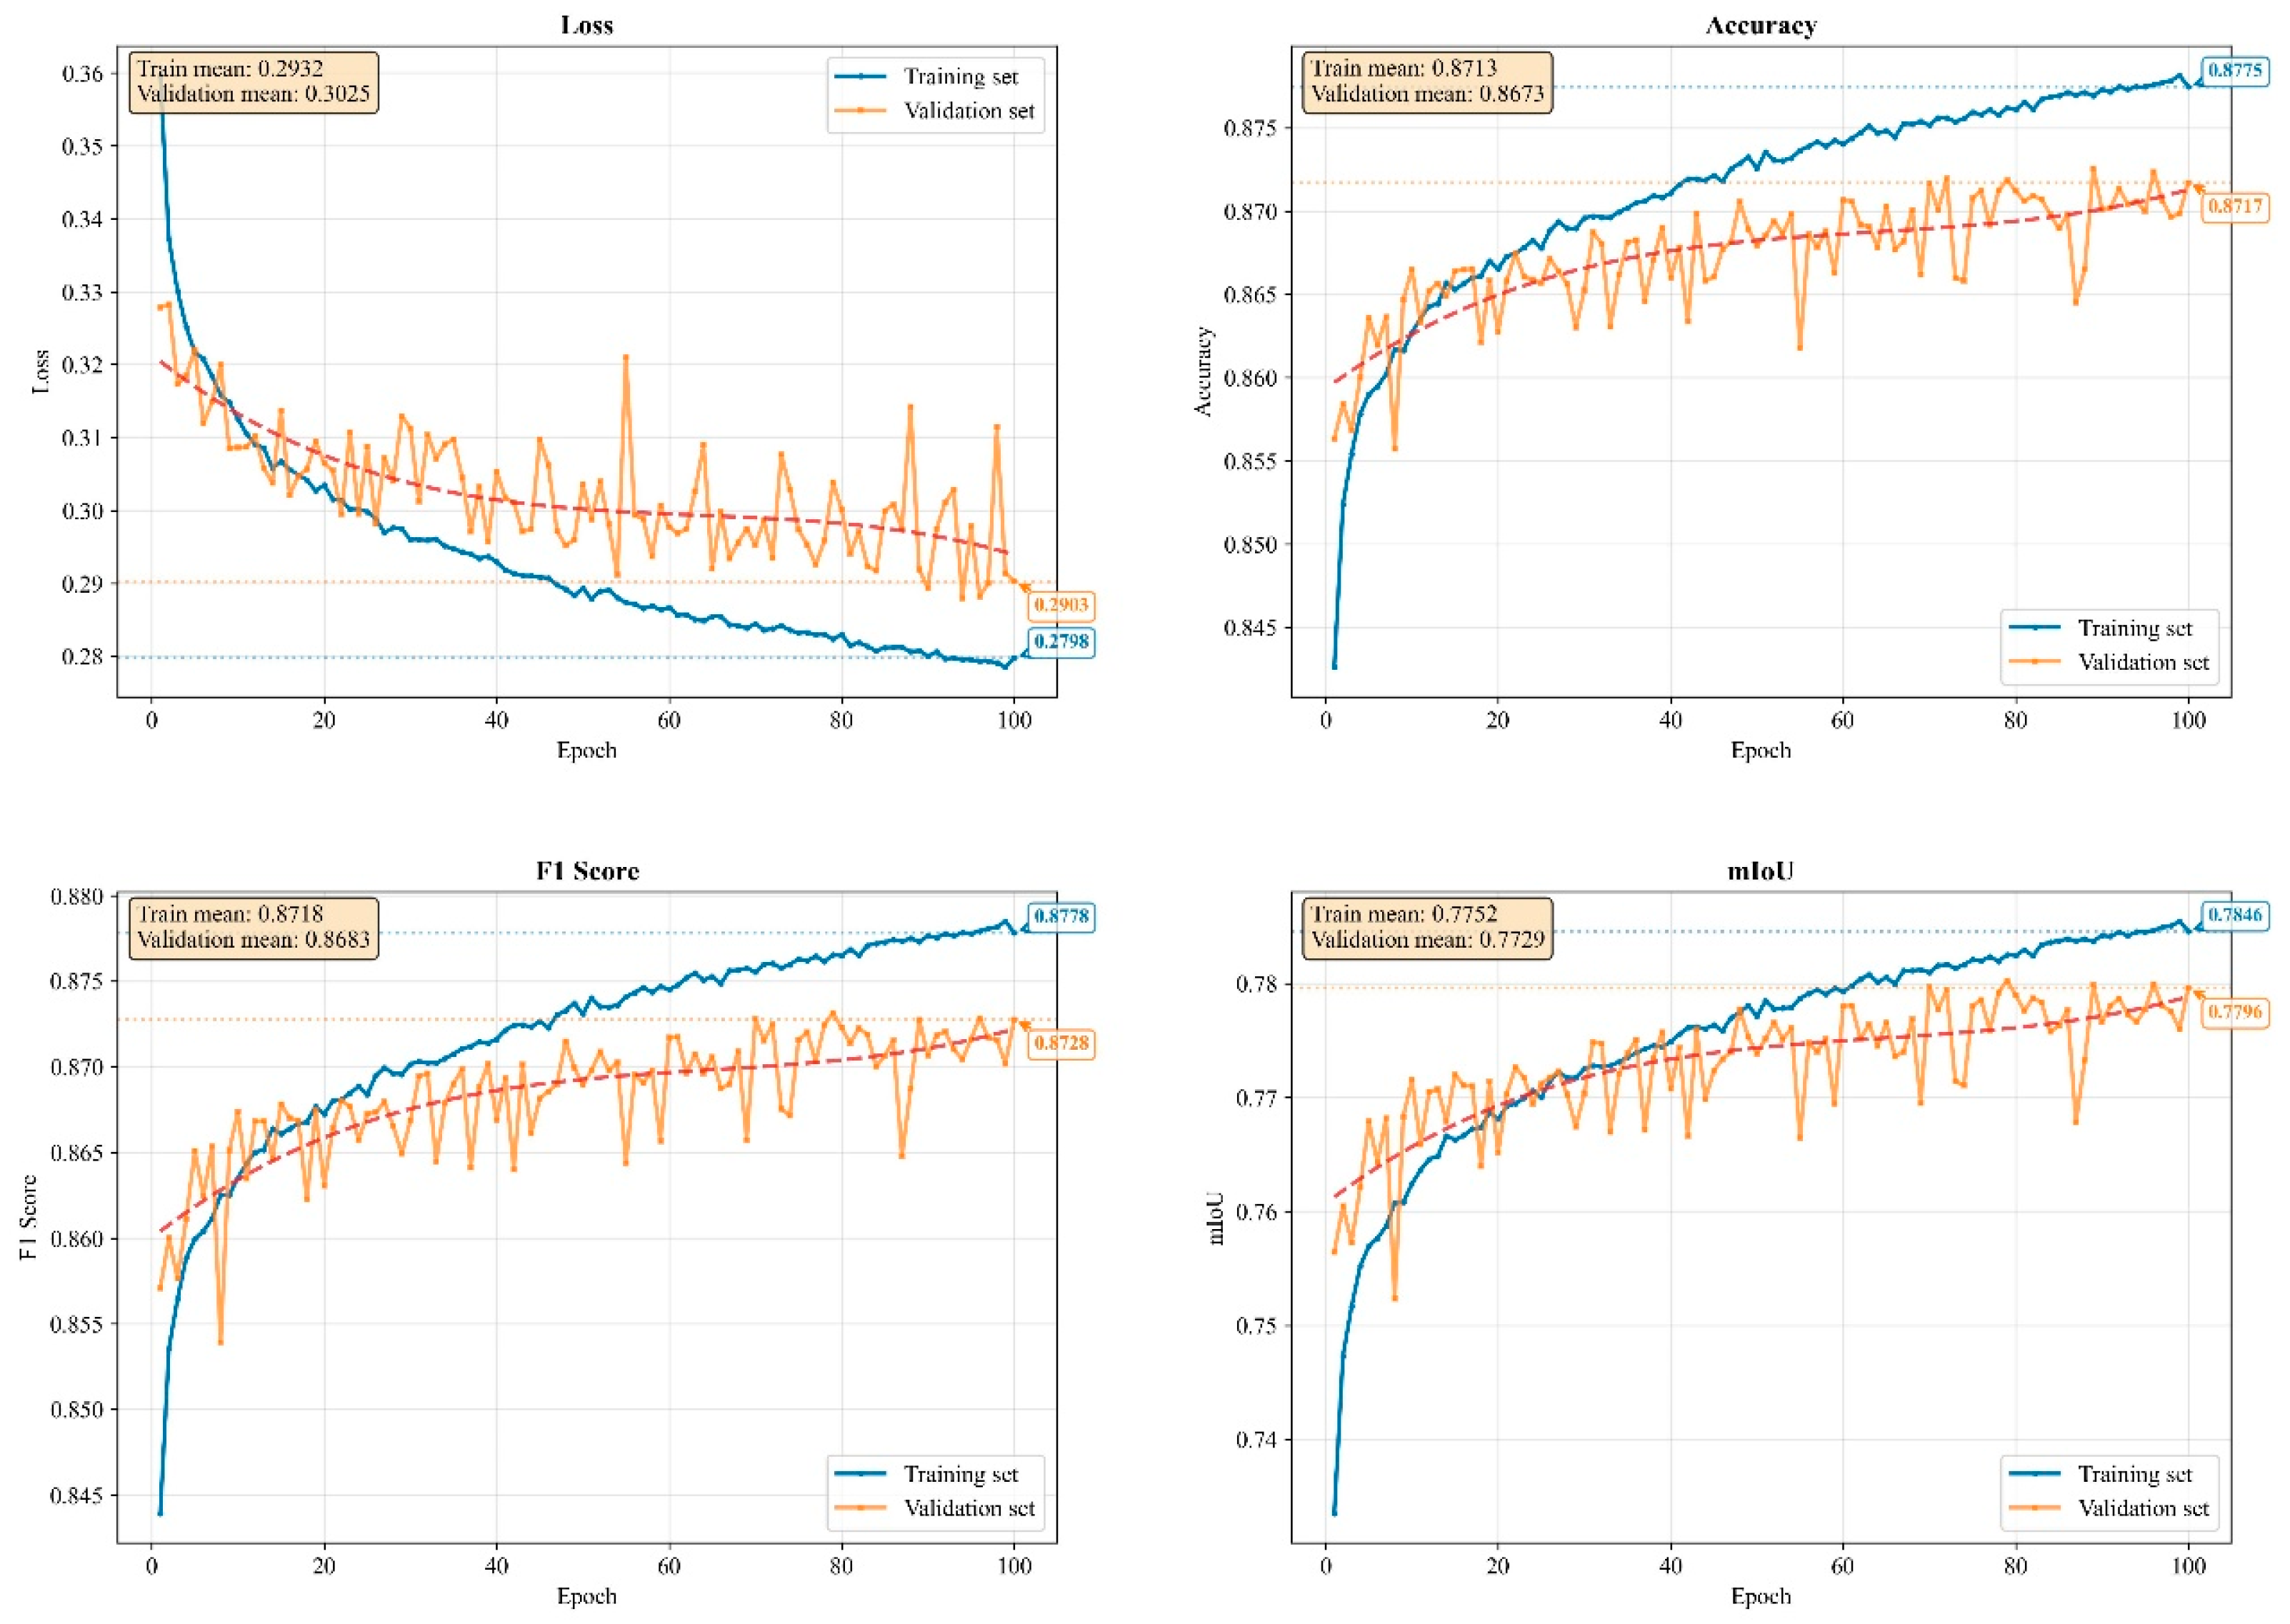
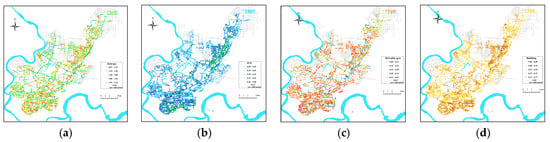
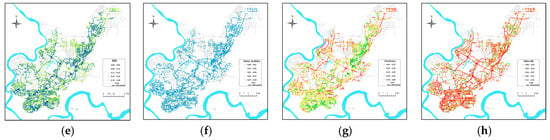
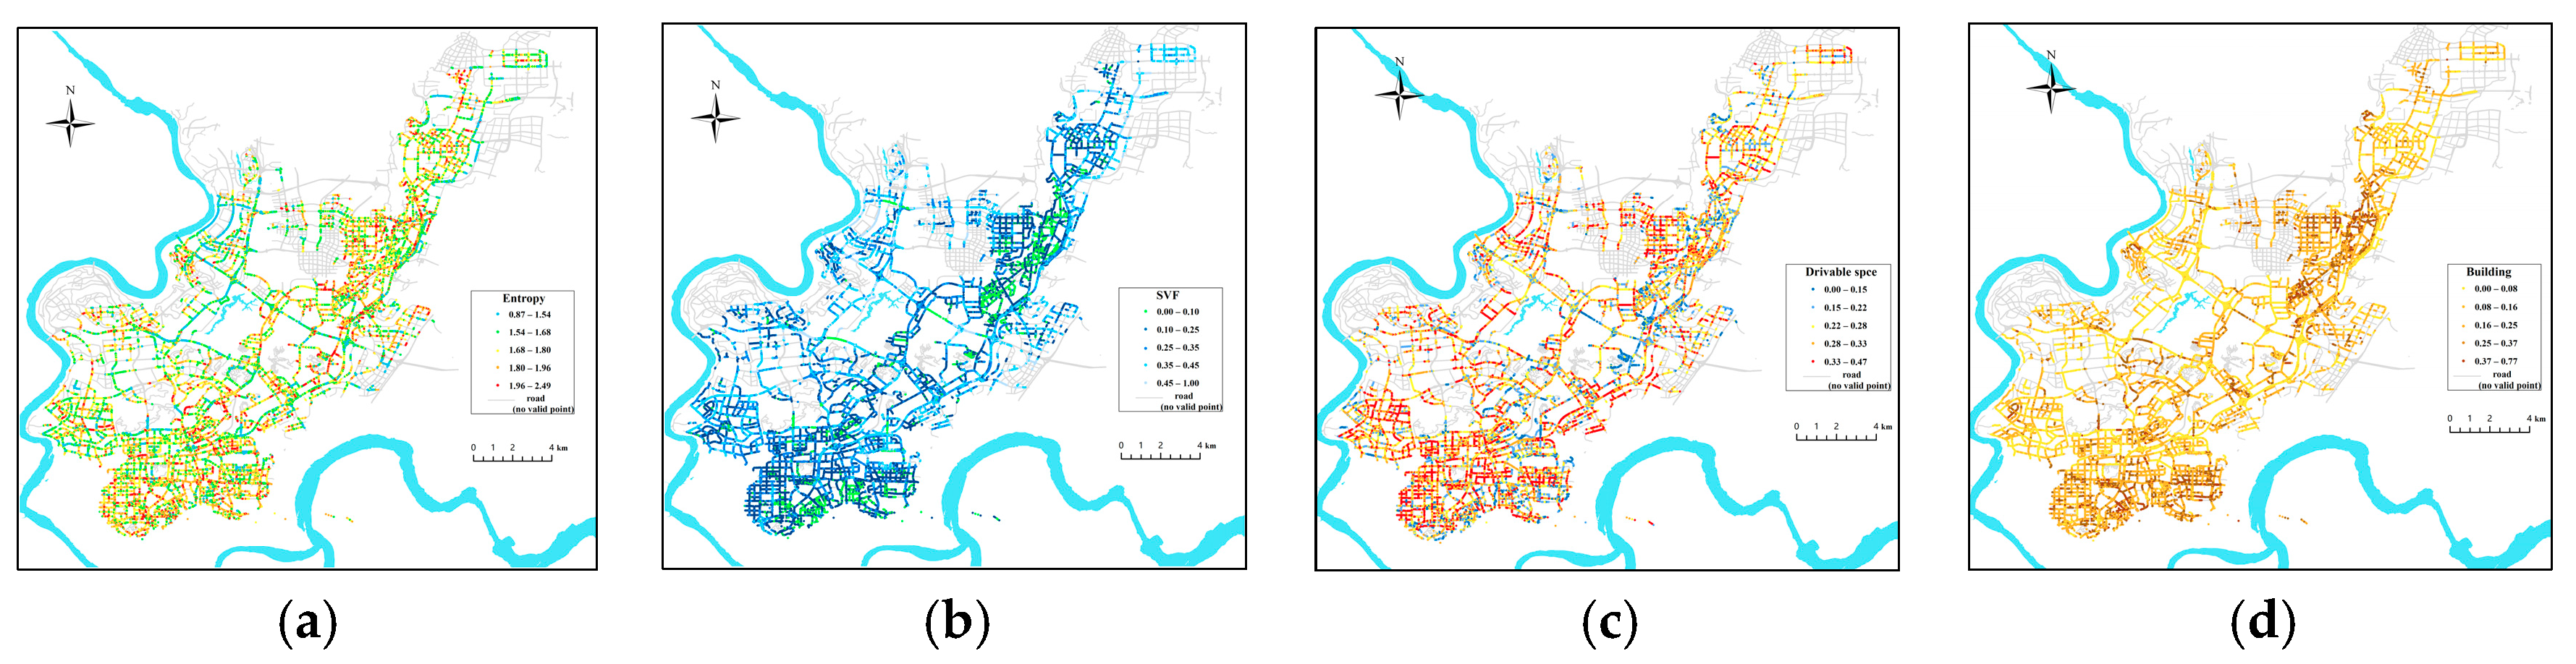
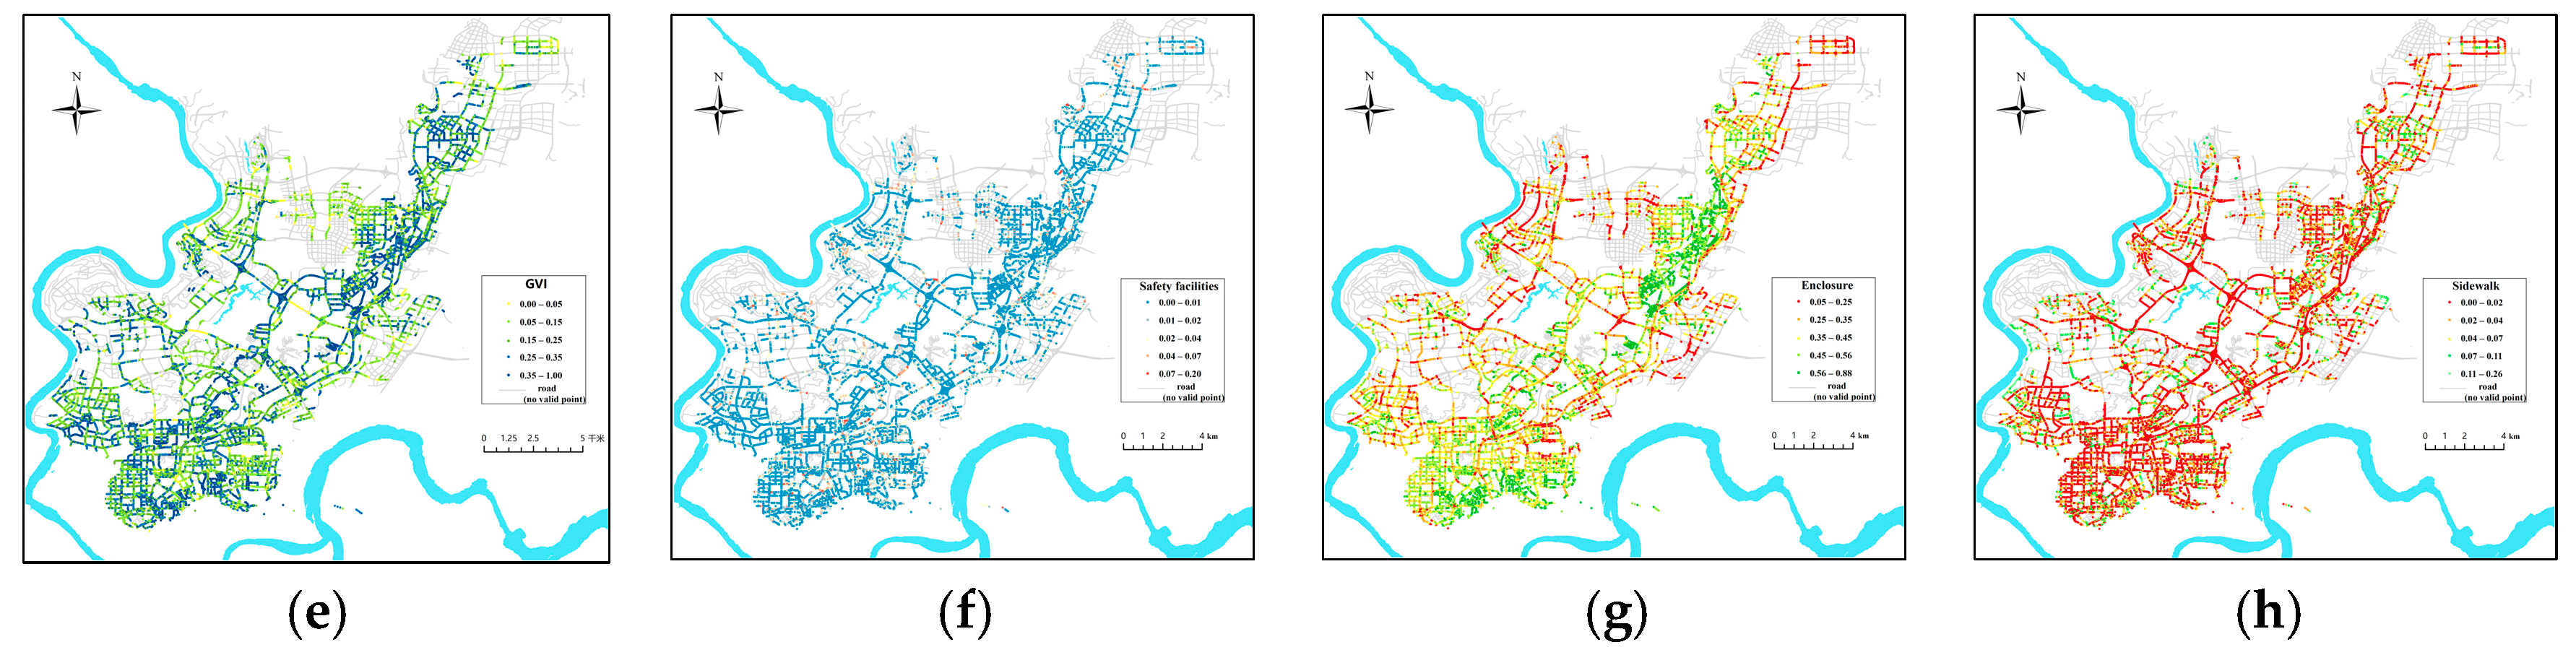
In this work, the PSP-Net model was used for semantic segmentation to identify physical elements in street view images. During the training of the model, its performance metrics were documented (Figure 7). The findings suggest that PSP-Net can effectively model global contextual dependencies and demonstrate outstanding performance in edge retention and regional consistency. The model’s metrics—accuracy, mIoU, and F1 score—achieve commendable values of 0.87, 0.78, and 0.87, respectively. The loss function exhibited a consistent decrease throughout the training process, while the validation set performance demonstrated a steady improvement. This observation underscores the model’s robust convergence and generalization capabilities. The training dataset, named ade20k, contains labels for 150 physical elements, including sky, vegetation, buildings, pedestrians, and vehicles. The model measures their proportions within images, calculates feature factors for each element based on segmentation results, and visualizes the spatial distribution of these factors (Figure 8).
Figure 7.
Four evaluation metrics for PSP-Net model training.(The red dashed lines represent the fitted curve for the training process).
Figure 8.
Distribution patterns in feature factor space: (a) Visual Entropy; (b) Sky view factor; (c) Drivable space; (d) Buildings; (e) Green view index; (f) Safety facilities; (g) Enclosure; and (h) Sidewalk.
4.2. Ablation Analysis
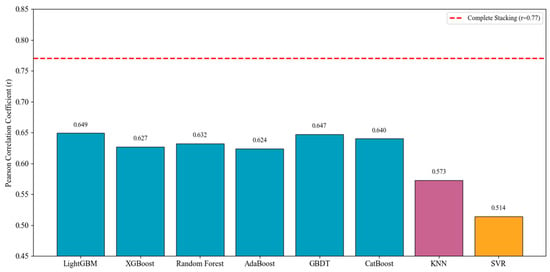
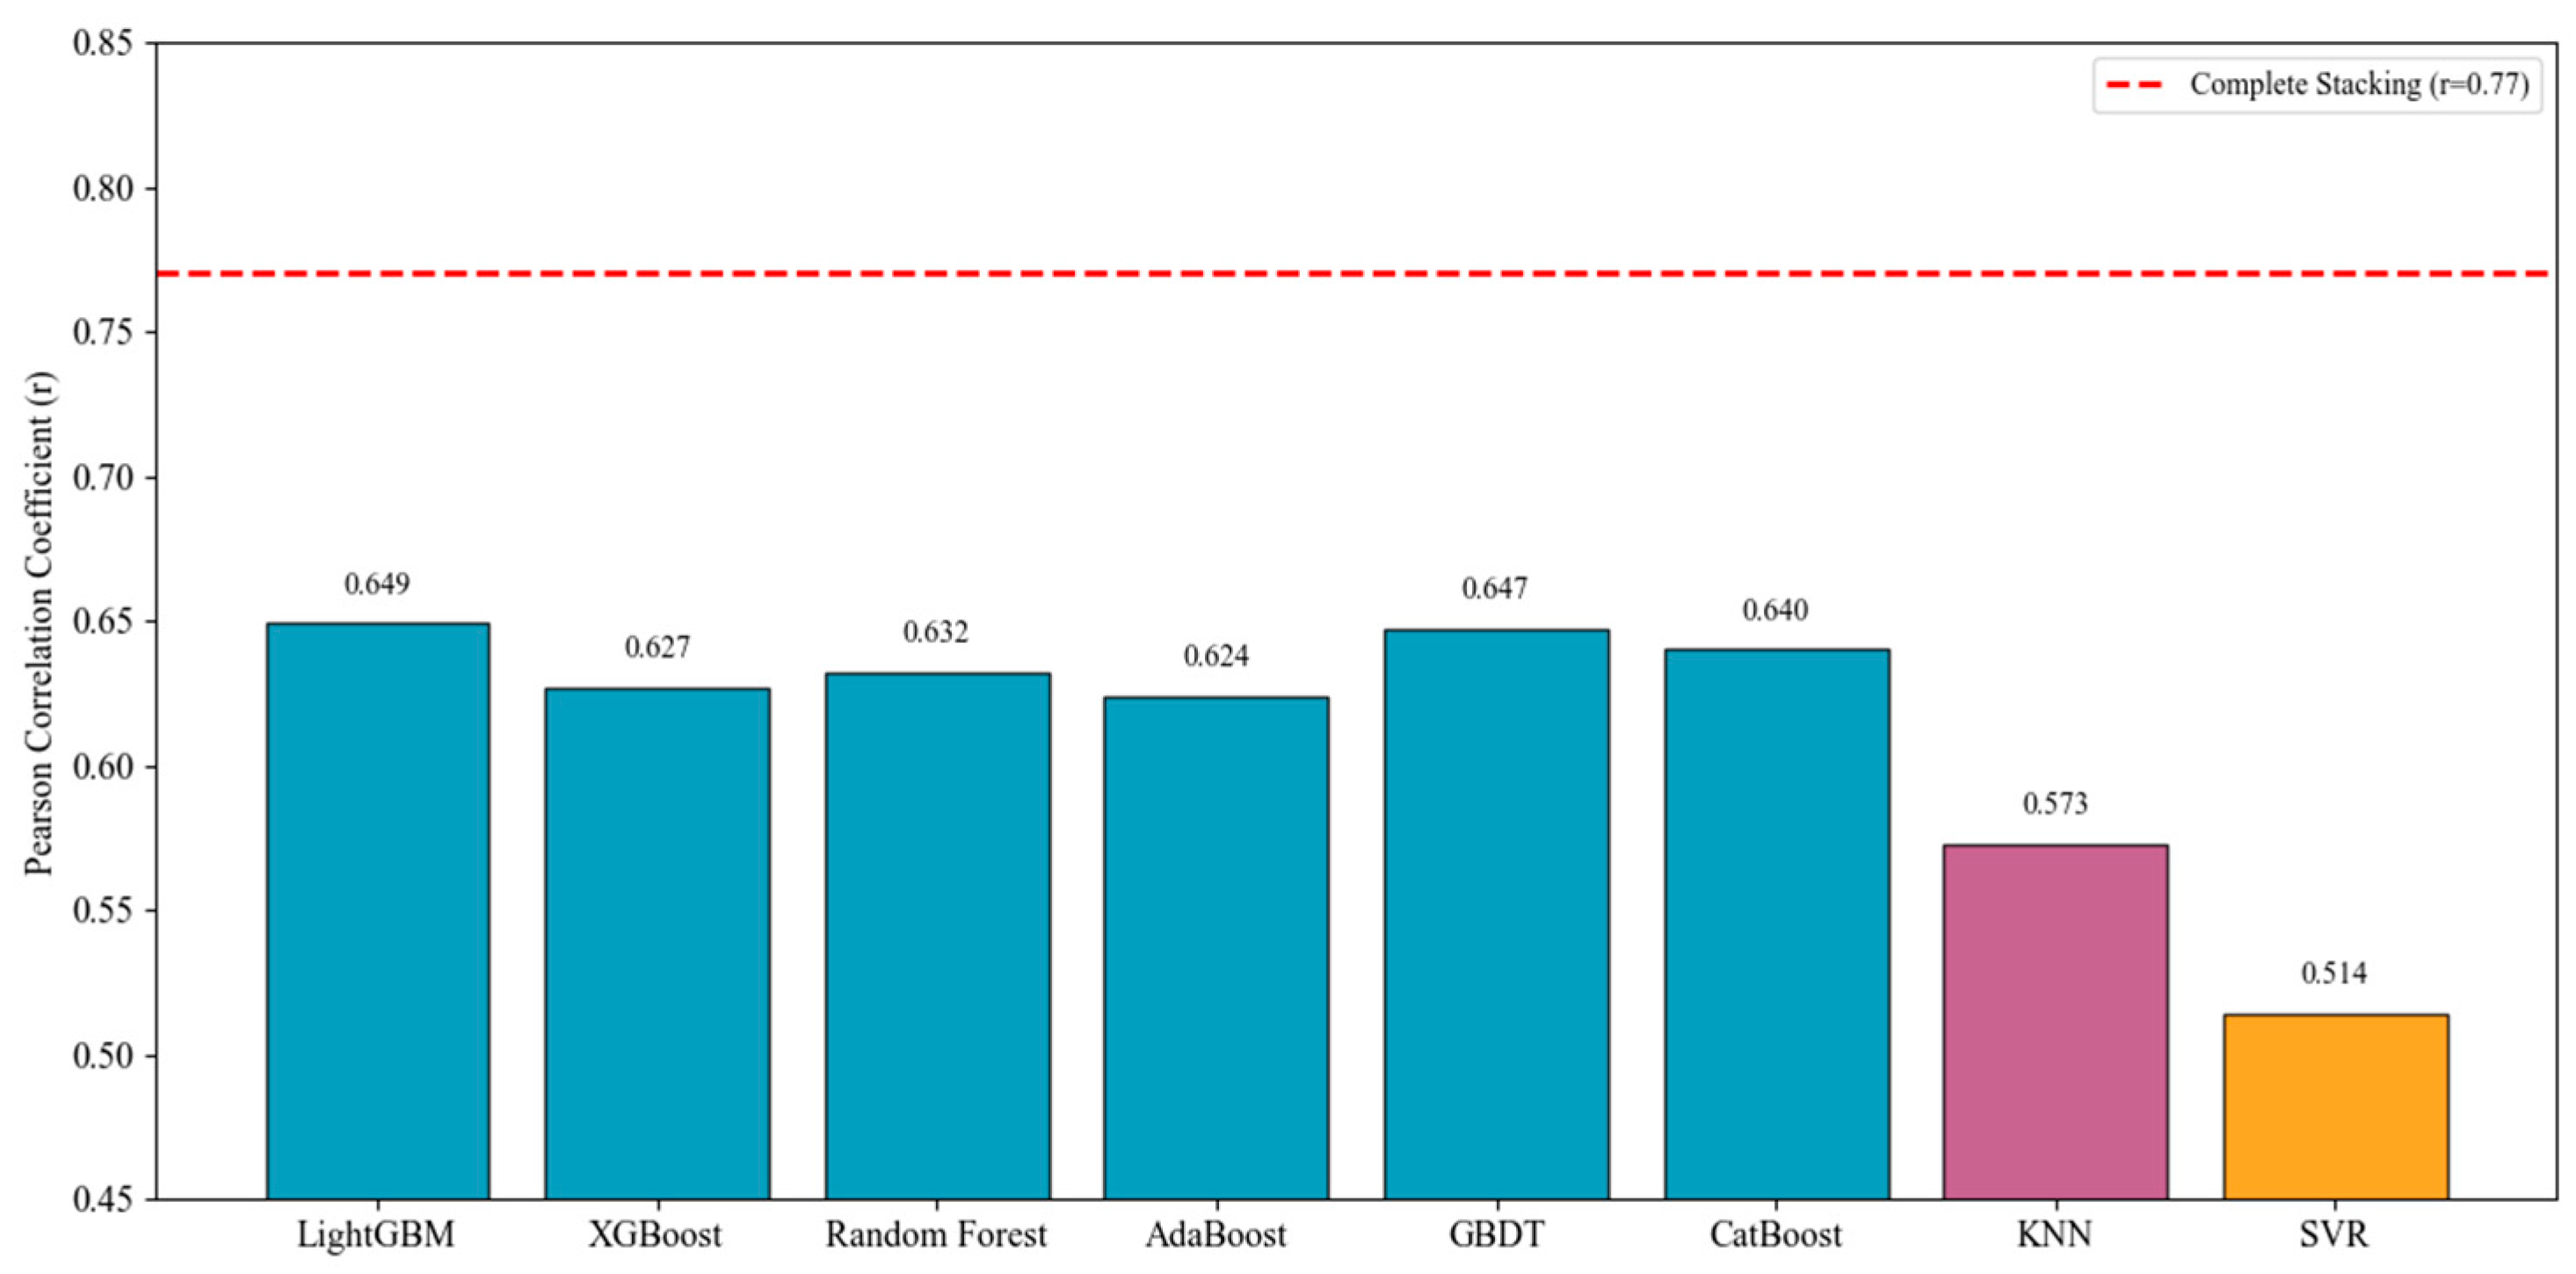
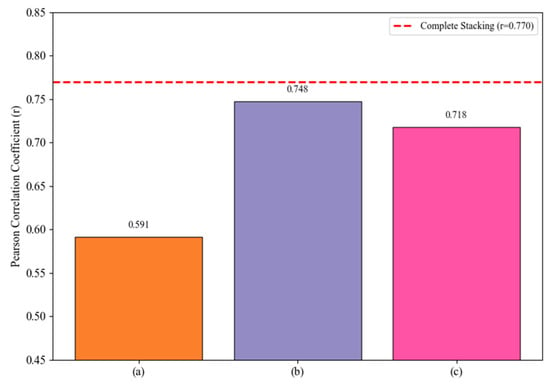
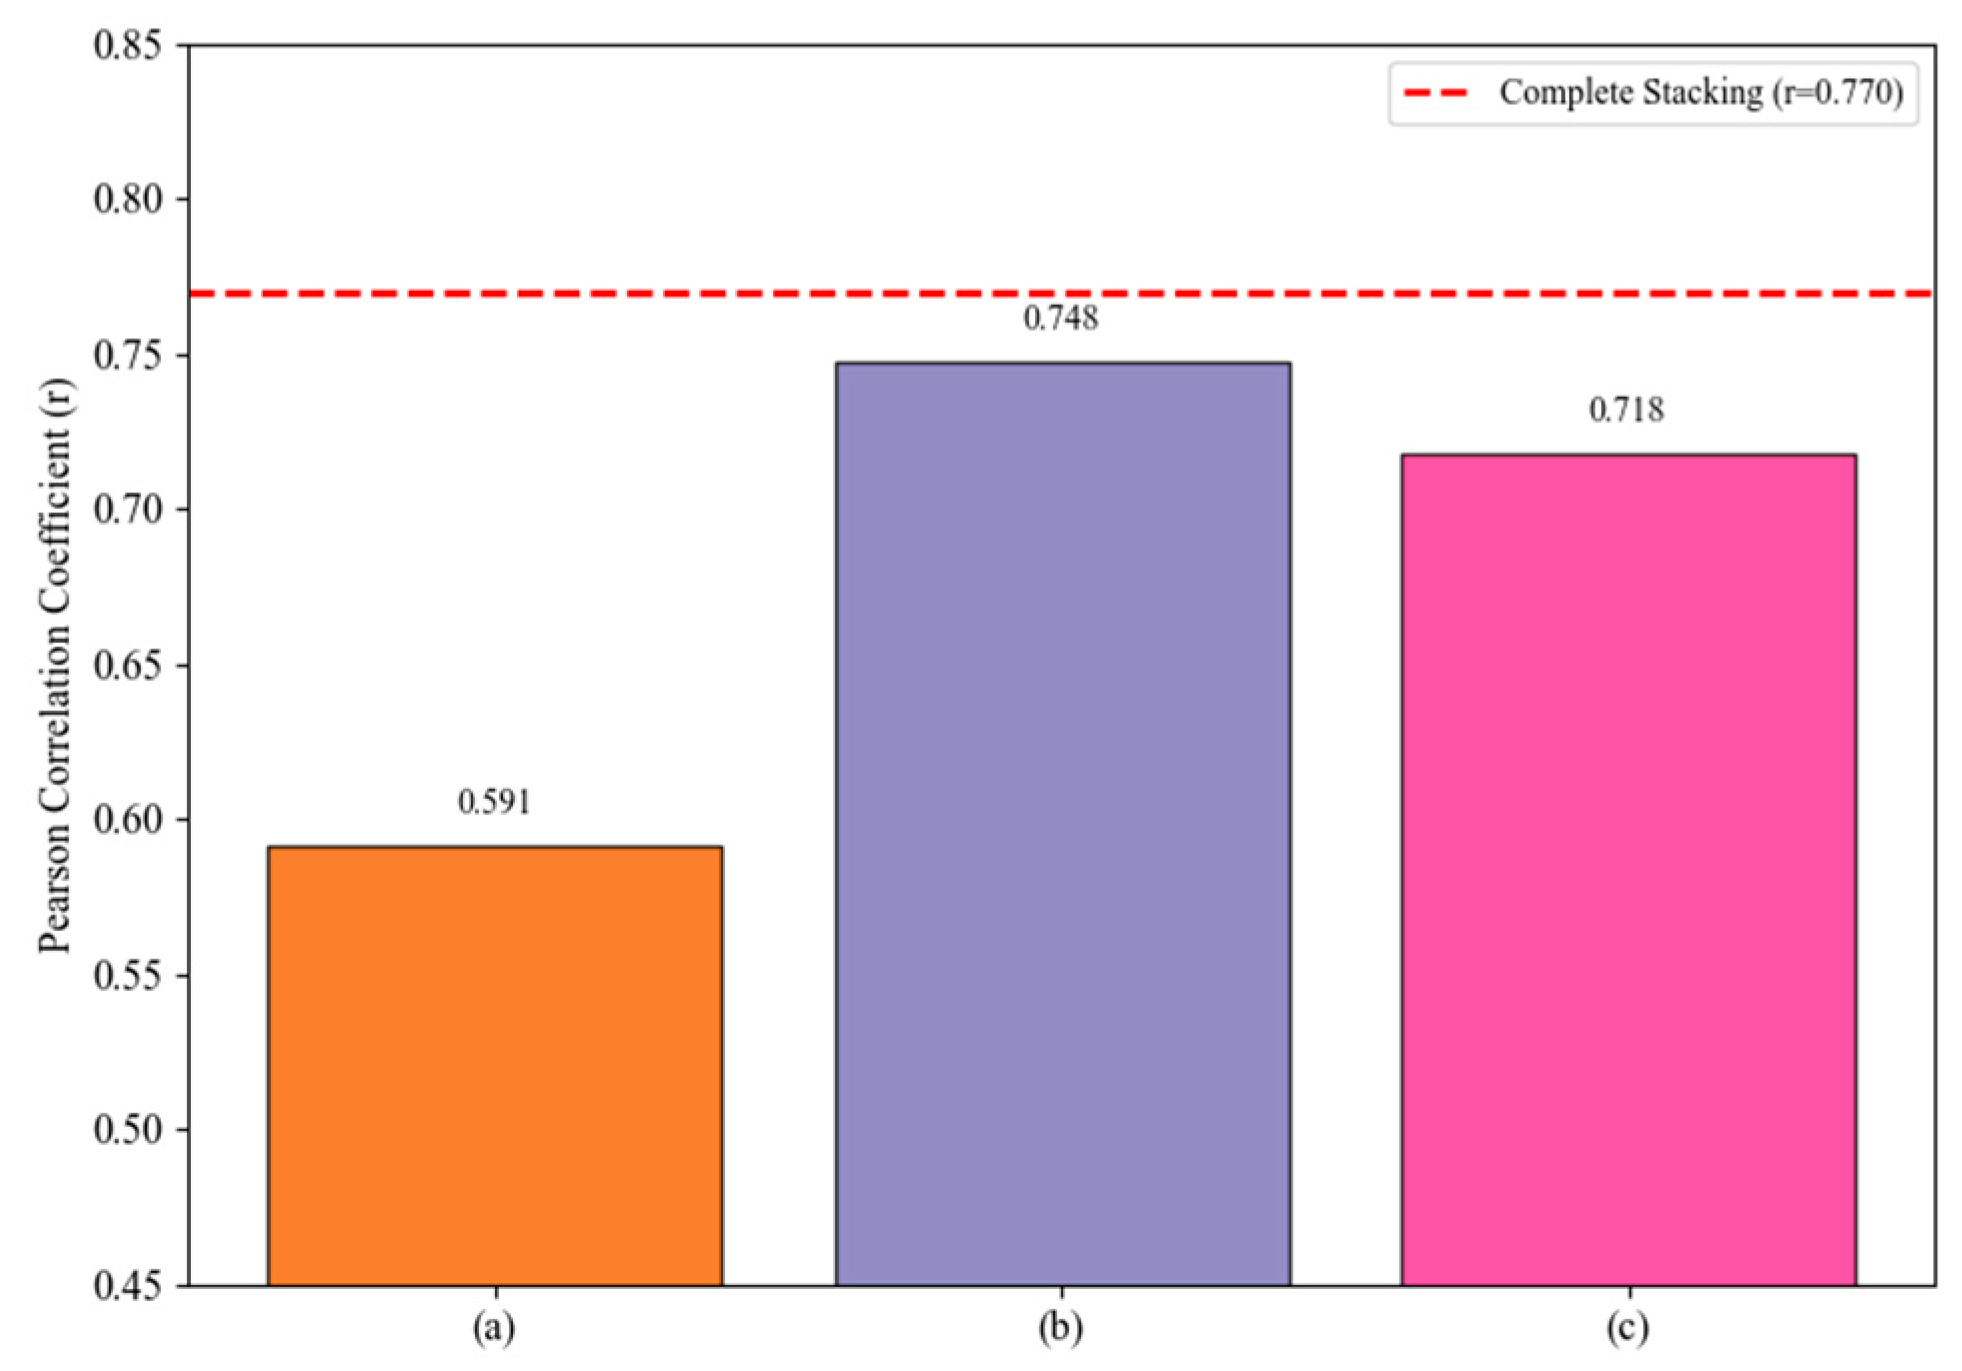
To elucidate the mechanisms underlying the various components of the Stacking integration framework, this paper conducted ablation experiments to compare the impact of different base model combinations on predictive performance. The results are shown in Figure 9 and Figure 10. In terms of the performance of individual base models (Figure 9), the correlation coefficients of tree-based models (LightGBM, GBDT, CatBoost, XGBoost, RF, AdaBoost) were generally higher than those of KNN and SVR. Among them, LightGBM performed best (r = 0.649), while SVR performed worst (r = 0.514). This difference reflects the varying abilities of different model types to capture the complex mapping relationship between street visual features and perceived ratings. Through hierarchical feature partitioning, tree-based models can effectively capture nonlinear interactions and higher-order combinatorial patterns, whereas KNN and SVR have relatively limited expressive power when dealing with such high-dimensional, non-stationary data. Further analysis of the ablation results for the ensemble framework (Figure 10) reveals that removing all tree-based models causes model performance to r = 0.591, which indicates that tree models play a central role in prediction within the ensemble. After removing KNN and SVR, the model performance declined only slightly to r = 0.748; KNN and SVR are not the primary contributors to accuracy. However, the local learning capabilities and decision diversity they provide enhance the robustness of the ensemble to some extent. When the ensemble was constructed using only the top three base models (LightGBM, GBDT, and CatBoost), the model performance was r = 0.718, which was significantly lower than that of the full ensemble. The result reveals that the performance advantage of base models cannot fully substitute for the diversity advantage. Even for combinations of relatively high-performing base models, if they lack sufficient heterogeneity, their complementary effects will be weakened, thereby limiting the overall generalization ability of the ensemble.
Figure 9.
Performance Comparison of Each Base Model.
Figure 10.
Performance Comparison of Three Ablation Experiments. (a) Remove tree models. (b) Remove KNN and SVR. (c) Only top 3 models.
4.3. Correlation Analysis
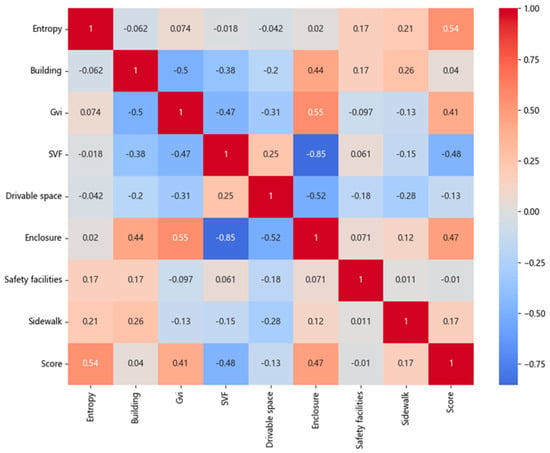
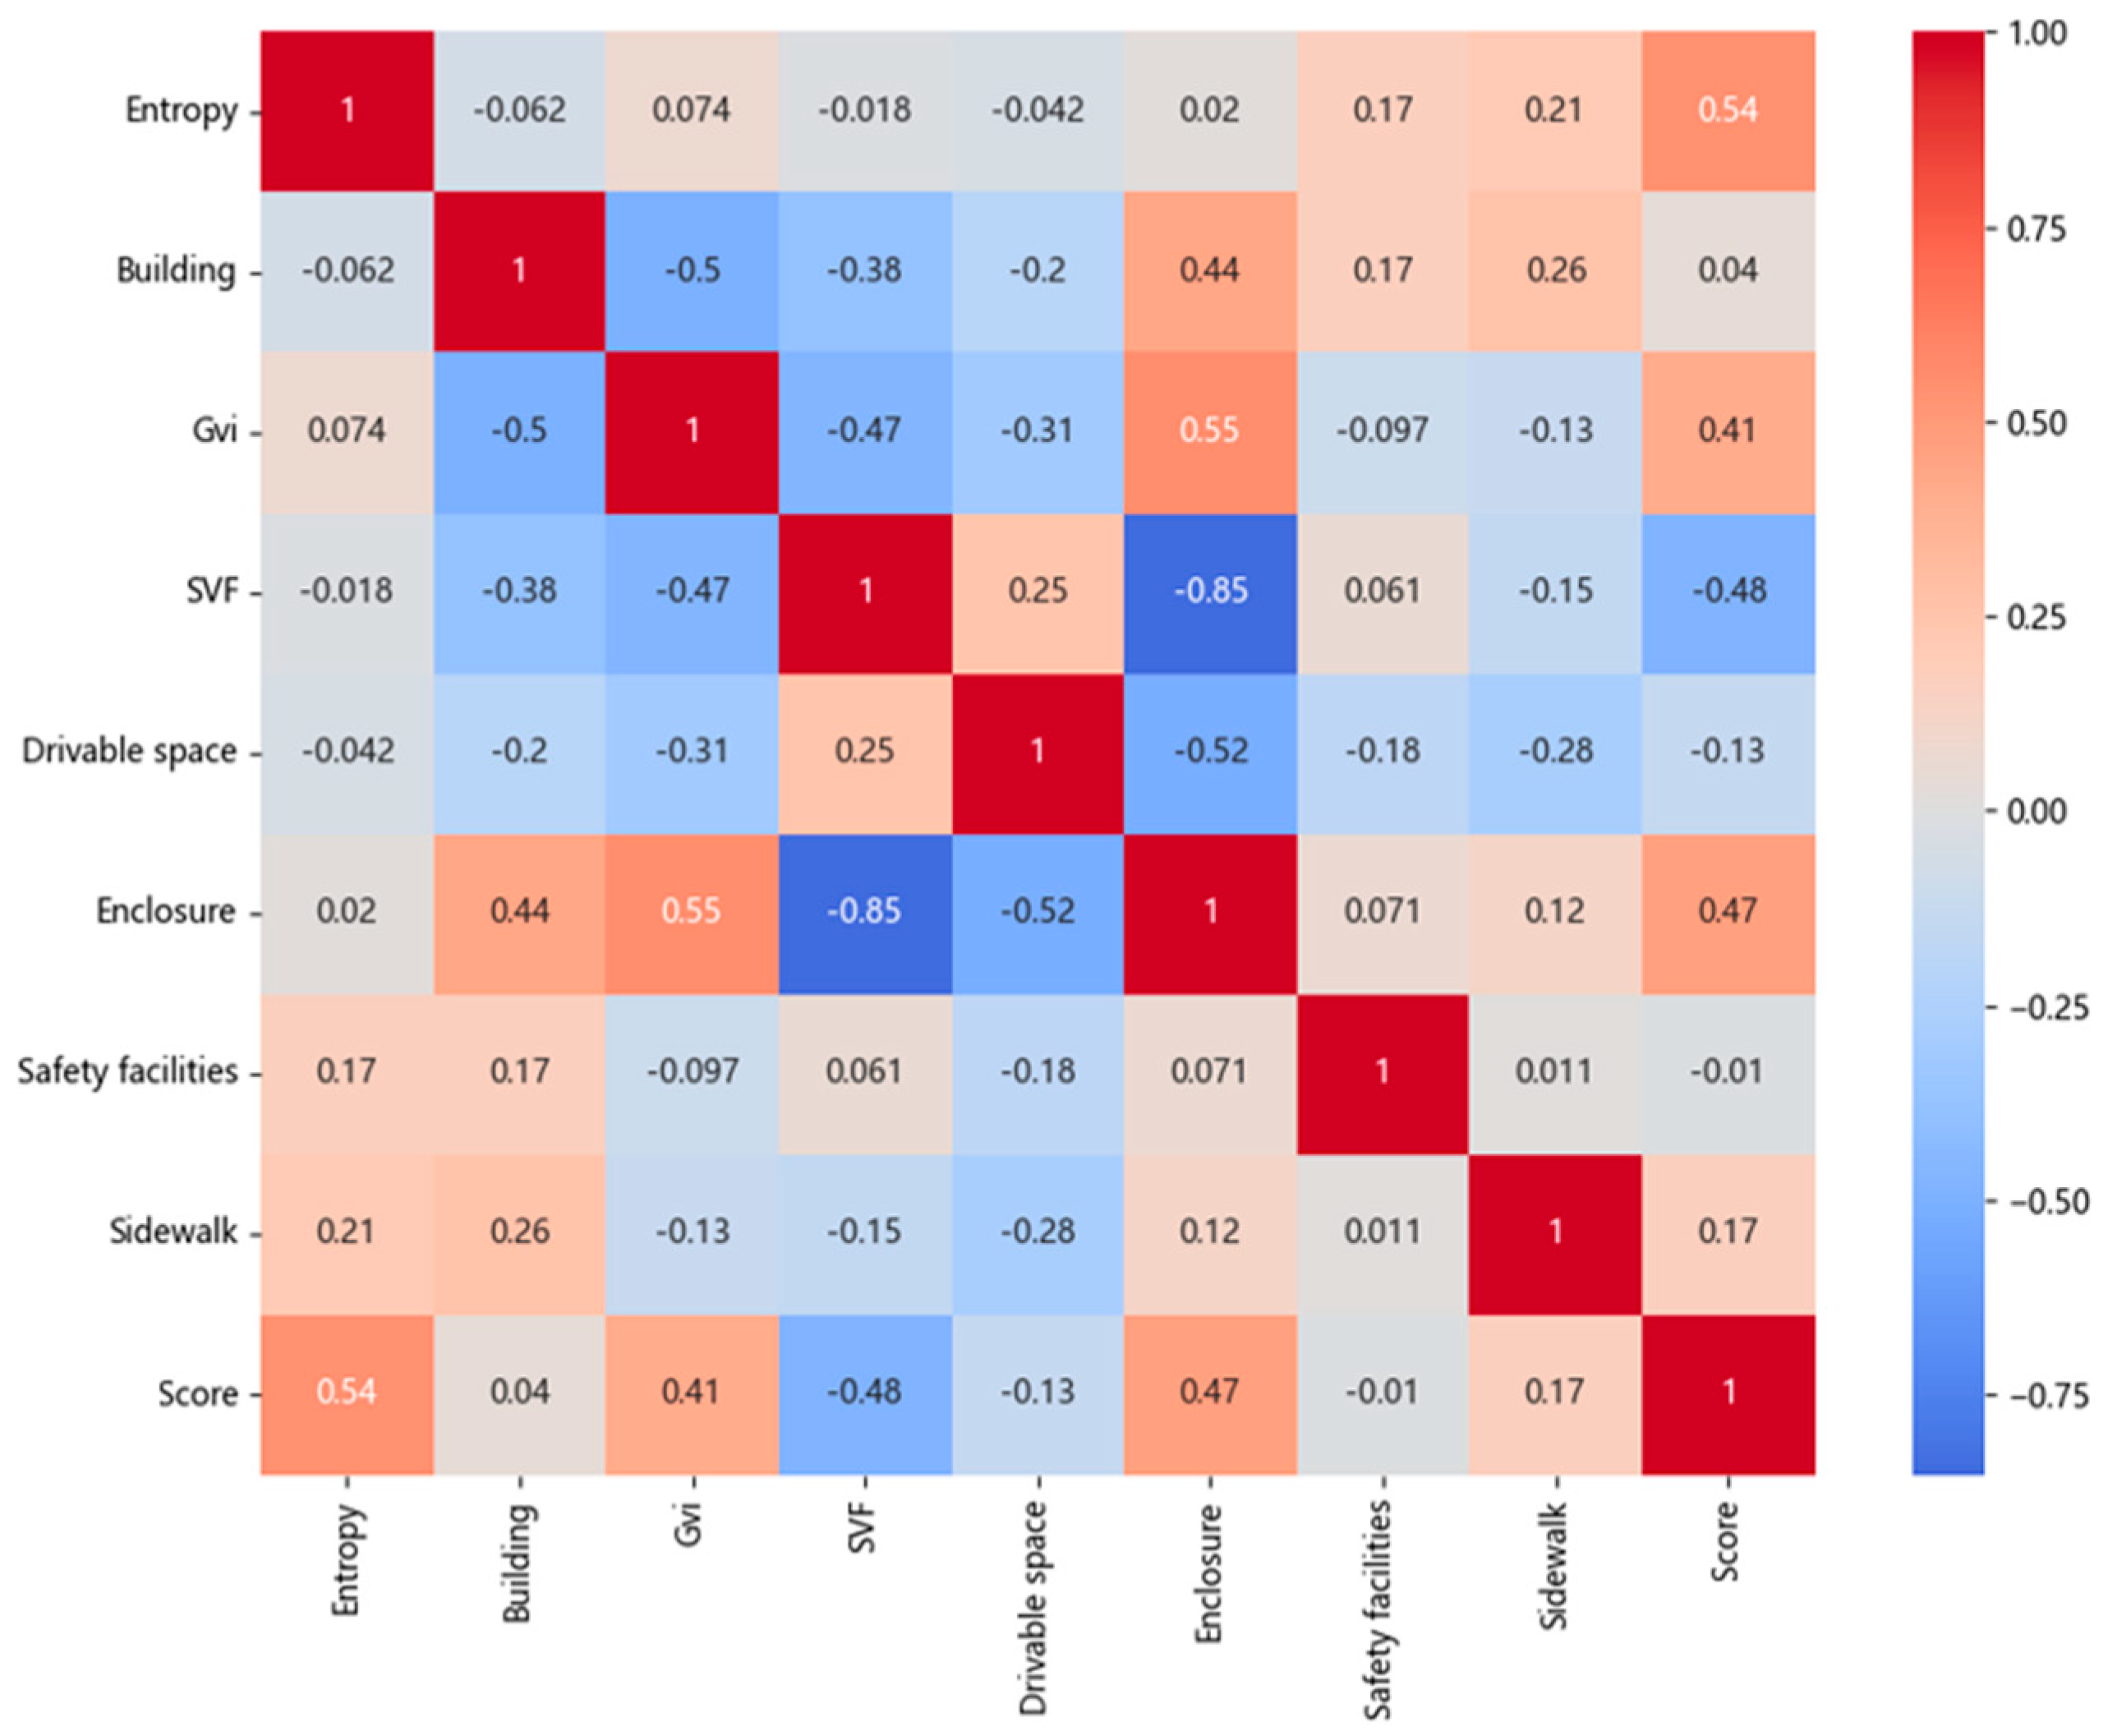
As described in Figure 11, the correlations between the eight feature factors and the target scores were analyzed. Among the eight factors in Yubei District, Visual Entropy (Entropy), Green View Index (GVI), and Enclosure demonstrated a strong correlation with the predicted score. The correlation coefficients for the variables of Building, Safety Facilities, and Sidewalk were found to be less significant in relation to the score. This phenomenon is closely tied to the unique spatial form of Yubei District as a mountainous city. Higher Visual Entropy is indicative of rich visual information and complex layering in the streetscape, which aligns with the staggered building layout and diverse skyline formed by the undulating terrain of mountainous cities. This approach has been demonstrated to convey visual vitality and richness to a certain extent. However, it is important to note that excessively high Entropy values may also be indicative of visual clutter, particularly in areas with high building density and narrow streets, which can evoke a sense of oppression. The substantial correlation with the Green Visual Index (GVI) suggests that the incorporation of natural elements into urban environments significantly mitigates the oppressive sensation caused by dense urban development, thereby enhancing visual comfort. Moreover, the concept of enclosure, as a pivotal factor, directly correlates with the spatial characteristics that are prevalent in mountainous cities, including imbalanced height-to-width ratios and narrow streets. The implementation of appropriate enclosures facilitates the establishment of clear spatial boundaries, thereby engendering a sense of pedestrian-scale security. Therefore, in mountainous urban environments such as Yubei District, visual quality is profoundly influenced by unique topography and spatial structure. Future street visual enhancements should prioritise the management of visual complexity, with a strategic introduction of green elements, and the management of appropriate enclosure relationships, with the objective of achieving visual comfort and elevated spatial quality.
Figure 11.
Correlation matrix between eight feature factors and score.
4.4. Perceiving Prediction Results
The trained model was used to predict scores for street view images, which were collected from sampling points in Yubei District and predictions were then spatially visualised based on score magnitude. As demonstrated in Figure 12 and Figure 13, the predicted perception scores and their spatial distribution are illustrated.
Figure 12.
Predicted street scene scores for Yubei District.
Figure 13.
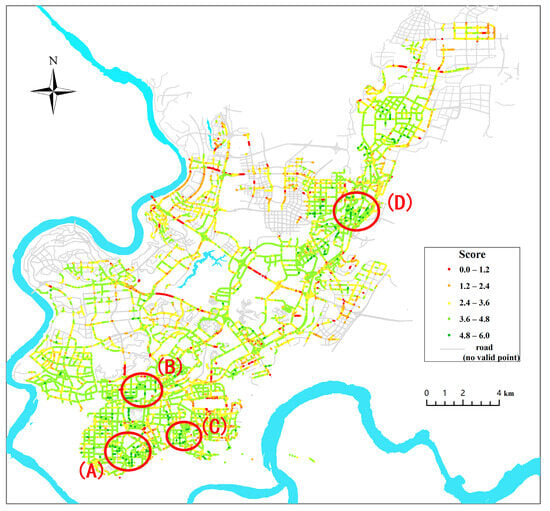
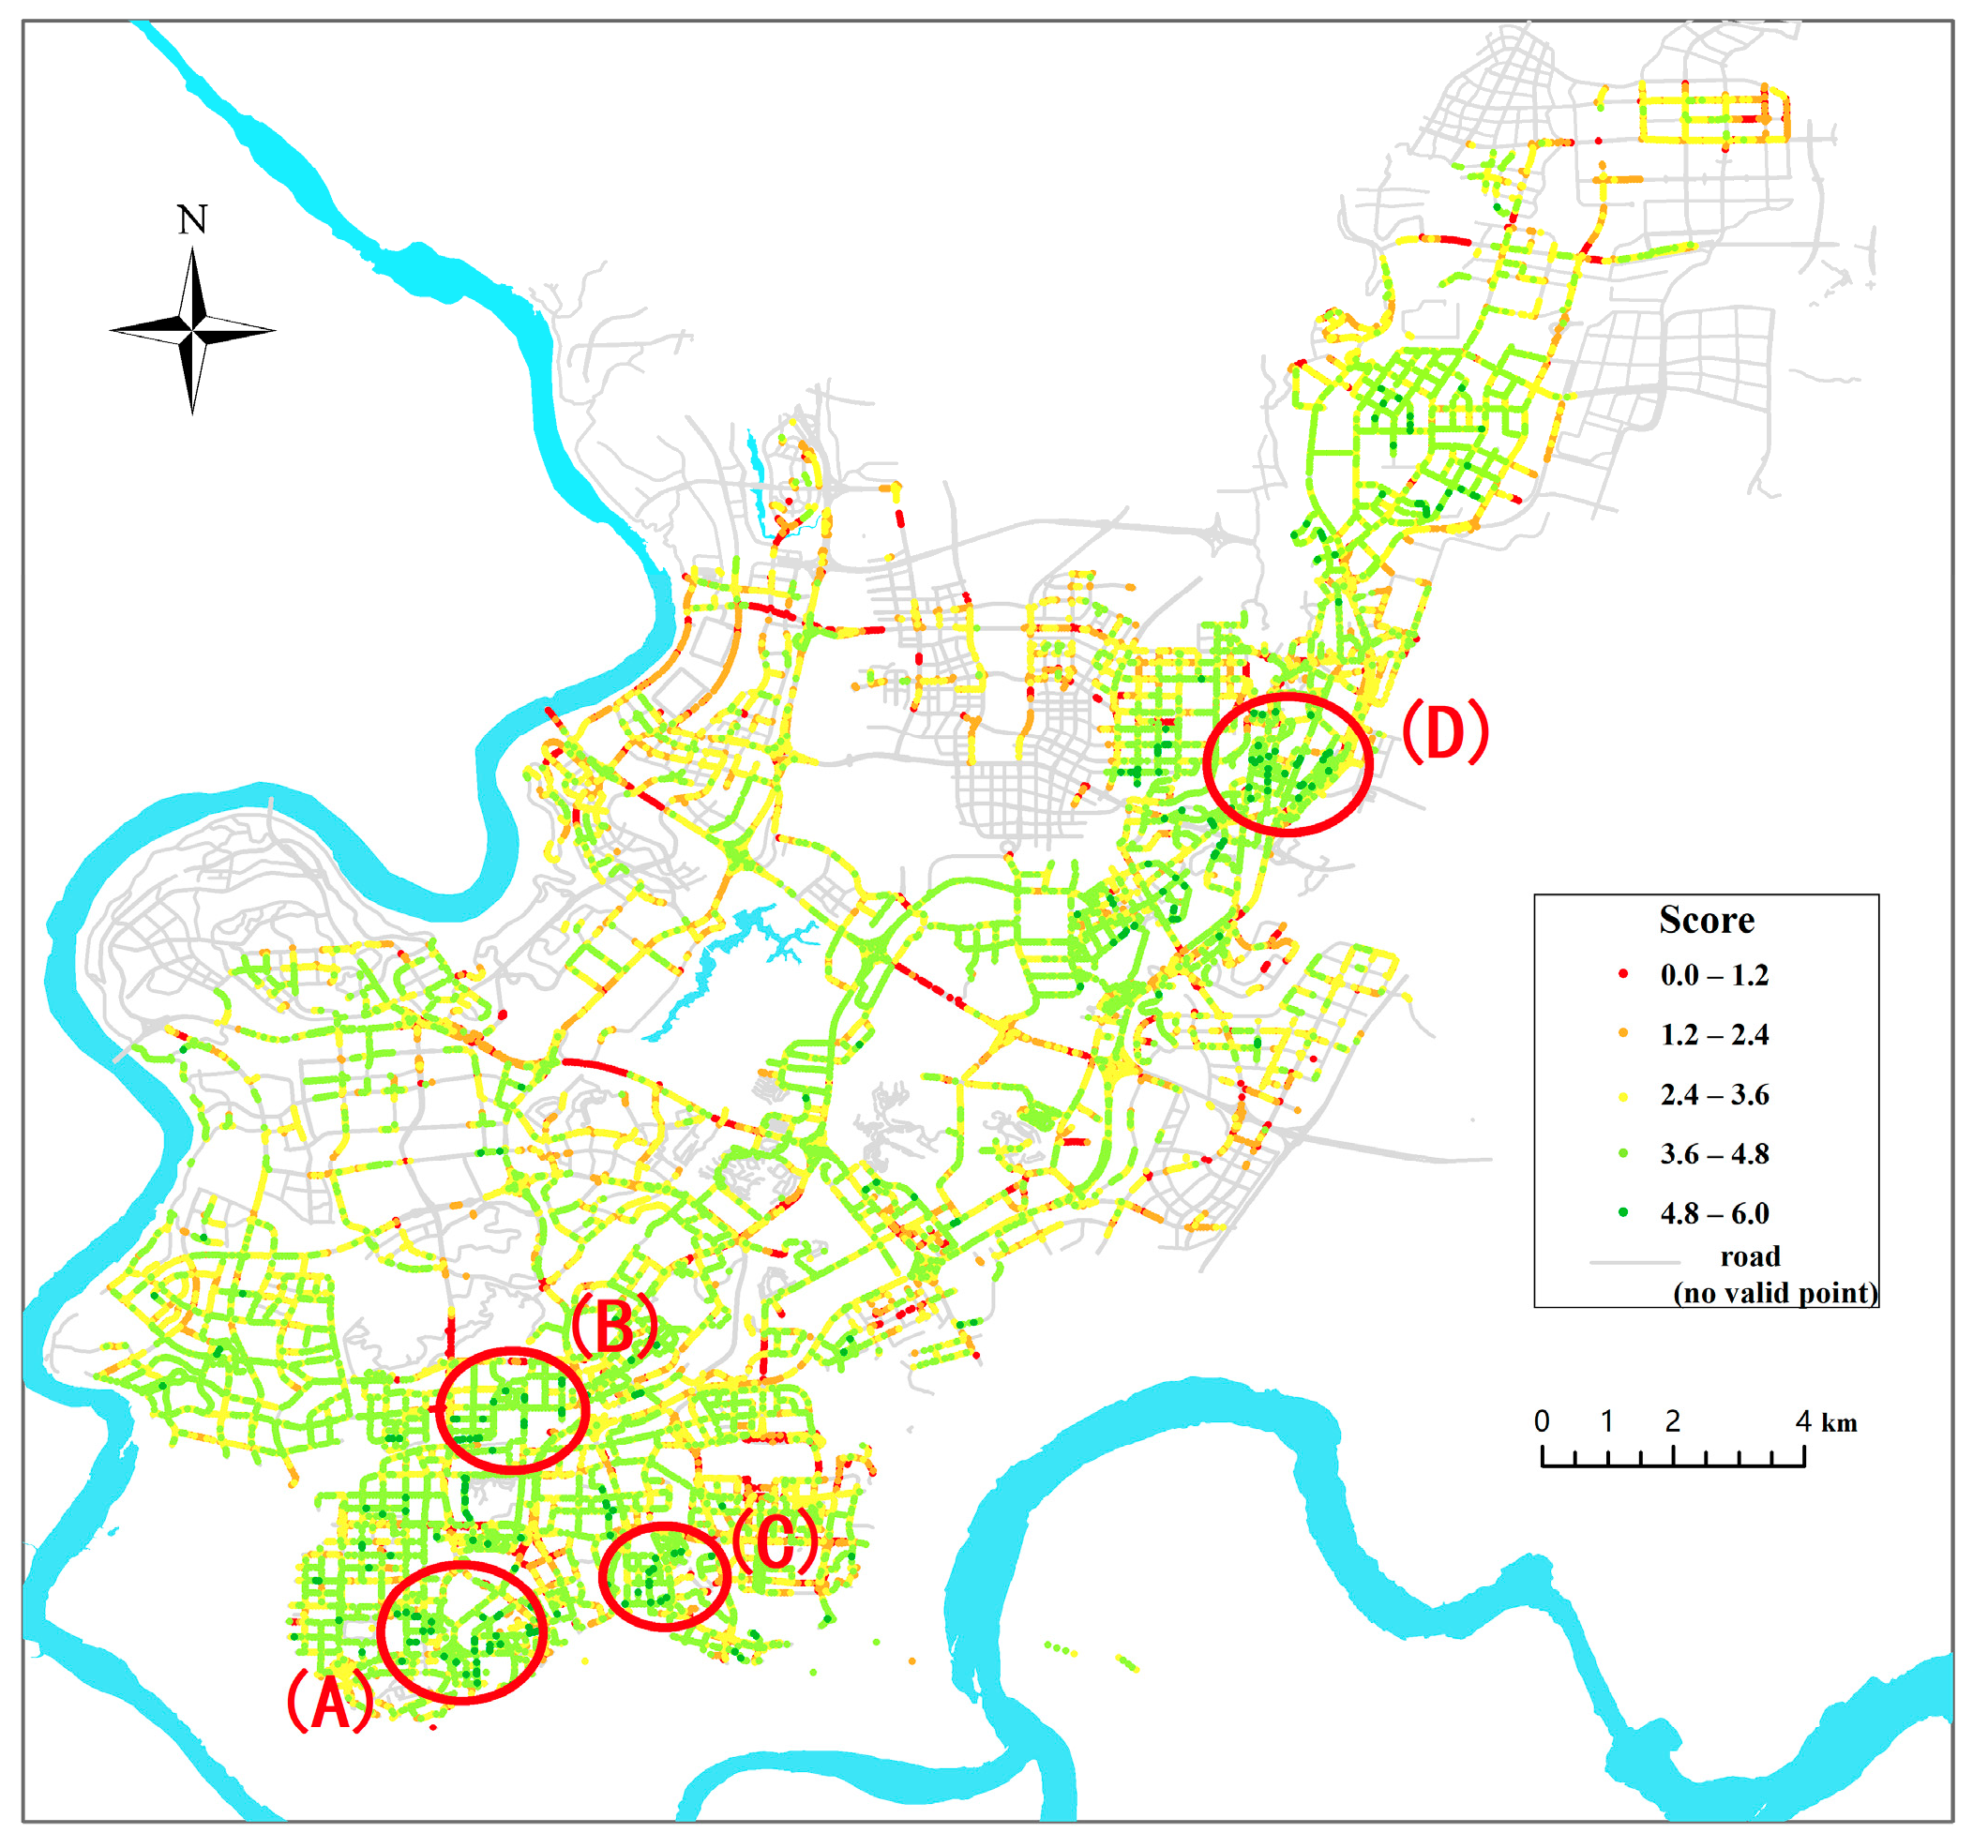
Visual quality scores in Yubei District. (A) Dalongshan Park to Flower Garden; (B) North of Longhu Xiangzhang Villa Area to Caifu Avenue; (C) Ziwei Road—Tianhe Road—Ziyuan Road—Zikang Road; and (D) South of Shuanglong Lake—Shuanglong Avenue—Shuanglong West Road—Longxing Street—Longrui Street.
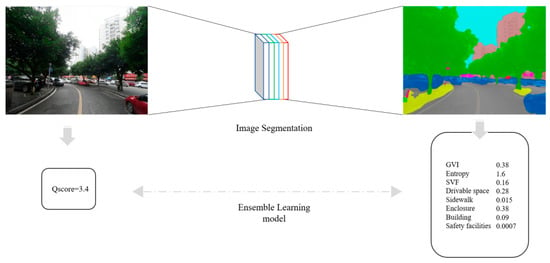
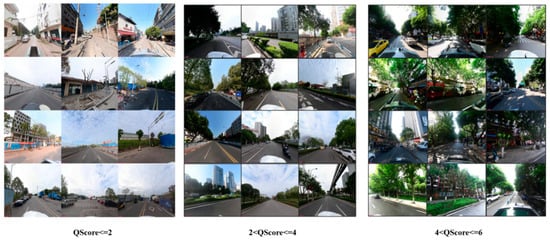
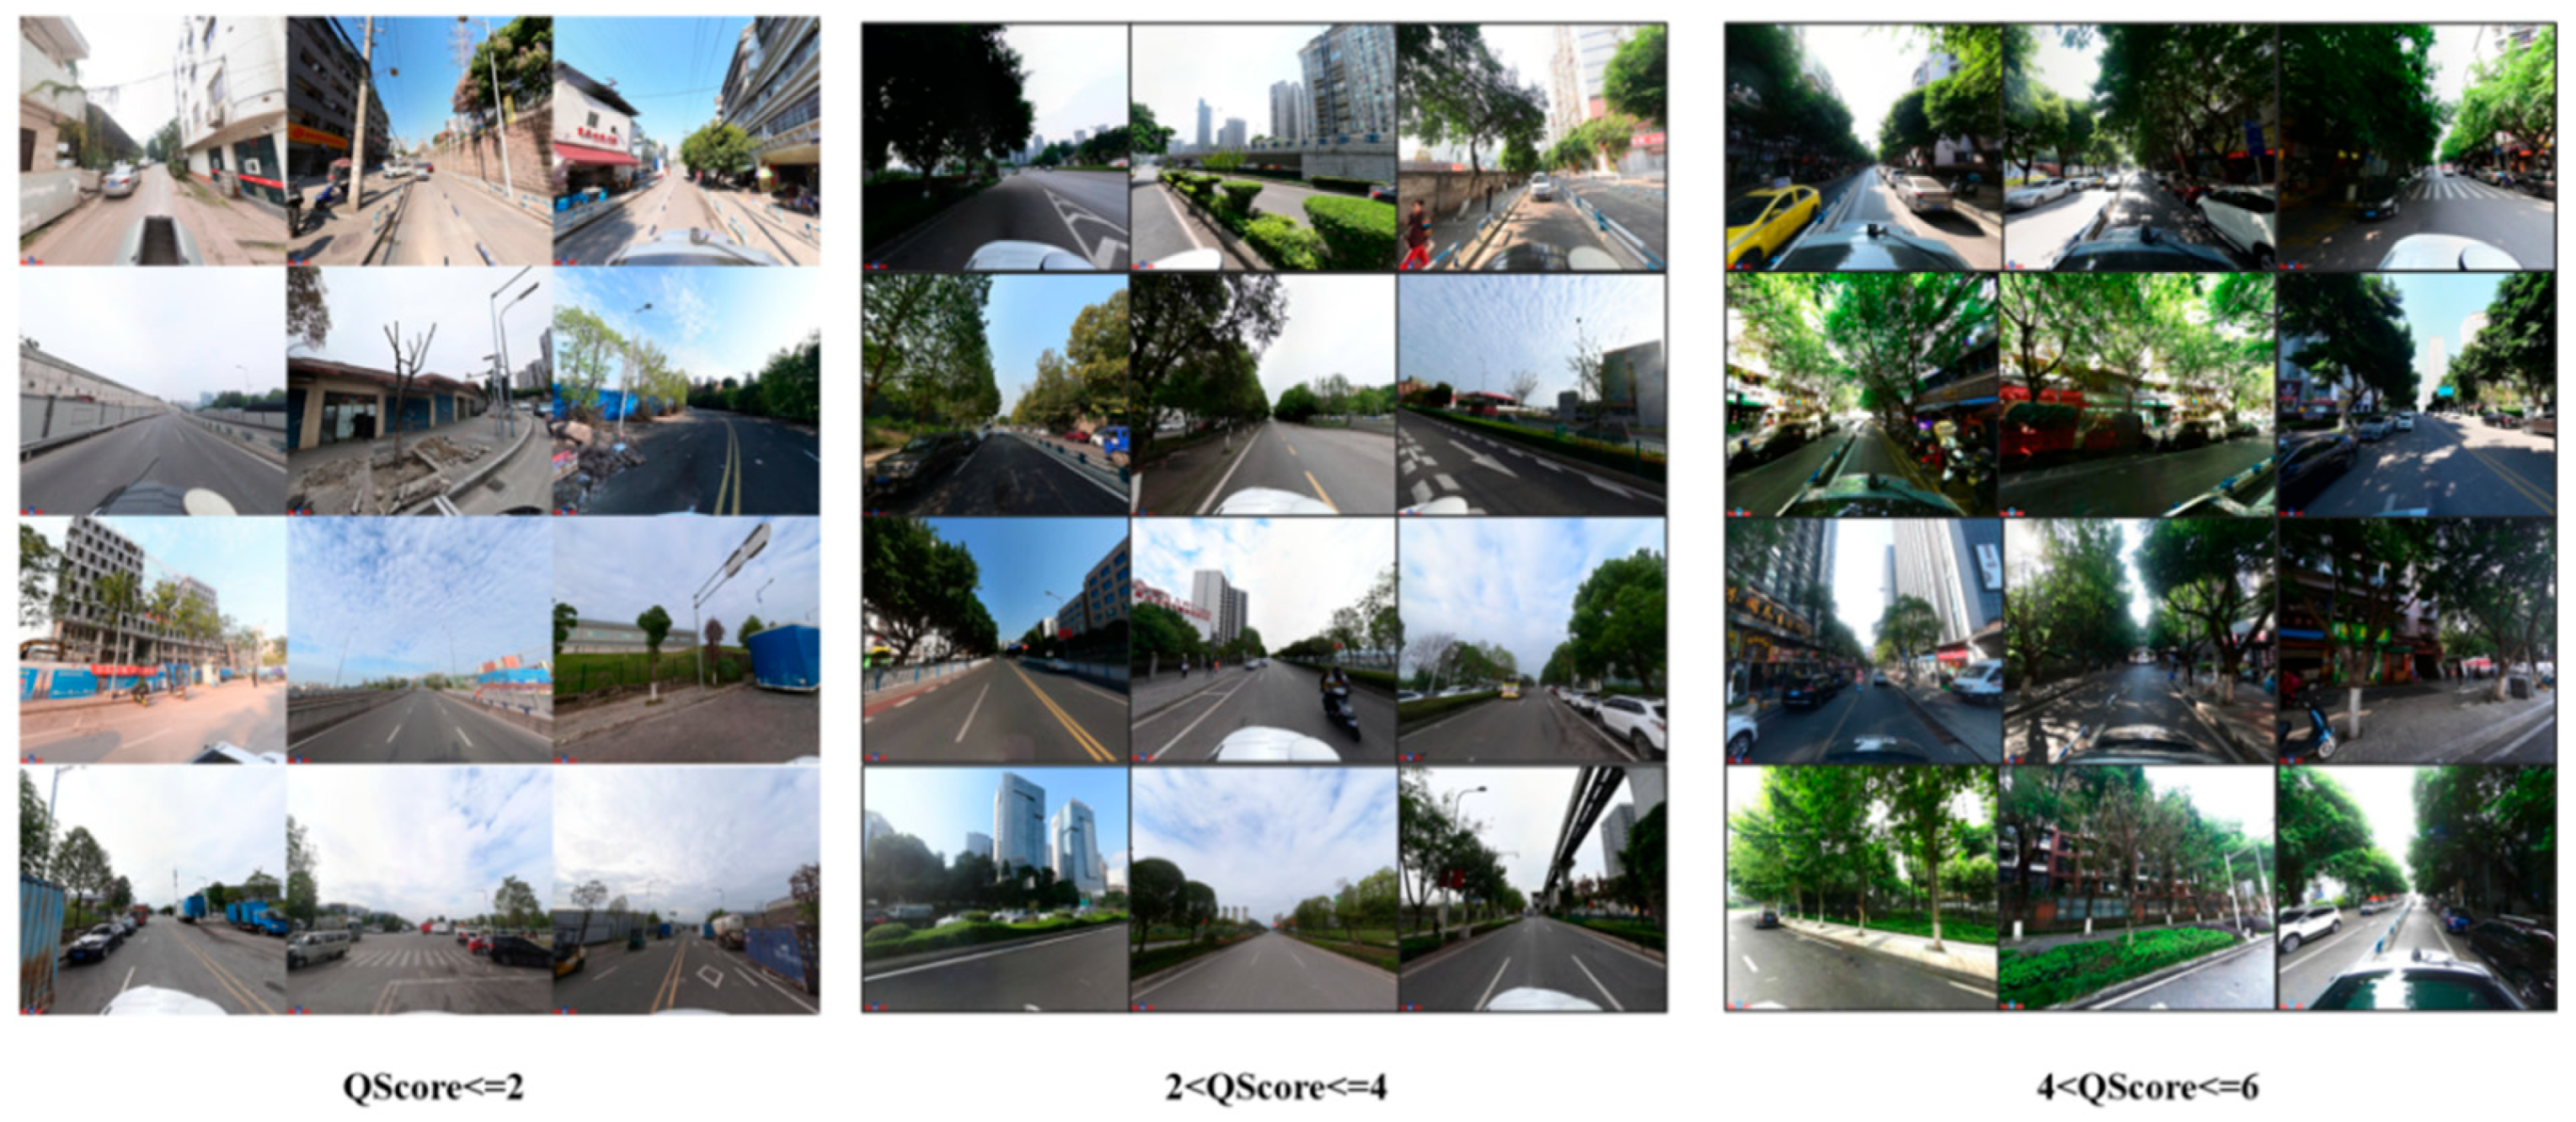
Compared to surrounding suburban areas, the streets in Yubei District’s urban core exhibit significantly higher visual quality. This suggests that the urban core areas possess superior landscape quality and spatial vitality. Simultaneously, the visual quality of major streets within the district consistently surpasses that of surrounding roads and highways, suggesting a better visual environment is being created along internal urban roads. However, the study also identified several street blocks with lower visual quality within traditional built-up areas. These zones are characterized by older buildings, narrower roads, and public spaces that are inadequately maintained, contributing to their lower overall scores. In addition, the data suggest that streets of shorter length within areas characterized by a high degree of network density frequently attain higher ratings of visual quality. This finding aligns with the assertion made by Jacobs that “short street blocks enhance street vitality and pedestrian experience,” thereby demonstrating a significant correlation between human visual perception and urban functional layout. As illustrated in Figure 12, the displayed samples represent street scenes collected from Yubei District. The left side of the image displays low-scoring samples, which are characterized by dilapidated facades and poorly maintained road spaces. The right side of the screen displays examples of streets that have been awarded high visual quality scores. These streets typically feature ample greenery, clean sidewalks, and orderly parking arrangements. The visual evaluation results demonstrate a strong correlation with manual assessments, indicating that the visual quality evaluation model possesses good reliability and interpretability.
As illustrated in Figure 13, the spatial distribution of street visual quality scores in Yubei District is categorised into five intervals: 0–1.2, 1.2–2.4, 2.4–3.6, 3.6–4.8, and 4.8–6, representing low to high visual perception. The majority of scores are found to be concentrated within the 2.4–4.8 range. Four areas have been identified as demonstrating higher scores: A: Several blocks surrounding Dalongshan Park and the Flower Garden; B: The area north of Longhu Xiangzhang Villa to Caifu Avenue; C: The vicinity of Ziwei Road–Tianhe Road–Ziyuan Road–Zikang Road; D: The area in question is situated to the south of Shuanglong Lake, extending from Shuanglong Avenue in a southerly direction, then following the route of Shuanglong West Road and Longxing Street, finally terminating at Longrui Street.
5. Discussion
5.1. Scientific Accuracy and Sensitivity Response
The physical spatial environment of a region exerts a significant influence on the daily behaviours of residents, as well as their physical and mental well-being. As the most fundamental and widespread public space in urban areas, the visual quality of streets exerts a direct and significant influence on citizens’ travel experiences, life quality, emotional states, social interactions, and overall well-being. In order to objectively quantify this complex process, the PSP-Net deep learning model was introduced. The system’s unique pyramid pooling module integrates multi-scale contextual information to achieve precise recognition of street elements, including sky, vegetation, buildings, and sidewalks. In consideration of the aforementioned points, a selection of key visual indicators was extracted, incorporating the green view index, sky view factor, and enclosure. These metrics systematically characterise the street visual environment across a range of dimensions, including ecological affinity, spatial openness, and enclosure harmony. Collectively, these dimensions form a feature system grounded in both clear physical significance and psychological rationale. During the construction of the model, the accuracy of the fitting increased progressively as the number of features increased to eight multidimensional indicators. This demonstrated that combining multidimensional visual features more comprehensively reflects environmental complexity. In comparison with single models, the stacked ensemble framework employed in this study—combining heterogeneous base models such as Random Forest (RF), XGBoost, and LightGBM with meta-learning of linear regression—ultimately elevated the prediction correlation coefficient to 0.77, outperforming single models.
5.2. Comparative Advantages over Existing Studies
In comparison with extant studies, this method exhibits distinct advantages in conducting refined assessments of visual quality in complex urban environments, particularly mountainous city streets. With regard to the construction of features, preliminary studies such as Salesses et al. [1] chiefly relied on manually annotated perceptual dimensions, while Ye et al. [34] concentrated on a single-dimensional street greening index. While these approaches are instructive, their representational capabilities are limited when confronted with the highly complex visual elements and multi-layered spatial structures that are inherent to mountainous urban environments. This study employs deep learning to automatically extract multi-dimensional visual metrics, including the green coverage ratio, the interface enclosure degree, and Visual Entropy. This creates a more comprehensive and structured visual feature system. This framework has been demonstrated to offer a superior means of capturing the unique spatial morphology and visual complexity that is characteristic of mountainous cities. In terms of the modelling approach, the Stacking ensemble framework adopted in this study has been shown to excel at handling complex nonlinear relationships between visual elements and perceptual ratings in comparison to traditional single machine learning models, such as the method used by Seresinhe et al. [48]. The ensemble strategy has been shown to enhance the model’s capacity to fit data and its robustness when dealing with heterogeneous street view data by integrating complementary information from multiple base learners. This renders the model better suited to variable spatial scenarios in mountainous cities. The experimental results demonstrate that the proposed method achieves approximately 15% higher prediction accuracy than conventional approaches [49], whilst maintaining stable evaluation performance even in typical mountainous scenarios such as high-density built-up areas and steep slopes. These findings not only validate the technical advancement of the proposed method but also highlight its value in systematically optimising and adapting to the challenges of visual quality assessment in complex urban environments.
5.3. Limitations and Future Work
With regard to the completeness of street view data, this study employed images from 2017 and 2019 as substitutes when corresponding street view data were absent at sample points in Yubei District. Street environments are subject to gradual changes over time, and such temporal discrepancies may exert a certain influence on the processes of visual feature extraction and scoring. This approach signifies a vital practical trade-off that is frequently adopted in large-scale studies with the objective of expanding sample size. Future research may explore the validation of data with stricter temporal consistency to enhance the precision of the evaluation. Additionally, although the proposed method facilitates automated visual quality assessment, several limitations warrant further refinement. First, existing feature systems fail to adequately cover diverse perceptual dimensions, including dynamic social activities and climatic conditions. Future research should incorporate indicators such as natural contact levels and biodiversity representation to more comprehensively reflect the holistic impacts of street environments. Second, although the ablation analysis in Section 4.2 has validated the contributions of the base models and visual features, the optimal combination of base models may vary across different cities. Future research will explore adaptive ensemble strategies tailored to specific street types (such as commercial streets and residential service streets) and further evaluate the transferability of the current model configuration to other cities. Furthermore, the perceptual labels employed for model training are predominantly derived from existing public datasets, thus failing to adequately capture local aesthetic preferences. Subsequent research will require large-scale public evaluation experiments to obtain more representative subjective data. Explainable methods like SHAP will be employed to explore feature coupling relationships and contribution levels, thereby revealing underlying mechanisms influencing visual quality. Finally, evaluation outcomes must be translated into actionable design control strategies for implementation. A mapping system will be developed to link street types, issues, and countermeasures. This system will generate visual design guidelines and provide ongoing support for smart city governance.
6. Conclusions
Multi-source Street View data and the Stacking ensemble learning method were employed to model and systematically evaluate the visual quality of streets in Yubei District, Chongqing. The integration of heterogeneous base models, including Random Forest, XGBoost, and LightGBM, in conjunction with linear regression as the meta-learner, facilitates an assessment of street visual quality within the designated study area. The ensemble learning approach effectively captures the complex nonlinear relationships between street visual elements and human perception, significantly enhancing the model’s generalisation capability and robustness. Among street visual elements, the most influential factors affecting perceived quality are the Green View Index (GVI), Visual Entropy, and interface closure. GVI exhibits a significant positive correlation with visual quality, further validating the critical role of greenery in enhancing street comfort and aesthetic experience. Visual Entropy, a concept denoting scene complexity, also contributes to the vitality of the street. The street visual quality of Yu Bei District demonstrates a clear spatial differentiation. Streets that demonstrate high visual quality are primarily concentrated in newly developed functional zones and central areas. This observation is supported by the analysis of prominent examples, such as Ziwai Road and Caifu Road. Conversely, certain older urban districts and back alleys exhibit significantly lower visual quality due to issues such as deteriorating building facades, insufficient greening, and cramped spaces. This finding indicates uneven development of street environments during urbanization, thereby identifying clear target areas for refining urban renewal strategies. In addition, this study validates the effectiveness and practicality of ensemble learning methods for automated large-scale street visual quality assessment, while providing quantitative evidence for understanding the relationship between street environments and human perception. Future research endeavours may seek to further refine the model through the incorporation of temporal analysis and multimodal data fusion techniques. Integrating assessment outcomes with urban design practices is crucial for creating high-quality, people-centered street environments.
Author Contributions
Conceptualization, Qianhan Wang; methodology, Qianhan Wang and Yuechen Li; software, Qianhan Wang; validation, Qianhan Wang; formal analysis, Qianhan Wang; writing—original draft preparation, Qianhan Wang and Yuechen Li; writing—review and editing, Yuechen Li; visualization, Qianhan Wang; supervision, Yuechen Li; project administration, Yuechen Li. All authors have read and agreed to the published version of the manuscript.
Funding
This work was supported by the Research Project of Chongqing Municipal Bureau of Planning and Natural Resources [grant numbers KJ2025038], the Special Key Project for Technological Innovation and Application Development in Chongqing [grant numbers CSTB2024TIAD-KPX0107].
Data Availability Statement
Data will be made available on request.
Conflicts of Interest
The authors declare no conflicts of interest.
References
- Salesses, P.; Schechtner, K.; Hidalgo, C.A. The collaborative image of the city: Mapping the inequality of urban perception. PLoS ONE 2013, 8, e68400. [Google Scholar] [CrossRef] [Scilit]
- Yang, N.; Deng, Z.; Hu, F.; Chao, Y.; Wan, L.; Guan, Q.; Wei, Z. Urban perception by using eye movement data on street view images. Trans. GIS 2024, 28, 1021–1042. [Google Scholar] [CrossRef] [Scilit]
- Vangorp, P.; Richardt, C.; Cooper, E.A.; Chaurasia, G.; Banks, M.S.; Drettakis, G. Perception of perspective distortions in image-based rendering. ACM Trans. Graph. 2013, 32, 58. [Google Scholar] [CrossRef] [Scilit]
- Ma, S.; Wang, B.; Liu, W.; Zhou, H.; Wang, Y.; Li, S. Assessment of street space quality and subjective well-being mismatch and its impact, using multi-source big data. Cities 2024, 147, 104797. [Google Scholar] [CrossRef] [Scilit]
- Husselman, T.-A.; Filho, E.; Zugic, L.W.; Threadgold, E.; Ball, L.J. Stimulus complexity can enhance art appreciation: Phenomenological and psychophysiological evidence for the Pleasure-Interest Model of Aesthetic Liking. J. Intell. 2024, 12, 42. [Google Scholar] [CrossRef] [Scilit]
- Chen, S.; Chen, Z.; Hong, J.; Zhuang, X.; Su, C.; Ding, Z. Exploring the relationship between audio-visual perception in Fuzhou universities and college students’ attention restoration quality using machine learning. Front. Psychol. 2025, 16, 1572426. [Google Scholar] [CrossRef] [Scilit]
- Fan, R.; Chen, Y.; Yocom, K.P. A New Approach to Landscape Visual Quality Assessment from a Fine-Tuning Perspective. Land 2024, 13, 673. [Google Scholar] [CrossRef] [Scilit]
- Tuan, Y.-F. Space and Place: The Perspective of Experience; University of Minnesota Press: Minneapolis, MN, USA, 2001. [Google Scholar]
- Goodchild, M.F. Citizens as sensors: The world of volunteered geography. GeoJournal 2007, 69, 211–221. [Google Scholar] [CrossRef] [Scilit]
- Zhang, F.; Zhou, B.; Liu, L.; Liu, Y.; Fung, H.H.; Lin, H.; Ratti, C. Measuring human perceptions of a large-scale urban region using machine learning. Landsc. Urban Plan. 2018, 180, 148–160. [Google Scholar] [CrossRef] [Scilit]
- Prazeres, L.; Costa, C.D.; Pereira, L.S.; Bruscato, U.M.; de Azevedo Pizzato, G.Z.; Moreira, M.; Bernardes, S. Fagocitose bench: An exploratory study on parametric design in street furniture projects focused on design and emotion. Arquiteturarevista 2019, 15, 39. [Google Scholar]
- Ho, L.-C.; Wei, Y.-T.; Li, D.; Chiang, Y.-C. Revealing emotional responses to urban environmental elements through street view data and deep learning. Environ. Plan. B Urban Anal. City Sci. 2025, 53, 647–672. [Google Scholar] [CrossRef] [Scilit]
- Zhao, W.; Tan, L.; Niu, S.; Qing, L. Assessing the impact of street visual environment on the emotional well-being of young adults through physiological feedback and deep learning technologies. Buildings 2024, 14, 1730. [Google Scholar] [CrossRef] [Scilit]
- Hao, N.; Li, X.; Han, D.; Nie, W. Quantifying the impact of street greening during full-leaf seasons on emotional perception: Guidelines for resident well-being. Forests 2024, 15, 119. [Google Scholar] [CrossRef] [Scilit]
- Zumelzu, A.; Heskia, C.; Herrmann-Lunecke, M.G.; Vergara, G.; Estrada, M.; Jara, C. Street design elements that influence mental well-being: Evidence from southern chile. Land 2024, 13, 1398. [Google Scholar] [CrossRef] [Scilit]
- Wang, R.; Yang, F.; Wang, Q. Emotion-based design research of rural street spaces using eye-tracking technology: A case study of Huixingtou Village in Handan City. PLoS ONE 2025, 20, e0326049. [Google Scholar] [CrossRef] [Scilit]
- Huang, Y.; Zhong, C.; He, T.; Jiang, Y. Dynamics of street environmental features and emotional responses in urban areas: Implications for public health and sustainable development. Front. Public Health 2025, 13, 1589183. [Google Scholar] [CrossRef] [Scilit]
- Ma, Z. Deep exploration of street view features for identifying urban vitality: A case study of Qingdao city. Int. J. Appl. Earth Obs. Geoinf. 2023, 123, 103476. [Google Scholar] [CrossRef] [Scilit]
- Zhao, J.; Han, Y.X.; Lu, P.Q. Research progress and prospect of street landscape visual quality evaluation at home and abroad. Landsc. Des. 2025, 23, 38–41. [Google Scholar]
- Long, Y.; Tang, J.X. Research progress on large-scale quantitative measurement of urban street space quality. City Plan 2019, 43, 107–114. [Google Scholar]
- Cresswell, T.J. In Place/Out of Place: Geography, Ideology and Transgression; University of Minnesota Press: Minneapolis, MN, USA, 1996. [Google Scholar]
- Min, W.; Mei, S.; Liu, L.; Wang, Y.; Jiang, S. Multi-task deep relative attribute learning for visual urban perception. IEEE Trans. Image Process. 2019, 29, 657–669. [Google Scholar] [CrossRef] [Scilit] [PubMed]
- Lu, Y.; Chen, H.-M. Using google street view to reveal environmental justice: Assessing public perceived walkability in macroscale city. Landsc. Urban Plan. 2024, 244, 104995. [Google Scholar] [CrossRef] [Scilit]
- Kim, J.; Nirjhar, E.H.; Kim, J.; Chaspari, T.; Ham, Y.; Winslow, J.F.; Lee, C.; Ahn, C.R. Capturing environmental distress of pedestrians using multimodal data: The interplay of biosignals and image-based data. J. Comput. Civ. Eng. 2022, 36, 04021039. [Google Scholar] [CrossRef] [Scilit]
- Kang, B.; Lee, S.; Zou, S. Developing sidewalk inventory data using street view images. Sensors 2021, 21, 3300. [Google Scholar] [CrossRef] [Scilit]
- Han, Y.; Zhong, T.; Yeh, A.G.; Zhong, X.; Chen, M.; Lü, G. Mapping seasonal changes of street greenery using multi-temporal street-view images. Sustain. Cities Soc. 2023, 92, 104498. [Google Scholar] [CrossRef] [Scilit]
- Zhao, J.; Guo, Q. Intelligent assessment for visual quality of streets: Exploration based on machine learning and large-scale street view data. Sustainability 2022, 14, 8166. [Google Scholar] [CrossRef] [Scilit]
- Wang, Z.; Ito, K.; Biljecki, F. Assessing the equity and evolution of urban visual perceptual quality with time series street view imagery. Cities 2024, 145, 104704. [Google Scholar] [CrossRef] [Scilit]
- Wang, R.; Liu, Y.; Lu, Y.; Zhang, J.; Liu, P.; Yao, Y.; Grekousis, G. Perceptions of built environment and health outcomes for older Chinese in Beijing: A big data approach with street view images and deep learning technique. Comput. Environ. Urban Syst. 2019, 78, 101386. [Google Scholar] [CrossRef] [Scilit]
- Frank, L.; Giles-Corti, B.; Ewing, R. The influence of the built environment on transport and health. J. Transp. Health 2016, 3, 423–425. [Google Scholar] [CrossRef] [Scilit]
- Wei, J.; Yue, W.; Li, M.; Gao, J. Mapping human perception of urban landscape from street-view images: A deep-learning approach. Int. J. Appl. Earth Obs. Geoinf. 2022, 112, 102886. [Google Scholar] [CrossRef] [Scilit]
- Hao, Y.F.; Liu, Z.; Zheng, X.; Li, Y.; Liu, Y. Evaluation and optimization of street space visual quality based on street view images driven by large language models. J. Geogr. Sci. 2025, 27, 2070–2085. [Google Scholar]
- Yang, N.; Deng, Z.; Hu, F.; Guan, Q.; Chao, Y.; Wan, L. Urban perception assessment from street view images based on a multifeature integration encompassing human visual attention. Ann. Am. Assoc. Geogr. 2024, 114, 1424–1442. [Google Scholar] [CrossRef] [Scilit]
- Ye, Y.; Zeng, W.; Shen, Q.; Zhang, X.; Lu, Y. The visual quality of streets: A human-centred continuous measurement based on machine learning algorithms and street view images. Environ. Plan. B Urban Anal. City Sci. 2019, 46, 1439–1457. [Google Scholar] [CrossRef] [Scilit]
- Zhang, Y.; Liu, P.; Biljecki, F. Knowledge and topology: A two layer spatially dependent graph neural networks to identify urban functions with time-series street view image. ISPRS J. Photogramm. Remote Sens. 2023, 198, 153–168. [Google Scholar] [CrossRef] [Scilit]
- Delgado, F.M.; Cernadas, E.; Barro, S.; Amorim, D. Gradient tree boosting for survival analysis. J. Mach. Learn. Res. 2014, 15, 3133–3181. [Google Scholar]
- Zhang, Y.; Liu, J.; Shen, W. A review of ensemble learning algorithms used in remote sensing applications. Appl. Sci. 2022, 12, 8654. [Google Scholar] [CrossRef] [Scilit]
- Sagi, O.; Rokach, L. Ensemble learning: A survey. Wiley Interdiscip. Rev. Data Min. Knowl. Discov. 2018, 8, e1249. [Google Scholar] [CrossRef] [Scilit]
- Lv, F.; Han, M.; Qiu, T. Remote sensing image classification based on ensemble extreme learning machine with stacked autoencoder. IEEE Access 2017, 5, 9021–9031. [Google Scholar] [CrossRef] [Scilit]
- Wang, Y.; Cao, L.; Deng, H. MFMamba: A mamba-based multi-modal fusion network for semantic segmentation of remote sensing images. Sensors 2024, 24, 7266. [Google Scholar] [CrossRef] [Scilit]
- Xie, J.; Qi, T.; Hu, W.; Huang, H.; Chen, B.; Zhang, J. Retrieval of live fuel moisture content based on multi-source remote sensing data and ensemble deep learning model. Remote Sens. 2022, 14, 4378. [Google Scholar] [CrossRef] [Scilit]
- Lee, S.-E.; Kim, H.-J. A new ensemble machine learning technique with multiple stacking. J. Soc. e-Bus. Stud. 2022, 25, 1–13. [Google Scholar]
- Che, M.; Wang, C.; Nian, Y.; Rao, P. Using social media for environmental insight: A multi-model deep learning framework approach. Geo-Spat. Inf. Sci. 2025, 1–16. [Google Scholar] [CrossRef] [Scilit]
- Agarwal, N.; Awasthi, P.; Kale, S.; Zhao, E. Stacking as accelerated gradient descent. arXiv 2024, arXiv:2403.04978. [Google Scholar] [CrossRef] [Scilit]
- Dubey, A.; Naik, N.; Parikh, D.; Raskar, R.; Hidalgo, C.A. Deep learning the city: Quantifying urban perception at a global scale. In Proceedings of the Computer Vision—ECCV 2016, Amsterdam, The Netherlands, 11–14 October 2016; Springer: Dordrecht, The Netherlands, 2016; pp. 196–212. [Google Scholar]
- Zhang, X.; Wang, L.; Yang, Y.; Han, H.; Shen, G.; Schroepfer, T.; He, J. Analyzing the typology and livability of 15-minute travel at metro stations in high-density cities: A case study of Singapore. Cities 2025, 158, 105727. [Google Scholar] [CrossRef] [Scilit]
- Morin, G.; Cardona, J.-M.; Prince, O.; Pendola, M.; Perrin, F. Reliability assessment of innovative designs in automotive industry. Struct. Infrastruct. Eng. 2009, 5, 367–379. [Google Scholar] [CrossRef] [Scilit]
- Seresinhe, C.I.; Preis, T.; Moat, H.S. Using deep learning to quantify the beauty of outdoor places. R. Soc. Open Sci. 2017, 4, 170170. [Google Scholar] [CrossRef] [Scilit]
- Li, X.; Beaucamp, B.; Tourre, V.; Leduc, T.; Servières, M. Evaluation of urban perception using only image segmentation features. In Proceedings of the 9th International Conference on Geographical Information Systems Theory, Applications and Management 2023, Prague, Czech Republic, 25–27 April 2023; Springer: Cham, Switzerland, 2024; pp. 200–207. [Google Scholar]



Disclaimer/Publisher’s Note: The statements, opinions and data contained in all publications are solely those of the individual author(s) and contributor(s) and not of MDPI and/or the editor(s). MDPI and/or the editor(s) disclaim responsibility for any injury to people or property resulting from any ideas, methods, instructions or products referred to in the content. |
© 2026 by the authors. Published by MDPI on behalf of the International Society for Photogrammetry and Remote Sensing. Licensee MDPI, Basel, Switzerland. This article is an open access article distributed under the terms and conditions of the Creative Commons Attribution (CC BY) license.