


Abstract
The conventional Two-Step Floating Catchment Area (2SFCA) method treats large-scale facilities as single centroids, leading to systematic under- and overestimation of spatial accessibility measures. To address this limitation, this study proposes a Grid-based G2SFCA methodology that disaggregates supply facilities into grid cells to better capture their shape and assigns them as multiple access points. Using green spaces in Seoul, South Korea, as a case study, we compared the measures from the proposed method with the conventional centroid-based approach using descriptive statistics and spatial inequality indices. The results indicate that the grid-based method significantly stabilized the distribution, nearly halving the standard deviation and reducing the Gini coefficient. In addition, our proposed method corrected the centroid-induced overestimation of accessibility and provided a more precise identification of underserved areas. By resolving the supply-side centroid problem, our study provides a more robust and realistic foundation for assessing spatial equity in urban planning and resource allocation.
1. Introduction
The equitable distribution of green space is a critical issue directly linked to the quality of life for urban residents within the built environment. Green space includes vegetated areas such as mountains, large-scale parks, neighborhood parks, and street trees. It enhances the mental and physical health of citizens by providing psychological stability and promoting physical activity [1,2]. In addition, it is a key public good that mitigates environmental problems such as the urban heat island effect and fine dust pollution [3,4,5,6]. However, public access to green spaces is often unequal, as facilities are concentrated in specific locations [7]. Hence, it is critical for policymakers to require objective tools to accurately measure this inequality and allocate limited resources efficiently.
To quantitatively measure spatial accessibility, various methodologies have been developed based on the interaction of three variables: supply, demand, and mobility [8]. Early spatial accessibility measurement methods, such as Hansen’s gravity model (1959) [9], primarily considered supply (services) and mobility to measure the opportunities available at a specific location. Subsequently, Huff (1964) [10] incorporated the spatial inequality of demand (population), paving the way for more comprehensive models. Building on this, Shen (1998) [11] developed an accessibility measure using all three variables. However, Shen’s methodology lacked a threshold distance for access, leading to a risk of overestimating accessibility scores. In this context, the Two-Step Floating Catchment Area (2SFCA) method [12] emerged as a representative methodology that overcomes the limitations of prior studies by reflecting the interaction between supply and demand. This method was initially applied to point-based facilities like hospitals and its application was then extended to area-based facilities such as green spaces, as seen in the work of Dai (2011) [13], and has since been actively used in green space accessibility analysis.
The 2SFCA method, while innovative, has undergone significant methodological refinement to enhance the accuracy and realism of accessibility measurement. These advancements primarily focus on four areas [8]. First, an implementation of distance decay functions has been investigated from the dichotomous classification of the original model (i.e., accessible or inaccessible) to various distance decay functions (e.g., Gaussian 2SFCA (G2SFCA), Enhanced 2SFCA (E2SFCA), and KD2SFCA [14,15,16]), which utilize functions like Gaussian or kernel density to reflect the geographical principle that interaction decreases continuously with distance. Second, studies began to employ variable catchment sizes, recognizing that the magnitudes of willingness to travel can differ based on geographical context (e.g., rural vs. urban) or facility type [17]. Third, the analysis was expanded to include multiple modes of transport (e.g., public transit, walking, cycling, and private car) to more accurately reflect the mobility constraints and choices of diverse populations [18]. Finally, the incorporation of time-dependent variables (e.g., time-dependent distribution of population data and time-sensitive traffic congestion) allowed researchers to capture the temporal fluctuations in supply, demand, and mobility, thereby improving the temporal resolution and accuracy of accessibility scores [19,20,21].
However, a critical methodological problem arises when applying this method to large-scale facilities. For computational convenience, most studies simplify facilities like parks into a single centroid [13,22,23,24]. While this approach has been widely adopted for its simplicity, it harbors a fundamental flaw by ignoring the actual shape and size of the facility, thus distorting reality. This distortion leads to the centroid problem, which underestimates accessibility for demand points near the facility’s boundary and overestimates it for those near the centroid. Ultimately, this entails a significant risk of leading to flawed policy decisions.
Recently, there have been attempts to address parts of this centroid problem. For instance, the Areal 2SFCA is a new methodology that measures spatial accessibility by considering the area of overlap between travel-time polygons and population geographies. This approach overcomes the limitations of traditional binary inclusion methods, allowing for a more realistic analysis of accessibility. The work by Michels et al. (2025) [25] is a significant example of this advancement, focusing on the under- and overestimation caused by simplifying demand into centroids of geographical units. By subdividing demand areas, their study enhanced the reliability of accessibility measurement by improving the accuracy of demand point calculation. However, this approach does not address the problem of ignoring the shape of supply facilities, leaving the centroid problem for large-scale facilities as an unresolved issue.
To address this limitation, this study proposes a new accessibility measurement methodology, the Grid-based G2SFCA, which subdivides not only demand locations but also supply facilities (e.g., green spaces) into a grid. To demonstrate the practicability and applicability of the proposed methodology, we conduct a comparative validation by contrasting its results with those from the conventional centroid-based method across three aspects: (1) changes in the descriptive statistics of the accessibility index, (2) shifts in the spatial patterns of overestimated and underestimated areas, and (3) changes in the spatial inequality index (i.e., Gini coefficient). Ultimately, this study aims to present a methodological framework that corrects for centroid-induced bias in accessibility measurement for large-scale facilities such as green spaces, thereby contributing to more evidence-based urban policies. Our analysis reveals that the proposed grid-based method mitigates the under- and overestimation issues inherent in the centroid-based approach, thereby providing a more robust basis for assessing and addressing spatial inequality.
2. Proposed Method: A Grid-Based G2SFCA
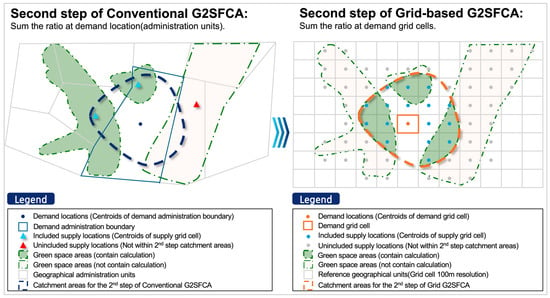
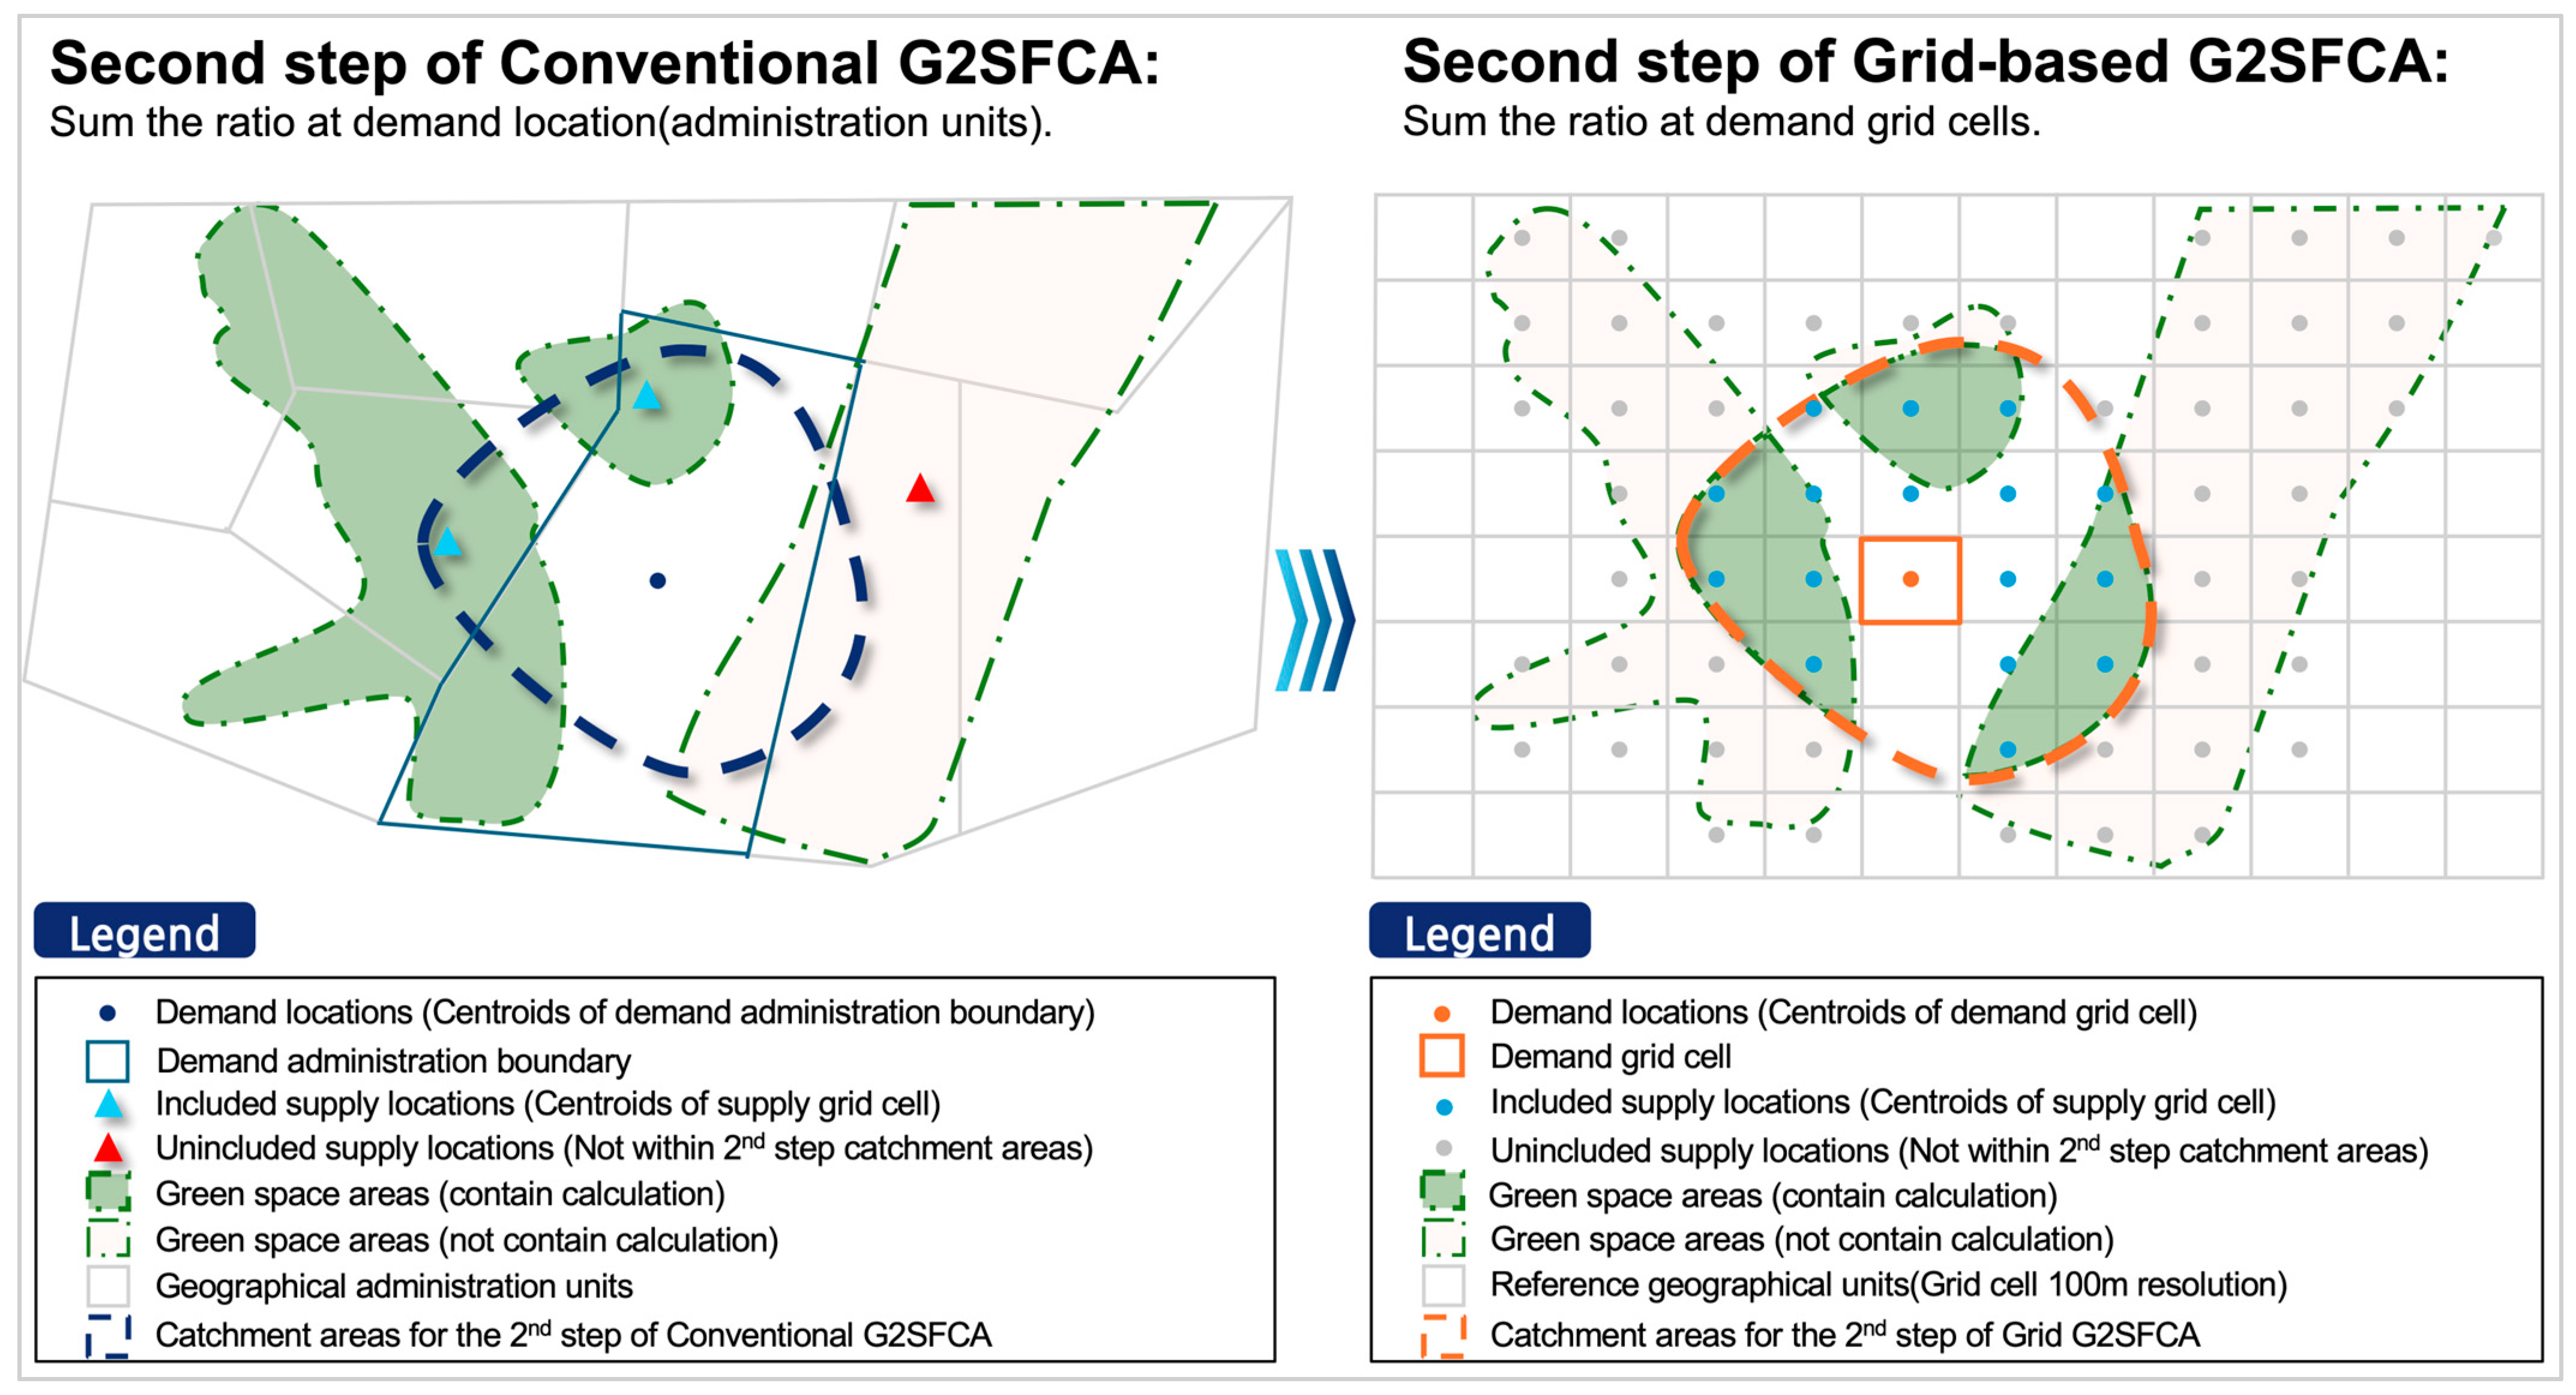
We proposed a grid-based G2SFCA methodology (Figure 1). While the conventional approach simplifies both supply and demand into single centroids of predefined geographical units (e.g., administrative districts), our method redefines the fundamental geographical unit itself. It disaggregates both supply (e.g., green spaces) and demand (population) into uniformly sized grid cells. This approach then measures spatial accessibility by treating each grid cell as an individual analysis unit, thereby helping capture the actual shape and size of the facilities without being constrained by arbitrary administrative boundaries. While maintaining the two-step framework and the Gaussian distance decay function from the conventional G2SFCA, this method refines the supply calculation step to better capture the spatial characteristics of large-scale facilities. The specific calculation steps are described below.
Figure 1.
Conceptual figure of the proposed Grid-based G2SFCA methodology.
2.1. Step 1: Grid-Based Supply-to-Demand Ratio
Unlike the conventional method, Step 1 of our approach begins by calculating individual weights for each grid cell within a supply facility. It calculates an individual supply-to-demand ratio (Rg) for each grid cell (g) that constitutes the supply area. In contrast, the conventional method calculates a single ratio (Rj) for an entire supply area’s centroid. The supply capacity (Sg) of each grid cell is calculated by summing the area-weighted contributions from all supply areas that overlap with it, as shown in Equation (1). This summation is particularly important for scenarios where a single grid cell g is covered by multiple supply areas (e.g., the service catchments of two different green spaces), as it ensures that the contributions from each distinct supply area are aggregated:
In this equation, Sg represents the total supply of grid cell g, calculated by summing contributions from the set of all supply areas J within the analysis region. For each individual supply area j, Sj is its total supply capacity (e.g., total park area), and Aj is its total area. The term Agj denotes the area of intersection between grid cell g and supply area j spatially overlap. A weight (w) is also included to account for the varying contributions of different types of supply facilities.
After calculating the individual supply for each grid cell, the supply-to-demand ratio (Rg) for each grid cell g is computed by dividing its supply capacity (Sg) by the total demand it serves, as described in Equation (2). This total demand is calculated by summing the demand (Di, e.g., population) at all demand locations (i) that lie within the grid cell’s catchment area. A location i is considered within the catchment if the travel time (tgi) from the supply grid g to it is less than or equal to a predefined threshold (t0). Each demand Di in this sum is then weighted by the distance decay function G (tgi, t0):
2.2. Step 2: Aggregating Accessibility
In the second step, the accessibility index (Ai) for a demand location i is calculated by summing the supply-to-demand ratios (Rg) from all supply grid cells (g) that are accessible to it, as shown in Equation (3). A grid cell is considered accessible if the travel time (tig) from the demand location i to the grid cell g is within the predefined travel time threshold (t0). Each accessible ratio Rg is then weighted by the Gaussian distance decay function G (tig, t0):
This method allows for a comprehensive measurement of the benefits a user receives from multiple parts of an accessible supply area or numerous smaller facilities, rather than from a single centroid. Consequently, this enables a more realistic assessment of accessibility to large-scale facilities such as green spaces.
2.3. Distance Decay Function
The Gaussian distance decay function G (tij, t0), applied across all steps, models the effect of geographical distance, based on the principle that the interaction between supply and demand diminishes as the distance between them increases. The value of the function G is determined by the relationship between the travel time (tij) from a demand location i to a supply location j and a predefined threshold time (t0):
In this function, tij represents the travel time between a demand location i and a supply location j (or grid g), and t0 is the predefined travel time threshold previously mentioned. The constant is the base of the natural logarithm.
If the travel time (tij) is within the threshold time (t0), its value is calculated according to Equation (4). Conversely, if the travel time exceeds the threshold, its value becomes 0. In other words, the function’s value approaches 1 as the travel time nears zero, and it decays toward 0 as the travel time approaches the threshold. This effectively excludes any supply beyond the threshold time from the accessibility calculation.
3. Case Study: Green Space Accessibility in Seoul, South Korea
3.1. Analysis Workflow
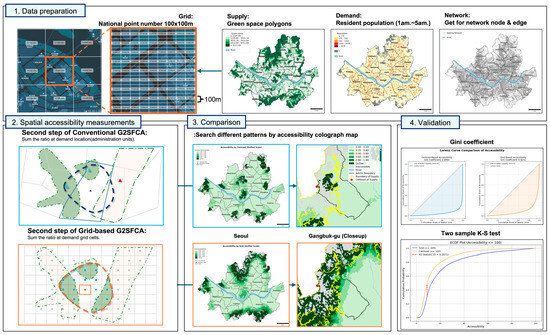
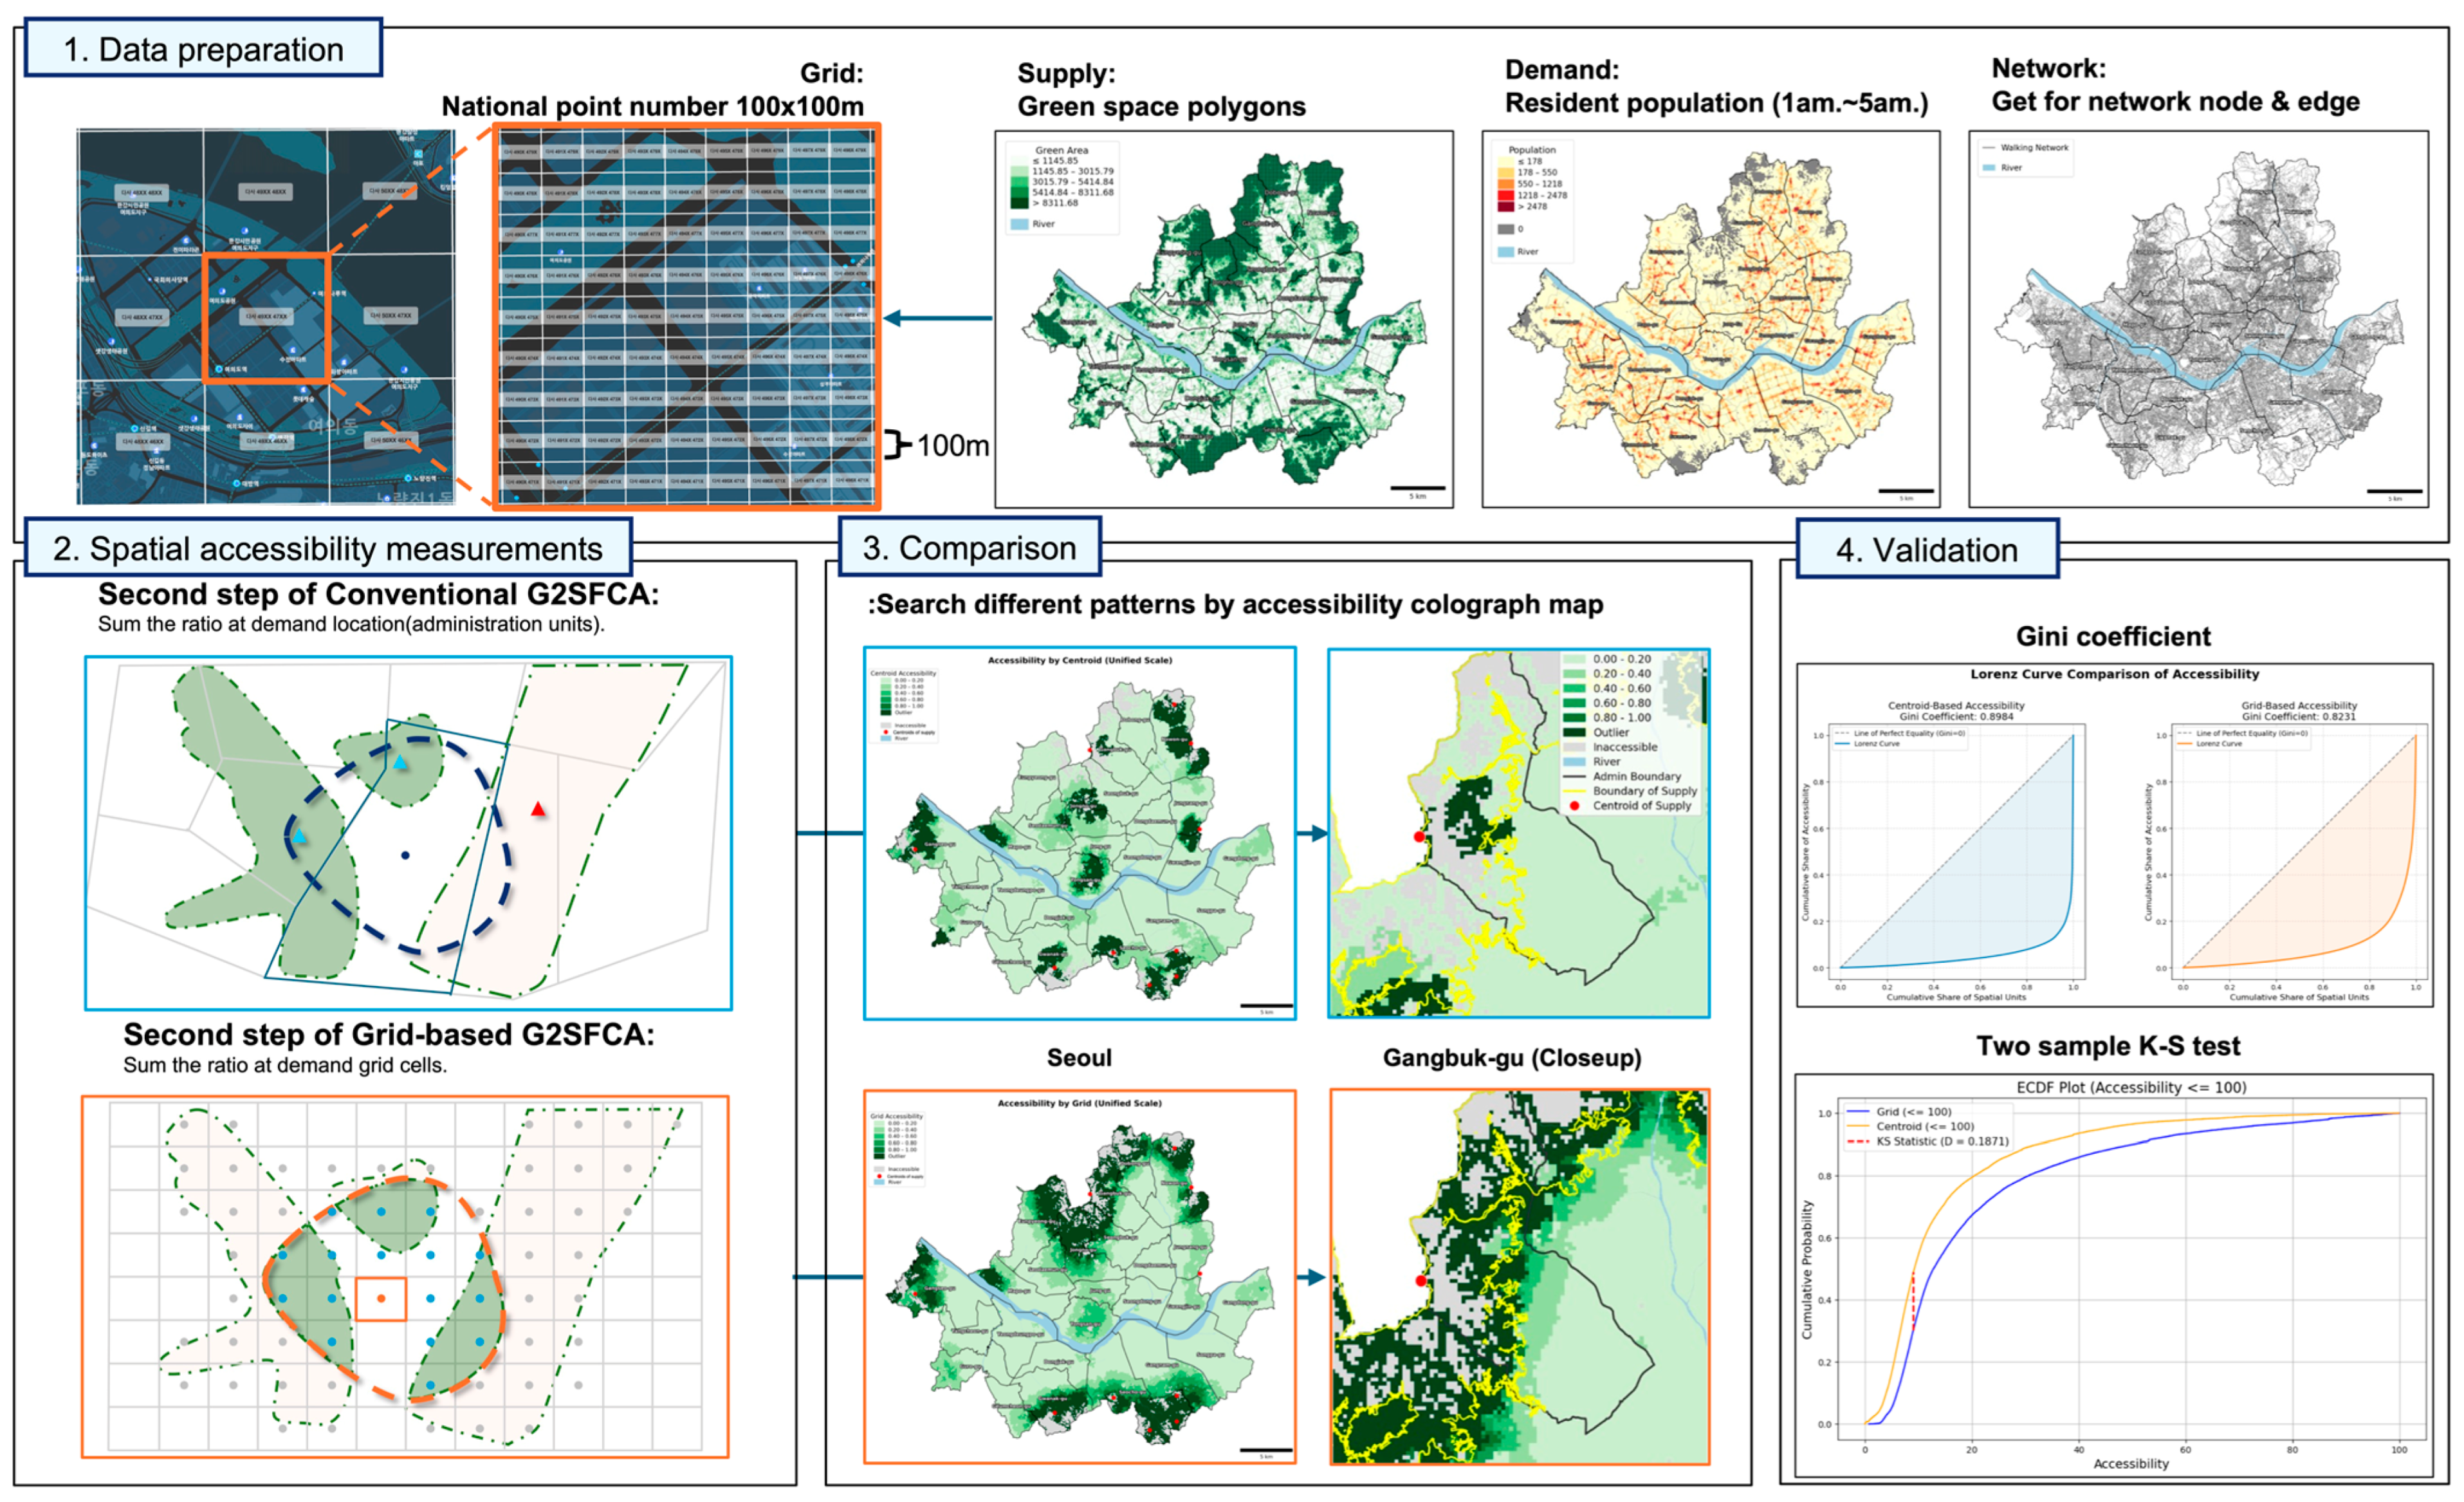
The analysis workflow of the case study consists of three stages: (1) data preparation; (2) spatial accessibility measurement for both the conventional and the proposed methods; (3) comparison of the results from both methods and statistical validation of the findings (Figure 2).
Figure 2.
Analysis Workflow. The process consists of four main stages: (1) data preparation for supply, demand, and network; (2) spatial accessibility measurement using conventional and grid-based G2SFCA; (3) spatial pattern comparison; and (4) statistical validation.
3.2. Study Area
Seoul is the capital of South Korea, covering an area of 605 km2. Green spaces occupy 228.81 km2, accounting for 37.81% of the city’s total area. The study area is a basin bordered by mountainous terrain, including Gwanaksan and Bukhansan. As the central city of the metropolitan area, Seoul exhibits a very high population density of 15,857 persons/km2 [26]. Consequently, it is a high-density megacity where a large population resides within a limited area.
3.3. Data Preparation
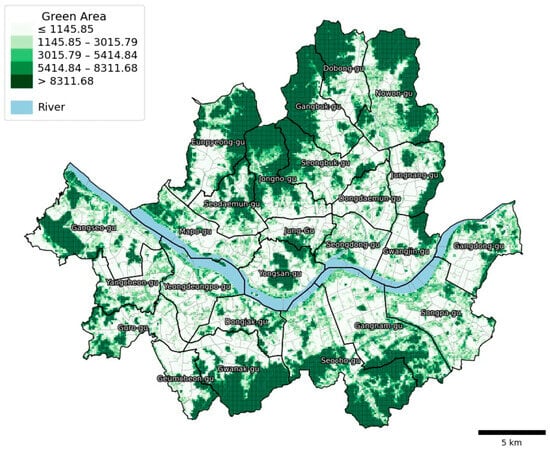
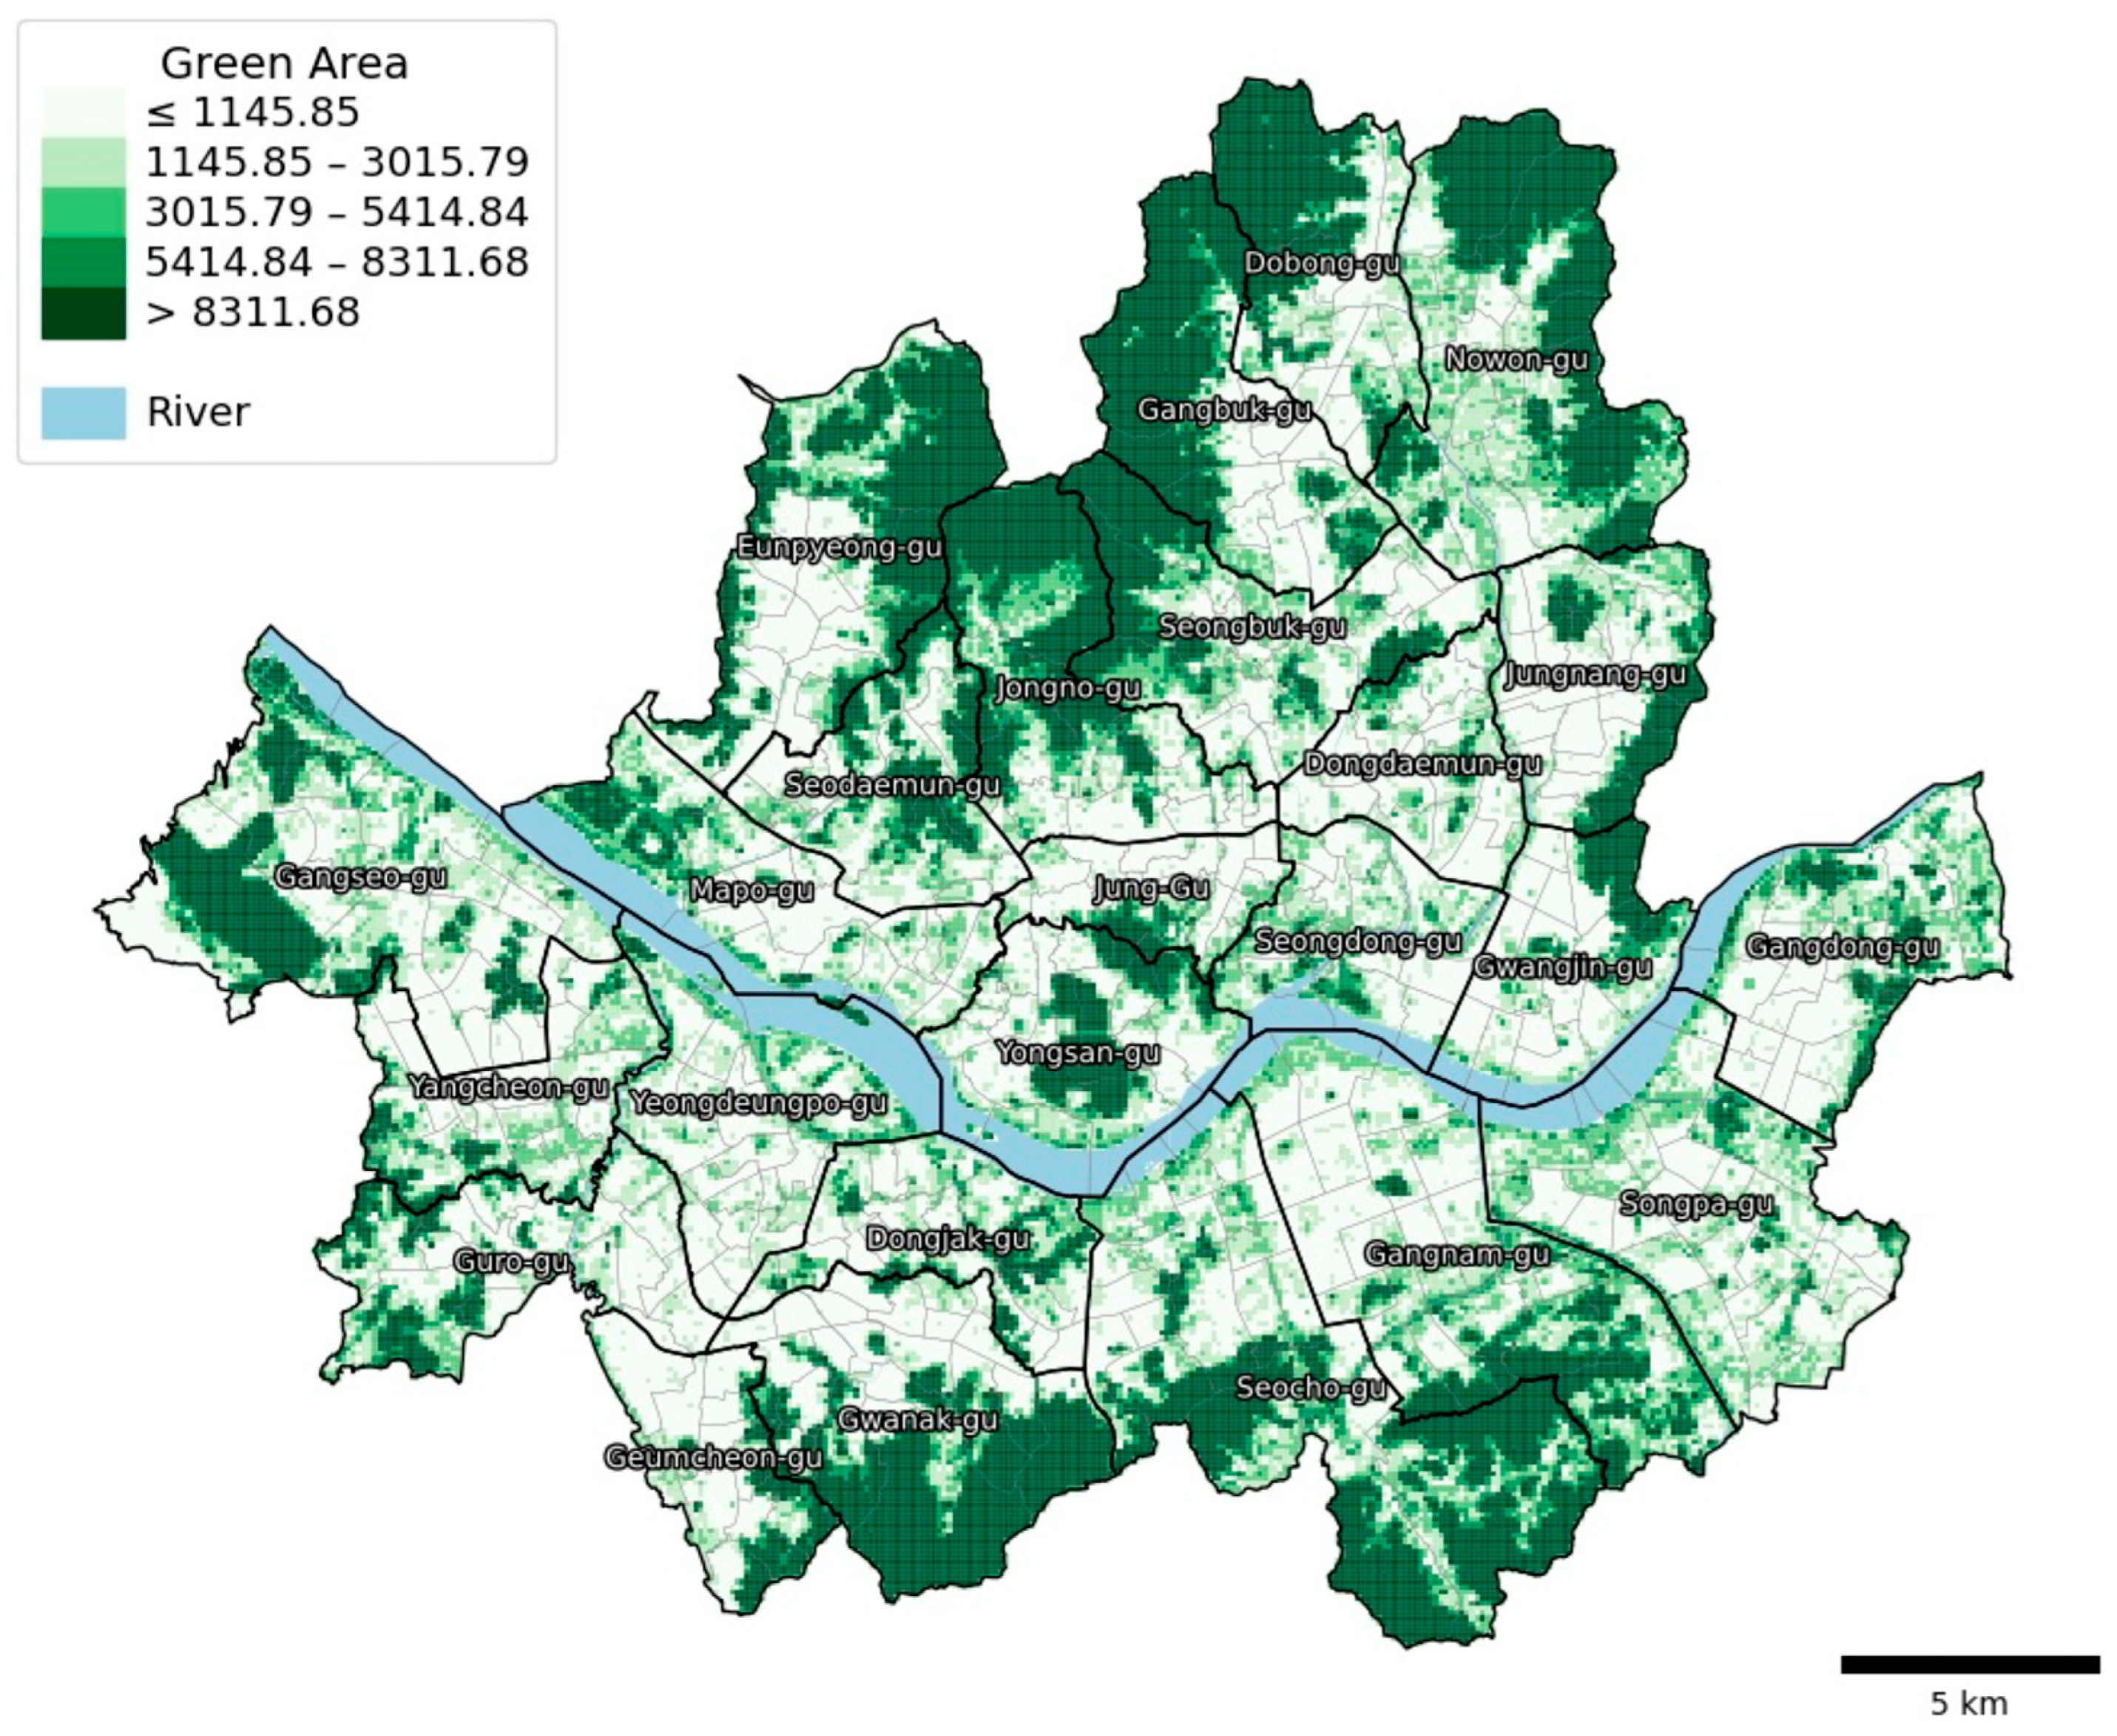
In this study, the fundamental geographical unit of analysis for both demand and supply are a uniform 100 m × 100 m grid. This addresses a key ambiguity in many accessibility studies. The grid data is based on the National Point Number system (10 m, 100 m, 1 km, 10 km), managed by the Ministry of the Interior and Safety. We deliberately chose this fine-resolution grid over traditional, administrative boundaries (such as dong or gu) to mitigate the Modifiable Areal Unit Problem (MAUP) and more accurately correct the centroid bias inherent in large facilities. The selection of this grid size is not arbitrary but is methodologically deliberate, guided by two key factors that define the appropriate analytical scale. First, the lower bound is determined by our input data; the highest available resolution for our population data is 100 m. Using a finer grid (e.g., 10 m) would be infeasible, as it would require unsound data disaggregation and introduce artificial precision. Second, the upper bound is dictated by the study’s analytical purpose. As our method aims to correct aggregation bias, employing a coarser grid (e.g., 1 km, 10 km) would reintroduce this very bias, undermining the study’s objective by replacing the ‘centroid problem’ with a ‘large grid problem’. Thus, the 100 m grid represents the optimal scale for this analysis, balancing data availability with methodological rigor. For supply data, green space and mountain datasets provided by the Korea Forest Conservation Association (KFCA) were utilized. The two datasets were merged using a spatial join, with the area of each feature serving as its supply quantity (Sj). We acknowledge that park capacity is a multifaceted concept that can include qualitative factors like specific amenities or perceived quality. However, area is the most objective, scalable, and widely accepted proxy for supply in large-scale accessibility studies, particularly when such granular data is unavailable or inconsistent across a large study area [13,27,28]. This approach rests on the reasonable assumption that larger parks can accommodate more users, thus providing a standardized measure of supply. The distribution of the combined green space facilities was visualized as a choropleth map, classified using the Natural Breaks method based on facility area sizes (Figure 3).
Figure 3.
Spatial Distribution of Green Space (Supply) in Seoul (Note: Administrative district boundaries are shown for geographical reference only. The unit of analysis for accessibility calculation is the 100 m grid).
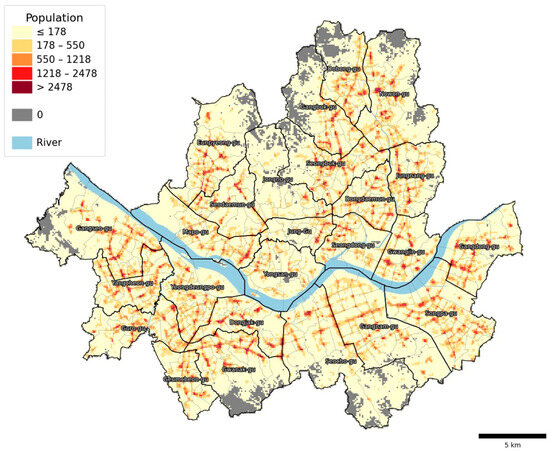
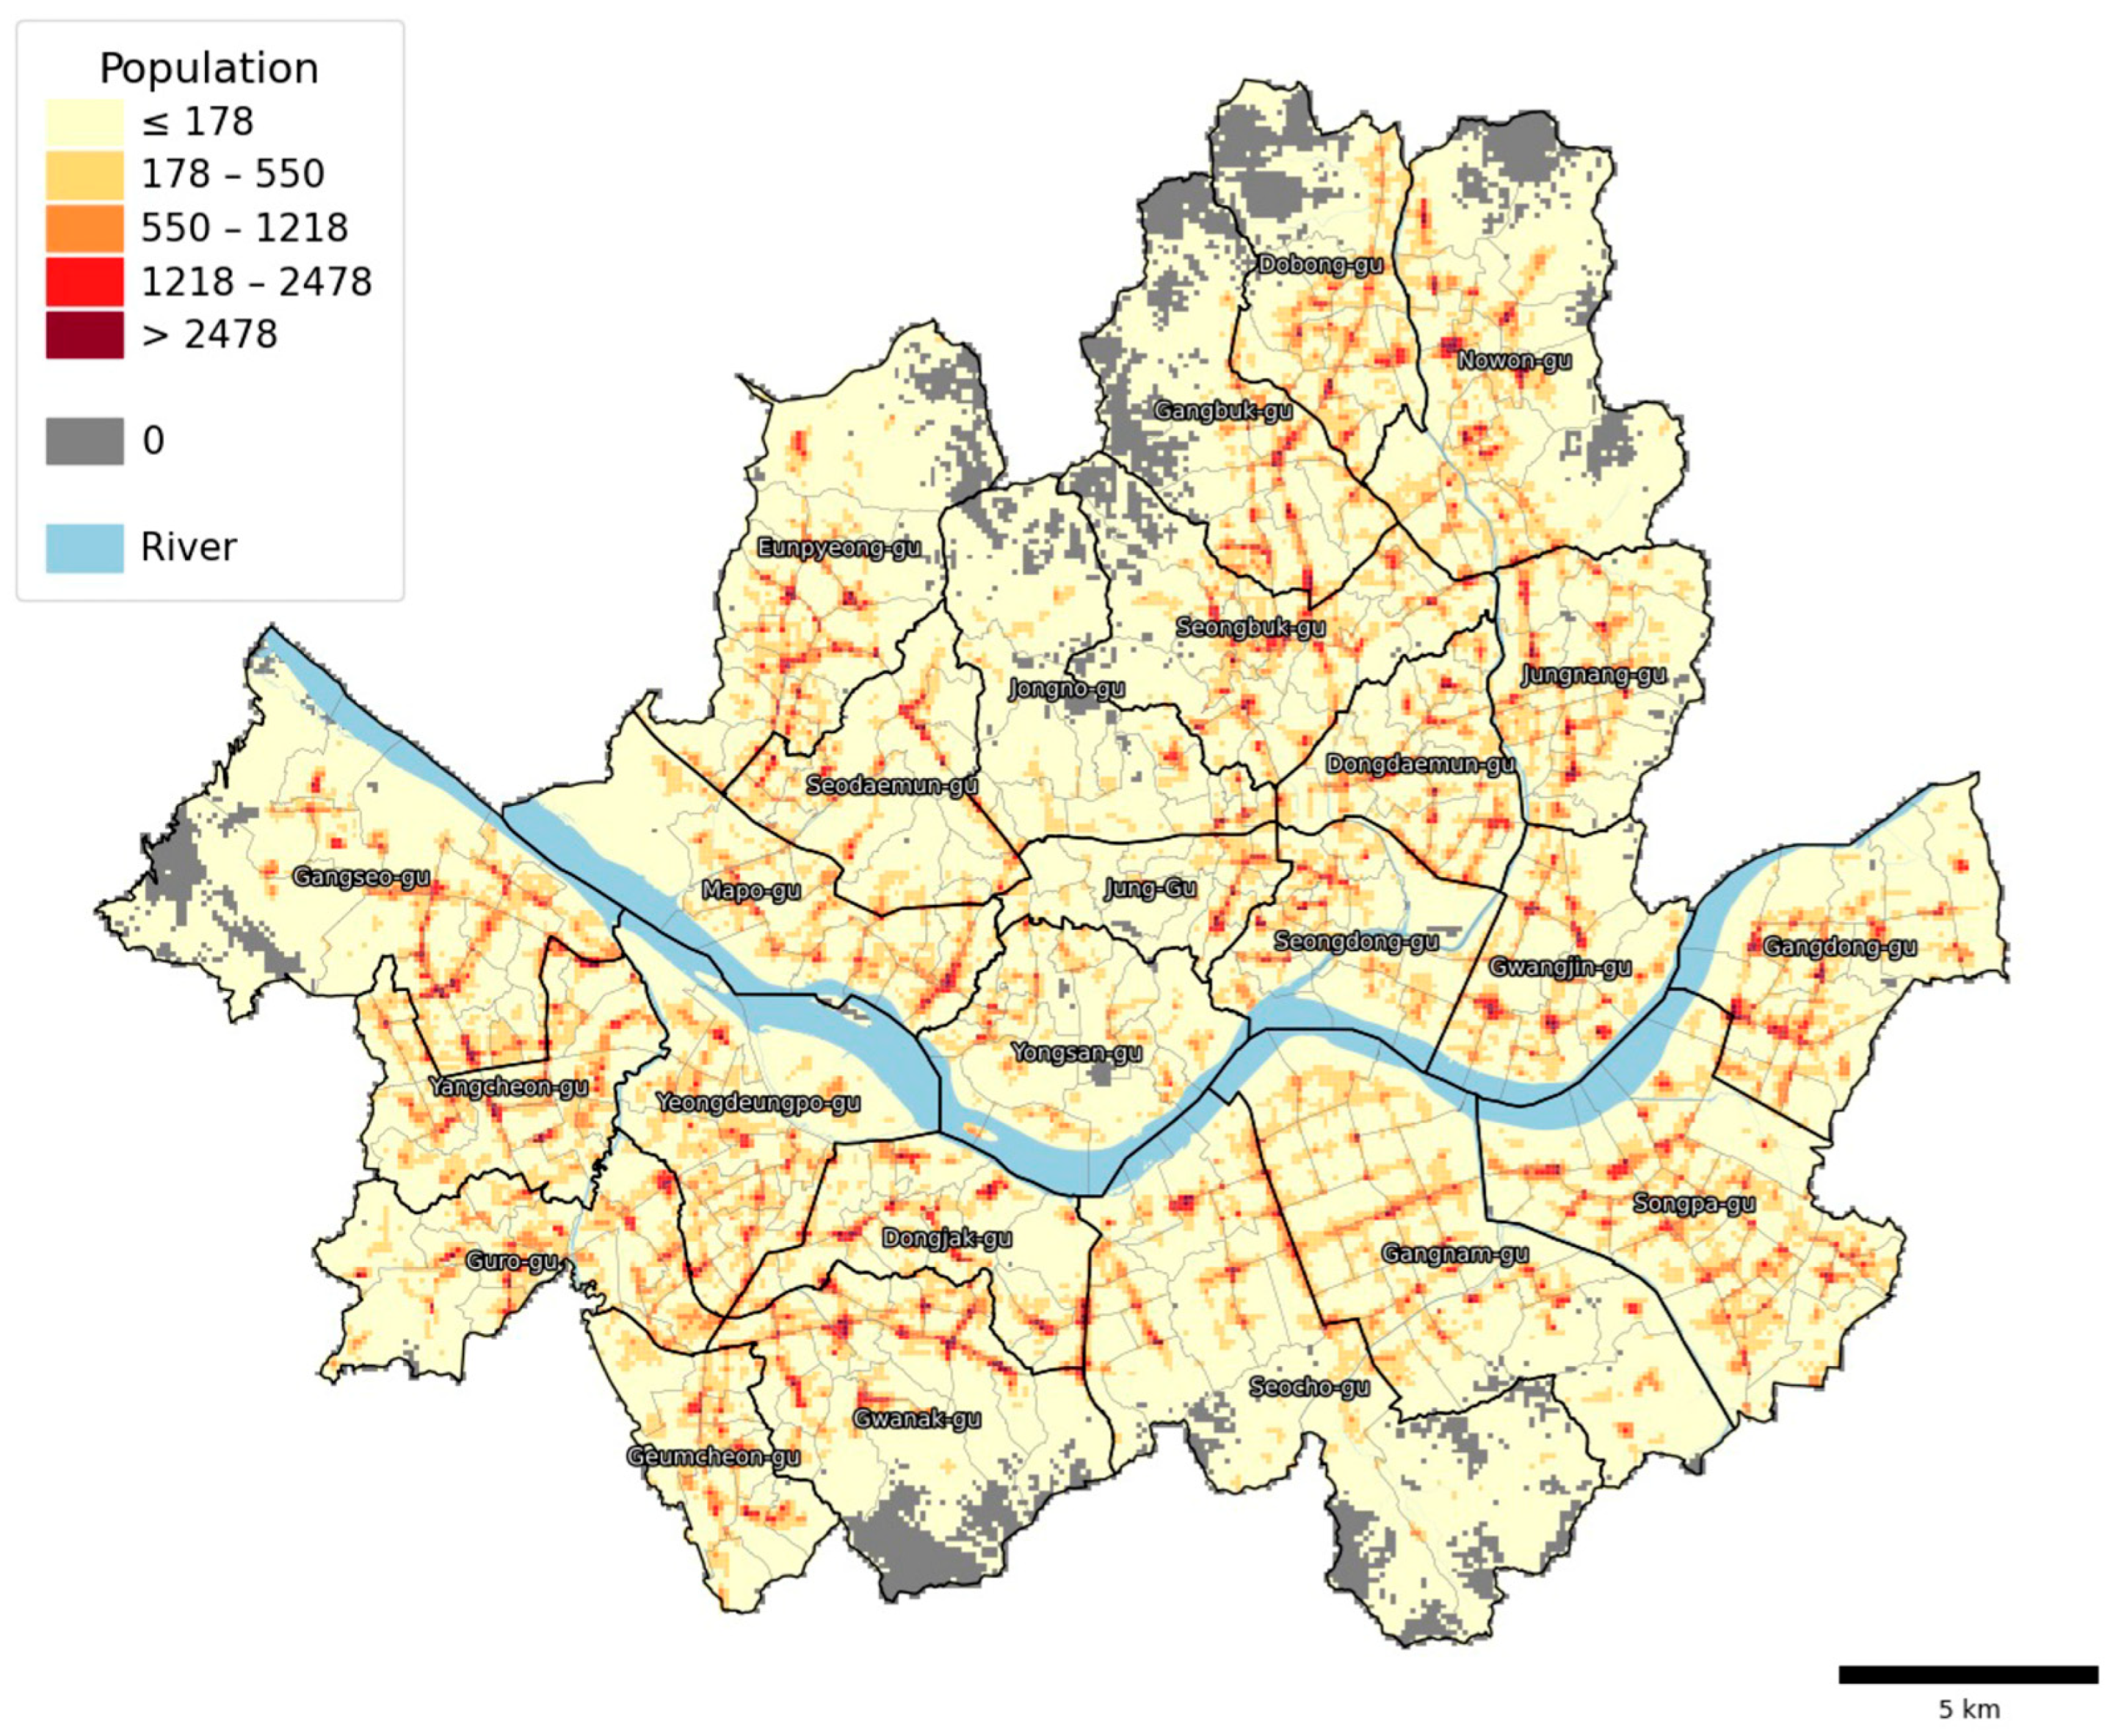
The demand data consisted of floating population data for Seoul, provided by SKT mobile data. To define the residential population, we calculated the average population between 1:00 a.m. and 5:00 a.m., a period when public transportation is generally not in operation [29]. Figure 4 shows the distribution of the residential population for a weekday (31 May 2024), aggregated on the grid and visualized as a five-class choropleth map using the Natural Breaks algorithm. To enhance clarity, grid cells with a population of zero are explicitly masked in gray. These cells, representing areas with no demand, are excluded from the subsequent accessibility calculation. For the network-based analysis, pedestrian network data for the city of Seoul was obtained from OpenStreetMap using the OSMnx package in Python.
Figure 4.
Spatial Distribution of Residential Population (Demand) (Note: Administrative district boundaries are shown for geographical reference only. The unit of analysis for accessibility calculation is the 100 m grid).
The conventional method measures accessibility by extracting centroids of supply facilities and demand administrative units. In contrast, the method proposed in this study divides both demand and supply data into identical grid units. To clearly evaluate the utility of the proposed method and identify changes in spatial accessibility patterns, the demand dataset is subjected to grid-based processing in both approaches (conventional and proposed). However, to facilitate a direct comparison, grid-based processing for supply data was applied only to the proposed method.
In this study, data analysis and visualization were performed using Python (version 3.13.5) and the OSMnx package (version 2.0.6).
3.4. Accessibility Measurement
The foundational methodology for accessibility measurement in this study is the G2SFCA [14]. This method is regarded as effective for measuring realistic accessibility by continuously reflecting supply-demand interactions and continuous distance decay effects [30]. For this analysis, the threshold travel time (d0) was set to 30 min. This was calculated via network analysis based on the actual road network and average walking speed, a standard widely adopted in previous accessibility studies [23,24]. The process corresponds to the steps detailed in Equations (2)–(4) in Section 2. In this stage, accessibility was measured separately using both the conventional centroid-based G2SFCA and the proposed grid-based approach. Crucially, for both approaches, accessibility scores are computed only for the populated grid cells identified in the previous step. Consequently, the gray areas in the final accessibility result maps represent these unpopulated or inaccessible regions where scores were not calculated.
3.5. Comparison of the Accessibility Score
To validate the proposed methodology, we conducted a comparative analysis focusing on structural shifts in spatial accessibility patterns. A key challenge in comparing the conventional and proposed methods is that they produce accessibility scores on different numerical scales. To address this and enable a direct, meaningful comparison, we implemented a systematic, multi-step process to create a unified classification scheme for both result maps.
First, outliers were identified and separated from both result datasets using the interquartile range (IQR) method [31] to prevent extreme values from distorting the analysis. Second, the remaining non-outlier scores from both methods were normalized onto a common 0–1 scale using a global Min–Max scaling approach. This involved scaling each dataset based on the minimum and maximum values of the combined non-outlier data. Finally, to ensure a standardized visualization, the same Equal Interval classification scheme was applied to both sets of normalized scores.
This unified classification scheme was then used to visualize both maps, allowing for an intuitive comparison. Our analysis, therefore, focuses not on the raw score values but on the shifts in accessibility classification—identifying which zones are reclassified into higher or lower accessibility categories and examining the overall expansion or contraction of accessibility patterns under the proposed method.
3.6. Validation (Two-Sample KS Validation, Global Moran’s I, Gini Coefficient)
We employed three post hoc analyses to statistically validate the results of the proposed methodology and confirm its distinction from the conventional method. The first was the Two-Sample Kolmogorov–Smirnov (KS) Test conducted to identify statistical differences between the two result distributions. The second one was Global Moran’s I conducted to measure global spatial autocorrelation. Finally, the third was the Gini coefficient, which assesses spatial inequality.
The Two-Sample KS test was performed to verify whether the distribution of results from the proposed method is statistically different from that of the conventional method [32]. As a non-parametric test that measures the maximum difference between the cumulative distribution functions of two data samples, a p-value below the significance level (e.g., 0.05) indicates that the two distributions are statistically distinct. This provides statistical evidence that the proposed methodology yields results that are significantly different from the conventional approach.
The Global Moran I analysis was used to determine whether the accessibility index exhibits a spatially clustered, dispersed, or random pattern from a global perspective [33]. The index ranges from −1 to +1, where values near +1 indicate strong spatial clustering of similar values, and values near 0 suggest random distribution. A p-value below 0.01 indicates statistically significant spatial autocorrelation.
The Gini coefficient was calculated to quantify spatial inequality in accessibility [34]. Values range from 0 (perfect equality) to 1 (perfect inequality), with higher values indicating concentration of accessibility in fewer areas. We compared Gini coefficients between methods to evaluate how the proposed approach affects the spatial structure of accessibility disparities [35].
4. Analysis Results
This chapter presents a comparative analysis of green space accessibility results measured by the centroid-based G2SFCA method (i.e., the conventional method below) and the grid-based G2SFCA method (i.e., the proposed method below). We systematically validate the methodological improvements of the proposed approach by comparing descriptive statistics, spatial distribution patterns, and geospatial statistical indicators.
4.1. Descriptive Statistics
A comparison of descriptive statistics for the accessibility indices shows that the mean score slightly increased from 101.2 (conventional) to 106.5 (proposed). More notably, the median value rose from 10.0 to 15.9, while the standard deviation was nearly halved, decreasing from 985.5 to 462.6 (Table 1). This indicates that the proposed method yields a more stable distribution compared to the conventional method.
Table 1.
Descriptive statistics for the Green Space Accessibility Score.
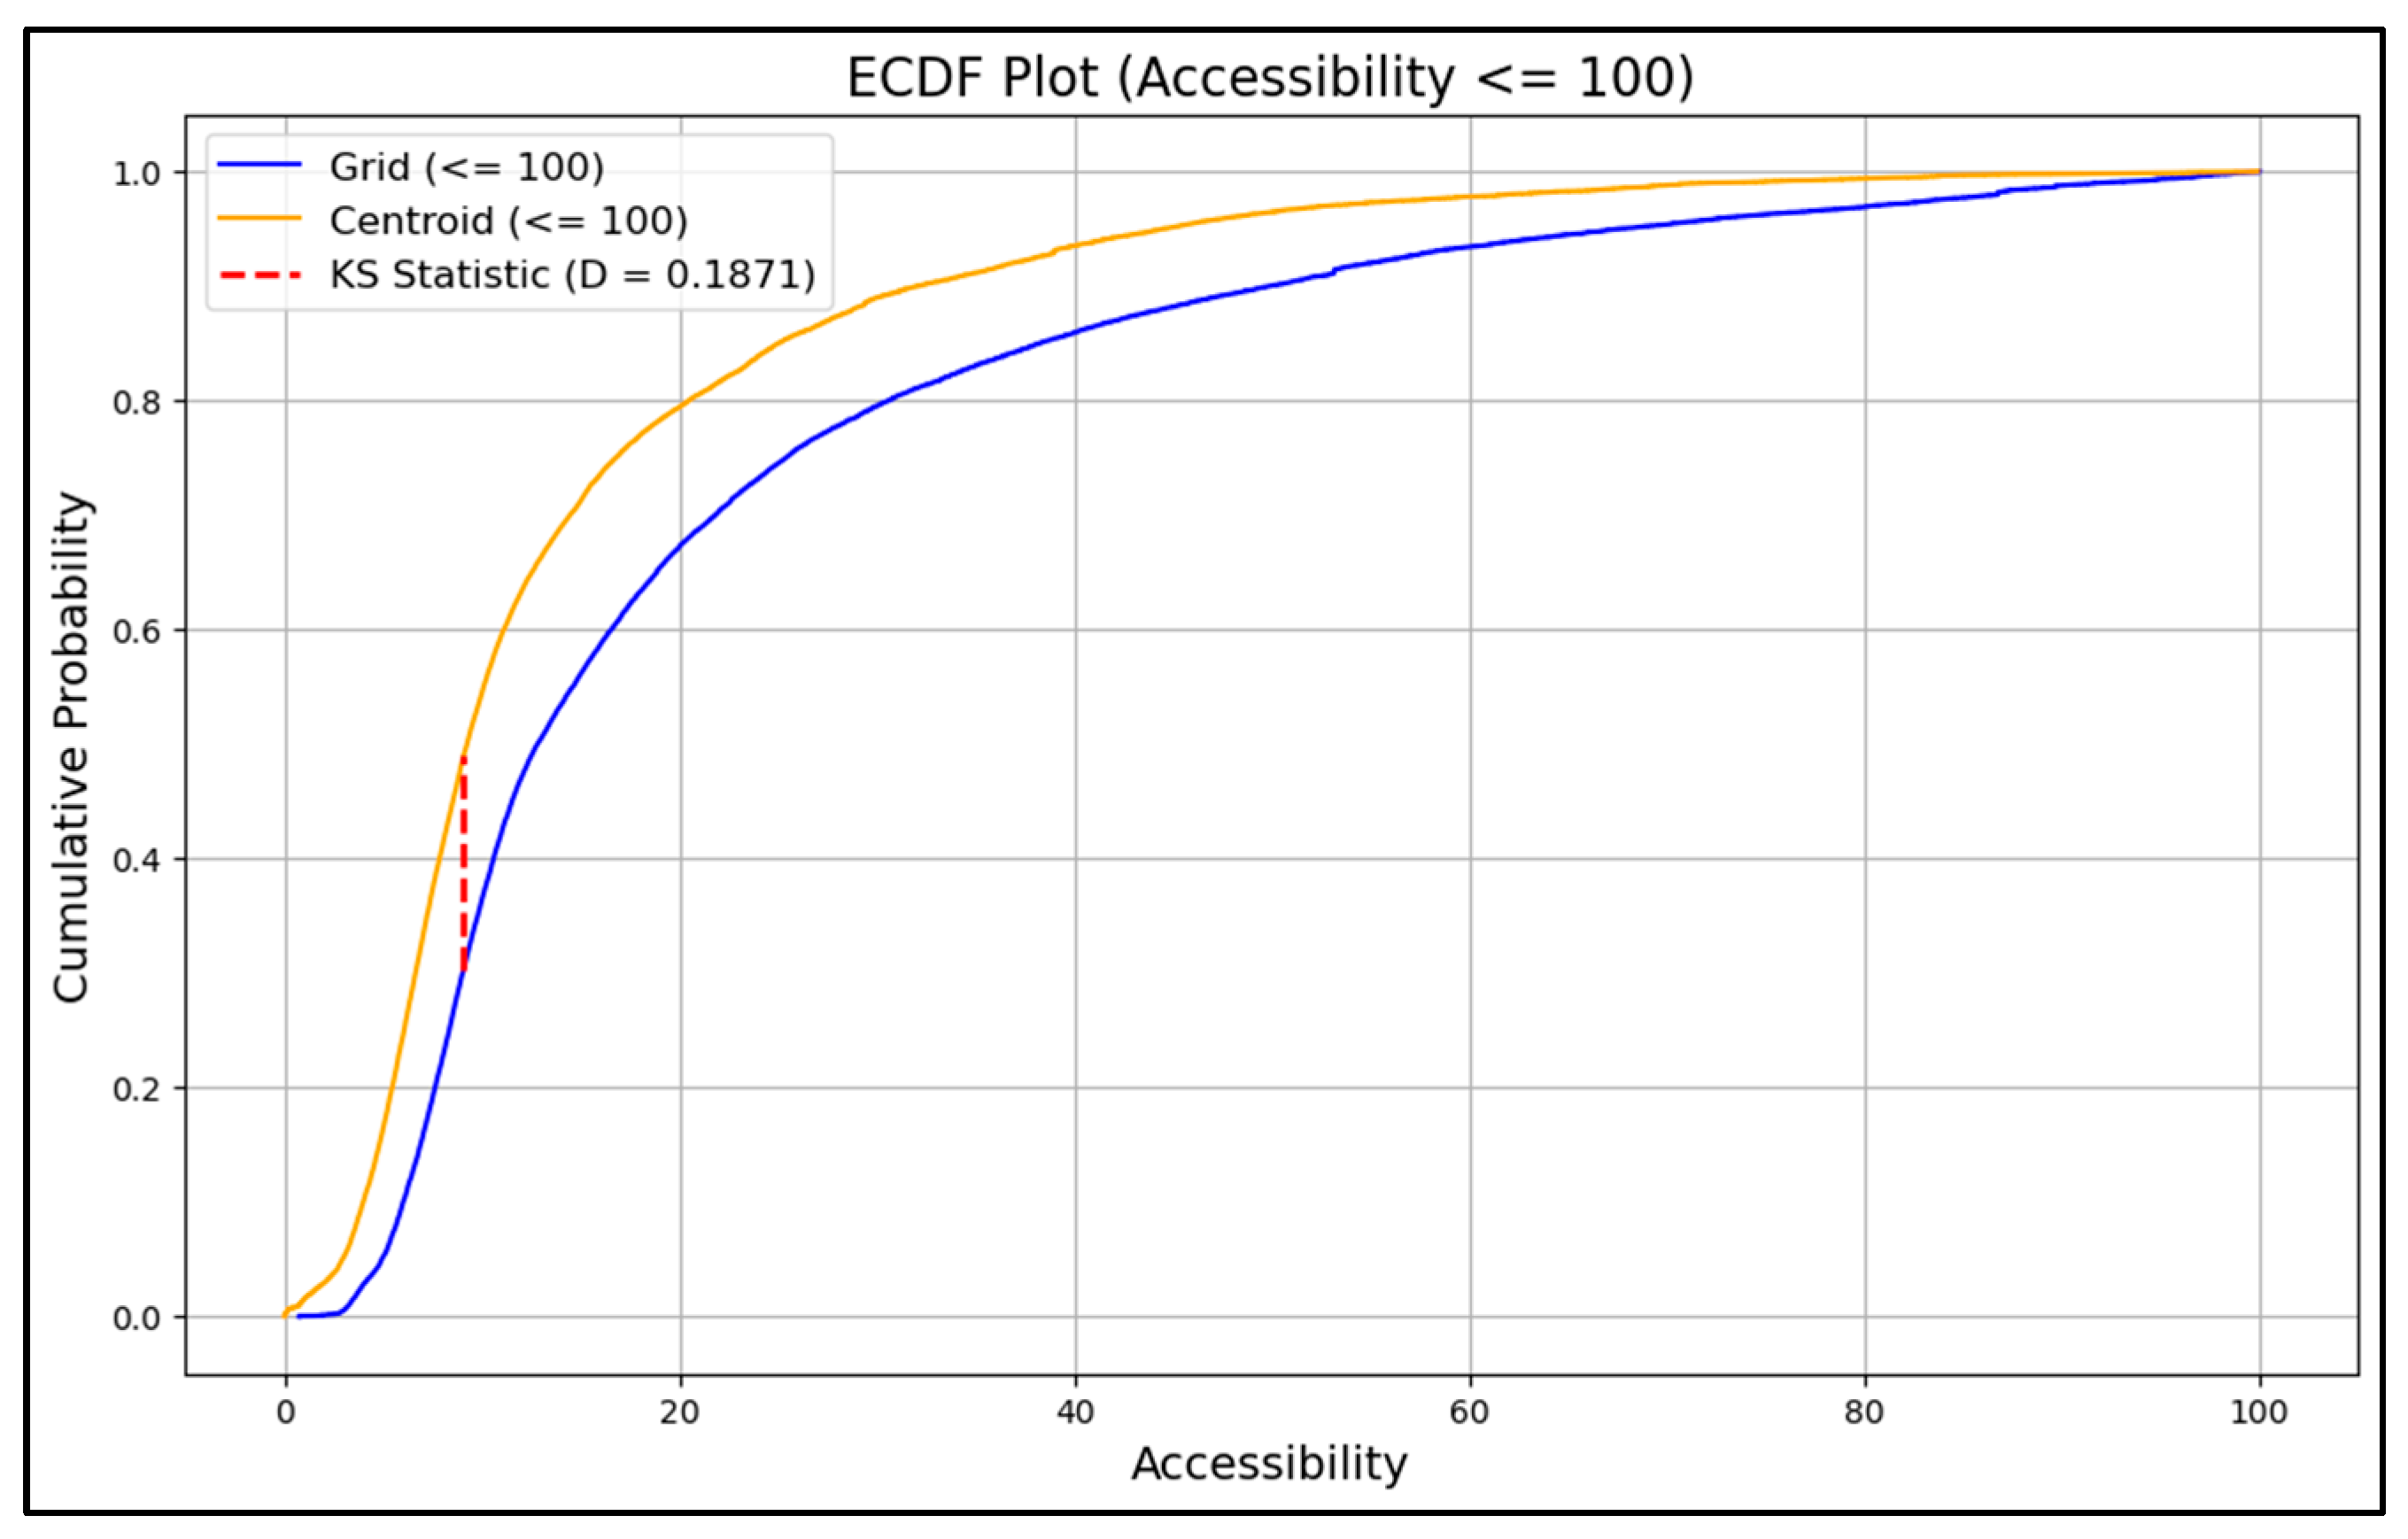
A Two-Sample Kolmogorov–Smirnov (K-S) test showed that the difference between the two result distributions was statistically significant. The Empirical Cumulative Distribution Function (ECDF) plot (Figure 5) visualizes this difference, which is particularly evident for values below 100. The test yielded a maximum difference (D-statistic) of approximately 0.208 with a p-value of less than 0.0001, confirming that the accessibility distributions from the conventional and proposed methods are statistically significantly different.
Figure 5.
Plot for the Empirical Cumulative Distribution Function (ECDF) Comparison.
4.2. Spatial Distribution
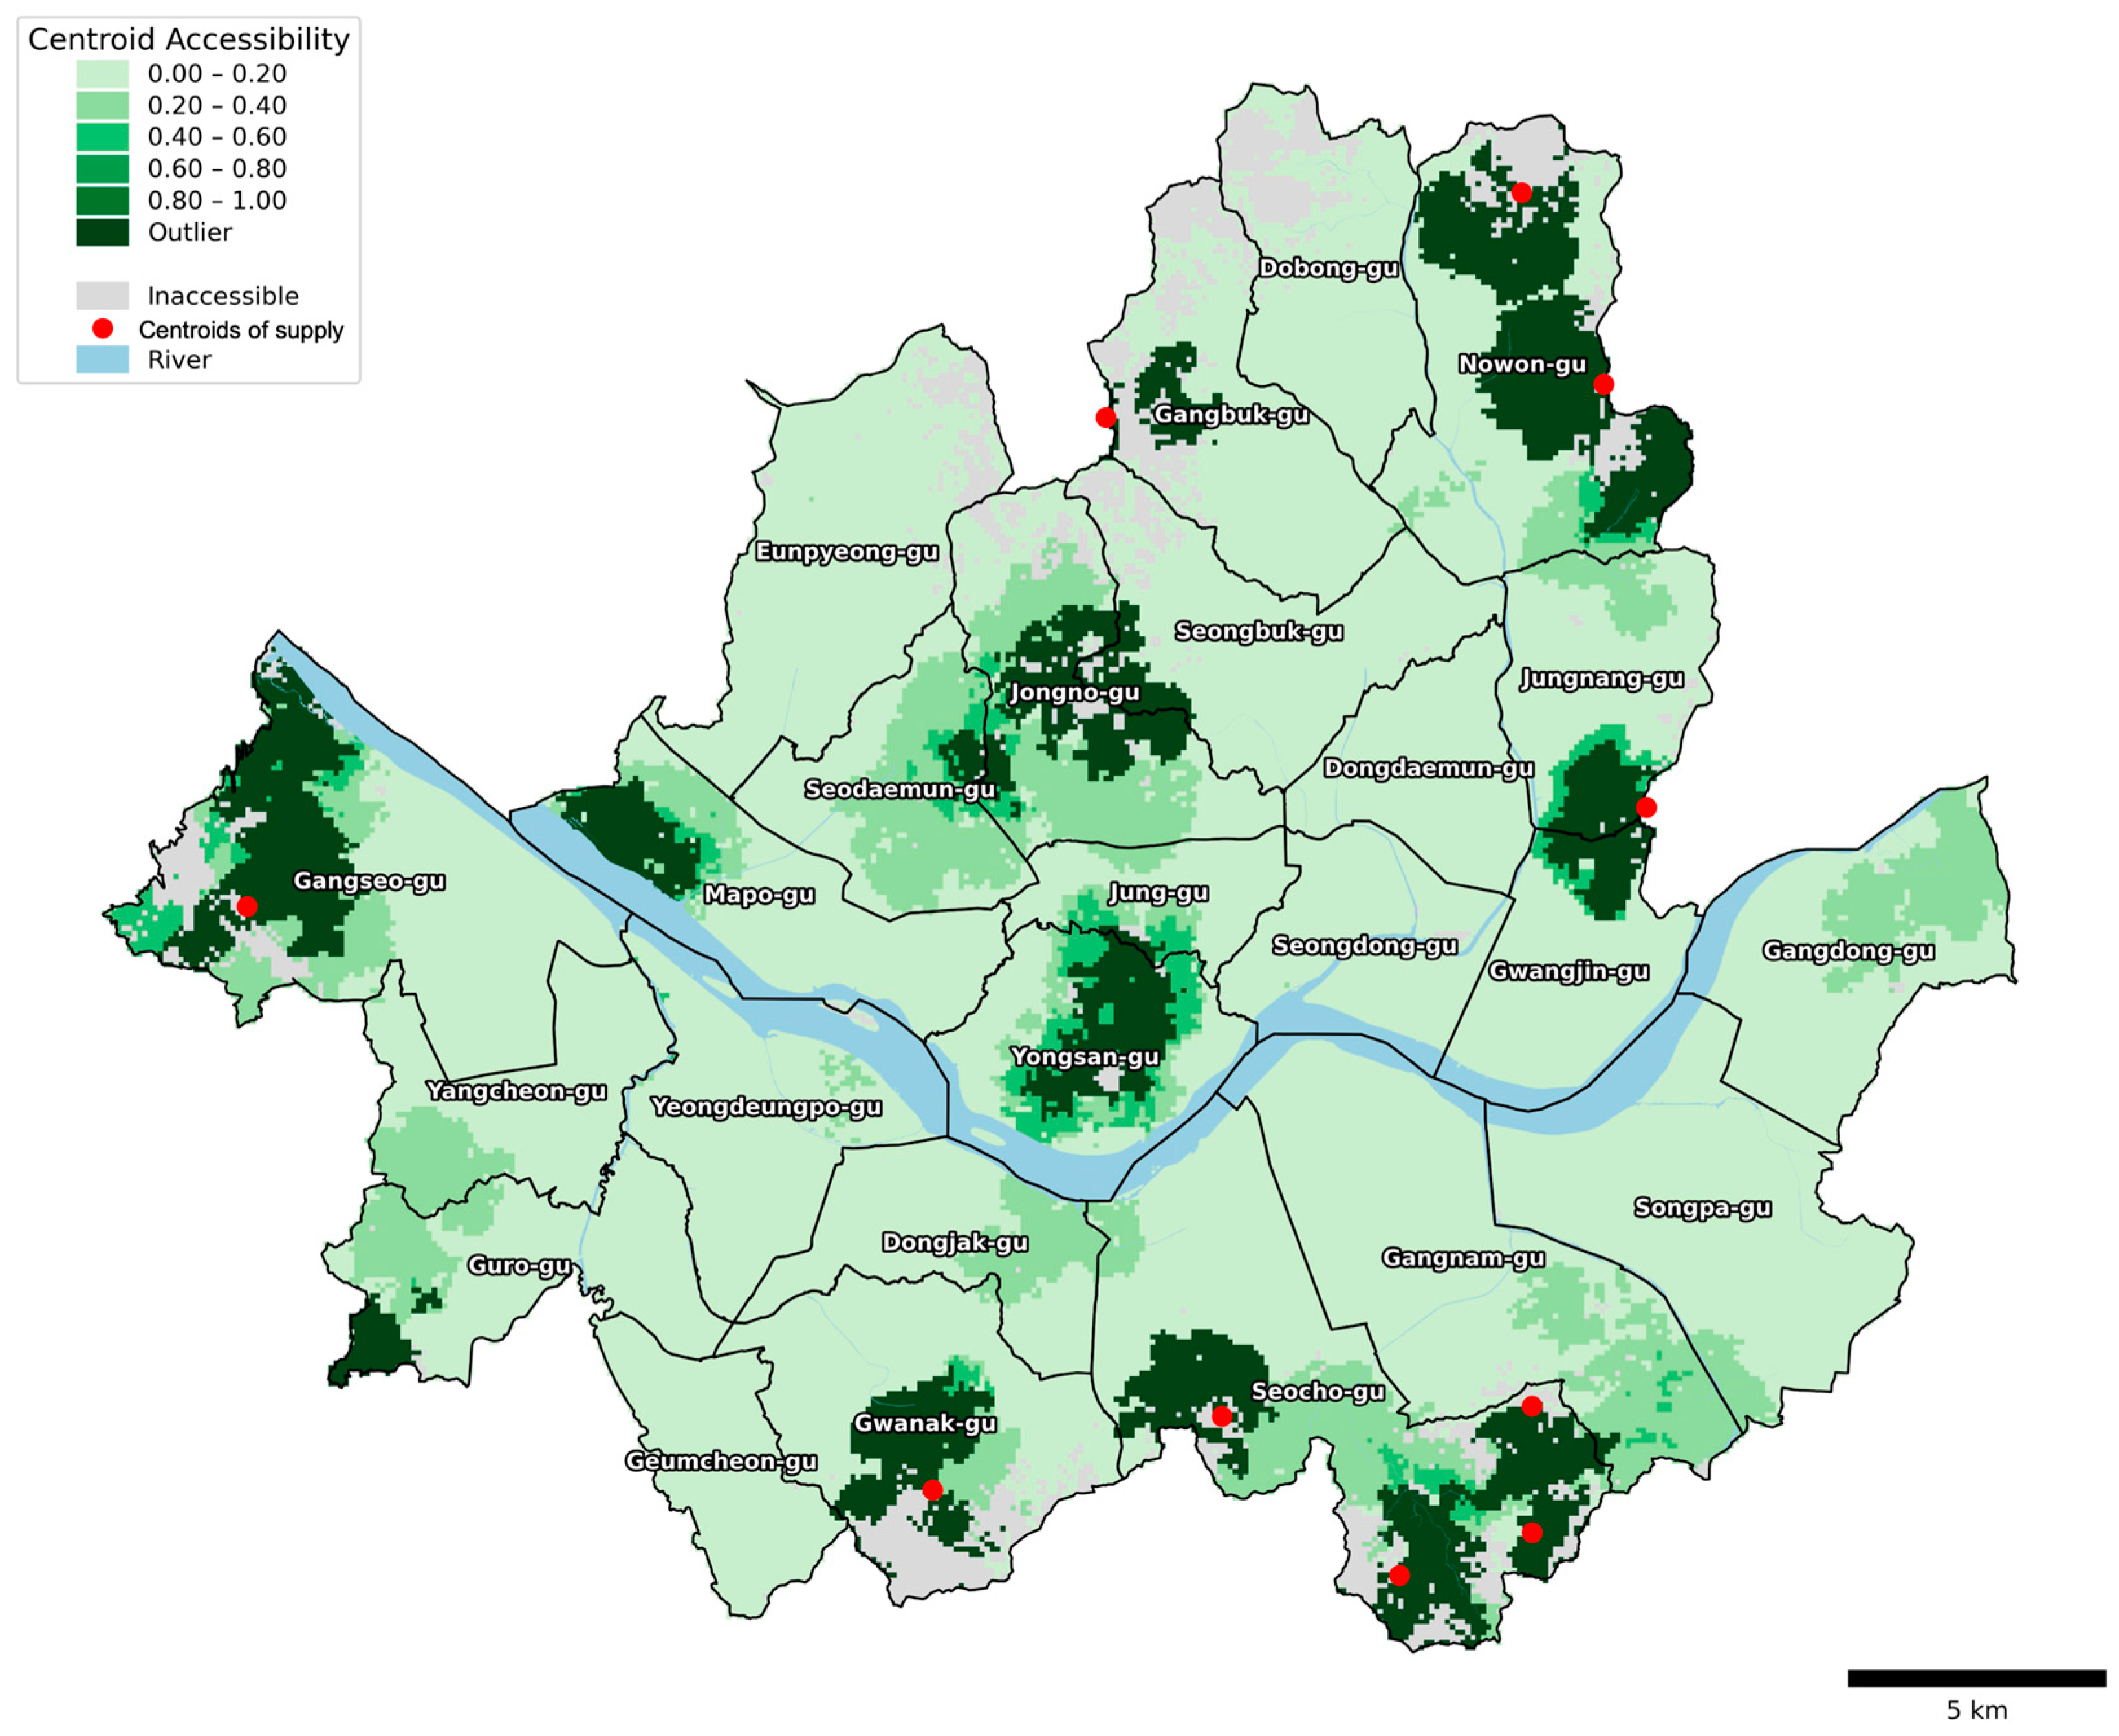
To compare the spatial distribution patterns, we visualized the results using the standardized classification process detailed in Section 3.5. After separating outliers (via IQR) and normalizing the remaining scores to a common 0–1 scale, choropleth maps were created using a shared Equal Interval classification scheme for both methods (Figure 6 and Figure 7). In these figures, areas marked in gray indicate inaccessible locations. To provide a complete context of the overall distribution, the identified outliers are distinctly marked in the darkest green.
Figure 6.
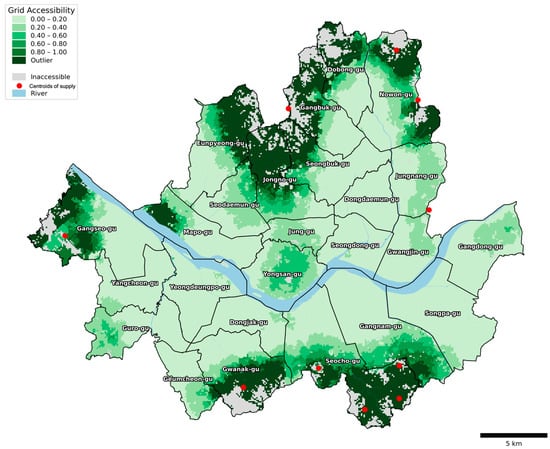
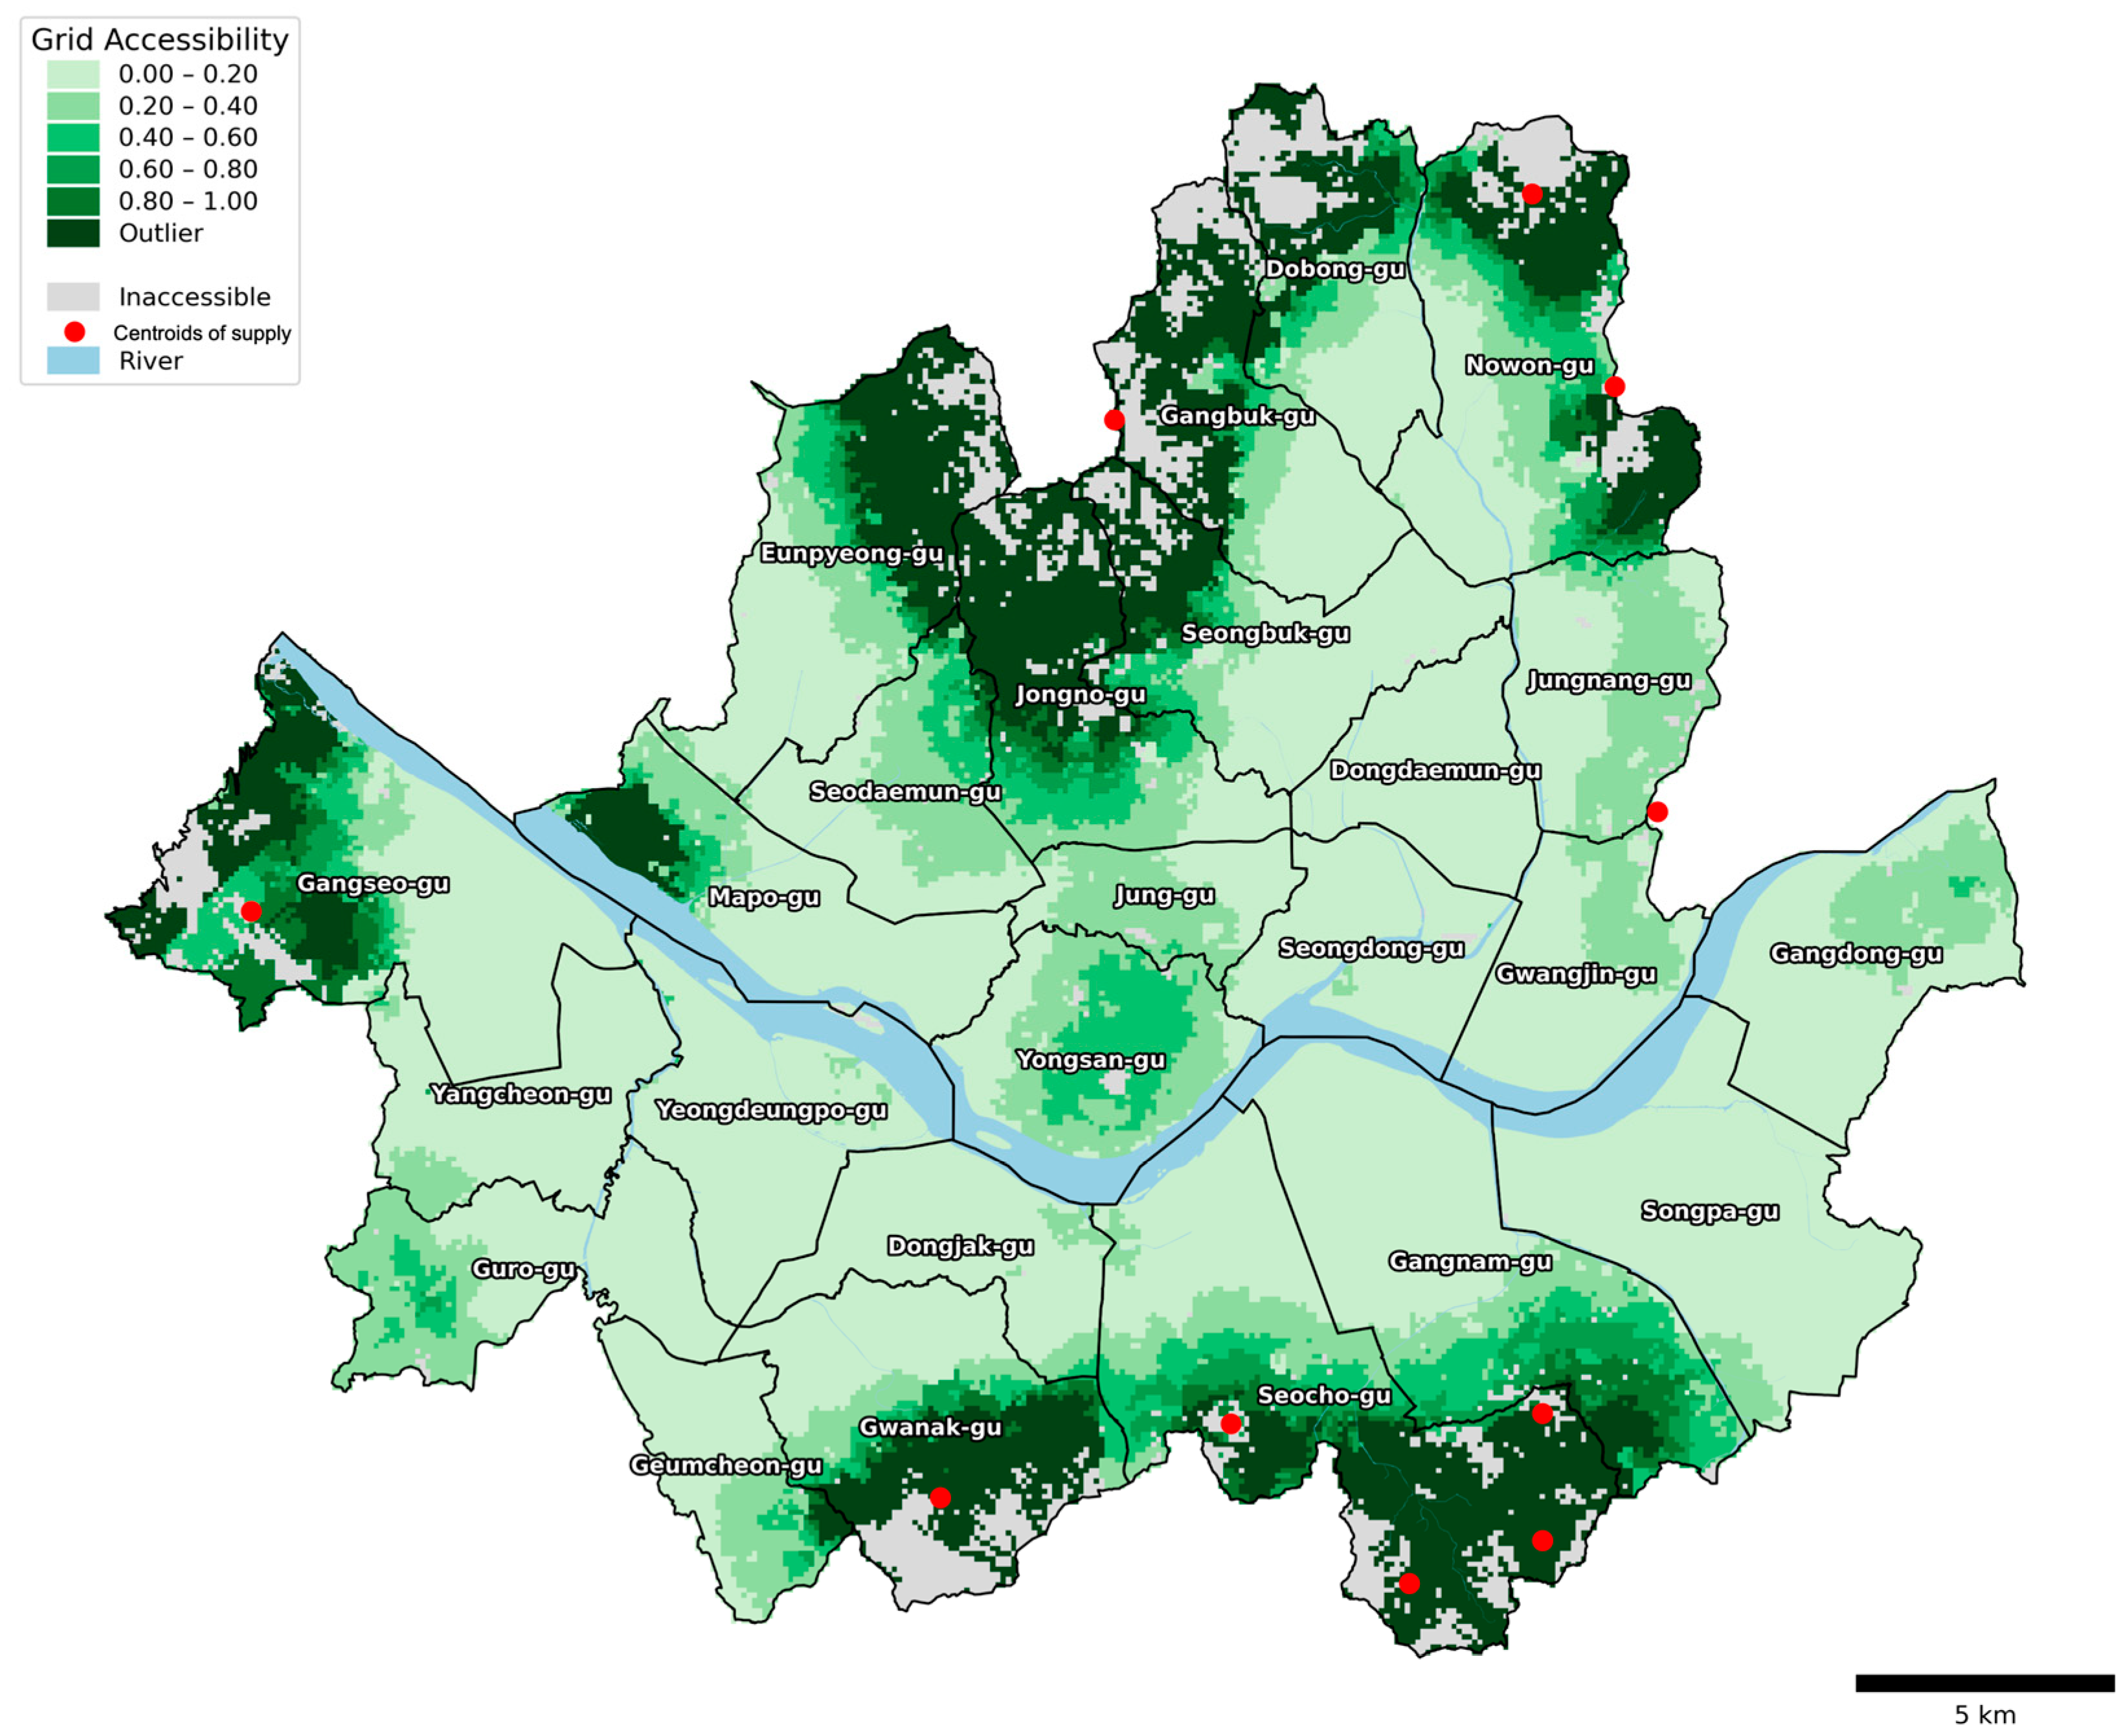
Accessibility Results using the Conventional Centroid-based G2SFCA: Gray areas indicate inaccessible regions. The darkest green represents outliers: areas with accessibility scores so high they exceed the 0–1 normalized range of the main data. The red dots represent the centroids of the top 10 largest green spaces by area (Note: Administrative district boundaries are shown for geographical reference only. The unit of analysis for accessibility calculation is the 100 m grid).
Figure 7.
Accessibility Results using the Proposed Grid-based G2SFCA: Gray areas indicate inaccessible regions. The darkest green represents outliers: areas with accessibility scores so high they exceed the 0–1 normalized range of the main data. The red dots represent the centroids of the top 10 largest green spaces by area (Note: Administrative district boundaries are shown for geographical reference only. The unit of analysis for accessibility calculation is the 100 m grid).
The results using the conventional method (Figure 6) show a tendency for high accessibility values to be concentrated only near the centroids of large-scale green spaces. Conversely, areas near the actual boundaries of large-scale green spaces often exhibit low accessibility values, highlighting the limitations of the centroid assumption. In contrast, the proposed grid-based method (Figure 7) exhibits accessibility patterns that are expanded and more closely follow the actual distribution of green spaces.
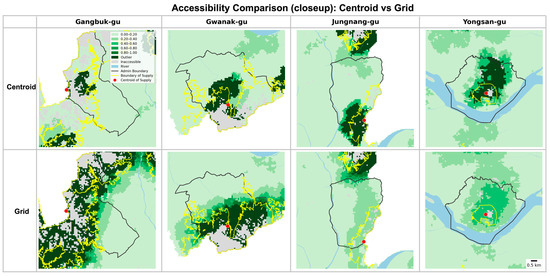
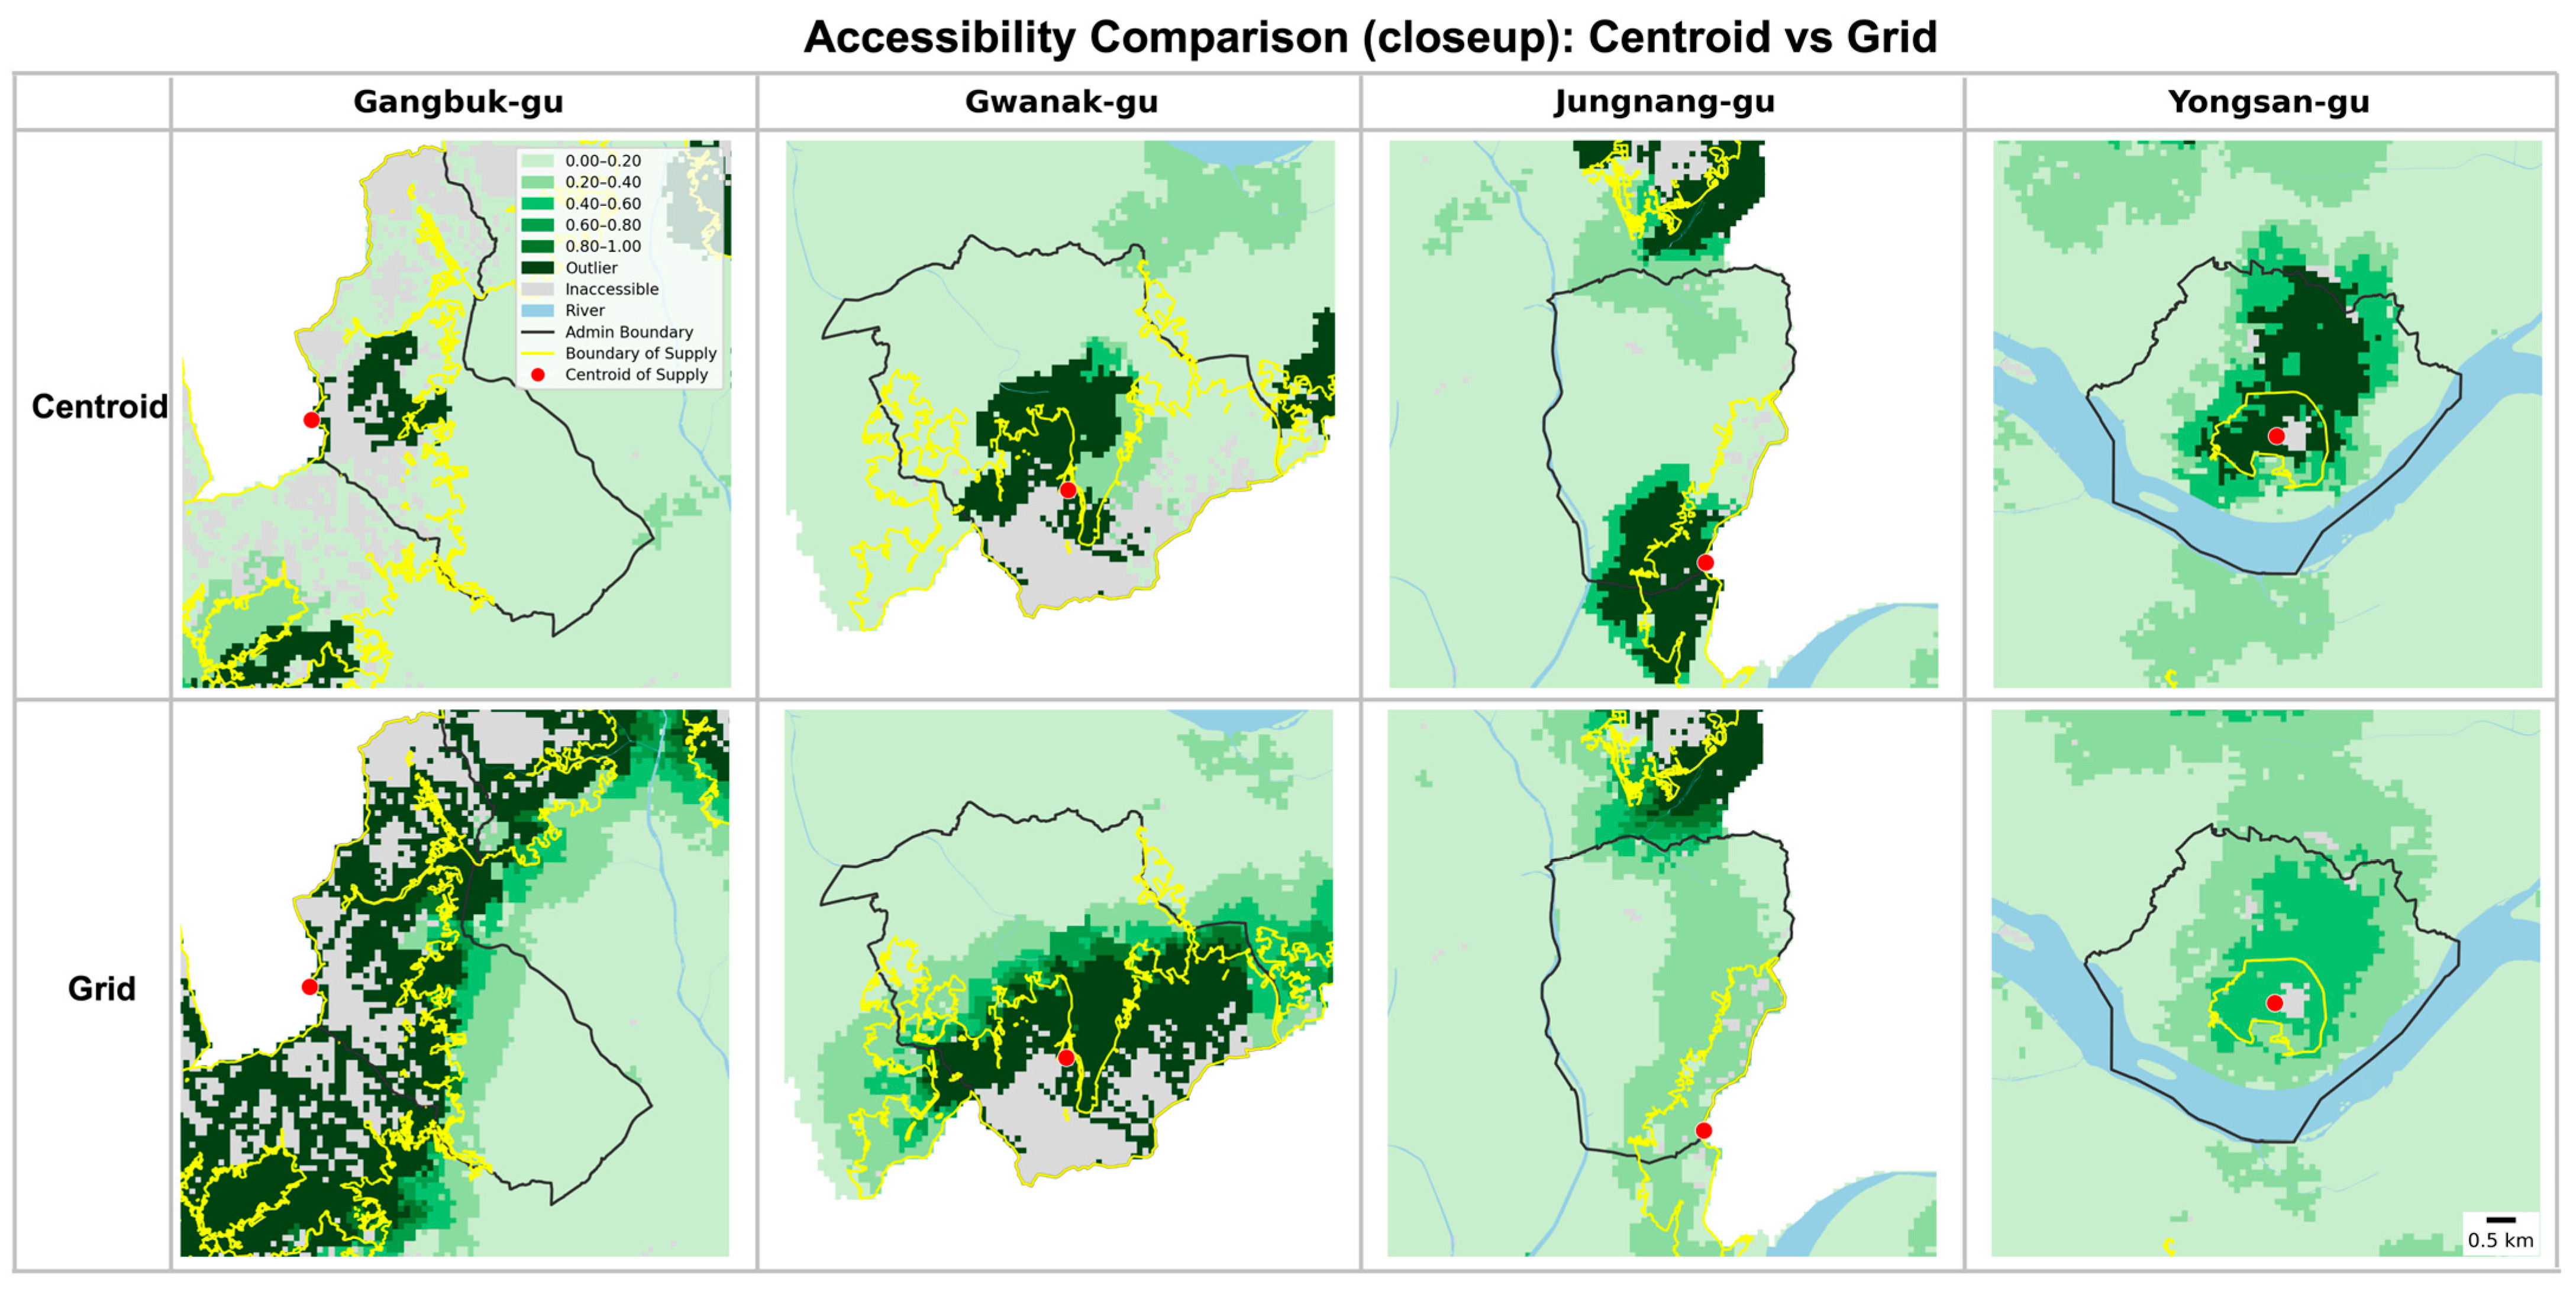
The comparative analysis reveals distinct spatial redistribution patterns across Seoul (Figure 8). Given that Seoul is surrounded by green belt and mountains, the north and south periphery has most of the green spaces. The proposed method yielded reasonable results regarding the distribution of green spaces (Figure 3). To be specific, in northern Seoul, the conventional method showed high accessibility concentrated in small locations in Gangbuk-gu, Nowon-gu, and Jongno-gu, while the proposed method shows high accessibility distributed across the entire northern region, including Eunpyeong-gu, Seongbuk-gu, and Dobong-gu. In southern Seoul, the localized high-accessibility zones in Gwanak-gu and Seocho-gu observed in the conventional method expanded to cover broader areas in the proposed method. Additionally, Geumcheon-gu, which previously demonstrated very low accessibility, showed increased accessibility in areas adjacent to Gwanak-gu under the proposed method.
Figure 8.
Closeup Views of Selected Districts: The yellow lines and red dots represent the boundaries and centroids of major green spaces, respectively (Note: Administrative district boundaries are shown for geographical reference only. The unit of analysis for accessibility calculation is the 100 m grid).
The eastern region exhibited contrasting patterns, where the high-accessibility cluster observed between Jungnang-gu and Gwangjin-gu in the conventional method was not present in the proposed method. Instead, both districts showed similar, moderate levels of accessibility. In central Seoul, the high-accessibility pattern in Seodaemun-gu and Yongsan-gu remained relatively consistent between methods, though the index values in the proposed method were comparatively lower when considered within the city-wide distribution context.
4.3. Spatial Autocorrelation Analysis
To quantitatively assess the spatial clustering of the accessibility scores, a Global Moran I analysis was conducted. The analysis yielded a Moran I value of 0.8899 for the proposed method and 0.7891 for the conventional method, with both results being statistically significant (p < 0.001). This indicates the presence of strong positive spatial autocorrelation in both distributions. Notably, the higher Moran I value of the proposed method suggests that it produces a more spatially coherent and realistic pattern, where accessibility transitions smoothly across adjacent areas rather than concentrating around isolated points.
4.4. Spatial Inequality Index Comparison
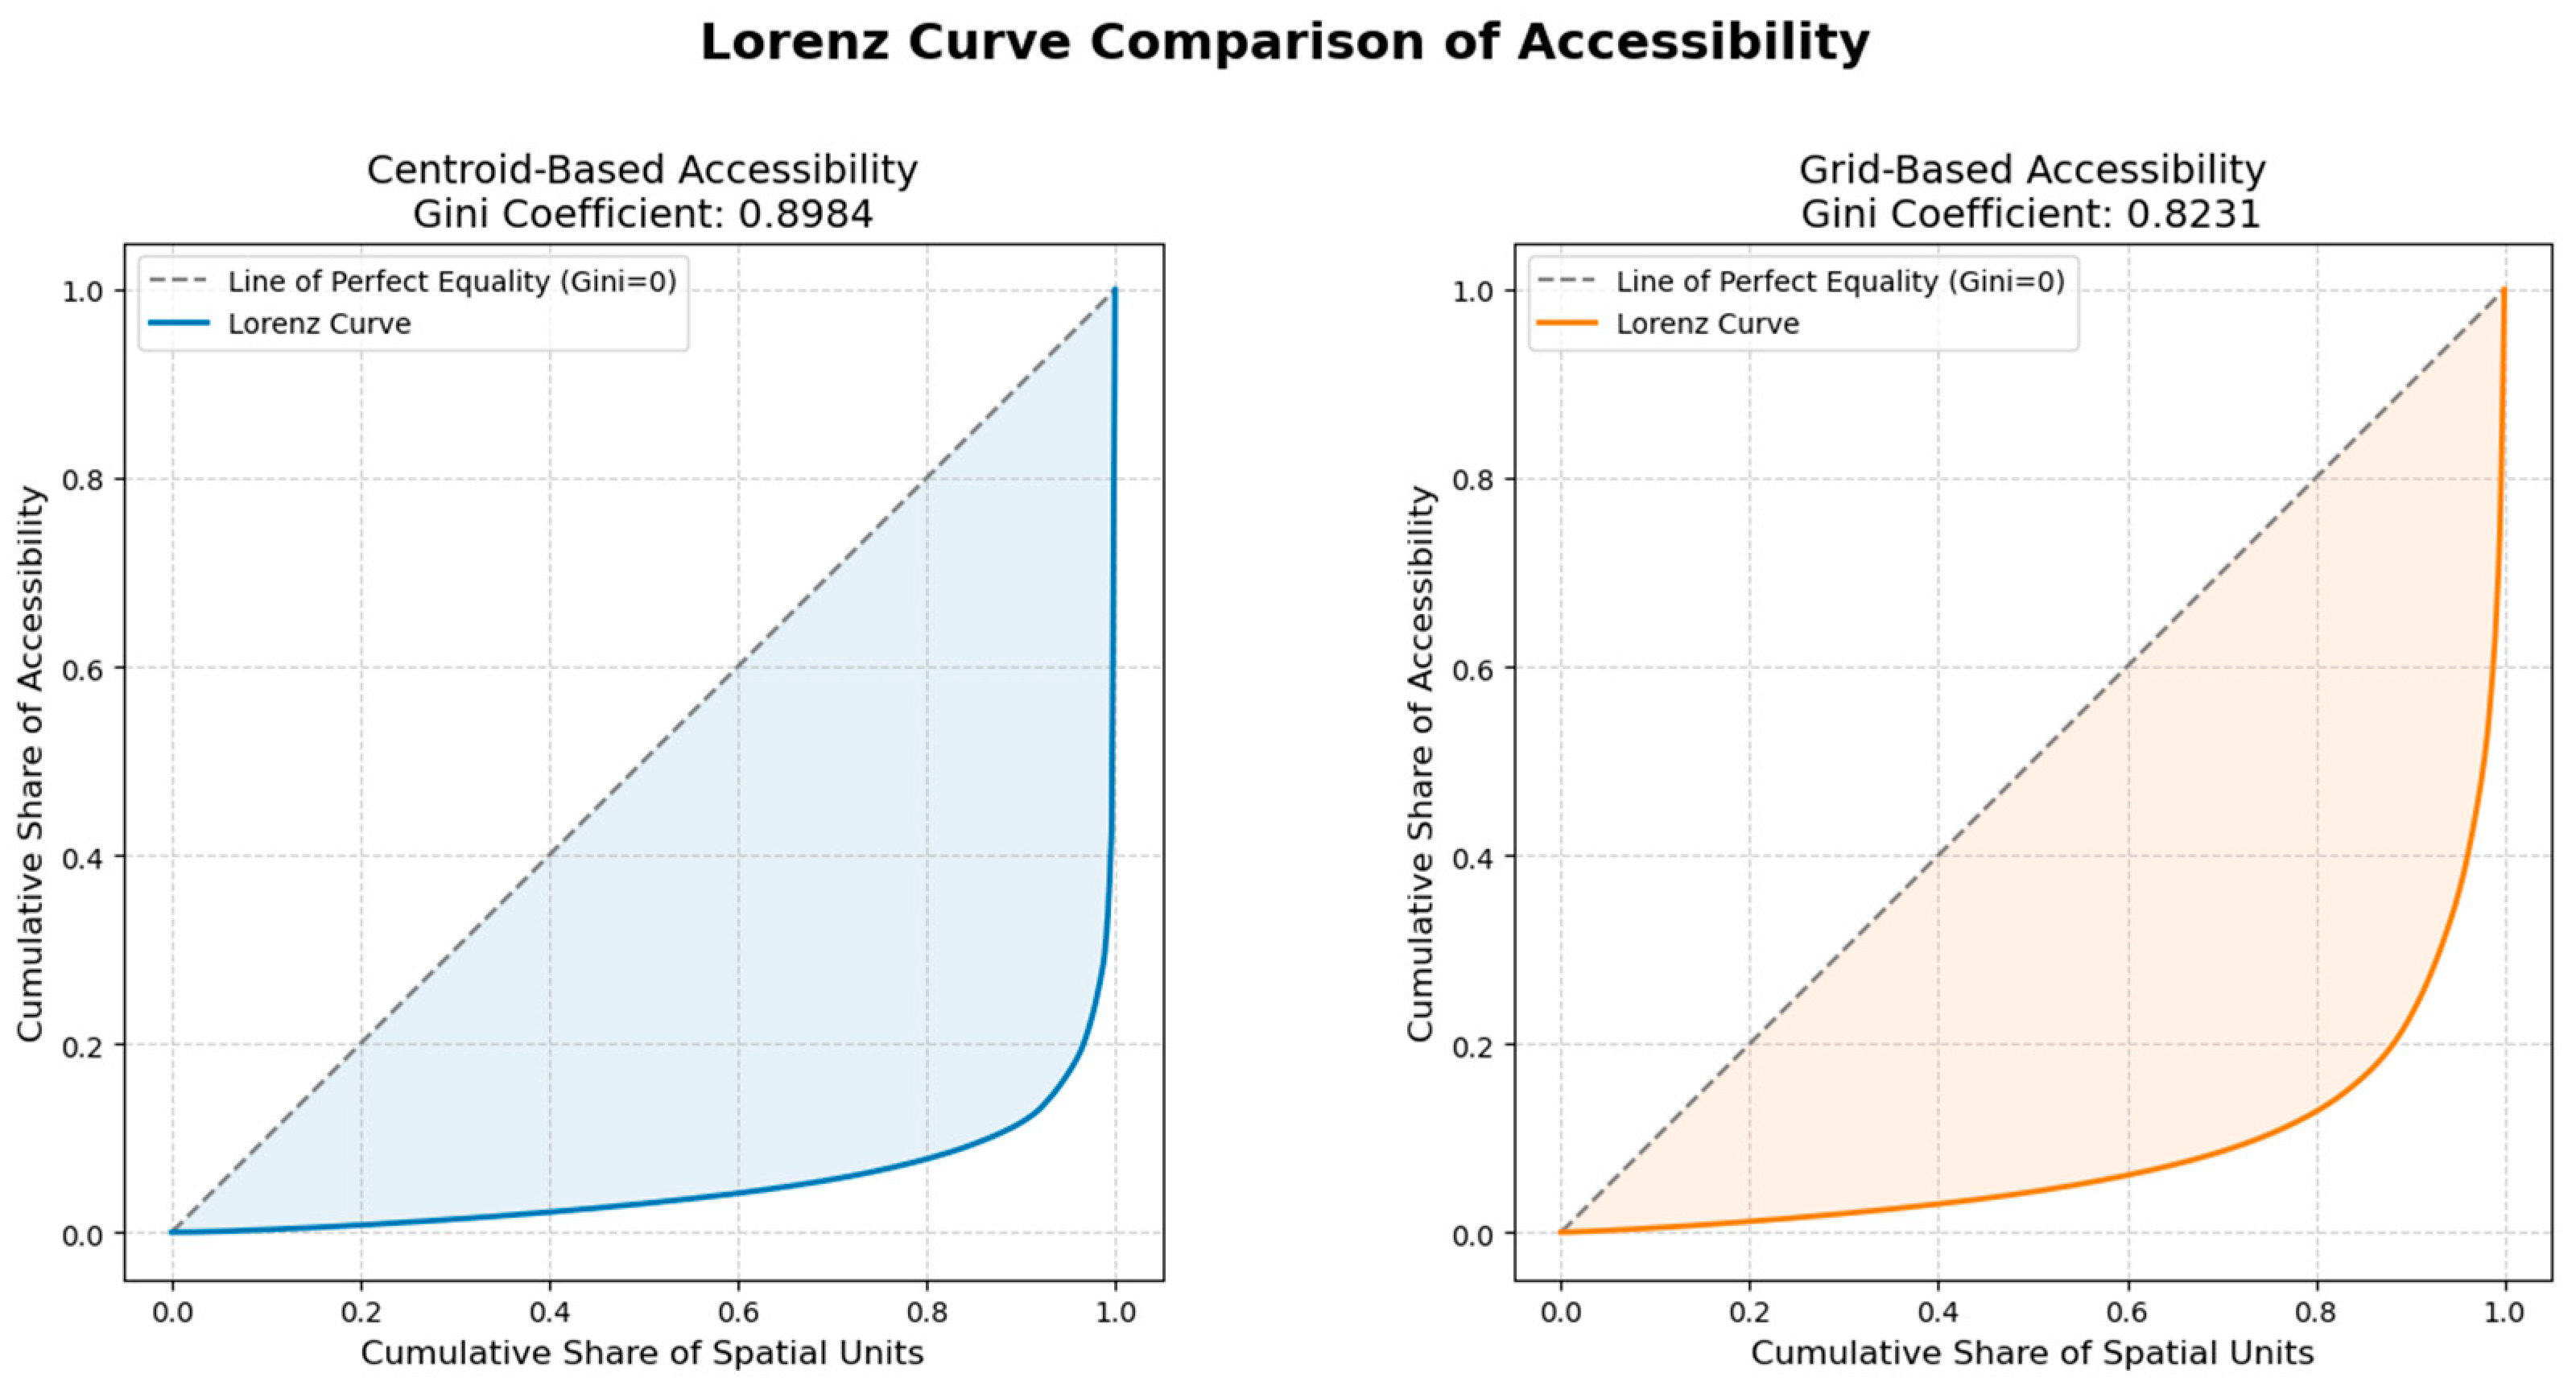
To compare the degree of inequality in the green space accessibility indices from both methods, the Gini Coefficient and the Lorenz Curve were analyzed (Figure 9). The Gini coefficient decreased from 0.8984 for the conventional method to 0.8231 for the proposed method, indicating that the proposed approach mitigates spatial inequality. In other words, this result yielded that the inequality using the conventional method could be exaggerated compared to the one of the practical and realized accessibility.
Figure 9.
The Gini Coefficient and the Lorenz Curve Comparison: the left plot (the conventional method) and the right plot (the proposed method). The proposed method (orange line) shows a lower Gini coefficient compared to the conventional method (blue line), indicating a reduction in spatial inequality.
5. Discussion
This study proposes a grid-based approach to provide a robust measure of accessibility. It addresses one of the most fundamental problems in the spatial accessibility discipline: the systematic bias resulting from the use of a single centroid to represent large-scale supply facilities. This problem becomes more severe as the size of the supply facility increases. Our proposed approach, which employs grids and multiple centroids, corrects this bias by redistributing the supply, thereby addressing the methodological artifact inherent in conventional accessibility measurements. This fundamental shift provides access measures that are considerably more realistic and reliable for policy implications. Specifically, our study makes contributions in two main aspects. First, it provides a re-evaluation of access inequality by correcting for centroid-induced distortions. Second, it enhances the practicality of infrastructure planning.
5.1. Re-Evaluation of Access Inequality
Our approach addresses the excessive and distorted inequality in access reported by conventional methods. Due to the misassignment of large-scale supply facilities to a single point, the conventional approach indicated that most districts had insufficient access, while a few exhibited extremely high or excessive access. Our approach reveals that such inequality is often an artifact of the measurement method itself when supply facilities are large-scale.
This argument is supported by robust statistical evidence from our case study. The proposed method demonstrated stabilized distribution characteristics: the mean accessibility score showed a slight increase from 101.2 to 106.5, while the standard deviation was nearly halved from 985.5 to 462.6. In addition, the Gini coefficient decreased substantially from 0.8984 to 0.8231, suggesting a more equitable distribution of accessibility benefits. Furthermore, the proposed method enhanced practicality in accessibility assessment. To be specific, the overconcentration of the accessibility measures from the conventional method (e.g., Gangbuk-gu) was redistributed to surrounding areas, including Eunpyeong-gu and Dobong-gu, with the help of grids and multiple centroids in the proposed method. This redistribution results in a pattern that better reflects the actual spatial characteristics of green facilities, a conclusion statistically supported by a higher Global Moran I value increasing from 0.7891 to 0.8899, which indicates a more spatially coherent distribution.
These findings suggest that previous studies need to be revisited and compared in light of methodological considerations. Recent studies have attempted to assess the equity of green space in Seoul through various approaches, such as incorporating private parks (parks within apartment complexes) into supply data or applying Pedestrian Network Analysis or E2SFCA methods [36,37,38]. However, each of these studies exhibits the following limitations. Reliance on coarse administrative boundaries (i.e., dong; census tract in the U.S. context) constrains the identification of fine-grained spatial variations [37], and the use of single centroids for large-scale facilities results in accessibility bias and spatial distortion in areas with major green spaces (e.g., Yongsan Park, Olympic Park) [36]. This bias inadvertently portrays many other areas as having significantly lower accessibility. While post-processing techniques (e.g., logarithmic transformation [36], setting park service level thresholds [38]) have been applied to mitigate extreme values, our study demonstrates that the root cause lies in the supply-side representation itself. By employing a grid-based G2SFCA method that encompasses all green space categories including mountainous areas and addresses the centroid substitution error, we fundamentally correct these distortions at their source, providing a more balanced depiction of spatial inequality without relying on artificial statistical adjustments.
5.2. Enhancing Practicality and Methodological Extension
Our proposed method significantly enhances the practicability of accessibility measurement by revealing the actual locations where new infrastructure is needed. The mitigation of centroid bias allows for the correct interpretation of access measures, preventing policy errors. For instance, in our case study, the northernmost district (i.e., Dobong-gu) was inaccurately presented as having insufficient access by the conventional approach. However, our proposed approach revealed that the district actually possesses relatively high access to green space due to the distributed nature of its mountain resources. Such a misunderstanding in the conventional approach could lead to the misallocation of resources or the unnecessary installation of infrastructure, resulting in the inefficient use of limited public funds.
This methodological improvement aligns with and extends recent advancements in accessibility research, such as the work by Michels et al. (2025) [25]. While that study focused on the demand side (Areal 2SFCA) to address the measurement error arising from the binary inclusion of population centroids, our study applies this logic to the supply side. Both studies share a common goal: overcoming the limitations of the centroid assumption that simplifies complex spatial features into single points. By integrating the grid-based supply representation proposed in this study with demand-side refinements, researchers and planners can achieve a holistic and precise understanding of the built environment.
Moreover, the implications of this study extend beyond mere measurement accuracy. By providing a more reliable accessibility analysis, the proposed method offers an evidence-based foundation for directing limited public funds to areas with the greatest need, thereby maximizing the efficiency of resource allocation. The grid-based approach demonstrated here can also be extended beyond green spaces to equitably assess accessibility to other large-scale facilities such as medical complexes, educational institutions, and cultural centers. This versatility contributes significantly to urban planning efforts aimed at mitigating regional disparities across various public services.
6. Conclusions
Our study proposed a grid-based G2SFCA methodology to overcome the limitations of the conventional centroid-based approach in measuring accessibility to large-scale facilities, such as green spaces. To the best of our knowledge, this is the first study to extend the resolution of the centroid aggregation error (previously addressed primarily on the demand side) to the supply side for large-scale facilities like green spaces. By calculating accessibility at the grid-cell level, the proposed method provides a more robust and realistic representation of spatial accessibility by correcting for the inherent biases of the conventional model. Applying this method to green spaces in Seoul demonstrated that using a grid-based supply representation yields more stable and realistic accessibility indices compared to the conventional method.
Our findings offer three main implications. First, the proposed method provides a more stable measure and offers a re-evaluation of spatial inequality of access. The significant reduction in the standard deviation and Gini coefficient indicates that the extreme disparities reported in previous studies were partly methodological artifacts stemming from the aggregation of supply into centroids. Second, this study supports more effective urban planning by identifying the spatial distribution of accessibility more reliably. As demonstrated in the Dobong-gu and Eunpyeong-gu cases, the grid-based approach prevents the misallocation of resources that could arise from such methodological artifacts, ensuring support reaches areas with actual accessibility deficits. Third, this research complements existing study by extending disaggregation methods to the supply side. While previous research has largely focused on refining demand-side measurements, our approach demonstrates that addressing supply-side representation is equally important for accurate accessibility analysis. In conclusion, the Grid-based G2SFCA offers a practical and rigorous alternative for evaluating accessibility to large-scale infrastructure.
Despite the significant contributions of this study, several limitations should be acknowledged. First, regarding the spatial unit of analysis, this study used the finest-resolution grid (100 m) available defined by the government to maximize the precision of the assessment. However, the optimal grid size may vary depending on the scale of the study area and facility types; thus, future research should investigate grid resolution optimization (e.g., sensitivity analysis). Second, the pedestrian network data from Open Street Map may not perfectly capture the real-world walking environment. Future work could incorporate more precise network data or actual mobility patterns. Finally, this study defined supply solely by the area of green space. Future studies should integrate qualitative variables (e.g., facility quality, safety) and extend the research to a spatio-temporal accessibility analysis using dynamic data to capture hourly fluctuations. Through these improvements, the study can contribute to evidence-based decision-making in urban management.
Author Contributions
Conceptualization, Jin Shin and Jinwoo Park; Methodology, Jin Shin and Jinwoo Park; Data curation, Jin Shin; writing—original draft preparation, Jin Shin; writing—review & editing, Jin Shin and Jinwoo Park; visualization, Jin Shin; supervision, Jinwoo Park. All authors have read and agreed to the published version of the manuscript.
Funding
This research received no external funding.
Data Availability Statement
Derived data supporting the findings of this study are available from the corresponding author upon request.
Acknowledgments
During the preparation of this manuscript, the authors used Gemini 3 Pro for English translation to refine the grammatical structure and to enhance readability. The authors have reviewed and edited the output and take full responsibility for the content of this publication.
Conflicts of Interest
The authors declare no conflicts of interest.
References
- Hartig, T.; Mitchell, R.; de Vries, S.; Frumkin, H. Nature and Health. In Annual Review of Public Health; Fielding, J.E., Ed.; Annual Reviews: Palo Alto, CA, USA, 2014; Volume 35, pp. 207–228. [Google Scholar]
- Mensah, C.A.; Andres, L.; Perera, U.; Roji, A. Enhancing quality of life through the lens of green spaces: A systematic review approach. Int. J. Wellbeing 2016, 6, 142–163. [Google Scholar] [CrossRef] [Scilit]
- Yu, Z.; Guo, X.; Jorgensen, G.; Vejre, H. How can urban green spaces be planned for climate adaptation in subtropical cities? Ecol. Indic. 2017, 82, 152–162. [Google Scholar] [CrossRef] [Scilit]
- Liu, H.-L.; Shen, Y.-S. The impact of green space changes on air pollution and microclimates: A case study of the Taipei metropolitan area. Sustainability 2014, 6, 8827–8855. [Google Scholar] [CrossRef] [Scilit]
- Zhang, Y.; Murray, A.T.; Turner Ii, B. Optimizing green space locations to reduce daytime and nighttime urban heat island effects in Phoenix, Arizona. Landsc. Urban Plan. 2017, 165, 162–171. [Google Scholar] [CrossRef] [Scilit]
- Arghavani, S.; Malakooti, H.; Bidokhti, A.-A.A.A. Numerical assessment of the urban green space scenarios on urban heat island and thermal comfort level in Tehran Metropolis. J. Clean. Prod. 2020, 261, 121183. [Google Scholar] [CrossRef] [Scilit]
- Dony, C.C.; Delmelle, E.M.; Delmelle, E.C. Re-conceptualizing accessibility to parks in multi-modal cities: A Variable-width Floating Catchment Area (VFCA) method. Landsc. Urban Plan. 2015, 143, 90–99. [Google Scholar] [CrossRef] [Scilit]
- Park, J.; Goldberg, D.W. A review of recent spatial accessibility studies that benefitted from advanced geospatial information: Multimodal transportation and spatiotemporal disaggregation. ISPRS Int. J. Geo-Inf. 2021, 10, 532. [Google Scholar] [CrossRef] [Scilit]
- Hansen, W.G. How accessibility shapes land use. J. Am. Inst. Plan. 1959, 25, 73–76. [Google Scholar] [CrossRef] [Scilit]
- Huff, D.L. Defining and estimating a trading area. J. Mark. 1964, 28, 34–38. [Google Scholar] [CrossRef] [Scilit]
- Shen, Q. Location characteristics of inner-city neighborhoods and employment accessibility of low-wage workers. Environ. Plan. B Plan. Des. 1998, 25, 345–365. [Google Scholar] [CrossRef] [Scilit]
- Luo, W.; Wang, F. Measures of spatial accessibility to health care in a GIS environment: Synthesis and a case study in the Chicago region. Environ. Plan. B Plan. Des. 2003, 30, 865–884. [Google Scholar] [CrossRef] [Scilit] [PubMed]
- Dai, D. Racial/ethnic and socioeconomic disparities in urban green space accessibility: Where to intervene? Landsc. Urban Plan. 2011, 102, 234–244. [Google Scholar] [CrossRef] [Scilit]
- Dai, D. Black residential segregation, disparities in spatial access to health care facilities, and late-stage breast cancer diagnosis in metropolitan Detroit. Health Place 2010, 16, 1038–1052. [Google Scholar] [CrossRef] [Scilit] [PubMed]
- Luo, W.; Qi, Y. An enhanced two-step floating catchment area (E2SFCA) method for measuring spatial accessibility to primary care physicians. Health Place 2009, 15, 1100–1107. [Google Scholar] [CrossRef] [Scilit]
- Dai, D.; Wang, F. Geographic disparities in accessibility to food stores in southwest Mississippi. Environ. Plan. B-Plan. Des. 2011, 38, 659–677. [Google Scholar] [CrossRef] [Scilit]
- Luo, W.; Whippo, T. Variable catchment sizes for the two-step floating catchment area (2SFCA) method. Health Place 2012, 18, 789–795. [Google Scholar] [CrossRef] [Scilit]
- Mao, L.; Nekorchuk, D. Measuring spatial accessibility to healthcare for populations with multiple transportation modes. Health Place 2013, 24, 115–122. [Google Scholar] [CrossRef] [Scilit]
- Park, J.; Goldberg, D.W. An Examination of the Stochastic Distribution of Spatial Accessibility to Intensive Care Unit Beds during the COVID-19 Pandemic: A Case Study of the Greater Houston Area of Texas. Geogr. Anal. 2023, 55, 384–398. [Google Scholar] [CrossRef] [Scilit]
- Park, J.; Michels, A.; Lyu, F.; Han, S.Y.; Wang, S. Daily changes in spatial accessibility to ICU beds and their relationship with the case-fatality ratio of COVID-19 in the state of Texas, USA. Appl. Geogr. 2023, 154, 102929. [Google Scholar] [CrossRef] [Scilit]
- Järv, O.; Tenkanen, H.; Salonen, M.; Ahas, R.; Toivonen, T. Dynamic cities: Location-based accessibility modelling as a function of time. Appl. Geogr. 2018, 95, 101–110. [Google Scholar] [CrossRef] [Scilit]
- Liu, D.; Kwan, M.; Kan, Z. Analysis of urban green space accessibility and distribution inequity in the City of Chicago. Urban For. Urban Green. 2021, 59, 127029. [Google Scholar] [CrossRef] [Scilit]
- Wu, W.; Zheng, T. Establishing a “dynamic two-step floating catchment area method” to assess the accessibility of urban green space in Shenyang based on dynamic population data and multiple modes of transportation. Urban For. Urban Green. 2023, 82, 127893. [Google Scholar] [CrossRef] [Scilit]
- Ye, C.; Hu, L.; Li, M. Urban green space accessibility changes in a high-density city: A case study of Macau from 2010 to 2015. J. Transp. Geogr. 2018, 66, 106–115. [Google Scholar] [CrossRef] [Scilit]
- Michels, A.; Park, J.; Kang, J.Y.; Wang, S. An Areal Approach to Spatial Accessibility Analysis. Geogr. Anal. 2025, 57, 233–269. [Google Scholar] [CrossRef] [Scilit]
- Seoul Open Data Plaza. Available online: https://data.seoul.go.kr/ (accessed on 25 November 2025).
- Li, C.; Wang, J. Using an age-grouped Gaussian-based two-step floating catchment area method (AG2SFCA) to measure walking accessibility to urban parks: With an explicit focus on elderly. J. Transp. Geogr. 2024, 114, 103772. [Google Scholar] [CrossRef] [Scilit]
- Guo, S.; Song, C.; Pei, T.; Liu, Y.; Ma, T.; Du, Y.; Chen, J.; Fan, Z.; Tang, X.; Peng, Y. Accessibility to urban parks for elderly residents: Perspectives from mobile phone data. Landsc. Urban Plan. 2019, 191, 103642. [Google Scholar] [CrossRef] [Scilit]
- Kang, J.; Park, J. Measuring Spatial Accessibility to COVID-19 Testing Sites: A Case Study of Seoul. J. Korean Geogr. Soc. 2021, 56, 231–244. (In Korean) [Google Scholar]
- Park, J.; Kang, J.-Y.; Goldberg, D.W.; Hammond, T.A. Leveraging temporal changes of spatial accessibility measurements for better policy implications: A case study of electric vehicle (EV) charging stations in Seoul, South Korea. Int. J. Geogr. Inf. Sci. 2022, 36, 1185–1204. [Google Scholar] [CrossRef] [Scilit]
- Tukey, J.W. Exploratory Data Analysis; Addison-Wesley: Reading, MA, USA, 1977; Volume 2, pp. 131–160. [Google Scholar]
- Massey, F.J., Jr. The Kolmogorov-Smirnov test for goodness of fit. J. Am. Stat. Assoc. 1951, 46, 68–78. [Google Scholar] [CrossRef]
- Moran, P.A. Notes on continuous stochastic phenomena. Biometrika 1950, 37, 17–23. [Google Scholar] [CrossRef] [Scilit]
- Gini, C. Variabilità e Mutabilità: Contributo allo Studio delle Distribuzioni e delle Relazioni Statistiche; Tipogr. di P. Cuppini: Bologna, Italy, 1912; Available online: https://books.google.it/books?id=fqjaBPMxB9kC (accessed on 6 February 2026).
- Chen, B.Y.; Cheng, X.-P.; Kwan, M.-P.; Schwanen, T. Evaluating spatial accessibility to healthcare services under travel time uncertainty: A reliability-based floating catchment area approach. J. Transp. Geogr. 2020, 87, 102794. [Google Scholar] [CrossRef] [Scilit]
- Hong, H.J. A Study on the Correlation between Spatial Accessibility of Urban Parks and Quality of Life of Urban Residents. Master’s Thesis, Kyung Hee University, Seoul, Republic of Korea, 2024. (In Korean) [Google Scholar]
- Seo, J.; Kim, J. Exploring the influence of the private park on spatial equity in urban parks: A case study in Seoul, South Korea. Urban For. Urban Green. 2025, 104, 128663. [Google Scholar] [CrossRef] [Scilit]
- Hwang, B.; Ko, C.; Kim, J.; Kim, C.; Kang, W. Urban Park Accessibility Evaluation using Pedestrian Network Analysis in Seoul. J. Korean Cadastre Inf. Assoc. 2022, 24, 154–167. (In Korean) [Google Scholar] [CrossRef] [Scilit]

Disclaimer/Publisher’s Note: The statements, opinions and data contained in all publications are solely those of the individual author(s) and contributor(s) and not of MDPI and/or the editor(s). MDPI and/or the editor(s) disclaim responsibility for any injury to people or property resulting from any ideas, methods, instructions or products referred to in the content. |
© 2026 by the authors. Published by MDPI on behalf of the International Society for Photogrammetry and Remote Sensing. Licensee MDPI, Basel, Switzerland. This article is an open access article distributed under the terms and conditions of the Creative Commons Attribution (CC BY) license.