


Abstract
Mycobacterium tuberculosis (Mtb) is a significant intracellular pathogen that causes tuberculosis (TB), a disease with considerable morbidity and mortality. Mtb evades host immunity by secreting effector proteins, including phosphatidylinositol-3-phosphatase SapM, which inhibits phagosomal maturation. However, the structure and functional mechanisms of SapM remain incompletely understood. Here, we successfully isolated monomeric SapM protein, with a measured hydrodynamic diameter of 5.1 ± 0.3 nm. We used p-nitrophenyl phosphate (pNPP), a small chromogenic phosphate monoester substrate, as a surrogate for PI3P (phosphatidylinositol-3-phosphate) in enzymatic assays. Molecular docking was performed using a refined model, and site-specific mutations were introduced. The R61A, T236A, and T250A mutants demonstrated a 5- to 60-fold reduction in activity. The segment 237–249 displayed greater flexibility compared to other regions of SapM. All enzymatic assays used pNPP without added metal; the reported kinetic parameters are therefore apparent values. The active-site metal was not identified, and metal occupancy was not controlled. The SapM gene is critical for Mtb survival within macrophages. In this study, p-nitrophenyl phosphate (pNPP) was used as a chromogenic surrogate for PI3P; therefore, the work reports active-site integrity and pNPP hydrolysis rather than physiological PI3P catalysis. The present data do not establish PI3P turnover in a membrane environment, and PI3P-liposome assays remain future work. Our findings provide a molecular framework for SapM function and identify 237–249 as a candidate regulatory element for future studies. Whether SapM can be targeted therapeutically remains to be established.
1. Introduction
Mycobacterium tuberculosis (Mtb), the causative agent of tuberculosis, remains a significant global health threat [1,2], affecting approximately one-quarter of the world’s population (https://www.who.int/news-room/fact-sheets/detail/tuberculosis (accessed on 17 March 2026)). A key factor in its pathogenicity is its ability to survive and replicate within the hostile environment of host macrophages—immune cells specifically tasked with destroying pathogens [3,4,5,6]. After phagocytosis, Mtb resides in a membrane-bound vacuole known as the phagosome [4,5,7]. In a typical antimicrobial response, the phagosome matures by acidifying and fusing with lysosomes to form a degradative phagolysosome [3,8,9,10]. However, Mtb can effectively interrupt this maturation process, remaining in an arrested, early endosomal-like compartment.
Mtb employs a multifaceted molecular strategy to disrupt phagosomal maturation, including the secretion of a variety of effector proteins into the host cell [11,12,13,14]. Previous biochemical work showed that SapM is a secreted acid phosphatase with an acidic pH optimum. It dephosphorylates phosphatidylinositol-3-phosphate (PI3P) and phosphatidylinositol-4,5-bisphosphate [PI(4,5)P2] [15]. Although SapM shares the metal-dependent serine-based catalytic architecture and overall fold of the alkaline phosphatase superfamily, it is atypical and is not a classical alkaline phosphatase; therefore, we refer to it here as a secreted acid phosphatase. The catalytic core is proposed to involve S95 as the nucleophile, with K159, H160, H204, E59, N60, D238, and E239 contributing to metal binding and substrate positioning. By dephosphorylating PI3P, SapM blocks phagosome-endosome fusion, preventing degradation and detection of intracellular Mtb and contributing to immune evasion [11,12,13,14].
Despite the established role of SapM in blocking phagosome maturation, several key knowledge gaps remain. First, no experimentally validated structure of SapM is available. Second, the residues required for phosphate monoester hydrolysis have not been systematically tested by mutagenesis. Third, the role of flexible peripheral segments in regulating substrate access is unknown. Fourth, the link between SapM catalytic activity and intracellular survival is incompletely defined. The overall aim of this study was to dissect the structure–function relationship of SapM using pNPP as a surrogate substrate. The specific objectives were: (1) to express and purify recombinant SapM and determine its oligomeric state; (2) to build and refine a structural model of SapM; (3) to dock pNPP and identify candidate active-site residues; (4) to introduce site-specific mutations and deletion mutants and determine their kinetic parameters; (5) to perform molecular dynamics simulations to assess regional flexibility; and (6) to evaluate the effect of SapM mutations on Mtb survival in macrophages and SapM expression during infection.
Herein, we successfully isolated monomeric SapM protein, which exhibited a hydrodynamic diameter of 5.1 ± 0.3 nm. Molecular docking was performed, and site-specific mutations were introduced. The R61A, T236A, and T250A mutants showed a 5- to 60-fold reduction in activity. The segment 237–249 displayed greater flexibility compared to other regions of SapM. The SapM gene is critical for Mtb survival within macrophages. In a word, we integrated AlphaFold3-based structural prediction, ModRefiner energy minimization, molecular docking, and molecular dynamics simulations with site-directed mutagenesis, enzymatic kinetics, and ex vivo macrophage infection assays to elucidate the structure–function–regulation relationship of SapM. Our findings provide insights into the mechanisms by which Mtb evades the host immune system and offer a valuable framework for developing targeted vaccines and immunotherapies against Mtb.
2. Materials and Methods
2.1. Protein Constructs, Expression and Purification
Primers for recombinant SapM (Mycobacterium tuberculosis, ATCC 25618/H37Rv, UniProt code O53361) were designed for PCR and synthesized by Shanghai Sangon Biotechnology (Shanghai Sangon Biotechnology, Shanghai, China) (Figures S1 and S2; Tables S1 and S2). The recombinant SapM gene was inserted into the pET28a vector, and PCR was performed using Q5 polymerase (Figures S1 and S2). DNA sequencing, conducted by Shanghai Sangon Biotechnology, confirmed the correct cloning sites.
To express SapM, 20 mL of overnight bacterial culture was transferred into 1 L of LB medium supplemented with 45 μg/mL kanamycin and incubated at 37 °C. The culture was shaken at 220 rpm until the optical density (OD) at 600 nm reached 0.6–0.8. Protein production was induced by adding 1.0 mM isopropyl-beta-D-thiogalactoside (IPTG).
SapM was purified using Ni-NTA affinity resin. Bacterial cells were resuspended in 45 mL of buffer and disrupted at 650 MPa for 3 min. The insoluble debris was removed by centrifugation, and the soluble fraction was applied to Ni-NTA resin. After buffer washes, SapM was eluted with 300 mM imidazole, concentrated, and further purified by size-exclusion chromatography (SEC) on a Superdex 75 10/300 GL gel filtration column in a buffer containing 150 mM NaCl and 20 mM Tris-HCl (pH 7.4). Variant SapM proteins were expressed and purified using the same method as the wild-type (WT) SapM, employing the Superdex 75 10/300 GL gel filtration column for final purification. Protein amount was determined using the Bicinchoninic acid (BCA) method with some modifications [16,17].
2.2. Dynamic Light Scattering Experiments
To investigate the oligomeric state of SapM, its diameter was assessed using dynamic light scattering (DLS) with a Dynapro DLS instrument (Malvern Zetasizer, Malvern, UK), according to our previous methods [17]. SapM was concentrated to approximately 1.9 mg/mL in a buffer containing 150 mM NaCl and 20 mM Tris-HCl (pH 7.4), then centrifuged at 18,000 rpm and 4 °C for 5 min. The sample was loaded into a 1-cm path length cuvette, and data acquisition involved recording 30 runs with a 120 s equilibration time. DLS data were analyzed using Zetasizer software (Version 6.20), which generated regularized histograms. The diameter was monitored throughout the analysis. DLS measurements were performed at 25 °C in triplicate, with 10 acquisitions per measurement. The polydispersity index (PDI) and size distribution were recorded. SEC on a Superdex 75 10/300 GL column was used as an independent assessment of monodispersity.
2.3. Structural Model Prediction and Quality Assessment
The full-length SapM sequence (residues 1–299; UniProt O53361) was used as the input for AlphaFold3 [18], followed by energy minimization with ModRefiner [19]. The protein sequence was used as input for these predictions. No residues were excluded from the prediction or refinement. The N-terminal region (residues 1–43) displayed lower pLDDT confidence and higher flexibility than the core structure; this is explicitly acknowledged. The average pLDDT of the full-length model was 90.94 (Figures S3–S5). Ramachandran statistics were calculated using PDBsum for all residues in the full-length model, and no residues were omitted. Residues with lower pLDDT were not used to support mechanistic claims about the catalytic pocket. Molecular graphics were generated using PyMOL v2.3.4 (https://www.pymol.org/2/, accessed on 12 April 2026). Structural homologues were identified using a DALI search against the PDB [20,21].
Structural validation was performed through geometric analysis, with the Ramachandran plot generated by PDBsum [22,23,24,25,26] to evaluate backbone dihedral angles (φ/ψ) and assess stereochemical quality. This analysis identified favorable conformations and flagged energetically unfavorable residue orientations, providing quantitative validation of the predicted model’s reliability. Ramachandran statistics were calculated using PDBsum for all residues included in the refined model. The model corresponds to the full-length SapM sequence, and no residues were excluded from the analysis. The statistics therefore report the stereochemical quality of the complete modeled protein.
2.4. Molecular Docking
Molecular docking of the substrate pNPP (p-nitrophenyl phosphate) to the SapM binding site was performed using AutoDockTools 1.5.7 and AutoDock 4.2.6 [17,27,28,29,30,31], based on the refined SapM model. Molecular docking was performed using the refined full-length SapM model (residues 1–299). The grid box was centered on the catalytic pocket. The low-pLDDT N-terminal region (residues 1–43) was included in the receptor, but no pNPP-interacting residue was located in this segment. The grid box was centered on the catalytic pocket with dimensions 60 × 60 × 60 Å. Protonation states for docking were assigned at pH 7.0 using AutoDockTools. The protein was prepared with standard protonation states for ionizable residues at pH 7.0. The Genetic Algorithm (GA) parameters were set with 1000 runs and a population size of 200, while the maximum number of generations and evaluations were set to 30,000 and 3,000,000, respectively. After docking, the results were analyzed, and the interactions between SapM and pNPP were visualized using PyMOL v2.3.4 (https://www.pymol.org/2/, accessed on 12 April 2026). The binding energy was calculated. Binding energy (typically expressed in kcal/mol) reflects the affinity of a ligand for its target protein, with more negative values indicating stronger binding interactions, greater complex stability, and a higher potential for functional modulation. This metric serves as a critical computational tool for identifying promising bioactive compounds for further investigation.
2.5. Enzymatic Activity Assay
The enzymatic activity of purified recombinant SapM and its mutants was assessed using a modified version of a previously described method [11,13]. Acid phosphatase activity was measured by an endpoint assay detecting p-nitrophenol released from pNPP. Purified SapM (0.5 μM for WT, T236A, T250A, and Δ237–249; 2 μM for R61A and Δ58–63) was incubated with pNPP (0–5 mM for WT and most mutants; 0–20 mM for T236A and T250A) in 50 mM Tris-HCl buffer (pH 7.0) at 37 °C for 20 min in the dark in a final volume of 500 μL. The reaction was linear with time and enzyme concentration, and substrate consumption was kept below 10%. Absorbance was measured at 405 nm after adding 500 μL of 1 M NaOH. The standard assay buffer (50 mM Tris-HCl, pH 7.0) contained no added Mg2+ or other metal. Therefore, the standard assays were not metal-optimized. All experiments were performed in three independent biological replicates, each with three technical replicates. The Michaelis constant (Km) and the catalytic constant (kcat) were determined from Hanes-Woolf plots. Enzyme activity (U) was calculated using the formula:
where E is the mean absorbance of the sample minus the mean absorbance of the blank at 405 nm, Vtotal is the total sample volume (1000 µL), t is the incubation time (20 min), ϵ is the extinction coefficient for pNPP (17.8 nM−1·cm−1), d is the path length of light (1 cm). No excess metal was added during purification or assay. Metal occupancy was not controlled or measured. Therefore, mixed or under-unity metal occupancy cannot be excluded, and the reported kinetic parameters are apparent values.
U (nmol/min/µg) = [E·Vtotal]/[t·ϵ·d·µg of culture filtrate]
2.6. MD (Molecular Dynamic) Simulations
All molecular dynamics simulations were conducted using GROMACS 2022.3 [32] with the AMBER99SB-ILDN force field [33] and the TIP3P water model, based on the refined SapM structure. MD simulations were performed using the refined full-length SapM model (residues 1–299). The N-terminal low-pLDDT region was retained in the simulation. RMSF analysis was performed for all residues; the reported flexibility of segment 237–249 is independent of the N-terminal region. Electrostatic interactions were computed using the PME method [34,35] with a 1.2 nm real-space cutoff for both electrostatic and van der Waals interactions. The Verlet cutoff scheme was applied, with neighbor lists updated every 10 steps (1.2 nm cutoff). Systems were maintained at 310 K and 1 bar using Nose-Hoover [36] and Parrinello-Rahman [37] thermostats (coupling constants: 0.4 ps and 0.1 ps, respectively), with periodic boundary conditions throughout. Prior to production runs, the systems underwent energy minimization (steepest descent), followed by NVT (100 ps) and NPT (100 ps) equilibration at target conditions. Production simulations were performed for 200 ns with a 2 fs timestep. For MD simulations, the apo-SapM model was protonated using GROMACS pdb2gmx with the AMBER99SB-ILDN force field. Default protonation states were used for histidine residues, and the N- and C-termini were treated as charged. The first 20 ns of each trajectory were discarded as equilibration, and the final 180 ns were used for analysis. Trajectories were corrected for periodic boundary conditions, centered, and least-squares fitted to the protein backbone before RMSD and RMSF calculations using gmxrms and gmxrmsf. Trajectory analysis (RMSD/RMSF) was conducted using GROMACS tools and visualized with xmgrace.
2.7. Macrophage Infections
Bone marrow-derived macrophages (BMDMs) from BALB/c mice were purchased from Wuhan Pricella Biotechnology Co., Ltd. (Wuhan, Hubei, China; Cat. No. CPM141) and cultured according to the supplier’s instructions. Prior to infection, macrophage monolayers were pre-treated with 200 U/mL gamma interferon (IFN-γ) (Gibco) for 4 h. Mtb strains were grown to mid-exponential phase, washed, and added to macrophages at an MOI of 5. Cells were infected for 4 h at 37 °C, after which they were washed six times with warm tissue culture medium to remove extracellular bacteria. The infected macrophages were then incubated in fresh culture medium at 37 °C for the indicated time periods (0, 2, 4, 6, and 8 days). The infection dose was determined by plating the inoculum. At each time point, the macrophage monolayer was lysed with 1 mL of sterile distilled water containing 0.1% Triton X-100 per well, and serial dilutions were plated on Middlebrook 7H10 agar plates. CFUs were enumerated after 3–4 weeks of incubation at 37 °C. All infections were performed in three independent biological replicates, each with three technical replicates. The following Mtb strains were used in these experiments: wild-type (WT) Mtb, ∆SapM (SapM knockout mutant), SapM∆58–63 (mutant with deletion of residues 58–63), SapM∆237–249 (mutant with deletion of residues 237–249), and ∆SapM::SapM (complemented SapM disruption mutant), all generated as previously described [11,12,13,14].
2.8. Gene Expression Analysis Using RT-qPCR
Bacterial strains and derivatives were grown to exponential phase for gene expression analysis. For gene expression analysis during infection, macrophages were infected as described above. At the indicated time points (0, 2, 4, 6, and 8 days), macrophages were lysed with sterile distilled water containing 0.1% Triton X-100, and bacteria were recovered by centrifugation. Total RNA was extracted using the TransZol RNA kit (Invitrogen, Carlsbad, CA, USA) following the manufacturer’s protocol. cDNA synthesis was carried out using the PrimeScript 1st Strand cDNA Synthesis Kit (Takara, Kyoto, Japan). RT-qPCR (real-time quantitative polymerase chain reaction) was performed with PowerUp SYBR Green Master Mix (Applied Biosystems, Foster City, CA, USA) and gene-specific primers (Table S3) on a QuantStudio 5 system. The sigA housekeeping gene [38,39] was used as an internal control for normalization, with a positive control included for validation. Relative expression levels of SapM were calculated using the 2−ΔΔCT method [40,41] and expressed as log2 fold changes. A ratio above zero indicated up-regulation, while a ratio below zero indicated down-regulation.
2.9. Accession Codes
The UniProt accession code for SapM from Mycobacterium tuberculosis (strain ATCC 25618/H37Rv) is O53361.
2.10. Statistical Analysis
All experiments were performed in triplicate, and data are presented as mean ± standard deviation (SD). Normality and homogeneity of variances were assessed using the Shapiro–Wilk and Bartlett tests, respectively. As these assumptions were satisfied, group means were compared using one-way analysis of variance (ANOVA). When the ANOVA was significant, Tukey’s honestly significant difference (HSD) post hoc test was used for pairwise comparisons. A p-value < 0.05 was considered statistically significant, and p < 0.01 highly significant. All statistical analyses were performed using SPSS 19.0, Origin 8.5, and Microsoft Excel 2013.
3. Results
3.1. Expression and Purification of Recombinant SapM
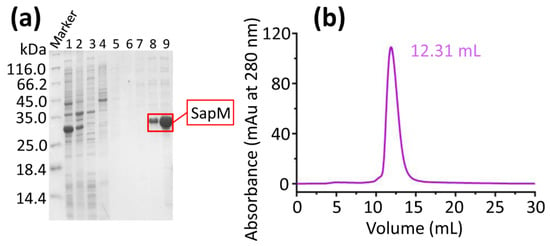
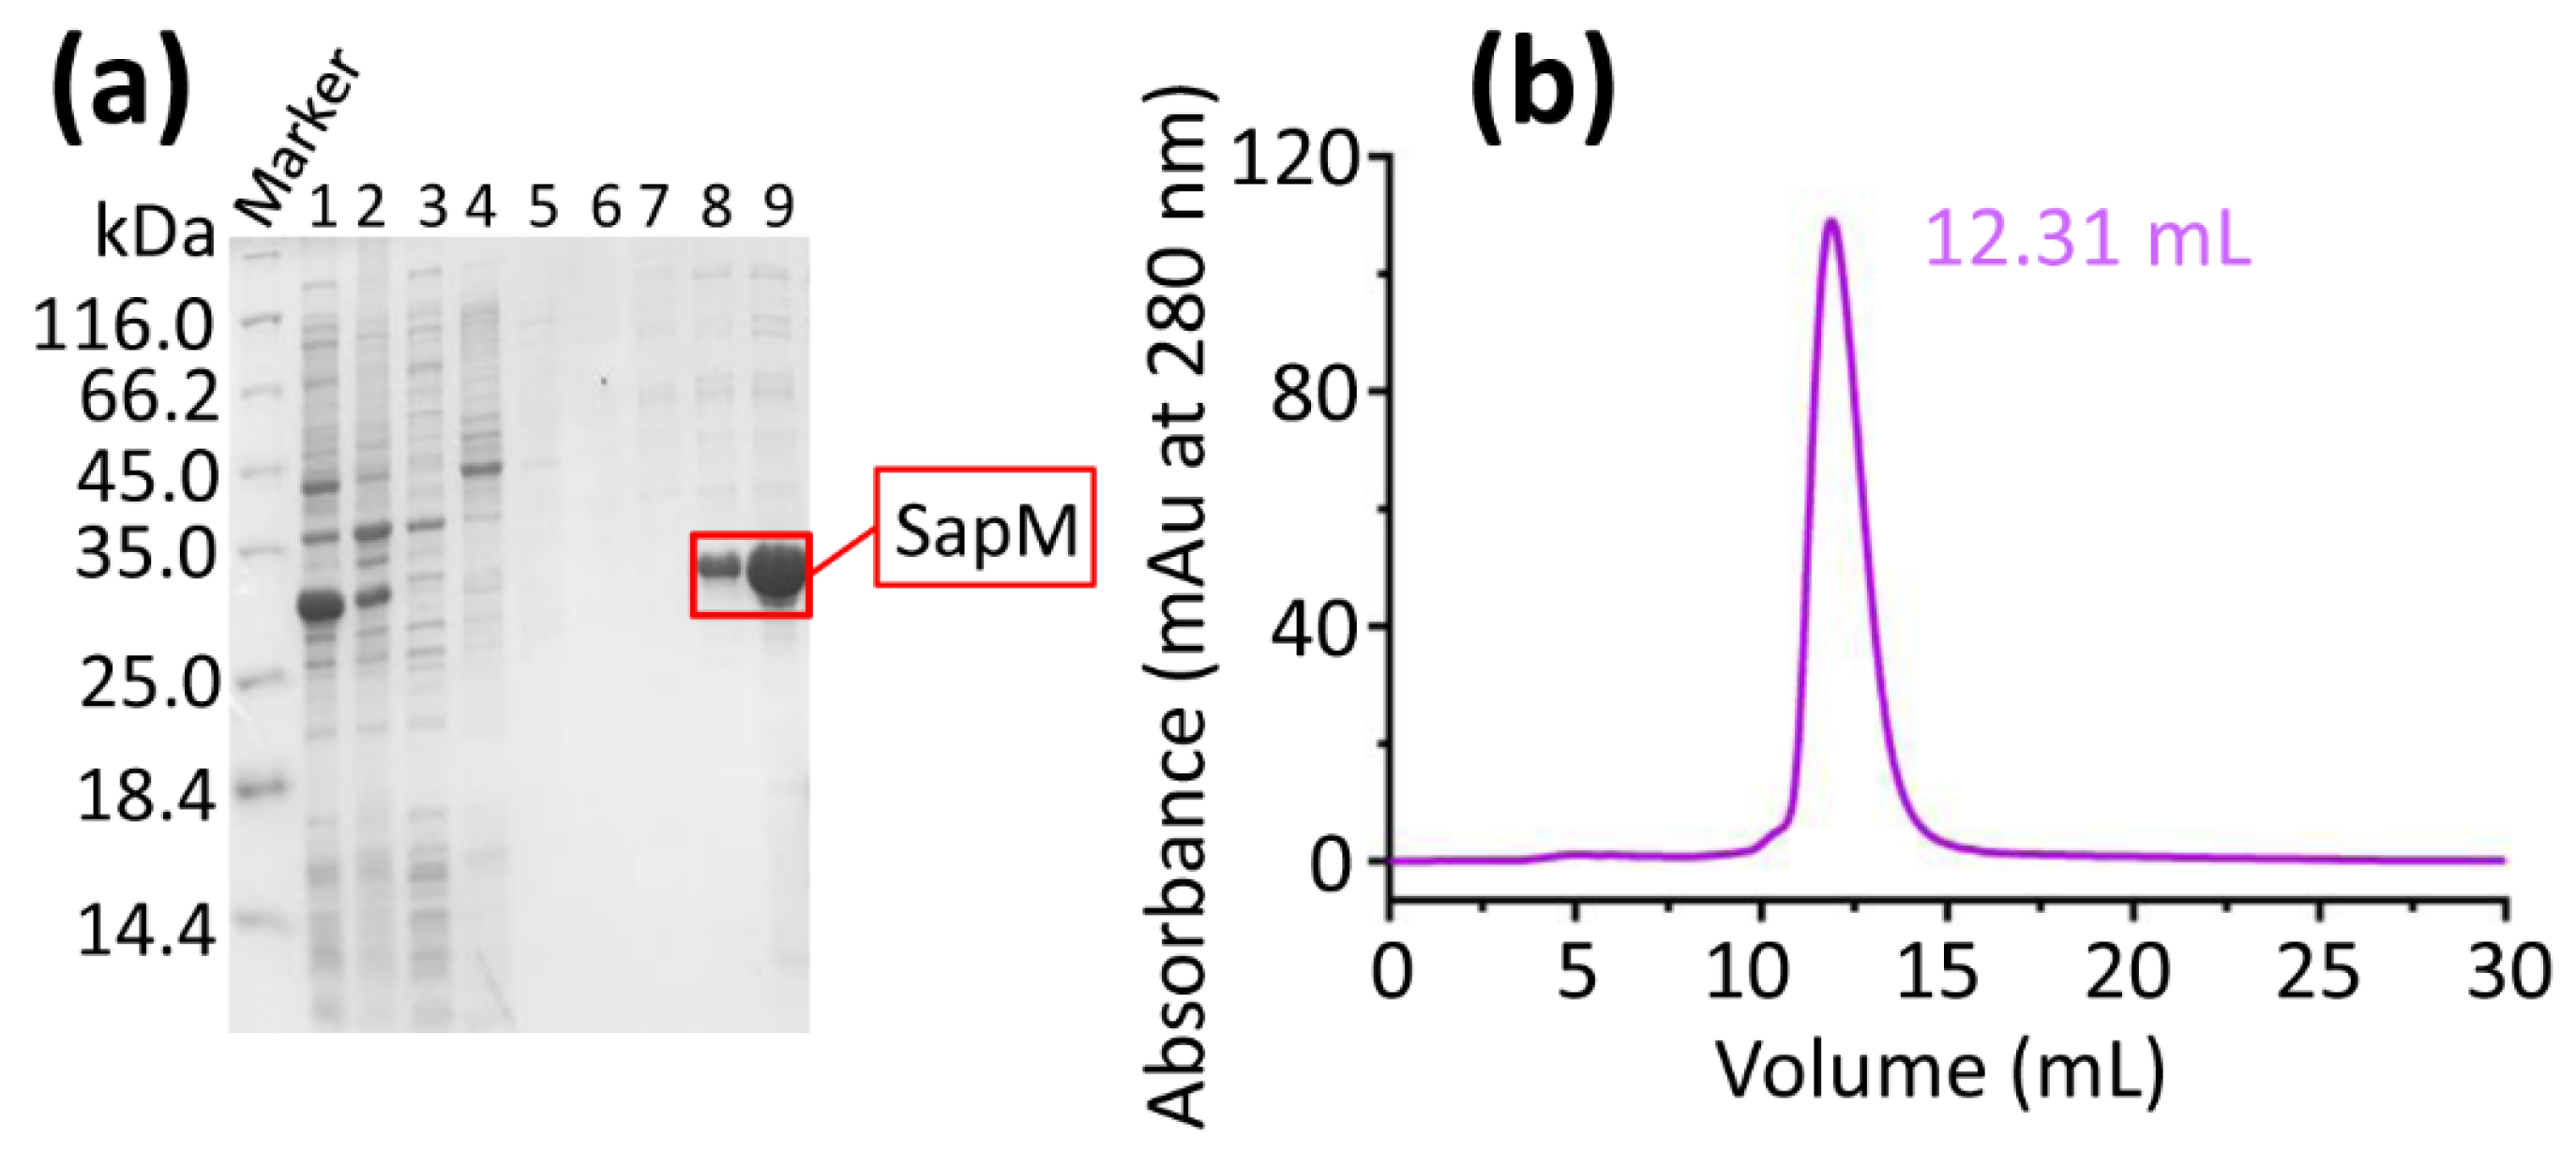
A prokaryotic expression plasmid (pET28a-SapM) was constructed by cloning with specific primers and restriction enzymes (HindIII and NdeI). The recombinant plasmid was then introduced into E. coli BL21 (DE3) cells. After bacterial lysis and centrifugation, the supernatant was purified using a Ni-NTA agarose affinity column. To remove contaminating proteins, the buffer was supplemented with varying concentrations of imidazole (0, 5, 10, 15, 20, and 60 mM) (Figure 1a). SapM was subsequently eluted from the column using a buffer containing 300 mM imidazole during the Ni-NTA affinity chromatography step (Figure 1a).
Figure 1.
Expression and purification of SapM. (a) The eluted SapM fractions are separated into lanes 1–9, corresponding to elution buffers containing 0, 2.5, 5, 10, 15, 20, 30, 60, and 300 mM imidazole, respectively. (b) SapM was purified using Superdex 75 10/300 column chromatography. SapM was eluted at 12.31 mL, as evidenced by a single peak. The fractions corresponding to ÄKTA purifier system were analyzed in lane 9 of Figure 1a.
Further purification of SapM was performed using size exclusion chromatography (SEC) on an ÄKTA Purifier system with a Superdex 75 10/300 column (Figure 1b). A single peak at a retention volume of 12.31 mL (Figure 1b) confirmed the monomeric form of SapM. The values shown in Table 1 are from one representative purification. Three independent purifications were performed. The final yield and purity were comparable among preparations (31–35 mg and 93–97%, respectively). The preparation shown in Table 1 gave a final yield of 34.2 mg and a purity of 96.6%.
Table 1.
Quantitative analysis of SapM at each key purification step.
3.2. Characterization of SapM Using Dynamic Light Scattering
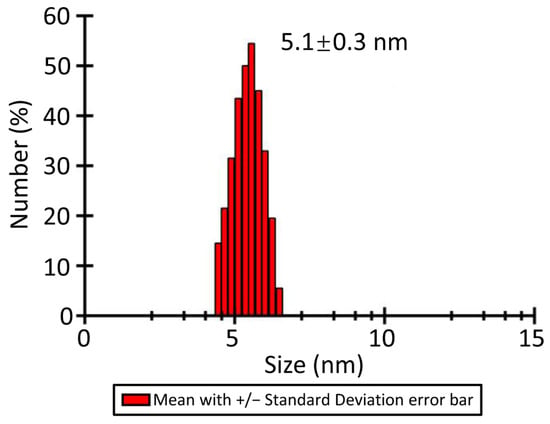
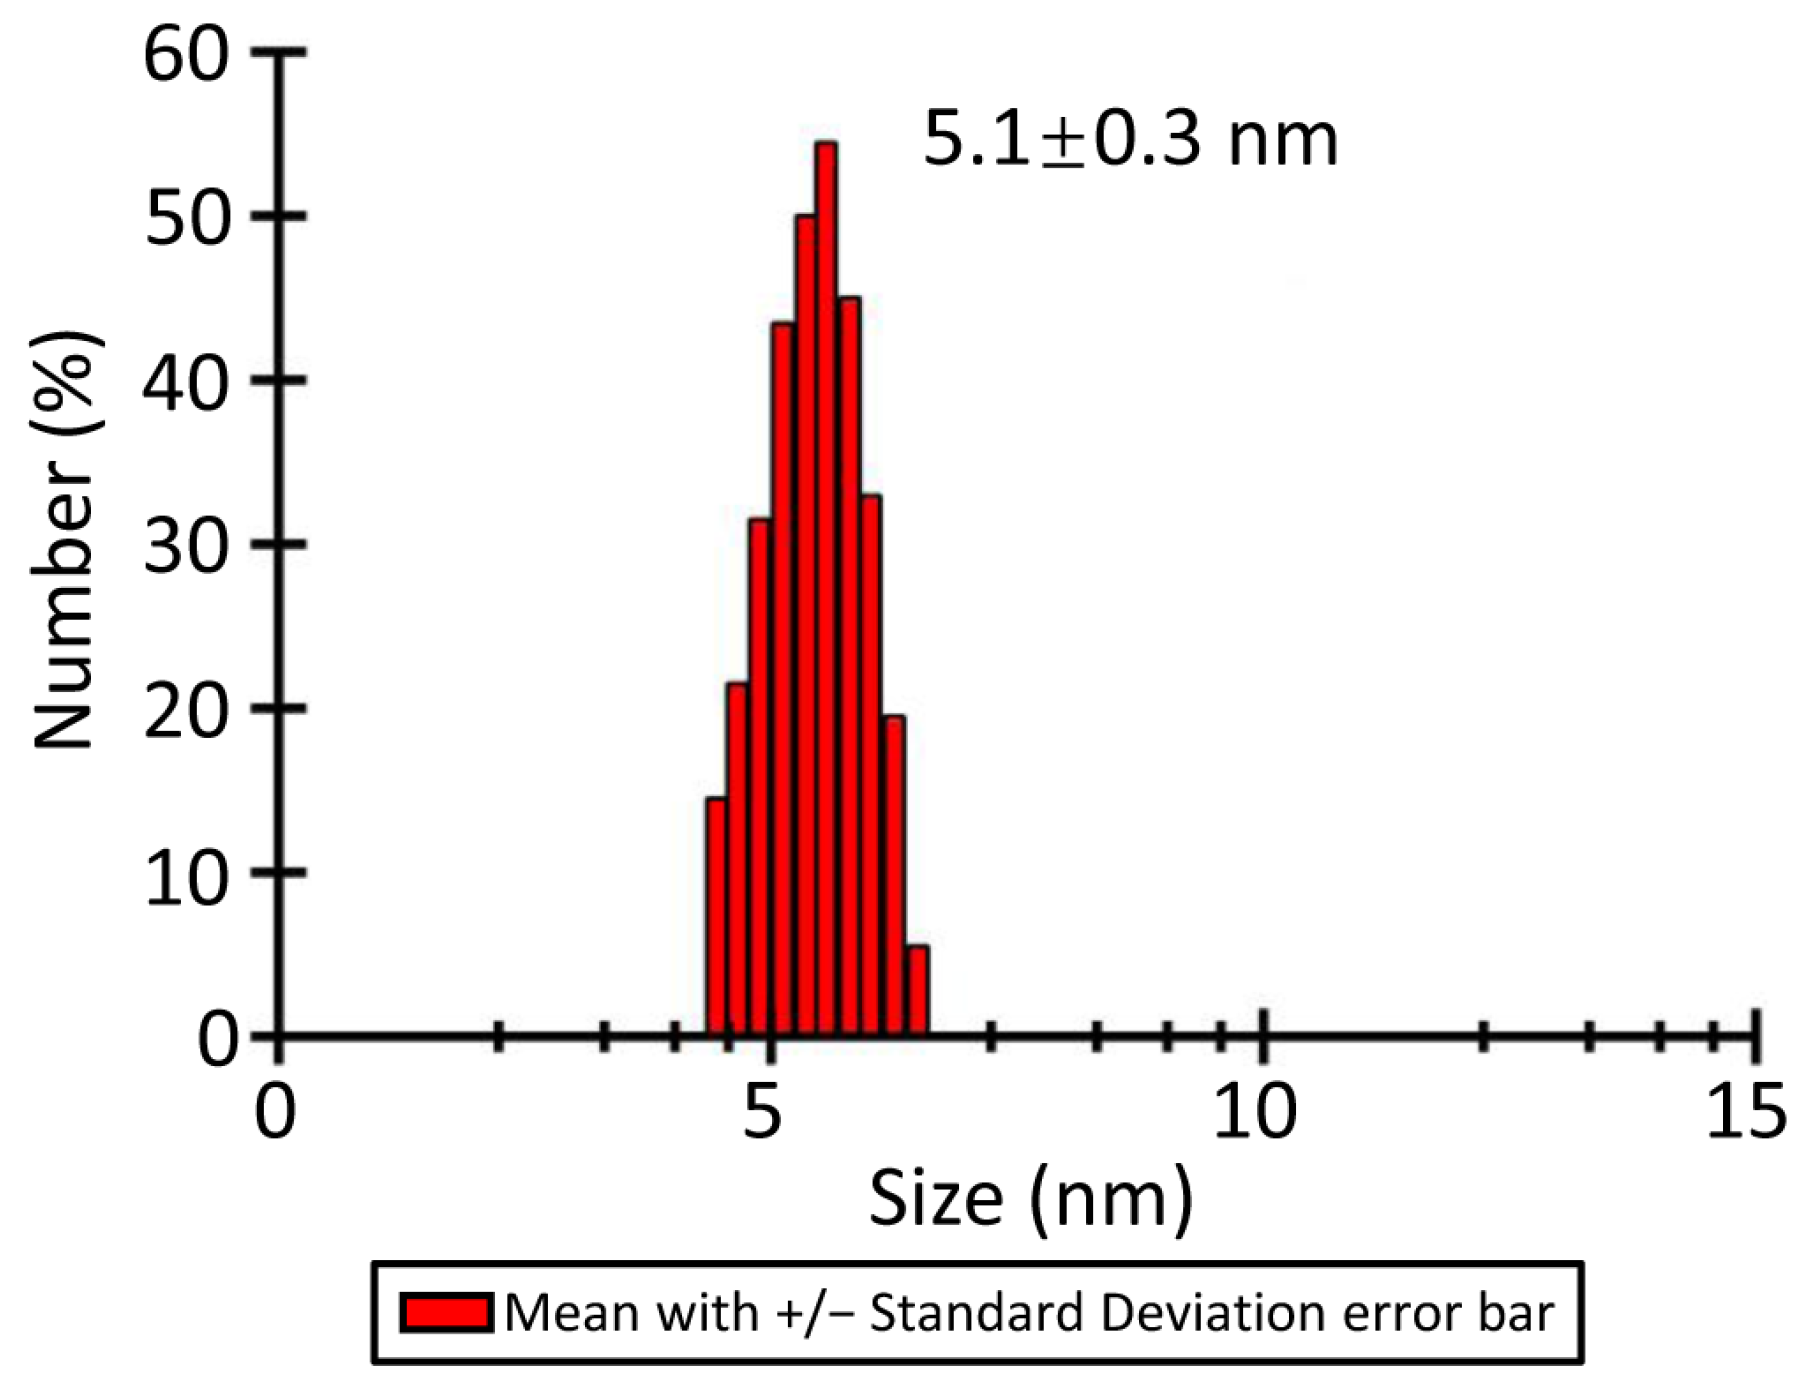
The oligomeric state of SapM was assessed by dynamic light scattering (DLS) following centrifugation to determine its hydrodynamic diameter. The DLS intensity distribution showed a single narrow peak, with a hydrodynamic diameter of 5.1 ± 0.3 nm (Figure 2) and a PDI of 0.18 ± 0.04. Three independent DLS measurements were performed and gave consistent results. SEC showed a single symmetric peak at 12.31 mL, further supporting a monodisperse, monomeric sample.
Figure 2.
The DLS (Dynamic light scattering) spectrum of SapM. The hydrodynamic diameter of SapM was determined to be 5.1 ± 0.3 nm.
To validate the monomer assignment, the theoretical minimum diameter (Dmin) was estimated using the empirical relationship for anhydrous globular proteins: Dmin (nm) = 0.132 × M1/3, where M is in Da [42]. For a monomer with M = 31,807 Da, Dmin ≈ 4.2 nm. The measured hydrodynamic diameter was 5.1 nm, only ~20% larger than Dmin, consistent with a hydrated monomer, as hydration typically increases the hydrodynamic diameter by ~20%. A dimer would have Dmin ≈ 5.3 nm, exceeding the measured value. After centrifugation, the DLS intensity distribution showed a single narrow peak (Figure 2), indicating a monodisperse sample. Collectively, these results strongly support that SapM is monomeric.
3.3. Structural Model Prediction and Quality Assessment of SapM
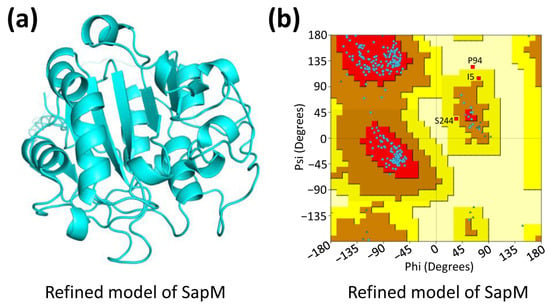
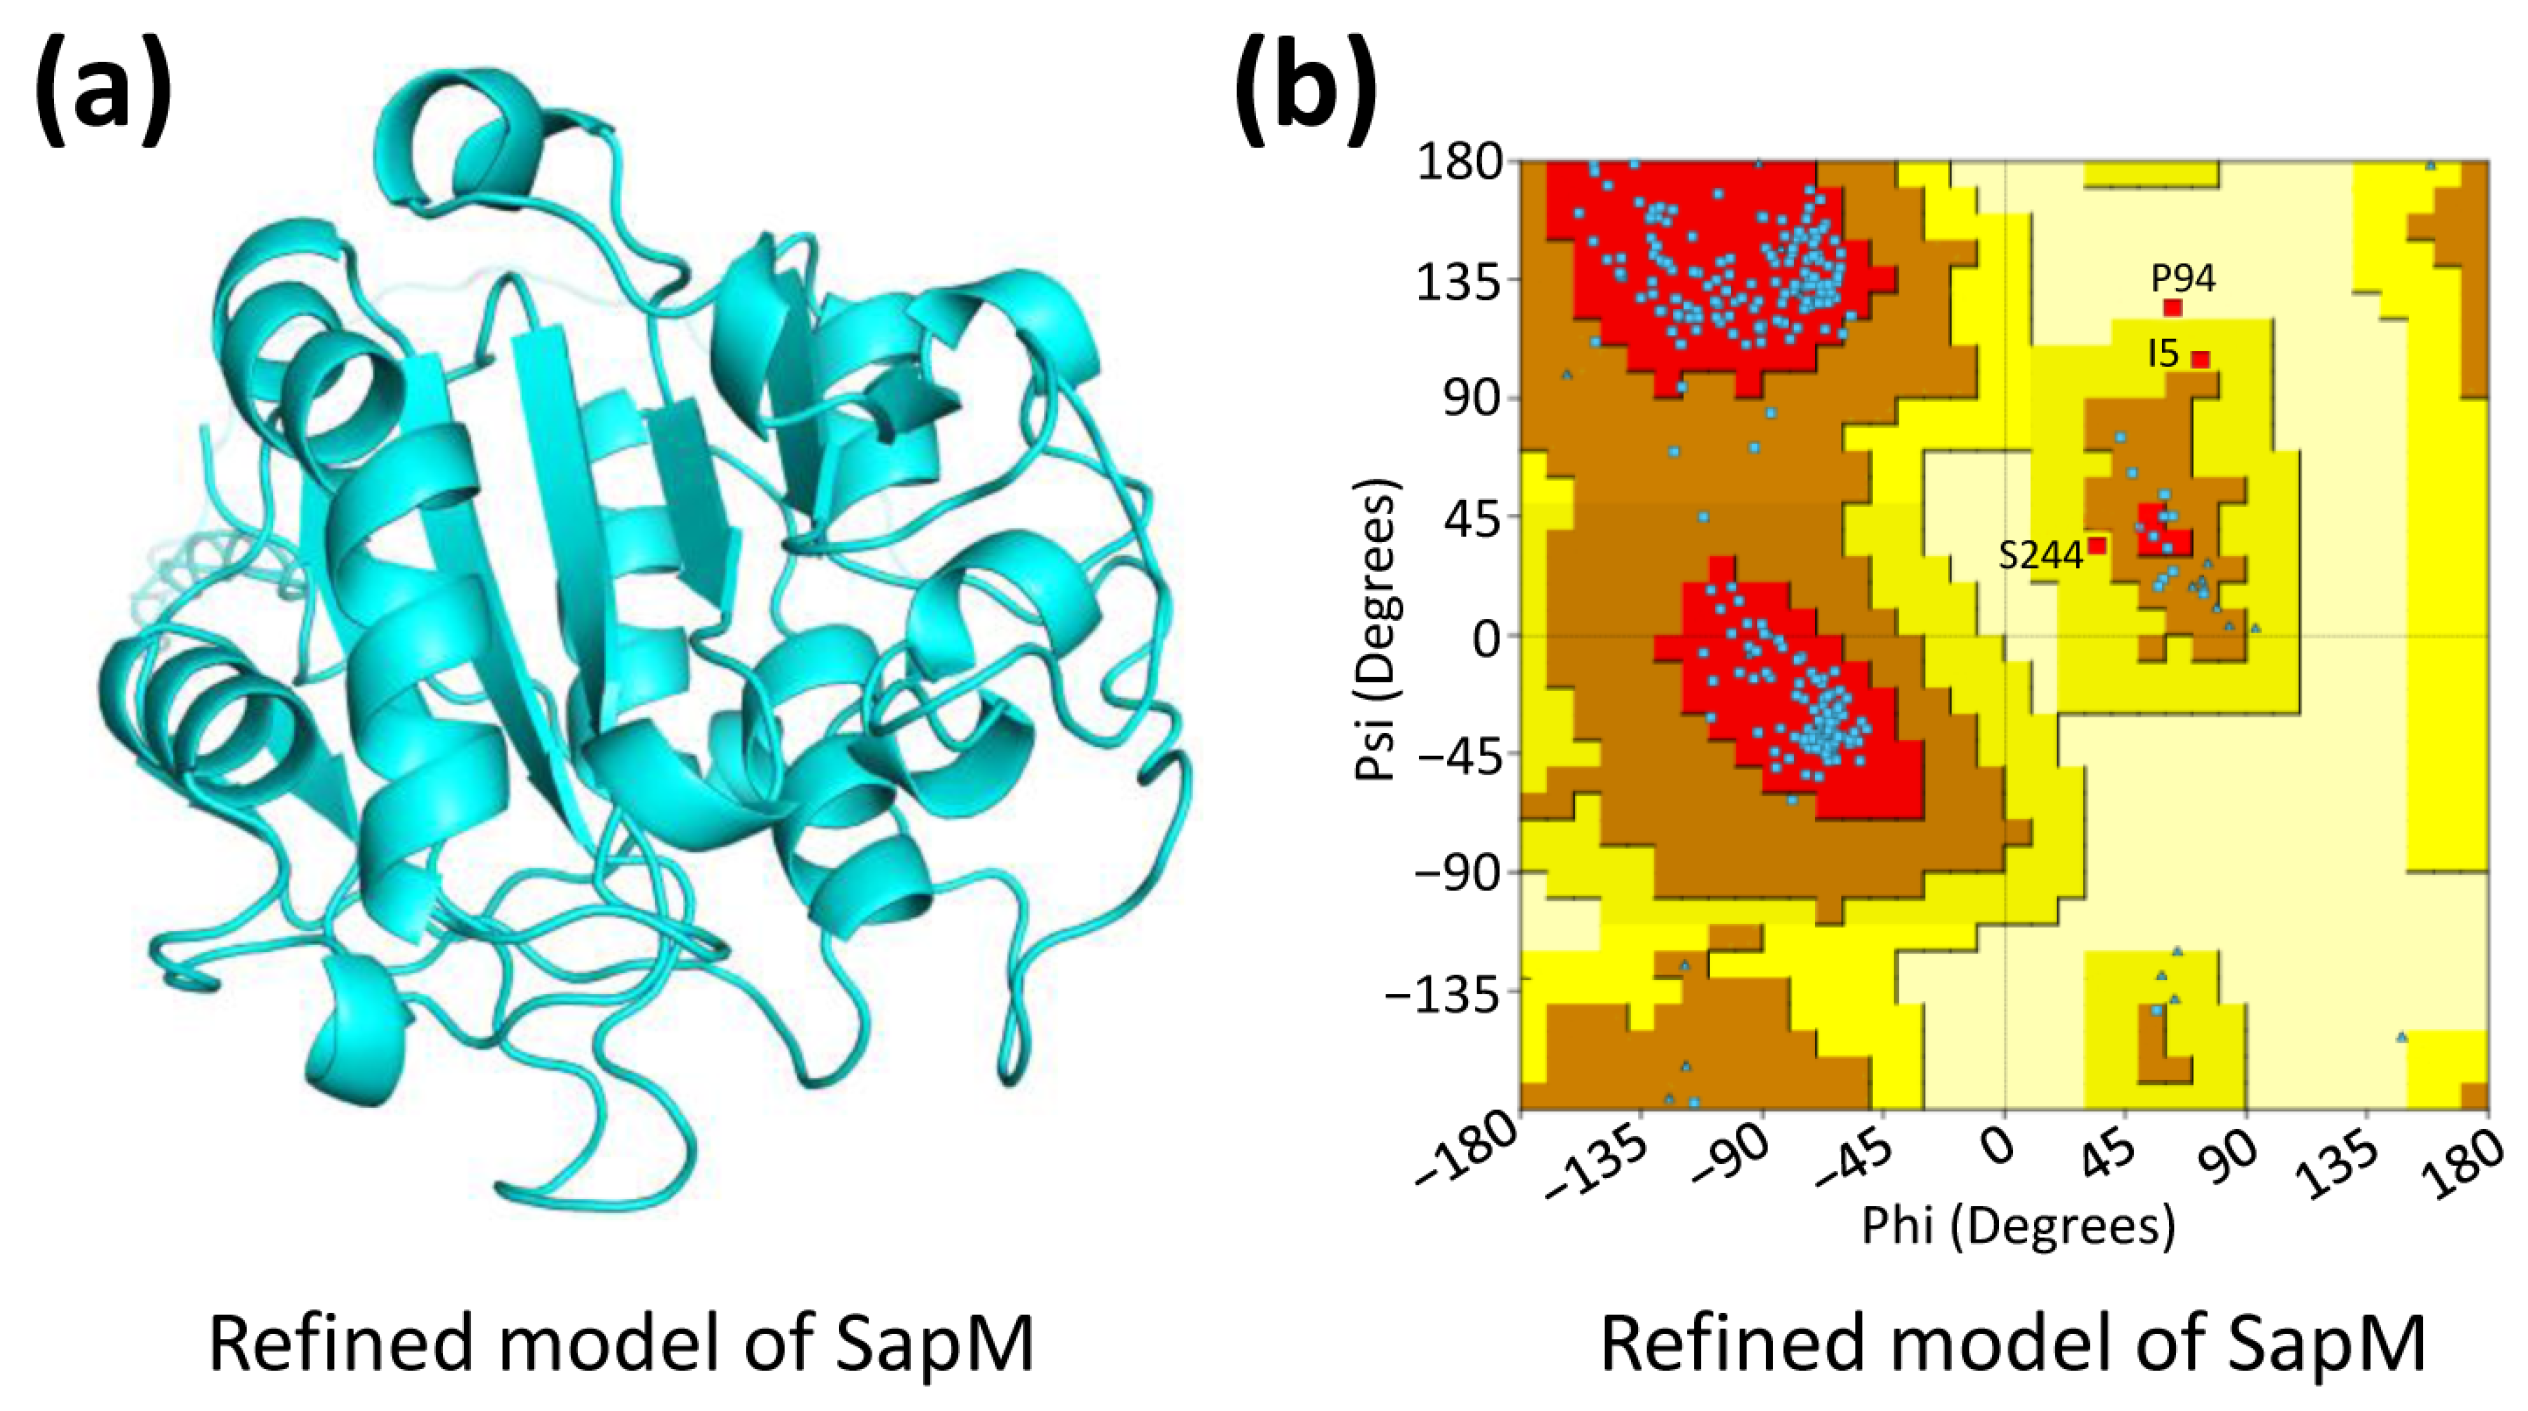
The structural model of SapM was initially predicted using AlphaFold3 [18] (Figures S3–S5). This model was then refined through energy minimization with ModRefiner [19] to improve its stereochemical quality, resulting in the optimized SapM structure (Figure 3a).
Figure 3.
Prediction and evaluation of the refined model of SapM. The initial SapM model was predicted using AlphaFold3, and then refined to obtain the refined model (a). The refined model validation via Ramachandran plot analysis (b) indicates favorable stereochemistry, with the most allowed regions highlighted in red and less favorable regions in progressively lighter shades.
To assess the quality of the predicted models, we analyzed the dihedral angles of the protein backbone using a Ramachandran Plot, which ensures structural integrity. For the initial model, 81.3% of residues were in the most favored region, 13.1% in the additionally allowed region, 3.2% in the generously allowed region, and 2.4% in the disallowed region (Table 2; Figure S3). In contrast, the refined model showed 93.2% of residues in the most favored region (an 11.9% improvement), 6.0% in the additionally allowed region, 0.8% in the generously allowed region, and no residues in the disallowed region (Table 2; Figure 3b). To further assess the local confidence of the predicted model, we examined the pLDDT (predicted Local Distance Difference Test) scores. The average pLDDT for the SapM model was 90.94, indicating high confidence for the majority of the structure.
Table 2.
Ramachandran plot statistics of structural models of SapM.
The refined model, with over 90% of residues in the most favored regions, demonstrated superior quality compared to the initial model and was used for subsequent experiments.
3.4. Predicted Binding Site Residues of SapM-pNPP Complex
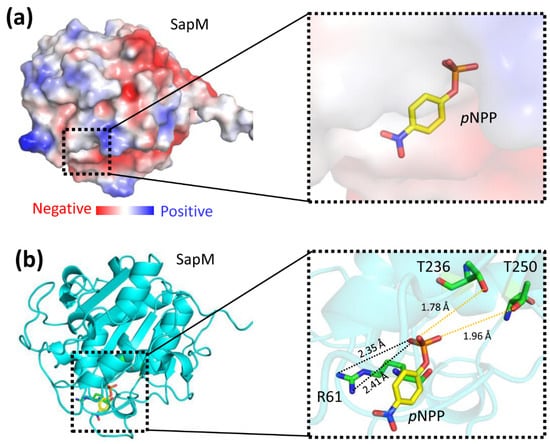
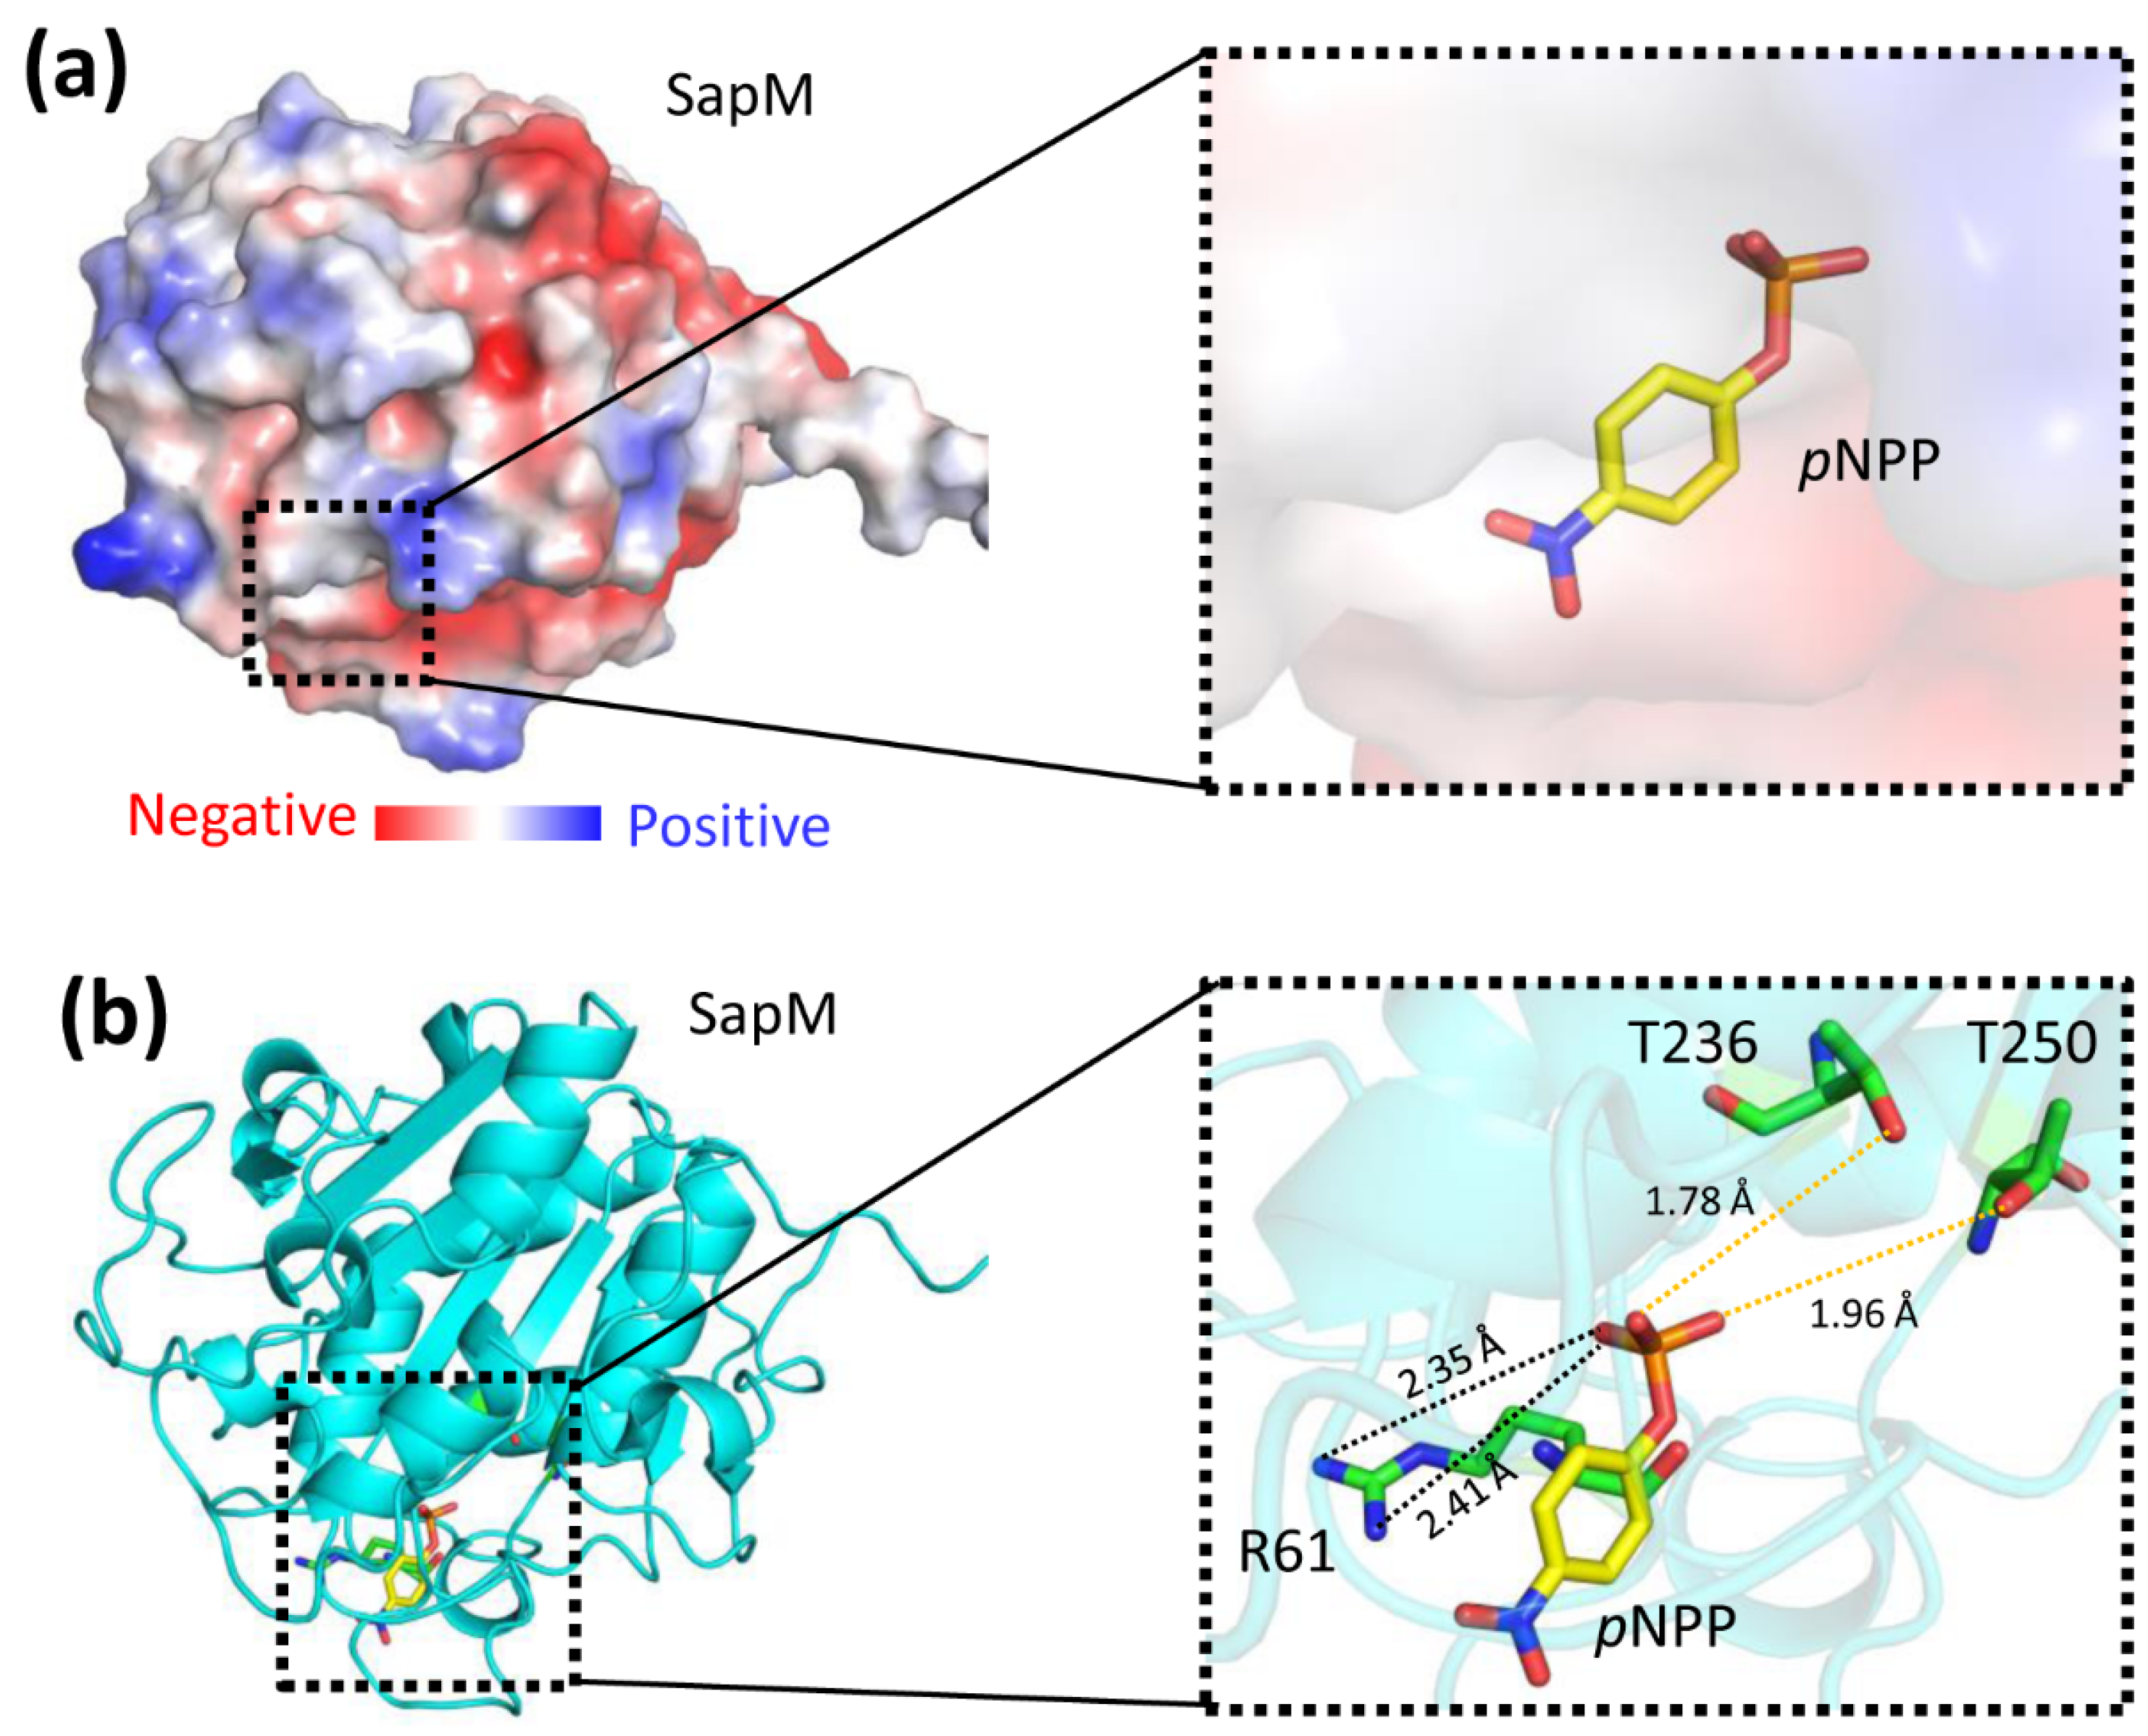
Molecular docking of SapM with its substrate pNPP (p-nitrophenyl phosphate) was performed using AutoDock software [28,29,30], based on the refined SapM model. The binding energy is reported only as an AutoDock score. It represents a single static pose and should not be interpreted as a thermodynamic measurement or as proof of catalytic mechanism. No ligand-bound MD, pose clustering, or interaction-occupancy analysis was performed. In the predicted SapM-pNPP complex, the substrate was effectively accommodated within the binding pocket of SapM, which displayed some positive charges (Figure 4a). Key residues (R61, T236, and T250) within the binding pocket interact with the phosphate group of pNPP through hydrogen bonds and electrostatic interactions (Figure 4b). It should be noted that pNPP is a small chromogenic surrogate for the physiological substrate PI3P. The implications and limitations of this substitution are discussed below.
Figure 4.
The structural model of SapM and pNPP binary complex. The substrate p-nitrophenyl phosphate (pNPP) is depicted in a stick model. (a) A surface representation of SapM structure is colored according to electrostatic potential: red for negative, blue for positive, and white for neutral regions. (b) A ribbon representation is provided, with an inset detailing the binding pocket. Key residues R61, T236, and T250, which constitute the binding site, are shown forming electrostatic interaction, denoted by dashed lines (on the right). Hydrogen bonds and electrostatic interactions are represented in yellow and black, respectively.
3.5. Mutations R61A, T236A or T250A Dramatically Decreased the Activity
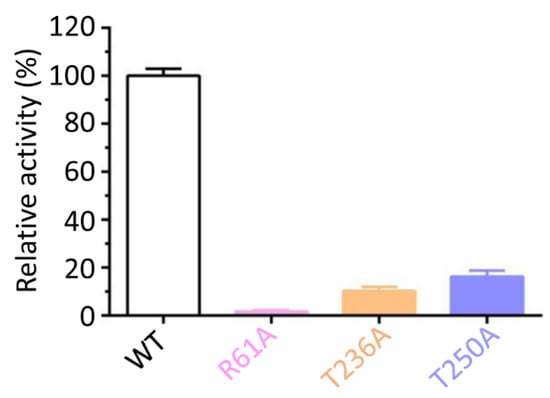
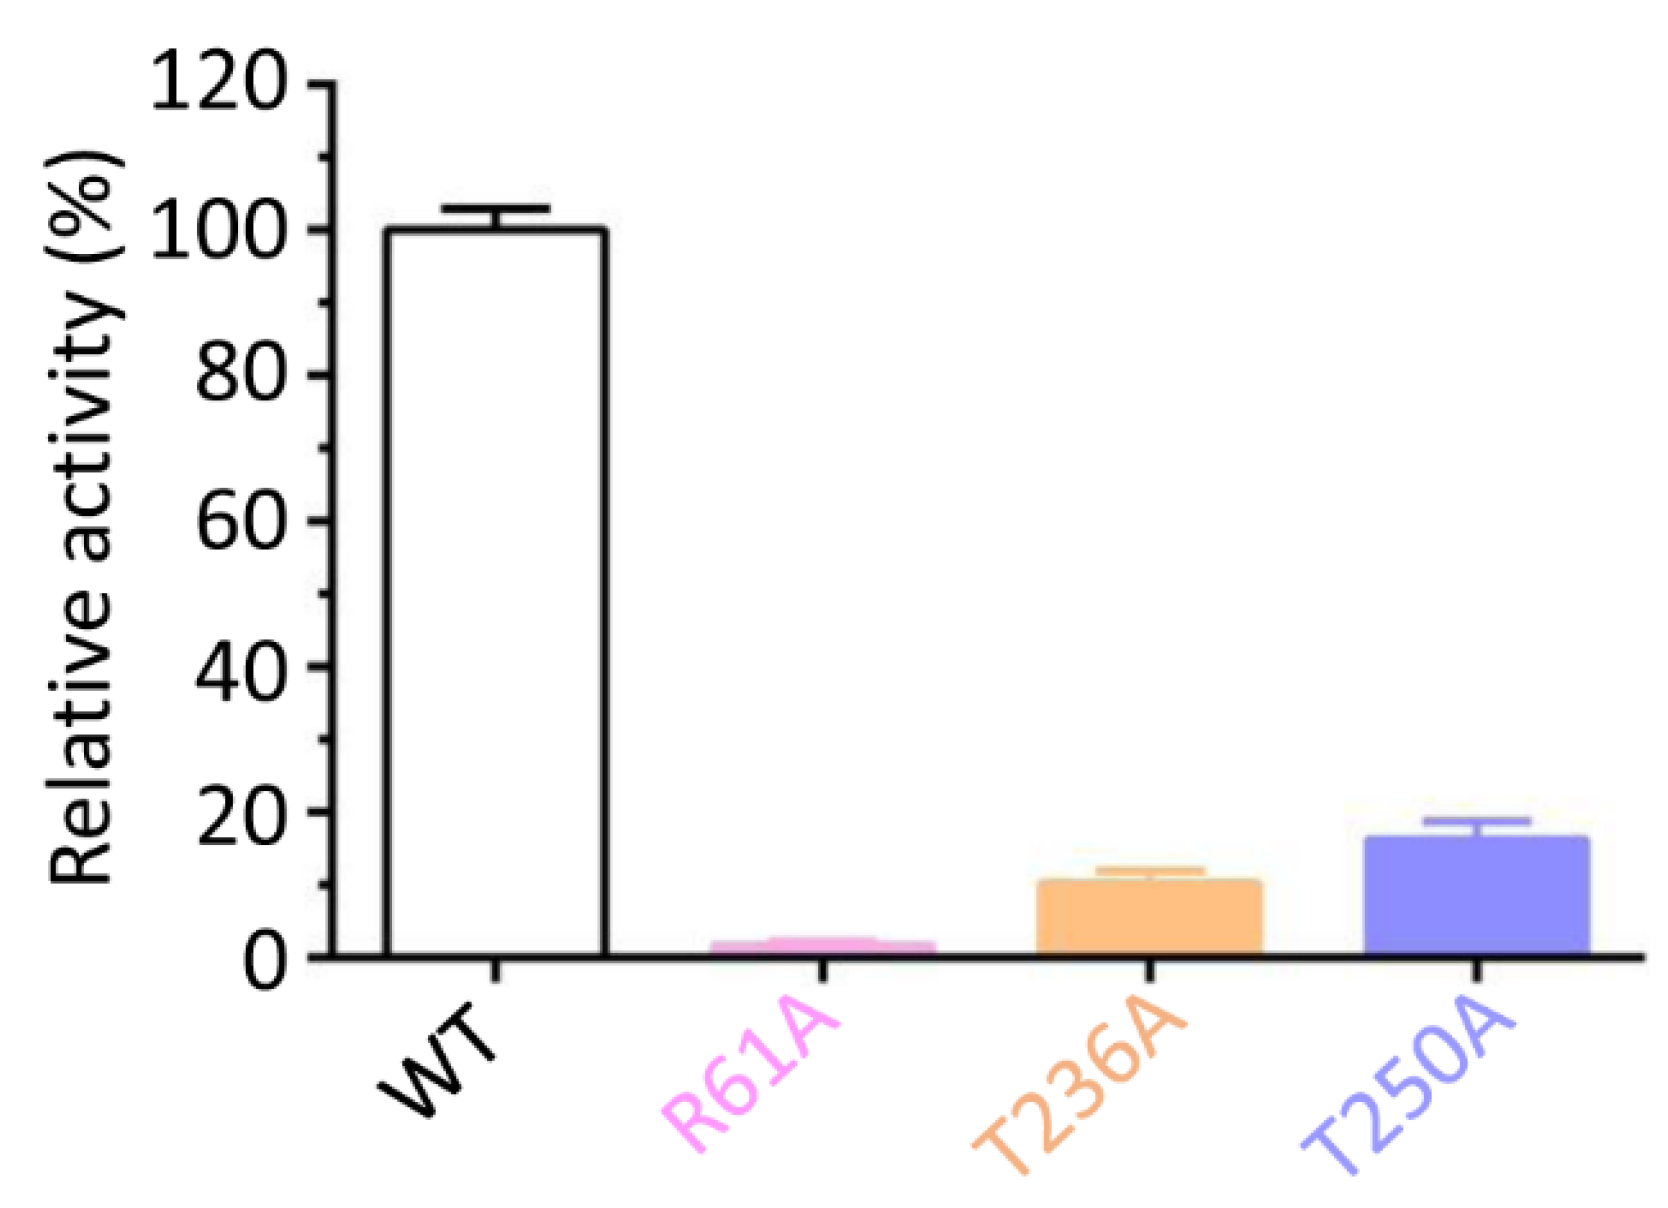
Based on the molecular docking results (Figure 4), site-specific mutations were introduced to further investigate the role of key residues. The original assays were performed without added metal. Values are apparent kinetic parameters obtained under metal-unsupplemented assay conditions. They are not normalized to metal occupancy and should not be interpreted as the kinetics of a fully metal-saturated enzyme. All constructs were purified and assayed in parallel, and relative comparisons are limited to the same preparation series. The R61A, T236A, and T250A mutations led to a 5- to 60-fold reduction in activity compared to the wild-type (WT) protein (Figure 5). For WT SapM, the Michaelis constant (Km) was 430.26 μM, and the catalytic constant (kcat) was 18.54 s−1 (Table 3). In contrast, the T236A and T250A mutants showed significantly altered kinetic parameters, with Km values of 2356.87 μM and 1768.94 μM, respectively, compared to 430.26 μM for WT (Table 3). The kcat values were also reduced for both mutants: 2.37 s−1 for T236A and 3.49 s−1 for T250A, compared to 18.54 s−1 for WT (Table 3). These findings indicate that R61, T236, and T250 are critical for SapM catalytic activity and highlight the importance of the positively charged arginine residue in enzyme function.
Figure 5.
Enzymatic activity of WT (wild-type) SapM and its mutants. The R61A, T236A, and T250A mutants exhibited a 5- to 60-fold reduction in activity compared to the wild-type (WT) SapM. Data are presented as mean ± SD from three independent biological replicates, each with three technical replicates. Statistical significance was determined by one-way ANOVA followed by Tukey’s HSD post hoc test. p < 0.05, p < 0.01, p < 0.001 versus WT.
Table 3.
Kinetic parameters of SapM constructs.
The catalytic efficiency kcat/Km reflects the apparent second-order rate constant at subsaturating substrate concentrations and provides a useful measure for comparing substrate turnover efficiency among SapM constructs. Compared with WT, T236A and T250A showed markedly reduced catalytic efficiency, by approximately 43-fold and 22-fold, respectively (Table 3). These reductions reflect both increased Km and decreased kcat, indicating impaired substrate binding and turnover.
These results indicate that R61, T236, and T250 are critical for SapM catalytic activity. R61 is a positively charged arginine that likely provides electrostatic stabilization of the phosphate group, whereas T236 and T250 are uncharged threonine residues that may contribute hydrogen bonds and proper substrate positioning. The severe loss of activity in R61A highlights the importance of a positively charged arginine in phosphate binding, while the T236A and T250A effects underscore the role of threonine-mediated hydrogen-bonding networks. Together, these results reveal a composite active site in which both charged and polar uncharged residues are required for efficient catalysis.
For R61A and Δ58–63, no detectable p-nitrophenol release was observed under standard assay conditions, even when the enzyme concentration was increased to 2 μM. The detection limit was approximately 0.01 nmol min−1 μg−1. Therefore, kinetic parameters for these mutants could not be reliably determined.
Because metal identity and occupancy were not determined, we cannot exclude mixed metal occupancy or under-unity occupancy. The possibility that different preparations differ in metal content is a limitation of the absolute kinetic values. This does not affect the main conclusion that R61, T236 and T250 are required for pNPP hydrolysis, because WT and mutants were compared within the same preparation and assay series.
3.6. Deletion of Segment 237–249 (∆237–249) Significantly Increased the Activity
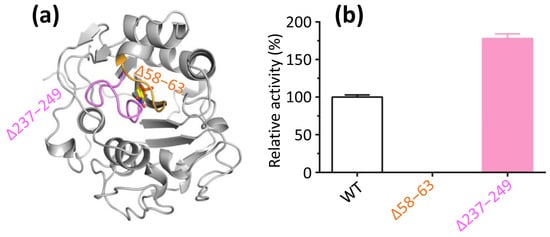
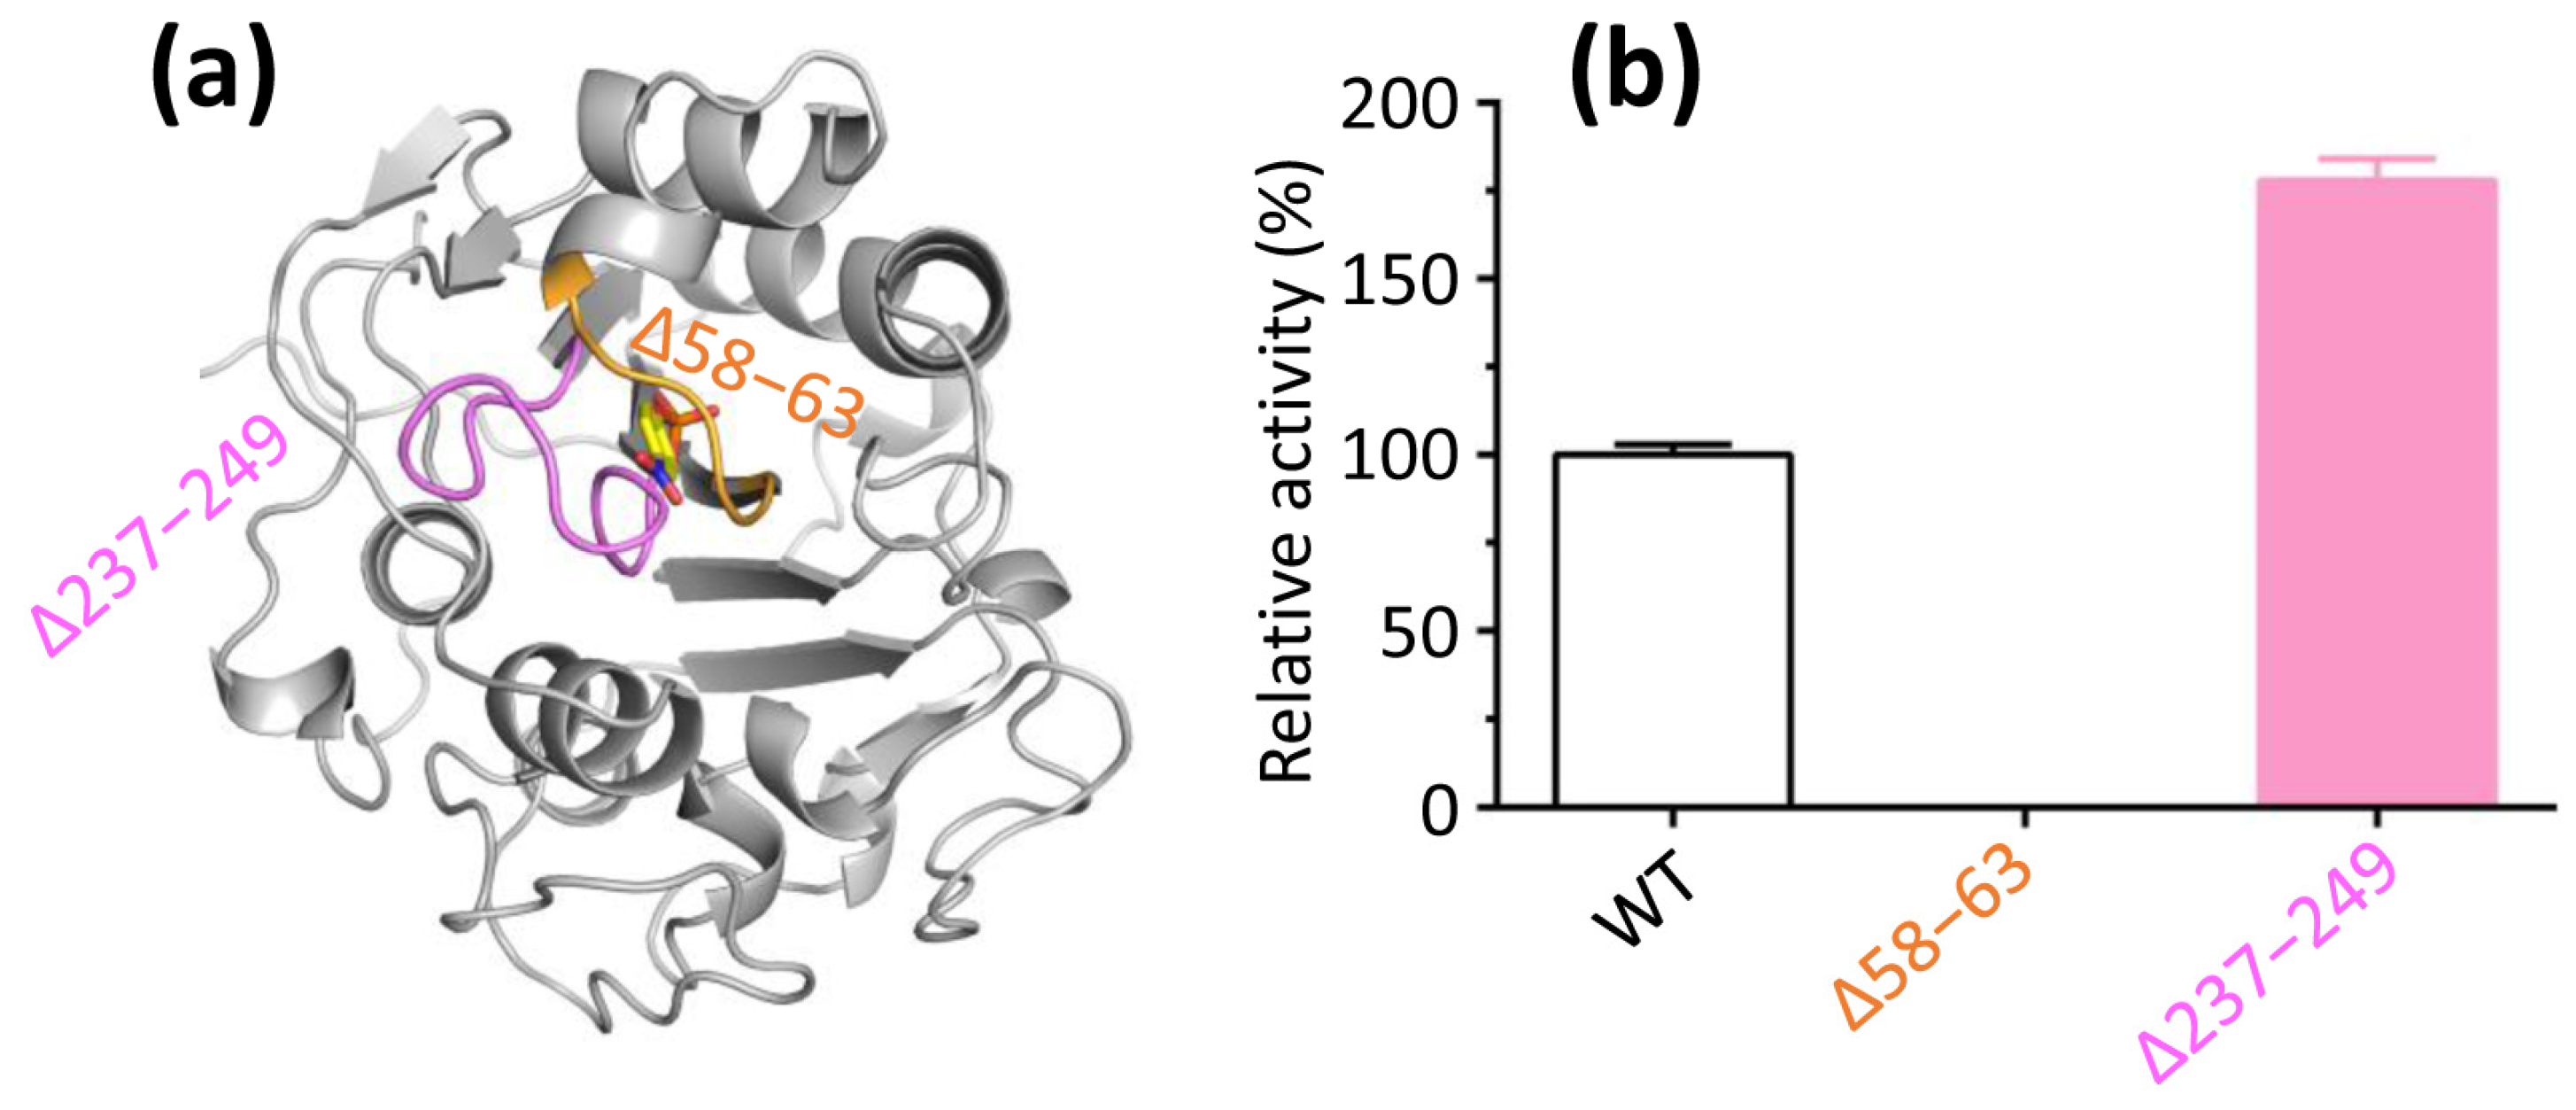
Regions 58–63 and 237–249 are located near the periphery of the catalytic pocket in SapM (Figure 6a). Deletion of residues 58–63 (∆58–63) resulted in a complete loss of activity (Figure 6b), highlighting the critical role of this region in the catalytic process. In contrast, deletion of residues 237–249 (∆237–249) led to a significant increase in activity compared to the wild-type (WT) protein (Figure 6b), suggesting that this region undergoes conformational changes that hinder substrate (pNPP) binding to the catalytic pocket, thereby reducing catalytic efficiency. These results indicate that the flexibility of the 237–249 region is important for modulating SapM activity.
Figure 6.
SapM activity mediated by the peripheral regions of the catalytic pocket. (a) The regions encompassing residues 58–63 and 237–249 are depicted in orange and magenta, respectively. (b) Functional analysis of deletion mutants revealed that the ∆237–249 mutant exhibited a significant increase in activity, in contrast to the ∆58–63 mutant, which resulted in a complete loss of activity. The activity of WT SapM was set to 100%. Data are presented as mean ± SD from three independent biological replicates, each with three technical replicates. Statistical significance was determined by one-way ANOVA followed by Tukey’s HSD post hoc test. p < 0.01, p < 0.001 versus WT.
Additionally, the Km value for ∆237–249 was 239.17 μM, significantly lower than that of the WT protein (Table 3). In contrast, the kcat value for ∆237–249 was notably higher, at 29.37 s−1, compared to the WT protein (Table 3). Additionally, Δ237–249 exhibited an approximately 2.9-fold higher catalytic efficiency than WT. Δ58–63 displayed no detectable activity under the assay conditions, and therefore their kcat/Km values could not be determined. Thus, deletion of residues 237–249 enhanced the apparent catalytic efficiency, whereas deletion of residues 58–63 abolished detectable activity under the assay conditions. These findings suggest that the ∆237–249 mutant exhibits stronger substrate affinity and faster reaction kinetics, likely due to reduced hindrance in substrate binding to the catalytic pocket.
3.7. Proposed Single-Gate Hypothesis
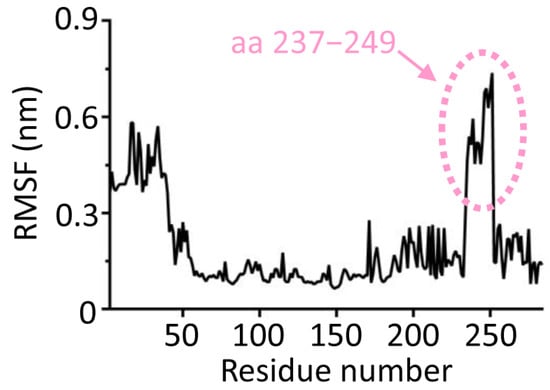
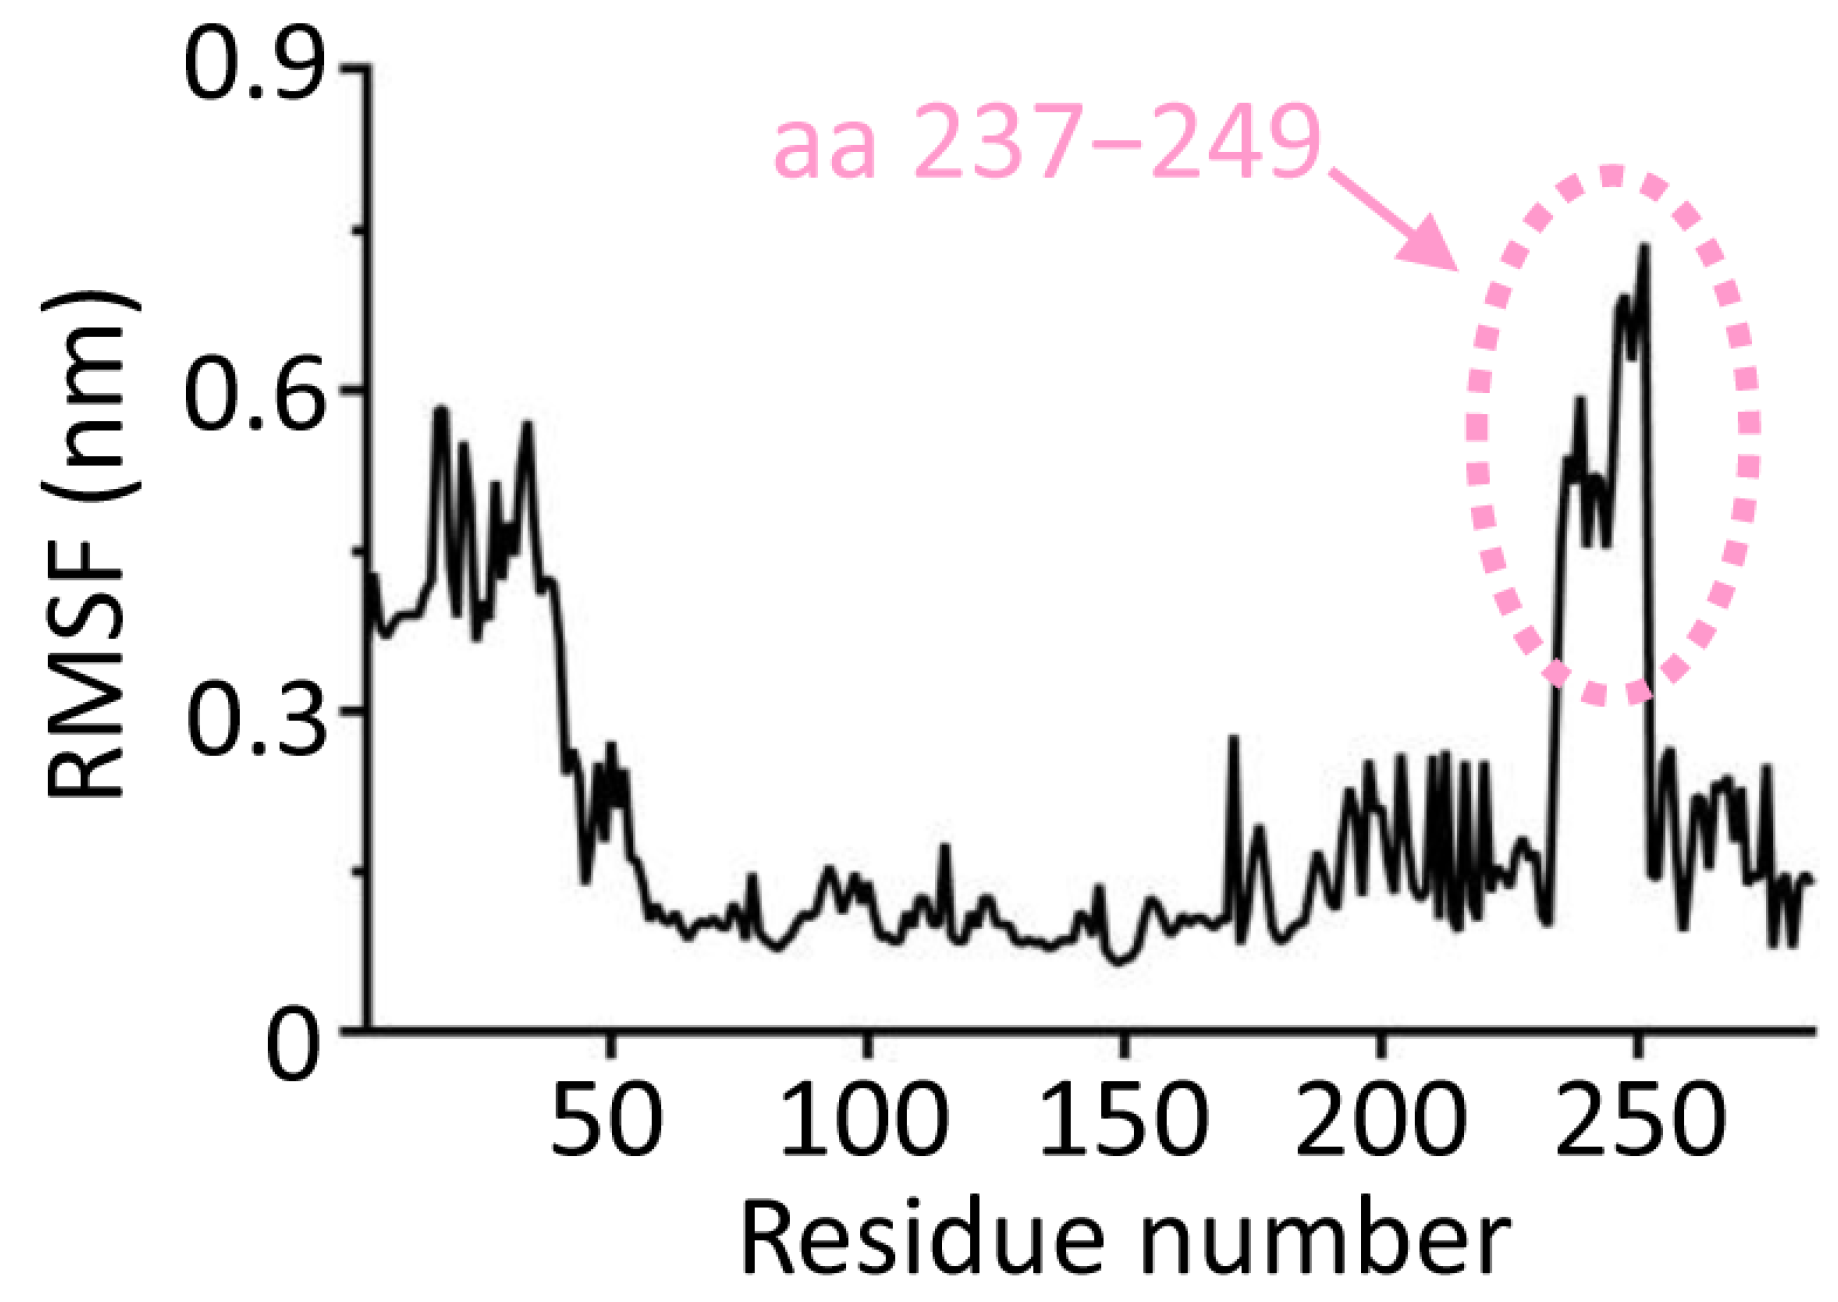
To investigate the flexibility of segment 237–249, we performed molecular dynamics simulations. The flexibility of each region in SapM was assessed using the root mean square fluctuation (RMSF), which measures the deviation of each atom from its average position. The results revealed that the RMSF peaks for segment 237–249 were 0.74 nm, significantly higher than those of other regions of SapM (Figure 7), further confirming the high flexibility of this segment.
Figure 7.
The high flexibility of segment 237–249 according to the results of RMSF (root mean square fluctuation) profile of SapM. Analysis of RMSF indicated significantly greater fluctuations in the segment encompassing residues 237–249, consistent with a region of high volatility. RMSF is a computational metric that evaluates the flexibility of individual residues by computing the time-averaged root-mean-square deviation of atomic positions in the protein backbone relative to a reference structure.
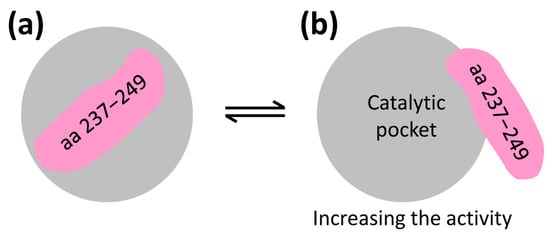
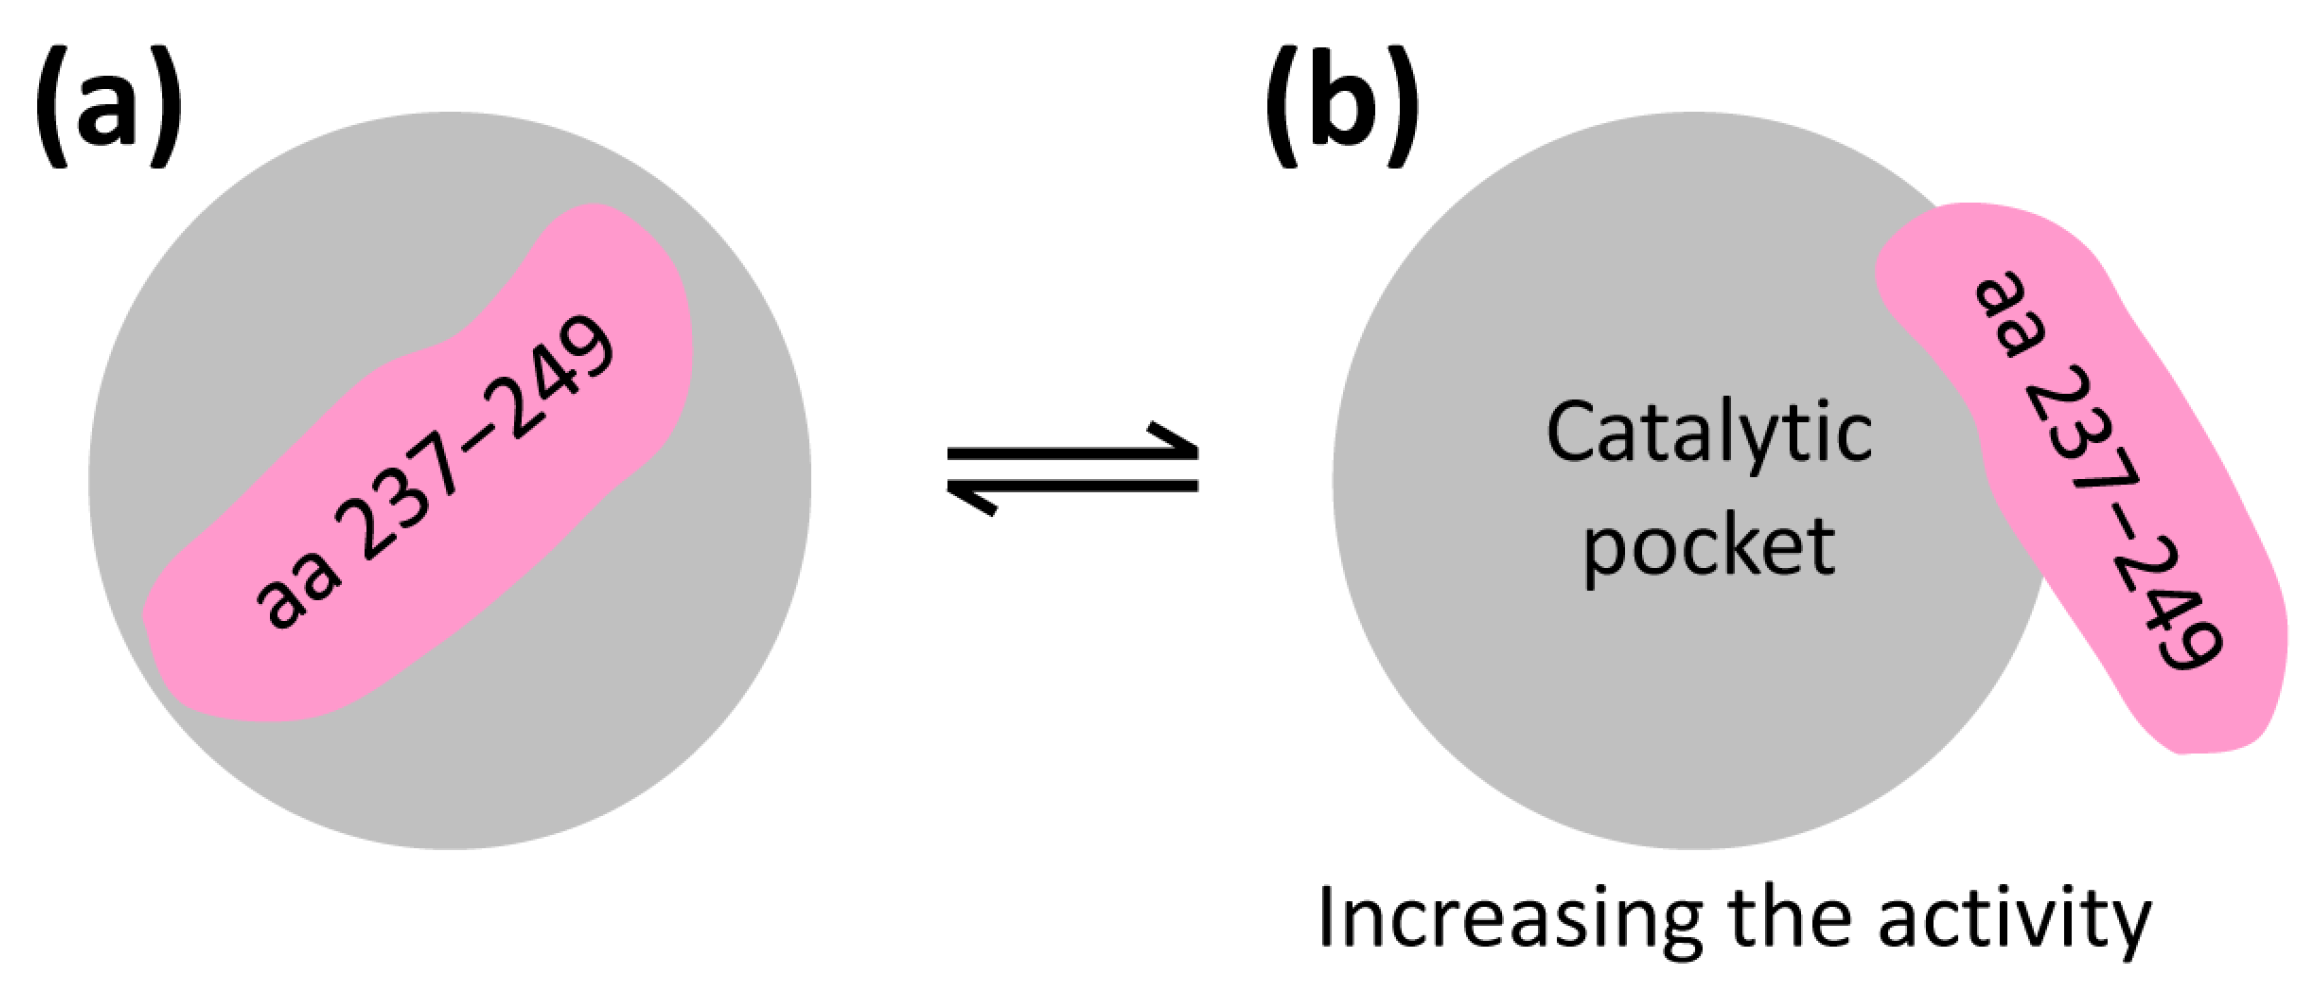
Based on these structural and functional insights, we propose a single-gate hypothesis to explain the possible activation mechanism of full-length SapM (Figure 8). This hypothesis is speculative and is based on a single apo-state MD simulation. It does not establish a thermodynamically defined open–closed transition, substrate-dependent gating, or a regulatory mechanism. In this model, full-length SapM transitions between active and inactive states in solution, with segment 237–249 acting as a gate that controls the interaction between SapM and its substrate (pNPP). When the gate (237–249) is closed, the catalytic pocket contracts, hindering substrate binding and rendering SapM inactive. When the gate is open, the catalytic pocket expands, allowing substrate entry and activating SapM for the catalytic reaction. This structural arrangement positions SapM and its substrate for efficient catalysis.
Figure 8.
A preliminary working model for the possible gating regulation of SapM activity. (a,b) Residues 237–249 (magenta) are proposed as a candidate regulatory element. This model is based on a single apo-state MD trajectory and does not represent an experimentally validated (b) open-closed (a) transition.
Based on one apo-state MD trajectory, we make a preliminary single-trajectory gate-like observation. Segment 237–249 displays high flexibility and may influence access to the catalytic pocket. However, no replicate simulations, pocket-volume calculations, or RMSF-convergence analysis were performed. This observation does not establish a thermodynamically defined open–closed transition, substrate-dependent gating, or a regulatory mechanism. It should be regarded as a working hypothesis to guide future experiments.
3.8. SapM Helps Mtb Survive in Macrophages
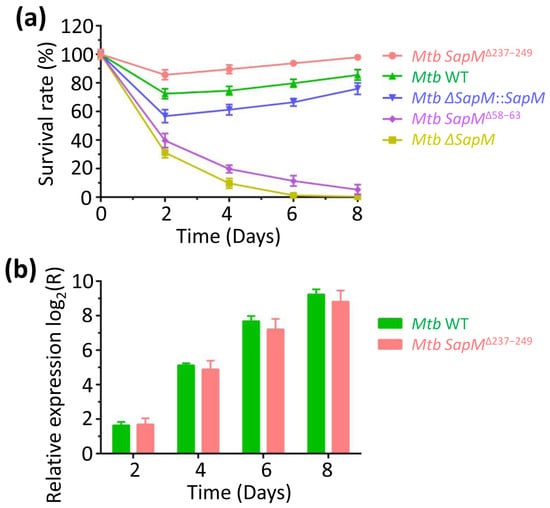
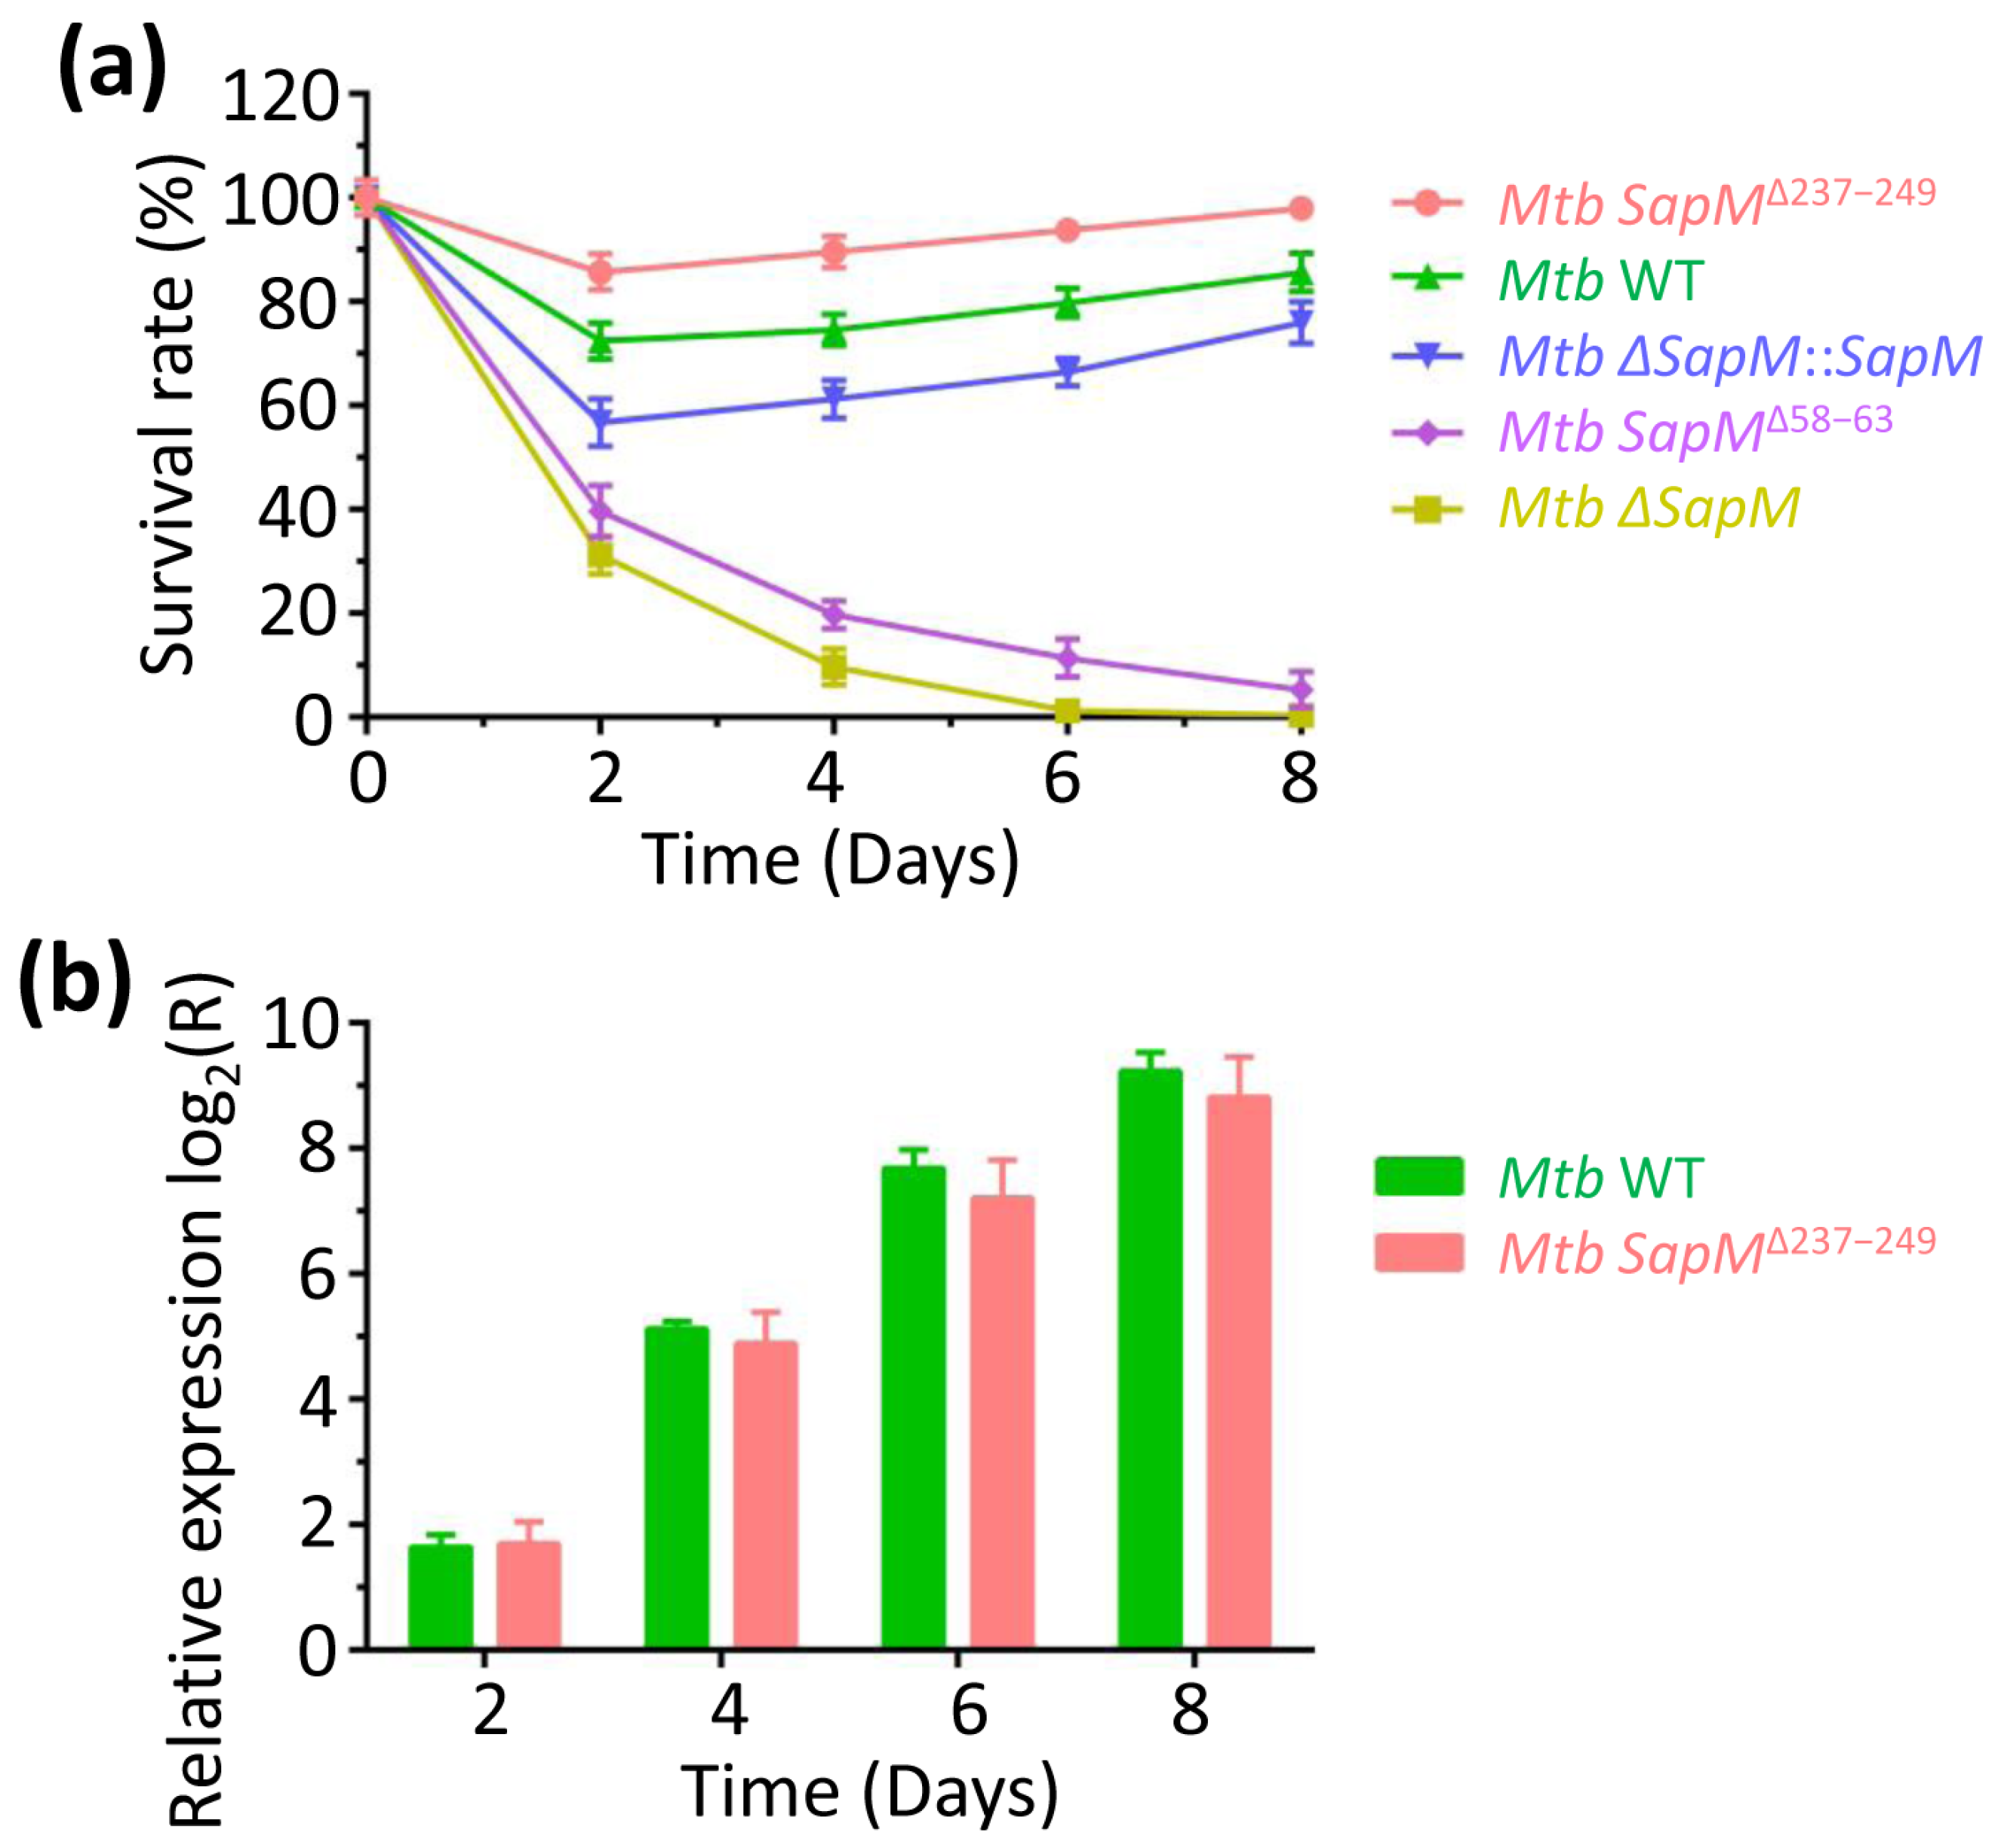
The SapM gene is crucial for Mtb survival in macrophages [11,12,13,14]. Macrophages, key early effector cells in controlling Mtb infection [44], can kill Mtb through various mechanisms, including the action of tumor necrosis factor alpha and reactive oxygen and nitrogen intermediates [45,46]. However, Mtb evades macrophage defense by inhibiting phagosome maturation [44,47,48]. To assess how different Mtb strains affect macrophage control, we compared the proliferation of wild-type (WT), ∆SapM, SapM∆58–63, SapM∆237–249, and ∆SapM::SapM strains in macrophages. We observed that the ∆SapM and SapM∆58–63 strains were rapidly killed, whereas the numbers of WT, SapM∆237–249, and ∆SapM::SapM strains initially decreased but then gradually increased (Figure 9a). Notably, the survival rate of SapM∆237−249 was higher than that of WT and ∆SapM::SapM strains (Figure 9a). This increased survival is likely due to the deletion of segment 237–249, which expands the catalytic pocket, facilitates substrate entry, and enhances catalytic activity compared to WT SapM. These findings are consistent with the structural and functional data presented earlier (Figure 6, Figure 7 and Figure 8), suggesting that SapM plays a critical role in enhancing Mtb survival within macrophages. This increased survival may be associated with the deletion of segment 237–249, but altered protein abundance, secretion, stability, localization, or host interactions cannot be excluded.
Figure 9.
Functional role of SapM. (a) A comparison of bacterial survival rates showed that the presence of a functional SapM gene significantly enhanced Mtb survival. This was evidenced by the higher survival of wild-type (WT), ΔSapM::SapM, and SapMΔ237–249 strains relative to the ΔSapM and SapMΔ58–63 mutants. (b) Gene SapM transcript levels were quantified via RT-qPCR (reverse transcription quantitative polymerase chain reaction) at multiple time points. Gene expression is presented as a log2-transformed relative ratio, where positive values denote transcriptional up-regulation. Data are presented as mean ± SD from three independent biological replicates, each with three technical replicates. Statistical significance was determined by one-way ANOVA followed by Tukey’s HSD post hoc test. p < 0.05, p < 0.01 versus WT.
The increased survival of the SapMΔ237–249 strain may be associated with, but is not proven to be caused by, increased catalytic activity. Altered protein abundance, secretion, stability, localization, or host interactions cannot be excluded. Causality between catalytic efficiency and intracellular survival remains unproven.
3.9. Expression Profile of SapM in Response to Macrophages
To investigate the expression profile of SapM during infection, RT-qPCR was conducted on RNA extracted from Mtb recovered from infected macrophages at various time points. We found that SapM transcription levels increased progressively over time (Figure 9b). Specifically, for WT Mtb, SapM expression was upregulated by 3.1-, 34.8-, 205.1-, and 588.1-fold on days 2, 4, 6, and 8, respectively (Figure 9b). For SapM∆237–249 Mtb, SapM expression was upregulated by 3.2-, 29.7-, 147.4-, and 449.9-fold on days 2, 4, 6, and 8, respectively (Figure 9b). These results indicate an increased synthesis of SapM during macrophage infection, suggesting that SapM is crucial for Mtb survival within macrophages, consistent with previous findings [11,12,13,14].
4. Discussion
In this work, we successfully isolated monomeric SapM protein, with a measured hydrodynamic diameter of 5.1 ± 0.3 nm. Molecular docking was performed using a refined model predicted by AlphaFold3, and site-specific mutations were introduced. The R61A, T236A, and T250A mutants exhibited a 5- to 60-fold reduction in activity. The docking result was used solely to guide site-directed mutagenesis. The functional importance of R61, T236, and T250 is supported by mutagenesis and kinetic assays, not by the docking score itself. Segment 237–249 demonstrated greater flexibility compared to other regions of SapM. The SapM gene plays a key role in Mtb survival within macrophages. Our findings provide a detailed molecular understanding of SapM function, highlighting it as a potential target for developing novel anti-tuberculosis therapies aimed at restoring phagosomal maturation and enhancing host immune responses.
A key achievement of this study was the successful production of monomeric SapM. With a hydrodynamic diameter of 5.1 ± 0.3 nm, this form, likely indicating flexible regions, is ideal for subsequent biophysical and functional analyses, allowing for clear interpretation of the structure-function relationship.
Experimental structural validation, including CD spectroscopy, SAXS, SEC-MALS, HDX-MS, and X-ray crystallography, was beyond the scope of the present study. Consequently, although the AlphaFold3 model was refined with ModRefiner and evaluated by Ramachandran statistics, pLDDT, and PAE, these computational assessments cannot establish the accuracy of the fold, active-site geometry, loop conformation, or side-chain orientations. The refined SapM model and the proposed regulatory role of the 237–249 segment should therefore be regarded as a working structural hypothesis rather than an experimentally validated structure. Future collaborative studies using these biophysical and structural approaches will be required to validate the model and to define the conformational dynamics of the 237–249 region. Until such data are available, conclusions regarding the precise open-closed transition and active-site geometry should be interpreted with appropriate caution, whereas the functional effects of the mutations and deletions are supported by the activity assays.
Although all variants were expressed solubly and purified by Ni-NTA and SEC with behavior similar to WT, and although the Δ237–249 mutant showed increased activity and the Δ58–63 mutant lost activity consistent with deletion of catalytic residues E59/N60, we did not perform far-UV CD or nano DSF to directly validate mutant folding. These methods report global secondary structure and thermal stability rather than active-site geometry. In addition, buffer exchange into phosphate is problematic for SapM because phosphate is a product analogue and, in our hands, promotes aggregation and precipitation. Therefore, we cannot formally exclude local misfolding, and the possibility that some activity changes arise from altered folding or stability remains. This limitation should be considered when interpreting the mutant data. The AlphaFold3 model and ModRefiner refinement were based on the full-length SapM sequence (residues 1–299), including the flexible N-terminal region (residues 1–43) with lower pLDDT confidence. This region is distant from the catalytic pocket, and the pNPP-interacting residues identified here (R61, T236, and T250) lie outside it. Nevertheless, the conformation of residues 1–43 is less reliable, and no mechanistic conclusion is based on this segment. Future simulations with the mature form or with explicit treatment of the N-terminal flexible region will be useful to test its potential regulatory role.
It is essential to reconcile the residues identified in our study with those previously implicated in SapM catalysis. Fernandez-Soto et al. demonstrated that SapM is an atypical monoester alkaline phosphatase that employs a metal-dependent serine-based catalytic mechanism, with S95 as the likely nucleophile and K159, H160, H204, E59, N60, D238, and E239 contributing to metal coordination, substrate binding, or catalysis [15]. In our pNPP-based docking and mutagenesis, R61, T236, and T250 emerged as auxiliary phosphate-orienting residues rather than catalytic nucleophiles. This apparent difference is likely attributable to the small size of pNPP, which lacks the inositol headgroup of PI3P and therefore favors interactions with peripheral phosphate-binding residues. Importantly, D238 and E239 are located within the 237–249 segment that we propose to act as a flexible autoinhibitory element. Deletion of this segment would remove D238/E239, which might be expected to impair catalysis; however, the Δ237–249 mutant exhibited increased activity. This suggests that the dominant consequence of the deletion is relief of autoinhibition and improved substrate access, which outweighs the loss of these auxiliary residues. Thus, our findings refine, rather than contradict, the established mechanism by identifying a regulatory element that modulates access to the conserved catalytic center, while the canonical roles of S95, K159, H160, H204, E59, N60, D238, and E239 remain fully acknowledged.
The metal-dependent serine-based catalytic mechanism of SapM was established in previous work [15]. In our hands, enzymatic assays were performed in Tris-HCl buffer without exogenous metal supplementation. We therefore cannot draw conclusions about metal identity, stoichiometry, or requirement from the present data. Trace metal ions may have been present in the buffer or purified protein preparation. Direct metal-binding and metal-reconstitution experiments will be required to define the role of metals in pNPP hydrolysis by SapM. The active-site metal was not identified, and metal occupancy was not controlled. Saleh & Belisle [11] reported inhibition by Zn2+, molybdate, Mg2+ and Cu2+, and by EDTA, and noted tartrate resistance suggestive of iron dependence, but did not establish the identity of the catalytic metal. We therefore cannot exclude mixed or under-unity metal occupancy, and the absolute kinetic values should be interpreted with this caveat.
To place the refined SapM model in a structural context, we performed a DALI search against the PDB (Table S4). The closest structurally characterized homologues were phosphatases, including Francisella tularensis subsp. novicida phosphatase (PDB 2D1G) and Pseudomonas aeruginosa PA14 phosphatase (PDB code 9GYE). These enzymes share the central α/β phosphatase core and the metal-coordinating active-site architecture, but they lack the SapM-specific 237–249 segment. This comparison supports the overall fold of the refined model while highlighting the SapM-specific peripheral element.
The main limitation of this study is the use of pNPP as a chromogenic surrogate for PI3P. pNPP is a small, soluble phosphate monoester that lacks the inositol headgroup and membrane-anchoring lipid moiety of PI3P. Therefore, the pNPP-based assays report active-site integrity and the catalytic step of pNPP hydrolysis rather than physiological PI3P turnover in a membrane environment. Accordingly, all main conclusions of this work, including the roles of R61, T236, and T250, the effect of the Δ237–249 deletion, and the proposed 237–249 gate, are explicitly limited to pNPP hydrolysis. No PI3P-liposome, membrane-mimetic, or PI3P-docking experiments were performed. Whether these findings apply to PI3P requires future assays using PI3P-containing liposomes or membrane mimetics. Until such data are available, the present results should not be interpreted as evidence for physiological PI3P catalysis, and the gate model should be regarded as a working hypothesis rather than a validated regulatory mechanism.
Several limitations should be considered. First, pNPP is a small chromogenic surrogate for PI3P; therefore, the kinetic data report active-site integrity and pNPP hydrolysis rather than physiological PI3P catalysis in a membrane environment. Second, we did not test metal dependence directly, and the metal-dependent mechanism is based on previous work [15]. Third, the gate model is based on a single apo-state MD trajectory without replicate simulations, convergence analysis, or pocket-volume calculations, and should be regarded as a working hypothesis. Fourth, the AlphaFold3/ModRefiner model was not experimentally validated by crystallography, NMR, or other biophysical methods. Fifth, the enhanced macrophage survival of the Δ237–249 strain is a phenotype associated with, but not proven to be caused by, increased catalytic activity, because protein abundance, secretion, stability, and localization were not quantified. These limitations define clear directions for future work.
In conclusion, our findings provide a molecular framework for SapM function and identify 237–249 as a candidate regulatory element. Further validation, including PI3P-liposome assays, structural determination, and in vivo infection models, will be required before SapM can be considered a therapeutic target.
5. Conclusions
In this study, we characterized SapM from Mtb. Recombinant SapM was monomeric, with a hydrodynamic diameter of 5.1 ± 0.3 nm. An AlphaFold3/ModRefiner model showed good stereochemical quality. Docking with pNPP and mutagenesis identified R61, T236, and T250 as important for pNPP hydrolysis; their mutation reduced activity 5- to 60-fold and altered Km and kcat. Deletion of 58–63 abolished pNPP activity, whereas deletion of the flexible 237–249 segment increased pNPP activity. Molecular dynamics supported a preliminary single-trajectory gate-like observation in which 237–249 may regulate access to the catalytic pocket. The Δ237–249 strain enhanced Mtb survival in macrophages, and SapM expression increased during infection. These conclusions refer to pNPP hydrolysis; whether the same mechanism applies to PI3P in a lipid bilayer remains to be tested. The proposed 237–249 gate should be regarded as a working hypothesis requiring further validation by replicate simulations, pocket-volume analysis, PI3P-liposome assays, and structural studies.
Supplementary Materials
The following supporting information can be downloaded at: https://www.mdpi.com/article/10.3390/biom16111595/s1, Figure S1: The amino acid sequence of SapM (UniProt code O53361); Figure S2: Gene sequence of SapM after codon optimization; Figure S3: Prediction and evaluation of the initial model of SapM; Figure S4: Structural model of SapM predicted using AlphaFold3; Figure S5: Predicted Aligned Error (PAE); Table S1: Primers used for constructions of SapM plasmids; Table S2: Primers used for generating site-directed mutants of SapM; Table S3: Primers used for RT-qPCR; Table S4: Search for structural homologs using DALI.
Author Contributions
Conceptualization, D.L.; data curation, D.L.; formal analysis, D.L.; investigation, D.L. and W.Y.; methodology, D.L.; resources, D.L.; software, D.L.; validation, D.L.; writing—original draft, D.L.; writing—review & editing, D.L. All authors have read and agreed to the published version of the manuscript.
Funding
Our research work is financially supported by grants from the third batch of the “Tianchi Talent” Young Doctoral Research Grant, Xinjiang Autonomous Region (2025QNBS001), and the Talent Team Support Initiative for Scientific Research and Innovation Platforms of the Xinjiang Talent Development Fund (XJRCXYCTD2025-2).
Institutional Review Board Statement
Not applicable.
Informed Consent Statement
Not applicable.
Data Availability Statement
The original contributions presented in this study are included in the article/Supplementary Materials. Further inquiries can be directed to the corresponding author.
Conflicts of Interest
The authors declare no conflicts of interest.
References
- Trajman, A.; Campbell, J.R.; Kunor, T.; Ruslami, R.; Amanullah, F.; Behr, M.A.; Menzies, D. Tuberculosis. Lancet 2025, 405, 850–866. [Google Scholar] [PubMed]
- Schmidt, A.C.; Fairlie, L.; Hellström, E.; Luabeya Kany Kany, A.; Middelkoop, K.; Naidoo, K.; Nair, G.; Gela, A.; Nemes, E.; Scriba, T.J.; et al. BCG Revaccination for the Prevention of Mycobacterium tuberculosis Infection. N. Engl. J. Med. 2025, 392, 1789–1800. [Google Scholar] [CrossRef] [Scilit] [PubMed]
- Dheda, K.; Mirzayev, F.; Cirillo, D.M.; Udwadia, Z.; Dooley, K.E.; Chang, K.-C.; Omar, S.V.; Reuter, A.; Perumal, T.; Horsburgh, C.R.; et al. Multidrug-resistant tuberculosis. Nat. Rev. Dis. Primers 2024, 10, 22. [Google Scholar] [CrossRef] [Scilit]
- Farhat, M.; Cox, H.; Ghanem, M.; Denkinger, C.M.; Rodrigues, C.; Abd El Aziz, M.S.; Enkh-Amgalan, H.; Vambe, D.; Ugarte-Gil, C.; Furin, J.; et al. Drug-resistant tuberculosis: A persistent global health concern. Nat. Rev. Microbiol. 2024, 22, 617–635. [Google Scholar] [CrossRef] [Scilit] [PubMed]
- Sweet, M.J.; Ramnath, D.; Singhal, A.; Kapetanovic, R. Inducible antibacterial responses in macrophages. Nat. Rev. Immunol. 2024, 25, 92–107. [Google Scholar] [CrossRef] [Scilit] [PubMed]
- Liu, D.; Yuan, C.; Guo, C.; Huang, M.; Lin, D. Structural and Functional Insights into the Stealth Protein CpsY of Mycobacterium tuberculosis. Biomolecules 2023, 13, 1611. [Google Scholar] [CrossRef] [Scilit] [PubMed]
- Dartois, V.A.; Mizrahi, V.; Savic, R.M.; Silverman, J.A.; Hermann, D.; Barry, C.E. Strategies for shortening tuberculosis therapy. Nat. Med. 2025, 31, 1765–1775. [Google Scholar] [CrossRef] [Scilit] [PubMed]
- Dartois, V.; Dick, T. Therapeutic developments for tuberculosis and nontuberculous mycobacterial lung disease. Nat. Rev. Drug Discov. 2024, 23, 381–403. [Google Scholar] [CrossRef] [Scilit] [PubMed]
- Goossens, S.N.; Sampson, S.L.; Rie, A.V. Mechanisms of Drug-Induced Tolerance in Mycobacterium tuberculosis. Clin. Microbiol. Rev. 2021, 34, e00141-20. [Google Scholar] [CrossRef] [Scilit] [PubMed]
- Liu, D.; Deng, H.; Liu, X.; Yao, W.; Li, N. Molecular insights into the functional mechanism of phosphoserine phosphatase SerB2 in Mycobacterium tuberculosis. Front. Microbiol. 2026, 17, 1863671. [Google Scholar] [CrossRef] [Scilit] [PubMed]
- Saleh, M.T.; Belisle, J.T. Secretion of an acid phosphatase (SapM) by Mycobacterium tuberculosis that is similar to eukaryotic acid phosphatases. J. Bacteriol. 2000, 182, 6850–6853. [Google Scholar] [CrossRef] [Scilit] [PubMed]
- Vergne, I.; Chua, J.; Lee, H.-H.; Lucas, M.; Belisle, J.; Deretic, V. Mechanism of phagolysosome biogenesis block by viable Mycobacterium tuberculosis. Proc. Natl. Acad. Sci. USA 2005, 102, 4033–4038. [Google Scholar] [CrossRef] [Scilit] [PubMed]
- Neyrolles, O.; Puri, R.V.; Reddy, P.V.; Tyagi, A.K. Secreted Acid Phosphatase (SapM) of Mycobacterium tuberculosis Is Indispensable for Arresting Phagosomal Maturation and Growth of the Pathogen in Guinea Pig Tissues. PLoS ONE 2013, 8, e70514. [Google Scholar] [CrossRef] [Scilit] [PubMed]
- Hu, D.; Wu, J.; Wang, W.; Mu, M.; Zhao, R.; Xu, X.; Chen, Z.; Xiao, J.; Hu, F.; Yang, Y.; et al. Autophagy regulation revealed by SapM-induced block of autophagosome-lysosome fusion via binding RAB7. Biochem. Biophys. Res. Commun. 2015, 461, 401–407. [Google Scholar] [CrossRef] [Scilit] [PubMed]
- Fernandez-Soto, P.; Bruce, A.J.E.; Fielding, A.J.; Cavet, J.S.; Tabernero, L. Mechanism of catalysis and inhibition of Mycobacterium tuberculosis SapM, implications for the development of novel antivirulence drugs. Sci. Rep. 2019, 9, 1–14. [Google Scholar] [CrossRef] [Scilit] [PubMed]
- Olson, B.J.S.C. Assays for Determination of Protein Concentration. Curr. Protoc. Pharmacol. 2016, 73, A.3A.1–A.3A.32. [Google Scholar] [CrossRef] [Scilit] [PubMed]
- Liu, D.; Deng, H.; Song, H. Insights into the functional mechanisms of the sesquiterpene synthase GEAS and GERDS in lavender. Int. J. Biol. Macromol. 2025, 299, 140195. [Google Scholar] [CrossRef] [Scilit] [PubMed]
- Abramson, J.; Adler, J.; Dunger, J.; Evans, R.; Green, T.; Pritzel, A.; Ronneberger, O.; Willmore, L.; Ballard, A.J.; Bambrick, J.; et al. Accurate structure prediction of biomolecular interactions with AlphaFold 3. Nature 2024, 630, 493–500, Addendum to Nature 2024, 636, E4. [Google Scholar] [CrossRef] [Scilit] [PubMed]
- Xu, D.; Zhang, Y. Improving the Physical Realism and Structural Accuracy of Protein Models by a Two-Step Atomic-Level Energy Minimization. Biophys. J. 2011, 101, 2525–2534. [Google Scholar] [CrossRef] [Scilit] [PubMed]
- Holm, L.; Laiho, A.; Törönen, P.; Salgado, M. DALI shines a light on remote homologs: One hundred discoveries. Protein Sci. 2022, 32, e4519. [Google Scholar] [CrossRef] [Scilit] [PubMed]
- Holm, L. Dali server: Structural unification of protein families. Nucleic Acids Res. 2022, 50, W210–W215. [Google Scholar] [CrossRef] [Scilit] [PubMed]
- Laskowski, R.A. PDBsum1: A standalone program for generating PDBsum analyses. Protein Sci. 2022, 31, e4473. [Google Scholar] [CrossRef] [Scilit] [PubMed]
- de Beer, T.A.P.; Berka, K.; Thornton, J.M.; Laskowski, R.A. PDBsum additions. Nucleic Acids Res. 2014, 42, D292–D296. [Google Scholar] [CrossRef] [Scilit] [PubMed]
- Laskowski, R.A. PDBsum more: New summaries and analyses of the known 3D structures of proteins and nucleic acids. Nucleic Acids Res. 2004, 33, D266–D268. [Google Scholar] [CrossRef] [Scilit] [PubMed]
- Laskowski, R.A. PDBsum new things. Nucleic Acids Res. 2009, 37, D355–D359. [Google Scholar] [CrossRef] [Scilit] [PubMed]
- Laskowski, R.A.; Jabłońska, J.; Pravda, L.; Vařeková, R.S.; Thornton, J.M. PDBsum: Structural summaries of PDB entries. Protein Sci. 2017, 27, 129–134. [Google Scholar] [CrossRef] [Scilit] [PubMed]
- Huey, R.; Morris, G.M.; Olson, A.J.; Goodsell, D.S. A semiempirical free energy force field with charge-based desolvation. J. Comput. Chem. 2007, 28, 1145–1152. [Google Scholar] [CrossRef] [Scilit] [PubMed]
- Morris, G.M.; Huey, R.; Lindstrom, W.; Sanner, M.F.; Belew, R.K.; Goodsell, D.S.; Olson, A.J. AutoDock4 and AutoDockTools4: Automated docking with selective receptor flexibility. J. Comput. Chem. 2009, 30, 2785–2791. [Google Scholar] [CrossRef] [Scilit] [PubMed]
- Trott, O.; Olson, A.J. AutoDock Vina: Improving the speed and accuracy of docking with a new scoring function, efficient optimization, and multithreading. J. Comput. Chem. 2009, 31, 455–461. [Google Scholar] [CrossRef] [Scilit] [PubMed]
- Forli, S.; Huey, R.; Pique, M.E.; Sanner, M.F.; Goodsell, D.S.; Olson, A.J. Computational protein–ligand docking and virtual drug screening with the AutoDock suite. Nat. Protoc. 2016, 11, 905–919. [Google Scholar] [CrossRef] [Scilit] [PubMed]
- Liu, D.; Li, N.; Deng, H.; Song, D.; Song, H. Integrating Structural Bioinformatics and Functional Mechanisms of Sesquiterpene Synthases CARS and CADS in Lavandula angustifolia (Lavender). Int. J. Mol. Sci. 2025, 26, 9568. [Google Scholar] [CrossRef] [Scilit] [PubMed]
- Abraham, M.J.; Murtola, T.; Schulz, R.; Páll, S.; Smith, J.C.; Hess, B.; Lindahl, E. GROMACS: High performance molecular simulations through multi-level parallelism from laptops to supercomputers. SoftwareX 2015, 1–2, 19–25. [Google Scholar] [CrossRef] [Scilit]
- Lindorff-Larsen, K.; Piana, S.; Palmo, K.; Maragakis, P.; Klepeis, J.L.; Dror, R.O.; Shaw, D.E. Improved side-chain torsion potentials for the Amber ff99SB protein force field. Proteins Struct. Funct. Bioinform. 2010, 78, 1950–1958. [Google Scholar] [CrossRef] [Scilit] [PubMed]
- Deserno, M.; Holm, C. How to mesh up Ewald sums. I. A theoretical and numerical comparison of various particle mesh routines. J. Chem. Phys. 1998, 109, 7678–7693. [Google Scholar] [CrossRef] [Scilit]
- Deserno, M.; Holm, C. How to mesh up Ewald sums. II. An accurate error estimate for the particle–particle–particle-mesh algorithm. J. Chem. Phys. 1998, 109, 7694–7701. [Google Scholar] [CrossRef] [Scilit]
- Hoover, W.G.; Holian, B.L. Kinetic moments method for the canonical ensemble distribution. Phys. Lett. A 1996, 95, 5. [Google Scholar] [CrossRef] [Scilit]
- Parrinello, M.; Rahman, A. Polymorphic transitions in single crystals: A new molecular dynamics method. J. Appl. Phys. 1981, 52, 7182–7190. [Google Scholar] [CrossRef] [Scilit]
- Hu, Y.; Coates, A.R.M. Transcription of two sigma 70 homologue genes, sigA and sigB, in stationary-phase Mycobacterium tuberculosis. J. Bacteriol. 1999, 181, 469–476. [Google Scholar] [CrossRef] [Scilit] [PubMed]
- Sarva, K.; Satsangi, A.T.; Plocinska, R.; Madiraju, M.; Rajagopalan, M. Two-component kinase TrcS complements Mycobacterium smegmatis mtrB kinase mutant. Tuberculosis 2019, 116, S107–S113. [Google Scholar] [CrossRef] [Scilit] [PubMed]
- Schmittgen, T.D.; Livak, K.J. Analyzing real-time PCR data by the comparative CT method. Nat. Protoc. 2008, 3, 1101–1108. [Google Scholar] [CrossRef] [Scilit] [PubMed]
- Livak, K.J.; Schmittgen, T.D. Analysis of Relative Gene Expression Data Using Real-Time Quantitative PCR and the 2−ΔΔCT Method. Methods 2001, 25, 402–408. [Google Scholar] [CrossRef] [Scilit] [PubMed]
- Erickson, H.P. Size and Shape of Protein Molecules at the Nanometer Level Determined by Sedimentation, Gel Filtration, and Electron Microscopy. Biol. Proced. Online 2009, 11, 32–51. [Google Scholar] [CrossRef] [Scilit] [PubMed]
- Chen, V.B.; Arendall, W.B.; Headd, J.J.; Keedy, D.A.; Immormino, R.M.; Kapral, G.J.; Murray, L.W.; Richardson, J.S.; Richardson, D.C. MolProbity: All-atom structure validation for macromolecular crystallography. Acta Crystallogr. Sect. D Biol. Crystallogr. 2009, 66, 12–21. [Google Scholar] [CrossRef] [Scilit] [PubMed]
- Huang, L.; Nazarova, E.V.; Russell, D.G.; Cossart, P.; Roy, C.R.; Sansonetti, P. Mycobacterium tuberculosis: Bacterial Fitness within the Host Macrophage. Microbiol. Spectr. 2019, 7, 10. [Google Scholar] [CrossRef] [Scilit] [PubMed]
- VanderVen, B.C.; Huang, L.; Rohde, K.H.; Russell, D.G.; Jacobs, W.R., Jr.; McShane, H.; Mizrahi, V.; Orme, I.M. The Minimal Unit of Infection: Mycobacterium tuberculosis in the Macrophage. Microbiol. Spectr. 2016, 4, 10. [Google Scholar] [CrossRef] [Scilit] [PubMed]
- Koch, A.; Mizrahi, V. Mycobacterium tuberculosis. Trends Microbiol. 2018, 26, 555–556. [Google Scholar] [CrossRef] [Scilit] [PubMed]
- Bo, H.; Moure, U.A.E.; Yang, Y.; Pan, J.; Li, L.; Wang, M.; Ke, X.; Cui, H. Mycobacterium tuberculosis-macrophage interaction: Molecular updates. Front. Cell. Infect. Microbiol. 2023, 13, 1062963. [Google Scholar] [CrossRef] [Scilit] [PubMed]
- Bekker, L.-G.; Freeman, S.; Murray, P.J.; Ryffel, B.; Kaplan, G. TNF-α Controls Intracellular Mycobacterial Growth by Both Inducible Nitric Oxide Synthase-Dependent and Inducible Nitric Oxide Synthase-Independent Pathways. J. Immunol. 2001, 166, 6728–6734. [Google Scholar] [CrossRef] [Scilit] [PubMed]

Disclaimer/Publisher’s Note: The statements, opinions and data contained in all publications are solely those of the individual author(s) and contributor(s) and not of MDPI and/or the editor(s). MDPI and/or the editor(s) disclaim responsibility for any injury to people or property resulting from any ideas, methods, instructions or products referred to in the content. |
© 2026 by the authors. Licensee MDPI, Basel, Switzerland. This article is an open access article distributed under the terms and conditions of the Creative Commons Attribution (CC BY) license.