


Abstract
Phenylketonuria (PKU) is an autosomal recessive disorder caused by pathogenic variants in the phenylalanine hydroxylase (PAH) gene. Clinically, maternal PKU syndrome—in which affected mothers exhibit hyperphenylalaninemia—leads to irreversible fetal neurological injury during gestation. However, it remains unclear whether fetuses with intrinsic PKU, carried by metabolically normal mothers, trigger measurable molecular changes in maternal urine, and non-invasive prenatal monitoring methods for this scenario are lacking. In this study, Pah+/− female mice were mated with Pah+/− male mice and wild-type male mice, respectively. Urine samples were collected longitudinally from pregnant mice at 10 time points during gestation from Day 1 to Day 19. Data-independent acquisition (DIA) quantitative proteomics combined with GO/KEGG analysis, WGCNA, and a dual-strategy LASSO-random forest approach was used to screen candidate biomarkers. The results showed that group-specific proteomic signals were detectable as early as Day 1, with a small subset of differentially expressed proteins persisting across gestation and exhibiting temporal dynamics. Permutation tests indicated that the probability of random generation of the differential protein combination was low (0.04–0.06), suggesting that it was not randomly generated. The intersection of the two machine-learning screening strategies identified five proteins: GINM1, PRG4, LY6A, NTM, and YIPF3. GLO1 was further added as a candidate biomarker based on its significant differential expression and central role in the protein co-expression network, resulting in six candidate biomarkers in total. This study found that the maternal urine proteome can non-invasively reflect the systemic maternal response induced by fetal intrinsic PKU.
1. Introduction
Phenylketonuria (PKU) is an autosomal recessive inherited disorder of amino acid metabolism caused by PAH gene variants. It was first reported by the Norwegian physician Asbjørn Følling in 1934 [1]. The core mechanism of the disease is the loss of phenylalanine hydroxylase activity, whereby phenylalanine cannot be normally converted to tyrosine, leading to substantial accumulation in the body and the generation of neurotoxic metabolites; if not promptly treated, it can cause irreversible neurological damage, with clinical symptoms mostly manifesting as intellectual disability and neurological deficits [2,3]. PKU can occur in newborns, infants, children, and even adults, with the highest incidence among newborns. Early clinical manifestations are insidious and easily overlooked [3]. The incidence of this disease varies across regions worldwide. The incidence among newborns in the United States is approximately 5.3–7.4 per 100,000 [4], and approximately 1 in 10,000 in Europe [5], imposing a heavy burden on affected families and public health.
In terms of pathogenesis, the core pathogenic basis of PKU is mutations in the Pah gene on chromosome 12, while a small number of cases are caused by mutations in genes involved in BH4 cofactor synthesis and metabolic pathways. These mutations lead to structural abnormalities and loss of activity of hepatic phenylalanine hydroxylase, which cannot catalyze the hydroxylation of phenylalanine (Phe) to tyrosine, resulting in persistent accumulation of blood Phe and its toxic metabolites phenylpyruvic acid, phenyllactic acid, and phenylacetic acid [6,7]. High intrauterine concentrations of Phe can cross the placenta and the fetal blood–brain barrier, competitively inhibiting the transport of essential amino acids such as tyrosine and tryptophan in the brain, directly causing deficient synthesis of key neurotransmitters such as dopamine and serotonin [8,9]. Meanwhile, a high-Phe environment can inhibit neuronal mitochondrial respiratory chain function, induce oxidative stress activation and massive ROS accumulation, and hinder fetal brain myelin development and neuronal proliferation and differentiation, ultimately leading to clinical phenotypes such as irreversible intellectual impairment, epilepsy, and motor developmental delay [9,10].
At present, the domestic clinical PKU prevention and control system mainly relies on postnatal newborn screening and dietary intervention therapy [11,12,13], and still lacks mature prenatal functional diagnostic methods. The existing shortcomings are reflected in three aspects: (1) Newborn screening can only achieve postpartum diagnosis, but neurological damage has already occurred during the fetal stage, missing the intrauterine intervention window; (2) traditional genetic testing only detects mutation sites and cannot assess residual enzyme activity or the true metabolic phenotype; there is genotype-phenotype dissociation, making it difficult to distinguish mild and severe subtypes and to guide individualized early intervention; (3) it cannot identify secondary fetal-origin PKU injury caused by abnormal maternal-fetal interactions. Therefore, developing non-invasive biomarkers for fetal PKU is a key breakthrough for achieving early screening, early diagnosis, and early intervention.
In this study, phenotypically normal Pah+/− pregnant mice were used to generate Pah−/− homozygous PKU-affected fetuses. This setup rules out intrinsic maternal effects and specifically mimics Pah-deficient fetuses. By analyzing maternal urine of pregnant mice, we intended to capture systemic maternal molecular responses elicited by pathological fetuses at the maternal-fetal interface and track dynamic changes in the urinary proteome throughout pregnancy. The Pah−/− knockout mouse model completely lacks PAH protein, can reproduce core pathological phenotypes of severe PKU such as hyperphenylalaninemia, neurotransmitter depletion, and myelin damage, and is widely used in preclinical PKU research [10,14,15].
2. Materials and Methods
2.1. Experimental Animals and Model Establishment
A total of 15 wild-type C57BL/6J male mice, 15 HE (Pah+/−) male mice, and 30 HE (Pah+/−) female mice, aged 10–12 weeks and of SPF grade, were selected. The mice were purchased from Shanghai Model Organisms Center, Inc. (Shanghai, China). The animal license number was SCXK (Beijing) 2024-0003. All mice were housed in an SPF animal room at 22–25 °C and 50–60% humidity under a 12 h/12 h light/dark cycle, with free access to food and water. All experimental procedures were reviewed and approved by the Ethics Committee of the College of Life Sciences, Beijing Normal University, with the approval number CLS-AWEC-B-2024-009. After 1 week of acclimatization, the experiments were initiated.
Experimental Grouping: Normal pregnant mice carrying Pah-KO phenylketonuria (PKU) fetuses were assigned to the experimental group (PKU-fetus-carrying dams, PKU-D; normal maternal phenotype), whereas normal pregnant mice carrying normal fetuses were assigned to the control group (control pregnant dams, C-D).
PKU-D: Pah+/− female mice × Pah+/− male mice. The offspring may include Pah+/+ (WT), Pah+/− (heterozygous, HE), and Pah−/− (homozygous, HO) mice, with Pah−/− mice being PKU fetuses.
C-D: Pah+/− female mice × Pah+/+ (WT) male mice. The offspring include only WT and HE mice.
Mating was performed daily at 18:00 by co-housing females and males at a female-to-male ratio of 2:1. Vaginal plugs were examined at 8:00 the following morning, and the day when a plug was observed was recorded as gestational day 0.5.
2.2. Urine Sample Collection
The sampling time points were Day 1, Day 3, Day 5, Day 7, Day 9, Day 11, Day 13, Day 15, Day 17, and Day 19. On each sampling day, from 20:00 to 8:00 the next morning, each pregnant mouse was placed individually in a separate metabolic cage overnight for urine collection; the urine volume collected from a single mouse per collection was ≥500 μL. After collection, urine samples were centrifuged at 4 °C and 3000 rpm for 10 min to remove cell debris and impurities. The supernatant was aliquoted into cryovials and stored at −80 °C, and repeated freeze–thaw cycles were strictly avoided.
2.3. Genotyping of Offspring Mice
Tail tissue was clipped from newborn mice and lysed overnight with proteinase K in a metal bath at 56 °C. Genomic DNA was obtained through DNA binding, washing, and elution. Three-primer PCR amplification was performed in a 20 μL total reaction system containing 0.5 μL each of P1/P2/P3 primers, 10 μL of 2× TransDirect Mouse Genotyping SuperMix, 2 μL of template DNA, and 6.5 μL of ddH2O. The PCR program was as follows: initial denaturation at 94 °C for 3 min; 34 cycles of 94 °C for 30 s, 60 °C for 30 s, and 72 °C for 30 s; and final extension at 72 °C for 5 min. PCR products were separated by 1% agarose gel electrophoresis at 120 V for 30 min and then imaged. Interpretation criteria were as follows: The single primer set can distinguish three genotypes by amplifying products of different sizes for wild-type and knockout alleles. WT showed only a 380 bp band; HE showed two bands at 380 bp and 644 bp; HO showed only a single 644 bp band.
2.4. Sample Processing
Protein extraction: Urine samples were thawed at 4 °C and centrifuged at 12,000 g for 10 min at 4 °C. The supernatant was collected, and prechilled anhydrous ethanol was added at a volume ratio of 1:3, followed by precipitation at −20 °C for 12 h. After centrifugation at 12,000 g for 30 min at 4 °C, the supernatant was discarded. The pellet was dried and resuspended in lysis buffer, sonicated for 3 min, rotated at 4 °C for 2 h, and the protein concentration was determined by the Bradford method.
Protein digestion: A total of 100 μg protein was diluted to 200 μL with NH4HCO3. DTT was added to a final concentration of 20 mM, and the mixture was reduced at 37 °C for 1 h. After cooling, IAA was added to a final concentration of 50 mM, and alkylation was performed at room temperature in the dark for 30 min. Buffer exchange was performed using a 10 kDa ultrafiltration tube, followed by two washes with UA buffer and three washes with NH4HCO3. Trypsin was added at an enzyme-to-protein mass ratio of 1:50, and digestion was performed at 37 °C overnight. The peptide filtrate was collected by centrifugation at 14,000 g. Peptides were desalted using an HLB solid-phase extraction cartridge and stored at −20 °C after lyophilization.
2.5. LC-MS/MS Mass Spectrometry Analysis
The lyophilized peptides were dissolved in 0.1% formic acid, and peptide concentration was determined using a bicinchoninic acid (BCA) protein assay kit (Thermo Fisher Scientific, Waltham, MA, USA). All samples were diluted to 0.5 μg/μL. A 10 μL aliquot of the diluted sample was centrifuged at 12,000 g and 4 °C for 30 min, and the supernatant was collected and spiked with 1 μL IRT. Proteomic analysis was performed in 96-well plates. Three intra-plate QCs were set up per plate, prepared by mixing equal amounts of 10 randomly selected digested samples from that plate; meanwhile, a pooled quality control sample, QCmix, was prepared as an equal mixture of all digested samples, and these were used for intra-plate and overall experimental quality control, respectively.
The entire detection platform consisted of an UltiMate 3000 nano-liquid chromatography system coupled with an Orbitrap Exploris 480 high-resolution mass spectrometer (Thermo Fisher Scientific, Waltham, MA, USA). An integrated C18 capillary column (75 μm inner diameter, 50 cm length) was used, with the column temperature maintained at 60 °C. The elution flow rate was 1.5 μL/min, and the linear gradient elution program with acetonitrile (containing 0.1% formic acid) was as follows: the organic phase proportion increased from 5% to 20% within 15.5 min, from 20% to 30% within 5 min, to 50% within 1 min, rapidly to 90% within 0.1 min and maintained for 1.3 min, and finally decreased to 5% within 0.1 min, followed by equilibration for 2 min. Mass spectrometry data were acquired in positive ion mode using data-independent acquisition (DIA): the full MS scan resolution was 120,000, the AGC target was 300%, the maximum ion injection time was 50 ms, and the scan mass-to-charge ratio range was 350–1200 m/z; the DIA MS2 scan resolution was 30,000, the AGC target was 200%, the maximum ion injection time was 50 ms, and the higher-energy collisional dissociation (HCD) collision energy was 30%.
2.6. Data Searching
The raw DIA data were imported into Spectronaut (version 19.0; Biognosys AG, Schlieren, Switzerland) and searched against the Swiss-Prot mouse database. Trypsin/P was used for digestion, with up to 2 missed cleavages allowed. The peptide length was set to 7–52 amino acids. Carbamidomethylation of cysteine was set as a fixed modification. Variable modifications included protein N-terminal acetylation and methionine oxidation. The false discovery rate (FDR) was ≤1% at both the peptide and protein levels. Protein quantification abundance was calculated as the sum of the fragment ion peak areas of all matched peptides.
2.7. Data Analysis
Missing value filtering was performed on the protein quantification matrix of all urine samples covering the ten gestational time points from Day 1 to Day 19. Proteins with a missing rate > 50% in both groups were removed. For retained proteins, missing values with a missing rate > 50% within a single group were filled with half of the minimum detected intensity of that protein in the respective group; the remaining missing values were imputed using the KNN algorithm. Differentially expressed proteins were screened independently at each individual gestational time point using the following criteria: fold change (FC) ≥ 1.5 or ≤0.67 and two-tailed unpaired t-test p value < 0.05. For each time-point comparison, samples were obtained from distinct, independent pregnant dams in the PKU-D and C-D groups, satisfying the statistical assumption of independent observations for unpaired testing. Longitudinal repeated samples collected from the same pregnant dam across multiple gestational days were not pooled or included in any t-test comparisons; these temporal repeated measurements were reserved for subsequent temporal dynamic characterization and machine-learning analyses. In addition, group-specific protein screening rules were established: ① proteins with a missing rate > 50% in both groups were excluded; ② a detection rate ≥ 50% in at least one group; ③ ≤2 samples detected in one group and a detection rate > 50% in the other group. Such specific proteins are difficult to identify by conventional differential analysis.
From these cross-time-point differentially expressed proteins, key PKU-associated proteins were selected. Criteria: (1) differentially expressed between PKU-D and C-D at ≥one gestational time point; (2) reported in the literature to relate to PKU, hyperphenylalaninemia or neurodevelopment, covering phenylalanine metabolism, BH4 metabolism, neurotransmitter synthesis, oxidative stress, mitochondrial function and myelination. These proteins were categorized as “directly related” (core pathway enzymes) or “strongly related” (downstream responsive proteins).
2.8. Bioinformatics and Statistical Analysis
Functional enrichment analysis: GO/KEGG functional enrichment of differentially expressed proteins was performed using the DAVID database and visualized with SRplot (https://www.bioinformatics.com.cn/srplot, accessed on 1 September 2026), and the top 15 enriched terms were extracted for each time point.
WGCNA: The log2-transformed protein quantification matrix of the full dataset was used to construct a scale-free co-expression network with scale-free R2 > 0.8. Hierarchical clustering combined with dynamic tree cutting was used to divide modules. Module membership (kME) was calculated for each protein as the Pearson correlation between its expression profile and the module eigengene. Proteins ranked in the top 20 by kME within each module were defined as hub proteins (kME ≥ 0.5–0.77 across modules, with the highest kME values ≥ 0.72–0.90). kME were calculated and subjected to Pearson correlation analysis with gestational time and maternal pregnancy group (PKU-D or C-D, indicating whether the dam carried Pah−/− PKU-affected fetuses).
Biomarker screening: Two complementary screening strategies were used: early-stage-specific screening (using 64 samples from Day1/Day3/Day5) and cross-time-point universal screening (using all 202 samples). Both employed an intersection strategy of LASSO-penalized logistic regression (5-fold stratified cross-validation, binomial deviance scoring, lambda.1se criterion) and random forest (n_estimators = 500) to reduce false positives associated with a single method. LASSO regression shrinks the coefficients of irrelevant features to zero via an L1 penalty and has been widely used in biomarker screening of high-dimensional omics data, including the construction of urine metabolite- and gene-based diagnostic models for pregnancy diseases such as preeclampsia [16,17].
Statistical software and visualization: Statistical analyses were performed using R (v4.3.1) software and Python (v3.12.11). Protein abundance trend clustering analysis, sample correlation heatmaps, protein abundance trend plots, biomarker–mechanism correlation heatmaps, and STRING interaction network plots were generated using tools such as ggplot2 (v3.5.1), ComplexHeatmap (v2.20.0), and matplotlib (v3.11.0). p < 0.05 was considered statistically significant. Abbreviations used in the figures: DEPs, differentially expressed proteins; LOO, leave-one-out cross-validation; PPI, protein–protein interaction; Mfuzz, soft clustering of time-series expression data; ROC, receiver operating characteristic; AUC, area under the receiver operating characteristic curve; CV, coefficient of variation.
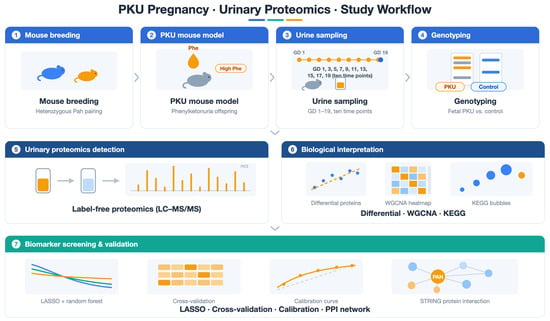
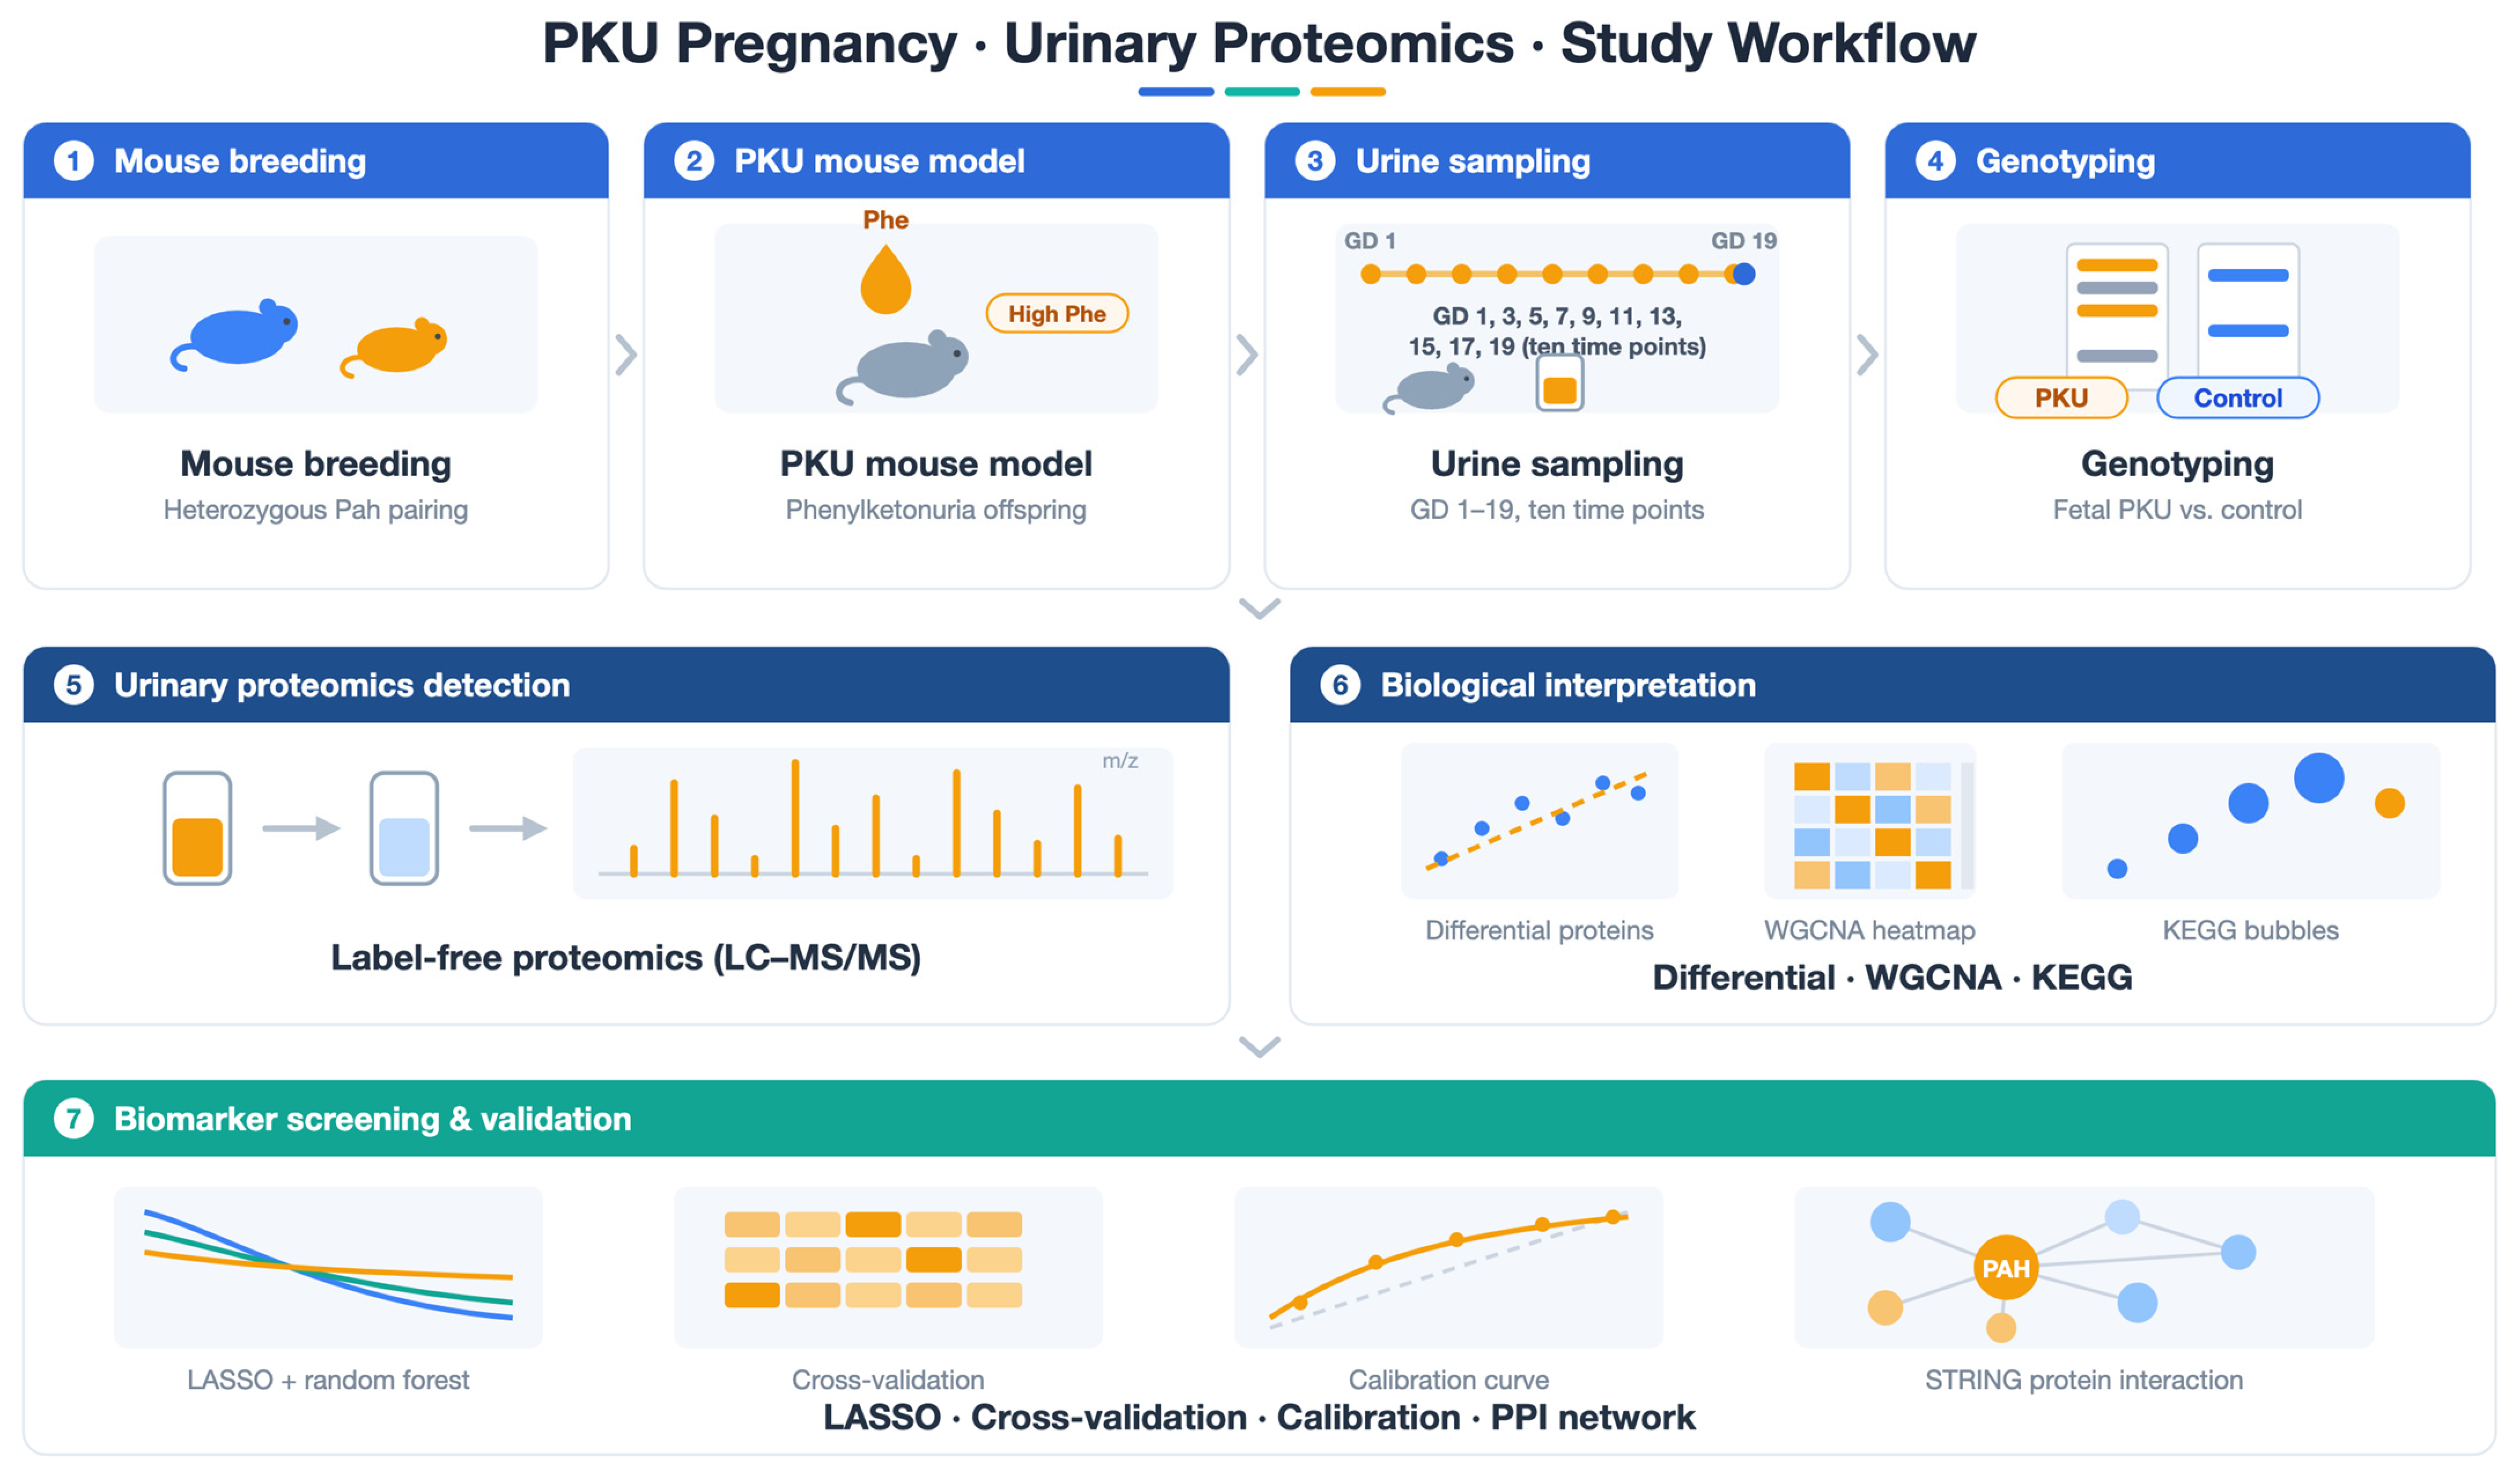
The overall workflow of this study, including animal breeding, sample collection, proteomic profiling and bioinformatic analyses, is summarized in Scheme 1.
Scheme 1.
Schematic overview of the study workflow for maternal urinary proteomic screening in fetal PKU mouse pregnancy.
3. Results
3.1. Genotyping Results of Offspring
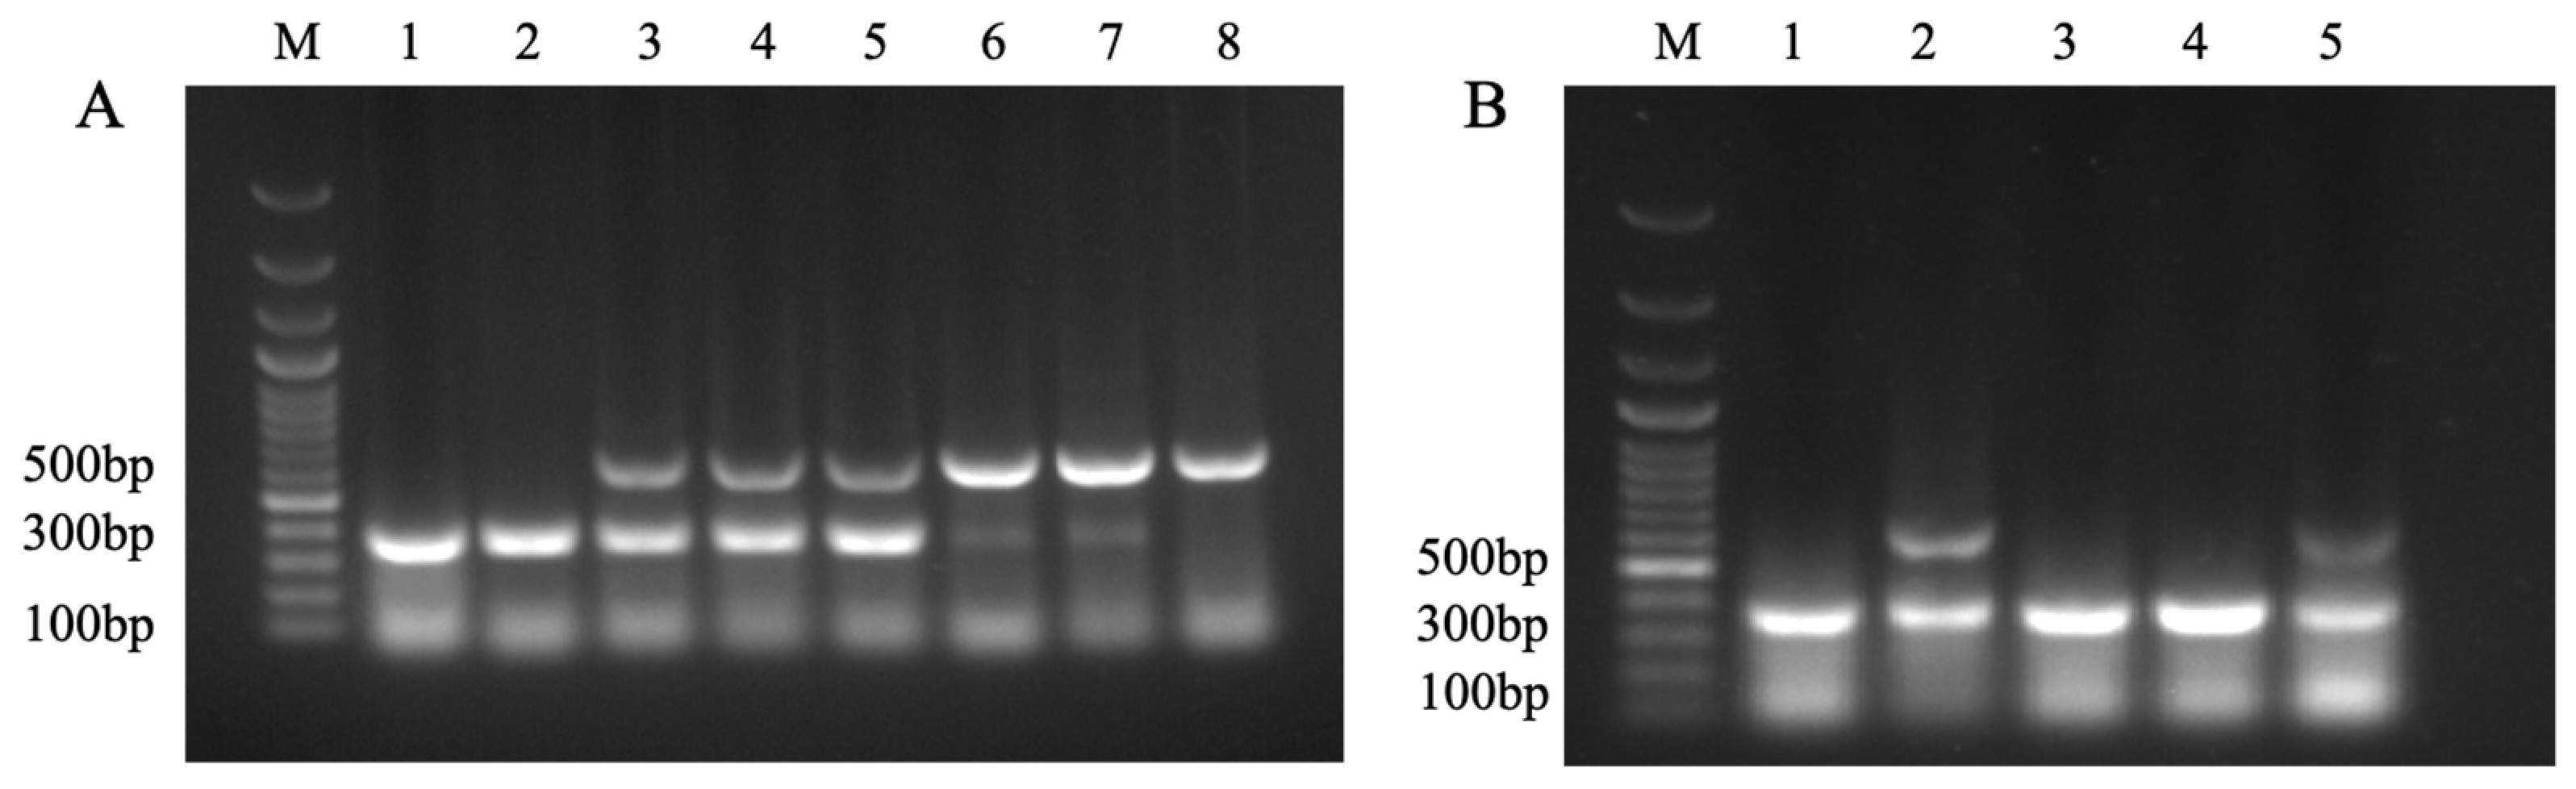
Genotyping of offspring from the PKU-D and C-D groups was performed by 1% agarose gel electrophoresis (Figure 1) to ensure that at least one HO offspring was present in the PKU-D group. The amplified fragment for WT was 380 bp; HE showed both 380 bp and 644 bp bands; and HO showed only a 644 bp band. The results showed that WT, HE, and HO genotypes were all detectable among the offspring of the experimental group, whereas only WT and HE were detected among the offspring of the control group, with no HO individuals observed. The overall fetal genotype distribution across all experimental litters did not strictly follow the classic Mendelian 1:2:1 segregation ratio. However, each litter from the experimental mating strategy yielded at least one HO (Pah−/−) fetus, which fulfilled the core requirement of our study design. The electrophoretic band sizes completely matched the genotyping criteria, indicating that the breeding system in this study can stably produce PKU offspring and corresponding controls, thereby providing a reliable animal model foundation for urinary proteomics research on fetal-origin phenylketonuria.
Figure 1.
PCR genotyping of the Pah gene in offspring mice detected by 1% agarose gel electrophoresis. M: DNA Marker; (A) Offspring from the PKU-D: bands 1/2 are WT, bands 3–5 are HE, and bands 6–8 are HO; (B) Offspring from C-D: bands 1/3/4 are WT, and bands 2/5 are HE.
3.2. Phenotype Identification Results of Offspring
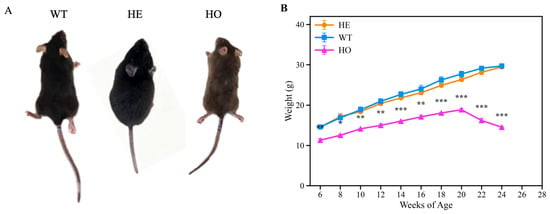
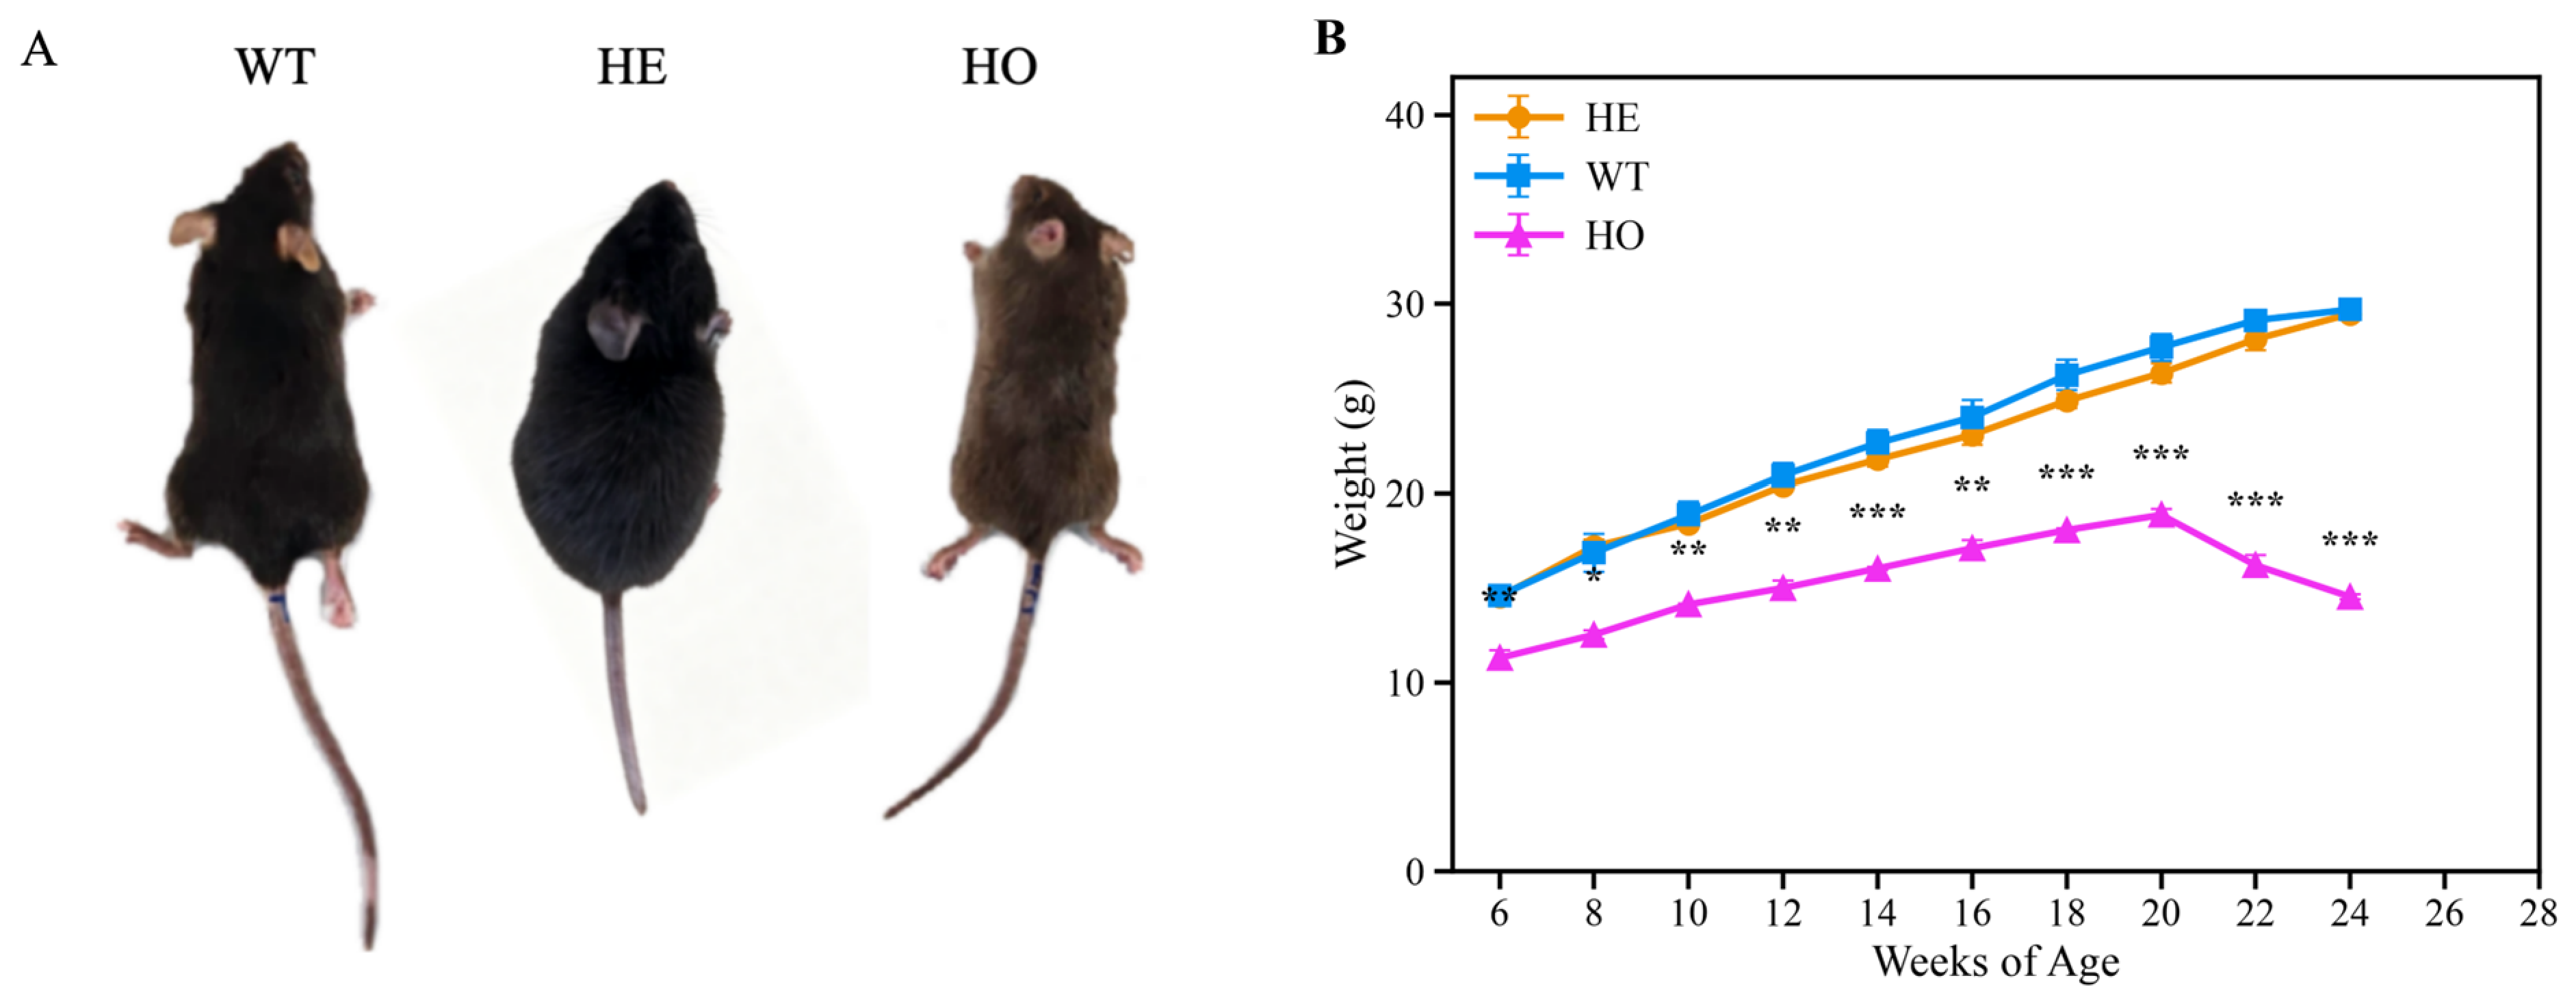
The gross phenotype and body weight of offspring mice with different genotypes from the PKU-D and C-D groups were recorded (Figure 2). In terms of appearance, WT and HE mice had black coat color, whereas HO mice exhibited markedly lighter gray coat color, which is associated with insufficient tyrosine supply and impaired melanin synthesis [10,18]. Regarding body weight, male WT and HE mice showed steady growth from 6 weeks of age, with similar body weights between the two groups, whereas HO homozygotes exhibited growth retardation, and their body weight was significantly lower than that of the WT and HE groups. Statistical analysis confirmed these observations: the body weight of HO mice was significantly lower than that of WT mice at every measured time point from 6 to 24 weeks of age (two-tailed unpaired Student’s t-test; * p < 0.05, ** p < 0.01, *** p < 0.001, as annotated in Figure 2B), and also significantly lower than that of HE mice at every time point (p < 0.01), whereas WT and HE mice did not differ significantly at any time point (p > 0.05). The above phenotypes of coat color lightening and growth retardation are consistent with the characteristic manifestations of PKU model mice, further supporting the successful establishment of the experimental model.
Figure 2.
Gross phenotype and body weight growth curve of Pah-KO mice. (A): WT and HE mice had similar appearance with black coat color, whereas HO mice exhibited coat color lightening. (B): Body weight change curves of male mice (n = 3 per genotype) from 6 to 24 weeks of age. Data are presented as mean ± SEM. The body weight of HO mice was significantly lower than that of WT mice at every measured time point (two-tailed unpaired Student’s t-test): * p < 0.05, ** p < 0.01, *** p < 0.001. HO mice also weighed significantly less than HE mice at every time point (p < 0.01), whereas WT and HE mice did not differ significantly at any time point (p > 0.05).
3.3. Proteomic Results
3.3.1. Model Construction and Sample Collection
The pregnancy rates and total gestation duration of the two groups of pregnant mice showed no significant differences (p > 0.05). In the control group, 12 mating pairs were successfully mated, and in the experimental group, 10 mating pairs were successfully mated. No miscarriage or death of dams occurred during the experimental period.
3.3.2. Overall Changes in the Urinary Proteome During Pregnancy
In this study, a total of 218 urine samples were collected from pregnant mice in the experimental group (n = 10) and the control group (n = 12) during gestation (Day 1–19). Across all samples (Table 1 and Table S1, Figure 1A), a total of 2591 proteins were identified (FDR < 1.0%), with an average of 1128 proteins per sample. After quality control screening, 202 samples were used for subsequent analysis (16 samples were excluded due to insufficient protein concentration).
Table 1.
Urine protein identification results.
3.3.3. Quality Control of the Mass Spectrometry Platform
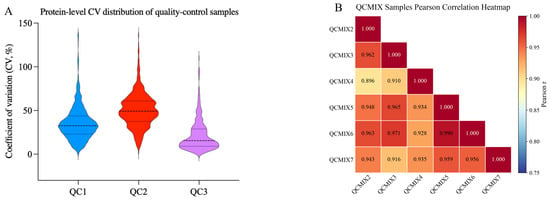
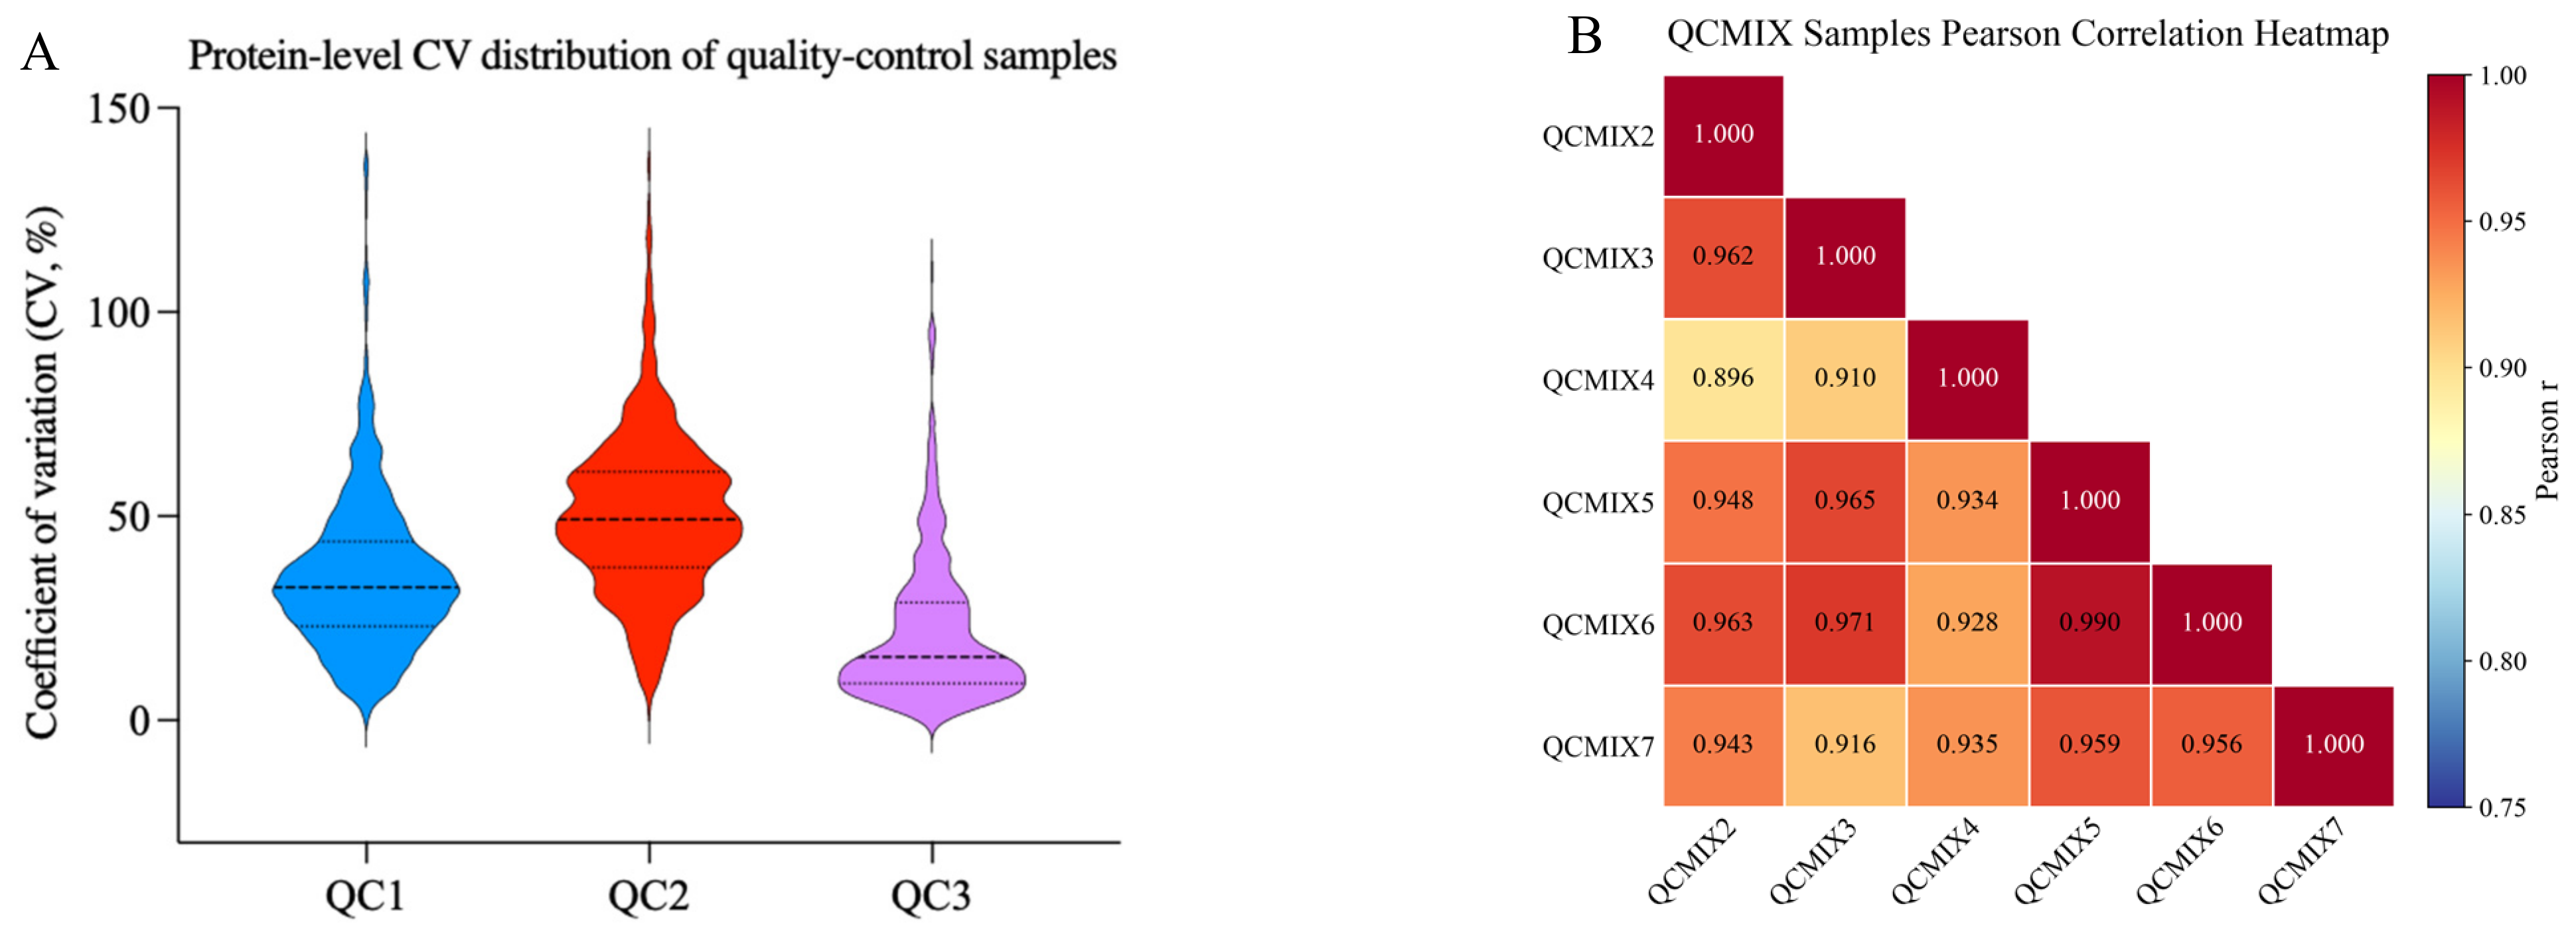
To evaluate the technical reproducibility of the mass spectrometry-based proteomics experiments, the coefficient of variation (CV) of protein signal intensities in intra-plate quality control (QC) samples was calculated. As shown in Figure 3A, the median protein-level CVs of the intra-plate QC samples QC1–QC3 were 31.2%, 48.5%, and 15.7%, respectively, and the CVs of the vast majority of proteins were below 50%. The Pearson correlation coefficients among QCmix replicate samples ranged from 0.89 to 0.97 (Figure 3B, Table S2). These results demonstrate that the technical reproducibility of the entire DIA proteomic detection system is reliable.
Figure 3.
Distribution of protein-level coefficient of variation (CV) in QC samples. (A) Violin plots show the distribution of the coefficient of variation (CV, %) of protein signal intensities for the three intra-plate QC samples (QC1–QC3). The solid black line inside each violin indicates the median CV, and the dashed lines denote the 25th and 75th quartiles. (B) Pearson correlation heatmap of protein signal intensities among the seven QCMIX samples (QCMIX1–QCMIX7); the Pearson r value is shown in each cell. Lower CV values indicate better technical reproducibility of proteomic measurements.
3.3.4. Distribution of Differential Proteins at Different Gestational Time Points
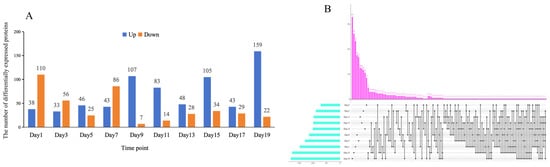
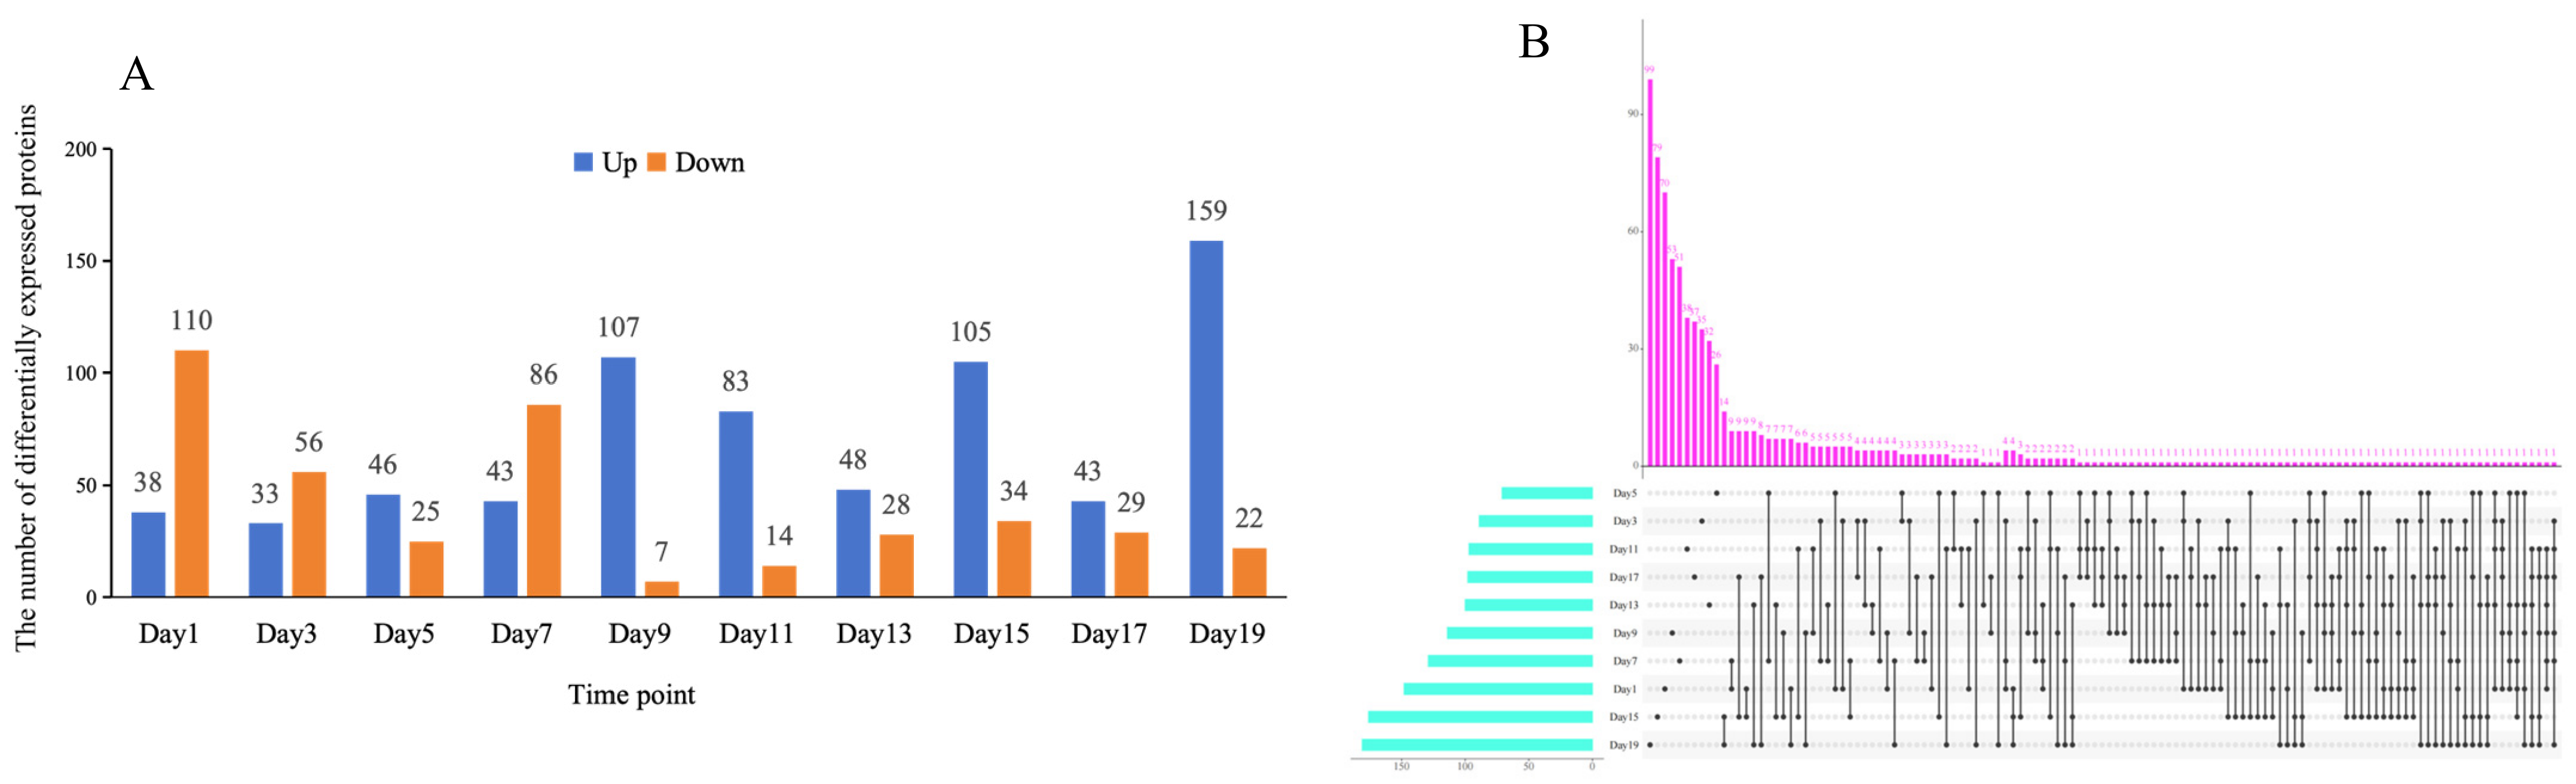
We first analyzed the distribution characteristics of differential proteins at different gestational time points. Figure 4 depicts the dynamic differential distribution characteristics of the urinary proteome during pregnancy between pregnant rats carrying PKU offspring and those carrying normal offspring. At each time point, the numbers of up- and down-regulated differential proteins exhibited strong temporal fluctuations: early pregnancy was dominated by down-regulated proteins; as pregnancy progressed, the number of down-regulated proteins gradually decreased; after Day 9, up-regulated proteins predominated, and the number of up-regulated proteins peaked at Day 19. UpSet intersection analysis suggested that most differential proteins were single-time-point-specific changes, with only a few proteins commonly differentially expressed across multiple gestational stages. This indicates that the maternal perturbation caused by fetal-origin PKU is highly temporally dynamic, and maternal response patterns differ markedly across different gestational weeks.
Figure 4.
Distribution characteristics of differential proteins in maternal urine from gestational Day 1 to Day 19: (A) Bar chart of the number of differential proteins at each gestational week: blue represents significantly up-regulated proteins, and orange represents significantly down-regulated proteins; (B) UpSet plot of differential protein intersections: the horizontal bars on the left indicate the total number of differential proteins for a single gestational week, the vertical bars at the top indicate the total number of proteins in the corresponding intersection set, and the dot-line connections represent the differential proteins shared by the corresponding combinations of gestational weeks.
3.3.5. Permutation Test to Verify the Reliability of DEPS
To rule out the possibility that the differential protein combinations arose randomly, we performed random combination simulations for the differential proteins at each time point (Day 1–Day 19). Specifically, for each time point, we randomly selected the same number (n) of proteins from the m differential proteins to form random combinations, and calculated the random generation probability—the probability that a random combination performed as well as or better than the observed combination. A lower probability indicates a lower likelihood of random generation and stronger biological relevance. As shown in Table 2, 9 of the 10 time points (Day 1, 3, 5, 7, 11, 13, 15, 17, and 19) had very low random generation probabilities (0.04–0.06), suggesting that the differential protein combinations at most time points were not randomly generated and had statistical significance and potential biological relevance.
Table 2.
Validation of the non-randomness of DEPS combinations across ten gestational time points.
3.3.6. Temporal Detection Characteristics of PKU Differential Proteins
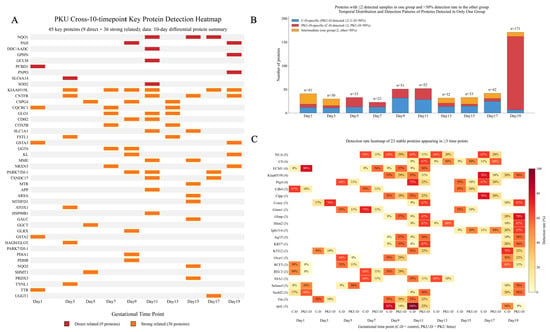
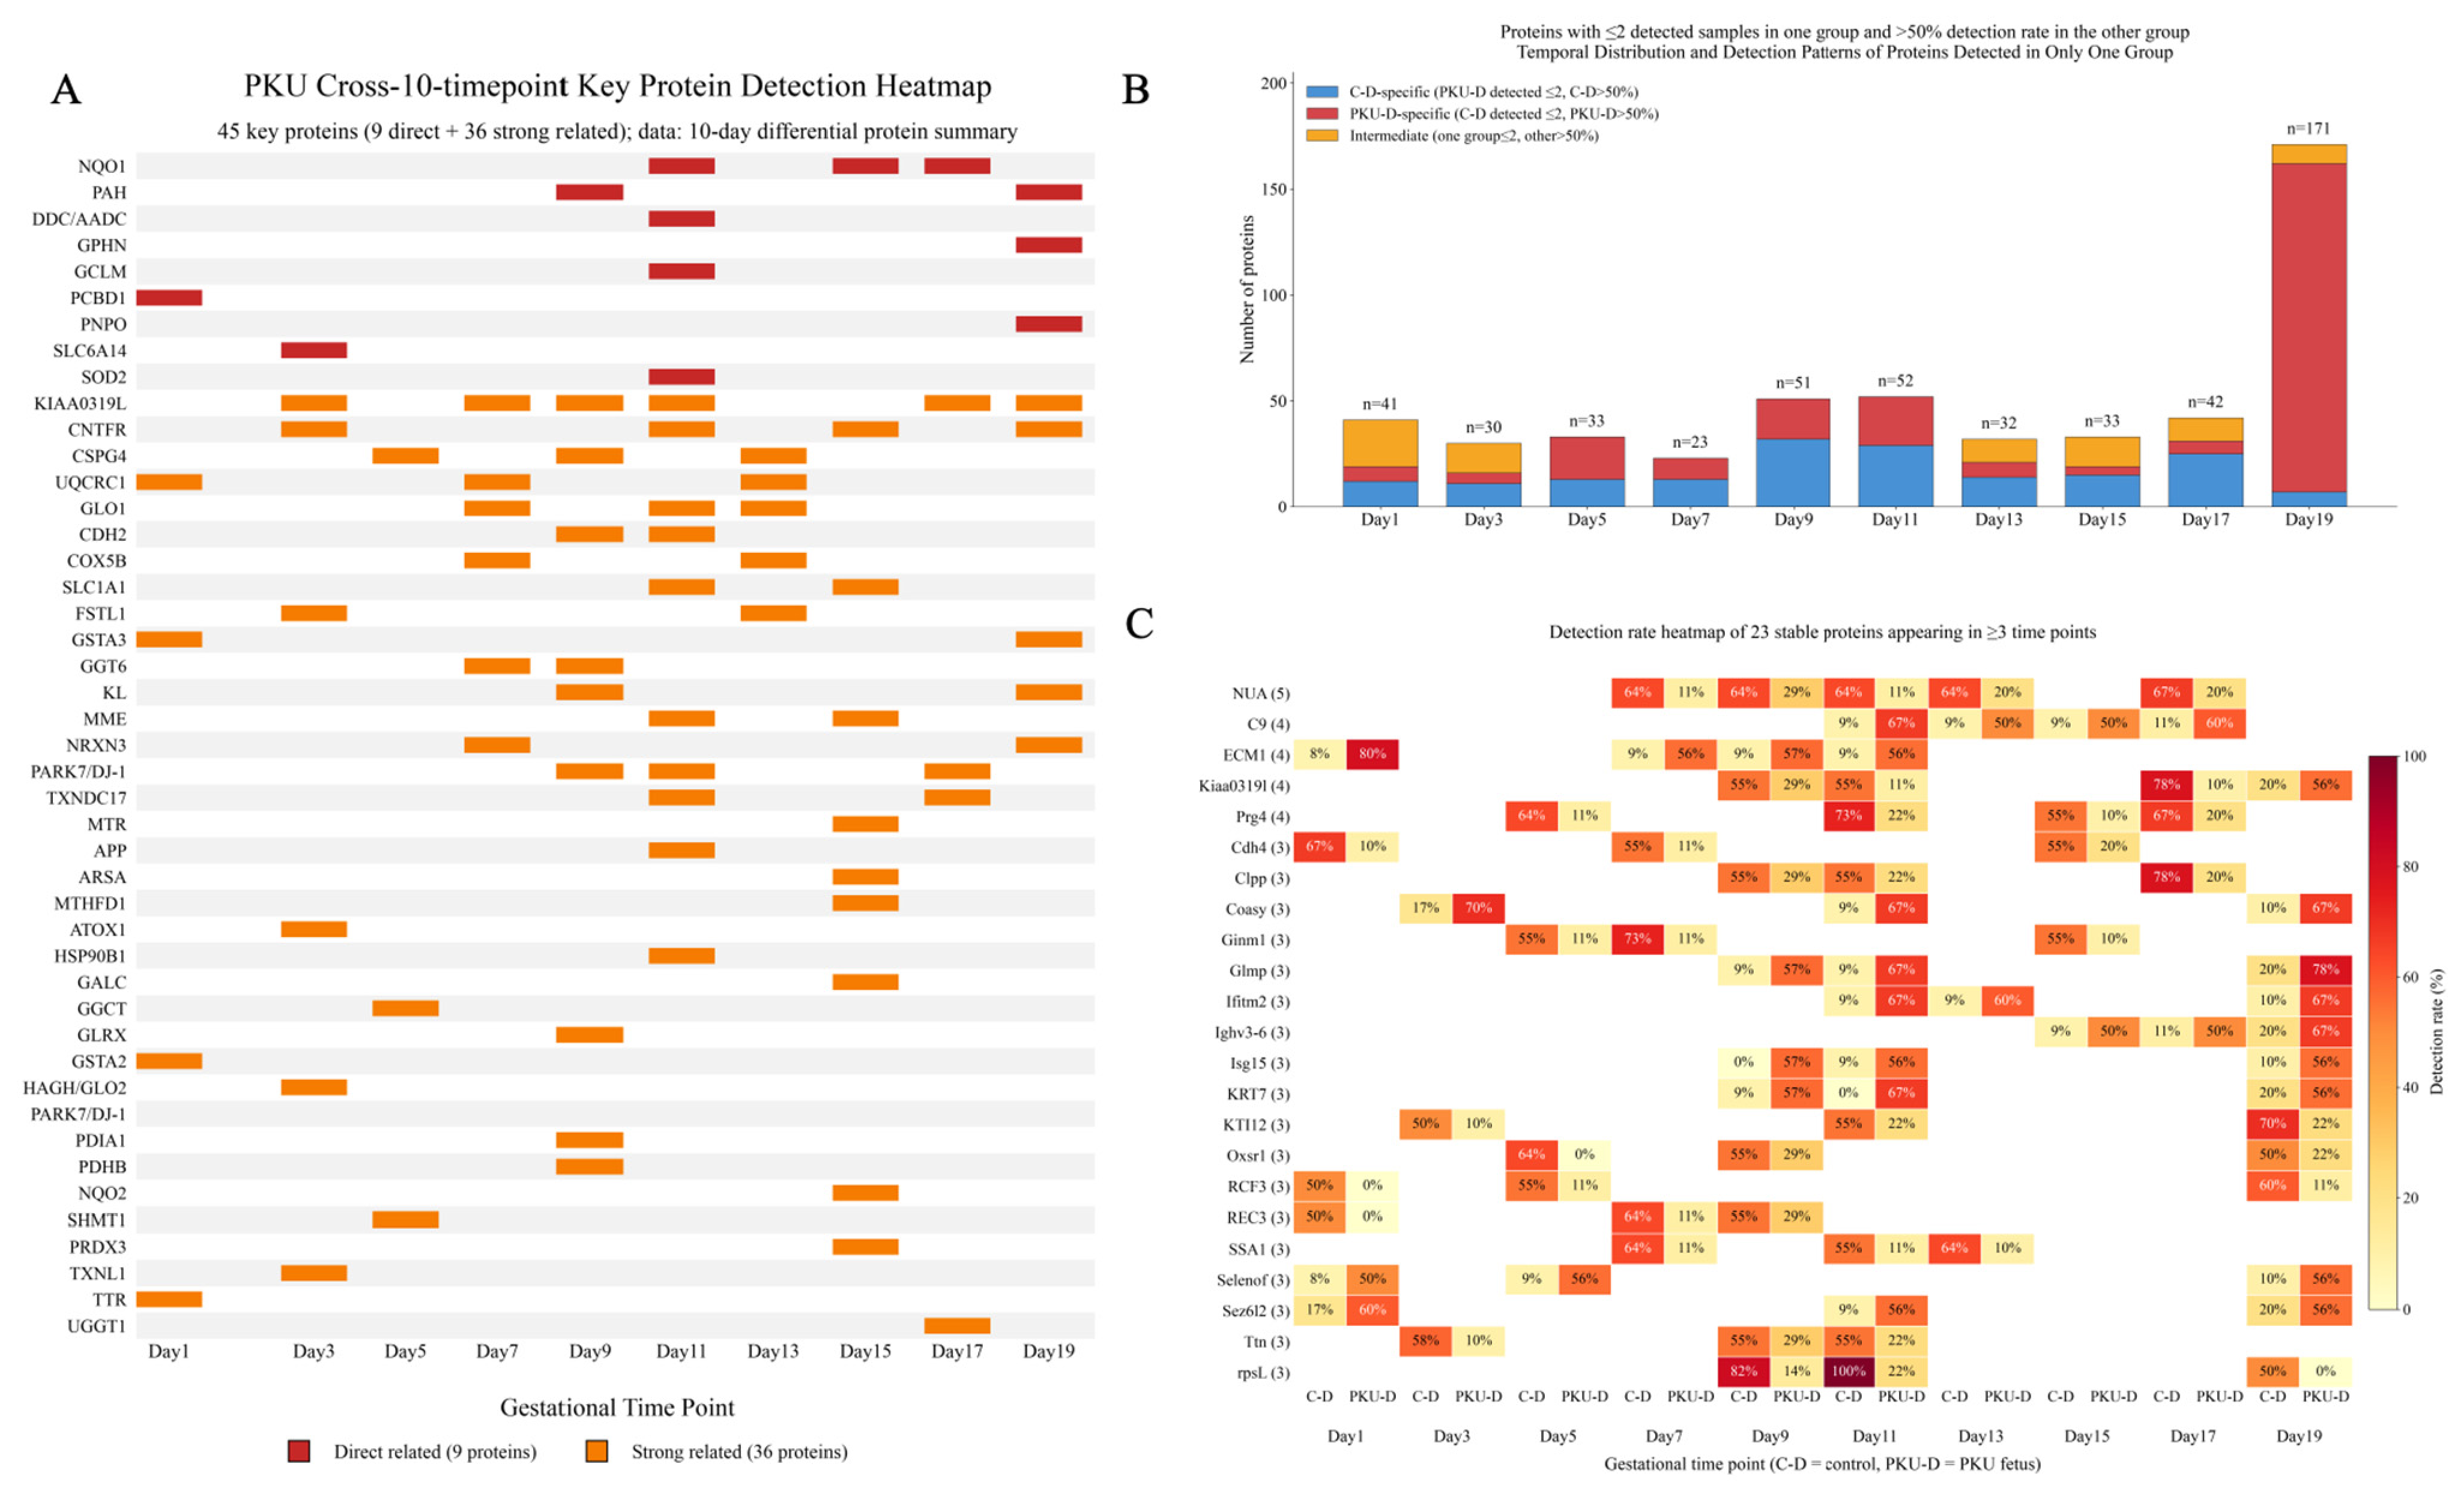
Having defined the distribution features of differentially expressed proteins at each gestational time point, we further analyzed the temporal detection patterns of PKU-associated differentially expressed proteins across ten time points from gestational day 1 to day 19 (Figure 5, Table S3). Figure 5A shows 45 key PKU proteins (9 directly related + 36 strongly related). Our observations suggest possible perturbation of pterin metabolism and amino acid transport in early pregnancy. On Day 1, PCBD1 (pterin-4α-carbinolamine dehydratase), a key enzyme in the BH4 regeneration cycle, was identified, together with significantly up-regulated TTR [19,20]; This early Day 1 molecular signature is correlative, and its biological interpretation remains speculative. on Day 3, the amino acid transporter SLC6A14, which uses L-phenylalanine as a substrate, was detected [21]; on Day 5, metabolic enzymes such as the GST family, GGCT, and SHMT1 were predominantly detected [22]; from Day 7 onward, the glyoxalase/glutathione detoxification system (GLO1, HAGH/GLO2) and mitochondrial respiratory chain proteins (UQCRC1, COX5B) appeared as a group, suggesting activation of the methylglyoxal–AGE–neurotoxicity axis and mitochondrial oxidative stress [23]; on Day 9, the directly causative PKU protein phenylalanine hydroxylase (PAH) was detected for the first time, accompanied by concentrated activation of ubiquitin–proteasome/ERAD components [6,24]; Day 11 was the time point with the densest antioxidant network; aromatic L-amino acid decarboxylase (AADC/DDC), GCLM, SOD2, and NQO1 were detected simultaneously, reflecting coupling between neurotransmitter synthesis and oxidative stress defense [9,22]; Day 13 was characterized by a mitochondrial energy metabolism cluster (ACADVL, UQCRC1, COX5B) and FSTL1; on Day 15, the myelin lysosomal lipid metabolism enzymes GALC and ARSA and the folate–methionine cycle enzymes MTR and MTHFD1 appeared in a concentrated manner, consistent with myelin formation defects and one-carbon metabolism disorders in PKU [6,25,26]; on Day 17, the endoplasmic reticulum glycoprotein quality control enzyme UGGT1 was detected [6]; on Day 19, PAH was detected again, and the pterin family bifunctional protein Gephyrin and the PLP synthase PNPO appeared; the product of PNPO, PLP, is precisely an essential cofactor of AADC, forming a cross-time-point evidence chain of “vitamin B6–neurotransmitter synthesis” [9,27,28]. Cross-stage stable proteins such as KIAA0319L, ECM1, and PRG4 can serve as priority candidates for temporal biomarkers. Figure 5B,C show 23 proteins stably and specifically detected between groups at ≥3 time points (e.g., NUA, C9, ECM1, PRG4), which are difficult to capture by conventional differential analysis; their functions involve oxidative stress, immune inflammation, myelin damage, neurodevelopment, and protein homeostasis, highly consistent with the core pathology of PKU [9,29].
Figure 5.
Heatmap of key PKU-associated proteins detected across ten time points and temporal distribution plus detection-rate heatmap of proteins detected exclusively in one group. (A) Detection profiles of 45 key proteins (9 directly related proteins in red, 36 strongly related proteins in orange) from Day 1 to Day 19, ranked by relevance. (B) Stacked bar charts across the ten time points (blue = C-D-specific, red = PKU-D-specific, orange = intermediate type). (C) Detection-rate heatmap of the 23 stable proteins identified in ≥3 time points for C-D and PKU-D groups.
3.3.7. KEGG Pathway and Protein–Protein Interaction Network Reveal a Coordinated Phenylalanine–One-Carbon Metabolism–Oxidative Stress Response
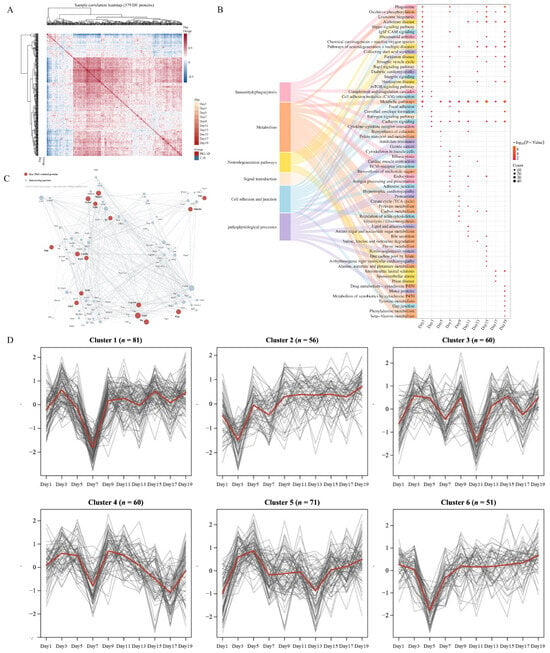
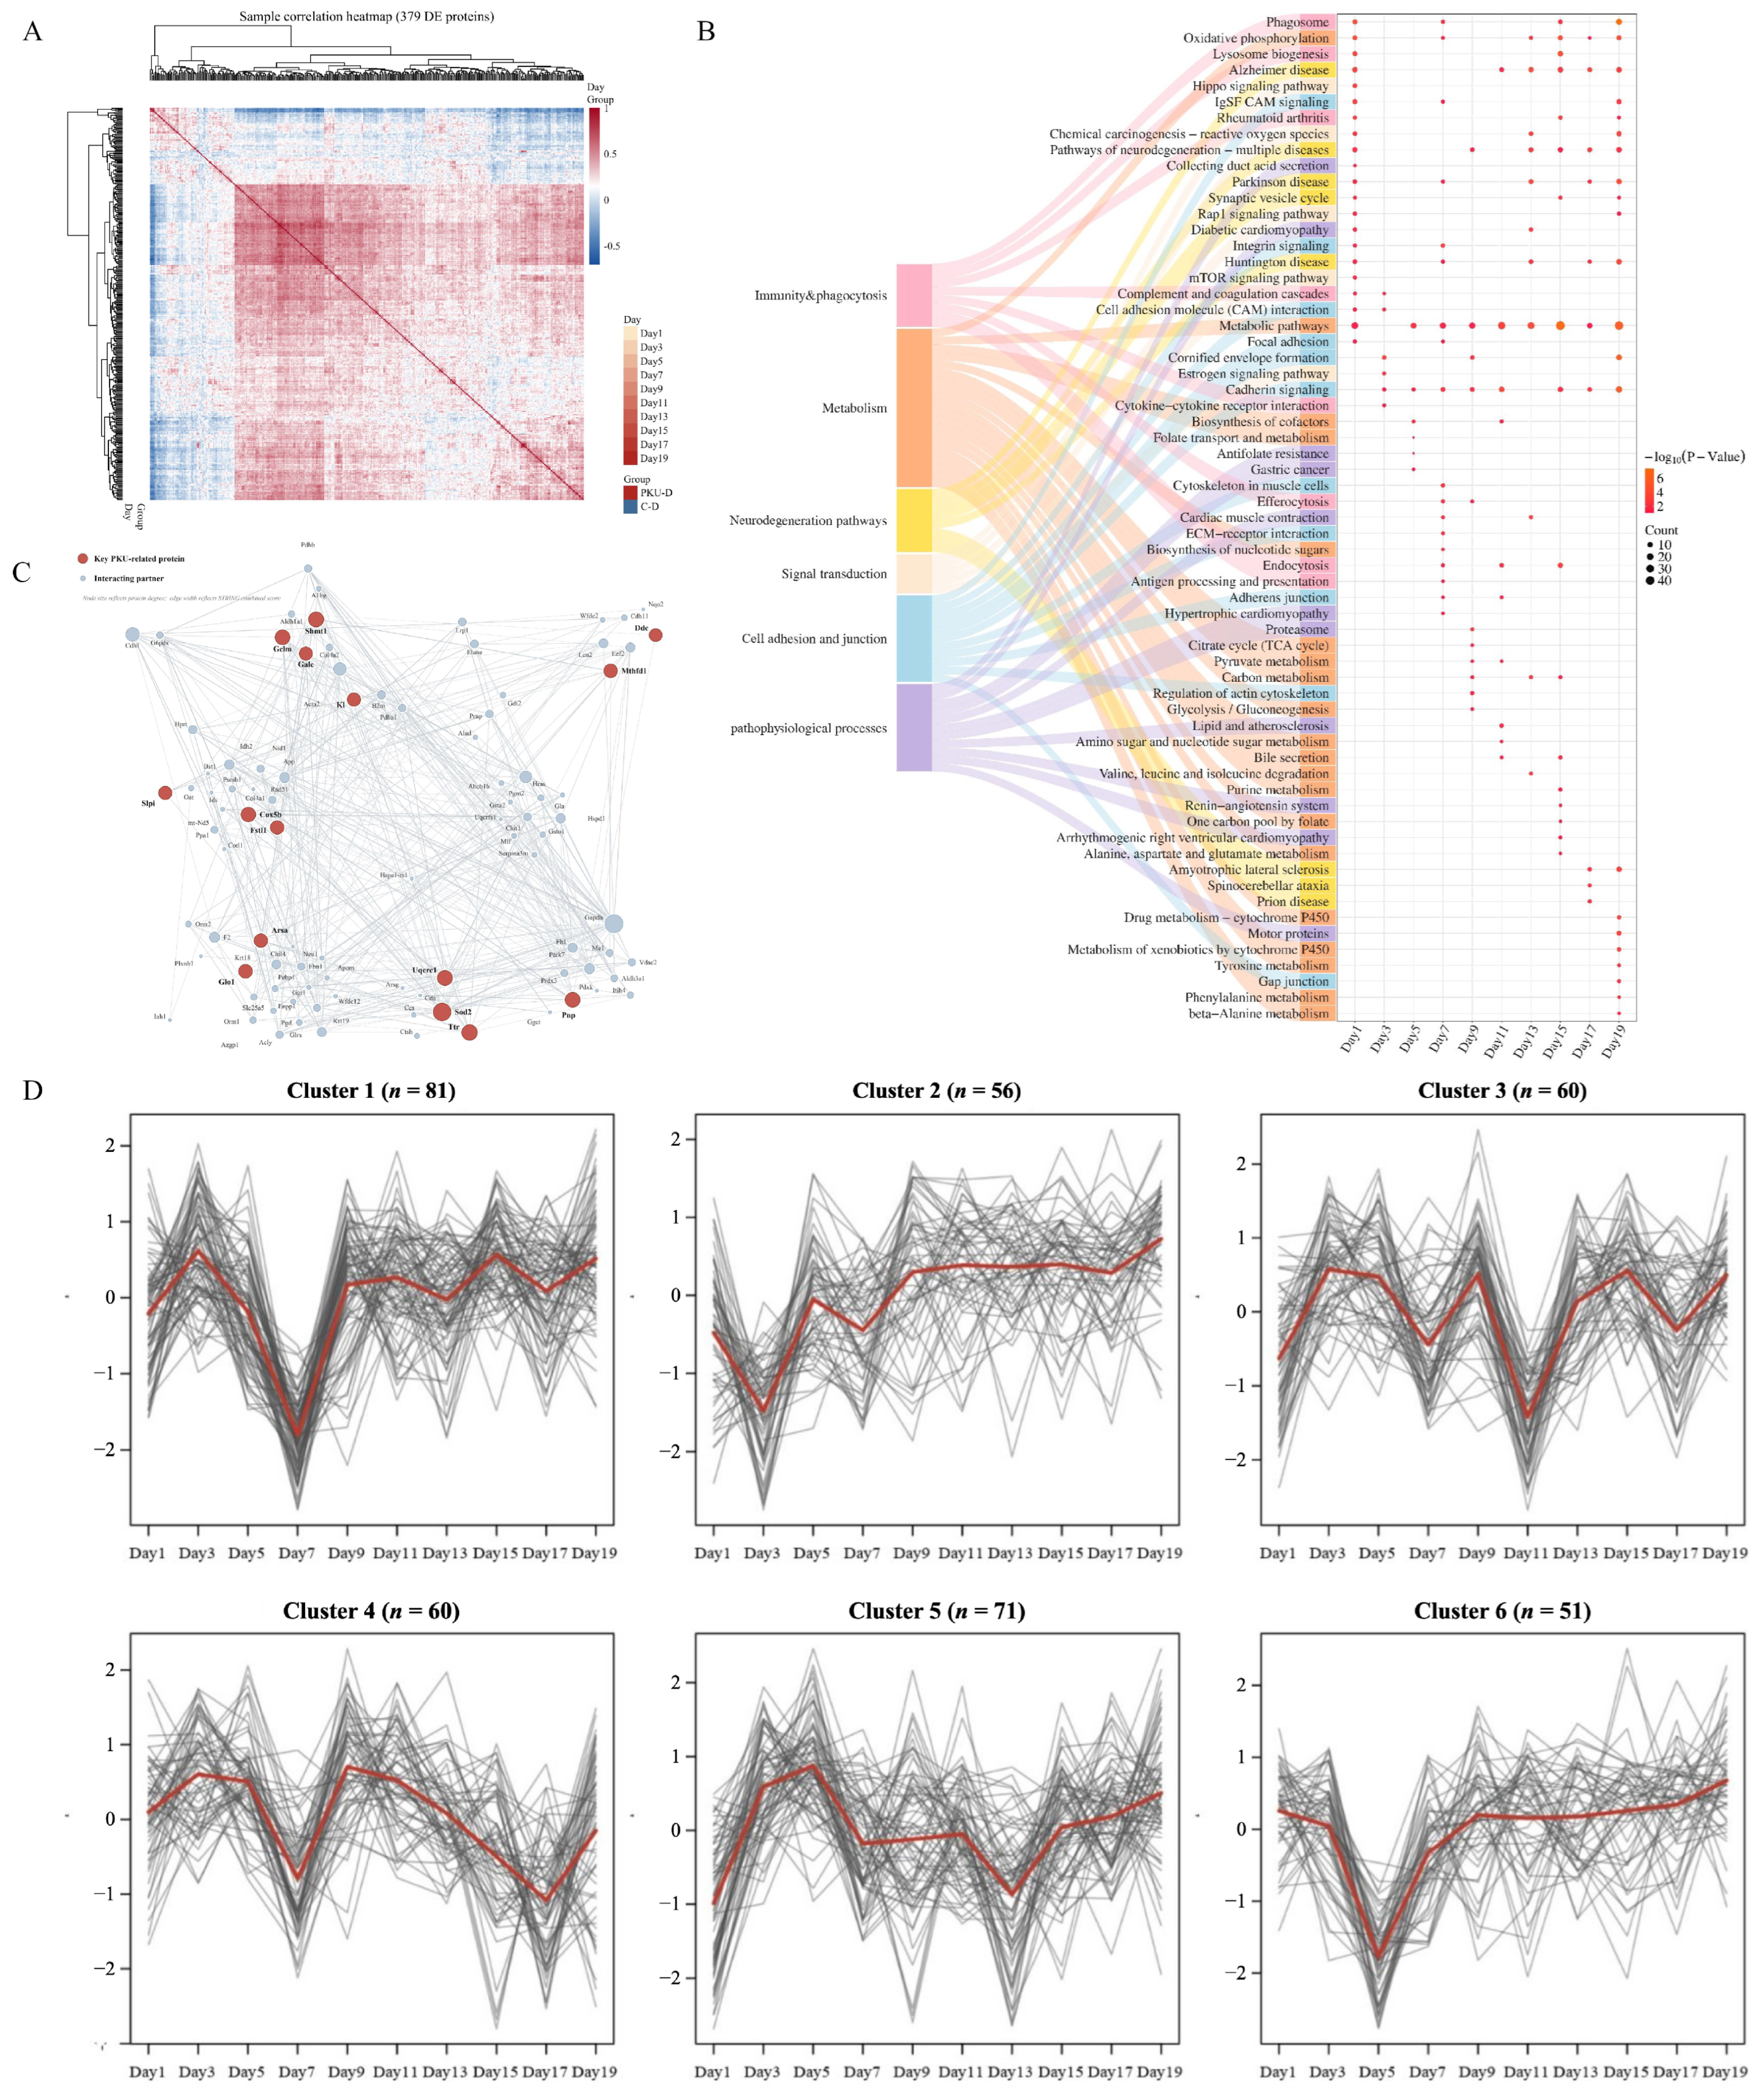
To comprehensively evaluate the differential characteristics of the gestational urinary proteome between the PKU-D and C-D groups, multidimensional integrative analysis was performed based on differential proteins from the 10 time points. The sample correlation heatmap showed high intra-group correlation and marked inter-group separation, with clear hierarchical clustering according to gestational day (Figure 6A). KEGG enrichment showed that differential proteins were mainly enriched in metabolism, immune phagocytosis, KEGG-annotated neurodegenerative disease-related pathways, signal transduction, and cell adhesion. (Figure 6B, Table S4). Phenylalanine metabolism and tyrosine metabolism pathways were significantly enriched in mid-to-late pregnancy, corroborating each other with the repeated detection of PAH on Day 9 and Day 19 and the temporal detection of the amino acid transporter SLC6A14 in early pregnancy, suggesting that the maternal metabolic response triggered by fetal PKU metabolic abnormalities gradually amplifies with advancing gestation [30,31]. ROS and oxidative phosphorylation pathways were significantly enriched, consistent with the brown and turquoise modules in WGCNA; these two modules contain core proteins for ROS scavenging and glyoxalase detoxification, such as SOD2, GLO1, and GCLM [32,33,34]. ARSA is related to myelin lipid homeostasis, and its enrichment peak on Day 11 coincided with the GO window of “response to oxidative stress, positive regulation of ROS metabolism,” suggesting coordinated initiation of antioxidant defense and myelin lipid metabolism in mid-pregnancy [35]. Synaptic vesicle cycle and neurodegenerative pathways such as Alzheimer’s, Parkinson’s, and Huntington’s diseases were significantly enriched, linking with the detection of AADC/DDC on Day 11 and the “vitamin B6–neurotransmitter synthesis” evidence chain, suggesting that maternal urine can capture fetal neurometabolic perturbations. In the STRING protein–protein interaction network (confidence score ≥ 0.4, Figure 6C), 14 key PKU differential proteins (SOD2, TTR, SHMT1, UQCRC1, GCLM, COX5B, MTHFD1, GLO1, ARSA, FSTL1, KL, GALC, SLPI, DDC, etc.) served as the core and formed interaction modules with proteins related to phenylalanine hydroxylation, one-carbon/folate metabolism, pterin metabolism, oxidative stress, neurotransmitter synthesis, and myelin lipid metabolism, suggesting that fetal PKU drives a coordinated maternal metabolic–oxidative stress–protein homeostasis network response [36,37]. Mfuzz (Figure 6D) classified the differential proteins into 6 trend clusters. For example, Cluster 4 (peak at D9, containing TTR) and Cluster 6 (valley at D5, containing PCBD1) corresponded to thyroxine transport and pterin regeneration, respectively, reflecting pathway activation windows at different gestational weeks and fully recapitulating the stage-specific maternal response to the metabolic burden of PKU fetuses [38]. In summary, PKU fetuses can leave multidimensional, dynamic, and discriminable proteomic imprints in maternal urine, and proteins related to metabolic remodeling, oxidative stress, and neurotransmitter synthesis constitute the core response module [8,39,40,41].
Figure 6.
Overall compositional analysis of DEPs in the gestational urinary proteome of PKU-D vs. C-D. (A): Sample correlation heatmap based on differential proteins from ten time points (annotated by Day and Group). (B): KEGG pathway enrichment plot of DEPs. (C): STRING PPI core network (red: PKU-related key proteins; gray: interaction partners; edge thickness ∝ confidence). (D): Mfuzz time-series clustering of DEPs. All analyses compare urinary proteomes between PKU-carrying and control pregnant mice.
3.3.8. WGCNA Co-Expression Network Analysis Reveals the Maternal Systemic Metabolic Response to Fetal-Origin PKU
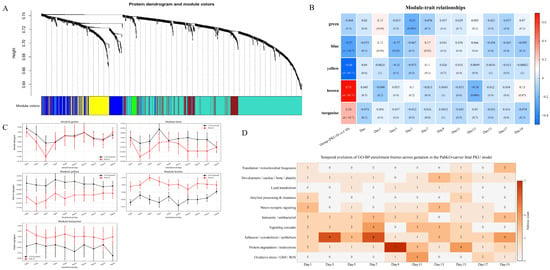
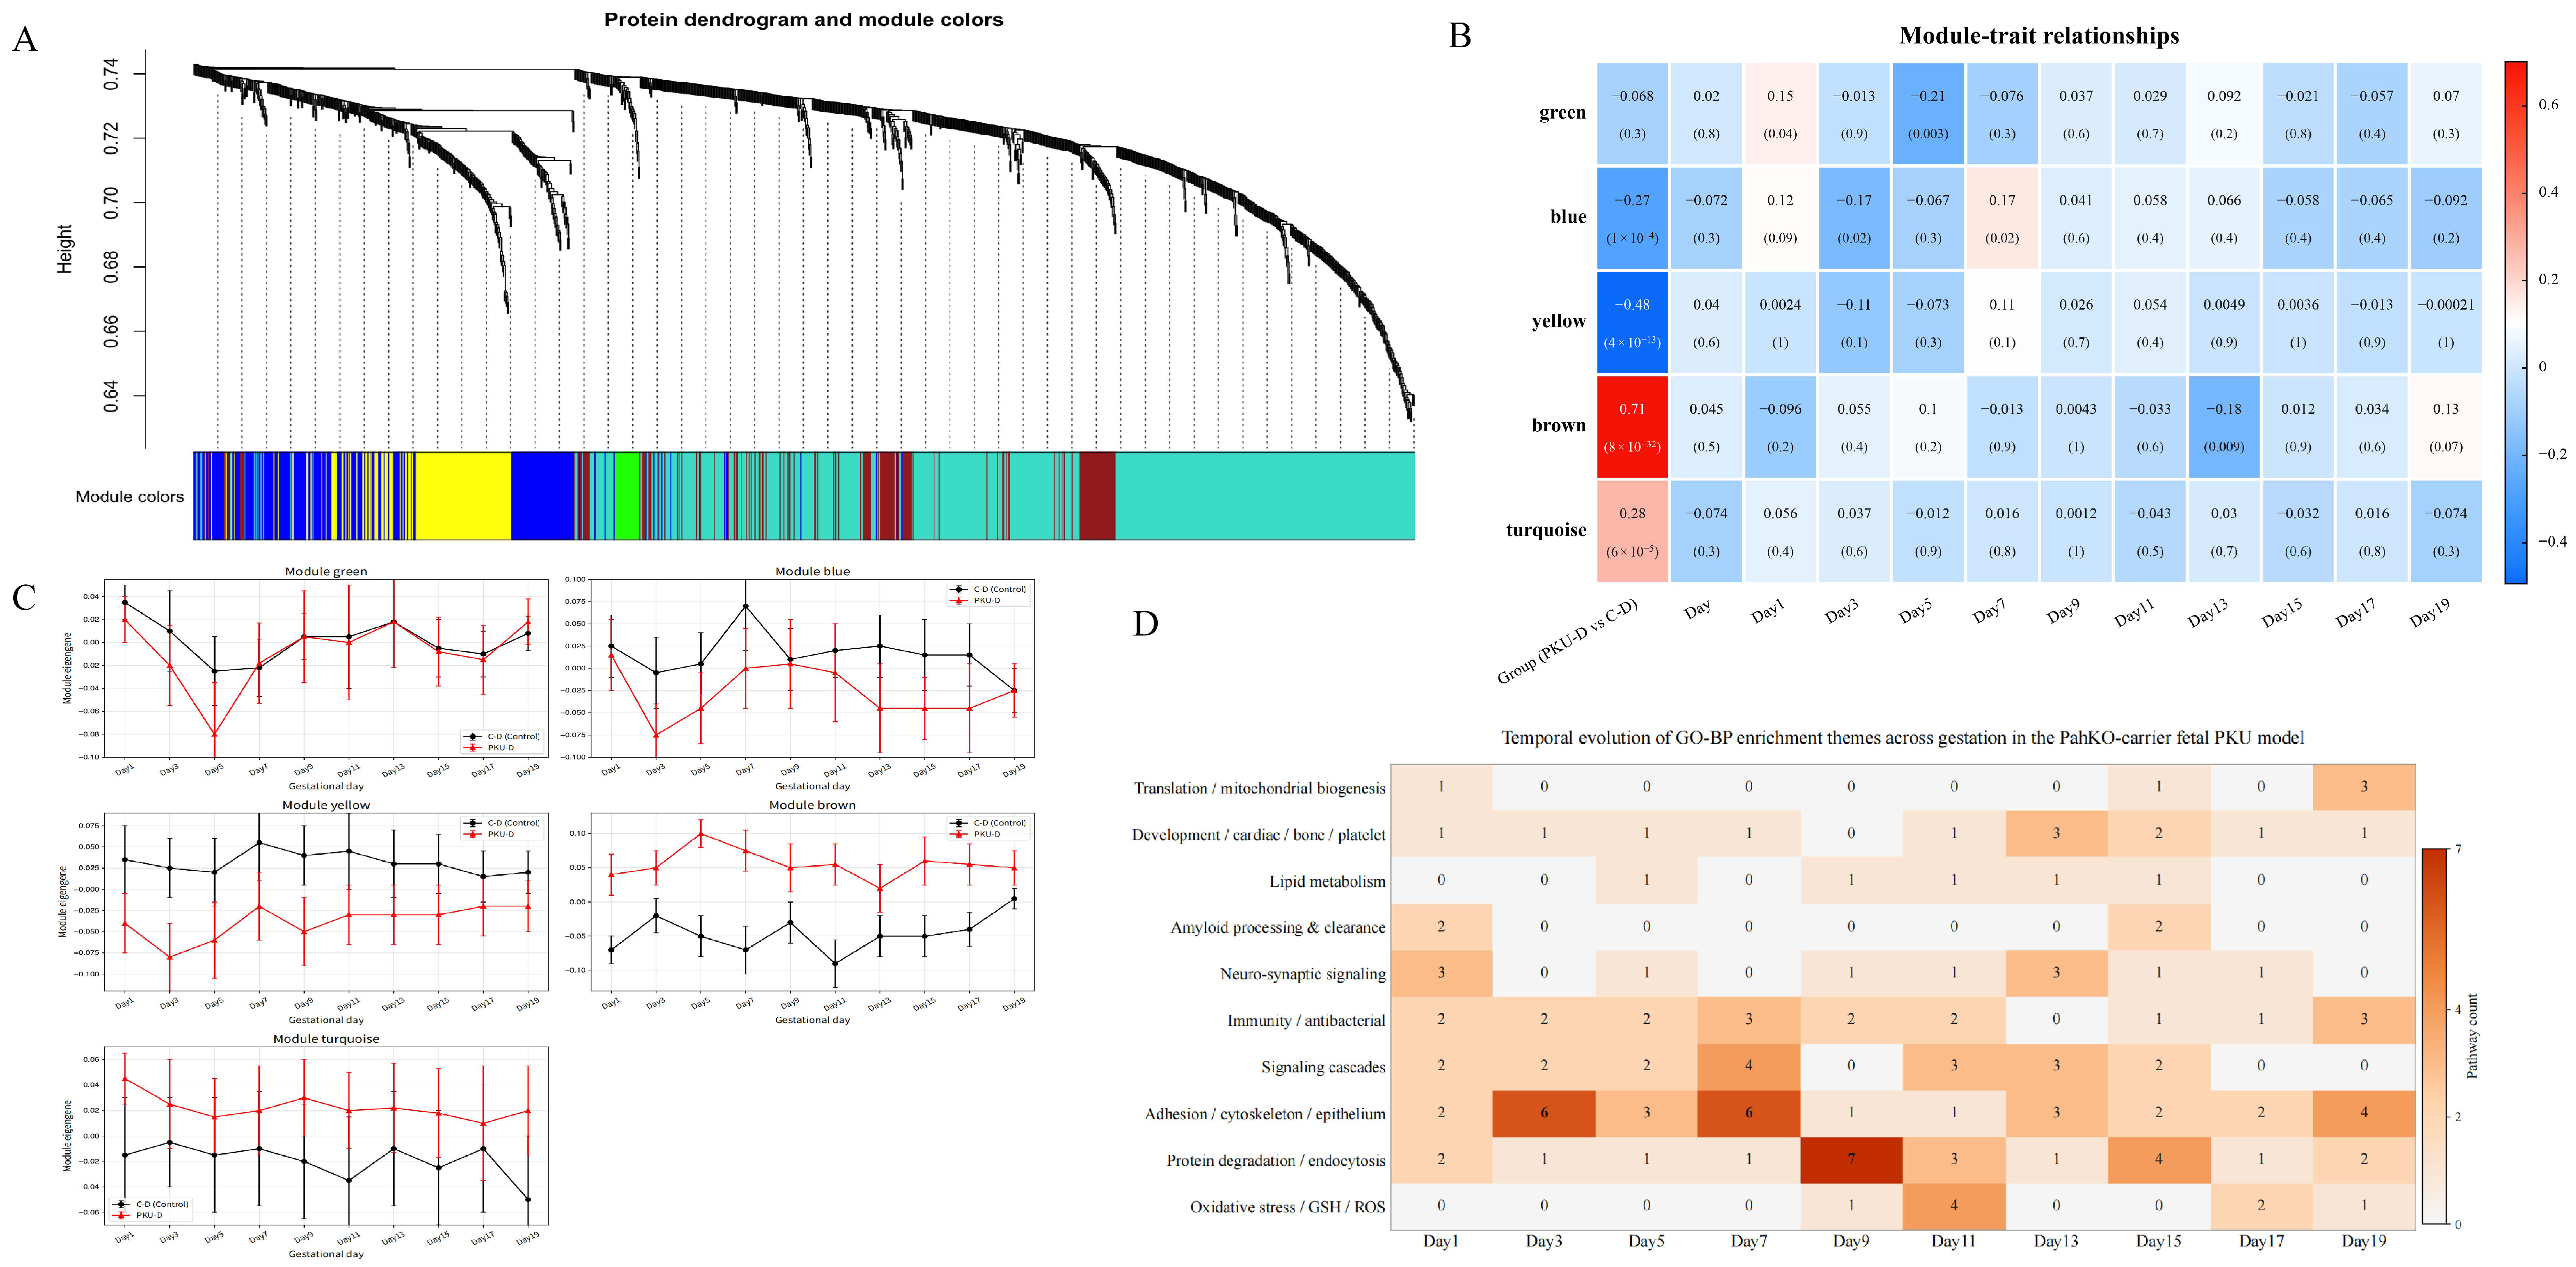
To systematically dissect the maternal systemic response induced by fetuses with phenylketonuria (PKU) in normal pregnant mice, weighted gene co-expression network analysis (WGCNA) was performed on 1247 log2-transformed proteins based on urinary proteomic data at 10 time points during gestation [42,43] (Table S5). A total of five modules were identified (Figure 7A): brown (149), turquoise (678), yellow (148), blue (229), and green (24); 19 proteins were not included in subsequent analysis. Module–phenotype association analysis (Figure 7B) showed that brown was significantly positively correlated with PKU-D (r = 0.708, p = 7.7 × 10⁻³²), and turquoise was elevated in PKU-D (r = 0.278, p = 6.4 × 10⁻⁵); yellow (r = −0.483, p = 3.6 × 10⁻¹³) and blue (r = −0.267, p = 1.3 × 10⁻⁴) were correlated with C-D; green showed no significant association (r = −0.068, p = 0.34). No module was significantly associated with gestational days (p = 0.294–0.781, |r| ≤ 0.074), suggesting that the co-expression changes were mainly driven by PKU fetal mice rather than by the progression of pregnancy itself. Module eigengenes (Figure 7C) further confirmed that the brown module was enriched in oxidative stress/metabolic proteins such as SOD2, GLO1, NQO1, Klotho, and SHMT1, which were continuously highly expressed throughout gestation in PKU-D; the turquoise module was enriched in DDC, GSTM2, GCLM, ARSA, PCBD1, etc., and maintained at relatively high levels in PKU-D; the yellow (PRG4, FSTL1, SLPI, etc.) and blue (TTR) modules were highly abundant in C-D. GO-BP temporal enrichment analysis (Figure 7D, Table S6) showed that oxidative stress–glutathione, synaptic signaling, immune response, and protein degradation pathways were gradually enriched in mid-to-late pregnancy, fully recapitulating the pathological processes of maternal oxidative stress, mitochondrial disorder, and protein homeostasis imbalance induced by hyperphenylalaninemic fetuses [8,40,44]. Module members encompassed functional clusters including oxidative stress defense, amino acid metabolism, and membrane transport, indicating that the maternal response triggered by fetal-origin PKU is a systematic network remodeling coordinated by multiple proteins [43,45]. These results indicate that the urinary proteome can non-invasively reflect the metabolic status of the maternal–fetal interface during pregnancy.
Figure 7.
Weighted gene co-expression network analysis (WGCNA) and GO enrichment analysis of the urinary proteome. (A) Protein dendrogram and assigned module colors. Proteins with similar temporal expression profiles were clustered into separate co-expression modules by WGCNA using all quantified urinary proteins. (B) Module–phenotype relationship heatmap: each cell shows the Pearson correlation coefficient (r) and significance p value (in parentheses) between the module eigengene (ME, the first principal component of proteins within the module) and phenotypes. Red indicates positive correlation, and blue indicates negative correlation. (C) Temporal changes in module eigengenes across gestational days: data points are group means, and error bars indicate 95% confidence intervals. (D) Temporal evolution heatmap of GO-BP enrichment themes of differential proteins in the PKU model.
3.3.9. Dual-Strategy Screening of Candidate Biomarkers Using LASSO and Random Forest
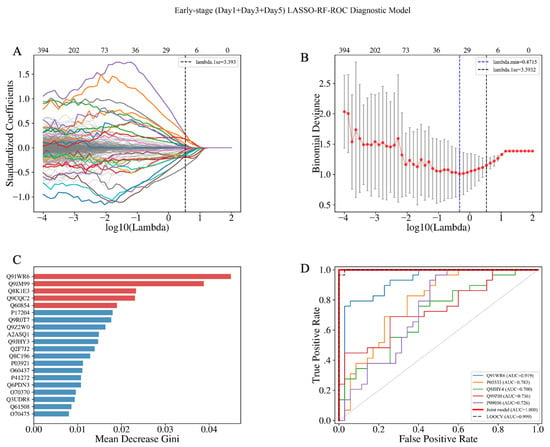
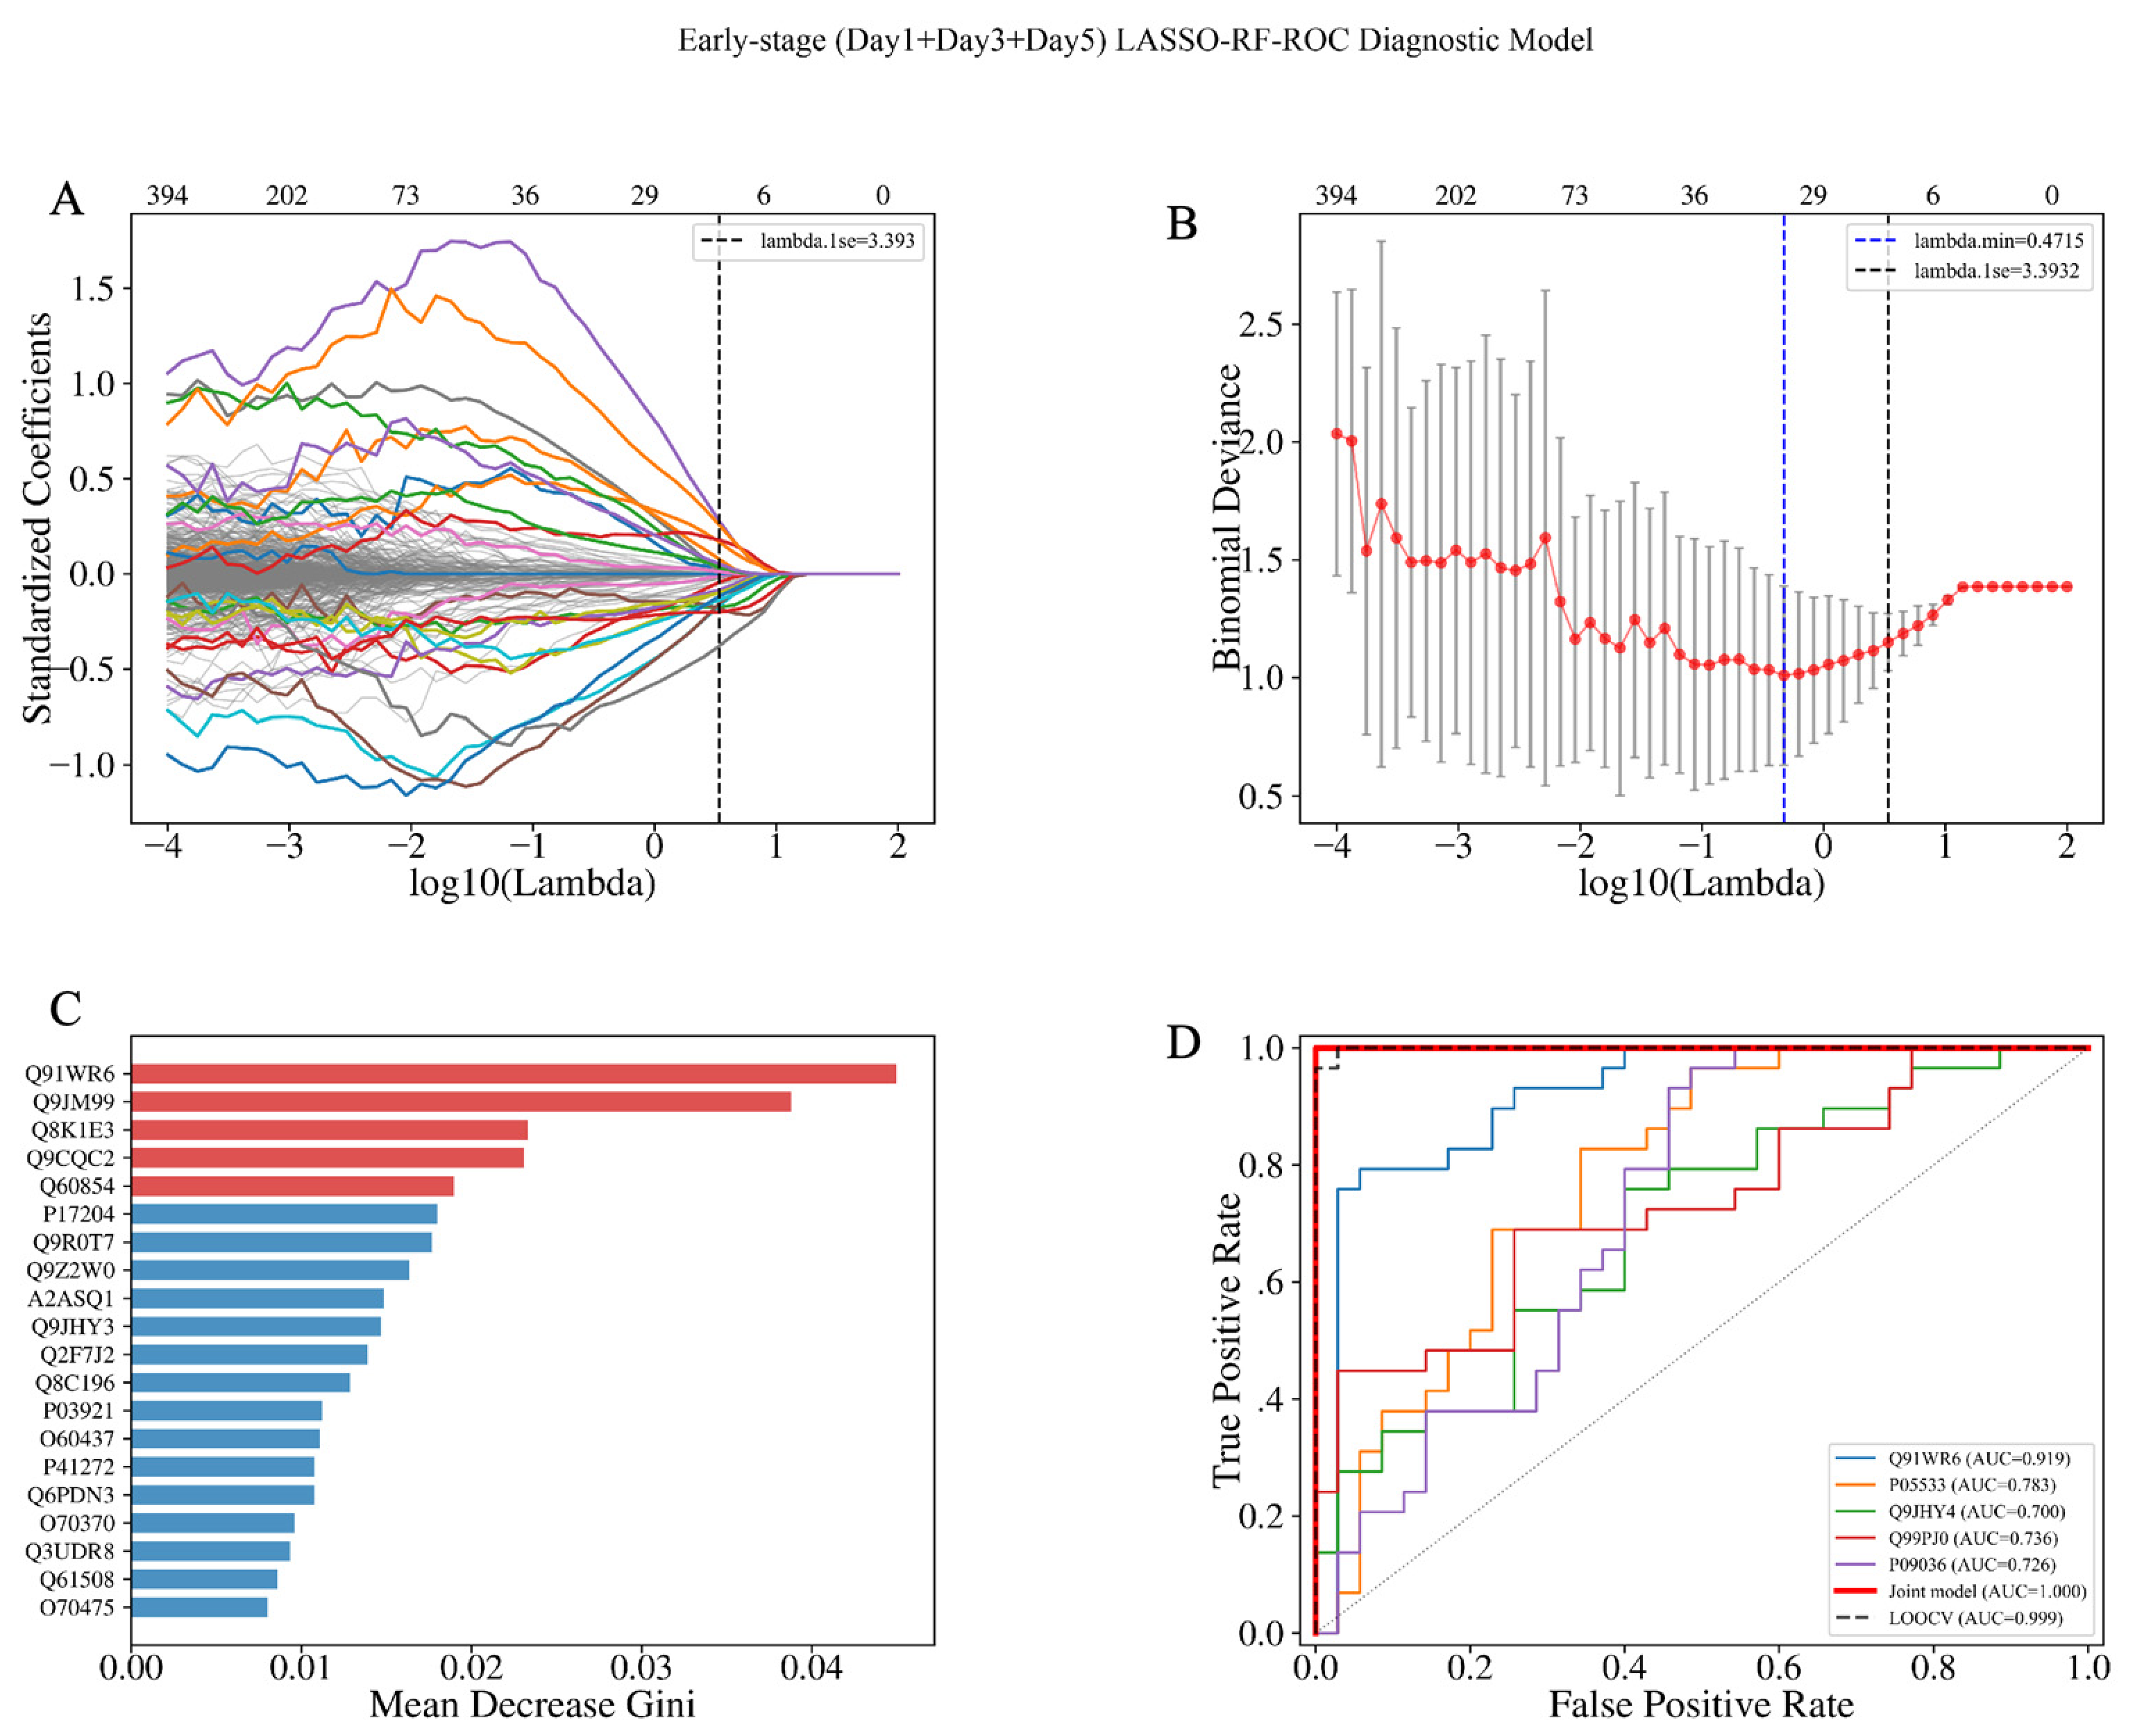
To systematically screen early diagnostic biomarkers in the maternal urine of pregnant mice with fetal-origin PKU, we adopted two strategies—early-stage (Day1–Day5, n = 64) and cross-time-point (Day1–Day19)—and performed combined screening using LASSO and random forest. Early-stage-specific screening: LASSO (lambda.1se = 3.393) selected 25 candidate proteins, and their intersection with the random forest Top50 yielded 12 early core proteins, as shown in Figure 8, among which Ginm1 (Q91WR6) ranked first in both algorithms. This model achieved an AUC of 1.000 in early pregnancy (Day1–Day5) and 0.844–0.960 in mid-pregnancy, but decreased in late pregnancy, suggesting clear early-window specificity.
Figure 8.
(A–D) Early-stage-specific screening: (A) LASSO coefficient trajectory plot; the black dashed line indicates lambda.1se (3.393, 25 non-zero coefficients); (B) LASSO 5-fold cross-validation plot, with red points representing the mean binomial deviance, error bars representing standard error, the blue dashed line indicating lambda.min, and the black dashed line indicating lambda.1se; (C) random forest variable importance bar chart (Top 20), with the top 5 highlighted in red and the x-axis showing Mean Decrease Gini; (D) ROC curves, with colored thin lines representing univariate models of the top 5 LASSO coefficients, the thick red line representing the combined model of 25 candidate proteins (AUC = 1.000), and the black dashed line representing LOOCV (AUC = 0.999).
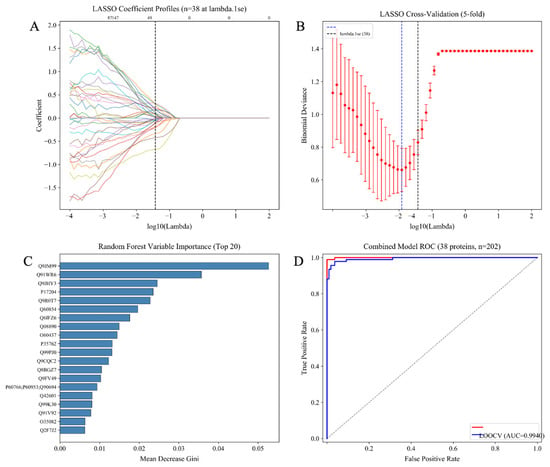
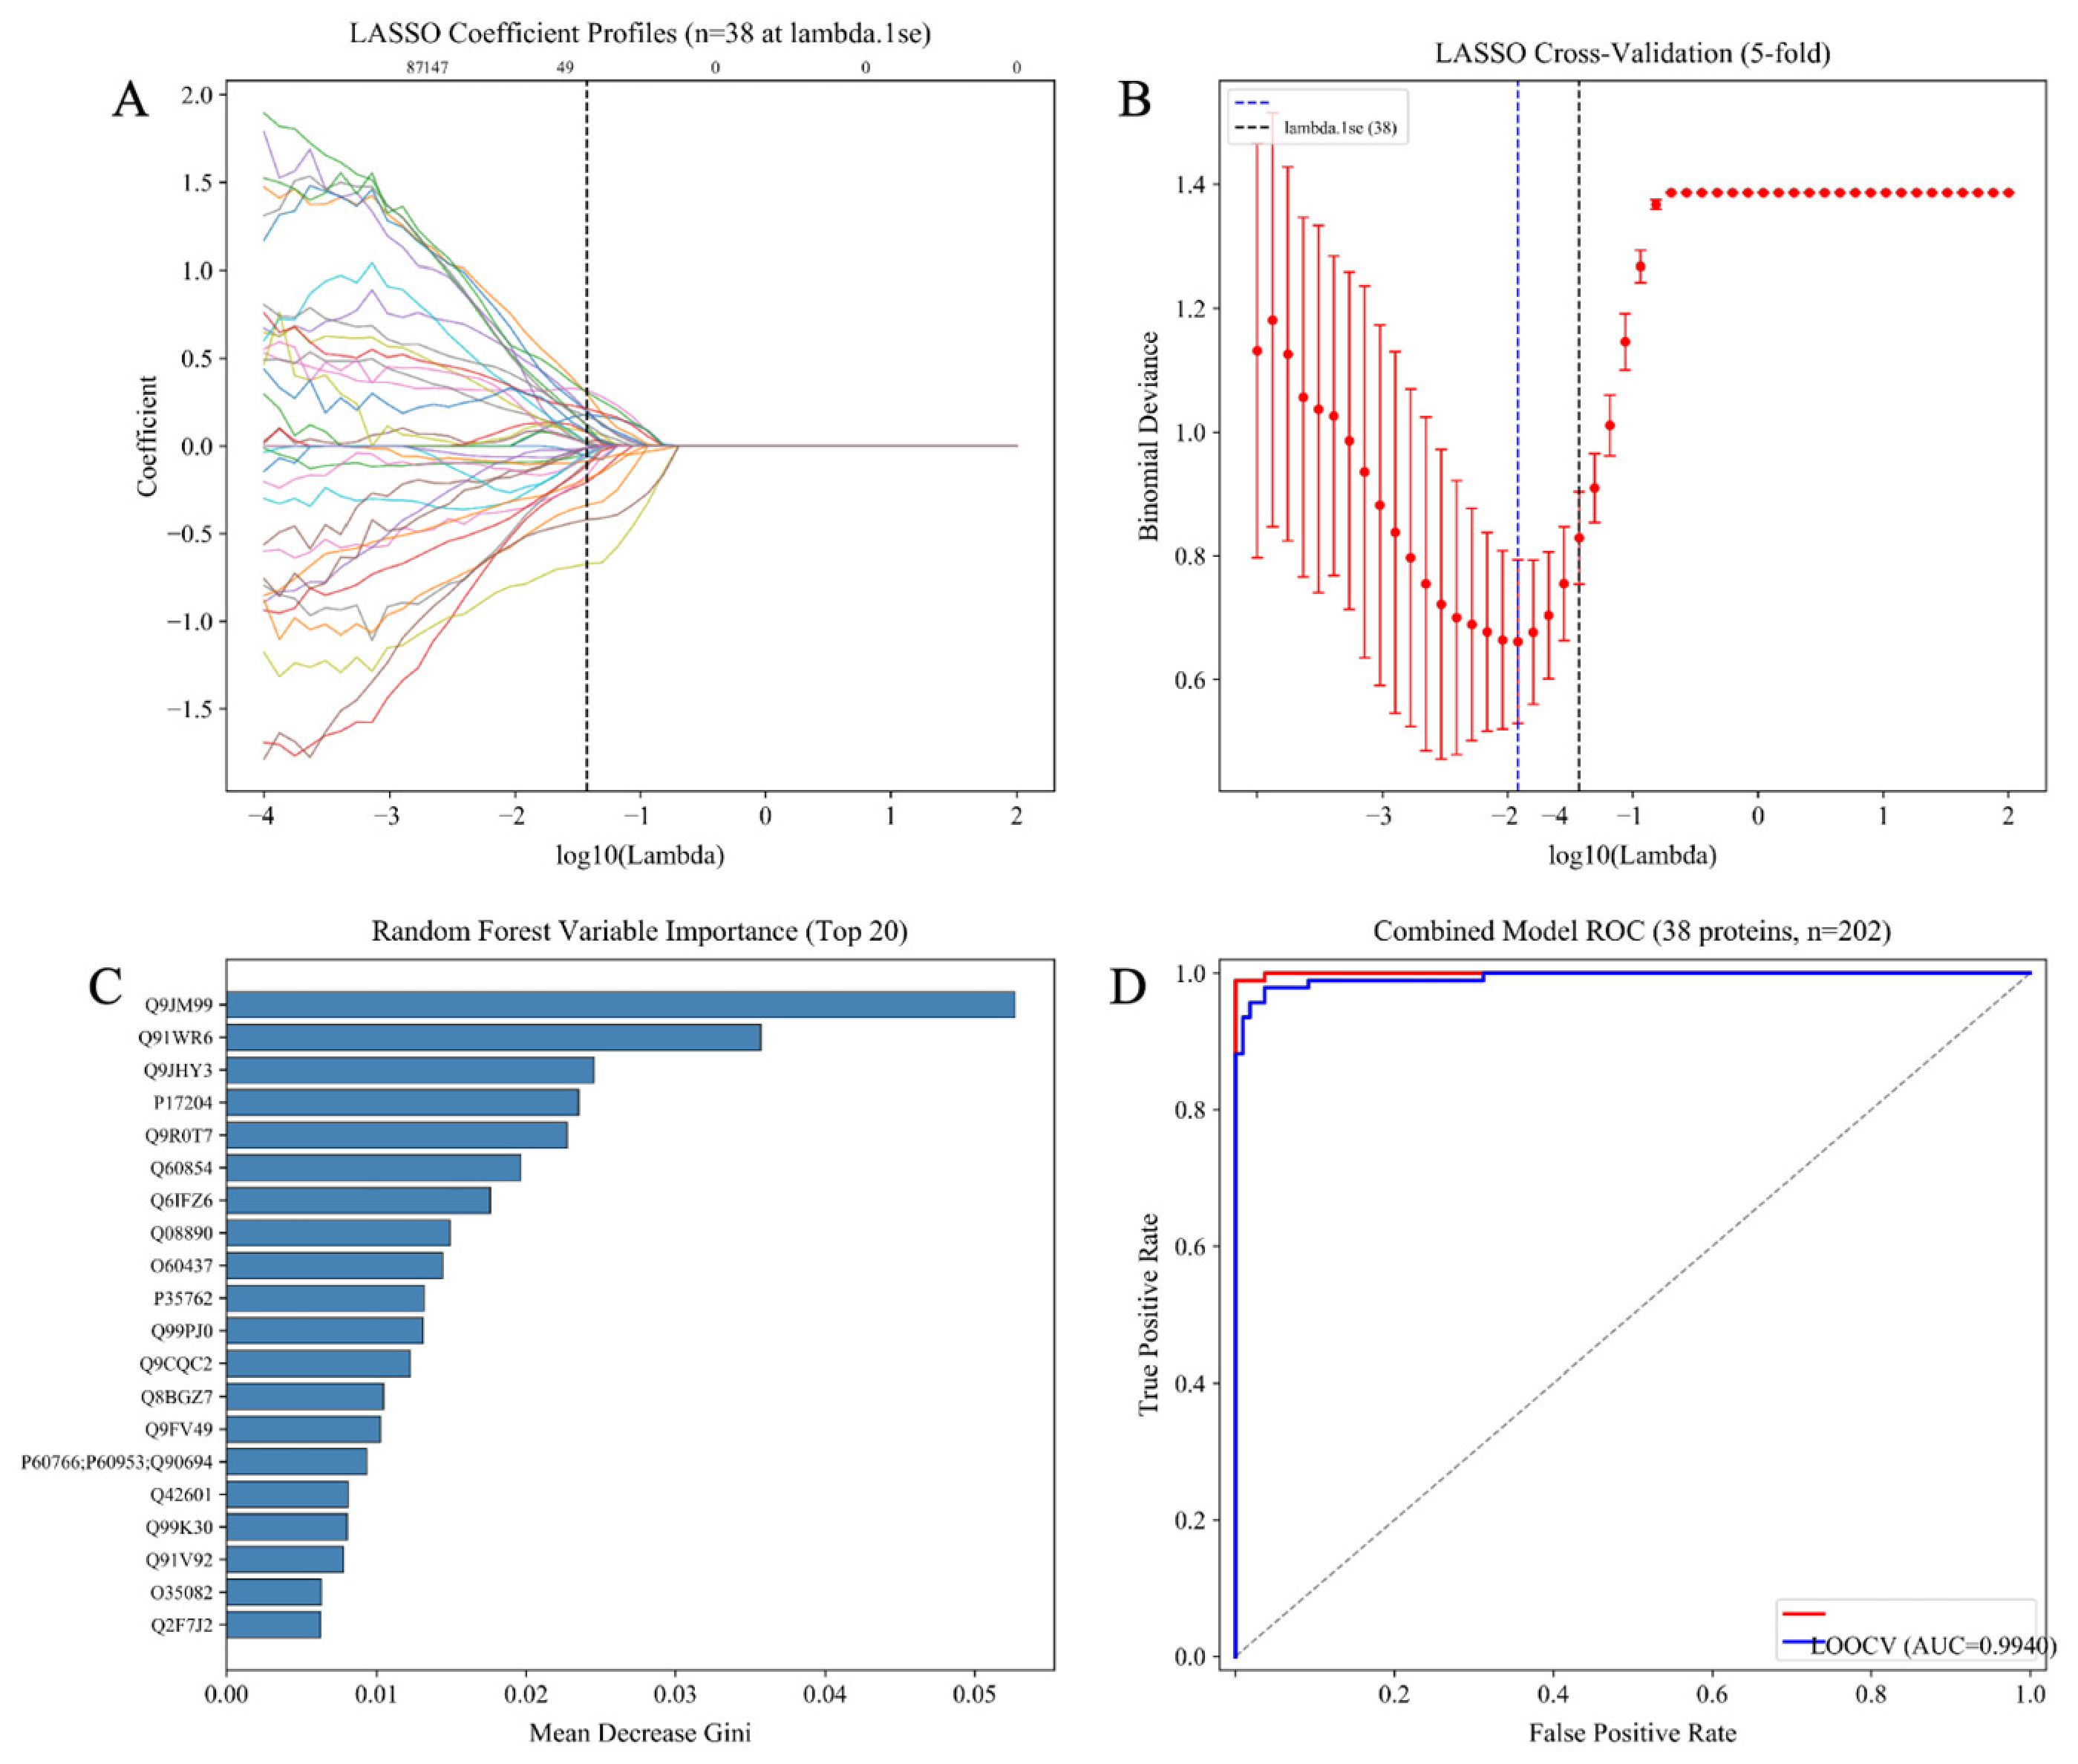
The cross-time-point screening results are shown in Figure 9. LASSO selected 38 candidate proteins at lambda.1se = 0.0373, and their intersection with the random forest Top50 yielded 15 cross-time-point core proteins. The two strategies produced 5 overlapping proteins: Ginm1, Prg4, Ly6a, Ntm, and Yipf3, indicating that these proteins are potential biomarker candidates independent of the screening strategy.
Figure 9.
LASSO–random forest diagnostic biomarker screening based on full-matrix proteins, cross-time-point universal screening (Day 1–Day 19, n = 202): (A) LASSO coefficient trajectory plot, lambda.1se = 0.0373 (38 non-zero coefficients), where each colored line represents an individual protein (colors assigned arbitrarily); (B) LASSO 5-fold cross-validation plot; (C) random forest variable importance Top 20; (D) ROC curves, combined model AUC = 0.9996, LOOCV AUC = 0.9940.
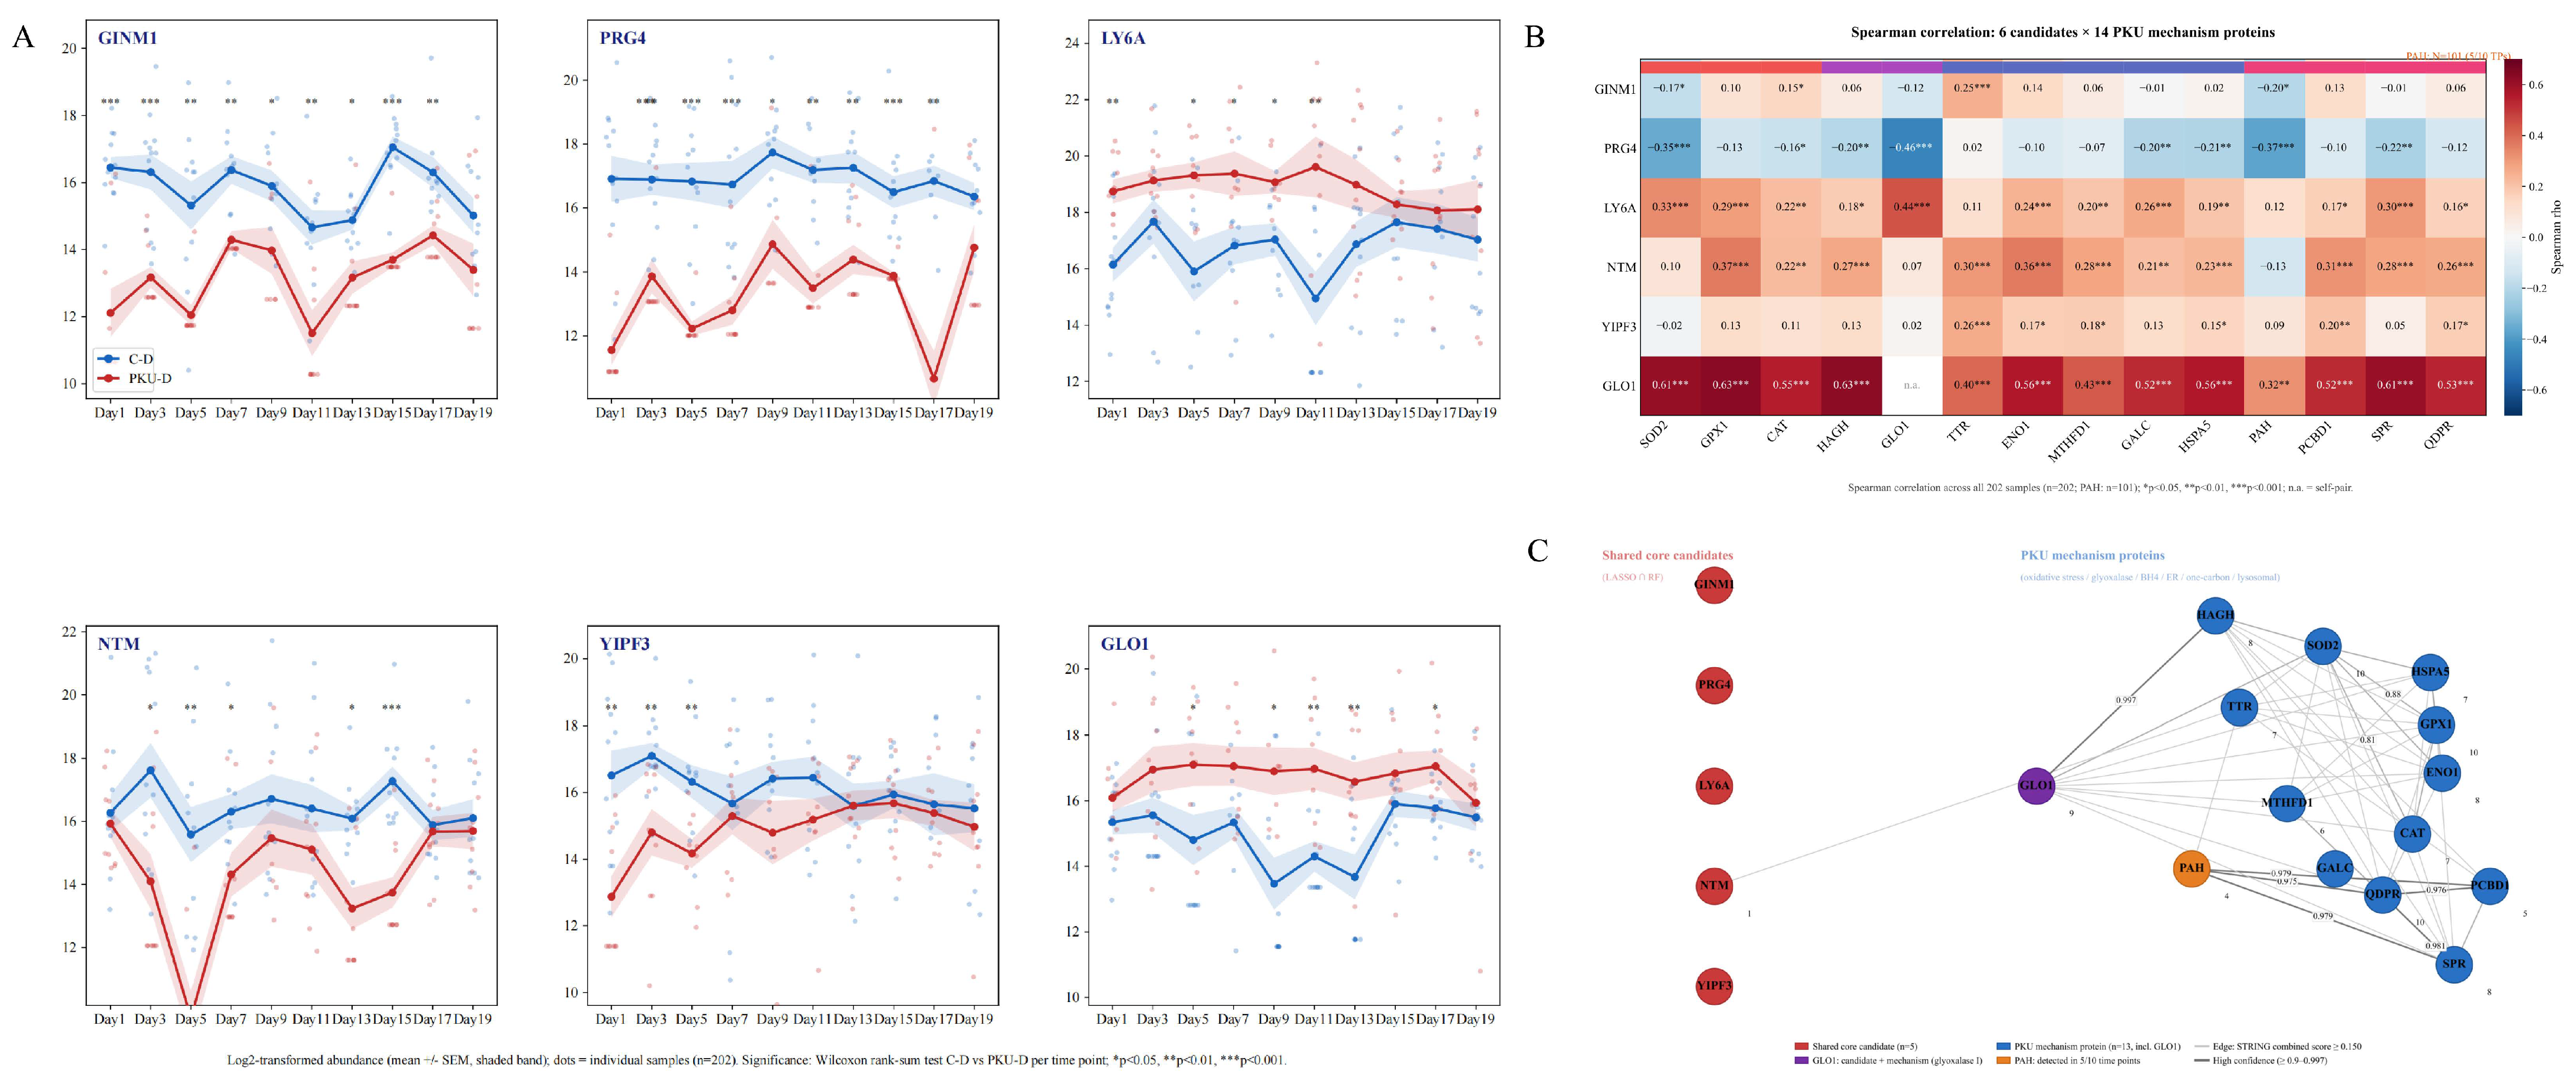
Ginm1, Prg4, Yipf3 and Ly6a were identified as core candidates by both LASSO and random forest algorithms, and are also hub proteins in the WGCNA network (kME = 0.690, 0.666, 0.501 and 0.69). These proteins exhibited persistent differential expression across multiple gestational time points, indicating that their intergroup expression differences are supported by stable co-expression patterns rather than isolated sporadic fluctuations. Glo1 was also a differentially expressed protein and a core hub protein; it is a known component of PKU-relevant pathological pathways. As the key rate-limiting enzyme of the glyoxalase system, Glo1 mediates methylglyoxal detoxification and oxidative stress responses [46,47]. Although Ntm was not a module hub protein, it was identified as a candidate biomarker by the combined LASSO–random forest screening and showed significant intergroup differential expression. As an IgLON-family neural cell adhesion molecule involved in neurodevelopment and synaptogenesis, Ntm may be associated with pathological features of perturbed fetal neurodevelopment in PKU [48]. Based on these multi-dimensional analyses, the six proteins were selected as potential candidate biomarkers for subsequent investigation.
3.3.10. Validation of the Association Between Candidate Biomarkers and PKU Mechanism Proteins
To further explore the associations between candidate biomarkers and pathological pathways of phenylketonuria (PKU), we first characterized the temporal dynamic profiles of protein abundance for six candidate biomarkers across the whole gestational period (Figure 10A). Subsequently, STRING protein–protein interaction prediction and Spearman correlation analyses were performed on these six candidate proteins and 14 PKU-related functional proteins identified by full-matrix screening (oxidative stress: SOD2, GPX1, CAT; glyoxalase/carbonyl detoxification: HAGH, GLO1; BH4–phenylalanine metabolism: PAH, PCBD1, SPR, QDPR; neurometabolism/endoplasmic reticulum stress: TTR, ENO1, MTHFD1, GALC, HSPA5; Figure 10B,C). The STRING-predicted network identified GLO1 as a hub node (degree = 9) linking glyoxalase-mediated carbonyl detoxification, oxidative stress, and BH4 metabolic pathways. GLO1 exhibited significant positive correlations with most PKU-related functional proteins (r = 0.32–0.63, Figure 10B). No predicted direct physical interactions were detected between the other five candidate proteins and PKU-related functional proteins; these candidates were mainly characterized by coordinated expression changes, suggesting potential indirect regulatory relationships. Collectively, these correlational results indicate that urinary proteomic signatures of pregnant mice carrying PKU fetuses are associated with alterations in oxidative stress, carbonyl stress and BH4 metabolism. These findings provide correlational evidence linking urinary candidate biomarkers to PKU-associated molecular pathways, while the underlying maternal–fetal signaling regulatory mechanism remains to be validated by further functional experiments.
Figure 10.
Abundance trends, expression correlations, and protein–protein interaction network validation of candidate biomarkers with PKU mechanism proteins. (A) Urinary abundance trends (log2 intensity) of the six candidate biomarkers across ten gestational time points from Day 1 to Day 19; the shaded area represents the mean ± confidence interval. Between-group comparisons were performed using the Wilcoxon rank-sum test with FDR correction (* p < 0.05, ** p < 0.01, *** p < 0.001). (B) Spearman expression correlation heatmap of the six candidate proteins and 14 PKU mechanism proteins. Color represents the Spearman correlation coefficient (red, positive correlation; blue, negative correlation); p < 0.05. (C) STRING protein–protein interaction network of the six candidate proteins (red nodes) and 14 PKU mechanism proteins (blue nodes) (Mus musculus).
4. Discussion
This study is the first to use urinary proteomics to find that pregnant mice carrying PKU fetal mice showed disease-related differential signals, such as PCBD1 and TTR, as early as Day 1, and these signals persisted throughout the entire gestational period. Permutation tests showed that the random generation probability of these differential protein combinations was low (0.04–0.06), suggesting that they were not random noise but rather an early maternal response with potential biological significance. At Day 1, mouse embryos are still at the zygote-to-cleavage stage; why could detectable changes already appear in the maternal urinary proteome? This may be related to the following mechanisms. First, the embryonic genotype is already determined at fertilization. The PKU-D group can produce Pah−/− embryos, whereas the C-D group does not produce Pah−/− embryos; therefore, the two groups differ in embryonic genotype from the earliest stage. Second, preimplantation embryos can affect the maternal local microenvironment through the secretion of metabolites, proteins, extracellular vesicles, or small RNAs via oviductal and uterine fluids, and can even enter the maternal circulation to trigger a systemic response [49,50,51]. Pah−/− embryos may exhibit abnormal phenylalanine metabolism due to PAH deficiency, leading to altered metabolite profiles, which are recognized by the mother and trigger adjustments in pterin metabolism, oxidative stress, or transport-related pathways. In this study, PCBD1 and TTR detected on Day 1 are involved in the BH4 regeneration cycle and thyroxine/retinol transport, respectively [52,53], suggesting that systemic changes at the metabolic and transport levels occur in the mother as early as the very early stage of pregnancy.
Functional enrichment showed that the maternal response gradually shifted from pterin–amino acid transport in early pregnancy to oxidative stress and myelin metabolic remodeling in mid-to-late pregnancy. WGCNA revealed that the maternal response was organized into modules involving oxidative stress defense, amino acid metabolism, and membrane transport, indicating a systemic network remodeling coordinated by multiple proteins [54,55]. KEGG and STRING analyses further suggested coordinated changes among BH4 metabolism, one-carbon metabolism, and the antioxidant/glyoxalase system. We propose a hypothesized pathological cascade:“phenylalanine accumulation→one-carbon metabolism/BH4 imbalance → enhanced oxidative stress → impaired neurotransmitter synthesis” [25,26,27]. It should be noted that our urinary proteomic data only demonstrate molecular associations and cannot establish causality or pathway flux. Dual machine learning screening identified six candidate biomarkers: GINM1, PRG4, LY6A, NTM, YIPF3, and GLO1. GLO1 occupies a hub position in the interaction network and directly participates in the methylglyoxal–AGE neurotoxicity detoxification pathway; the remaining five proteins are mainly characterized by expression co-association, and their mechanisms in maternal–fetal interaction still require functional experimental validation. The six proteins showed significant between-group differences as early as the first trimester and weakened as pregnancy progressed, consistent with the goal of early screening. GLO1 has dual roles as both a candidate biomarker and a mechanism protein, supporting the central role of the methylglyoxal–AGE–neurotoxicity axis [56,57].
In this mouse model study, we observed dynamic alterations in the urinary proteome of pregnant mice carrying PKU fetuses; we even characterized these proteomic signatures and screened potential urinary biomarker candidates. Such molecular signatures can non-invasively mirror fetal metabolic perturbations at the maternal-fetal interface. Nevertheless, this work has several limitations. First, all experiments were performed in a mouse model, and the findings cannot be directly extrapolated to human pregnancy. Second, grouping was defined by the fetal genotype of the whole litter. Due to limited sample size, we were unable to evaluate whether urinary proteomic changes correlate with the number of HO fetuses carried by each dam. Third, this study focused on maternal proteomic alterations induced by fetal PKU genotypes. Preliminary proteomic comparisons confirmed no significant differences in the urinary proteome between pregnant HE and WT dams under normal gestation. Accordingly, WT × WT mating pairs were not included in our experimental design. Although this preliminary evidence supports that the maternal HE genotype does not confound our observations, inclusion of WT × WT matings could further refine the baseline urinary proteome data of HE dams. Fourth, only proteomic profiling was performed in this study, without quantitative measurement of phenylalanine and its metabolites. In addition, LC-MS/MS detects enzymatically digested peptides rather than intact native urinary proteins. The six candidate biomarkers identified via the dual screening strategy also face challenges: urinary proteins generally exhibit low abundance and substantial inter-individual variation, and missing-value imputation may introduce analytical bias. The early prediction model yielded an AUC approaching 1.000, which raises concerns about overfitting and highlights the requirement for external validation in large independent cohorts.
5. Conclusions
Differential proteomic analysis of maternal urine throughout gestation revealed regular, reproducible, and dynamic proteomic changes in pregnant mice carrying PKU fetuses. Permutation tests showed low random generation probabilities (0.04–0.06) at 9 of 10 time points (0.19 on Day9), indicating that the differential protein combinations were non-random and statistically significant. Functional enrichment revealed a temporal response shifting from pterin metabolism/amino acid transport in early pregnancy to oxidative stress and myelin remodeling in mid-to-late pregnancy. WGCNA showed modular organization of the maternal response, and KEGG and STRING analyses revealed coordinated phenylalanine–one-carbon metabolism–oxidative stress response. Dual-strategy screening identified five core candidates—GINM1, PRG4, LY6A, NTM, and YIPF3—with both early specificity and cross-time-point stability; including GLO1 yielded six candidate biomarkers, and candidate–mechanism associations were established. These findings provide proof of concept and a candidate biomarker basis for non-invasive early-pregnancy screening of PKU based on maternal urinary proteomics.:
Supplementary Materials
The following supporting information can be downloaded at: https://www.mdpi.com/article/10.3390/biom16111566/s1. Table S1: Intensity matrix of all proteins identified in the urinary samples, including the 202 biological samples and quality-control (QC) samples; Table S2: Quality-control assessment of the mass spectrometry data, including protein intensities, mean, standard deviation, and coefficient of variation (CV%) for each QC group; Table S3: Differential urinary proteins (PKU-D vs. C–D) identified at each of the ten gestational time points (Days 1–19); Table S4: KEGG pathway enrichment analysis of the differential urinary proteins at each time point; Table S5: Quantified urinary proteins at each of the ten gestational time points; Table S6: Gene Ontology (GO) enrichment analysis of the differential urinary proteins at each time point.
Author Contributions
Conceptualization: Y.G.; writing—review and editing: Y.G.; supervision: Y.G.; methodology: L.G.; formal analysis: L.G.; data curation: L.G.; writing—original draft preparation: L.G. All authors have read and agreed to the published version of the manuscript.
Funding
This study was funded by the National Key R&D Program of China (2023YFA1801900), Beijing Natural Science Foundation (L246002 and L2604022), Beijing Normal University (11100704).
Institutional Review Board Statement
The animal study protocol was approved by the Ethics Committee of the College of Life Sciences, Beijing Normal University, with the approval number CLS-AWEC-B-2024-009, date of approval: 21 October 2024.
Informed Consent Statement
Not applicable.
Data Availability Statement
The original contributions presented in this study are included in the article/Supplementary Materials. Further inquiries can be directed to the corresponding author.
Acknowledgments
This work was supported by the National Key Research and Development Program of China (Grant No. 2023YFA1801900) and the Beijing Natural Science Foundation (Grant Nos. L246002 and L2604022), Beijing Normal University(11100704). We thank all lab members for assistance with animal feeding, urine sample collection and mass spectrometry data analysis.
Conflicts of Interest
The authors declare no conflicts of interest.
References
- Woolf, L.I.; Adams, J. The Early History of PKU. Int. J. Neonatal Screen. 2020, 6, 59. [Google Scholar] [CrossRef] [Scilit] [PubMed]
- Di Mascio, D.; Khalil, A.; Rizzo, G.; Buca, D.; Liberati, M.; Martellucci, C.A.; Flacco, M.E.; Manzoli, L.; D’Antonio, F. Risk of fetal loss following amniocentesis or chorionic villus sampling in twin pregnancy: Systematic review and meta-analysis. Ultrasound Obstet. Gynecol. 2020, 56, 647–655. [Google Scholar] [CrossRef] [Scilit] [PubMed]
- Xiao, D.; Yuan, J.; Liu, S.; Yang, Y.; Chen, Y. The cost-effectiveness analysis of newborn screening for inherited metabolic disorders in China using tandem mass spectrometry: A real-world evidence. Cost Eff. Resour. Alloc. 2025, 23, 3. [Google Scholar] [CrossRef] [Scilit] [PubMed]
- National Institutes of Health Consensus Development Panel. National Institutes of Health Consensus Development Conference Statement: Phenylketonuria: Screening and Management, October 16–18, 2000. Pediatrics 2001, 108, 972–982. [Google Scholar] [CrossRef] [Scilit] [PubMed]
- van Spronsen, F.J.; van Wegberg, A.M.; Ahring, K.; Bélanger-Quintana, A.; Blau, N.; Bosch, A.M.; Burlina, A.; Campistol, J.; Feillet, F.; Giżewska, M.; et al. Key European guidelines for the diagnosis and management of patients with phenylketonuria. Lancet Diabetes Endocrinol. 2017, 5, 743–756. [Google Scholar] [CrossRef] [Scilit] [PubMed]
- van Spronsen, F.J.; Blau, N.; Harding, C.; Burlina, A.; Longo, N.; Bosch, A.M. Phenylketonuria. Nat. Rev. Dis. Primers 2021, 7, 36. [Google Scholar] [CrossRef] [Scilit] [PubMed]
- Abuelela, I.S.; Bebars, G.M.; Kamal, A.M.; Sayed, S.I.; Refaat, R.S. Impact of depression on quality of life in PKU children. Eur. J. Pediatr. 2026, 185, 293. [Google Scholar] [CrossRef] [Scilit] [PubMed]
- Levy, H.L.; Ghavami, M. Maternal phenylketonuria: A metabolic teratogen. Teratology 1996, 53, 176–184. [Google Scholar] [CrossRef]
- Elhawary, N.A.; AlJahdali, I.A.; Abumansour, I.S.; Elhawary, E.N.; Gaboon, N.; Dandini, M.; Madkhali, A.; Alosaimi, W.; Alzahrani, A.; Aljohani, F.; et al. Genetic etiology and clinical challenges of phenylketonuria. Hum. Genom. 2022, 16, 22. [Google Scholar] [CrossRef] [Scilit] [PubMed]
- Singh, K.; Cornell, C.S.; Jackson, R.; Kabiri, M.; Phipps, M.; Desai, M.; Fogle, R.; Ying, X.; Anarat-Cappillino, G.; Geller, S.; et al. CRISPR/Cas9 generated knockout mice lacking phenylalanine hydroxylase protein as a novel preclinical model for human phenylketonuria. Sci. Rep. 2021, 11, 7254. [Google Scholar] [CrossRef] [Scilit] [PubMed]
- El-Metwally, A.; Yousef Al-Ahaidib, L.; Ayman Sunqurah, A.; Al-Surimi, K.; Househ, M.; Alshehri, A.; Da’ar, O.B.; Abdul Razzak, H.; AlOdaib, A.N. The Prevalence of Phenylketonuria in Arab Countries, Turkey, and Iran: A Systematic Review. BioMed Res. Int. 2018, 2018, 7697210. [Google Scholar] [CrossRef] [Scilit] [PubMed]
- Chen, H.-F.; Rose, A.M.; Waisbren, S.; Ahmad, A.; Prosser, L.A. Newborn Screening and Treatment of Phenylketonuria: Projected Health Outcomes and Cost-Effectiveness. Children 2021, 8, 381. [Google Scholar] [CrossRef] [Scilit] [PubMed]
- Ugalde-Abiega, B.; Stanescu, S.; Belanger, A.; Martinez-Pardo, M.; Arrieta, F. New challenges in management of phenylketonuria in pregnancy: A case report. J. Med. Case Rep. 2023, 17, 465. [Google Scholar] [CrossRef] [Scilit] [PubMed]
- Bobrova, N.A.; Lyubimova, D.I.; Mishina, D.M.; Lobanova, V.S.; Valieva, S.I.; Mityaeva, O.N.; Feoktistova, S.G.; Volchkov, P.Y. Experimental Animal Models of Phenylketonuria: Pros and Cons. Int. J. Mol. Sci. 2025, 26, 5262. [Google Scholar] [CrossRef] [Scilit] [PubMed]
- Winn, S.R.; Scherer, T.; Thöny, B.; Ying, M.; Martinez, A.; Weber, S.; Raber, J.; Harding, C.O. Blood phenylalanine reduction corrects CNS dopamine and serotonin deficiencies and partially improves behavioral performance in adult phenylketonuric mice. Mol. Genet. Metab. 2018, 123, 6–20. [Google Scholar] [CrossRef] [Scilit] [PubMed]
- Zheng, Y.; Fang, Z.; Wu, X.; Zhang, H.; Sun, P. Identification of hub genes, diagnostic model, and immune infiltration in preeclampsia by integrated bioinformatics analysis and machine learning. BMC Pregnancy Childbirth 2024, 24, 847. [Google Scholar] [CrossRef] [Scilit] [PubMed]
- Huang, P.; Song, Y.; Yang, Y.; Bai, F.; Li, N.; Liu, D.; Li, C.; Li, X.; Gou, W.; Zong, L. Identification and verification of diagnostic biomarkers based on mitochondria-related genes related to immune microenvironment for preeclampsia using machine learning algorithms. Front. Immunol. 2023, 14, 1304165. [Google Scholar] [CrossRef] [Scilit] [PubMed]
- Yu, I.; Jeong, J. Advancing Gene Therapy for Phenylketonuria: From Precision Editing to Clinical Translation. Int. J. Mol. Sci. 2025, 26, 8722. [Google Scholar] [CrossRef] [Scilit] [PubMed]
- Park, J.-W.; Park, E.-S.; Choi, E.N.; Park, H.-Y.; Jung, S.-C. Altered brain gene expression profiles associated with the pathogenesis of phenylketonuria in a mouse model. Clin. Chim. Acta 2009, 401, 90–99. [Google Scholar] [CrossRef] [Scilit] [PubMed]
- Mastrangelo, M.; Tolve, M.; Artiola, C.; Bove, R.; Carducci, C.; Carducci, C.; Angeloni, A.; Pisani, F.; Leuzzi, V. Phenotypes and Genotypes of Inherited Disorders of Biogenic Amine Neurotransmitter Metabolism. Genes 2023, 14, 263. [Google Scholar] [CrossRef] [Scilit] [PubMed]
- Belanger, A.M.; Przybylska, M.; Gefteas, E.; Furgerson, M.; Geller, S.; Kloss, A.; Cheng, S.H.; Zhu, Y.; Yew, N.S. Inhibiting neutral amino acid transport for the treatment of phenylketonuria. JCI Insight 2018, 3, e121762. [Google Scholar] [CrossRef] [Scilit] [PubMed]
- Dobrowolski, S.F.; Phua, Y.L.; Vockley, J.; Goetzman, E.; Blair, H.C. Phenylketonuria oxidative stress and energy dysregulation: Emerging pathophysiological elements provide interventional opportunity. Mol. Genet. Metab. 2022, 136, 111–117. [Google Scholar] [CrossRef] [Scilit] [PubMed]
- Fernandes, C.G.; Leipnitz, G.; Seminotti, B.; Amaral, A.U.; Zanatta, Â.; Vargas, C.R.; Dutra Filho, C.S.; Wajner, M. Experimental evidence that phenylalanine provokes oxidative stress in hippocampus and cerebral cortex of developing rats. Cell. Mol. Neurobiol. 2010, 30, 317–326. [Google Scholar] [CrossRef] [Scilit] [PubMed]
- Tyagi, A.; Sarodaya, N.; Kaushal, K.; Chandrasekaran, A.P.; Antao, A.M.; Suresh, B.; Rhie, B.H.; Kim, K.S.; Ramakrishna, S. E3 Ubiquitin Ligase APC/CCdh1 Regulation of Phenylalanine Hydroxylase Stability and Function. Int. J. Mol. Sci. 2020, 21, 9076. [Google Scholar] [CrossRef] [Scilit] [PubMed]
- Barnes-Vélez, J.A.; Aksoy Yasar, F.B.; Hu, J. Myelin lipid metabolism and its role in myelination and myelin maintenance. Innovation 2023, 4, 100360. [Google Scholar] [CrossRef] [Scilit] [PubMed]
- Ducker, G.S.; Rabinowitz, J.D. One-Carbon Metabolism in Health and Disease. Cell Metab. 2017, 25, 27–42. [Google Scholar] [CrossRef] [Scilit] [PubMed]
- Shaimardanova, A.A.; Chulpanova, D.S.; Solovyeva, V.V.; Mullagulova, A.I.; Kitaeva, K.V.; Allegrucci, C.; Rizvanov, A.A. Metachromatic Leukodystrophy: Diagnosis, Modeling, and Treatment Approaches. Front. Med. 2020, 7, 576221. [Google Scholar] [CrossRef] [Scilit] [PubMed]
- Reza, S.; Ugorski, M.; Suchański, J. Glucosylceramide and galactosylceramide, small glycosphingolipids with significant impact on health and disease. Glycobiology 2021, 31, 1416–1434. [Google Scholar] [CrossRef] [Scilit] [PubMed]
- Gupta, S.; Lau, K.; Harding, C.O.; Shepherd, G.; Boyer, R.; Atkinson, J.P.; Knight, V.; Olbertz, J.; Larimore, K.; Gu, Z.; et al. Association of immune response with efficacy and safety outcomes in adults with phenylketonuria administered pegvaliase in phase 3 clinical trials. eBioMedicine 2018, 37, 366–373. [Google Scholar] [CrossRef] [Scilit] [PubMed]
- Alsharhan, H.; Ficicioglu, C. Disorders of phenylalanine and tyrosine metabolism. Transl. Sci. Rare Dis. 2020, 5, 3–58. [Google Scholar] [CrossRef] [Scilit]
- Wu, T.; Hu, E.; Xu, S.; Chen, M.; Guo, P.; Dai, Z.; Feng, T.; Zhou, L.; Tang, W.; Zhan, L.; et al. clusterProfiler 4.0: A universal enrichment tool for interpreting omics data. Innovation 2021, 2, 100141. [Google Scholar] [CrossRef] [Scilit] [PubMed]
- Kang, Y.P.; Mockabee-Macias, A.; Jiang, C.; Falzone, A.; Prieto-Farigua, N.; Stone, E.; Harris, I.S.; DeNicola, G.M. Non-canonical glutamate-cysteine ligase activity protects against ferroptosis. Cell Metab. 2021, 33, 174–189. [Google Scholar] [CrossRef] [Scilit] [PubMed]
- Li, Y.; Huang, T.-T.; Carlson, E.J.; Melov, S.; Ursell, P.C.; Olson, J.L.; Noble, L.J.; Yoshimura, M.P.; Berger, C.; Chan, P.H.; et al. Dilated cardiomyopathy and neonatal lethality in mutant mice lacking manganese superoxide dismutase. Nat. Genet. 1995, 11, 376–381. [Google Scholar] [CrossRef] [Scilit] [PubMed]
- Toriumi, K.; Miyashita, M.; Suzuki, K.; Tabata, K.; Horiuchi, Y.; Ishida, H.; Itokawa, M.; Arai, M. Role of glyoxalase 1 in methylglyoxal detoxification—The broad player of psychiatric disorders. Redox Biol. 2022, 49, 102222. [Google Scholar] [CrossRef] [Scilit] [PubMed]
- Bergner, C.G.; van der Meer, F.; Winkler, A.; Wrzos, C.; Türkmen, M.; Valizada, E.; Fitzner, D.; Hametner, S.; Hartmann, C.; Pfeifenbring, S.; et al. Microglia damage precedes major myelin breakdown in X-linked adrenoleukodystrophy and metachromatic leukodystrophy. Glia 2019, 67, 1196–1209. [Google Scholar] [CrossRef] [Scilit] [PubMed]
- Eichwald, T.; da Silva, L.B.; Staats Pires, A.C.; Niero, L.; Schnorrenberger, E.; Filho, C.C.; Espíndola, G.; Huang, W.L.; Guillemin, G.J.; Abdenur, J.E.; et al. Tetrahydrobiopterin: Beyond Its Traditional Role as a Cofactor. Antioxidants 2023, 12, 1037. [Google Scholar] [CrossRef] [Scilit] [PubMed]
- Wang, Z.; Zhao, M.; Fu, Y.; Liu, L.; Hou, Y.; Shi, M.; Gao, F.; Zhang, G. Transcriptomic profiling of HBV transgenic mouse livers reveals ZBP1-associated necroptotic signaling. Sci. Rep. 2026, 16, 24056. [Google Scholar] [CrossRef] [Scilit] [PubMed]
- Futschik, M.E.; Carlisle, B. Noise-robust soft clustering of gene expression time-course data. J. Bioinform. Comput. Biol. 2005, 3, 965–988. [Google Scholar] [CrossRef] [Scilit] [PubMed]
- Wang, X.; Zhao, M.; Guo, Z.; Song, S.; Liu, S.; Yuan, T.; Fu, Y.; Dong, Y.; Sun, H.; Liu, X.; et al. Urinary proteomic analysis during pregnancy and its potential application in early prediction of gestational diabetes mellitus and spontaneous abortion. Ann. Transl. Med. 2022, 10, 736. [Google Scholar] [CrossRef] [Scilit] [PubMed]
- Loo, Y.H.; Rabe, A.; Potempska, A.; Wang, P.; Fersko, R.; Wisniewski, H.M. Experimental maternal phenylketonuria: An examination of two animal models. Dev. Neurosci. 1983, 6, 227–234. [Google Scholar] [PubMed]
- Tang, S.; Gao, Y. Urinary Proteome Changes during Pregnancy in Rats. Biomolecules 2023, 13, 34. [Google Scholar] [CrossRef] [Scilit] [PubMed]
- Zhang, B.; Horvath, S. A general framework for weighted gene co-expression network analysis. Stat. Appl. Genet. Mol. Biol. 2005, 4, 17. [Google Scholar] [CrossRef] [Scilit] [PubMed]
- Langfelder, P.; Horvath, S. WGCNA: An R package for weighted correlation network analysis. BMC Bioinform. 2008, 9, 559. [Google Scholar] [CrossRef] [Scilit] [PubMed]
- Brass, C.A.; Isaacs, C.E.; Mcchesney, R.; Greengard, O. The effects of hyperphenylalaninemia on fetal development: A new animal model of maternal phenylketonuria. Pediatr. Res. 1982, 16, 388–394. [Google Scholar] [CrossRef] [Scilit] [PubMed]
- Chella Krishnan, K.; El Hachem, E.-J.; Keller, M.P.; Patel, S.G.; Carroll, L.; Vegas, A.D.; Gerdes Gyuricza, I.; Light, C.; Cao, Y.; Pan, C.; et al. Genetic architecture of heart mitochondrial proteome influencing cardiac hypertrophy. eLife 2023, 12, e82619. [Google Scholar] [CrossRef] [Scilit] [PubMed]
- Rabbani, N.; Xue, M.; Thornalley, P.J. Dicarbonyls and glyoxalase in disease mechanisms and clinical therapeutics. Glycoconj. J. 2016, 33, 513–525. [Google Scholar] [CrossRef] [Scilit] [PubMed]
- Uceda, A.B.; Leal-Pérez, F.; Adrover, M. Protein glycation: A wolf in sweet sheep’s clothing behind neurodegeneration. Neural Regen. Res. 2024, 19, 975–976. [Google Scholar] [CrossRef] [Scilit] [PubMed]
- Mazitov, T.; Bregin, A.; Philips, M.-A.; Innos, J.; Vasar, E. Deficit in emotional learning in neurotrimin knockout mice. Behav. Brain Res. 2017, 317, 311–318. [Google Scholar] [CrossRef] [Scilit] [PubMed]
- Mazzarella, R.; Sánchez, J.M.; Fernandez-Fuertes, B.; Egido, S.G.; McDonald, M.; Álvarez-Barrientos, A.; González, E.; Falcón-Pérez, J.M.; Azkargorta, M.; Elortza, F.; et al. Embryo-Induced Changes in the Protein Profile of Bovine Oviductal Extracellular Vesicles. Mol. Cell. Proteom. 2025, 24, 100935. [Google Scholar] [CrossRef] [Scilit] [PubMed]
- Bridi, A.; Perecin, F.; Silveira, J.C.D. Extracellular Vesicles Mediated Early Embryo–Maternal Interactions. Int. J. Mol. Sci. 2020, 21, 1163. [Google Scholar] [CrossRef] [Scilit] [PubMed]
- Di Simone, N.; Di Nicuolo, F.; Marana, R.; Castellani, R.; Ria, F.; Veglia, M.; Scambia, G.; Surbek, D.; Barnea, E.; Mueller, M. Synthetic PreImplantation Factor (PIF) prevents fetal loss by modulating LPS induced inflammatory response. PLoS ONE 2017, 12, e0180642. [Google Scholar] [CrossRef] [Scilit] [PubMed]
- Werner, E.R.; Blau, N.; Thöny, B. Tetrahydrobiopterin: Biochemistry and pathophysiology. Biochem. J. 2011, 438, 397–414. [Google Scholar] [CrossRef] [Scilit] [PubMed]
- Thöny, B.; Auerbach, G.; Blau, N. Tetrahydrobiopterin biosynthesis, regeneration and functions. Biochem. J. 2000, 347, 1–16. [Google Scholar] [CrossRef] [Scilit]
- Mantini, G.; Vallés, A.M.; Le Large, T.Y.S.; Capula, M.; Funel, N.; Pham, T.V.; Piersma, S.R.; Kazemier, G.; Bijlsma, M.F.; Giovannetti, E.; et al. Co-expression analysis of pancreatic cancer proteome reveals biology and prognostic biomarkers. Cell. Oncol. 2020, 43, 1147–1159. [Google Scholar] [CrossRef] [Scilit] [PubMed]
- Gibbs, D.L.; Baratt, A.; Baric, R.S.; Kawaoka, Y.; Smith, R.D.; Orwoll, E.S.; Katze, M.G.; McWeeney, S.K. Protein co-expression network analysis (ProCoNA). J. Clin. Bioinform. 2013, 3, 11. [Google Scholar] [CrossRef] [Scilit] [PubMed]
- Wang, K.; Li, N.; Xu, M.; Huang, M.; Huang, F. Glyoxalase 1 inhibitor alleviates autism-like phenotype in a prenatal valproic acid-induced mouse model. ACS Chem. Neurosci. 2020, 11, 3786–3792. [Google Scholar] [CrossRef] [Scilit] [PubMed]
- Yang, Z.; Zhang, W.; Lu, H.; Cai, S. Methylglyoxal in the Brain: From Glycolytic Metabolite to Signalling Molecule. Molecules 2022, 27, 7905. [Google Scholar] [CrossRef] [Scilit] [PubMed]

Disclaimer/Publisher’s Note: The statements, opinions and data contained in all publications are solely those of the individual author(s) and contributor(s) and not of MDPI and/or the editor(s). MDPI and/or the editor(s) disclaim responsibility for any injury to people or property resulting from any ideas, methods, instructions or products referred to in the content. |
© 2026 by the authors. Licensee MDPI, Basel, Switzerland. This article is an open access article distributed under the terms and conditions of the Creative Commons Attribution (CC BY) license.