


Abstract
Cannabidiol (CBD) is a non-psychoactive phytocannabinoid derived from Cannabis sativa that has gained widespread popularity for both medical and recreational uses. CBD in the form of an oral solution is approved by the Food and Drug Administration (FDA) as Epidiolex for the treatment of certain seizure conditions, but CBD is also sold in numerous hemp-derived non-pharmaceutical products that are not approved by the FDA. Following the legalization of CBD products containing less than 0.3% tetrahydrocannabinol (THC), the market has expanded rapidly, leading to the incorporation of CBD into oils, capsules, topical formulations, foods, beverages, and vaping products. However, unlike conventional FDA-approved pharmaceuticals, many over-the-counter CBD products are manufactured without standardized quality control measures, potentially resulting in variability in cannabinoid content and subsequently CBD bioavailability and biological effects. Here, we use in-house reversed-phase high-performance liquid chromatography (HPLC) for accurate and reproducible comparison of CBD recovery under organic-solvent extraction and simulated biological fluid from commercially available non-pharmaceutical CBD products. All five tested hemp products yielded CBD contents that fell within the expected range of the labeled amount when extracted using a methanol and isopropanol mixture. However, there was a wide range of variability in CBD recovery when the same products were extracted under identical conditions using simulated gastric, intestinal, or sublingual fluids. This study provides further evidence that standardized manufacturing practices to govern the processing and development of hemp-derived CBD products need to be developed to ensure adequate release of CBD into biological fluids, thereby increasing the potential for high CBD bioavailability and accurate dosing.
1. Introduction
Marijuana and hemp are derived from Cannabis sativa, a flowering plant in the Cannabaceae family, but differ primarily in their cannabinoid composition. Marijuana contains relatively high concentrations of Δ9-tetrahydrocannabinol (THC), the principal psychoactive cannabinoid, whereas hemp contains very low concentrations of THC and is commonly used as a source of cannabidiol (CBD), a non-intoxicating cannabinoid [1]. CBD and THC exert distinct effects on the two major endogenous cannabinoid receptors CB1 and CB2, altering the functions of the endocannabinoid system including regulation of hypothalamic–pituitary–adrenal response, pain perception, immune function, appetite, and energy balance [2,3,4]. Consequently, there is a growing interest in the potential therapeutic applications of THC and CBD, as well as targeting CB1 and CB2 for therapeutic application [5,6]. In the United States, dronabinol, a synthetic form of THC, is FDA-approved for the treatment of anorexia and chemotherapy-induced nausea and vomiting [7] and Epidiolex®, an oral solution of CBD, is FDA-approved for certain types of seizures [8,9]. In addition to these approved indications, multiple clinical trials are ongoing to evaluate CBD use as an intervention/treatment in a wide range of clinical indications (Clinicaltrials.gov; accessed on 30 August 2026) [10,11].
Consumer access to CBD products in the United States expanded substantially following the removal of hemp and its derivatives from the definition of marijuana under the Controlled Substances Act [12]. CBD has since been incorporated into numerous commercially available products, including oils, capsules, topical formulations, foods, beverages, and vaping products. Still, CBD and hemp products are subject to the Federal Food, Drug, and Cosmetic Act and the FDA has issued numerous warning letters to companies selling unapproved CBD products in violation of that Act [13,14]. The fact that most commercially available CBD products have not undergone rigorous manufacturing, dosing, and quality-control requirements applied to FDA-approved pharmaceuticals continues to raise concerns regarding the safety of these products. Torović et al. [15] described these concerns using a “CBD Hazard Triangle,” highlighting the intersection of CBD’s pharmacological activity and potential for drug interactions, its evolving regulatory status, and risks associated with inconsistent cannabinoid content, undeclared THC, and inaccurate labeling. In an analysis of 427 CBD-related safety notifications submitted to the European Union’s Rapid Alert System for Food and Feed (RASFF) between 2018 and 2025, frequent discrepancies between labeled and analytically determined CBD concentrations were reported and THC was identified in 26.7% of these CBD-related RASFF notifications [15]. In an analysis of 84 CBD products purchased online, only 30.95% contained CBD concentrations consistent with their labels, whereas 42.85% contained less CBD and 26.19% contained more CBD than labeled [16]. Other investigations have similarly identified discrepancies in cannabinoid concentrations across commercially available tinctures, gummies, vaping products, and topical formulations [17,18]. Such variability is particularly concerning for consumers using CBD for therapeutic purposes, as inaccurate labeling may result in unintended exposure to CBD or THC.
Third-party laboratory testing is currently the primary quality control method available for non-pharmaceutical CBD/hemp products. After analysis, these labs issue a certificate of analysis that provides cannabinoid quantities based on the method used at their laboratory. Consumers can access certificates of analysis by scanning a QR code on the bottle or through the company’s website using the batch number. Some certificates of analysis inform consumers of the type of test performed but do not provide the protocol used for cannabinoid testing. Many analytical techniques have been developed for quantification of cannabinoids. A recent review identified gas chromatography (GC) and high-performance liquid chromatography (HPLC) as the most common cannabinoid quantification techniques [19]. GC is typically coupled with mass spectrometry (MS) or flame ionization detection (FID), with the latter providing higher accuracy and requiring more specialized cannabinoid standards. On the other hand, HPLC, often coupled with UV or diode-array detection, remains the gold standard for cannabinoid verification [20,21], owing to its ability to resolve and measure multiple cannabinoids without the derivatization required for gas chromatography [22]. HPLC is commonly available equipment in academic and healthcare settings, uses affordable standards, and provides reliable CBD and THC determinations with an accuracy level sufficient for the goal of routine cannabinoid analysis.
Existing HPLC-based studies have characterized cannabinoid content in the product itself, typically via methanol or ethanol extraction, without examining how that content behaves under conditions simulating human ingestion. Therefore, the present study evaluated CBD release from commercially available oral hemp oil products using both conventional alcoholic extraction and conditions designed to simulate the physiological processes preceding absorption. Comparing CBD recovery under organic-solvent extraction and simulated biological fluid provides greater insight into whether labeled or analytically measured CBD content accurately reflects the amount of CBD potentially available for absorption following oral administration.
2. Materials and Methods
2.1. Materials
High-Performance Liquid Chromatography (HPLC) grade methanol, isopropanol, and ethanol were purchased from Fisher Scientific (Fischer Scientific, Pittsburgh, PA, USA). Simulated intestinal fluid USP XXII formulation (CAS Number-7778-77-0, pH 7.4–7.6; without pancreatin) and simulated gastric fluid (0.2% (w/v) sodium chloride in 0.7% (v/v) hydrochloric acid, pH = 1–1.4; without pepsin) were purchased from RICCA Chemical (Ricca Chemical Company, Arlington, TX, USA), Sodium dodecyl Sulfate (SDS) solution [20% (w/v)] from Bio-Rad (Hercules, CA, USA), pancreatin (porcine pancreas lyophilized powder), and pepsin (porcine stomach, powder) were purchased from Alfa Aesar (Ward Hill, MA, USA), Trifluoroacetic acid (TFA, 99.9%) reagent was purchased from Spectrum (Fischer Scientific; Pittsburgh, PA, USA), acetonitrile (HPLC grade, 99.9%), and other chemicals and reagents were obtained from VWR Chemicals (Avantor, Solon, OH, USA). HPLC-quality water was prepared using a Milli-Q Water Purification System (MilliporeSigma, Burlington, TX, USA).
Certified reference THC cannabinoids Mixture-3 containing 1.0 mg/mL of cannabidiol (CBD), cannabinol (CBN) and (-)-delta-9-tetrahydrocannabinol (THC) in methanol was purchased from Cerilliant, Sigma-Aldrich (Round Rock, TX, USA), catalog number T-108-0.5 mL. Five CBD oral products with labeled CBD contents ranging from 10 to 20 mg/mL were purchased from local or online stores and marked as Dosage Form 01 to 05 (DF01 to DF05). These dosage forms were labeled by distributors as CBD tincture, Hemp Extract, Hemp Tincture, CBD oil, and/or Hemp extract. Suggested uses of these products include placing 1 serving (1 mL, one full dropper) under the tongue and holding for 15–30 s, then swallowing, or using 0.5 mL in 8 oz water. Initial doses for these products ranged between 5 and 40 mg, with users advised to adjust serving as needed. One product suggested starting with 25–50 mg CBD, waiting 2 h, and then using more as needed. Standard storage conditions in a dry, cool, and dark place were recommended. One product is labeled as a full-spectrum, standard-potency dietary supplement, one is labeled as a broad-spectrum, ultra-purified CBD, one is labeled as a nano-cannabidiol dietary supplement, and two are labeled as Hemp Supplement, Regular potency. Additives used in these products include coconut MCT oil in three products and vegetable glycerin in the remaining two products.
2.2. CBD Extraction
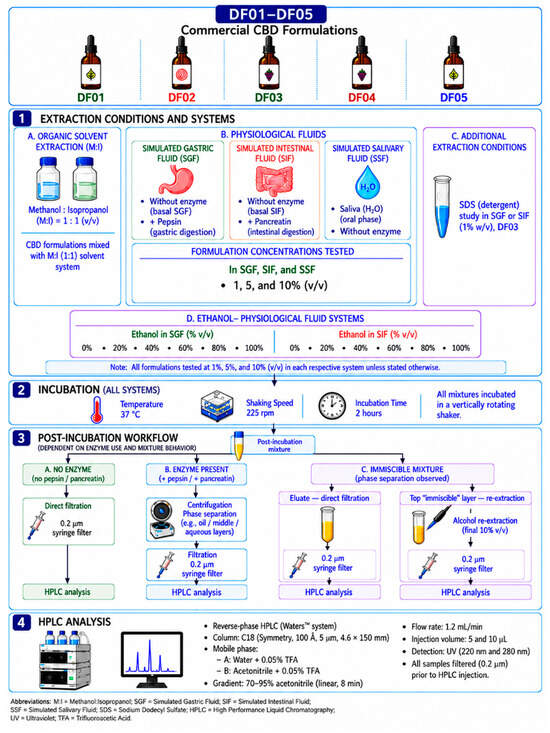
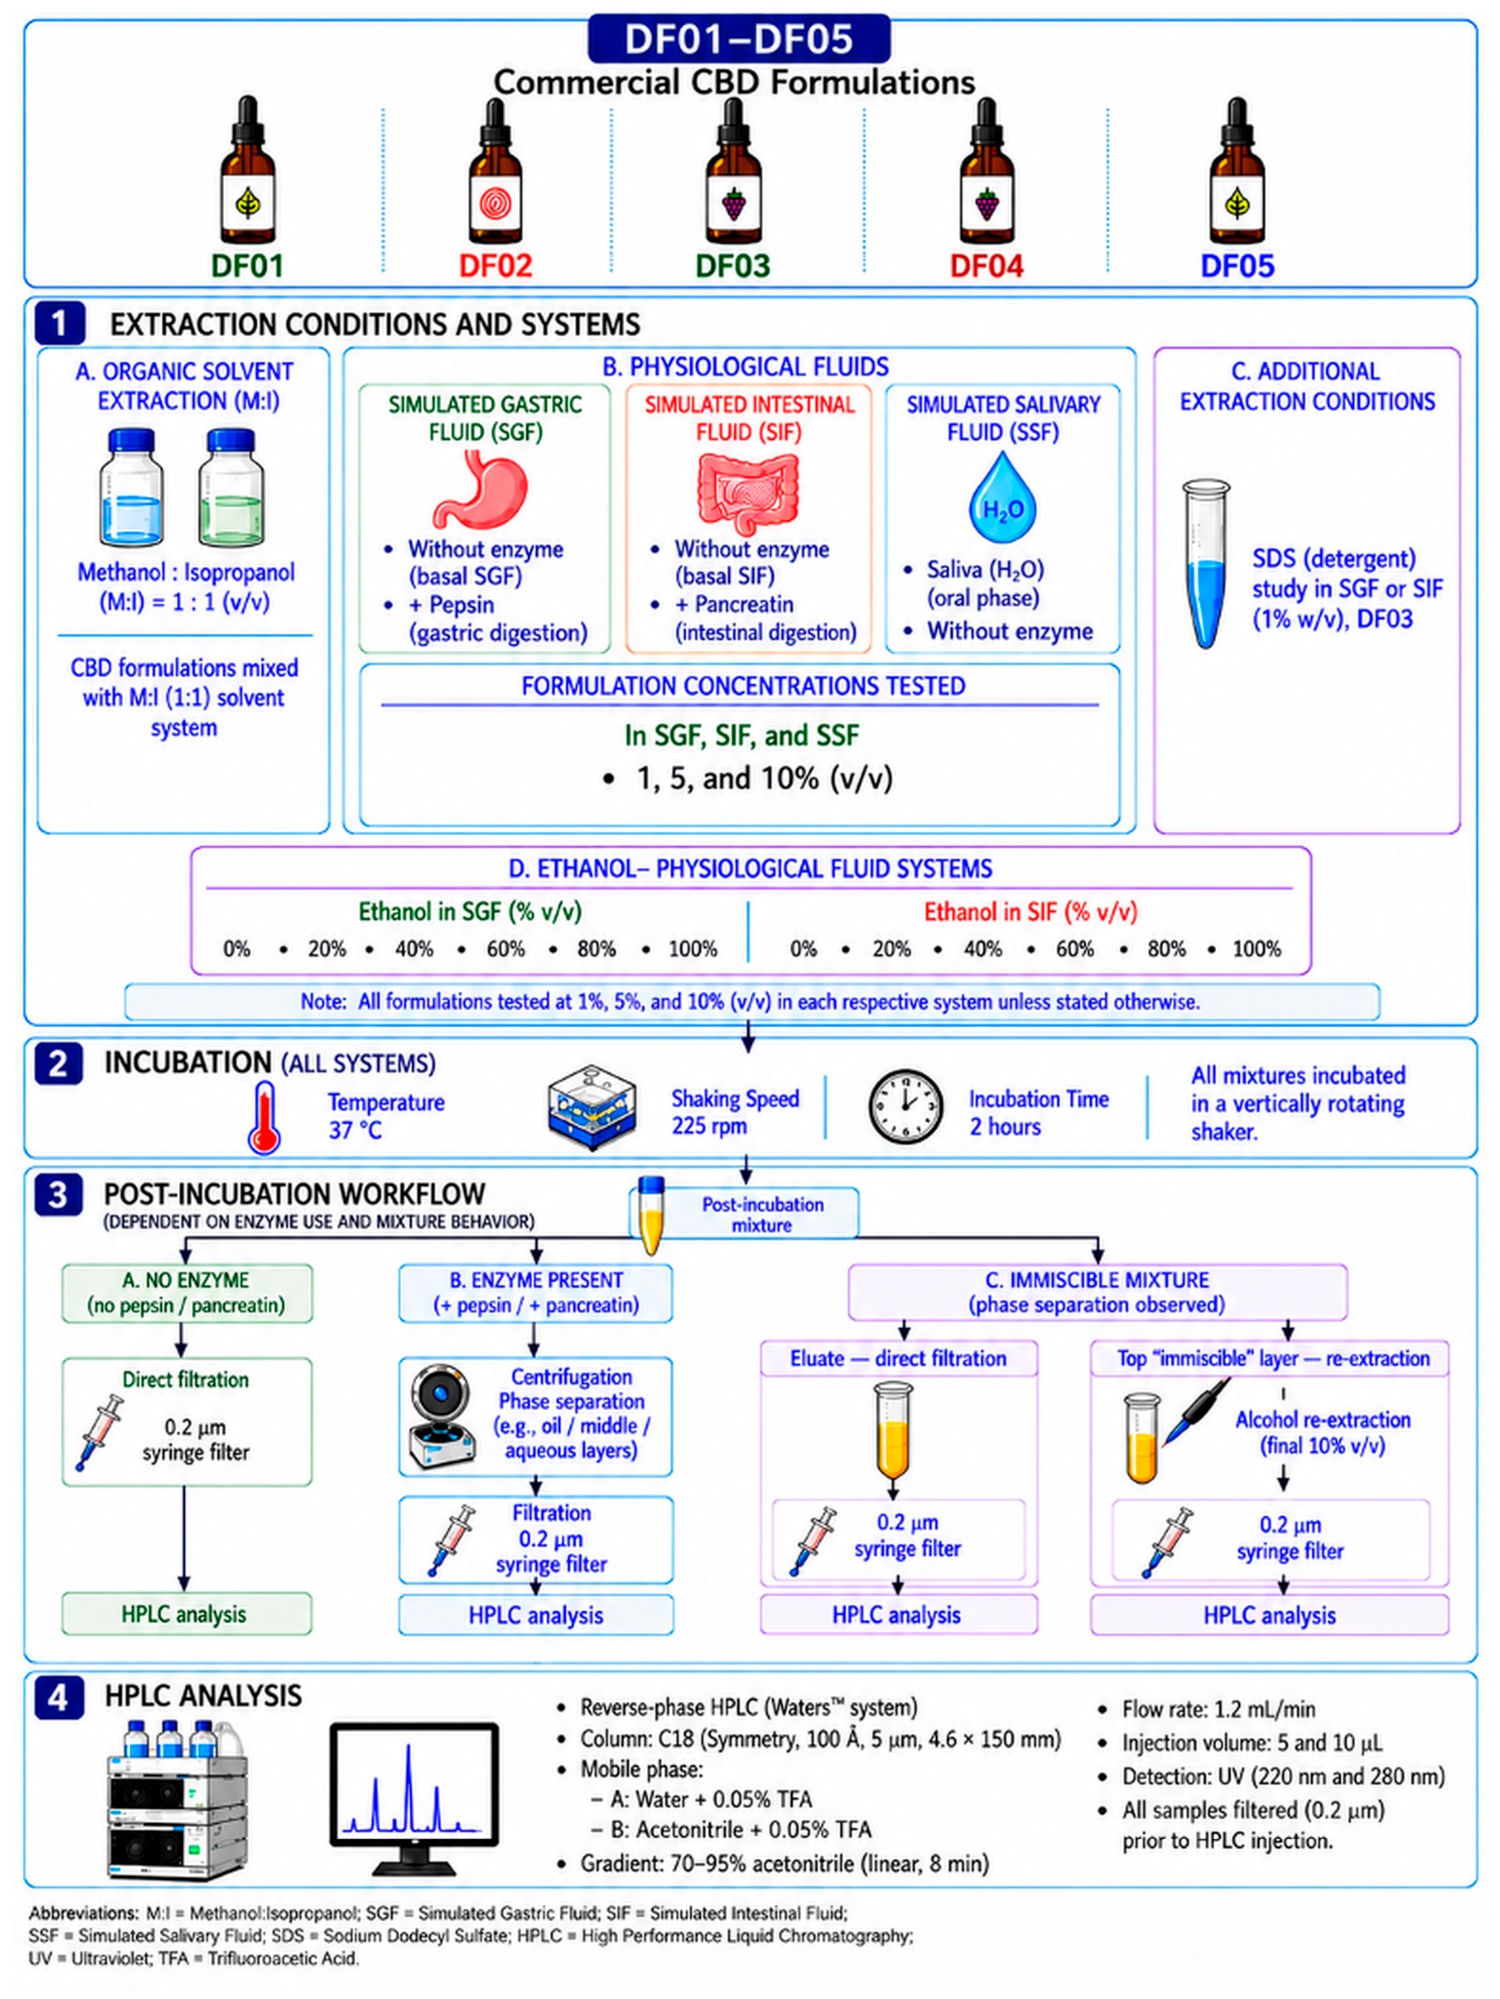
The overall methodology used for the extraction, fractionation, and quantification of CBD recovery using organic solvents and simulated physiological fluids is described in Figure 1. Total extraction of cannabinoids from CBD products was done using a mixture of methanol: isopropanol (1:1 v:v; hereafter referred to as M:I). CBD release under physiological conditions mimicking gastric and intestinal fluids was evaluated using simulated gastric fluid (SGF) containing 3.2 mg/mL pepsin and simulated intestinal fluid (SIF) containing 10 mg/mL pancreatin, respectively. Cannabinoid contents of CBD products were extracted at 37 °C for 2 h with gentle shaking at 225 rpm in a vertically rotating shaker to maximize active ingredient extraction. Extractions were carried out at 1%, 5% and 10% (v/v) in the intended extraction media. Following extraction, all the products were filtered through a 0.2 μm syringe filter into an amber HPLC vial. This process was repeated for each product (DF01–DF05) in triplicate. Samples with enzymes added to the extraction media resulted in thick mixtures, requiring centrifugation (15 min at 15,000 rpm) to remove insoluble materials before filtration.
Figure 1.
Schematic of overall workflow used for extraction and quantification of CBD contents in commercially available non-pharmaceutical CBD oral formulations. This figure was made using FigureLabs (https://www.figurelabs.ai/), accessed on 30 August 2026.
2.3. High-Performance Liquid Chromatography (HPLC)
HPLC analysis was performed using a WatersTM HPLC system using a method developed based on previously published protocols (e.g., Shimadzu Application News No. HPLC-018). A symmetry reversed-phase C18 Column, 100 Å, 5 µm, 4.6 mm × 150 mm (Water SKU: WAT045905, Milford, MA, USA) was used as a stationary phase. A linear gradient composed of 70–95% acetonitrile containing 0.05% trifluoroacetic acid in deionized water containing 0.05% trifluoroacetic acid over 8 min at a flow rate of 1.2 mL/min was used as a mobile phase. All the samples were filtered using 0.2 µm 4 mm filters (Thermo Scientific, Waltham, MA, USA). At least two aliquots (5 and 10 µL) from the eluate of each biological replicate were injected using an automated injector. Separated molecules were detected using a dual 2489 UV/Visible Waters detector at 220 nm and 280 nm.
2.4. Statistical Analysis
The area under the curves (AUCs) of the CBD peak from HPLC fractionation at at least two injection volumes (5 and 10 µL) per eluate (biological replicate) were normalized to the injection volume, averaged, and converted to µg CBD using the slope of the Mix-3 standard CBD calibration curve. Data from at least three biological replicates were plotted and statistically analyzed using GraphPad Prism 10.6.1. One-way ANOVA with Tukey’s post hoc multiple comparison test was used to evaluate the statistical significance of CBD recovery among the three types of extraction media.
3. Results and Discussions
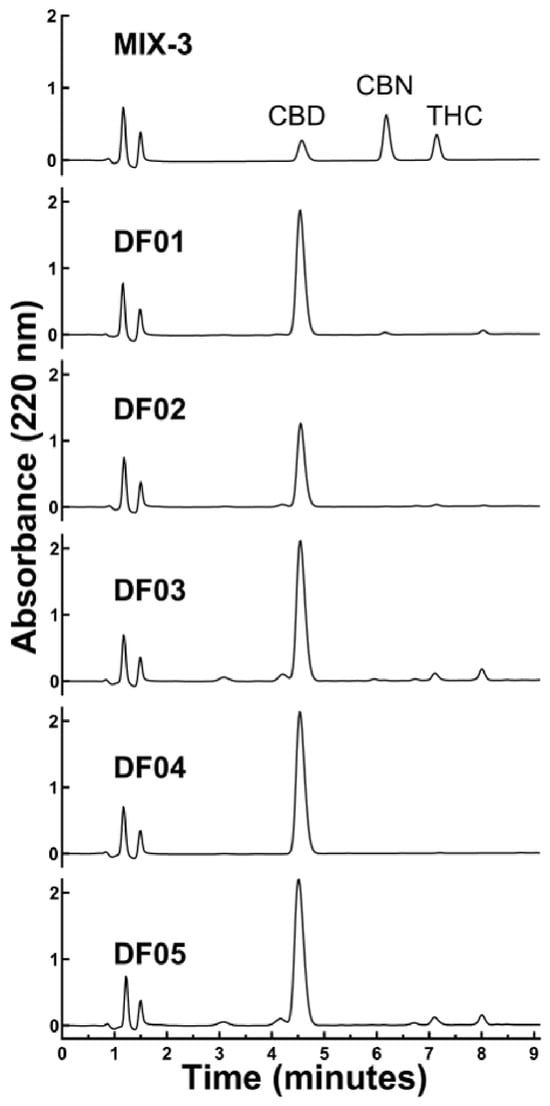
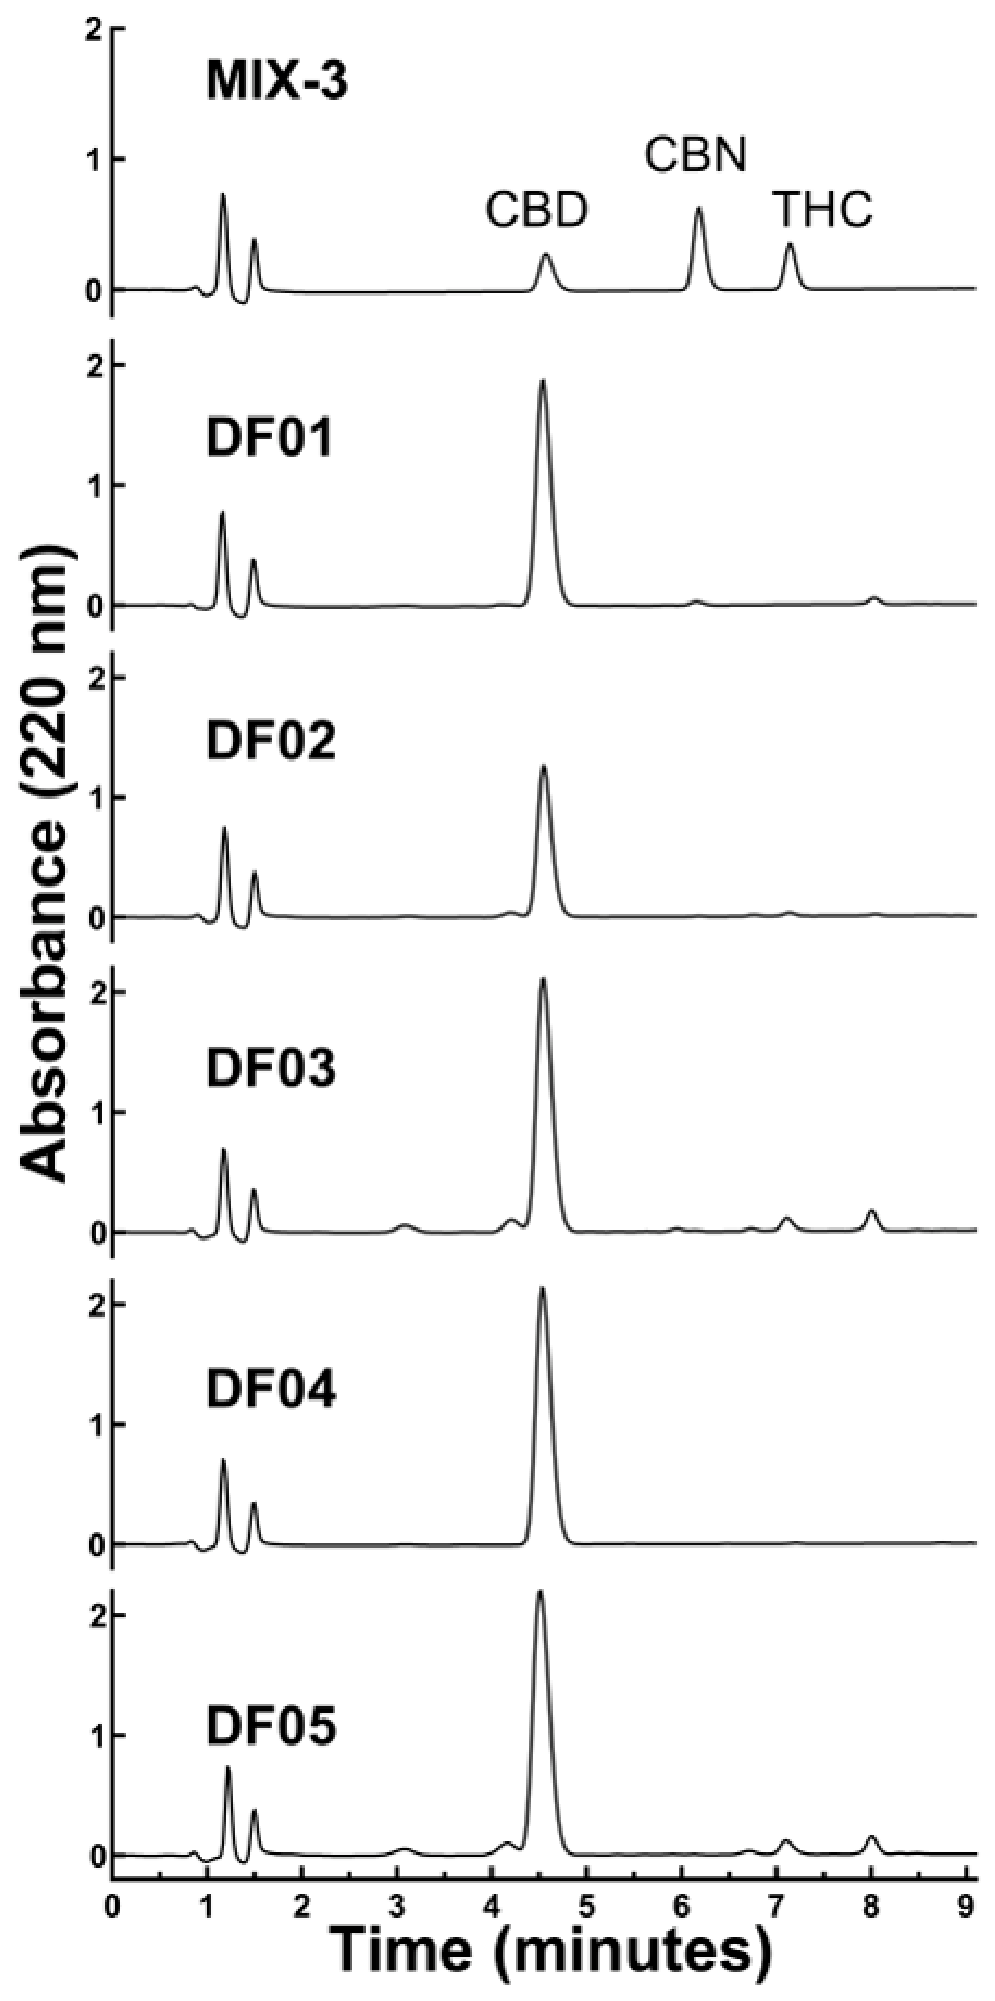
Our first set of experiments focused on the development and optimization of an in-house HPLC method because of its cost-effectiveness and availability in our academic research facility. As described in the Section 2, we used a C18 reversed-phase column as the stationary phase and UV absorbance at 220 and 280 nm for detection. Method optimization included evaluation of mobile phase composition, linear/non-linear gradient profile, injection volume, flow rate, and run time to obtain adequate separation of CBD and THC with good peak resolution and reproducibility. We used samples prepared from a certified reference THC cannabinoids Mixture-3 from Cerilliant, Sigma-Aldrich (hereafter referred to as Mix-3) containing 1.0 mg/mL CBD, CBN, and THC and from Dosage Form 1 (DF01) to evaluate different HPLC conditions. We concluded from these preliminary studies that a linear gradient of acetonitrile in water (70–95% over 8 min), a flow rate of 1.2 mL/min, and injection volumes of 5, 10, and 20 µL are optimal. Representative HPLC chromatographs showing the elution profile of Mix-3 and DF01–DF05 extracted in methanol:isopropanol (1:1 v/v) are shown in Figure 2. CBD was eluted with a retention time of ~4.3 min at ~85% acetonitrile in water. Peak height and area under the curve (AUC) for CBD and THC absorbance at 220 nm were determined and the AUC was used for quantification of the quantity of CBD because it yielded more accurate determination than peak height. All the products tested yielded minimal, if any, THC content recovery when extracted in an M:I mixture and no further quantification of THC content was necessary.
Figure 2.
Representative HPLC chromatographs showing the elution profile of Mix-3 standard and DF01-DF05 extracted at 5% v/v in a 1:1 mixture of methanol and isopropanol. Reversed-phase HPLC was performed on a Water HPLC system, using a C18 column. Following extraction DF01–DF05 were filtered and 10 µL was injected using an automated sampler. A non-linear elution gradient of 70–95% solvent B in 8 min at 1.2 mL/min was used, with a mobile phase consisting of 0.05% TFA in acetonitrile (Solvent B) and 0.05% TFA in water (Solvent A). The elution of CBD was monitored by absorbance at 220 nm.
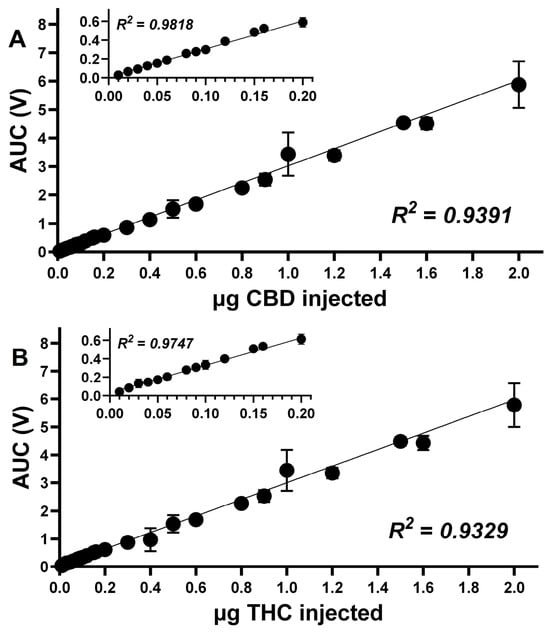
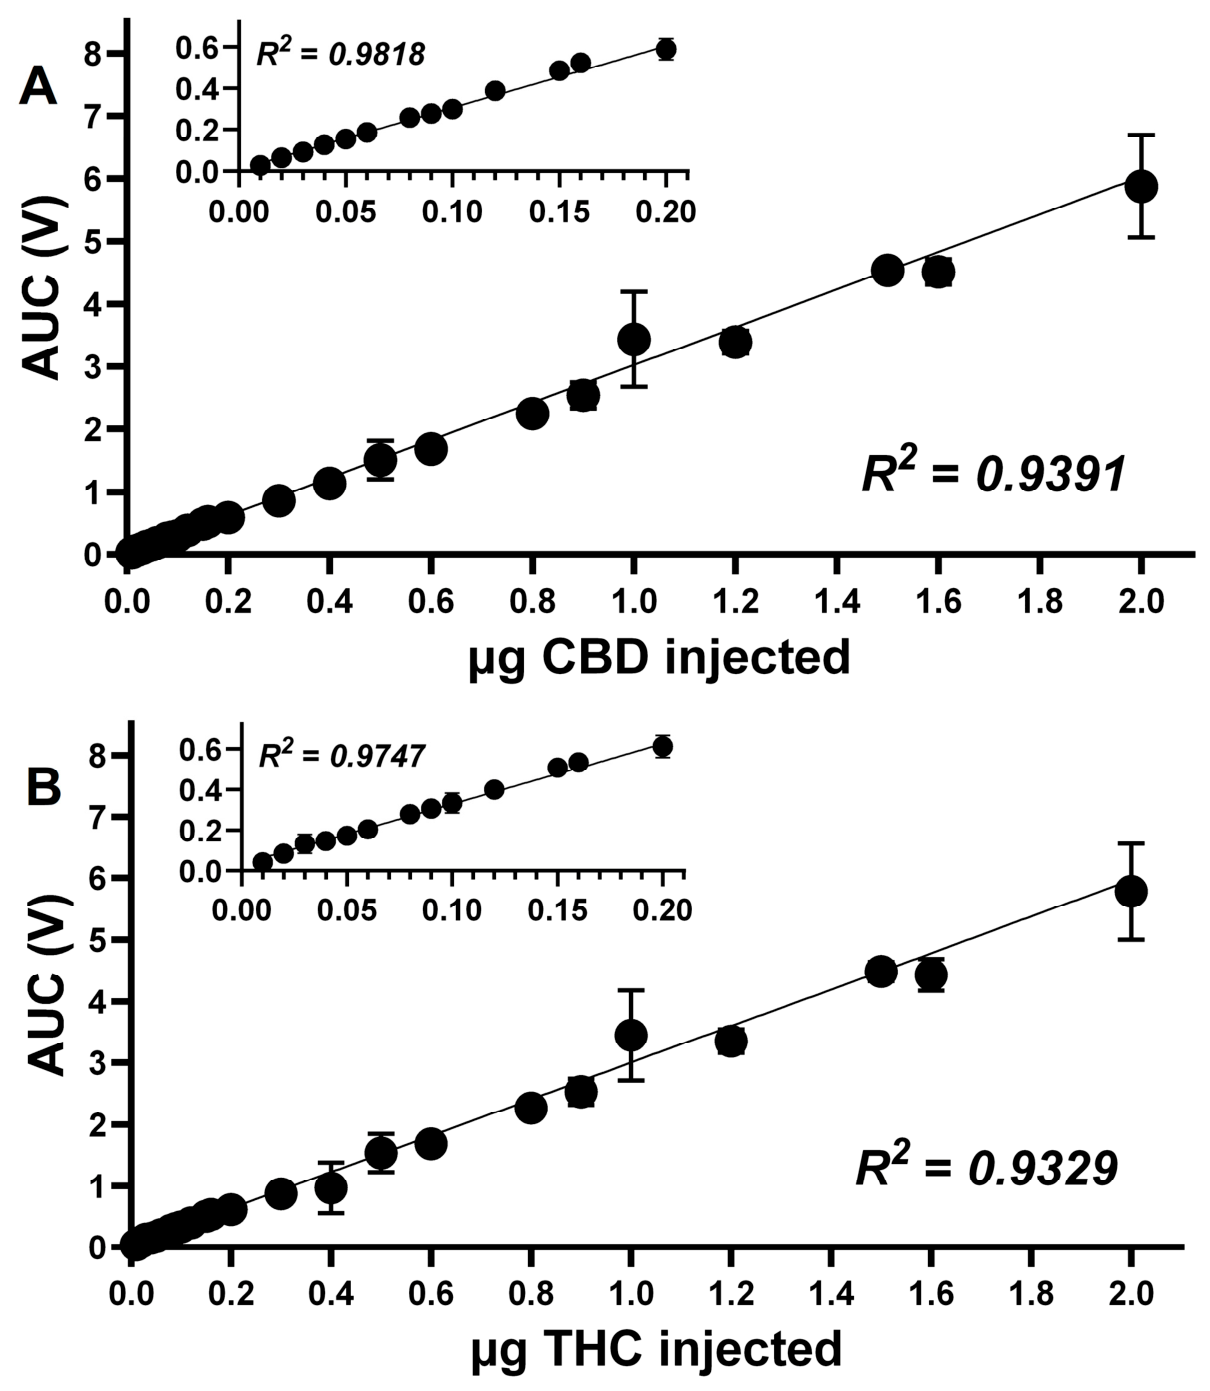
To construct a concentration-absorbance calibration curve for CBD and THC, serial dilutions of Mix-3 (1–100% v/v in methanol-isopropanol mixture) were prepared and aliquots containing 0.01–10 μg CBD and THC were fractionated by HPLC. Figure 3A,B show a linear concentration absorbance relationship for CBD (R2 = 0.94) and THC (R2 = 0.93) up to 2 μg. This linear correlation maintained up to 5 μg CBD (R2 = 0.98) and started to deviate from linearity (R2 = 0.84) when higher CBD (6–10 μg) was included in the curve fit To establish the lower detection and quantification limits, we fitted the concentration absorbance relationship for CBD (R2 = 0.98) and THC (R2 = 0.97) when injected at 0.01–0.2 μg (shown in inserts in Figure 3A,B). This confirms accurate and reproducible quantification of CBD with a dynamic range of 0.1–5 μg under these HPLC fractionation conditions. The slope of the CBD concentration-absorbance calibration curve was determined from the curve fit (linear equation, Y = 3.00 + 0.03) and used to convert the AUC of the CBD peak to CBD content for DF01 to DF05.
Figure 3.
CBD (A) and THC (B) standard calibration curves. Area under the curves (AUCs) of peaks corresponding to CBD and THC elution in HPLC chromatographs (absorbance at 220 nm) following fractionation of increasing concentration of Certified reference THC cannabinoid Mixture-3. The AUC was plotted as a function of the calculated amount of CBD and THC in the injected mixture. Curves were fitted to a linear equation using GraphPad Prism and slopes were used for quantification of CBD and THC in DF01–DF05. Inserts show the same data plotted at a different scale to visualize data for CBD and THC below 0.2 μg.
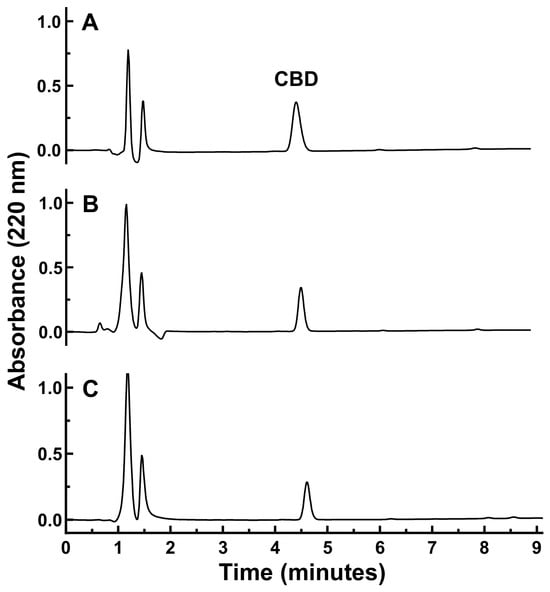
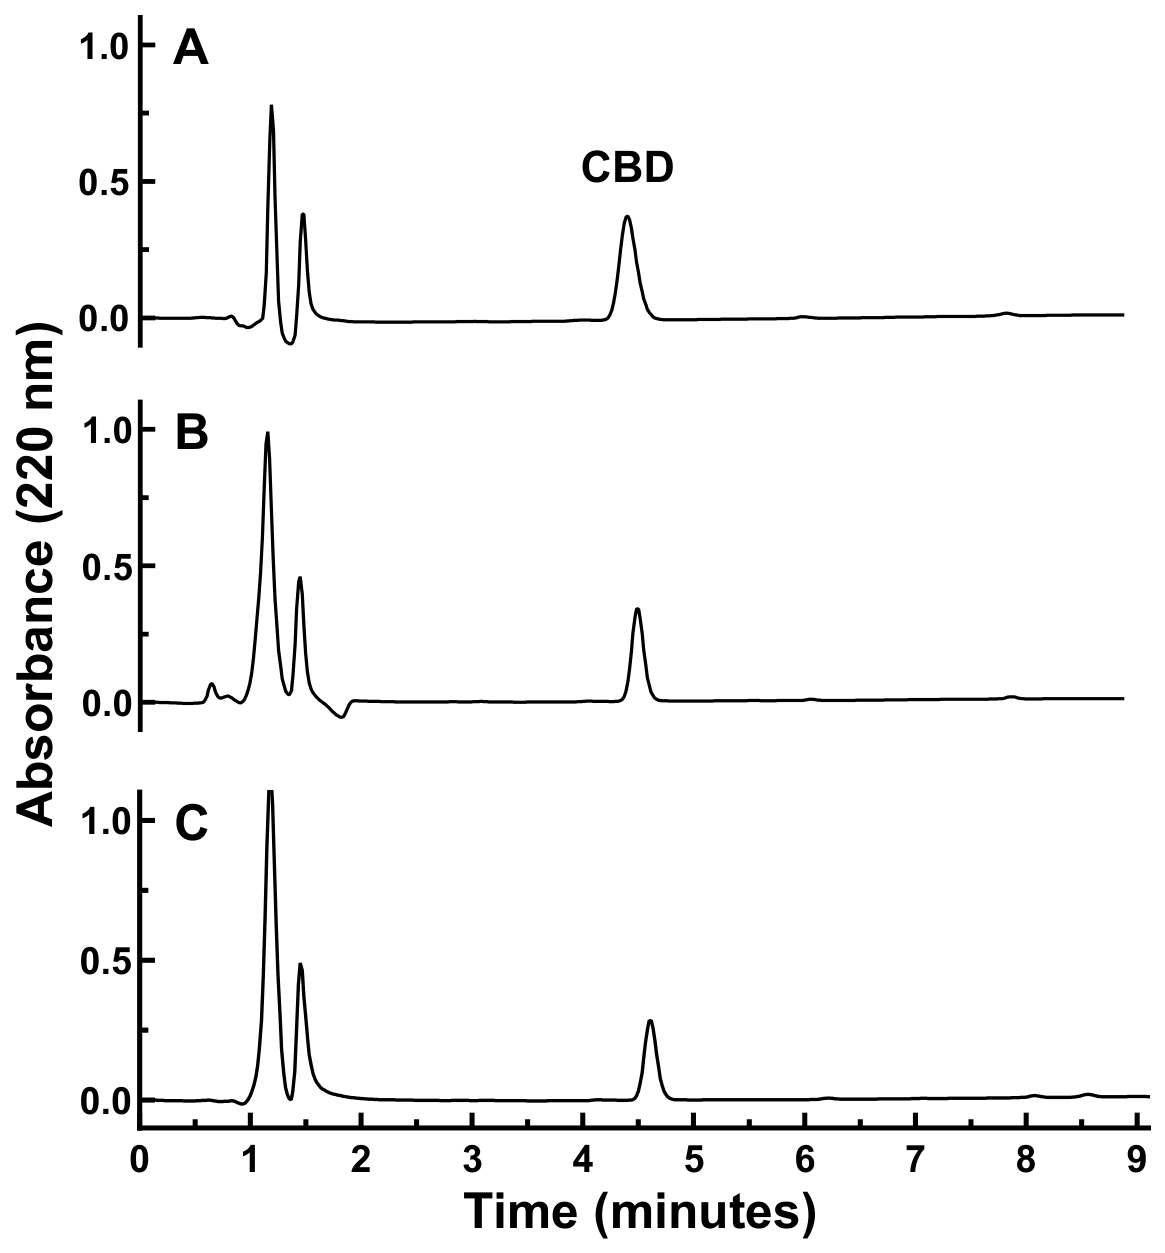
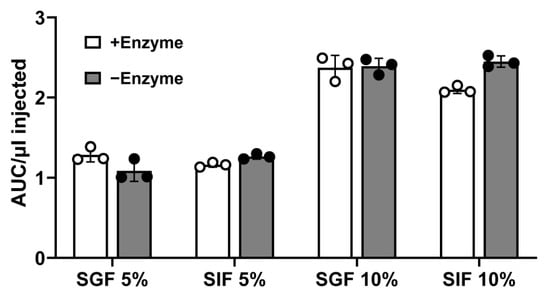
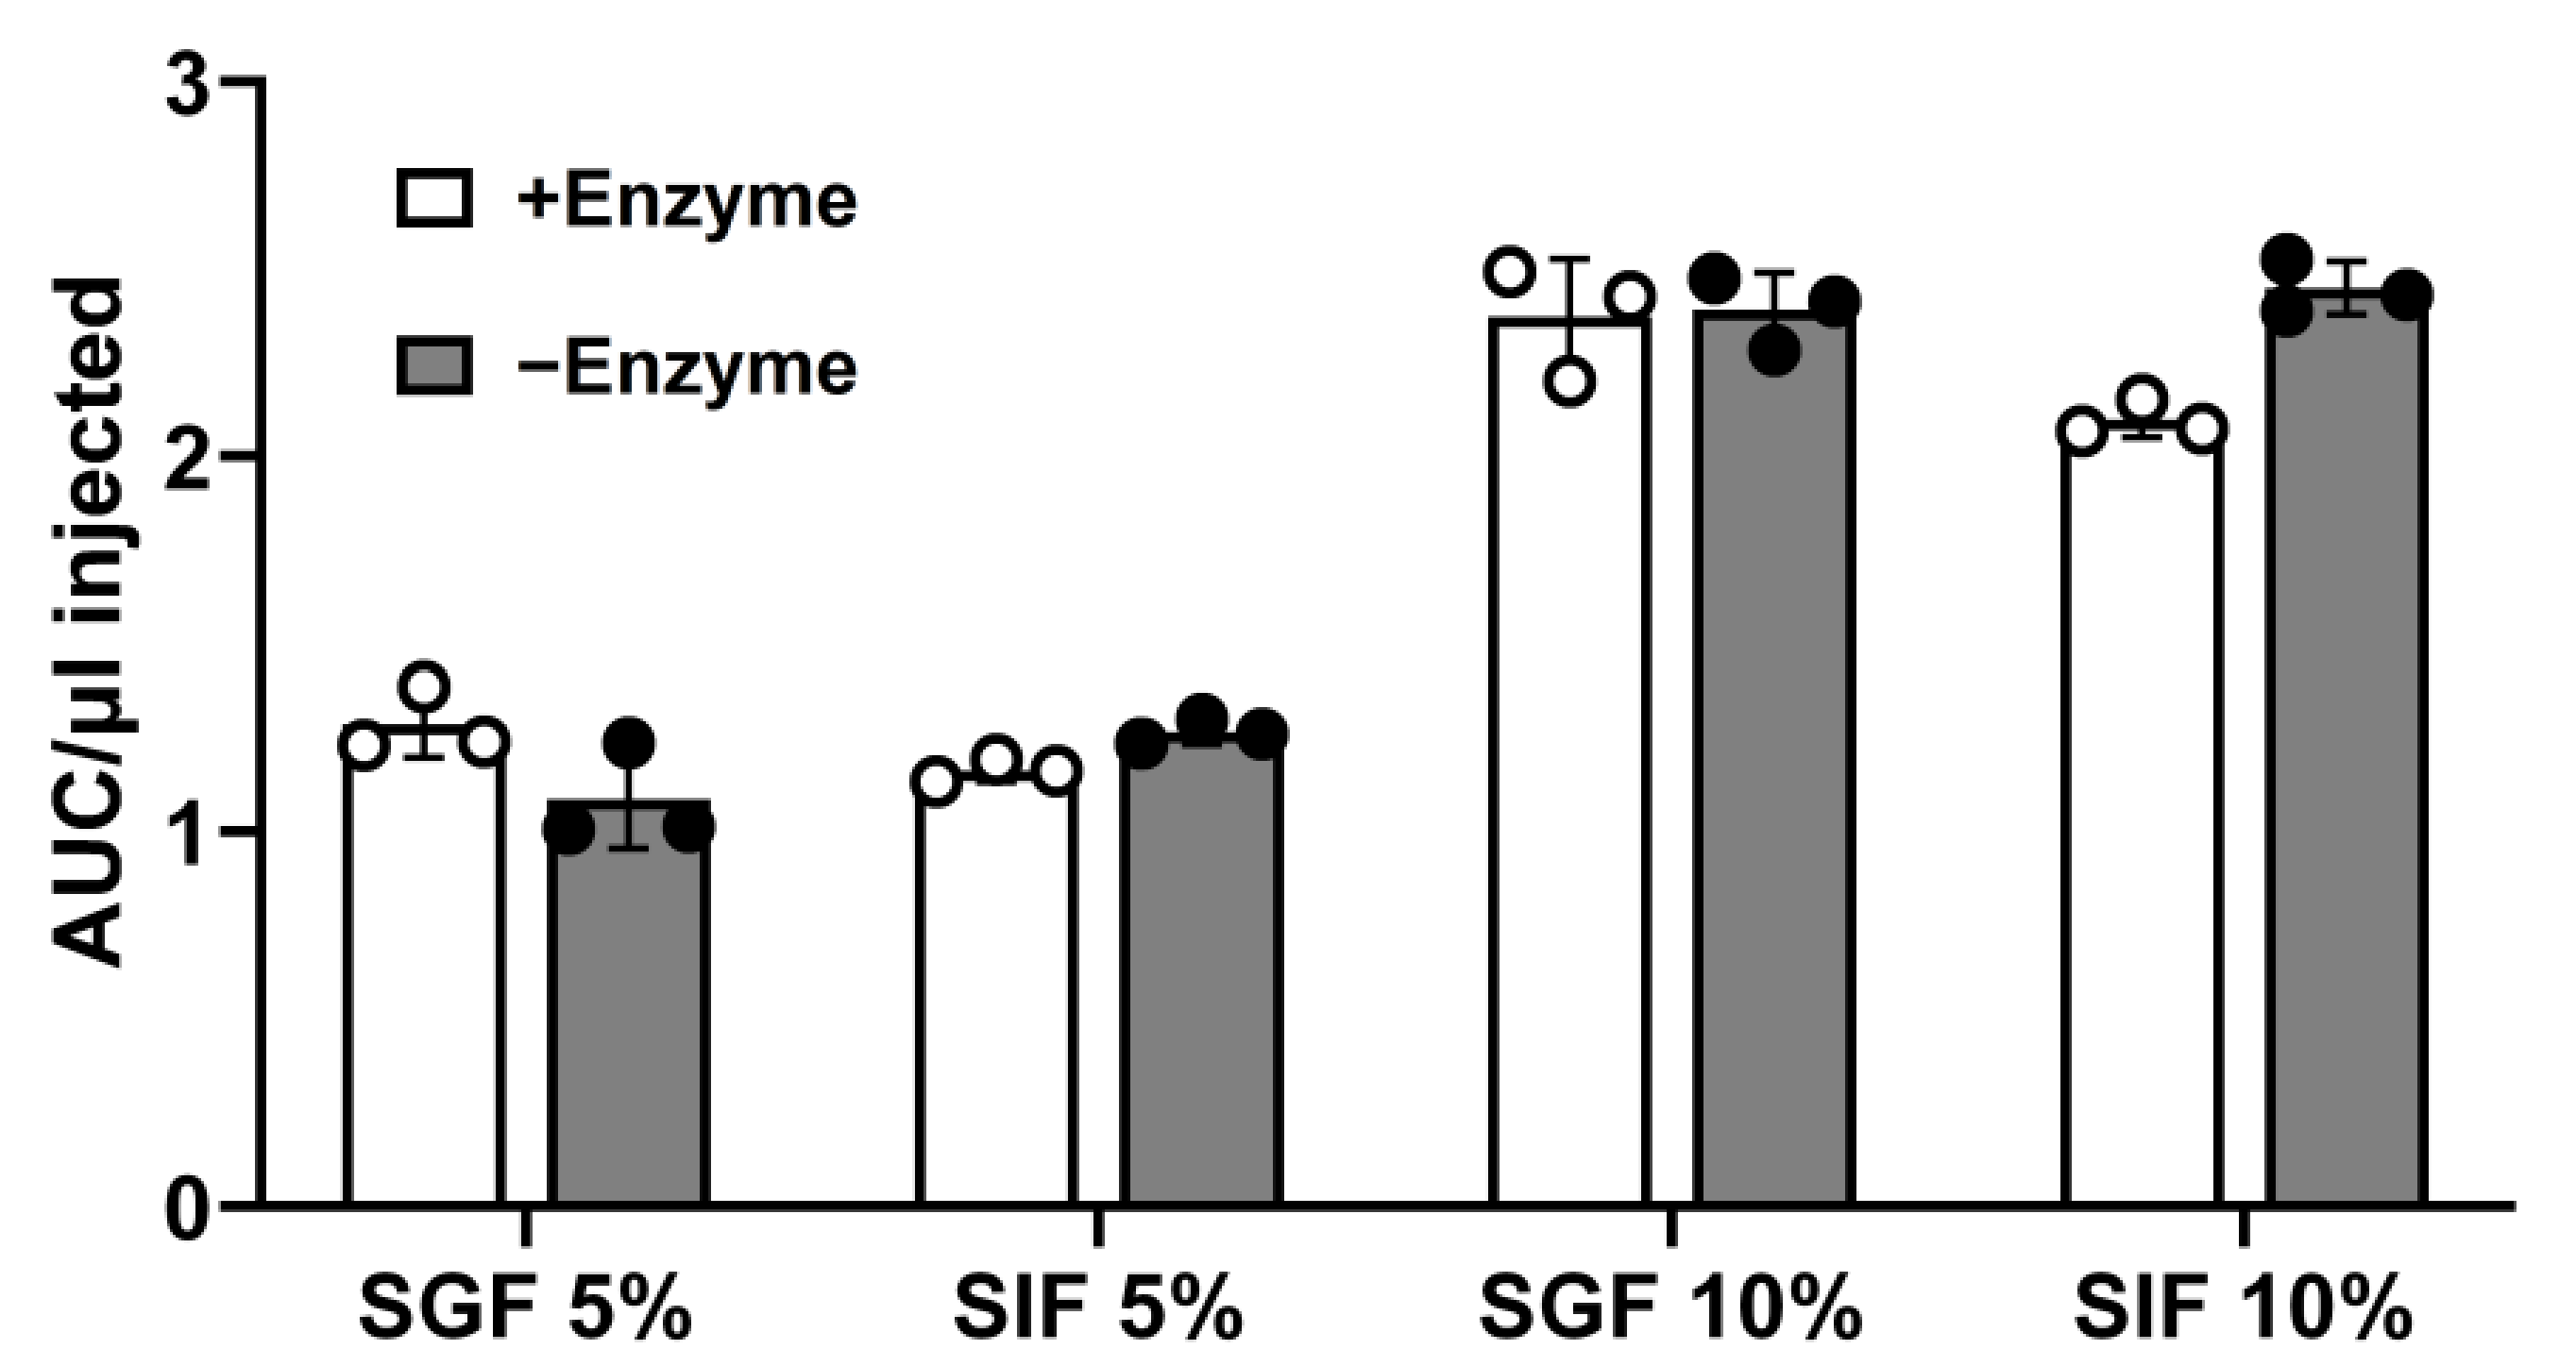
Based on the labeled CBD concentration (5–20 mg/mL) of the product we intended to analyze, it was determined that extractions at product-to-extraction-media ratios of 1, 5, and 10% will cover the full range of expected CBD and THC yields and help account for the low water solubility of CBD. Then, HPLC fractionation of two aliquots (5 and 10 μL) from each extract was used to maintain the eluted CBD within the dynamic range of our HPLC detection. Extraction using a 1% product-to-extraction-media ratio allowed more efficient extraction due to higher solubility, whereas extraction using 5 and 10% products with the M:I mixture resulted in prominent CBD peaks in HPLC elution and more accurate quantification especially for samples with low CBD recovery. As shown in Figure 4, HPLC fractionation of DF01 following extraction in M:I mixture, SGF, and SIF at a 1% product-to-extraction-media ratio resulted in detection of clear CBD peaks and allowed accurate quantification of CBD. It also demonstrates that extractions in SGF, SIF, and M:I have similar efficiency and can be used for direct comparison of product recovery under different conditions. Extraction in the presence or absence of enzymes (pepsin in SGF and pancreatin in SIF) did not alter CBD recovery (Figure 5). Because the presence of enzymes in SGF and SIF added technical difficulties (adding a centrifugation step), most extractions were done without enzymes added. Data from all the extractions done with and without enzymes added were combined in our analysis.
Figure 4.
Representative HPLC chromatographs comparing CBD elution profile from DF01 following extraction at 1% v/v product to extraction media in a mixture of methanol and isopropanol (A), simulated gastric fluid (B), and simulated intestinal fluid (C). Reversed-phase HPLC was performed and monitored as described in the methods section and in the Figure 2 legend.
Figure 5.
Removal of pepsin from simulated gastric fluid (SGF) and pancreatin from simulated intestinal fluid (SIF) has no effect on CBD recovery from DF02.
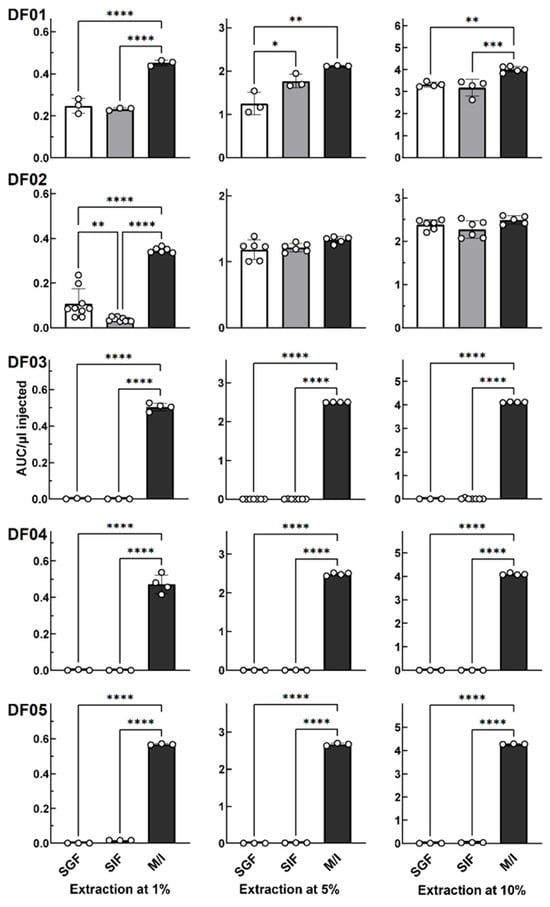
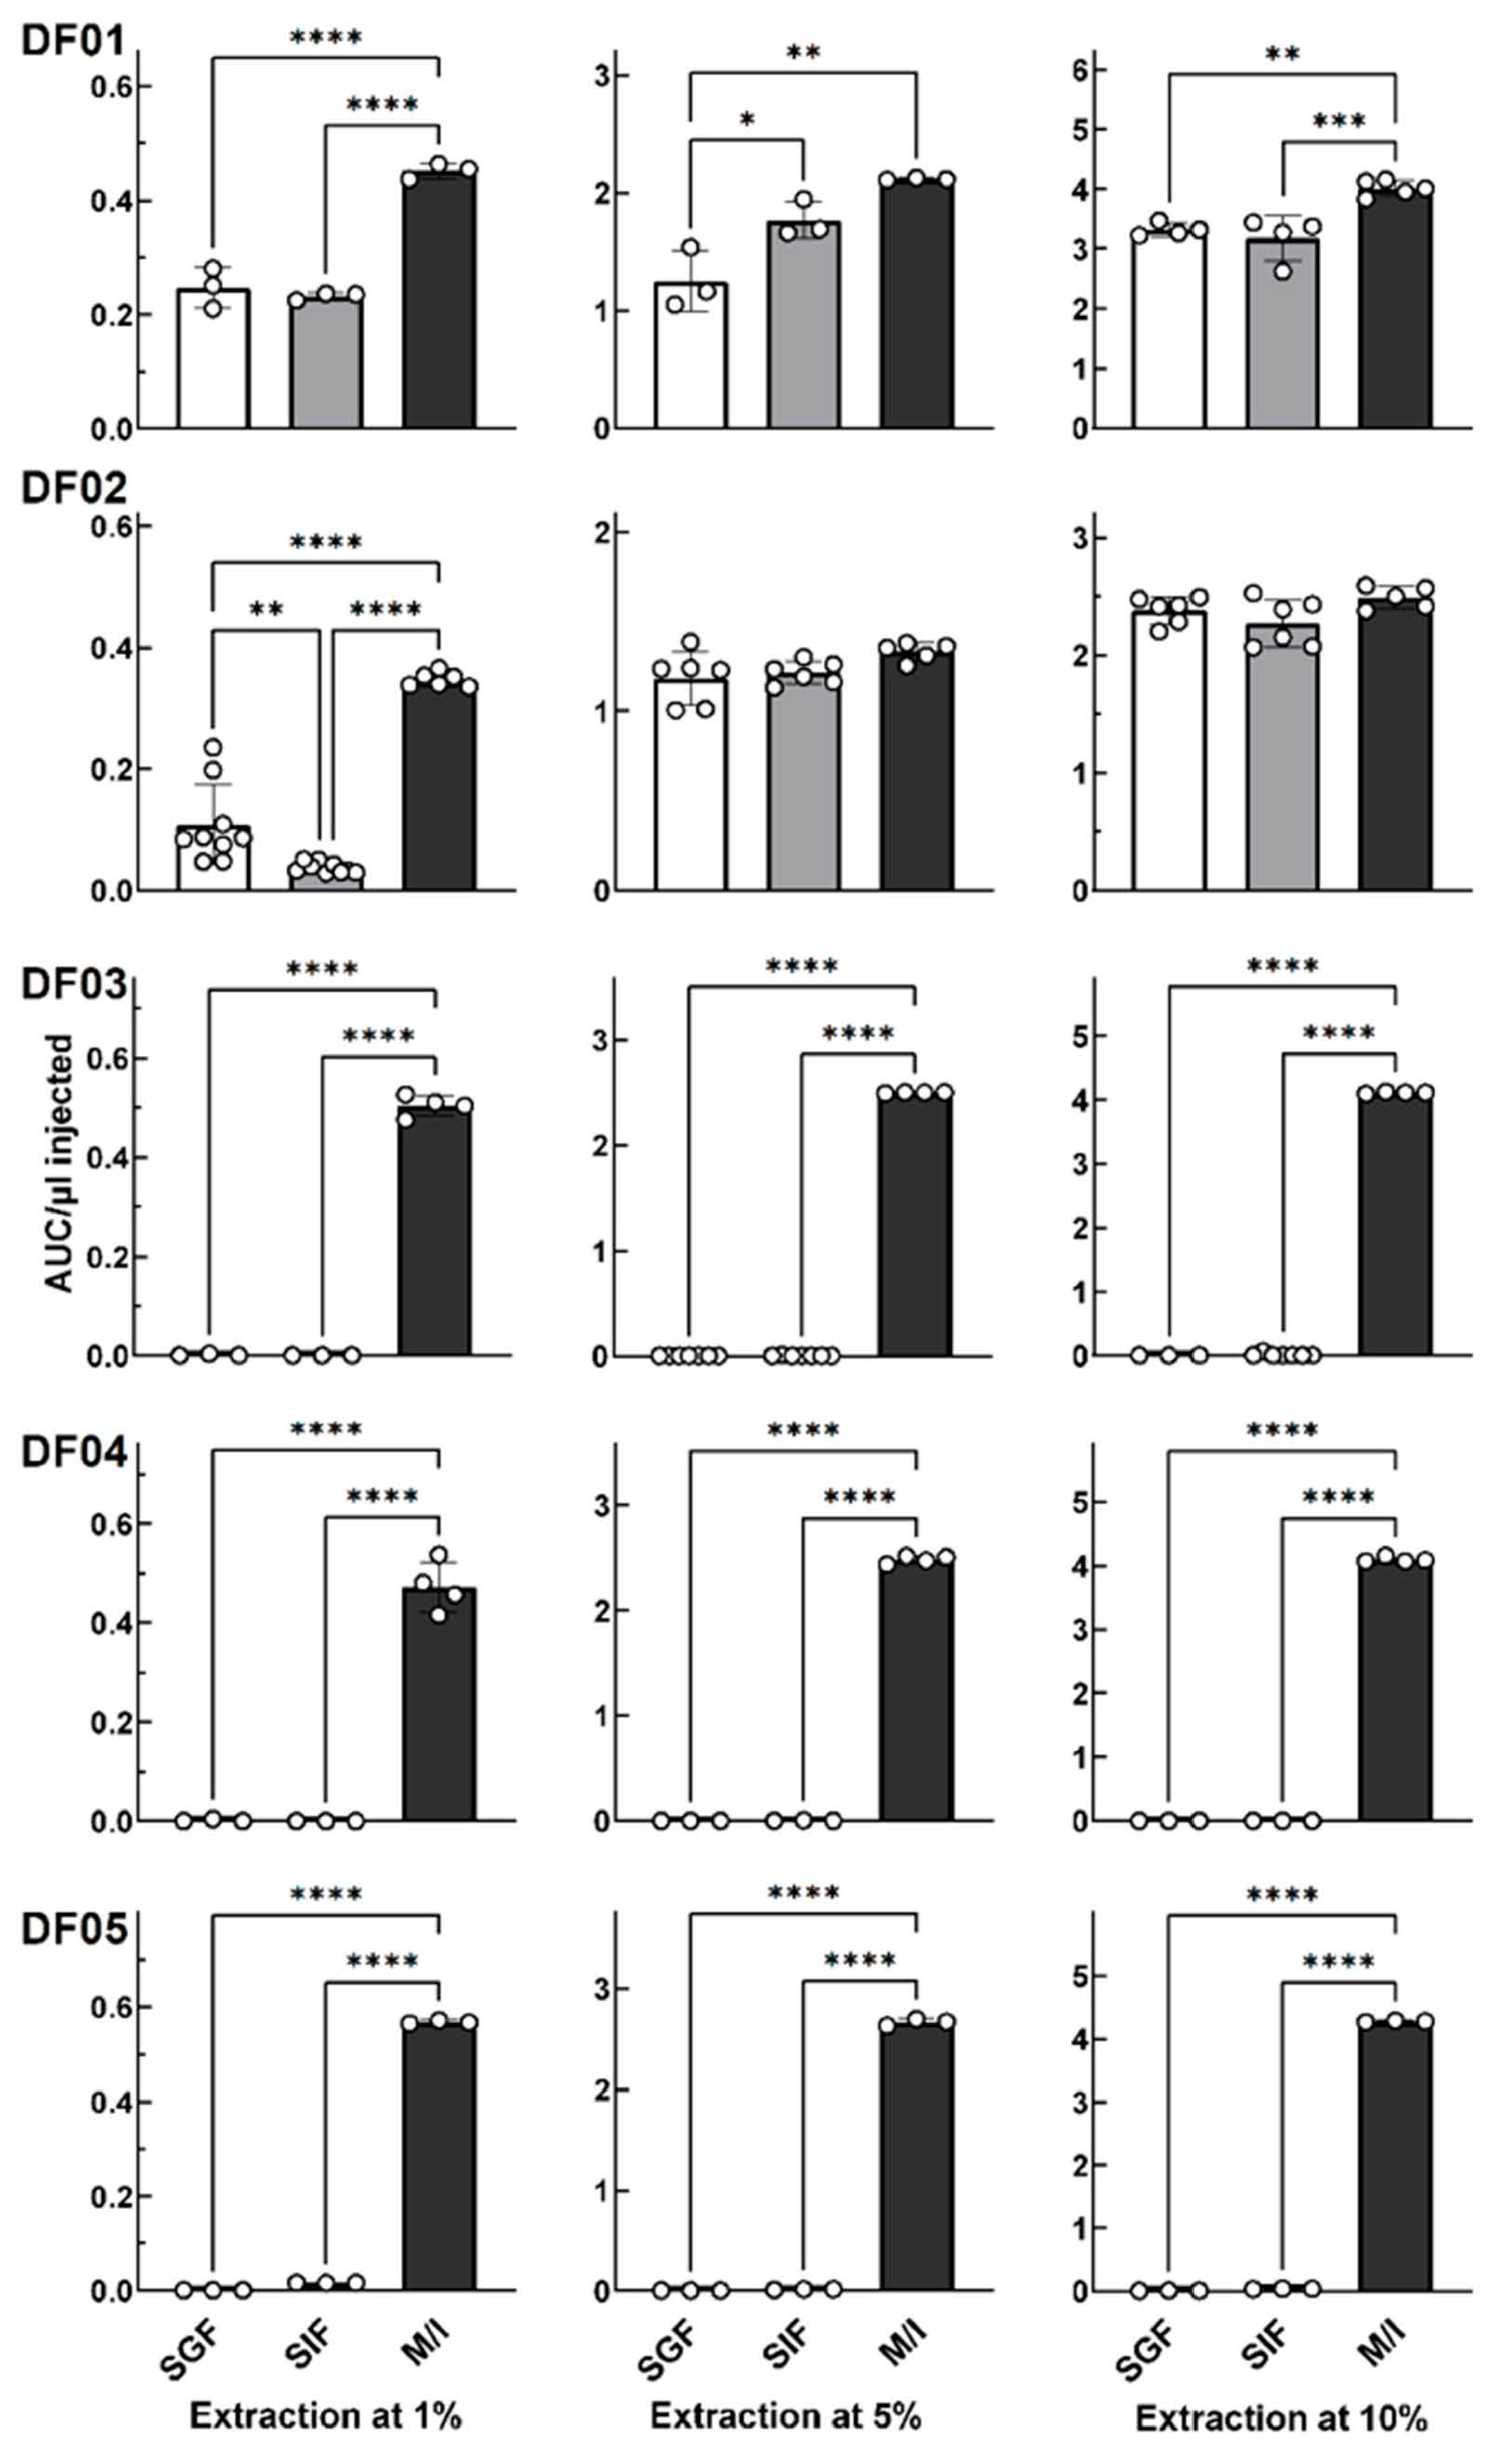
Using this workflow, all five products DF01 to DF05 were extracted, HPLC-fractionated, and the AUC for the CBD elution peak was quantified and normalized to the injected volume (Figure 6). Then we converted these values to CBD contents in µg using the slope of the Mix-3 standard CBD calibration curve and calculated the percentage yield for each extraction condition relative to labeled CBD content on the product’s label and to the CBD content recovered under alcoholic extraction (Table 1). All the products had high CBD content recovery and minimal, if any, THC content recovery when extracted in an M:I mixture. In contrast, CBD content recovery from these products substantially varies when extracted in physiological fluids, regardless of the product-to-extraction-media ratio. This led us to divide products into two groups: the “Miscible Products” group that includes DF01 and DF02, and the “Immiscible Products” group that includes DF03–DF05.
Figure 6.
Comparison of CBD recovery from DF01–DF05 following extraction in methanol and isopropanol 1:1 mixture (M/I; open bars), simulated gastric fluid (SGF; gray bars), or simulated intestinal fluids (SIF; black bars). CBD extraction was performed at product-to-extraction-media v/v ratios of 1, 5, and 10% and then aliquots of the eluates were fractionated in HPLC as described under the methods section. Area under the curve (AUC) for HPLC peaks corresponding to CBD was determined and divided by the volume of injected aliquot to get AUC per 1 µL. Each circle represents the average of CBD quantifications from all the HPLC runs from an individual extraction and the total number of biological replicates (n) is listed in Table 1. Statistically significant differences based on One-way ANOVA with a post hoc Tukey multiple comparison test using GraphPad Prism are shown as * = p < 0.05, ** = p < 0.01, *** = p < 0.001, **** = p < 0.0001.
Table 1.
Labeled CBD contents and percentage recovery following extraction in simulated biological fluids. M:I (methanol–isopropanol mixture); SGF, simulated gastric fluid; and SIF, simulated intestinal fluid. The percentage of recovered CBD relative to the labeled amount is shown as Ave + SD and number of extractions (N). The percentage of CBD recovered in simulated fluids relative to CBD recovered in M/I extraction under the same product-to-extraction-media ratio is shown in brackets as Ave + SD from the same number of extractions (N). NPD, no peak detected in the expected range of CBD elution. ND, not determined.
3.1. Miscible Products (DF01 and DF02)
DF01 and DF02 were miscible with the aqueous SGF and SIF media and formed homogeneous solutions following 2 h of extraction with continuous shaking. DF01 exhibited substantial CBD content recovery in SGF and SIF; nevertheless, the recovery was statistically significantly different from CBD content recovery in the M:I mixture. CBD recovery from DF02 when extracted at product-to-extraction ratios of 5 and 10% was similar regardless of the extraction media used (Figure 5) and the differences among SGF, SIF, and M:I were not statistically significant. Extraction at 1% in the M:I mixture was statistically higher than extraction at 1% in SGF and SIF. When we analyzed DF02 samples across all the extraction ratios and media, we found DF01 CBD recovery at 1% M:I was much higher than one-fifth and one-tenth of the recovery at 5 and 10% M:I, respectively. Therefore, the difference in CBD recovery at 1% product-to-extraction media seems to be due to an overestimation of the 1% M:I sample, and not due to poor extraction in SGF and SIF.
3.2. “Immiscible Products” (DF03–DF05)
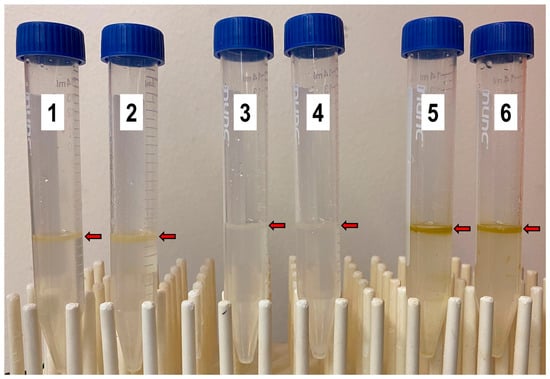
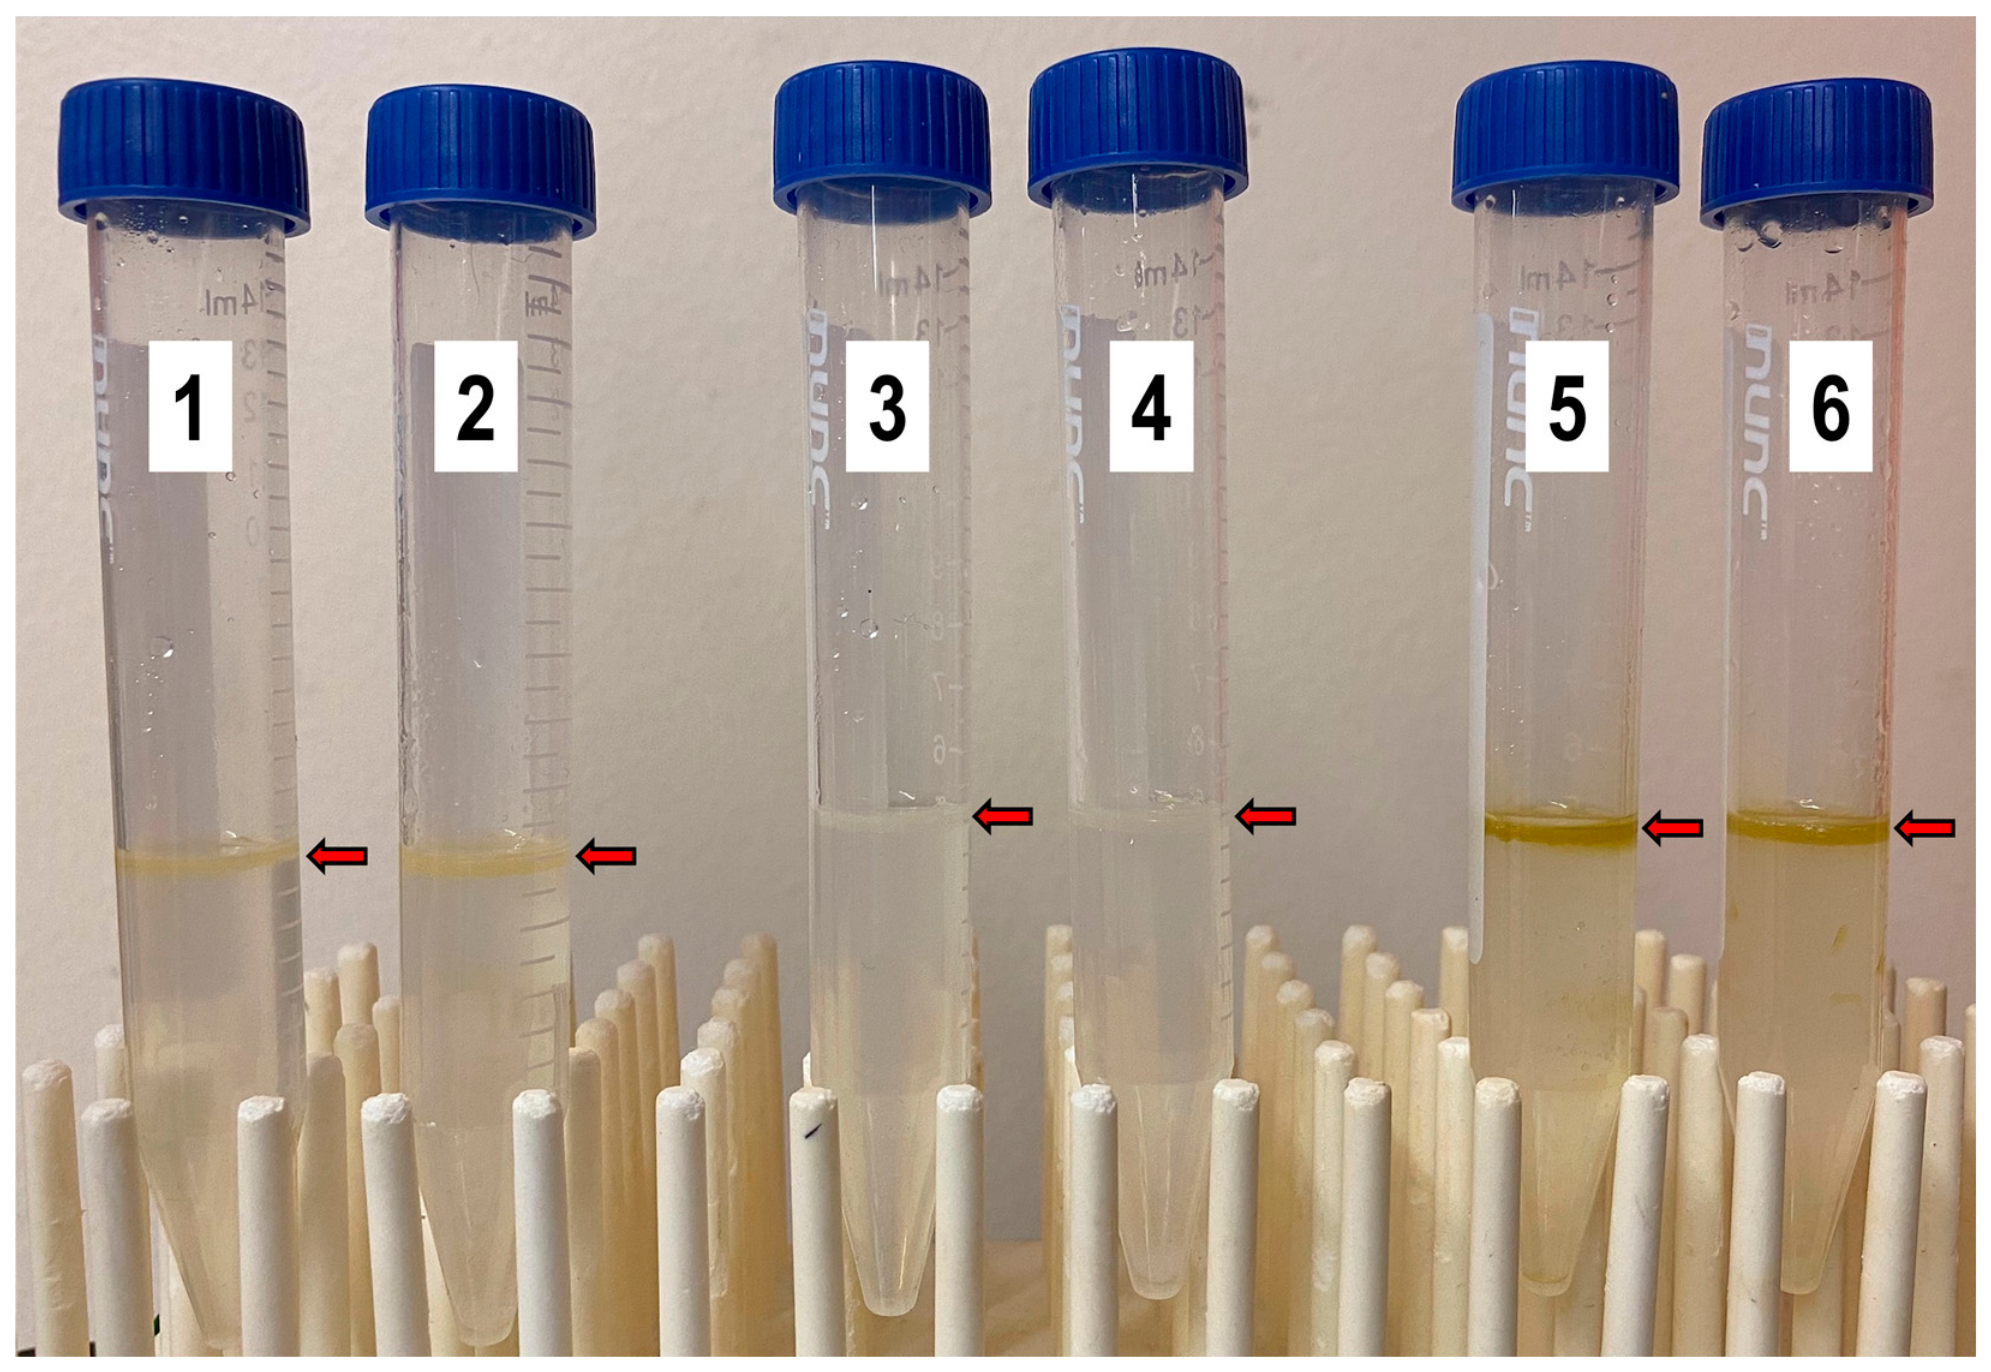
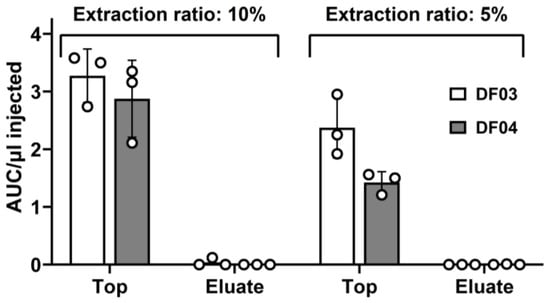
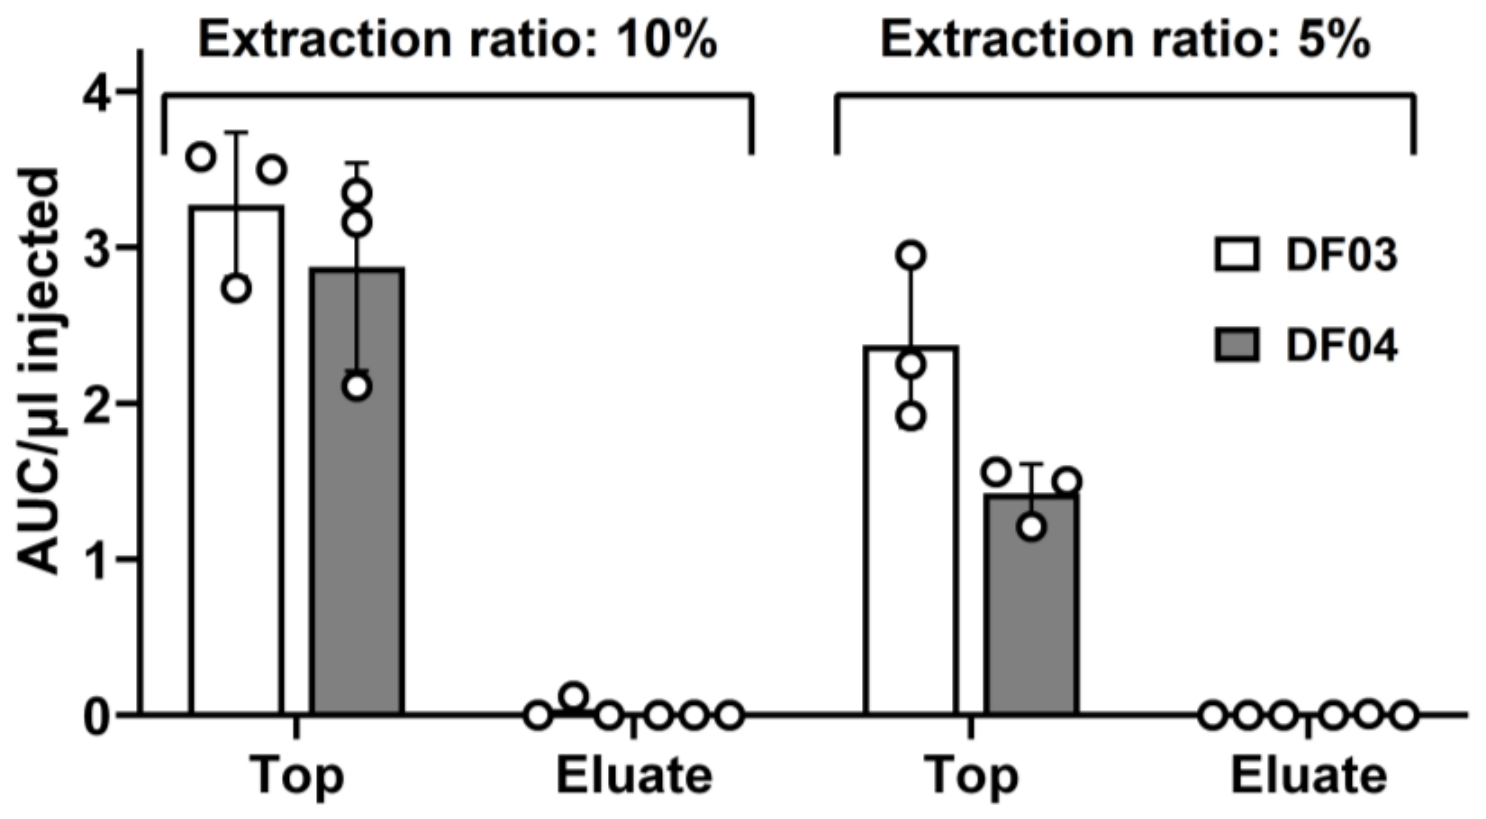
DF03, DF04, and DF05 were not miscible with the SGF or SIF extraction media even at a 1% product-to-extraction-media ratio. Following shaking for 2 h, these three products remained as a viscous oil phase on the top of the aqueous extraction media (Figure 7). To determine whether any CBD was extracted from the product, both the extraction media and the top layer were processed for HPLC analysis. HPLC analysis of the extraction media indicated negligible CBD content recovery in GSF and SIF, regardless of the extraction ratio used and in the absence or presence of enzymes. For quantification of CBD content in the top (viscous product-like) layer, the top portion was retrieved, diluted in methanol to a final dilution of 10% v/v by vortexing for 15–30 s, filtered, and analyzed by HPLC. The CBD content recovered from the top layer was consistent with the amount recovered when the products were extracted directly in the M:I mixture (Figure 8). This indicates that these three products did not release any detectable CBD into SGF and/or SIF.
Figure 7.
Photograph showing DF03 (tubes 1 and 2), DF04 (tubes 3 and 4), and DF05 (tubes 5 and 6) forming immiscible layers (indicated by red arrows) following extraction in simulated gastric fluid (tubes 1, 3, and 5) and simulated intestinal fluid (tubes 2, 4, and 6).
Figure 8.
CBD recovery from DF03 and DF04 following extraction in simulated intestinal fluids in the presence of pancreatin. CBD extraction was performed at 5 and 10% v/v product to extraction media. A 200 ul sample was removed from the top “immiscible” layer and reextracted with methanol (10% final v/v). Aliquots from eluates in SIF and from the methanolic extraction of the top layer were fractionated in HPLC.
The fact that extraction efficiencies in SGF, SIF and M:I were comparable for products DF01 and DF02 precludes the possibility that the observed differences in CBD recovery from DF03, DF04, and DF05 in SGF and SIF and the CBD recovery obtained following extraction in M:I are due to factors inherent in the use of SGF and SIF. The poor aqueous solubility of CBD (<10 µg/mL) is considered a challenge in formulating it for oral use [23,24,25]. In addition, storage conditions such as light and temperature have been shown to alter product stability [26]. Extensive research is ongoing to enhance CBD’s bioavailability. Several studies have reported that emulsion-based drug delivery systems enhance the bioavailability of CBD, likely due to its high lipophilicity [24,27,28]. Consistent with this hypothesis, our study demonstrated that CBD release from a lipid-based formulation (formulated with coconut MCT oil; DF03–DF05) was significantly lower in SGF and SIF than that from an aqueous-based formulation (vegetable glycerin; DF01–DF02). This is consistent with earlier work by Alhamami et al. [29], who found that oral administration of salicylate in an oily formulation (coconut oil) resulted in a slower absorption rate compared to aqueous or glycerin-based formulations. The authors attributed this to the oil phase acting as a reservoir that controls drug release, along with the oil’s tendency to delay gastric emptying, both of which extend the time the drug spends in the gastrointestinal tract before absorption. Altogether, these results provide supportive evidence that currently used processing and manufacturing practices of CBD products can result in products that either do not contain the labeled amount of CBD and/or have limited CBD dissolution in gastric and intestinal fluids, potentially resulting in inconsistent dosing and variable consumer exposure.
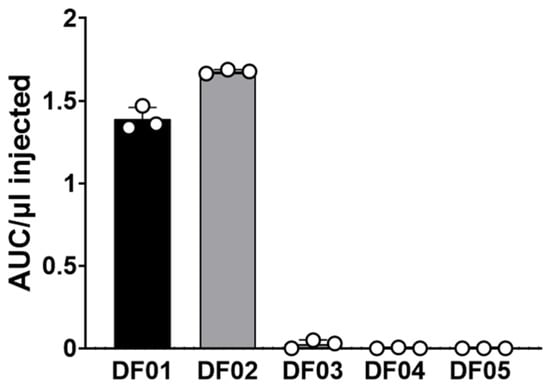
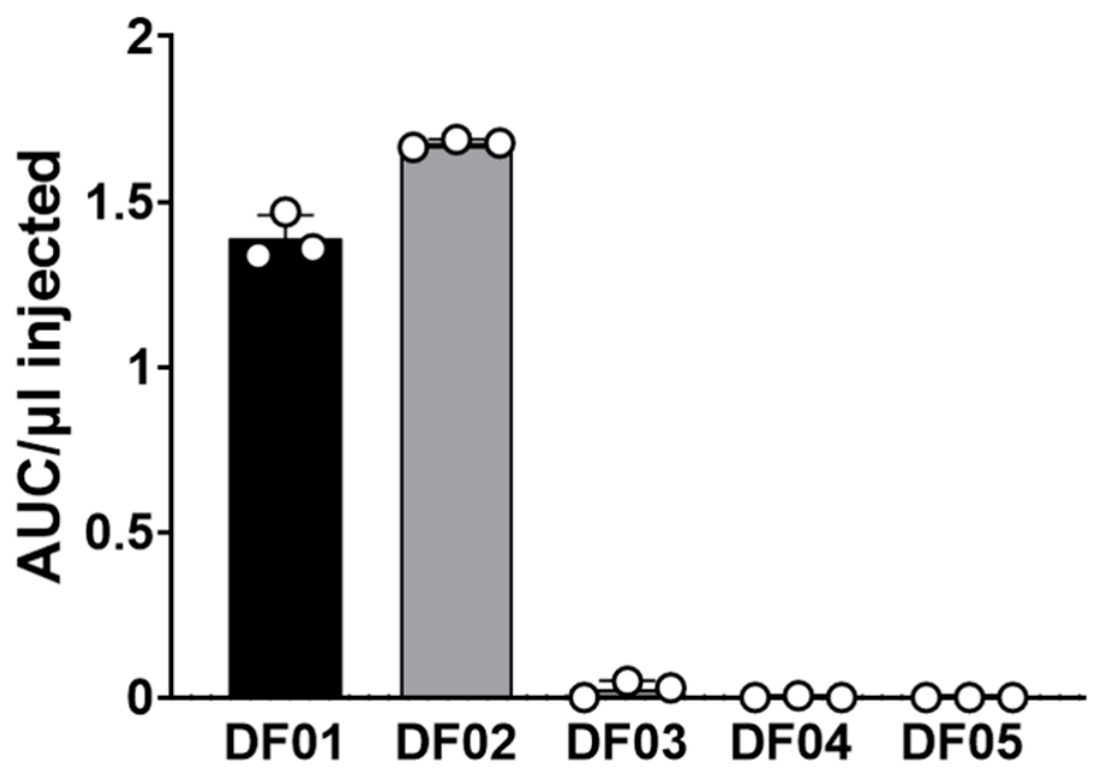
To further confirm that the lack of CBD recovery from DF03–DF05 in physiological aqueous media is specific to these formulations, we used extraction in water to simulate CBD content recovery in saliva following sublingual administration. We dissolved each product in 2 mL of HPLC-grade water and incubated for at least 2 min at room temperature. Then we followed the same workflow used for other extraction media described above. All five products were examined at 1, 5, and/or 10% product-to-extraction-media ratio, each in triplicate. Product extraction in HPLC-grade water to simulate saliva extraction exhibited similar patterns of CBD content recovery as in SGF and SIF (Figure 9). These data indicate that following the product’s direction “to place the product under the tongue and allow it to sit without swallowing” may not be sufficient to enhance CBD release from these products.
Figure 9.
Comparison of CBD recovery from DF01-DF05 following extraction in H2O at a 5% product-to-extraction-media ratio to simulate saliva sublingual administration.
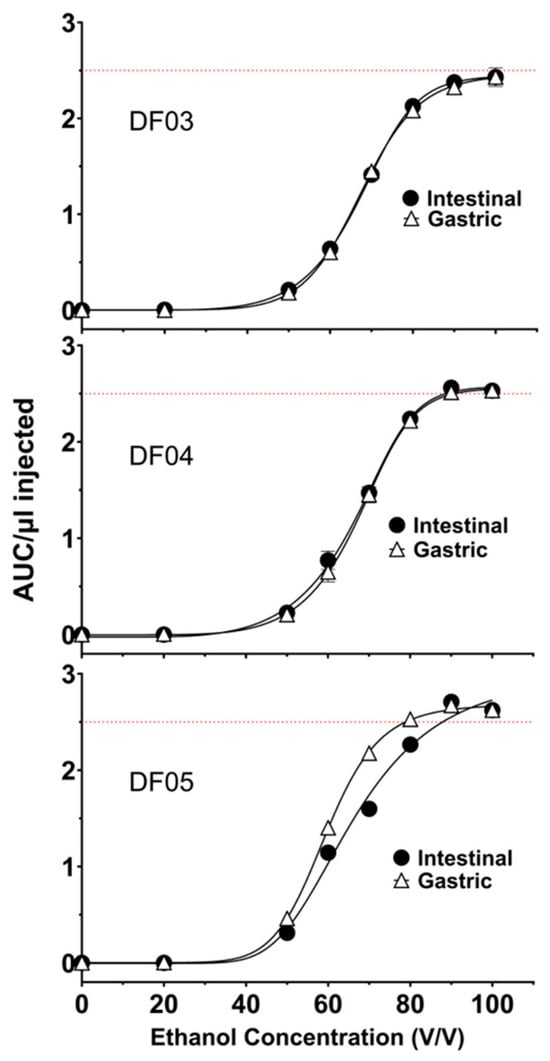
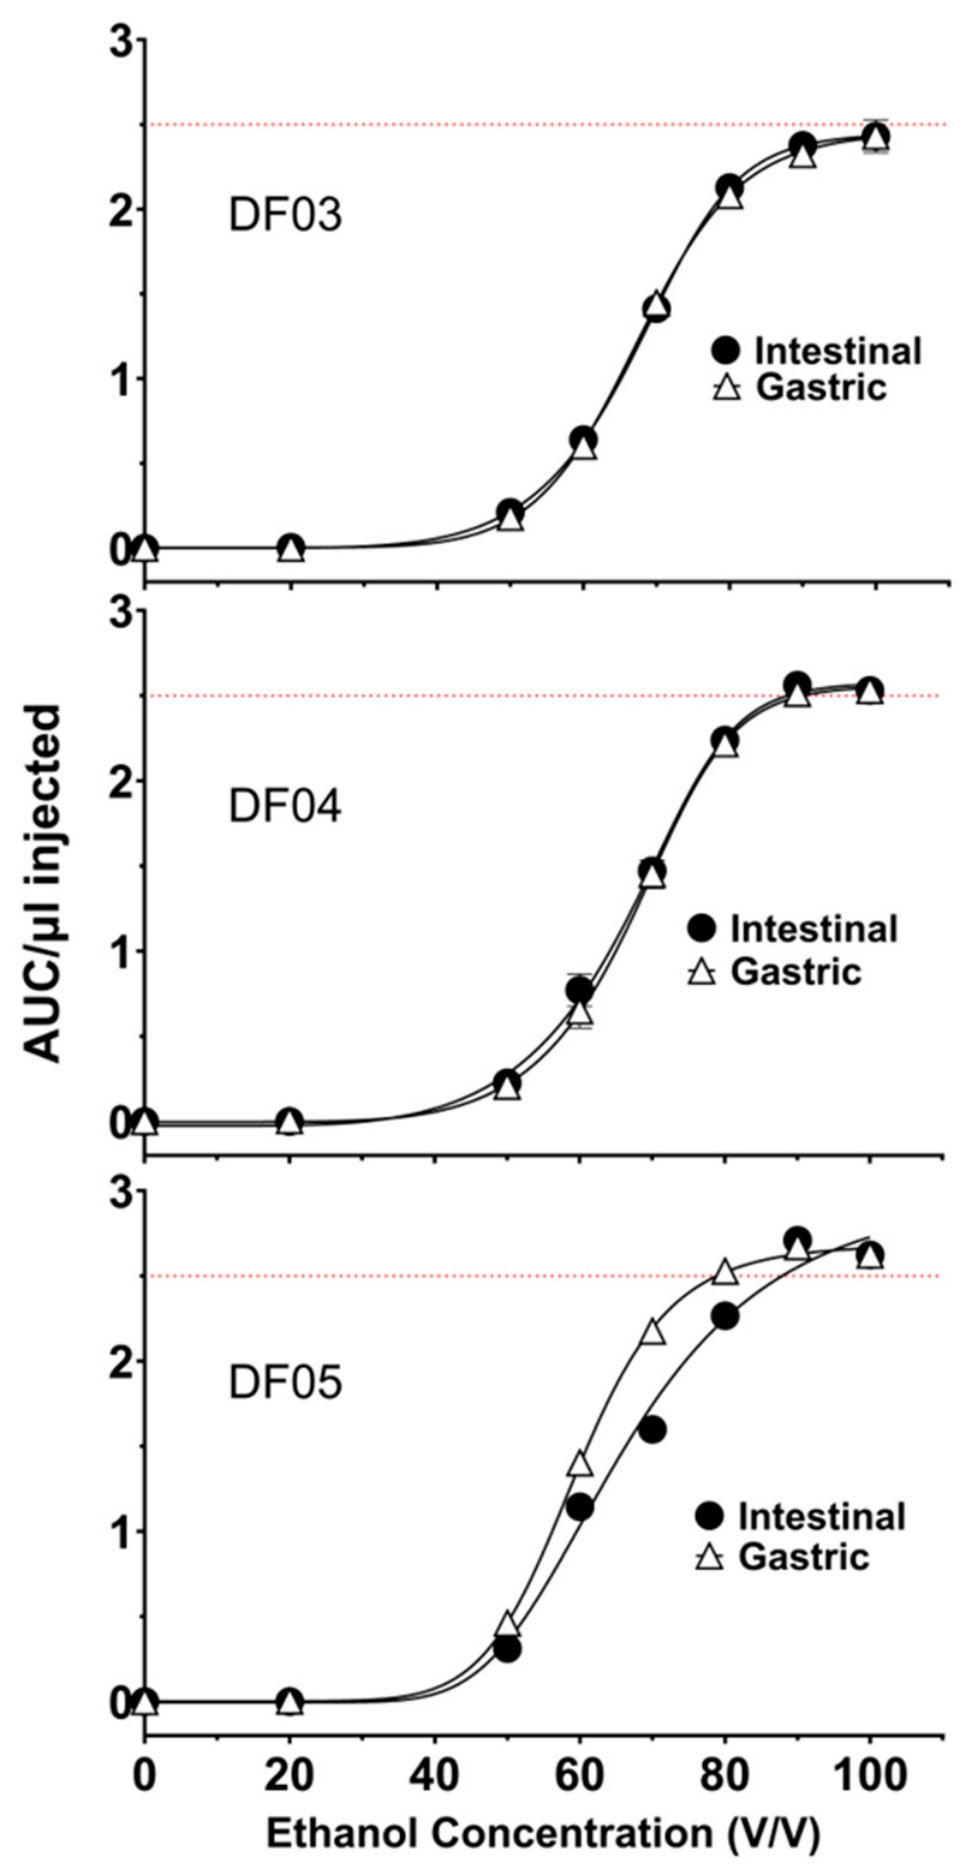
We also examined the effect of the inclusion of increasing concentrations of ethanol in SGF and SIF on CBD content recovery from DF03–DF05. Our results, as shown in Figure 10, showed that approximately 90% ethanol–10% GSF or SIF mixture was required to achieve CBD recovery comparable to that obtained by direct extraction in an M:I mixture. These data establish that the level of ethanol needed in SGF or SIF to fully extract CBD content from DF03–DF05 is very high and practically impossible to achieve. Therefore, these products will not release CBD at the levels claimed on the product’s label even when they are consumed alongside an alcoholic beverage.
Figure 10.
Effect of ethanol on CBD recovery from DF03–DF05 in simulated gastric and intestinal fluids. Increasing concentrations of ethanol were added during the extraction of DF03–05 at a 5% extraction ratio in gastric or intestinal fluid. The red line indicates the expected absorbance/μL of DF03–DF05 in gastric and intestinal fluids.
To test the effect of emulsification in CBD recovery from “immiscible” products, we extracted DF03 in SGF and SIF containing 1% sodium dodecyl Sulfate (SDS). CBD recovery remained <3% of the labeled amount or the amount recovered by alcoholic extraction. DF03 CBD content recovery in SGF + 1%SDS/SIF + 1%SDS at 1, 5, and 10% product-to-extraction-media ratios relative to labeled CBD content was 0.3 ± 0.2 (3)/2.5 ± 0.1 (3), 1.0 ± 0.9 (3)/1.3 ± 0.1 (3), and 0.1 ± 0.2 (3)/0.8 ± 0.0 (3), respectively.
4. Conclusions
In this study, we compared the recovery of CBD content from five commonly used non-pharmaceutical CBD/hemp oral products using organic-solvent extraction and simulated biological-fluid extraction. All the products had high CBD content recovery and minimal, if any, THC content recovery when extracted in an M:I mixture but not when extracted in simulated physiological fluids. Indeed, three of the tested products (DF03, DF04, and DF05) yielded negligible amounts of CBD when extracted using simulated gastric and intestinal fluids. This demonstrates that CBD recovery differs between alcoholic and simulated physiological fluids. Therefore, the common practice of CBD evaluation using alcohol extraction can be misleading, as it may not accurately reflect the amount of CBD available under physiological conditions and does not necessarily establish the suitability of these products as oral dosage forms. These results underscore the importance of incorporating physiologically relevant testing methods into product evaluation. Such approaches may provide a more meaningful assessment of product performance and help improve the accuracy and consistency of CBD dosing for consumers. While variability in CBD content has been reported in multiple studies, to the best of our knowledge, this is the first study to compare the release of the active component, CBD, into simulated gastric, intestinal, and sublingual fluids.
A few limitations should be considered when interpreting the findings of this study. First, this study examined CBD content in a limited number of products, two glycerin aqueous-based and three MCT oil-based formulations. Second, the results reflect only in vitro CBD recovery and do not account for additional factors that influence cannabinoid absorption and disposition in vivo, such as the presence of bile salts, lipid digestion, bioavailability, metabolism, and systemic distribution. Furthermore, this study focused on the release of CBD in simulated gastric and intestinal fluids and did not quantify the amount of CBD that would ultimately be bioavailable following its release from the product. Consequently, products that demonstrated near-complete CBD release under simulated physiological conditions (DF01 and DF02) may exhibit substantially different systemic levels due to other factors contributing to CBD bioavailability. On the other hand, lipophilic compounds such as CBD may be transported via the lymphatic system, potentially contributing to systemic absorption despite their limited aqueous solubility. Sandmeier et al. 2025 [27] suggested that lymphatic uptake contributes to the absorption of CBD from self-emulsifying drug delivery systems. For products like DF03–DF05, which exhibited limited miscibility in simulated gastric or intestinal fluids, the possibility of CBD uptake via alternative absorption pathways cannot be ruled out. Further studies are necessary to evaluate the potential involvement of the lymphatic pathway in CBD absorption from oil-based formulations and to elucidate any other possible mechanisms for CBD absorption following oral administration.
Author Contributions
Conceptualization, A.K.H. and B.L.P.; methodology, A.K.H., S.T., and R.M.T.; formal analysis, A.K.H., S.T., A.A., A.A.-S., and B.L.P.; investigation, S.T. and A.A.; resources, R.M.T.; data curation, A.K.H., S.T., and B.L.P.; writing—original draft preparation, S.T., A.A., and A.A.-S.; writing—review and editing, A.K.H., S.T., A.A., A.A.-S., R.M.T., and B.L.P.; visualization, S.T. and A.A.-S.; supervision, A.K.H. and B.L.P.; project administration, A.K.H. and B.L.P.; funding acquisition, A.K.H. and B.L.P. All authors have read and agreed to the published version of the manuscript.
Funding
Research was supported in part by the Edna Research Fund and the Fisch College of Pharmacy internal grant to AKH and BLP.
Institutional Review Board Statement
Not applicable.
Informed Consent Statement
Not applicable.
Data Availability Statement
The original contributions presented in this study are included in the article. Further inquiries can be directed to the corresponding author.
Acknowledgments
The authors would like to thank Nathalia Pinheiro Menegasso and Khaldoun Abdelwahed (The University of Texas at Tyler) for their helpful contributions and critical reading of the manuscript.
Conflicts of Interest
The authors declare no conflicts of interest.
Abbreviations
The following abbreviations are used in this manuscript:
| SIF | simulated intestinal fluid |
| SGF | simulated gastric fluid |
| M:I | methanol:isopropanol mixture |
| MIX-3 | certified reference THC cannabinoids Mixture-3 |
| DF | dosage form |
| CBD | cannabidiol |
| THC | (-)-delta-9-tetrahydrocannabinol |
| CBN | cannabinol |
| HPLC | high-performance liquid chromatography |
| CB | cannabinoid receptor |
| FDA | U.S. Food and Drug Administration |
References
- VanDolah, H.J.; Bauer, B.A.; Mauck, K.F. Clinicians’ Guide to Cannabidiol and Hemp Oils. Mayo Clin. Proc. 2019, 94, 1840–1851. [Google Scholar] [CrossRef] [Scilit] [PubMed]
- de Almeida, D.L.; Devi, L.A. Diversity of molecular targets and signaling pathways for CBD. Pharmacol. Res. Perspect. 2020, 8, e00682. [Google Scholar] [CrossRef] [Scilit] [PubMed] [PubMed Central]
- Matei, D.; Trofin, D.; Iordan, D.A.; Onu, I.; Condurache, I.; Ionite, C.; Buculei, I. The Endocannabinoid System and Physical Exercise. Int. J. Mol. Sci. 2023, 24, 1989. [Google Scholar] [CrossRef] [Scilit] [PubMed] [PubMed Central]
- Nagyova, A.; Hlavacova, N. Endocannabinoid signalling in the regulation of hypothalamic-pituitary neuroendocrine circuits: A review. Endocr. Regul. 2026, 60, 98–110. [Google Scholar] [CrossRef] [Scilit] [PubMed]
- Hsu, M.; Shah, A.; Jordan, A.; Gold, M.S.; Hill, K.P. Therapeutic Use of Cannabis and Cannabinoids: A Review. JAMA 2026, 335, 345–359. [Google Scholar] [CrossRef] [Scilit] [PubMed]
- Maldonado, R.; Banos, J.E.; Cabanero, D. The endocannabinoid system and neuropathic pain. Pain 2016, 157, S23–S32. [Google Scholar] [CrossRef] [Scilit] [PubMed]
- O’Donnell, B.; Meissner, H.; Gupta, V. Dronabinol; StatPearls Publishing: Treasure Island, FL, USA, 2026; Available online: https://europepmc.org/article/NBK/nbk557531 (accessed on 30 August 2026).
- US Food and Drug Administration. FDA Approves First Drug Comprised of an Active Ingredient Derived from Marijuana to Treat Rare, Severe Forms of Epilepsy. 2018. Available online: https://www.prnewswire.com/news-releases/fda-approves-first-drug-comprised-of-an-active-ingredient-derived-from-marijuana-to-treat-rare-severe-forms-of-epilepsy-300671667.html (accessed on 30 August 2026).
- US Food and Drug Administration. FDA Approves New Indication for Drug Containing an Active Ingredient Derived from Cannabis to Treat Seizures in Rare Genetic Disease. 2020. Available online: https://www.prnewswire.com/news-releases/fda-approves-new-indication-for-drug-containing-an-active-ingredient-derived-from-cannabis-to-treat-seizures-in-rare-genetic-disease-301104233.html (accessed on 30 August 2026).
- Clinicaltrials.gov. A Clinical Trial Search Including “Cannabidiol (CBD)” as the “Intervention/Treatment”. 2026. Available online: https://clinicaltrials.gov/search?intr=Cannabidiol%20(CBD)&viewType=Card (accessed on 30 August 2026).
- Sastre-Garriga, J.; Vila, C.; Clissold, S.; Montalban, X. THC and CBD oromucosal spray (Sativex(R)) in the management of spasticity associated with multiple sclerosis. Expert. Rev. Neurother. 2011, 11, 627–637. [Google Scholar] [CrossRef] [Scilit] [PubMed]
- Park, J.Y. Patterns of cannabidiol use among marijuana users in the United States. Prev. Med. Rep. 2025, 50, 102985. [Google Scholar] [CrossRef] [Scilit] [PubMed]
- US Food and Drug Administration. FDA Regulation of Cannabis and Cannabis-Derived Products, Including Cannabidiol (CBD). 2021. Available online: https://www.fda.gov/news-events/public-health-focus/fda-regulation-cannabis-and-cannabis-derived-products-including-cannabidiol-cbd (accessed on 30 August 2026).
- US Food and Drug Administration. FDA Warns Companies for Illegally Selling Food and Beverage Products That Contain CBD 2022. Available online: https://www.fda.gov/food/hfp-constituent-updates/fda-warns-companies-illegally-selling-food-and-beverage-products-contain-cbd (accessed on 30 August 2026).
- Torovic, L.; Urumovic, K.; Kobiljski, D.; Srdenovic Conic, B. Cannabidiol in Food and Food Supplements: Drug, Novel Food and Hazard Triangle. Molecules 2026, 31, 2287. [Google Scholar] [CrossRef] [Scilit] [PubMed] [PubMed Central]
- Bonn-Miller, M.O.; Loflin, M.J.E.; Thomas, B.F.; Marcu, J.P.; Hyke, T.; Vandrey, R. Labeling Accuracy of Cannabidiol Extracts Sold Online. JAMA 2017, 318, 1708–1709. [Google Scholar] [CrossRef] [Scilit] [PubMed] [PubMed Central]
- Spindle, T.R.; Sholler, D.J.; Cone, E.J.; Murphy, T.P.; ElSohly, M.; Winecker, R.E.; Flegel, R.R.; Bonn-Miller, M.O.; Vandrey, R. Cannabinoid Content and Label Accuracy of Hemp-Derived Topical Products Available Online and at National Retail Stores. JAMA Netw. Open 2022, 5, e2223019. [Google Scholar] [CrossRef] [Scilit] [PubMed] [PubMed Central]
- Gidal, B.E.; Vandrey, R.; Wallin, C.; Callan, S.; Sutton, A.; Saurer, T.B.; Triemstra, J.L. Product labeling accuracy and contamination analysis of commercially available cannabidiol product samples. Front. Pharmacol. 2024, 15, 1335441. [Google Scholar] [CrossRef] [Scilit] [PubMed] [PubMed Central]
- Lazarjani, M.P.; Torres, S.; Hooker, T.; Fowlie, C.; Young, O.; Seyfoddin, A. Methods for quantification of cannabinoids: A narrative review. J. Cannabis Res. 2020, 2, 35. [Google Scholar] [CrossRef] [Scilit]
- Nahar, L.; Chaiwut, P.; Sangthong, S.; Theansungnoen, T.; Sarker, S.D. Progress in the analysis of phytocannabinoids by HPLC and UPLC (or UHPLC) during 2020–2023. Phytochem. Anal. 2024, 35, 927–989. [Google Scholar] [CrossRef] [Scilit]
- Nahar, L.; Onder, A.; Sarker, S.D. A review on the recent advances in HPLC, UHPLC and UPLC analyses of naturally occurring cannabinoids (2010-2019). Phytochem. Anal. 2019, 31, 413–457. [Google Scholar] [CrossRef] [Scilit] [PubMed]
- Silva, E.M.P.; Vitiello, A.; Miro, A.; Ribeiro, C.J.A. Recent HPLC-UV Approaches for Cannabinoid Analysis: From Extraction to Method Validation and Quantification Compliance. Pharmaceuticals 2025, 18, 786. [Google Scholar] [CrossRef] [Scilit] [PubMed] [PubMed Central]
- Muta, T.; Khetan, R.; Song, Y.; Garg, S. Optimising Cannabidiol Delivery: Improving Water Solubility and Permeability Through Phospholipid Complexation. Int. J. Mol. Sci. 2025, 26, 2647. [Google Scholar] [CrossRef] [Scilit] [PubMed] [PubMed Central]
- Hossain, K.R.; Alghalayini, A.; Valenzuela, S.M. Current Challenges and Opportunities for Improved Cannabidiol Solubility. Int. J. Mol. Sci. 2023, 24, 14514. [Google Scholar] [CrossRef] [Scilit] [PubMed] [PubMed Central]
- Paczkowska-Walendowska, M.; Trzaskoma, P.; Dziopa, A.; Moeini, A.; Soczawa, M.; Krasinski, Z.; Cielecka-Piontek, J. Innovative Strategies to Enhance the Bioavailability of Cannabidiol: Nanotechnology and Advanced Delivery Systems. Pharmaceuticals 2025, 18, 1637. [Google Scholar] [CrossRef] [Scilit] [PubMed] [PubMed Central]
- Mazzetti, C.; Ferri, E.; Pozzi, M.; Labra, M. Quantification of the content of cannabinol in commercially available e-liquids and studies on their thermal and photo-stability. Sci. Rep.-UK 2020, 10, 3697. [Google Scholar] [CrossRef] [Scilit]
- Sandmeier, M.; Wong, E.T.; Nikolajsen, G.N.; Purwanti, A.; Lindner, S.; Bernkop-Schnurch, A.; Xia, W.; Hoeng, J.; Kjaer, K.; Bruun, H.Z.; et al. Oral formulations for cannabidiol: Improved absolute oral bioavailability of biodegradable cannabidiol self-emulsifying drug delivery systems. Colloids Surf. B Biointerfaces 2025, 255, 114879. [Google Scholar] [CrossRef] [Scilit] [PubMed]
- Bonilla, L.G.P.; Orozco, G.A.; Chaves, I.D.G.; Niño, G.R. Experimental Solubility of Cannabidiol (CBD) in Different Organic Solvents. Ind. Eng. Chem. Res. 2023, 62, 12356–12364. [Google Scholar] [CrossRef] [Scilit]
- Alhamami, O.M.O.; Aljanabi, N.H.; Shalan, N.A. Biopharmaceutic and pharmacokinetic studies following the oral administration of sodium salicylate in oily and aqueous vehicles to rabbit. Int. J. Pharm. 2006, 311, 63–68. [Google Scholar] [CrossRef] [Scilit]

Disclaimer/Publisher’s Note: The statements, opinions and data contained in all publications are solely those of the individual author(s) and contributor(s) and not of MDPI and/or the editor(s). MDPI and/or the editor(s) disclaim responsibility for any injury to people or property resulting from any ideas, methods, instructions or products referred to in the content. |
© 2026 by the authors. Licensee MDPI, Basel, Switzerland. This article is an open access article distributed under the terms and conditions of the Creative Commons Attribution (CC BY) license.