


Abstract
TANGO2 deficiency disorder is a rare autosomal recessive disease (~100 cases reported worldwide). Despite being caused by loss-of-function variants in the TANGO2 gene, patients exhibit marked phenotypic variability, including intrafamilial differences among individuals carrying identical variants. To uncover potential modifier mechanisms influencing disease severity, we developed an integrative Systems biology framework, combining exome sequencing, transcriptomics, variant effect prediction, and Human Phenotype Ontology mapping. This approach was applied to two siblings carrying identical compound heterozygous TANGO2 variants but opposite clinical outcomes: one severely affected and one asymptomatic. Personalized protein–protein interaction networks and combined univariate and multivariate analyses were employed to maximize specificity in this single-family comparison. In the affected sibling, a cumulative burden of common APOB variants, together with altered VLDLR, NTN1, and LDHA expression, implicated disrupted lipid metabolism and neurodevelopmental pathways. The asymptomatic sibling harbored a potentially protective 3′-UTR variant in EP300 and no APOB variant burden, supporting enhanced post-transcriptional regulation within developmental biology networks. These findings highlight lipid metabolism as a key pathway in TANGO2 deficiency pathophysiology and suggest autophagy and mitophagy as additional modifier mechanisms influencing phenotypic variability. Our integrative multi-omics framework provides a valuable strategy for elucidating genotype-phenotype relationships in rare diseases and supports personalized therapeutic approaches.
1. Introduction
Systems biology is an interdisciplinary approach that seeks to understand biological complexity by integrating diverse layers of molecular information, such as genomics, transcriptomics, proteomics, and metabolomics, within the framework of networks and dynamic systems [1]. Rather than examining single genes or molecules in isolation, it models how genes, proteins, and pathways interact to influence health and disease. This approach has greatly advanced the understanding of disease mechanisms, particularly through the construction of molecular interaction networks and the identification of key drivers of disease phenotypes, even in small or genetically heterogeneous cohorts [2,3]. By mapping protein–protein interactions (PPI) and signaling pathways, Systems biology provides a holistic view of cellular processes that is especially valuable for rare Mendelian disorders, which often remain poorly characterized due to limited patient numbers and scarce functional studies of disease-associated genes. Even when patients carry identical causative mutations, rare diseases frequently show marked phenotypic variability. In such cases, secondary variants may act as genetic modifiers (gene variants able to modify the phenotypic outcome of the primary disease gene) and thereby influence disease severity and contribute to clinical variability [4]. Identifying these genetic modifiers remains a major challenge, especially in the context of rare diseases where traditional association studies lack statistical power [4]. Advanced statistical and multivariate methods are therefore essential to extract mechanistic insight from high-dimensional multi-omics datasets, particularly in neurodevelopmental disorders and other rare conditions where sample sizes are limited but molecular complexity is high [5]. Network-based analyses have proven effective in pinpointing key regulatory nodes and functional modules that drive disease pathogenesis, which may serve as therapeutic targets [6]. Moreover, the integration of omics data with curated phenotype repositories, such as the Human Phenotype Ontology (HPO, a structured vocabulary of phenotypic abnormalities), facilitates mapping molecular signatures to clinical features, providing deeper insights into disease heterogeneity and underlying biological processes [7].
TANGO2 (Transport and Golgi Organization 2 homolog) deficiency disorder (TDD, OMIM: #616878) is a rare autosomal recessive disorder caused by pathogenic variants in the TANGO2 gene, first described in 2016 [8,9]. TDD presents a broad clinical spectrum, including neurodevelopmental delay, brain atrophy, dystonia, seizures, and hypothyroidism. Metabolic stresses, such as infections or prolonged fasting, can trigger life-threatening crises characterized by rhabdomyolysis, cardiac arrhythmias, and encephalopathy [10].
The TANGO2 gene is evolutionarily conserved across mammals and encodes a ubiquitously expressed protein. Initially, it was believed to be localized in the cytosol and Golgi apparatus, playing a role in Golgi-to-endoplasmic reticulum (ER) membrane redistribution [9,11,12]. More recent studies suggest its localization within mitochondria [8,13,14,15,16]. Interestingly, TANGO2 also localizes to contact sites among the ER, lipid droplets (LDs), and mitochondria [15]. Proteomic analyses of TANGO2-deficient human fibroblasts revealed perturbations in crucial metabolic pathways, including fatty acid oxidation, ER-Golgi network, and secretory pathways [17]. TDD patient-derived cells show abnormal mitochondrial morphology, increased reactive oxygen species (ROS), altered lipid droplet structure, and disrupted lipid metabolism [15,18]. Lipidomic analysis of TANGO2-deficient cells revealed elevated free fatty acid pools, triglycerides and lysophospholipids, confirming a significant imbalance in the lipid profile [19]. Notably, purified TANGO2 binds acyl-coenzyme A (acyl-CoA), suggesting a role in lipid metabolism relevant to the metabolic crises observed in TDD [16].
While TDD shows complete penetrance, the symptom severity varies widely, even among siblings carrying the same TANGO2 variants [20]. This phenotypic heterogeneity suggests that additional genetic interactions (e.g., genetic modifiers), epigenetic mechanisms, or environmental factors may influence clinical outcomes in TDD patients [4,18].
The aim of this work is to elucidate the molecular mechanisms underlying phenotypic variability in two siblings with identical heterozygous TANGO2 variants (c.262C>T, p.Arg88Ter; c.338del, p.Gly113AlafsTer10), previously reported by Miyake et al. [20], that result in complete loss of TANGO2 protein expression. Despite sharing the same pathogenic variants, the siblings exhibit strikingly different clinical outcomes. The older brother (Subject 1) shows a severe TDD phenotype, with neurodevelopmental delay, motor and cognitive impairments, hypothyroidism, and multiple metabolic crises, including cardiac arrest. In contrast, his younger sister (Subject 2) remains entirely asymptomatic. To uncover genetic modifiers underlying this phenotypic variability, we applied an integrated Systems biology approach combining genomic, transcriptomic, and phenotype ontology. This robust framework allowed us to identify differences between the two siblings, even in the absence of suitable controls and despite the extreme rarity of the disease, which underlie the siblings’ differing clinical presentations, particularly the younger sister’s unusual resilience to TDD.
2. Materials and Methods
2.1. Patients and Genomic Analysis
Two siblings with TDD carrying the same compound heterozygous variants in the TANGO2 gene (c.262C>T, p.(Arg88Ter); c.338del, p.(Gly113AlafsTer10)) were selected to be studied. Both variants are classified as pathogenic (PVS1, PM2). c.338del and c.262C>T variants were paternally and maternally inherited, respectively. Despite sharing identical genotypes, their clinical presentations were markedly different (Table 1) [20]. This unique intra-familial contrast provides a controlled framework to investigate genotype–phenotype correlations and potential molecular modifiers of disease severity.
Table 1.
Summary of clinical features in two siblings harboring identical TANGO2 mutations.
Genomic DNA was extracted from peripheral white blood cells using the PureLink Genomic DNA kit (Thermo-Fisher Scientific, Waltham, MA, USA), and exomic regions were enriched with the Illumina Nextera® Rapid Capture Exome Kit (Illumina, San Diego, CA, USA), with whole exome sequencing (WES) conducted at 80X mean coverage. Paired-end FASTQ files were aligned to the human reference genome (GRCh38/hg38) using the BWA-MEM algorithm. Variant calling format (VCF) files were processed from WES performed on the proband, following standard protocols outsourced to GalSeq. Variants in the TANGO2 gene identified through WES were further confirmed by Sanger sequencing.
Variant annotation was performed using the Variant Effect Predictor (VEP, Ensembl Release 113, October 2024, https://www.ensembl.org/Tools/VEP, accessed on 2 November 2024), incorporating data from multiple sources, including gene identifiers, population allele frequency (Genome Aggregation Database, gnomAD ver.2.1), and functional predictions. Variant deleteriousness was assessed using the Combined Annotation Dependent Depletion (CADD) score metapredictor (v1.7) [21]. Focus was placed on variants in protein-coding genes, excluding records lacking chromosome annotations, gene symbols, or showing sequencing artifacts (e.g., ALT alleles > 25 bp). Only variants mapped to protein-coding or loss-of-function genes were retained. SNP and indel files were merged for each subject.
Subject-specific protein–protein interaction (PPI) networks were built in Cytoscape (version 3.10.3) using input gene lists from WES and retrieving experimentally validated physical interactions between proteins from the IMEx (International Molecular Exchange) consortium database [22]. A preliminary PPI network included first-degree interactors, refined by removing non-mutated interactors, self-loops, and duplicated edges. Only nodes corresponding to Homo sapiens (taxonomy ID: 9606) were retained.
Finally, variants were filtered based on allele frequency (AF < 0.01 or not annotated in gnomAD, as these criteria enrich for potentially rare or private variants), and the resulting physically connected genes were considered to functional enrichment analysis.
2.2. Total RNA Sequencing and Transcriptome Analysis
Skin fibroblasts from both subjects were cultured in T25 flasks using Dulbecco’s Modified Eagle Medium (DMEM, Gibco, Waltham, MA, USA), supplemented with 10% fetal bovine serum (FBS, Gibco, Waltham, MA, USA) and 1% Penicillin-Streptomycin (100×, Gibco). Cultures were maintained at 37 °C in a humidified atmosphere with 5% CO2. Cells were passaged every 4 days using 0.05% trypsin-EDTA (Gibco), and fibroblasts between passages 3 and 6 were used for RNA extraction.
Total RNA was isolated using TRIzol Reagent (Euroclone, Pero, Italy) and purified following the manufacturer’s instructions (Direct-zol RNA Miniprep Kit, Zymo Research, Irvine, CA, USA). RNA concentration and purity were assessed using a Nanodrop spectrophotometer (Thermo Fisher Scientific, Waltham, MA, USA) and an Agilent 2100 Bioanalyzer (Agilent Technologies, Santa Clara, CA, USA). RNAseq libraries were prepared using a strand-specific poly(A) selection protocol and sequenced on the DNBSEQ platform, generating 100 bp paired-end reads. Each sample yielded at least 20 million high-quality reads. Raw sequencing data (FASTQ files) were aligned to the human reference genome (GRCh38/hg38) using STAR 2.7.11a [23], and raw gene counts were obtained with the RSubread package (release 3.17) [24]. Count data were normalized to counts per million (CPM) and low-expression genes (CPM < 0.5 in at least two replicates) were filtered out [25]. Log-transformed CPM values were computed to identify potential discrepancies across replicates, and Principal Component Analysis (PCA) was performed to evaluate biological variance.
In accordance with recommendations for filtering polymorphic genes and homolog pairs, highly expressed and variable human leukocyte antigen (HLA) genes were removed, as their high polymorphism and variability could confound subsequent analyses.
Differential Gene Expression (DGE) analysis was performed to compare gene expression levels between Subject 1 and Subject 2 using both univariate and multivariate approaches. The univariate analysis was carried out using the DESeq2 package (version 1.42.0) [26], which models raw gene counts with normalization for library depth, providing a robust assessment of gene-level changes. Genes with an adjusted (Benjamini–Hochberg) p-value < 0.05 were considered differentially expressed (DEGs). No additional log2 fold-change cutoff was applied; however, log2-fold change values were computed and reported for interpretation. In contrast, for multivariate analysis, a Sparse Partial Least Squares Discriminant Analysis (sPLS-DA) combined with Recursive Feature Elimination (RFE) was employed [27], capturing coordinated expression patterns and identifying the most informative genes. The sPLS-DA method considers global expression patterns and identifies sets of genes that contribute most to subject discrimination. RFE was iteratively applied, reducing the feature set to the top 10% of genes based on predictive contribution. The 10% threshold was chosen to limit overfitting while retaining the most informative genes identified by the sPLS-DA model.
The final DEG list for downstream analysis was obtained by intersecting the results of DESeq2 and sPLS-DA/RFE, ensuring high confidence and reducing false positives. This integration of statistical and multivariate methods is particularly valuable in a 1 vs. 1 comparison, where the limited sample size makes specificity essential for biological interpretation. Differential expression was quantified as log2 fold change between Subject 1 and Subject 2.
Finally, the DEGs were used as input for functional interaction (FI) network construction in Cytoscape via ReactomeFIPlugIn [28] (version 8.0.9), which also added linker genes that functionally connect disconnected DEGs.
2.3. Topological Analysis of the Network
Topological analysis was performed on a directed network using the NetworkAnalyzer tool in the Cytoscape environment (version 3.10.3). The following topological parameters were measured for each node: edge count, in-degree, and out-degree. The edge count reflects the total number of connections associated with each node, while in-degree and out-degree quantify the number of incoming and outgoing edges, respectively. These metrics were used to assess node centrality and interaction flow, enabling the identification of hub genes and potential regulators within the network.
2.4. Functional Enrichment Analysis
Functional enrichment analysis was performed using WebGestalt 2024 (WEB-based Gene SeT AnaLysis Toolkit) [29] (both over-representation analysis—ORA—and gene set enrichment analysis—GSEA). The parameters were set as follows: Homo sapiens as organism of interest, Kyoto Encyclopedia of Genes and Genomes (KEGG) [30], Reactome [31], and Gene Ontology—cellular component [32] as databases. For statistical testing, the “genome protein coding” was used as reference set. To determine statistically significant enriched pathways a Benjamini–Hochberg false discovery rate (FDR) threshold of <0.05 was applied. Weighted set cover algorithm was applied to reduce redundancy in the results.
2.5. Phenotype Annotation and Omics Integration
The Human Phenotype Ontology (HPO) database (September 2024 release, https://hpo.jax.org) was queried using the term “TANGO2” to generate a virtual gene panel. This search identified the phenotype “Metabolic encephalomyopathic crises, recurrent, with rhabdomyolysis, cardiac arrhythmias, and neurodegeneration” (OMIM: #616878) as associated with TANGO2. We retrieved the list of genes annotated to each relevant HPO term. This gene set was used to build a disease-specific PPI network, where nodes are genes of the panel above and edges are the interactions between them. To integrate phenotype and functional data, we intersected this disease-phenotype network with the FI network, incorporating differentially expressed genes and their functional linkers relevant to the TDD phenotype.
All nodes were annotated with genomic variant data, including variant type, allele frequency, CADD score, and zygosity. To identify genes harboring variants with potential deleterious effects, a CADD score cutoff of ≥15 was arbitrarily defined, which corresponds to approximately the top 3.2% of the variants and represents the median score for canonical splice site and non-synonymous variants in CADD v1.0. This cutoff was chosen to capture variants with moderate to high predicted impact while maintaining a manageable set for downstream analysis. Genes harboring variants above this threshold were subjected to functional enrichment analysis. For identification of highly deleterious variants, we applied a more stringent cutoff of CADD score ≥ 30, corresponding to the top 0.1% of all possible variants. This more stringent cutoff focuses on variants most likely to have strong functional effects.
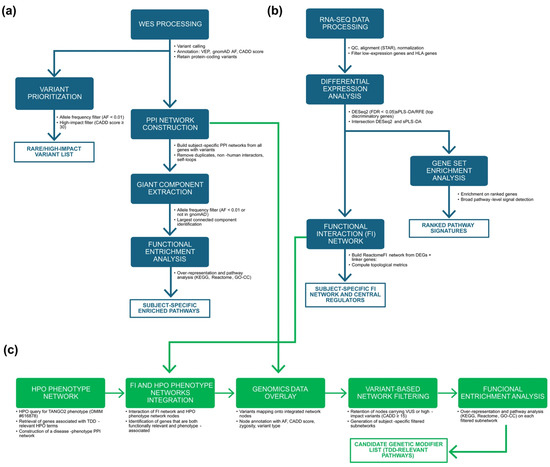
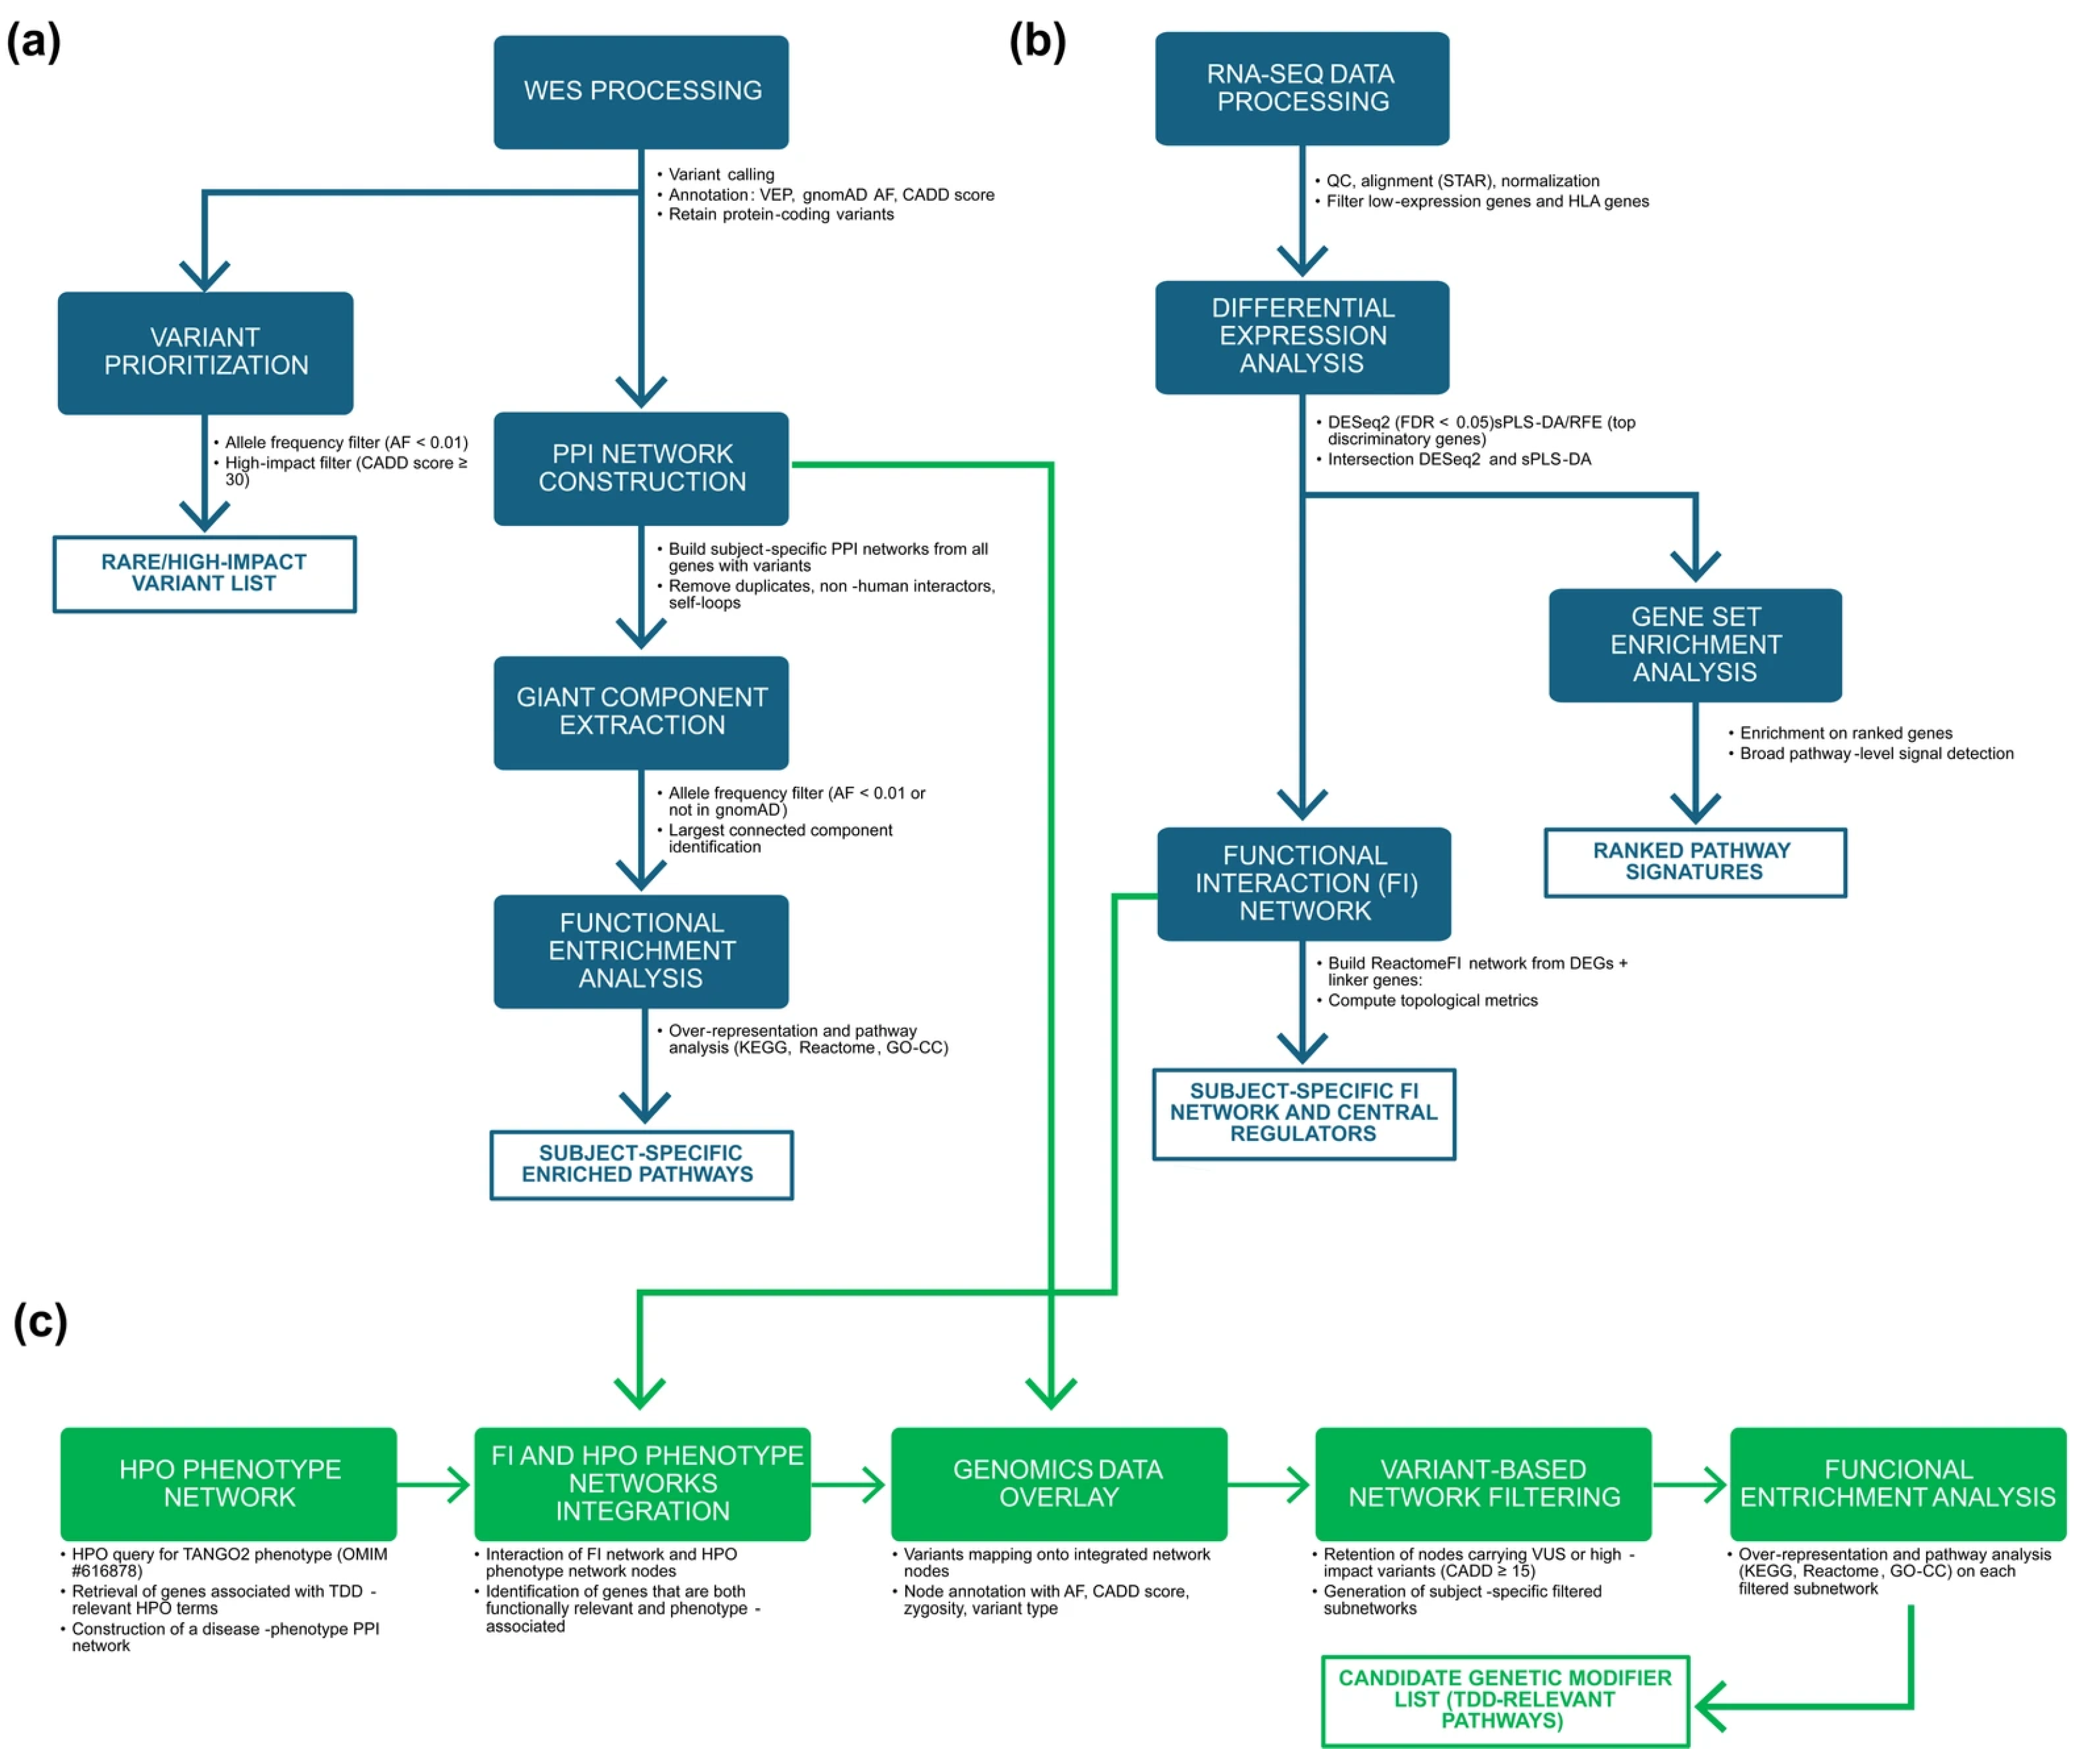
Figure 1 provides an overview of the analytical workflows employed in this study: (a) Genomic data analysis workflow (b) the Transcriptomic data analysis workflow, and (c) the integration workflow combining phenotype ontology, functional networks, and variant filtering to identify subject-specific candidate genetic modifiers.
Figure 1.
Overview of the multi-omics workflows used in this study. (a) Genomic data analysis workflow: Variant calling and annotation (VEP, gnomAD, CADD) were performed to characterize the variant set. Rare (AF < 0.01 or absent in gnomAD) or high-impact (CADD ≥ 30) variants were retained and used to construct subject-specific PPI networks based on IMEx interactions. After removal of non-human interactors, duplicates, and self-loops, the largest connected component of each network was extracted and analyzed through pathway over-representation analysis (KEGG, Reactome, GO-CC). (b) Transcriptomic data analysis workflow: RNA-seq data underwent quality control, alignment, normalization, and filtering of low-expression and HLA genes. Differential expression was assessed using DESeq2 (univariate) and sPLS-DA with recursive feature elimination (multivariate) to obtain a high-confidence set of DEGs. Pathway-level signals were evaluated through GSEA, and DEGs were used to reconstruct a ReactomeFI-based functional interaction (FI) network, expanded with linker genes and characterized through topological metrics. (c) Omics integration workflow: HPO terms associated with TDD (OMIM #616878) were used to build a disease–phenotype network, which was intersected with the FI network to identify genes that were both functionally connected and phenotype-associated. Subject-specific WES variants were overlaid onto this integrated network to obtain personalized integrated networks, which were then filtered using a CADD ≥ 15 threshold to generate subject-specific subnetworks. Functional enrichment analysis of these subnetworks was used to derive TDD-relevant functional signatures and to shortlist candidate genetic modifiers.
3. Results
3.1. Genomic Data Analysis
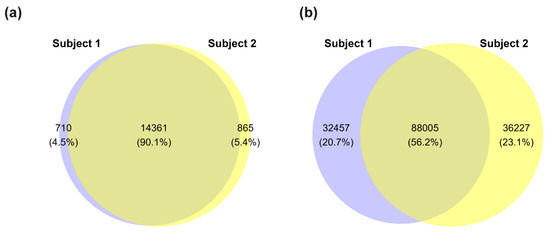
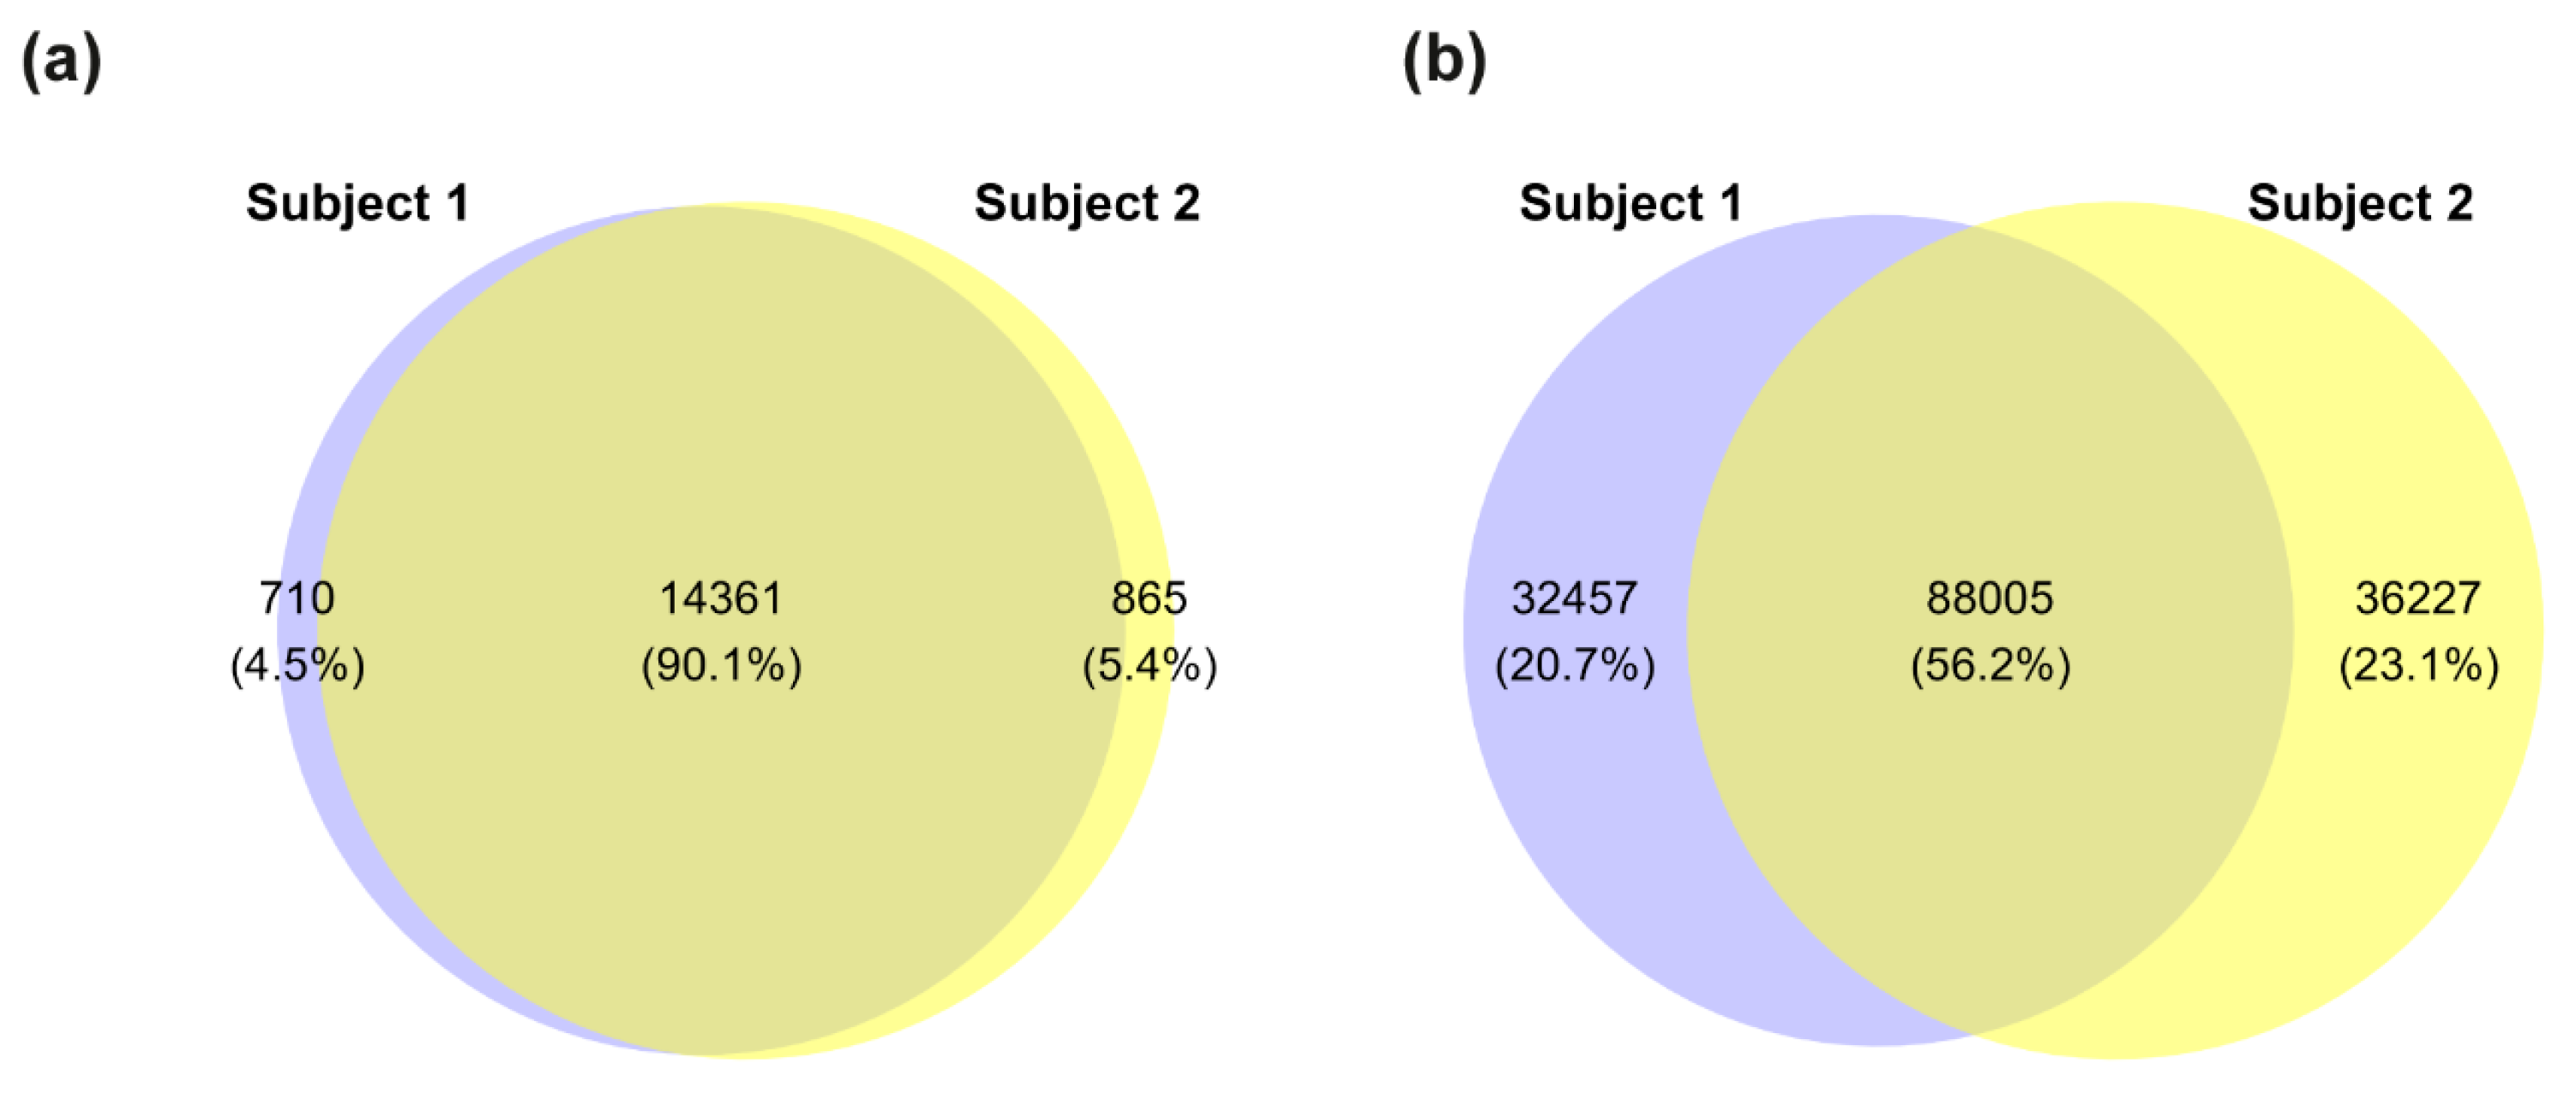
As an initial step, we performed a comprehensive WES analysis to compare genomic profiles of the two siblings and identify variants that may contribute to their divergent clinical phenotypes. This analysis revealed variants in 15,071 protein-coding genes in Subject 1 (male) and 15,226 protein-coding genes in Subject 2 (female). Notably, 710 genes were unique to Subject 1 and 865 genes to Subject 2 (Figure 2a). In total, we identified 244,694 variants across both subjects: 120,462 in Subject 1 and 124,232 in Subject 2. Of these, 88,005 variants were shared, while 32,457 variants were unique to Subject 1 and 36,227 to Subject 2 (Figure 2b). The known compound heterozygous variants in the TANGO2 gene (c.262C>T, p.Arg88Ter; c.338del, p.Gly113AlafsTer10) were confirmed in both siblings.
Figure 2.
Distribution of genes and variants between siblings. (a) Euler-Venn diagram showing protein-coding genes with at least one detected variant in each subject. (b) Total number of genomic variants detected in each subject and their overlap. Blue = Subject 1 (male, affected), yellow = Subject 2 (female, unaffected).
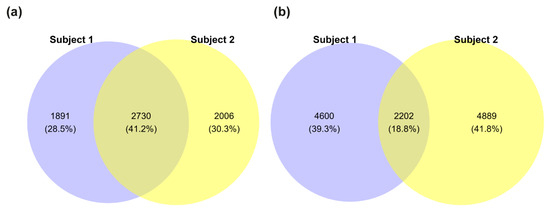
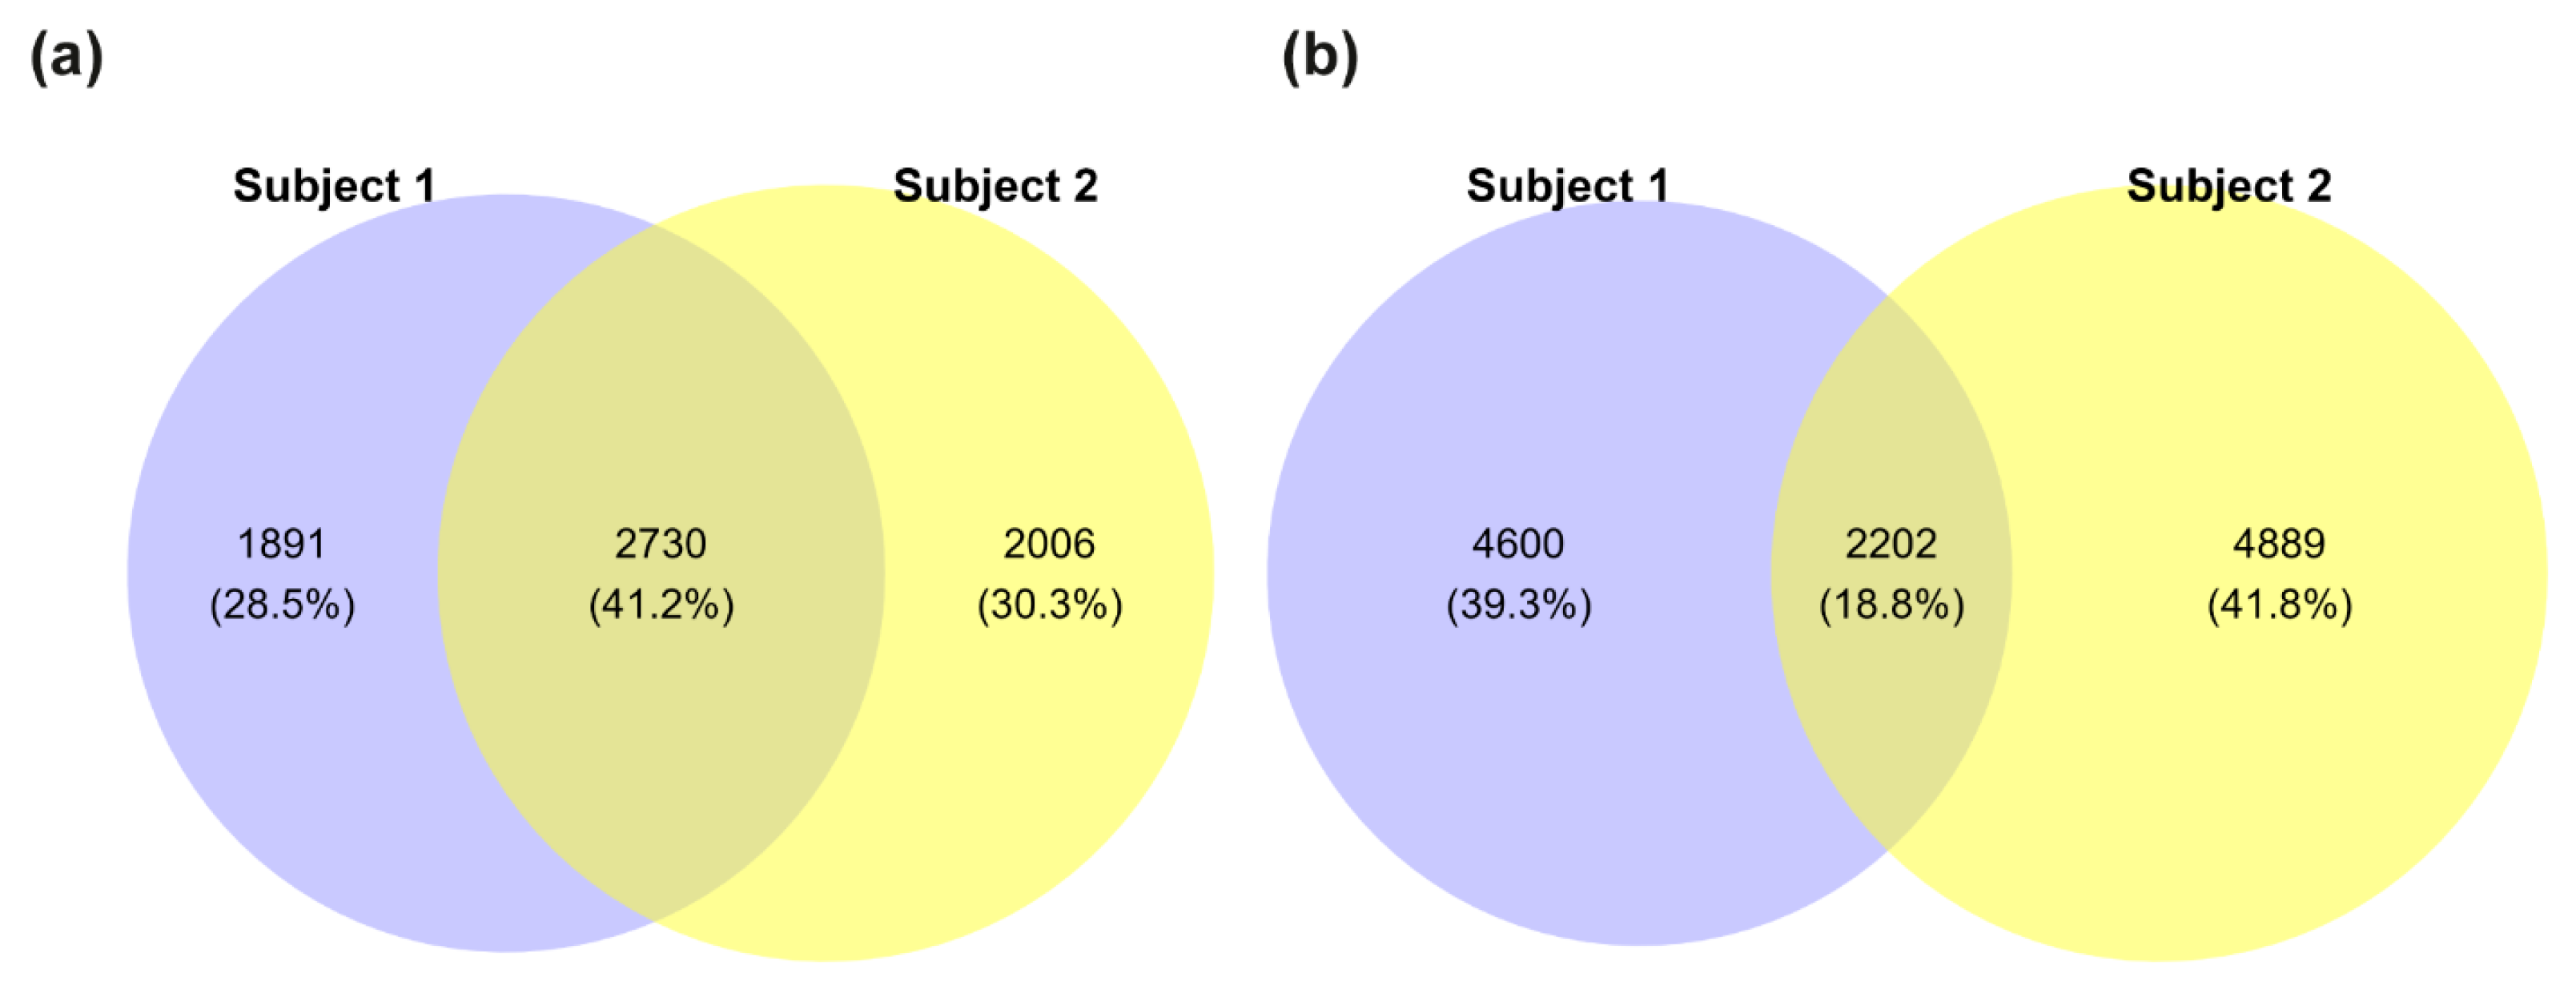
Next, we assessed the potential pathogenicity of the detected variants by comparing CADD score distributions between the siblings (Figure S1). However, no significant differences were observed. We then filtered for rare variants with an AF below 0.01 or lacking annotation in gnomAD. This filtering step reduced the number of protein-coding genes with variants to 4621 in Subject 1 and 4730 in Subject 2, with 2730 genes shared between them (Figure 3a). The total number of variants was also reduced, with Subject 1 carrying 6802 variants and Subject 2 having 4889, of which 2202 were shared (Figure 3b).
Figure 3.
Rare variant distribution between siblings. (a) Euler-Venn diagram of protein-coding genes harboring at least one rare variant (allele frequency < 0.01 or not annotated in gnomAD). (b) Total number of rare variants detected in each subject and their overlap. Blue = Subject 1 (male, affected), yellow = Subject 2 (female, unaffected).
We focused on variants with a CADD score ≥ 30 to prioritize variants most likely to have strong deleterious effects, identifying a total of 48 rare variants (Table 2). Most of the variants identified (46) were located in genes that are tolerant to haploinsufficiency in heterozygosity, suggesting limited contribution to phenotypic divergence. We therefore prioritized variants located in genes with high intolerance to loss-of-function (pLI ≥ 0.9). Among these, a variant in CUX1 was found in both siblings and thus unlikely to account for clinical differences. In Subject 1, the most pathogenic variant was found in the PABPC1 gene, which encodes a poly(A) binding protein (CADD score: 45, AF: 1.824 × 10⁻³; pLI = 1). Notably, variants in this gene have been linked to neurodevelopmental disorders, potentially impairing neurogenesis [33,34]. Conversely, all high-CADD variants unique to Subject 2 (female, unaffected) were detected in genes not typically associated with TDD. These included a canonical splice-site variant in the SORT1 (c.1108+1G>A) gene, classified as a variant of unknown significance (VUS). SORT1 is involved in glucose and lipoprotein metabolism, neurotrophin signaling and lysosomal targeting [35,36]. Additional missense variants were found in KCNJ12, PAX7, and RANBP3 genes, which are mainly involved in cellular excitability, fetal development and cellular signaling, respectively [37,38,39]. However, these variants had allele count > 10 in gnomAD and lacked phenotypic relevance to Subject 2’s presentation and were therefore excluded from further consideration.
Table 2.
Rare gene variants with high predicted pathogenicity identified in the two siblings.
To explore the physical interactions among proteins harboring these variants, we constructed PPI networks. The initial networks comprised 15,071 nodes and 305,034 edges for Subject 1, and 15,226 nodes and 308,747 edges for Subject 2. After filtering for rare variants (AF < 0.01 or not annotated in gnomAD), Subject 1’s network was reduced to 4621 nodes and 33,996 edges, and Subject 2’s network to 4736 nodes and 35,604 edges. The giant components of these filtered networks contained 4071 nodes and 33,994 edges for Subject 1, and 4189 nodes and 35,601 edges for Subject 2 (Figure S2).
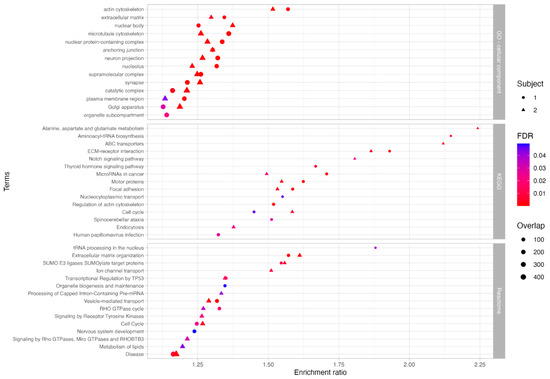
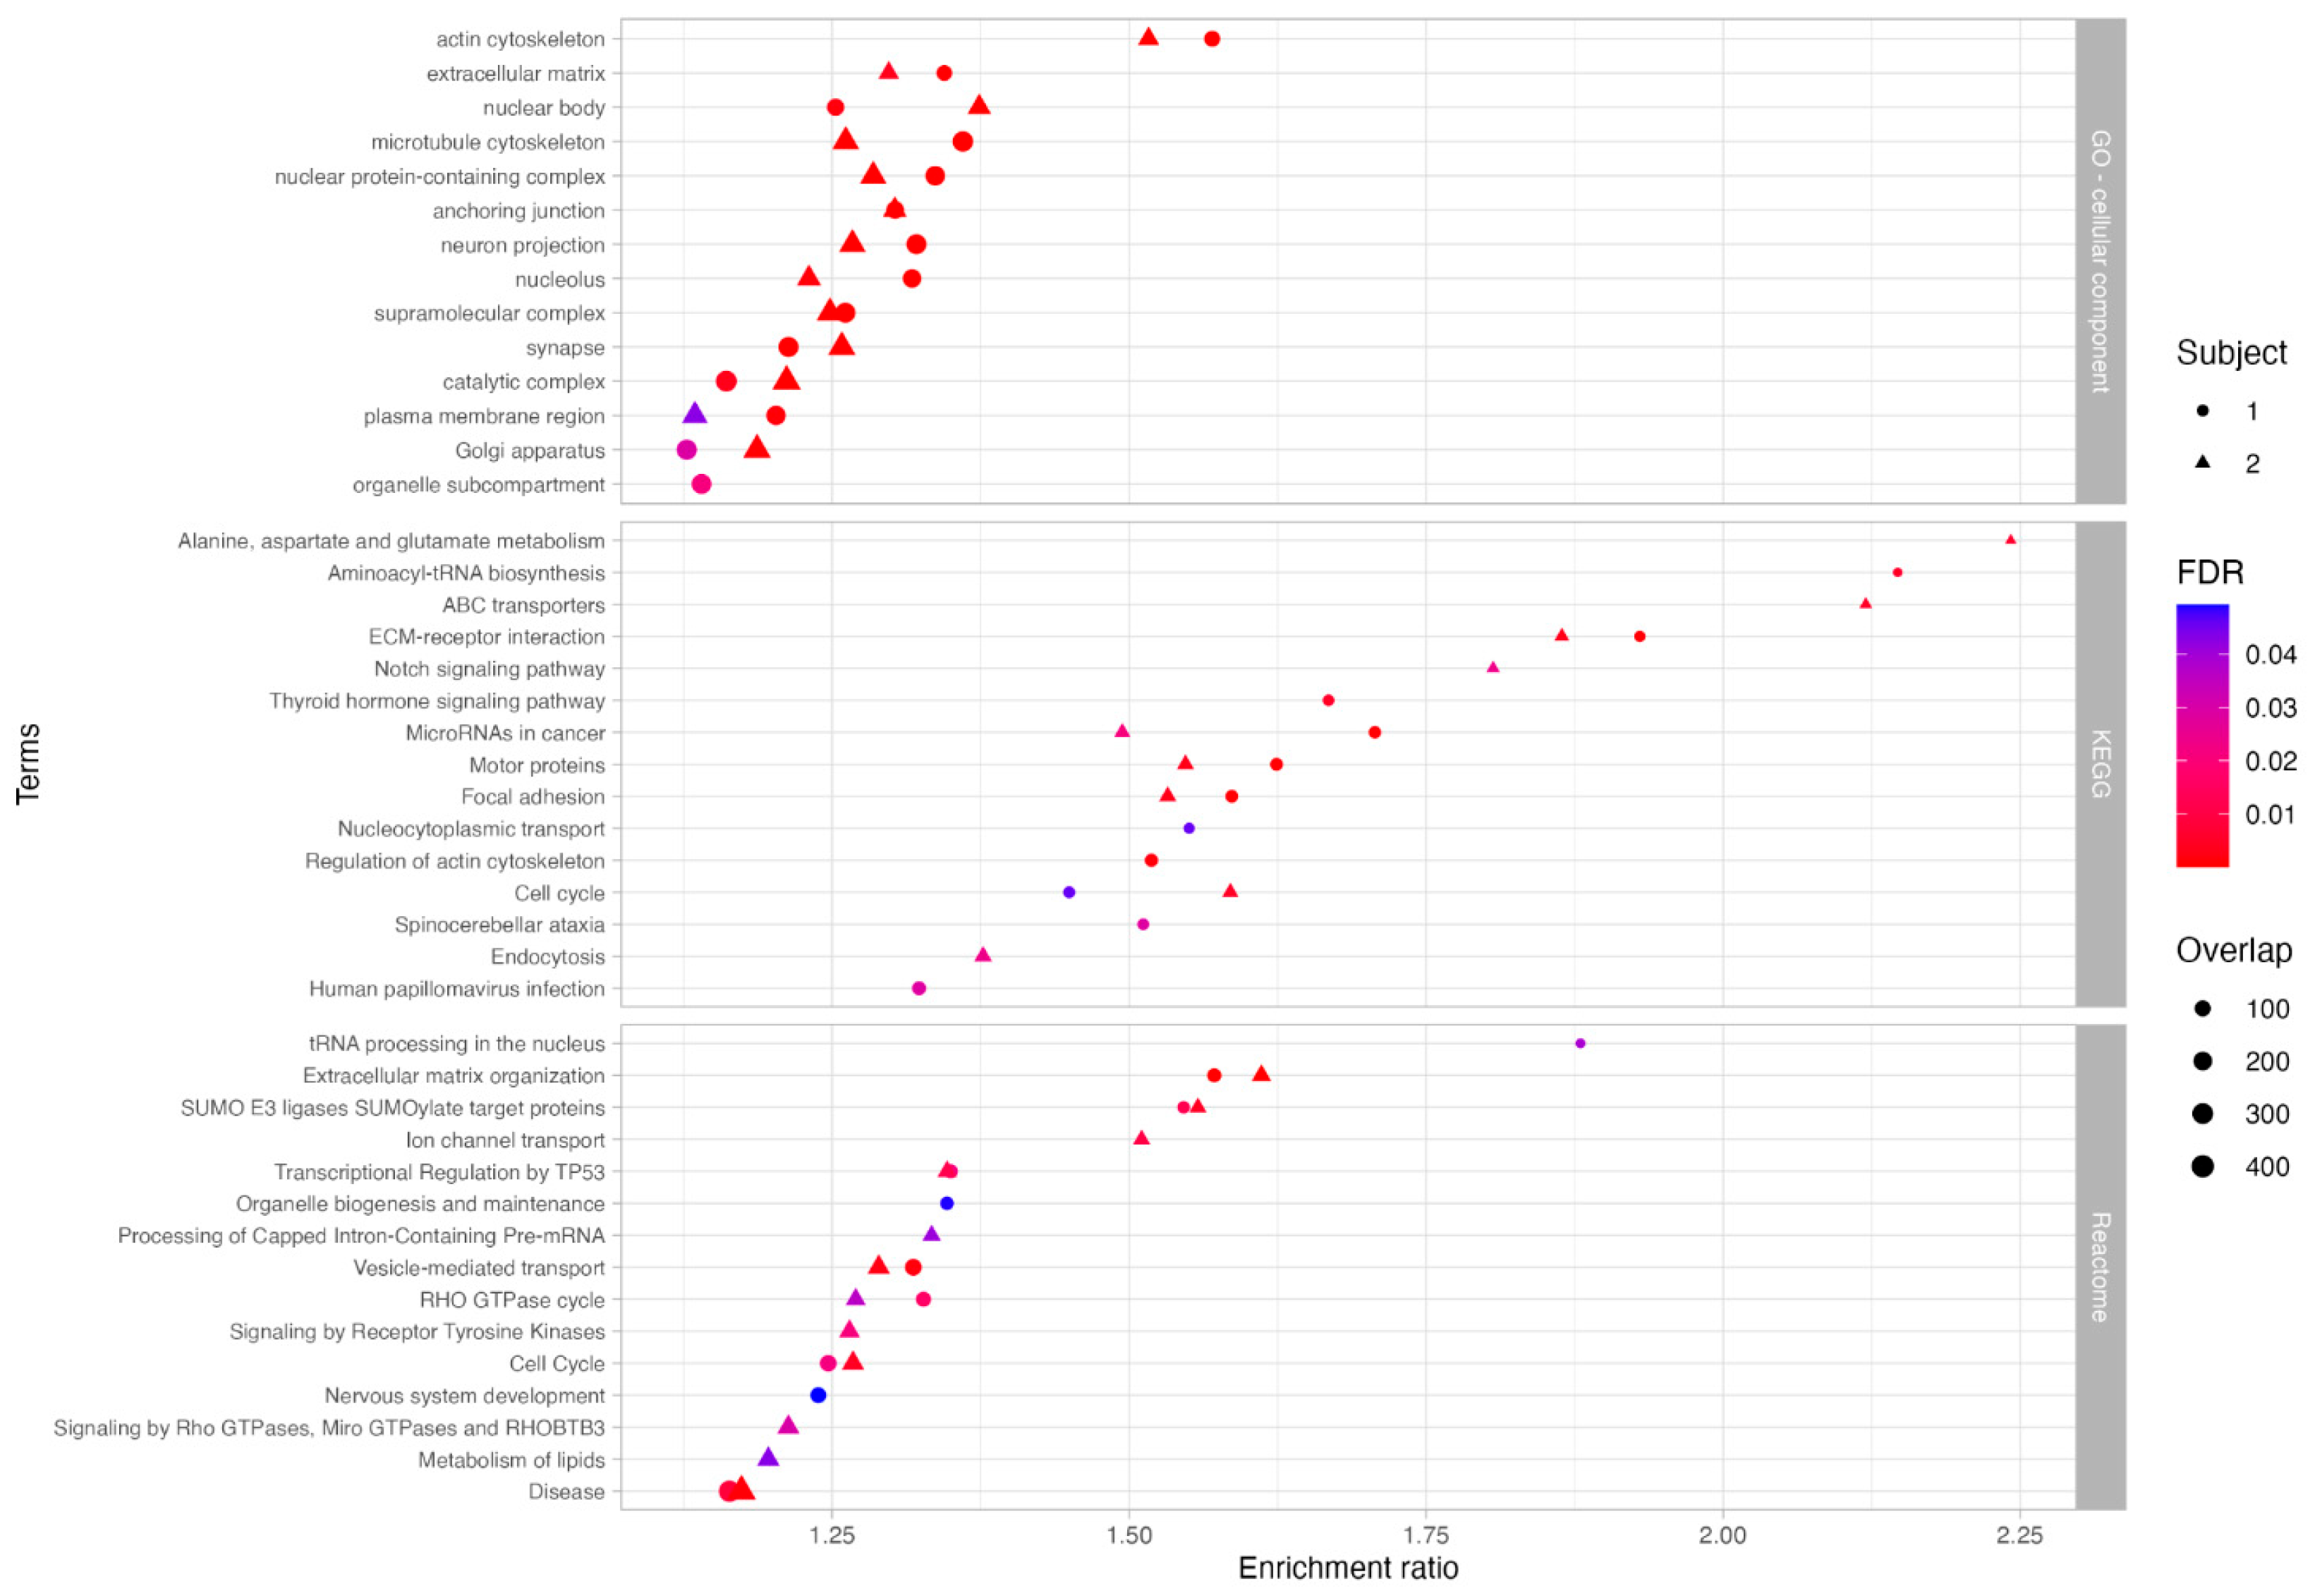
To explore the potential biological significance of these variants, we performed functional enrichment analysis using ORA on the genes within the giant components. This analysis aimed to identify pathways potentially linked to the TDD phenotype and infer the subcellular localization of the encoded proteins (Figure 4, Table S1). In Subject 1, enriched pathways included thyroid hormone signaling, neurodevelopment, vesicle transport, cellular signaling, and transcriptional processes. In Subject 2, enriched pathways included amino acid and lipid metabolism, transport processes, cellular signaling, vesicular trafficking, motor protein function, RNA processing, extracellular matrix organization, endocytosis, and p53-related mechanisms. Gene Ontology (GO) analysis revealed enrichment in both Subjects for cellular components such as the cytoskeleton, extracellular matrix, plasma membrane, nucleus, neuronal projection, synapses, and Golgi apparatus. Notably, Subject 1 also showed specific enrichment in organelle subcompartments.
Figure 4.
Functional enrichment analysis of genes in subject-specific PPI network giant components. Significantly enriched terms identified through functional enrichment using GO (Cellular Component), KEGG, and Reactome databases. Circles represent terms enriched in Subject 1; triangles represent terms enriched in Subject 2. Symbol size reflects the number of associated genes, and color indicates statistical significance (FDR ≤ 0.05).
3.2. Transcriptomic Data Analysis
RNA sequencing analysis generated a raw count matrix of 31,638 genes across six samples (31,638 × 6). After filtering for low expression (CPM > 0.5 in at least two samples), the matrix was reduced to 16,489 × 6. Exploratory data analysis showed consistent raw count distributions across biological replicates, with the median log2CPM values for the entire dataset aligning with those of individual samples (Figure S3a). PCA further revealed distinct clustering of replicates by Subject, with the first two principal components explaining 68% and 15% of the variance, respectively (Figure S3b). Due to their intrinsic high variance, HLA genes were removed, resulting in a final 16,403 × 6 count matrix.
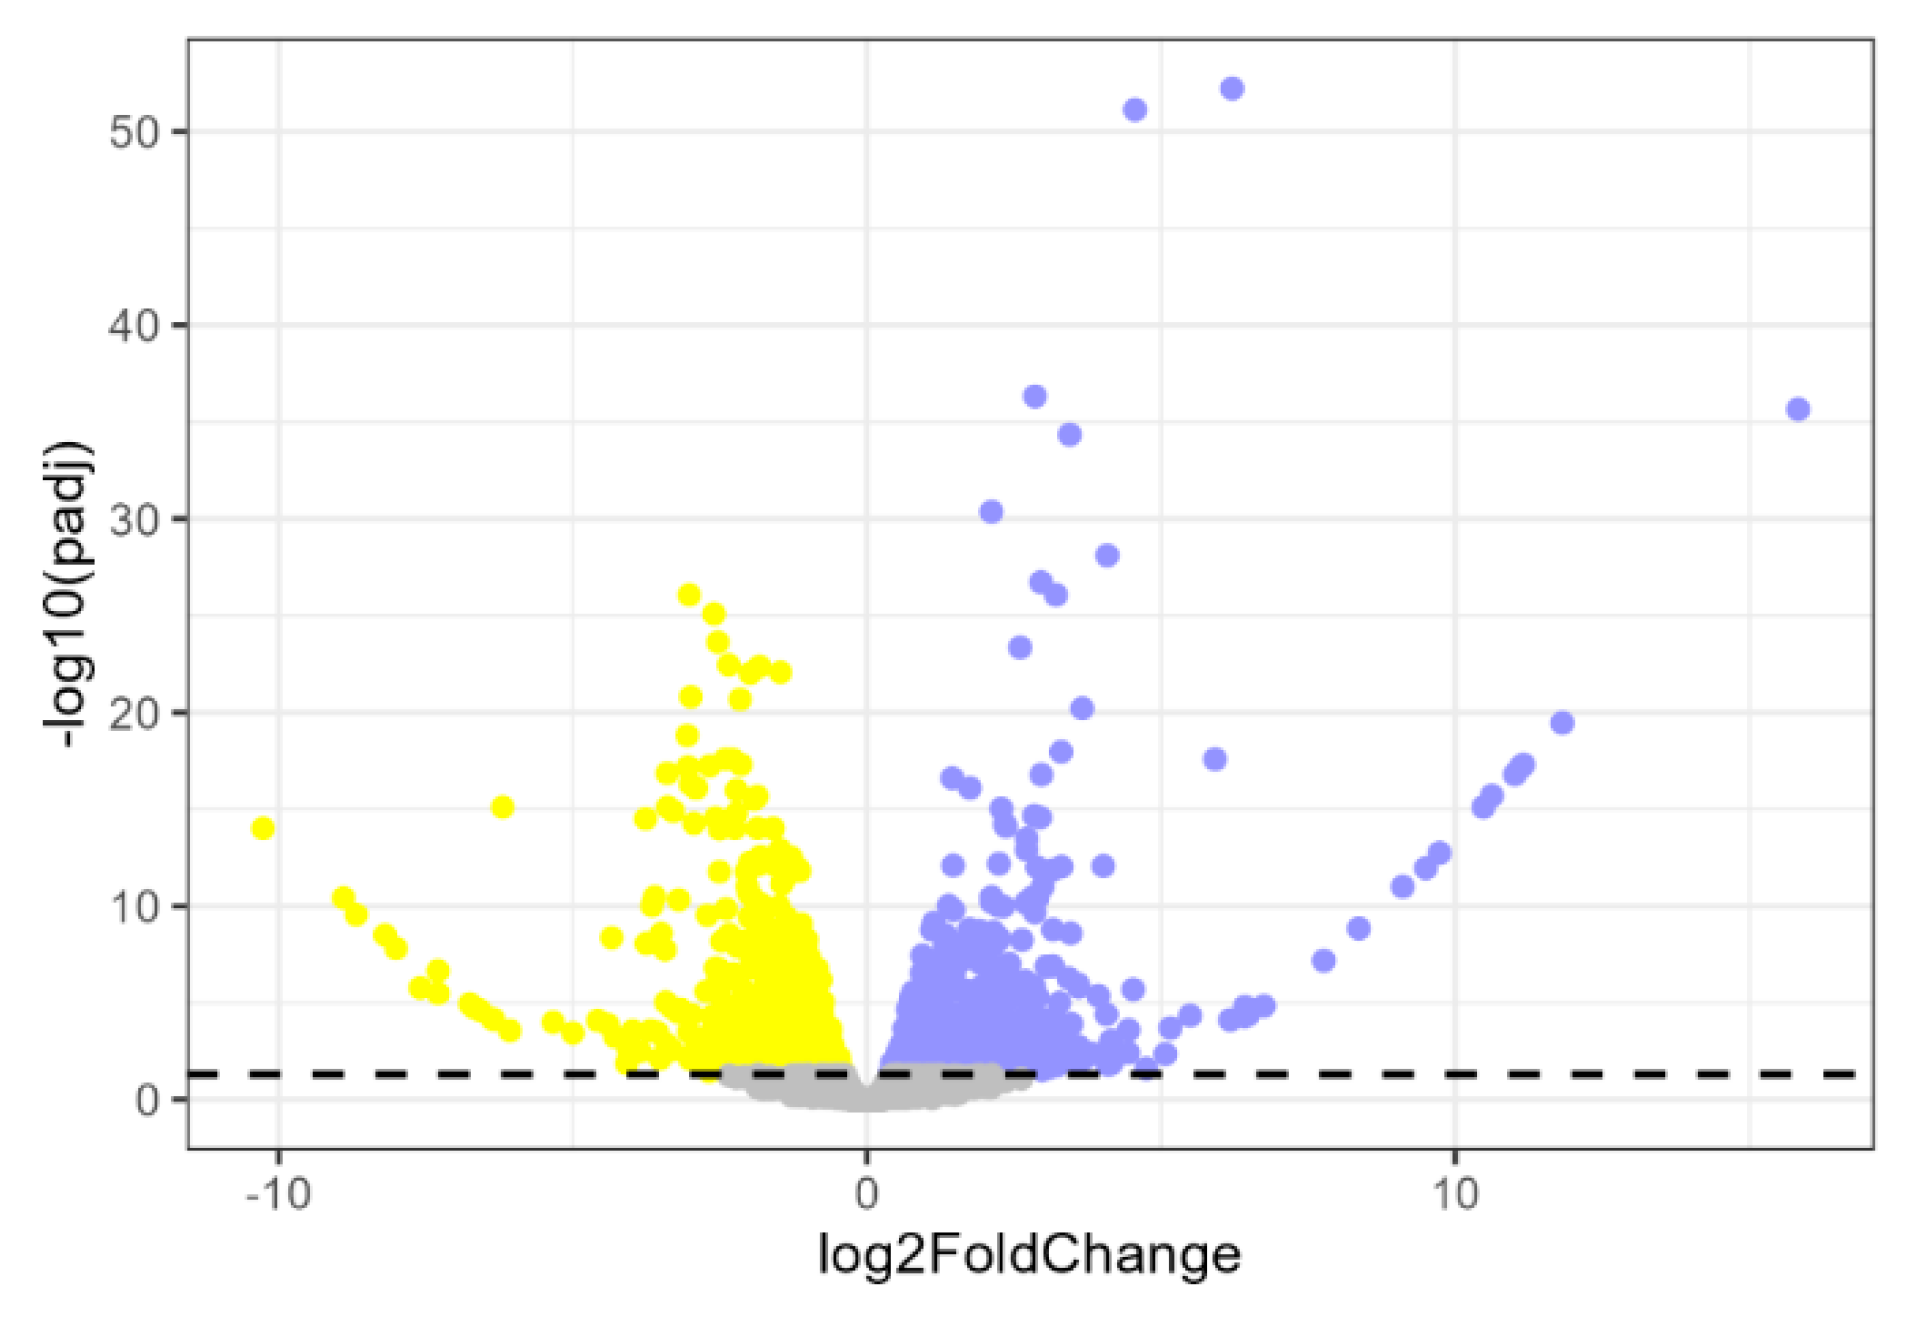
Differential expression analysis was performed using DESeq2, fitting the data to a negative binomial distribution (Figure S4). We identified 1425 differentially expressed genes (DEGs; adjusted p-value < 0.05). Of these, 673 were up-regulated and 752 were down-regulated genes in Subject 1 relative to Subject 2 (Figure 5).
Figure 5.
Differential gene expression between siblings. Volcano plot showing differentially expressed genes (DEGs) in Subject 1 relative to Subject 2. Blue dots represent up-regulated genes in Subject 1 vs. Subject 2; yellow dots represent down-regulated genes in Subject 1 vs. Subject 2; gray dots indicate non-significant genes. The dashed horizontal line marks the significance threshold (adjusted p-value = 0.05).
To complement the univariate analysis, we applied a multivariate approach using sPLS-DA on the 16,403-gene matrix. After confirming data separability (Figure S5a), we selected the first component (explaining 31% of the variance) and iteratively performed RFE to identify the most discriminative genes. This process retained 1640 genes (10% of the initial genes), with the first component (X-variate 1) explaining 86% of the variance (Figure S5b).
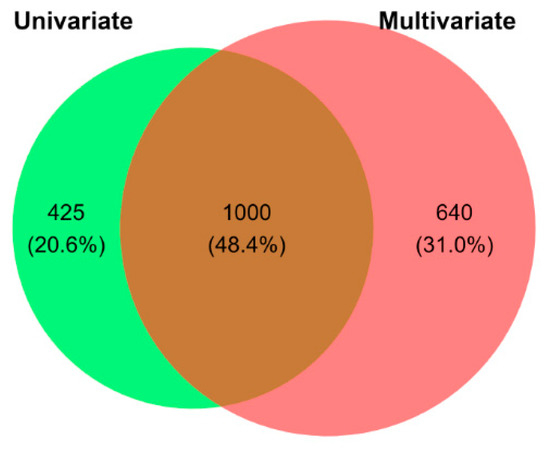
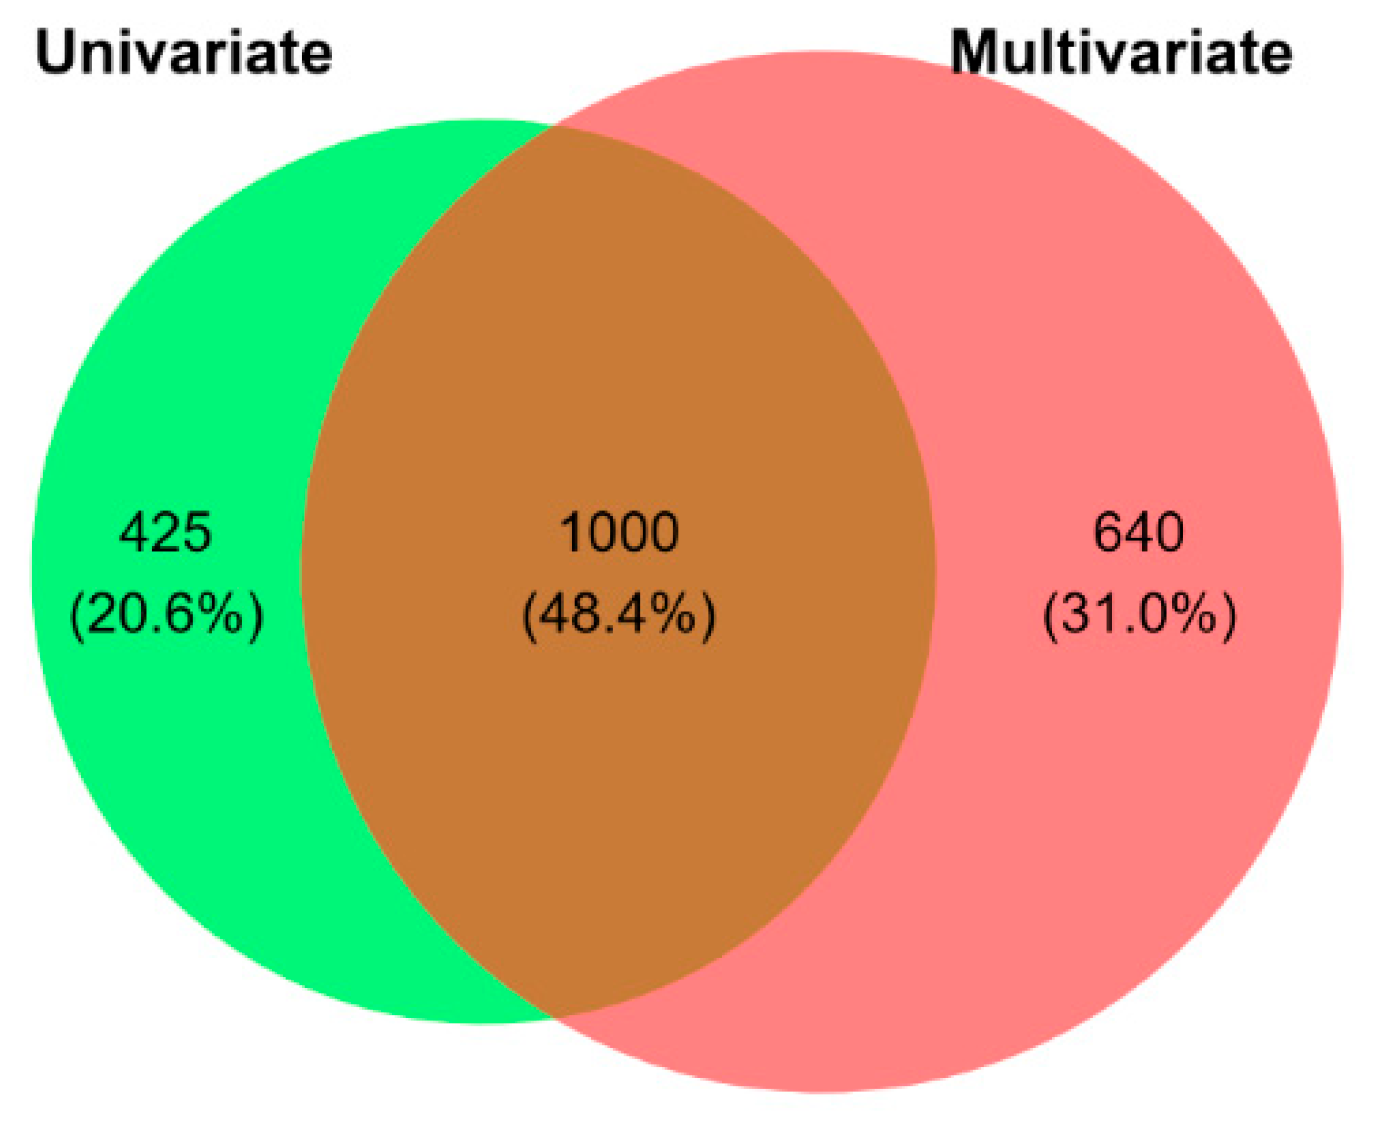
To ensure robustness and increase specificity, we intersected the DEGs identified by DESeq2 and sPLS-DA, retaining only the 1000 genes common to both methods (Figure 6). Among these, 454 were up-regulated and 546 down-regulated in Subject 1 vs. Subject 2 (Figure S6, Table S2).
Figure 6.
Overlap of differentially expressed genes (DEGs) identified by univariate and multivariate analyses. Venn diagram showing the overlap between DEGs identified using a univariate approach (green; DESeq2) and a multivariate approach (red; sPLS-DA with recursive feature elimination). The intersection includes 1000 DEGs retained for downstream analysis.
GSEA, performed using the log2 fold changes across all genes, did not identify any significantly enriched pathways.
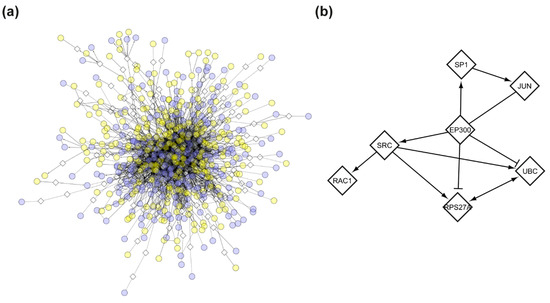
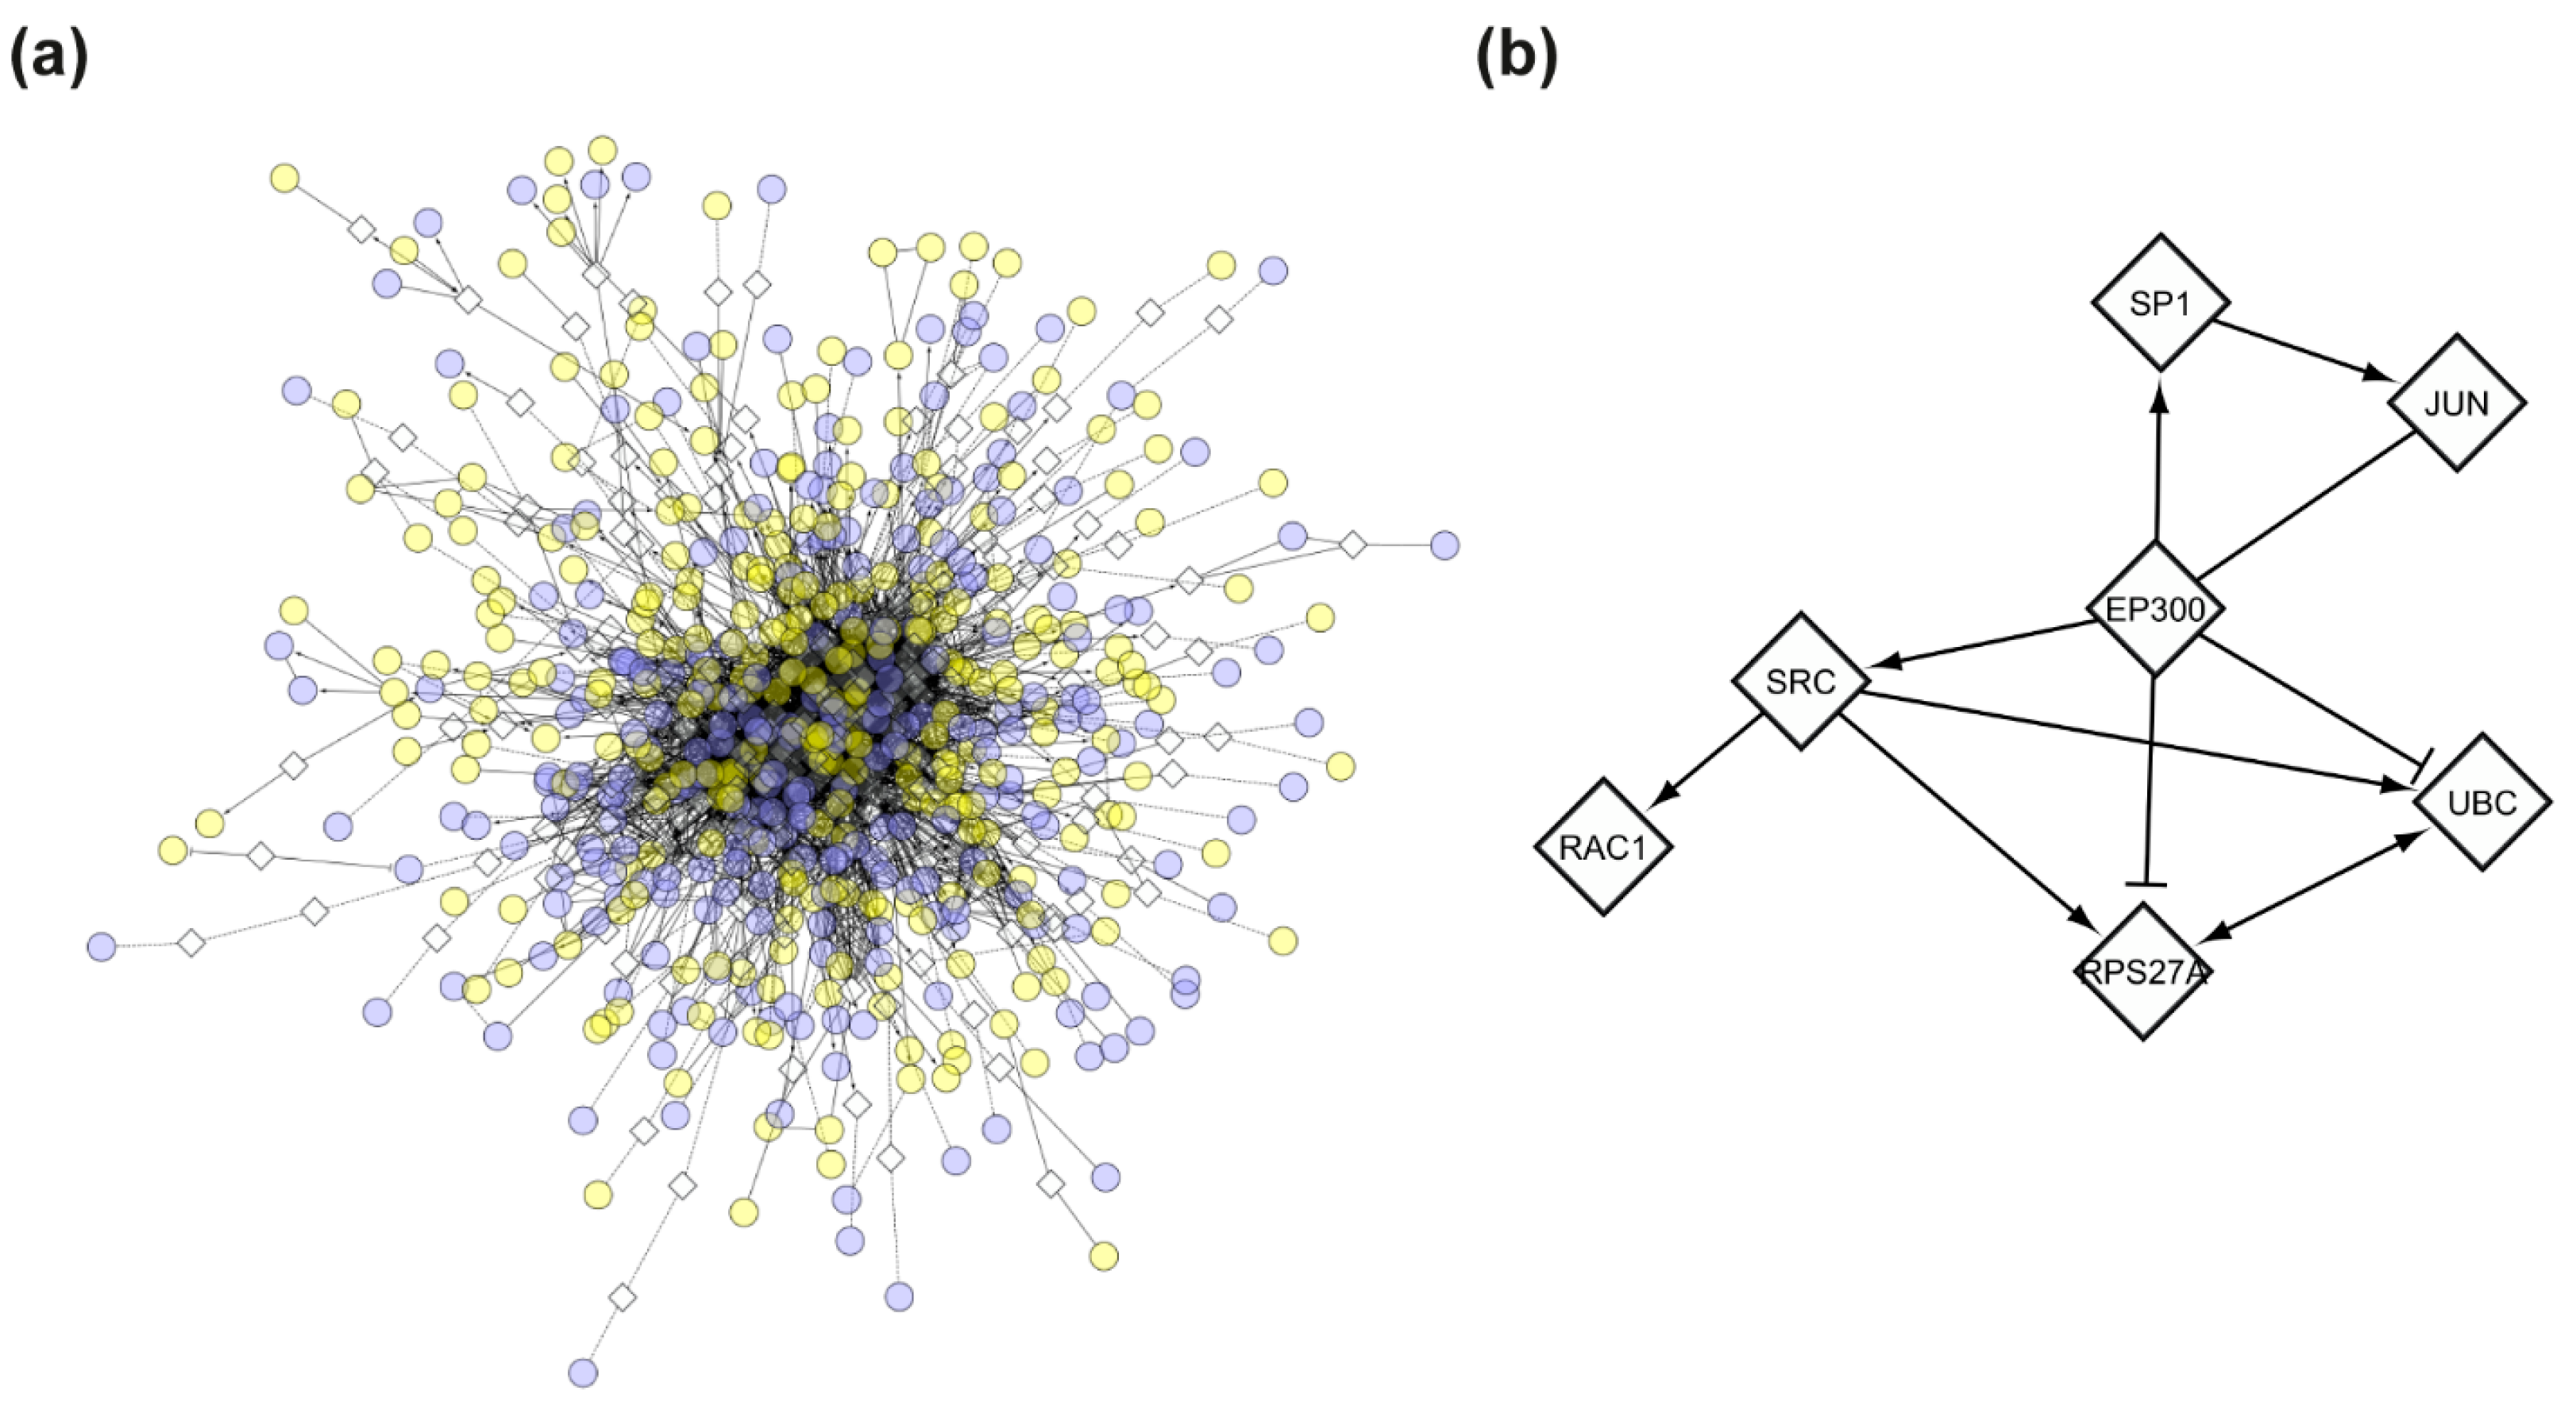
To further interpret the transcriptional changes, we constructed an FI network based on the DEG list. The FI network comprised 735 nodes (521 DEGs and 214 linker genes) and 3114 edges (Figure 7a). By focusing on high connectivity nodes (both in-degree and out-degree), we identified a tightly interconnected cluster of 7 genes at the network’s core (Figure 7b). Among these, EP300 appeared to be the central player, with an in-degree of 24 and an out-degree of 91 (Table 3).
Figure 7.
Functional interaction (FI) network of differentially expressed genes (DEGs). (a) Full FI network generated from DEGs with the addition of linker genes, showing functional connectivity among differentially expressed transcripts. (b) Core cluster of 7 highly connected genes within the network. Circular nodes represent DEGs; diamond-shaped nodes indicate linker genes. Edges represent high-confidence functional interactions; arrows indicate directed functional interactions; dashed edges indicate predicted (but not experimentally validated) functional interactions. Blue nodes are upregulated in Subject 1; yellow nodes are downregulated in Subject 1.
Table 3.
Core genes in the functional interaction (FI) network.
3.3. Integrating Genomic, Transcriptomic, and Phenotypic Data for Subject-Specific Networks
To integrate phenotypic information into the analysis, we queried the HPO database to identify genes associated with the TDD phenotype. Specifically, we selected the entry “Metabolic encephalomyopathic crises, recurrent, with rhabdomyolysis, cardiac arrhythmias, and neurodegeneration” (OMIM: #616878), which is representative of the clinical features observed in TDD. This entry was linked to 61 HPO terms associated with TDD (Table S3), corresponding to 4599 unique genes (Table S4). These genes were employed to generate a disease-phenotype network to capture functional relationships potentially relevant to the observed phenotype. The resulting network consisted of 4599 nodes and 50,016 edges. The giant component contained 4276 nodes and 50,015 edges, with the remainder comprising one node pair and 321 singleton nodes (Figure S7).
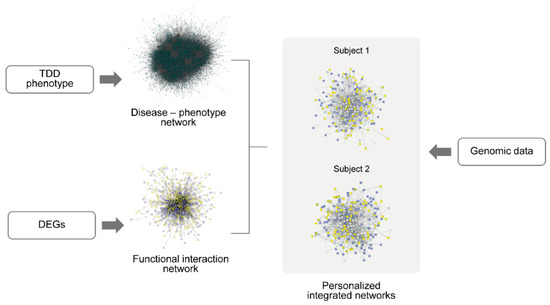
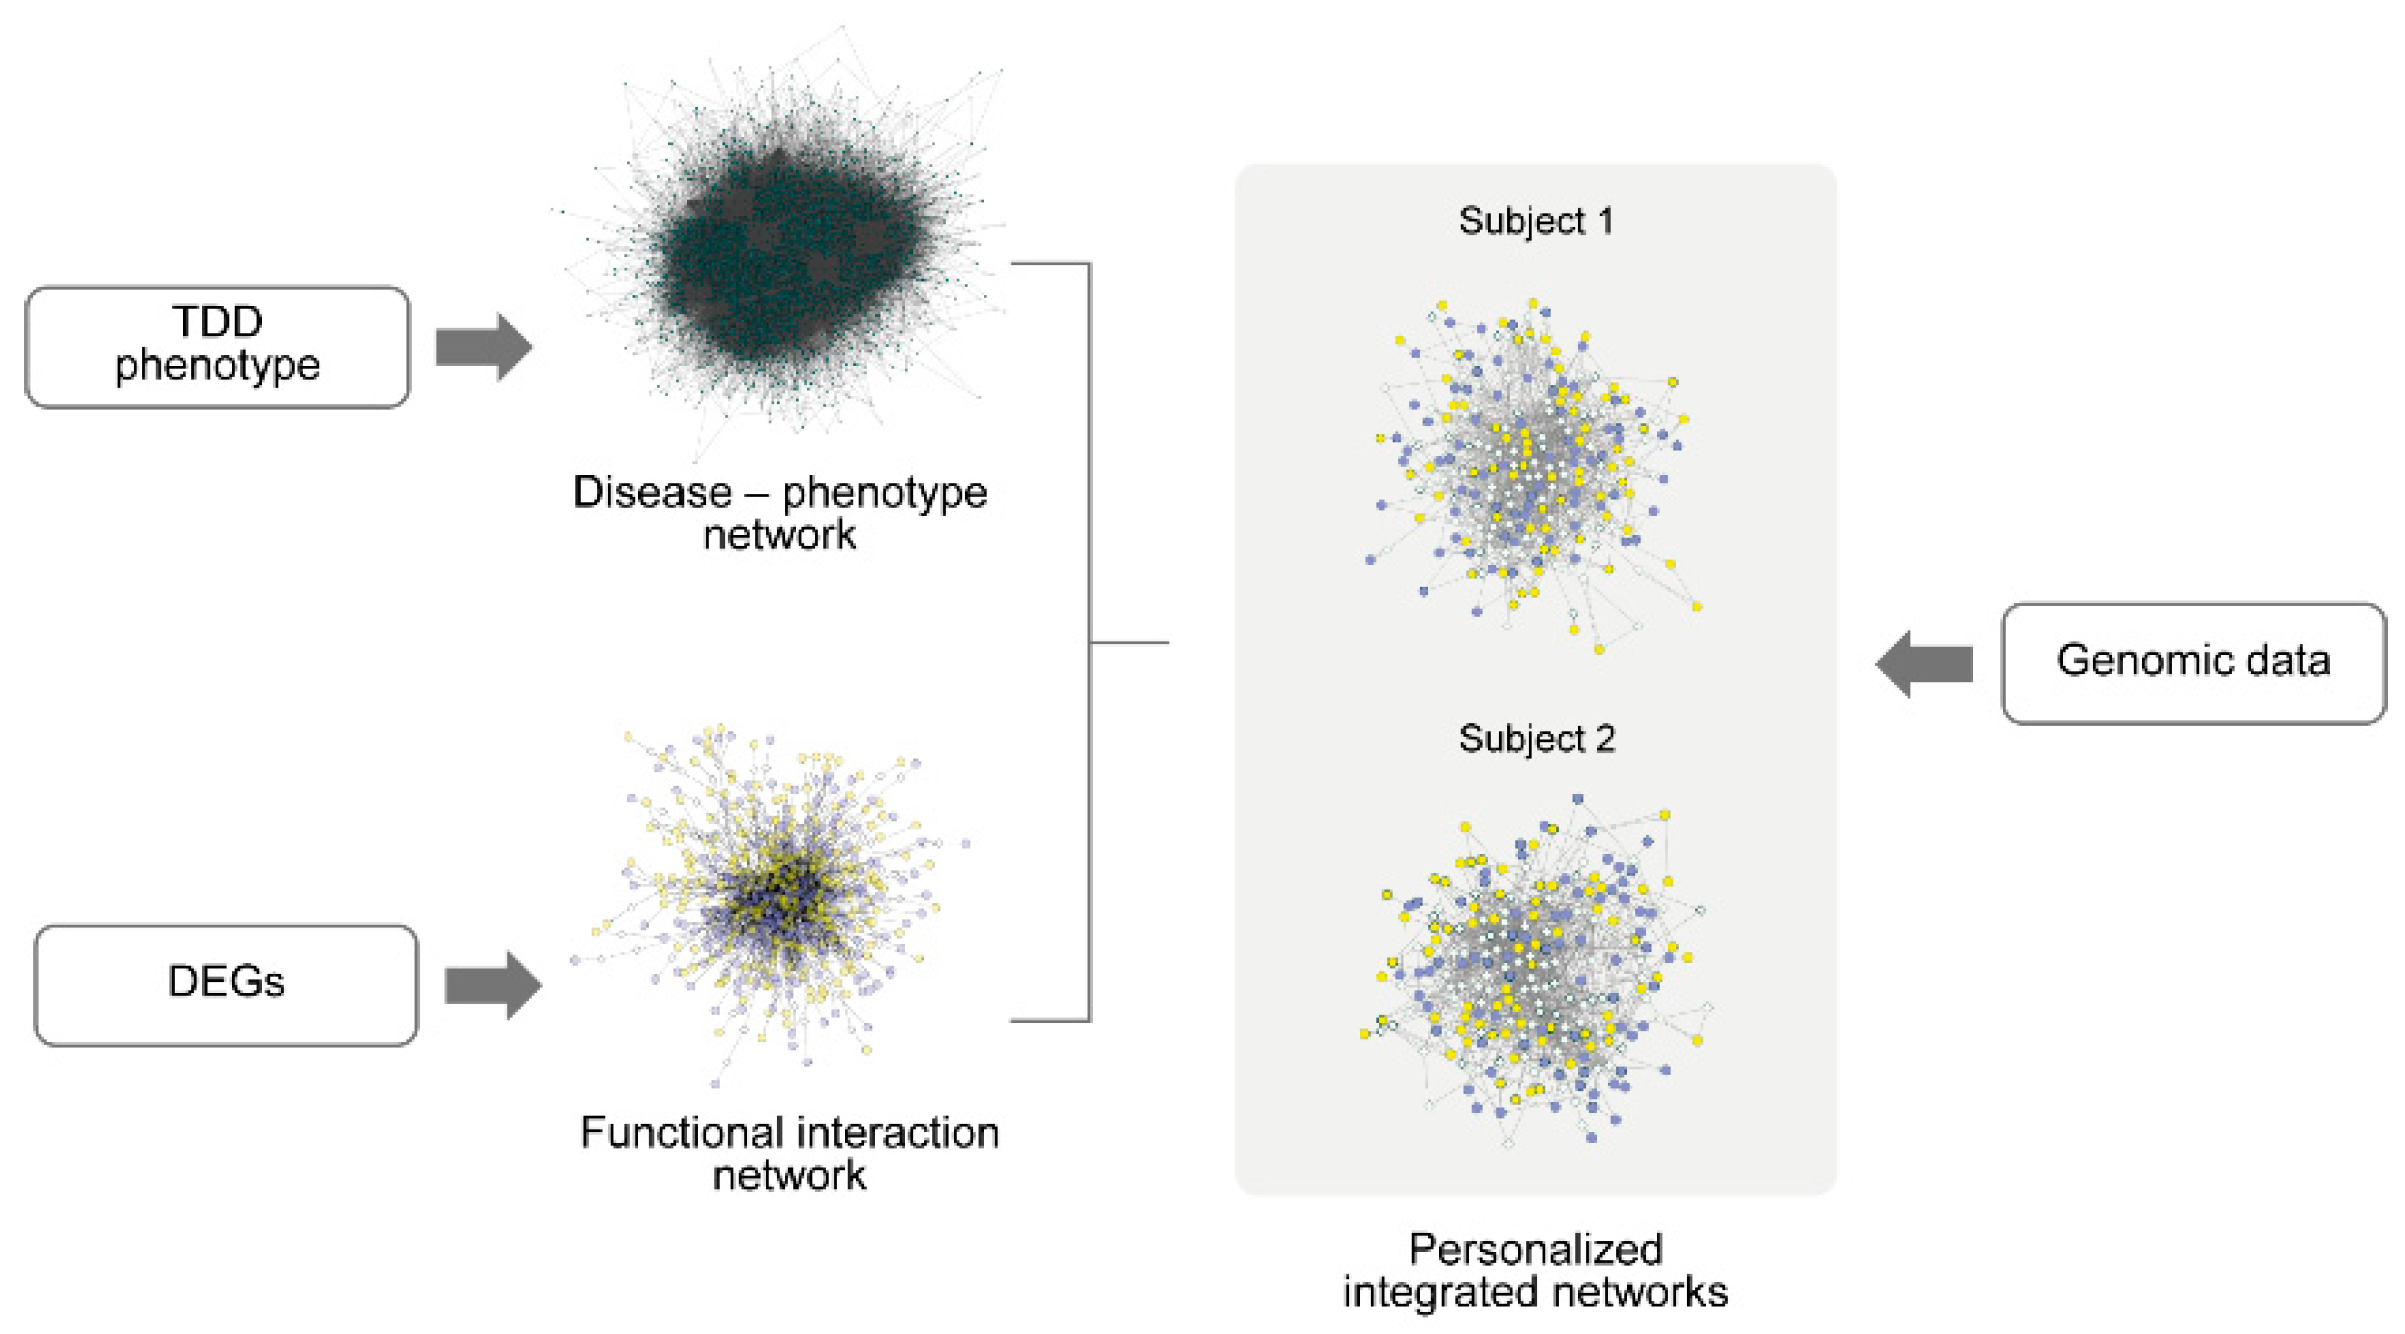
To investigate how DEGs and their functional interactors relate to the TDD phenotype, we intersected the giant component of the disease-phenotype network with the previously constructed FI network based on DEGs. The overall integration workflow is illustrated in Figure 8.
Figure 8.
Workflow for the construction of personalized integrated networks. Differentially expressed genes (DEGs) were used to generate a functional interaction (FI) network, while phenotype-associated genes were retrieved from the Human Phenotype Ontology (HPO) database to construct a disease-phenotype network (OMIM: #616878). The giant components of both networks were intersected to define a shared functional-phenotypic network. Genomic variant data from WES were subsequently integrated to build subject-specific personalized networks.
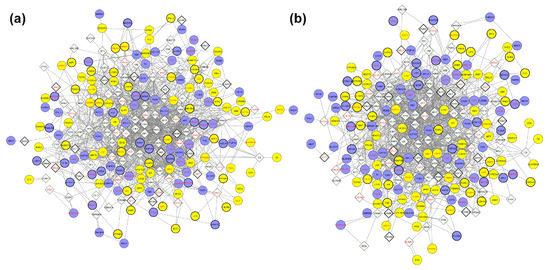
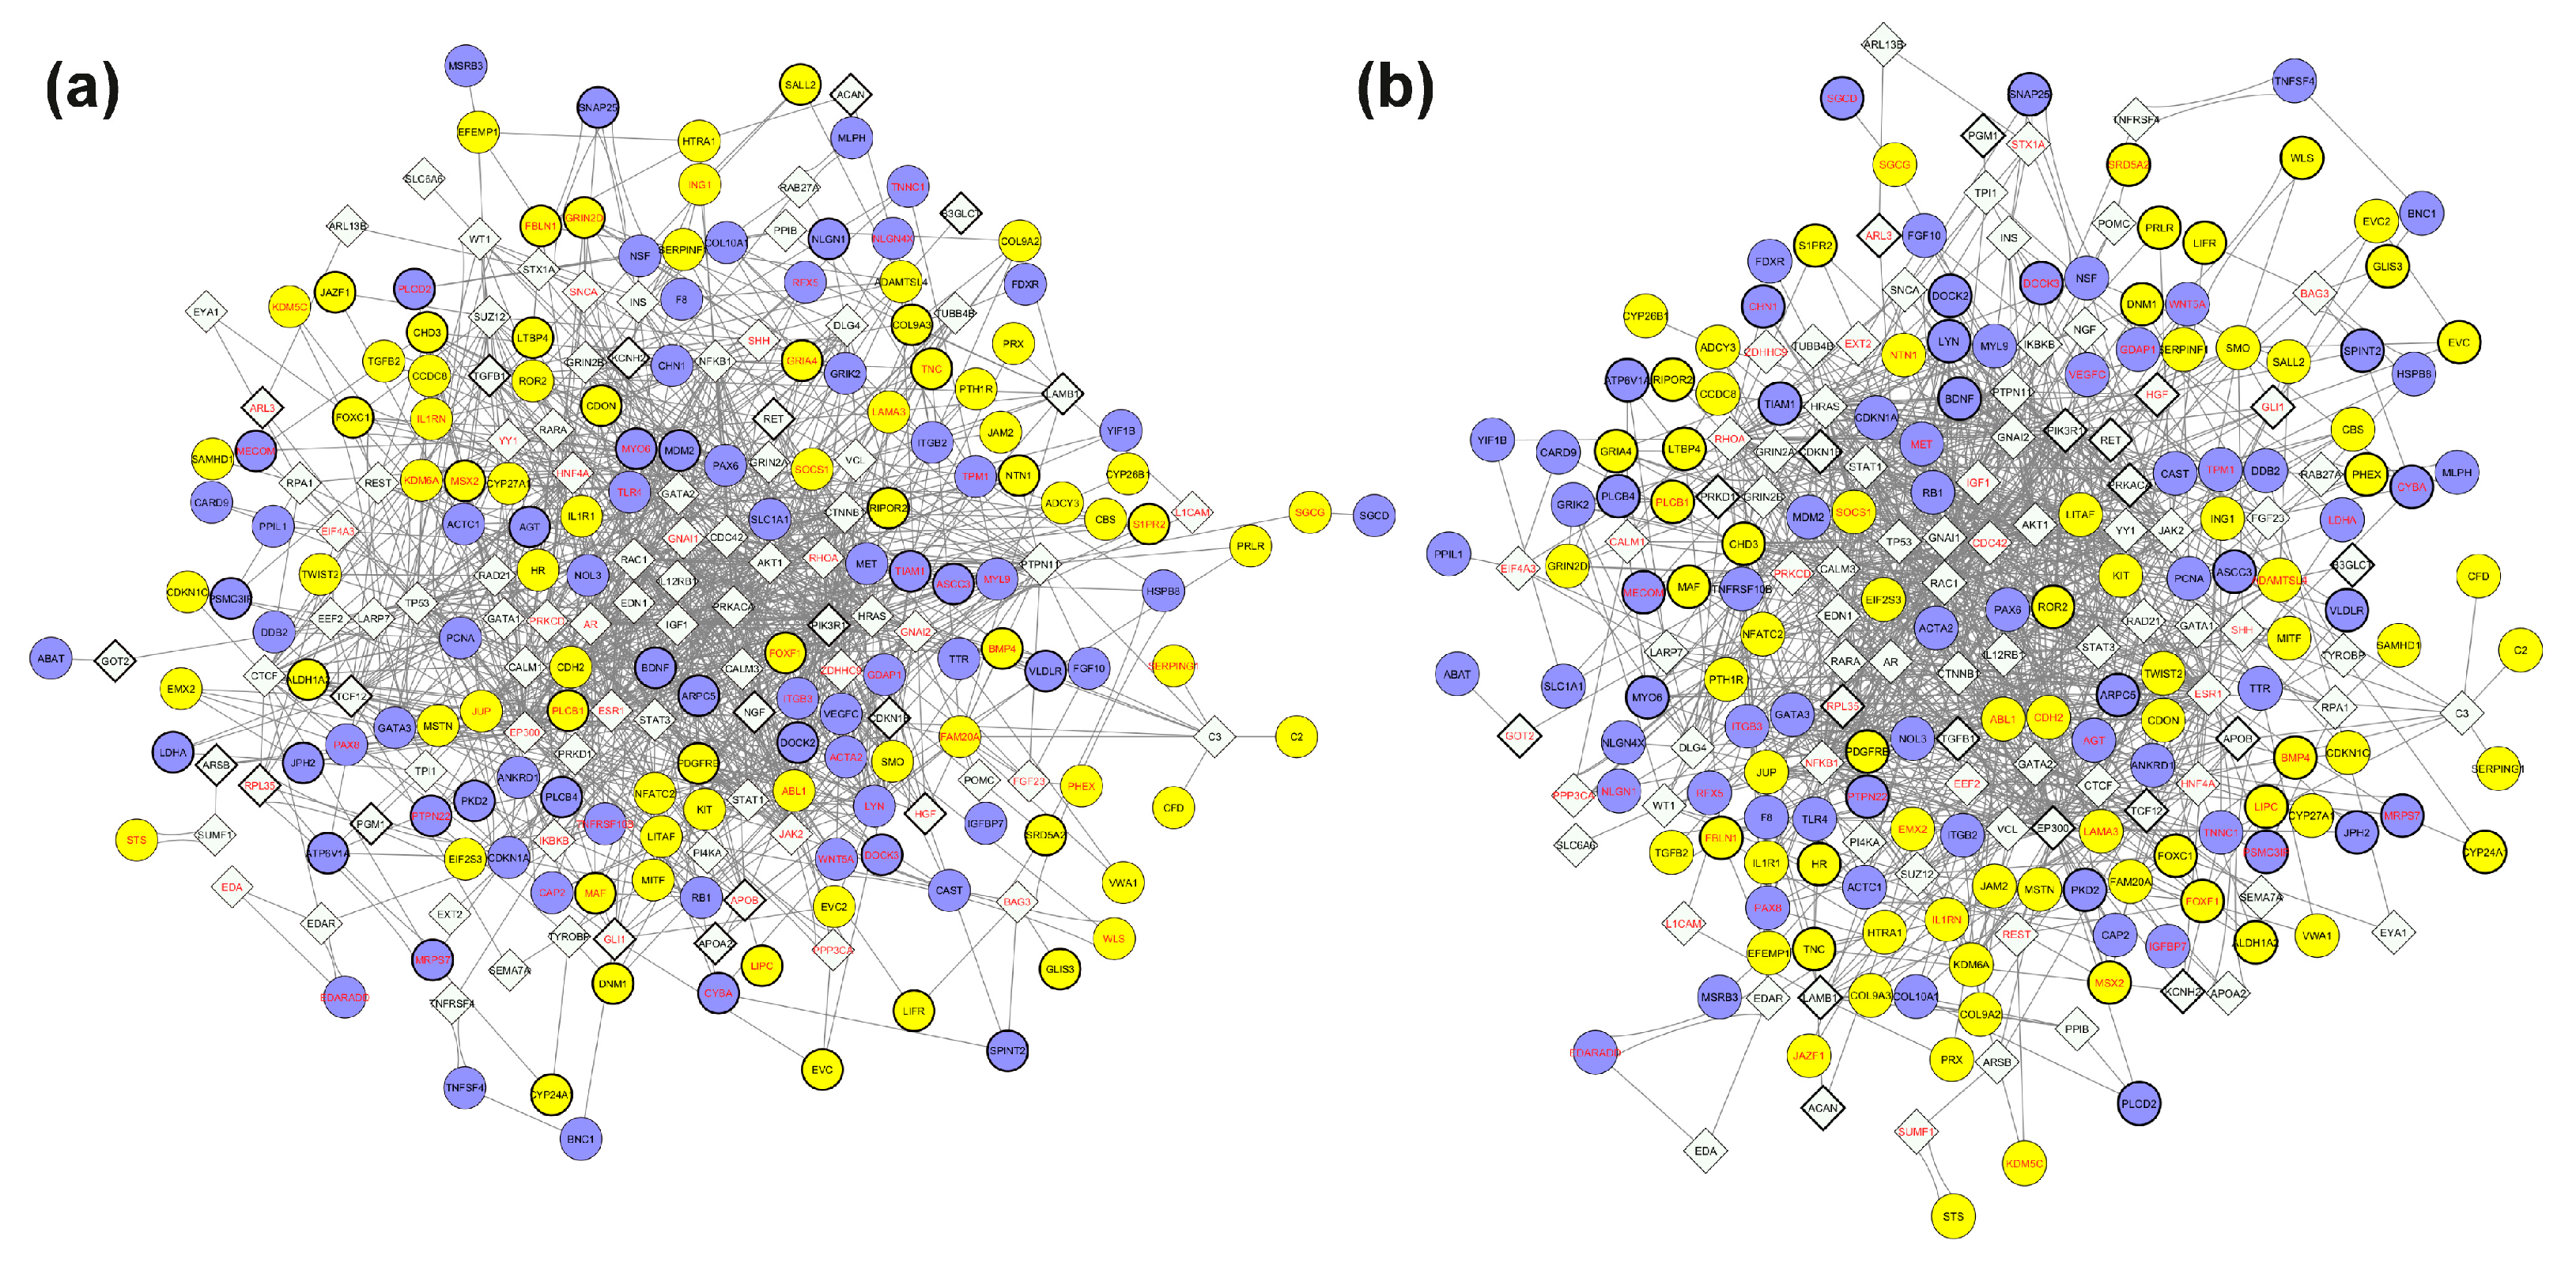
Genomic data from WES were incorporated to enrich the network with subject-specific variant information, providing a more comprehensive molecular view. This integrative strategy resulted in the construction of subject-specific networks that integrate genomic, transcriptomic, and disease-phenotype information (Figure 9a,b).
Figure 9.
Personalized integrated networks combining exome sequencing, gene expression, and disease-phenotype data. (a) integrated Subject 1 network; (b) integrated Subject 2 network. Each network was generated by intersecting the giant component of the disease-phenotype network with the functional interaction network, followed by the integration of subject-specific exome sequencing data. Circles represent differentially expressed genes (DEGs), diamond-shaped nodes represent linker genes. Blue nodes indicate upregulated genes in Subject 1 (and correspondingly downregulated in Subject 2); yellow nodes represent downregulated genes in Subject 1 (and correspondingly upregulated in Subject 2). Gene symbols in red denote homozygous variants; gene symbols in black denote heterozygous variants.
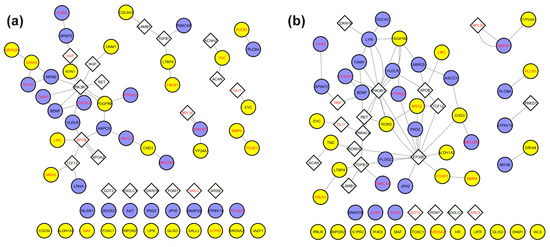
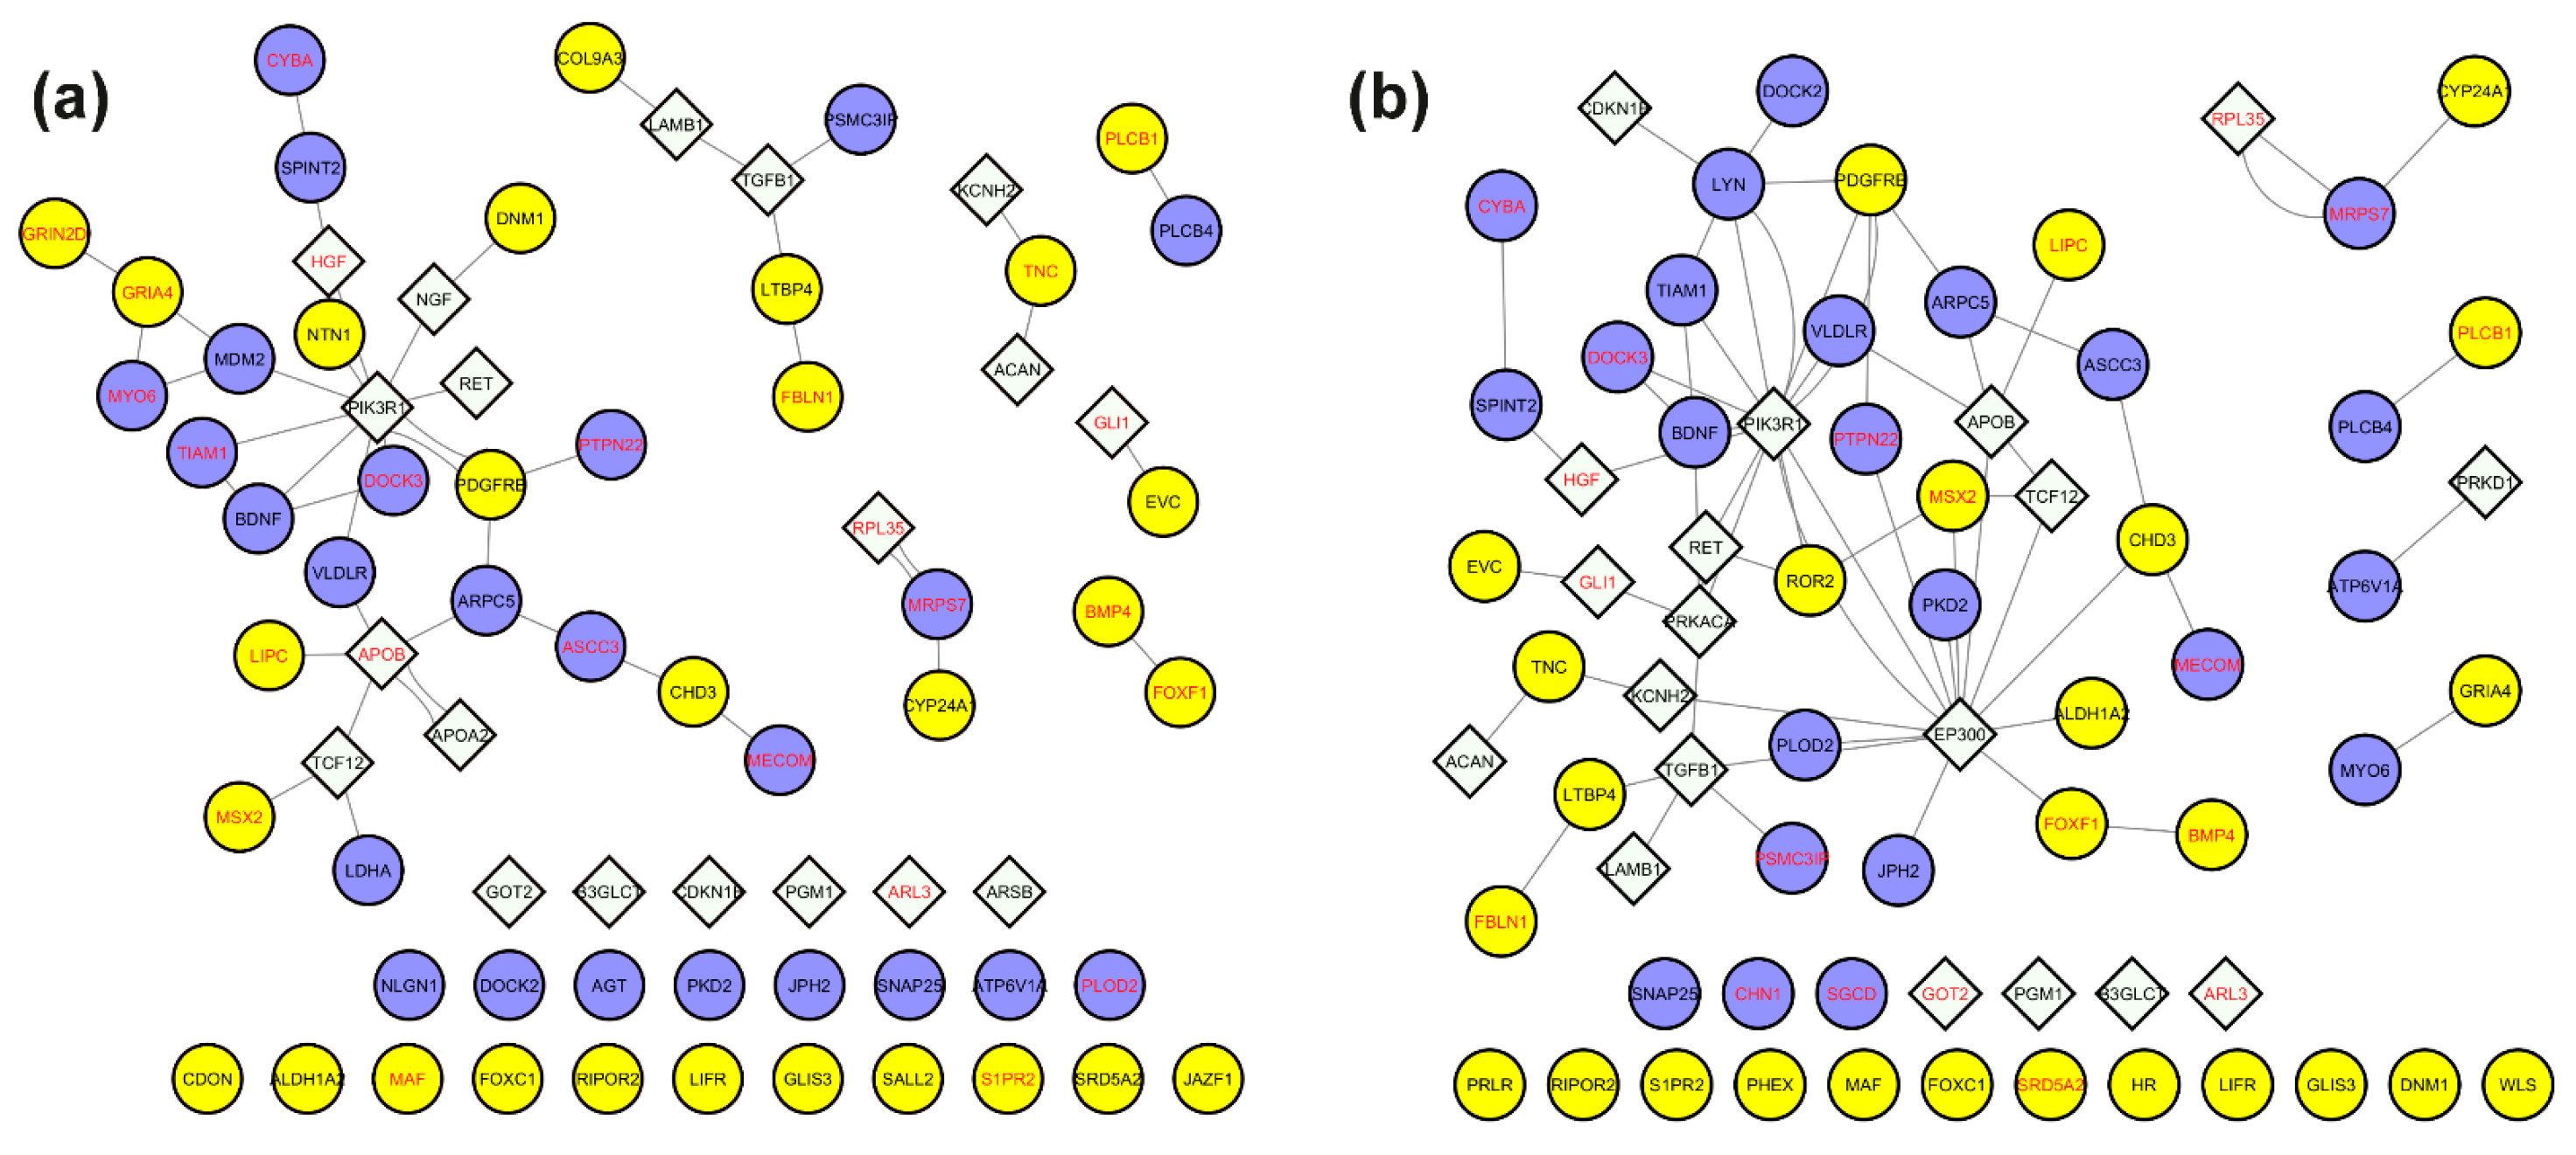
To prioritize functionally relevant nodes, we filtered the subject-specific integrated networks by retaining only genes with variants exhibiting a CADD score ≥ 15 (Table S5). This filtering yielded a refined network of 71 nodes and 46 edges for Subject 1, consisting of a giant component (28 nodes, 33 edges), a secondary cluster (6 nodes, 5 edges), 2 triads, 3 node pairs, and 25 isolated nodes (Figure 10a, Table 4). For Subject 2, the filtered network contained 69 nodes and 64 edges, comprising a giant component with 41 nodes and 58 edges, 1 triad, 3 node pairs, and 19 isolated nodes (Figure 10b, Table 4).
Figure 10.
Subnetworks of genes carrying potentially impactful variants extracted from the personalized integrated networks. Nodes were filtered to retain only genes carrying variants classified as variants of uncertain significance (VUS) or pathogenic (CADD score ≥ 15). Panels (a) and (b) correspond to Subject 1 and Subject 2, respectively. Circular nodes indicate differentially expressed genes (DEGs); diamond-shaped nodes are linker genes. Gene symbols in red indicate homozygous variants; gene symbols in black indicate heterozygous variants. Blue nodes refer to upregulated genes in Subject 1 (and correspondingly downregulated in Subject 2); yellow nodes are downregulated genes in Subject 1 (and correspondingly upregulated in Subject 2).
Table 4.
Potentially impactful variants mapped to genes within the giant components of personalized integrated networks.
For downstream analysis, we focused on the genes in the giant components of each subject-specific subnetwork. The genes and corresponding variants are listed in Table 4.
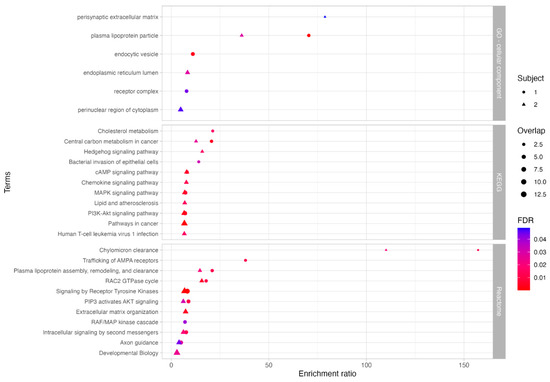
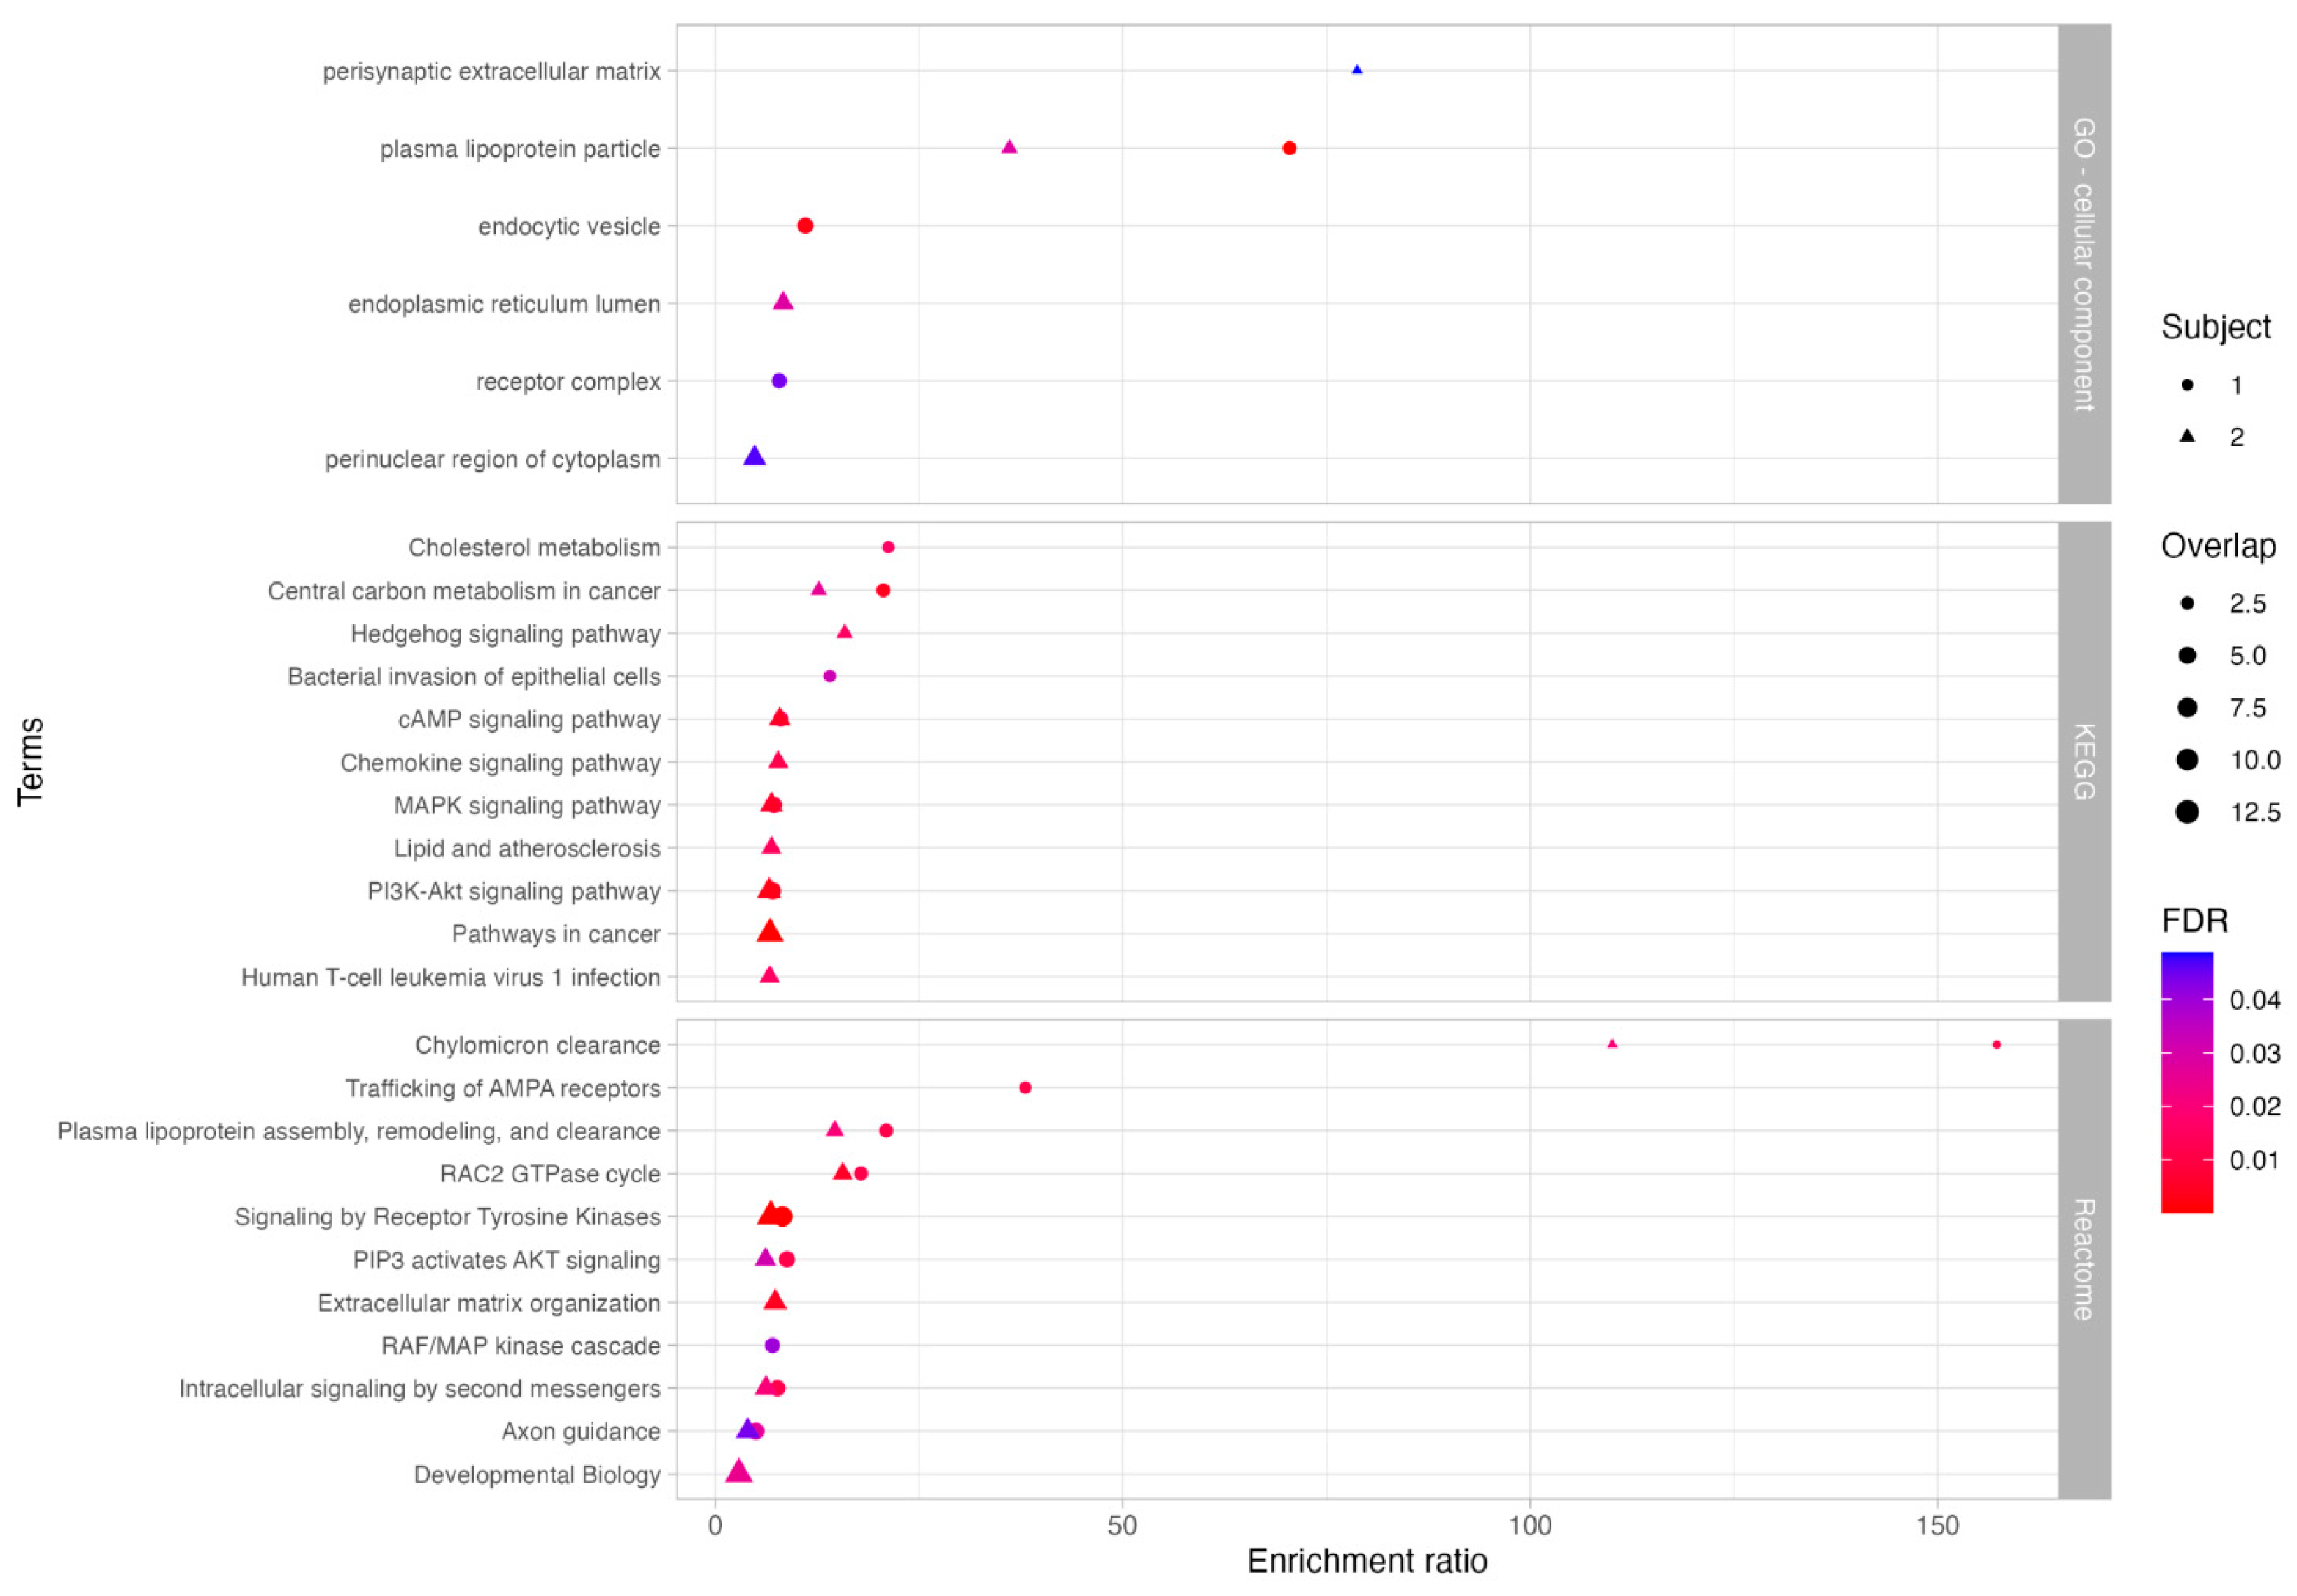
Functional enrichment analysis was then performed using the GO cellular component database to infer the possible cellular localizations of encoded proteins, and the KEGG and Reactome pathway databases to investigate significantly over-represented pathways (Figure 11, Table S6). Results revealed shared enrichment in lipoprotein particle localization and protein-lipid complexes in both subjects.
Figure 11.
Functional enrichment analysis of genes carrying potentially impactful variants in the integrated networks. Genes in the giant components of the subject-specific integrated networks were filtered for variants classified as variants of uncertain significance (VUS) or pathogenic. Significantly enriched terms were identified using GO (Cellular Component), KEGG, and Reactome databases. Circles represent Subject 1; triangles represent Subject 2; symbol size corresponds to gene count, and color indicates statistical significance (FDR ≤ 0.05).
In Subject 1, we identified a heterozygous variant in APOA2 (rs3813628) and, more strikingly, two homozygous variants in APOB: (c.8216C>T) and (c.1853C>T). While c.8216C>T (AF: 0.23; CADD: 27.5) is relatively common, it has been linked to elevated LDL cholesterol levels [40], increased cardiovascular risk [41], and altered statin response [42]. Similarly, c.1853C>T (AF: 0.401; CADD: 26.7) is also common, but has been associated with mild effects on lipid traits. However, this variant was present in Subject 2 in a heterozygous state, suggesting possible dosage effects.
Additionally, Subject 1 carried a rare 3′ untranslated region (3′ UTR) deletion in NTN1 (c.30_33del); AF: 2.563 × 10⁻⁴; CADD score: 16.28), a gene crucial for axonal growth during neurogenesis [43]. Although 3′UTR variants are rarely pathogenic, this deletion could still affect regulatory elements involved in NTN1-mediated signaling, and subtle modulatory effects cannot be excluded. A unique pathway enriched only in Subject 1 was central carbon metabolism in cancer, which includes key metabolic processes involved in energy production and biosynthesis. Within this pathway, we detected a rare missense variant in LDHA (lactate dehydrogenase A; c.439G>T; AF: 1.256 × 10⁻³; CADD score: 23.8) in Subject 1, a critical enzyme in anaerobic glycolysis. This variant has been previously associated with elevated LDH serum levels and altered protein expression [44].
In Subject 2, we identified a 3′ UTR SNP in EP300 (c.*13_*15del; AF: 0.245; CADD score: 15.8), a common variant previously associated with reduced schizophrenia risk [45]. Enrichment analysis also highlighted endoplasmic reticulum lumen localization, along with perturbations in lipid metabolism and cellular signaling, consistent with findings from Subject 1.
Only variants with the strongest biological rationale were highlighted; the others in Table 4 may still be relevant but currently lack interpretable evidence.
4. Discussion
TANGO2 deficiency disorder (TDD), a rare disease with an estimated prevalence of 1:1,000,000 [8,9,46], exhibits marked clinical variability even among individuals with identical pathogenic variants. This suggests that additional genetic factors modulate disease severity. We investigated two siblings with the same compound heterozygous pathogenic TANGO2 variant but opposite phenotypes: Subject 1 was severely affected, while Subject 2 remained asymptomatic. This unique intrafamilial case provided an ideal model to investigate endogenous factors modulating disease severity while minimizing environmental and genetic background confounders, allowing a more precise identification of subject-specific molecular differences.
To systematically investigate the molecular basis of this phenotypic discordance, we employed an integrative Systems biology approach combining WES, transcriptomic profiling, phenotypic annotations, and functional network analysis. This strategy addressed the inherent limitations of single-case comparisons, such as the lack of external controls and other TDD-subjects. To overcome the statistical challenge, we integrated multivariate and univariate transcriptomic analysis, filtered variants by predicted pathogenicity and population frequency, and incorporated linker genes to build personalized networks. Notably, the consistency of the following results with current understanding of TDD suggested that this approach successfully mitigated the limitations inherent to single pair comparisons, extracting biologically meaningful information through convergent evidence across multiple molecular layers.
After excluding high impact variants (CADD ≥ 30) as primary drivers of the phenotypic discrepancy, we constructed a protein–protein interaction (PPI) network based on rare variants (GnomAD frequency ≤ 1%) for each subject. Functional enrichment analysis of the giant component of these two networks revealed distinct pathway perturbations. Subject 1 showed significant enrichment in the thyroid hormone signaling and nervous system development pathways, consistent with his severe clinical presentation. In contrast, Subject 2 showed enrichment in lipid metabolism, ABC (ATP-Binding Cassette) transporters, as well as alanine, aspartate, and glutamate metabolism pathways, corroborating the established role of TANGO2 in lipid homeostasis [15] and supporting previous proteomic studies that reported alterations in amino acid metabolism in TDD patients [17]. These pathways are strongly linked to mitochondrial function and cellular energy homeostasis, as they provide substrates and reducing equivalents essential for ATP production through the TCA cycle and oxidative phosphorylation [47], which are crucial in preventing the metabolic decompensation observed in TDD patients. The observed enrichment of ABC transporters in Subject 2 may further enhance intracellular trafficking of lipids and metabolites, promoting metabolic flexibility under stress conditions [48]. Together, these mechanisms could provide a protective buffer against the energetic failures typically associated with TDD, partially contributing to the absence of clinical symptoms in Subject 2.
Transcriptomic profiling alone did not reveal any significantly altered pathways. Thus, we constructed a functional interaction (FI) network starting from the 1000 DEGs identified through a combined univariate and multivariate approach. To enhance biological interpretability and reveal potential regulatory mechanisms, we incorporated linker genes. Topological analysis of this network revealed a central cluster of seven highly connected genes, with EP300 emerging as a key player (in-degree: 24, and out-degree: 91).
EP300 is an acetyl-CoA–dependent acetyltransferase known to suppress autophagy when cytosolic acetyl-CoA levels are high through the acetylation of key autophagy regulators [49,50]. Although TANGO2 binds long-chain acyl-CoAs rather than acetyl-CoA, acyl-CoA metabolism feeds into the acetyl-CoA pool via β-oxidation, suggesting that metabolic alterations relevant to TDD could plausibly influence EP300 activity and autophagy-linked regulatory pathways. Since TANGO2 is linked to mitochondrial function, and given that acetyl-CoA is a signaling metabolite to control mitophagy [51], it cannot be excluded that mitophagy may also represent a relevant pathway to explore in future studies aimed at understanding phenotypic variability in TANGO2-deficient patients.
EP300, which presented a deletion only for Subject 2 and was involved in the “Developmental Biology” pathway enriched in Subject 2, may play a crucial regulatory role contributing to her asymptomatic status. Notably, EP300 and the other genes in the central hub were not differentially expressed themselves, but emerged as critical linkers that connect and potentially regulate multiple DEGs. The remaining six genes carried variants with low predicted functional impact (CADD < 15) and participated in diverse pathways, but no single pathway was shared by all seven genes; for this reason, they were not discussed individually. This finding highlights the added value of network-based inference in rare disease transcriptomics, where relevant biological signals may be distributed across weakly differentially expressed genes and become evident only when considered within a functional framework.
By integrating DEGs, linker genes implicated in the disease phenotype, and subject-specific genetic information, and then filtering for genes with CADD score ≥ 15, we identified 71 variants in Subject 1 and 69 variants in Subject 2, respectively. Functional enrichment consistently highlighted lipid-related pathways in both subjects, emphasizing the established role of TANGO2 in lipid homeostasis [52]. TANGO2 localizes near mitochondria-ER contact sites and lipid droplets, and its loss disrupts lipid composition and fatty acid metabolism [15]. This prompted us to examine specific genetic variants in lipid pathways that might underlie the phenotypic divergence [53], such as those in APOB and VLDLR genes.
Indeed, the homozygous co-occurrence of both APOB variants (c.8216C>T, p.Pro2739Leu) and (c.1853C>T, p.Ala618Val) in Subject 1 points to a possible additive impact. This configuration represents a cumulative burden of variants, whereby multiple missense changes may a combined influence. Although APOB is considered tolerant to loss-of-function variants (pLI: 0), the biallelic presence of these missense variants may still lead to a subtle impairment of APOB functions. This could contribute to intracellular lipid accumulation and trigger compensatory mechanisms, as evidenced by the upregulation of lipoprotein receptors like VLDLR [54] in Subject 1. Interestingly, while both siblings carried heterozygous VLDLR variants, only Subject 1 showed VLDLR upregulation, suggesting a specific regulatory response to a more pronounced lipid imbalance in the severely affected sibling. In contrast, Subject 2 carried APOB (c.1853C>T) only in heterozygosity, lacking the homozygous burden observed in Subject 1’s APOB gene. This difference in APOB genotype, leading to potentially less impaired APOB function, could mitigate the lipid dysregulation associated with TANGO2 deficiency, thereby contributing to Subject 2’s remarkable resilience. Since TANGO2 depletion itself is known to cause enlarged lipid droplets and dysregulated lipid handling, the presence of these potentially damaging variants in APOB, a key mediator of triglyceride mobilization from lipid droplets for lipoprotein assembly [55], together with differential VLDLR expression, may critically exacerbate the lipid imbalance in Subject 1.
Beyond lipid metabolism, other pathways also offer insights into the siblings’ phenotypic differences. Axon guidance, a pathway significantly enriched in Subject 1, directly correlates with his prominent neurological involvement, including cognitive and motor impairments. Within this pathway, we identified the variant (c.*30_*33del) in NTN1 gene, which encodes a secreted protein crucial for axonal pathfinding during neuronal development. Although this variant does not alter the coding sequence, it may affect the post-transcriptional regulation, a hypothesis supported by the observed downregulation of NTN1 in Subject 1 compared to his sister.
In addition, LDHA was upregulated in Subject 1, potentially increasing glycolytic activity and lactate metabolism. This is particularly relevant, as TANGO2 loss is known to impair mitochondrial function [19], leading to episodes of acute metabolic crisis characterized by lactic acidosis and elevated serum lactate [9]. The LDHA upregulation may represent a compensatory shift toward anaerobic glycolysis in response to mitochondrial dysfunction, further contributing to the severity of TDD in Subject 1.
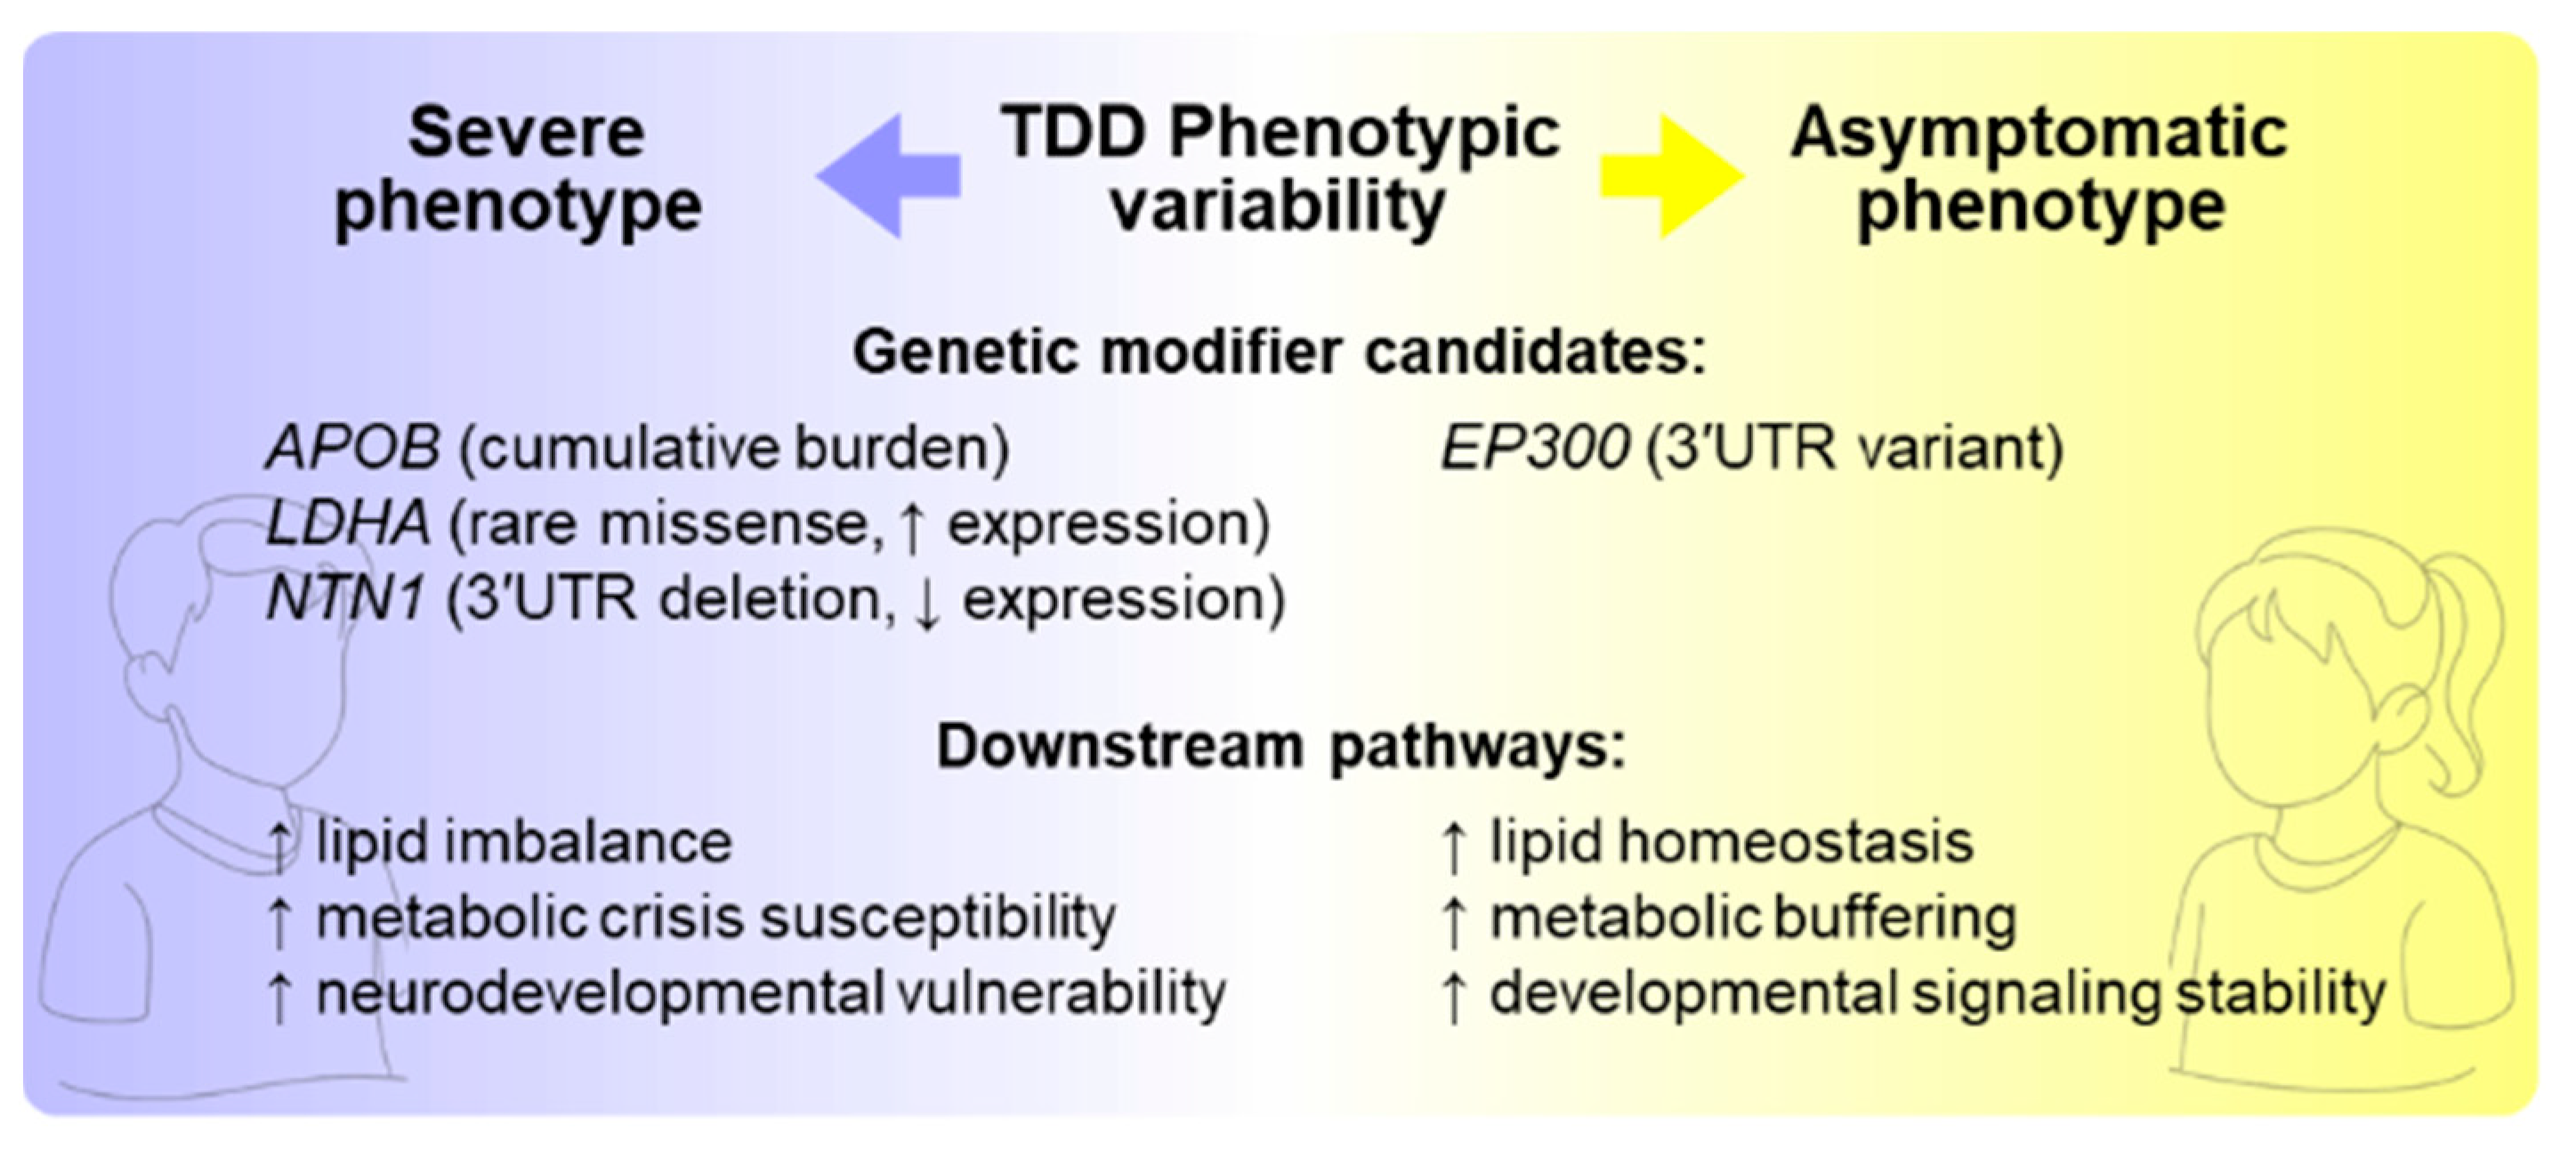
In summary, our analysis uncovered specific molecular mechanisms potentially modulating disease severity, identifying promising targets for further exploration. Our findings highlight that common polymorphisms can act as significant genetic modifiers in monogenic disorders, moving beyond single-gene causality toward a more comprehensive genotype–phenotype framework. Building on these findings, future experimental validations, such as in vitro functional assays of APOB and VLDLR variants, TANGO2 interactome studies, and investigations into the regulatory roles of EP300 in autophagy and mitophagy, could be feasible and poised to deepen understanding of the molecular basis of phenotypic variability (Figure 12). Moreover, in the future, in vivo models incorporating these modifiers could be developed to clarify their impact on disease progression and metabolic resilience. Furthermore, expanding the collection of genomic and phenotypic data from other patients will be crucial to validate the proposed candidates and determine whether their effects are consistent across the TDD population.
Figure 12.
Modifier-driven mechanisms of phenotypic divergence in TANGO2 deficiency. Genetic modifier candidates identified in Subject 1 (APOB, LDHA, NTN1) may exacerbate pathways linked to lipid dysregulation, susceptibility to metabolic crises, and neurodevelopmental vulnerability, consistent with his severe clinical presentation. In contrast, Subject 2 carries a potentially protective 3′UTR variant in EP300 and lacks the homozygous APOB burden, aligning with enhanced metabolic buffering, lipid homeostasis, and stabilized developmental signaling, consistent with an asymptomatic phenotype.
5. Conclusions
Our integrated multi-omics analysis identified potential genetic modifiers that may underlie the striking phenotypic differences between the two siblings.
This study demonstrated that Systems biology approaches can extract meaningful insights from rare disease cohorts, successfully identifying genetic modifiers and mechanisms of disease heterogeneity from only two TDD patients. Importantly, this work shows that actionable biological insights can be obtained even from extremely limited patient cohorts when multiple computational strategies are applied. More broadly, this integrated framework provides a robust template for investigating phenotypic variability in other rare monogenic disorders, opening new avenues for precision medicine in rare disease populations.
Supplementary Materials
The following supporting information can be downloaded at: https://www.mdpi.com/article/10.3390/biom15121742/s1. Table S1: Functional enrichment analysis of genes in the giant component of the PPI network; Table S2: Differentially expressed genes (DEGs) identified by univariate and multivariate analyses; Table S3: Human Phenotype Ontology (HPO) terms linked to TANGO2 deficiency disorder; Table S4. Genes included in the TANGO2 deficiency disorder (TDD) virtual panel; Table S5: Potentially impactful variants mapped to genes within the personalized integrated networks; Table S6: Functional enrichment analysis of genes in subject-specific subnetworks; Figure S1: Histogram of the CADD score distribution for all variants; Figure S2. Giant components of subject-specific PPI networks filtered for rare variants; Figure S3: Exploratory analysis of the matrix counts; Figure S4: Gene-wise dispersion estimation; Figure S5: sPLS-DA analysis; Figure S6: Heatmap of the 1000 DEGs obtained by the intersection of DESeq2 and sPLS-DA/RFE; Figure S7 Disease-phenotype network for TANGO2 deficiency disorder (TDD).
Author Contributions
Conceptualization, M.A., H.B. and M.F.; methodology, M.A., H.B. and V.R.; formal analysis, M.A., H.B. and V.R.; investigation, M.A. and H.B.; resources, S.C., A.B. and G.B.F.; data curation, H.B. and M.A.; writing―original draft preparation, H.B. and M.A.; writing―review and editing, V.R., M.F., S.C. and A.B.; visualization, H.B., M.A. and V.R.; supervision, M.F. and A.B.; project administration, M.F.; funding acquisition, M.F. and A.B. All authors have read and agreed to the published version of the manuscript.
Funding
This research was funded by the Italian Ministry for Education, University and Research, PRIN 2020, to M.F and A.B (20203P8C3X).
Institutional Review Board Statement
The study was conducted in accordance with the Declaration of Helsinki, and the study protocol was approved by the “Città della Salute e della Scienza” University Hospital Ethics Committee (CE n.0053916 dated 27 May 2019).
Informed Consent Statement
Informed consent was obtained from all subjects involved in the study.
Data Availability Statement
The raw data supporting the conclusions of this article are available at https://doi.org/10.5281/zenodo.16887326.
Acknowledgments
We are grateful to patients and their family who collaborated in this study.
Conflicts of Interest
The authors declare that the research was conducted in the absence of any commercial or financial relationships that could be construed as a potential conflict of interest.
Abbreviations
The following abbreviations are used in this manuscript:
| Acyl-CoA | acyl-coenzyme A |
| AF | allele frequency |
| CADD | Combined Annotation Dependent Depletion |
| CPM | counts per million |
| DGE | Differential Gene Expression |
| DEGs | differentially expressed genes |
| ER | endoplasmatic reticulum |
| FDR | false discovery rate |
| FI | functional interaction |
| gnomAD | Genome Aggregation Database |
| GO | Gene Ontology |
| GSEA | gene set enrichment analysis |
| HPO | Human Phenotype Ontology |
| IMEx | International Molecular Exchange |
| LD | lipid droplets |
| ORA | over representation analysis |
| PCA | Principal Components Analysis |
| PPI | protein–protein interaction |
| RFE | Recursive Feature Elimination |
| ROS | reactive oxygen species |
| sPLS-DA | Sparse Partial Least Squares Discriminant Analysis |
| TANGO2 | Transport and Golgi Organization 2 homolog |
| TDD | TANGO2 deficiency disorder |
| VCF | Variant calling format |
| VEP | Variant Effect Predictor |
| VUS | variant of unknown significance |
| WES | whole exome sequencing |
References
- Qiao, L.; Khalilimeybodi, A.; Linden-Santangeli, N.J.; Rangamani, P. The Evolution of Systems Biology and Systems Medicine: From Mechanistic Models to Uncertainty Quantification. Annu. Rev. Biomed. Eng. 2025, 27, 425–447. [Google Scholar] [CrossRef] [Scilit] [PubMed]
- Barabási, A.-L.; Gulbahce, N.; Loscalzo, J. Network Medicine: A Network-Based Approach to Human Disease. Nat. Rev. Genet. 2011, 12, 56–68. [Google Scholar] [CrossRef] [Scilit] [PubMed]
- Hasin, Y.; Seldin, M.; Lusis, A. Multi-Omics Approaches to Disease. Genome Biol. 2017, 18, 83. [Google Scholar] [CrossRef] [Scilit] [PubMed]
- Rahit, K.M.T.H.; Tarailo-Graovac, M. Genetic Modifiers and Rare Mendelian Disease. Genes 2020, 11, 239. [Google Scholar] [CrossRef] [Scilit]
- Airoldi, M.; Remori, V.; Fasano, M. Statistical Methods for Multi-Omics Analysis in Neurodevelopmental Disorders: From High Dimensionality to Mechanistic Insight. Biomolecules 2025, 15, 1401. [Google Scholar] [CrossRef] [Scilit]
- Vidal, M.; Cusick, M.E.; Barabási, A.-L. Interactome Networks and Human Disease. Cell 2011, 144, 986–998. [Google Scholar] [CrossRef] [Scilit]
- Köhler, S.; Doelken, S.C.; Mungall, C.J.; Bauer, S.; Firth, H.V.; Bailleul-Forestier, I.; Black, G.C.M.; Brown, D.L.; Brudno, M.; Campbell, J.; et al. The Human Phenotype Ontology Project: Linking Molecular Biology and Disease through Phenotype Data. Nucleic Acids Res. 2014, 42, D966–D974. [Google Scholar] [CrossRef] [Scilit]
- Kremer, L.S.; Distelmaier, F.; Alhaddad, B.; Hempel, M.; Iuso, A.; Küpper, C.; Mühlhausen, C.; Kovacs-Nagy, R.; Satanovskij, R.; Graf, E.; et al. Bi-Allelic Truncating Mutations in TANGO2 Cause Infancy-Onset Recurrent Metabolic Crises with Encephalocardiomyopathy. Am. J. Hum. Genet. 2016, 98, 358–362. [Google Scholar] [CrossRef] [Scilit]
- Lalani, S.R.; Liu, P.; Rosenfeld, J.A.; Watkin, L.B.; Chiang, T.; Leduc, M.S.; Zhu, W.; Ding, Y.; Pan, S.; Vetrini, F.; et al. Recurrent Muscle Weakness with Rhabdomyolysis, Metabolic Crises, and Cardiac Arrhythmia Due to Bi-Allelic TANGO2 Mutations. Am. J. Hum. Genet. 2016, 98, 347–357. [Google Scholar] [CrossRef] [Scilit]
- Miyake, C.Y.; Lay, E.J.; Beach, C.M.; Ceresnak, S.R.; Delauz, C.M.; Howard, T.S.; Janson, C.M.; Jardine, K.; Kannankeril, P.J.; Kava, M.; et al. Cardiac Crises: Cardiac Arrhythmias and Cardiomyopathy during TANGO2 Deficiency Related Metabolic Crises. Heart Rhythm 2022, 19, 1673–1681. [Google Scholar] [CrossRef] [Scilit]
- Bard, F.; Casano, L.; Mallabiabarrena, A.; Wallace, E.; Saito, K.; Kitayama, H.; Guizzunti, G.; Hu, Y.; Wendler, F.; DasGupta, R.; et al. Functional Genomics Reveals Genes Involved in Protein Secretion and Golgi Organization. Nature 2006, 439, 604–607. [Google Scholar] [CrossRef] [Scilit] [PubMed]
- Saneto, R.P.; Perez, F.A. Mitochondria-Associated Membrane Scaffolding with Endoplasmic Reticulum: A Dynamic Pathway of Developmental Disease. Front. Mol. Biosci. 2022, 9, 908721. [Google Scholar] [CrossRef] [Scilit] [PubMed]
- Milev, M.P.; Saint-Dic, D.; Zardoui, K.; Klopstock, T.; Law, C.; Distelmaier, F.; Sacher, M. The Phenotype Associated with Variants in May Be Explained by a Dual Role of the Protein in ER-to-Golgi Transport and at the Mitochondria. J. Inherit. Metab. Dis. 2021, 44, 426–437. [Google Scholar] [CrossRef] [Scilit] [PubMed]
- Heiman, P.; Mohsen, A.-W.; Karunanidhi, A.; St Croix, C.; Watkins, S.; Koppes, E.; Haas, R.; Vockley, J.; Ghaloul-Gonzalez, L. Mitochondrial Dysfunction Associated with TANGO2 Deficiency. Sci. Rep. 2022, 12, 3045. [Google Scholar] [CrossRef] [Scilit]
- Lujan, A.L.; Foresti, O.; Sugden, C.; Brouwers, N.; Farre, A.M.; Vignoli, A.; Azamian, M.; Turner, A.; Wojnacki, J.; Malhotra, V. Defects in Lipid Homeostasis Reflect the Function of TANGO2 in Phospholipid and Neutral Lipid Metabolism. eLife 2023, 12, e85345. [Google Scholar] [CrossRef] [Scilit]
- Lujan, A.L.; Foresti, O.; Wojnacki, J.; Bigliani, G.; Brouwers, N.; Pena, M.J.; Androulaki, S.; Hashidate-Yoshida, T.; Kalyukina, M.; Novoselov, S.S.; et al. TANGO2 Is an Acyl-CoA Binding Protein. J. Cell Biol. 2025, 224, e202410001. [Google Scholar] [CrossRef] [Scilit]
- Mingirulli, N.; Pyle, A.; Hathazi, D.; Alston, C.L.; Kohlschmidt, N.; O’Grady, G.; Waddell, L.; Evesson, F.; Cooper, S.B.T.; Turner, C.; et al. Clinical Presentation and Proteomic Signature of Patients with TANGO2 Mutations. J. Inherit. Metab. Dis. 2020, 43, 297–308. [Google Scholar] [CrossRef] [Scilit]
- Jennions, E.; Hedberg-Oldfors, C.; Berglund, A.-K.; Kollberg, G.; Törnhage, C.-J.; Eklund, E.A.; Oldfors, A.; Verloo, P.; Vanlander, A.V.; De Meirleir, L.; et al. TANGO2 Deficiency as a Cause of Neurodevelopmental Delay with Indirect Effects on Mitochondrial Energy Metabolism. J. Inherit. Metab. Dis. 2019, 42, 898–908. [Google Scholar] [CrossRef] [Scilit]
- Mehranfar, M.; Asadi, P.; Shokohi, R.; Milev, M.P.; Gamberi, C.; Sacher, M. Lipidomic Analysis of Human TANGO2-Deficient Cells Suggests a Lipid Imbalance as a Cause of TANGO2 Deficiency Disease. Biochem. Biophys. Res. Commun. 2024, 717, 150047. [Google Scholar] [CrossRef] [Scilit]
- Miyake, C.Y.; Ehsan, S.A.; Zhang, L.; Mackenzie, S.J.; Azamian, M.S.; Scott, D.A.; Hernandez-Garcia, A.; Lalani, S.R. Early Initiation of B-Vitamin Supplementation May Reduce Symptoms and Explain Intrafamilial Variability: Insights from Two Sibling Pairs from the TANGO2 Natural History Study. Am. J. Med. Genet. A 2023, 191, 2433–2439. [Google Scholar] [CrossRef] [Scilit]
- Schubach, M.; Maass, T.; Nazaretyan, L.; Röner, S.; Kircher, M. CADD v1.7: Using Protein Language Models, Regulatory CNNs and Other Nucleotide-Level Scores to Improve Genome-Wide Variant Predictions. Nucleic Acids Res. 2024, 52, D1143–D1154. [Google Scholar] [CrossRef] [Scilit] [PubMed]
- Remori, V.; Bondi, H.; Airoldi, M.; Pavinato, L.; Borini, G.; Carli, D.; Brusco, A.; Fasano, M. A Systems Biology Approach for Prioritizing ASD Genes in Large or Noisy Datasets. Int. J. Mol. Sci. 2025, 26, 2078. [Google Scholar] [CrossRef] [Scilit]
- Dobin, A.; Davis, C.A.; Schlesinger, F.; Drenkow, J.; Zaleski, C.; Jha, S.; Batut, P.; Chaisson, M.; Gingeras, T.R. STAR: Ultrafast Universal RNA-Seq Aligner. Bioinformatics 2013, 29, 15–21. [Google Scholar] [CrossRef] [Scilit]
- Liao, Y.; Smyth, G.K.; Shi, W. The R Package Rsubread Is Easier, Faster, Cheaper and Better for Alignment and Quantification of RNA Sequencing Reads. Nucleic Acids Res. 2019, 47, e47. [Google Scholar] [CrossRef] [Scilit]
- Chen, Y.; Lun, A.T.L.; Smyth, G.K. From Reads to Genes to Pathways: Differential Expression Analysis of RNA-Seq Experiments Using Rsubread and the edgeR Quasi-Likelihood Pipeline. F1000Research 2016, 5, 1438. [Google Scholar]
- Love, M.I.; Huber, W.; Anders, S. Moderated Estimation of Fold Change and Dispersion for RNA-Seq Data with DESeq2. Genome Biol. 2014, 15, 550. [Google Scholar] [CrossRef] [Scilit]
- Remori, V.; Airoldi, M.; Alberio, T.; Fasano, M.; Azzi, L. Prediction of Oral Cancer Biomarkers by Salivary Proteomics Data. Int. J. Mol. Sci. 2024, 25, 11120. [Google Scholar] [CrossRef] [Scilit]
- Wu, G.; Feng, X.; Stein, L. A Human Functional Protein Interaction Network and Its Application to Cancer Data Analysis. Genome Biol. 2010, 11, R53. [Google Scholar] [CrossRef] [Scilit]
- Elizarraras, J.M.; Liao, Y.; Shi, Z.; Zhu, Q.; Pico, A.R.; Zhang, B. WebGestalt 2024: Faster Gene Set Analysis and New Support for Metabolomics and Multi-Omics. Nucleic Acids Res. 2024, 52, W415–W421. [Google Scholar] [CrossRef] [Scilit]
- Kanehisa, M.; Goto, S. KEGG: Kyoto Encyclopedia of Genes and Genomes. Nucleic Acids Res. 2000, 28, 27–30. [Google Scholar] [CrossRef] [Scilit]
- Milacic, M.; Beavers, D.; Conley, P.; Gong, C.; Gillespie, M.; Griss, J.; Haw, R.; Jassal, B.; Matthews, L.; May, B.; et al. The Reactome Pathway Knowledgebase 2024. Nucleic Acids Res. 2024, 52, D672–D678. [Google Scholar] [CrossRef] [Scilit] [PubMed]
- The Gene Ontology Consortium; Aleksander, S.A.; Balhoff, J.; Carbon, S.; Cherry, J.M.; Drabkin, H.J.; Ebert, D.; Feuermann, M.; Gaudet, P.; Harris, N.L.; et al. The Gene Ontology Knowledgebase in 2023. Genetics 2023, 224, iyad031. [Google Scholar] [CrossRef] [Scilit] [PubMed]
- Wegler, M.; Jia, X.; Alders, M.; Bouman, A.; Chen, J.; Duan, X.; Lauzon, J.L.; Mathijssen, I.B.; Sticht, H.; Syrbe, S.; et al. De Novo Variants in the PABP Domain of PABPC1 Lead to Developmental Delay. Genet. Med. 2022, 24, 1761–1773. [Google Scholar] [CrossRef] [Scilit] [PubMed]
- Köhler, S.; Gargano, M.; Matentzoglu, N.; Carmody, L.C.; Lewis-Smith, D.; Vasilevsky, N.A.; Danis, D.; Balagura, G.; Baynam, G.; Brower, A.M.; et al. The Human Phenotype Ontology in 2021. Nucleic Acids Res. 2021, 49, D1207–D1217. [Google Scholar] [CrossRef] [Scilit]
- Nielsen, M.S.; Madsen, P.; Christensen, E.I.; Nykjaer, A.; Gliemann, J.; Kasper, D.; Pohlmann, R.; Petersen, C.M. The Sortilin Cytoplasmic Tail Conveys Golgi-Endosome Transport and Binds the VHS Domain of the GGA2 Sorting Protein. EMBO J. 2001, 20, 2180–2190. [Google Scholar] [CrossRef] [Scilit]
- Huang, G.; Buckler-Pena, D.; Nauta, T.; Singh, M.; Asmar, A.; Shi, J.; Kim, J.Y.; Kandror, K.V. Insulin Responsiveness of Glucose Transporter 4 in 3T3-L1 Cells Depends on the Presence of Sortilin. Mol. Biol. Cell 2013, 24, 3115–3122. [Google Scholar] [CrossRef] [Scilit]
- Hibino, H.; Inanobe, A.; Furutani, K.; Murakami, S.; Findlay, I.; Kurachi, Y. Inwardly Rectifying Potassium Channels: Their Structure, Function, and Physiological Roles. Physiol. Rev. 2010, 90, 291–366. [Google Scholar] [CrossRef] [Scilit]
- Zalc, A.; Revital R.; Auradé, F.; Cadot, B.; Relaix, F. Pax3 and Pax7 Play Essential Safeguard Functions Against Environmental Stress-Induced Birth Defects. Developmental cell 2015, 33, 56–66. [Google Scholar] [CrossRef] [Scilit] [PubMed]
- Fiore, P.P.D.; Zastrow, M. von Endocytosis, Signaling, and Beyond. Cold Spring Harb. Perspect. Biol. 2014, 6, a016865. [Google Scholar] [CrossRef] [Scilit]
- Gu, Q.-L.; Han, Y.; Lan, Y.-M.; Li, Y.; Kou, W.; Zhou, Y.-S.; Hai, X.-J.; Yan, B.; Ci, C.-H. Association between Polymorphisms in the APOB Gene and Hyperlipidemia in the Chinese Yugur Population. Braz. J. Med. Biol. Res. 2017, 50, e6613. [Google Scholar] [CrossRef] [Scilit] [PubMed]
- Liu, C.; Yang, J.; Han, W.; Zhang, Q.; Shang, X.; Li, X.; Lu, F.; Liu, X. Polymorphisms in ApoB Gene Are Associated with Risk of Myocardial Infarction and Serum ApoB Levels in a Chinese Population. Int. J. Clin. Exp. Med. 2015, 8, 16571–16577. [Google Scholar] [PubMed]
- Abdulfattah, S.Y.; Al-Awadi, S.J. ApoB Gene Polymorphism (Rs676210) and Its Pharmacogenetics Impact on Atorvastatin Response among Iraqi Population with Coronary Artery Disease. J. Genet. Eng. Biotechnol. 2021, 19, 95. [Google Scholar] [CrossRef] [Scilit] [PubMed]
- Serafini, T.; Colamarino, S.A.; Leonardo, E.D.; Wang, H.; Beddington, R.; Skarnes, W.C.; Tessier-Lavigne, M. Netrin-1 Is Required for Commissural Axon Guidance in the Developing Vertebrate Nervous System. Cell 1996, 87, 1001–1014. [Google Scholar] [CrossRef] [Scilit] [PubMed]
- Kristjansson, R.P.; Oddsson, A.; Helgason, H.; Sveinbjornsson, G.; Arnadottir, G.A.; Jensson, B.O.; Jonasdottir, A.; Jonasdottir, A.; Bragi Walters, G.; Sulem, G.; et al. Common and Rare Variants Associating with Serum Levels of Creatine Kinase and Lactate Dehydrogenase. Nat. Commun. 2016, 7, 10572. [Google Scholar] [CrossRef] [Scilit]
- Aygün, N.; Vuong, C.; Krupa, O.; Mory, J.; Le, B.D.; Valone, J.M.; Liang, D.; Shafie, B.; Zhang, P.; Salinda, A.; et al. Genetics of Cell-Type-Specific Post-Transcriptional Gene Regulation during Human Neurogenesis. Am. J. Hum. Genet. 2024, 111, 1877–1898. [Google Scholar] [CrossRef] [Scilit]
- Miyake, C.Y.; Lay, E.J.; Soler-Alfonso, C.; Glinton, K.E.; Houck, K.; Tosur, M.; Moran, N.E.; Stephens, S.B.; Scaglia, F.; Howard, T.S.; et al. Natural History of TANGO2 Deficiency Disorder: Baseline Assessment of 73 Patients. Genet. Med. 2023, 25, 100352. [Google Scholar] [CrossRef] [Scilit]
- Li, Q.; Hoppe, T. Role of Amino Acid Metabolism in Mitochondrial Homeostasis. Front. Cell Dev. Biol. 2023, 11, 1127618. [Google Scholar] [CrossRef] [Scilit]
- Plummer-Medeiros, A.M.; Culbertson, A.T.; Morales-Perez, C.L.; Liao, M. Activity and Structural Dynamics of Human ABCA1 in a Lipid Membrane. J. Mol. Biol. 2023, 435, 168038. [Google Scholar] [CrossRef] [Scilit]
- Xu, Y.; Wan, W. Emerging roles of p300/CBP in autophagy and autophagy-related human disorders. J. Cell Sci. 2023, 136, jcs261028. [Google Scholar] [CrossRef] [Scilit] [PubMed]
- Son, S.M.; Park, S.J.; Fernandez-Estevez, M.; Rubinsztein, D.C. Autophagy Regulation by Acetylation-Implications for Neurodegenerative Diseases. Exp. Mol. Med. 2021, 53, 30–41. [Google Scholar] [CrossRef] [Scilit]
- Zhang, Y.; Shen, X.; Shen, Y.; Wang, C.; Yu, C.; Han, J.; Cao, S.; Qian, L.; Ma, M.; Huang, S.; et al. Cytosolic Acetyl-Coenzyme A Is a Signalling Metabolite to Control Mitophagy. Nature 2025. [Google Scholar] [CrossRef] [Scilit]
- Sacher, M.; DeLoriea, J.; Mehranfar, M.; Casey, C.; Naaz, A.; Gamberi, C. TANGO2 Deficiency Disease Is Predominantly Caused by a Lipid Imbalance. Dis. Models Mech. 2024, 17, dmm050662. [Google Scholar] [CrossRef] [Scilit]
- Carrasquilla, G.D.; Christiansen, M.R.; Kilpeläinen, T.O. The Genetic Basis of Hypertriglyceridemia. Curr. Atheroscler. Rep. 2021, 23, 39. [Google Scholar] [CrossRef] [Scilit]
- Gao, Y.; Shen, W.; Lu, B.; Zhang, Q.; Hu, Y.; Chen, Y. Upregulation of Hepatic VLDLR via PPARα Is Required for the Triglyceride-Lowering Effect of Fenofibrate. J. Lipid Res. 2014, 55, 1622–1633. [Google Scholar] [CrossRef] [Scilit]
- Ordóñez-Llanos, J.; Escolà-Gil, J.C. Apolipoproteins in Health and Disease. Int. J. Mol. Sci. 2024, 25, 7048. [Google Scholar] [CrossRef] [Scilit]

Disclaimer/Publisher’s Note: The statements, opinions and data contained in all publications are solely those of the individual author(s) and contributor(s) and not of MDPI and/or the editor(s). MDPI and/or the editor(s) disclaim responsibility for any injury to people or property resulting from any ideas, methods, instructions or products referred to in the content. |
© 2025 by the authors. Licensee MDPI, Basel, Switzerland. This article is an open access article distributed under the terms and conditions of the Creative Commons Attribution (CC BY) license (https://creativecommons.org/licenses/by/4.0/).