


Abstract
Background/Objectives: Potassium humate has potential as a natural feed additive, but its dose-dependent effects remain unclear. This study investigated the effects of potassium humate on growth performance, blood parameters, intestinal morphology, fecal volatile fatty acids and selected gene expressions in Wistar albino rats. Methods: Forty-eight male rats (182.36 ± 24.11 g) were randomly allocated into three treatment groups and one control group. Liquid potassium humate was provided in drinking water at 0.25%, 0.50%, or 1% (v/v) for 60 days. Weekly body weight and daily feed intake were recorded. At the end of the study, rats were euthanized, and blood and tissue samples were collected. Results: Mean body weight and feed intake were lower in the 0.50% and 1% groups (p < 0.001). Body weight gain did not differ among groups. None of the supplemented groups differed from the control in water intake. Serum IgG was lower in the 1% group (p < 0.001), whereas cortisol was higher in the 0.50% group (p = 0.01). Serum glucose, AST, ALT, total protein, total cholesterol, HDL, and LDL levels did not differ between control and treatment groups. Hematological parameters were unaffected by treatment, except plateletcrit which, was lower in the 1% group (p = 0.03). The fecal volatile fatty acid values remained unaffected. Villus height was lower at 0.50% (p = 0.004) and PCNA at 1% (p < 0.001). Intestinal TJP1 and hepatic TNF-α mRNA expression were higher in the treatment groups. Conclusions: Potassium humate did not improve body weight gain, while higher concentrations altered selected immune and intestinal indicators.
1. Introduction
Over the past decades, growing regulatory pressure on the use of antibiotic growth promoters in livestock production has accelerated the search for safe and efficient substitutes. Consequently, a wide variety of feed additives have been tested, and many of them have shown antimicrobial, antioxidant, anti-inflammatory, immunostimulatory and growth-promoting properties [1]. Owing to their particular chemical structure, humic substances have emerged as a promising candidate among these additives [2].
Rather than being discrete chemically defined compounds, humic substances are heterogeneous and structurally complex mixtures of aromatic and aliphatic constituents. They originate from the progressive breakdown and transformation of plant-derived polymers such as lignin, cellulose and cutin, and they form a major fraction of soil organic matter [3]. On the basis of their solubility, these substances are traditionally divided into three fractions: humic acids, fulvic acids and humin. Their structure carries carboxyl, phenolic hydroxyl, carbonyl and quinone moieties, which largely determine their physicochemical and biological behavior [4].
Because of these chemical features, humic substances display a broad spectrum of biological activities, including antiviral [5], antimicrobial [6], antioxidant [7], antitumor [8], antiulcerogenic [9], immunomodulatory [10], glucose-regulating [11] and cardioprotective [12] effects. These actions are thought to arise from several mechanisms, most notably their polyphenol and quinone content and their capacity to scavenge free radicals [13]. In dairy cattle, for instance, supplementing humic acid to cows during the dry period enhanced milk production, immune status and energy balance after calving [14].
Previous studies in rats have investigated the effects of humic preparations on growth performance and ileal morphology [15], as well as the influence of dietary humic and fulvic acids on mineral homeostasis [16]. However, these investigations provide limited insight into the combined systemic and intestinal responses to graded concentrations of liquid potassium humate administered through drinking water. For liquid preparations, this route of supplementation offers a practical means without reformulating the basal diet.
Drinking-water supplementation exposes the gastrointestinal tract to the preparation, making intestinal responses relevant to the interpretation of systemic findings. It remains unclear whether concentration-related differences in growth coincide with changes in epithelial organization and renewal [9,17], as well as how these responses relate to immune and endocrine status. In addition, fecal fermentation-associated metabolites provide additional endpoints for investigating these relationships [18]. We hypothesized that the systemic and intestinal responses to potassium humate would vary depending on its concentration in drinking water. Accordingly, the present study evaluated these responses in Wistar rats by integrating growth performance with circulating physiological indicators, intestinal morphology, molecular markers and fecal metabolites. This controlled model may provide a basis for subsequent investigations in farm animals.
2. Materials and Methods
2.1. Ethical Approval
The experimental protocol was approved by the Local Ethics Committee for Animal Experiments of Afyon Kocatepe University (approval number: 49533702; date: 25 July 2018).
2.2. Animals, Experimental Design and Supplement
Forty-eight weaned male Wistar albino rats weighing 182.36 ± 24.11 g were allocated to one control and three treatment groups. Each group comprised 12 rats housed in three replicate cages, with four rats per cage. The number of animals was determined with reference to previous rat studies evaluating humic preparations [19,20]. Rats in the control group drank plain water without any additive, whereas those in the treatment groups received drinking water containing liquid potassium humate at 0.25%, 0.5% or 1% (v/v). Previous studies have evaluated liquid humic preparations in drinking water at 3.5 mL/L in rats [15] and at 0.5% 1.0%, and 1.5% by volume in broiler chickens [21]. Taking these reported supplementation levels into account, the present study used concentrations of 0.25%, 0.50%, and 1% to compare responses across a series with twofold increments. The potassium humate source was TKİ Hümas, a commercial liquid product manufactured from leonardite by Turkish Coal Enterprises (Ankara, Türkiye). According to the manufacturer’s product label, the product contained 5% total organic matter, 12% combined humic and fulvic acids, and 2% water-soluble potassium oxide (K2O), with a pH of 11–13. Drinking water was freshly prepared each day, and a measured volume was supplied to each cage. For the treatment groups, the volume of liquid potassium humate added was calculated according to the supplementation concentration. The volume remaining in each drinking bottle was measured the following day before replacement with freshly prepared water. Daily water intake per cage was calculated as the difference between the volumes supplied and remaining. The mean daily water intake per rat was estimated by dividing the cage water intake by the number of rats housed in that cage. The mean daily product intake per rat over the 60-day experimental period was estimated by multiplying the mean daily water intake by the supplementation concentration (%) and dividing by 100. The estimates were expressed as mL of commercial product per rat per day.
2.3. Housing, Feeding and Performance Measurements
Throughout the 60-day experimental period, the rats had free access to feed and water. Body weights were recorded once a week, and the average body weight was computed for each cage. Feed was weighed before being offered every day, and the remaining feed was collected and weighed on the next day. The daily feed intake of each cage was obtained by subtracting the refused amount from the amount offered, and this value was divided by the number of rats in the cage to obtain the mean intake per animal. The room was kept at 24–25 °C under a photoperiod of 12 h light and 12 h darkness. The nutrient profile of the pelleted basal diet is given in Table 1. Body weights were recorded weekly, and the mean body weight was calculated for each cage at each weighing. The mean body weight over the study period was obtained by averaging the weekly cage means.
Table 1.
Nutrient profile of the pelleted basal diet.
2.4. Fecal Volatile Fatty Acid Analysis
Fresh fecal samples were obtained from each cage during the last week of the trial for volatile fatty acid (VFA) determination and kept at −20 °C until analysis. Two replicate measurements were performed per cage. The cage was the experimental unit, with three cages per treatment group. Fecal volatile fatty acid concentrations were expressed as µmol per gram of wet feces (n = 6 per group). Prior to analysis, the samples were thawed at 4 °C, diluted 1:5 with double-distilled water, homogenized for 30 s (IKA T-25 Ultra Turrax, Staufen, Germany) and centrifuged (4000× g, 15 min, 4 °C). A 1 mL aliquot of the resulting supernatant was transferred into an Eppendorf tube, combined with 0.2 mL of cold 25% metaphosphoric acid, held on ice for 30 min and centrifuged once more (11,000× g, 15 min, 4 °C). The clear supernatant was analyzed on a Shimadzu GC-2010 gas chromatograph (Shimadzu Co., Kyoto, Japan) fitted with a Stabilwax-DA capillary column (30 m × 0.25 mm × 0.25 µm; Restek, Bellefonte, PA, USA) and a flame ionization detector (FID). Both the injector and the detector were operated at 240 °C. The oven was initially held at 90 °C, heated at 6 °C/min to 160 °C, then at 10 °C/min to 190 °C, and kept at this final temperature for 2 min. Helium served as the carrier gas; here, 1 µL of the sample was injected, and every sample was run in duplicate. Individual VFAs were identified by comparing their retention times with those of a reference standard mixture (Supelco Volatile Free Acid Mix, 46975-U, Sigma-Aldrich, St. Louis, MO, USA). Quantification was performed using calibration curves relating chromatographic peak area to standard concentration.
2.5. Blood Sampling and Analyses
At the end of the trial, the rats were anesthetized with a xylazine–ketamine combination, and blood was drawn by cardiac puncture into tubes with and without anticoagulant. Tubes without anticoagulant were centrifuged at 5000 rpm for 10 min, and the separated serum was aliquoted into 1.5 mL microcentrifuge tubes and frozen at −20 °C pending analysis. Serum glucose, total cholesterol, LDL, HDL and total protein levels, together with AST and ALT activities, were measured by colorimetric and enzymatic methods. Commercial enzyme-linked immunosorbent assay (ELISA) kits were used to quantify the serum IgG (BT Lab (Shanghai, China) cat no: E0453Ra) and cortisol (BT Lab cat no: E0828Ra). Complete blood counts were performed on the anticoagulated samples immediately after collection with an automated hematology analyzer (BC-3000, Mindray Bio-Medical Electronics, Shenzhen, China).
2.6. Tissue Sampling and Histomorphology
After removal, each liver was weighed in its entirety. Portions of liver and duodenum were then placed into 2 mL microcentrifuge tubes containing RNAlater (Thermo Fisher Scientific, Waltham, MA, USA) and kept at −20 °C until RNA extraction.
For histological evaluation, a 1 cm segment of duodenum was collected from each rat, rinsed gently with physiological saline and fixed in neutral buffered formalin for 48 h. Following routine processing, the tissues were embedded in paraffin, and 4 µm-thick sections were cut with a microtome onto adhesive slides. The sections were stained with hematoxylin and eosin (HE) and examined under a light microscope (Zeiss Axio Lab.A1, Jena, Germany) equipped with an AxioCam ICc 5 camera. Histomorphometric measurements were performed on well-oriented villi and crypts with clearly identifiable villus tips, villus–crypt junctions, and crypt bases. The villus height was measured from the villus tip to the villus–crypt junction and the crypt depth from the crypt base to this junction using ImageJ software (version 1.53h). The villus height-to-crypt depth ratio was calculated from these measurements [22]. The absorptive mucosal surface area of the small intestine was calculated according to Kisielinski et al. [23].
2.7. PCNA Immunohistochemistry
Proliferating cell nuclear antigen (PCNA) was detected immunohistochemically on intestinal sections mounted on adhesive slides by means of the avidin–biotin–peroxidase complex (ABC) technique. Following deparaffinization and rehydration, the sections were rinsed in phosphate-buffered saline (pH 7.2), and endogenous peroxidase was blocked by a 10 min incubation in 3% H2O2. Antigen retrieval was carried out by heating the sections in 0.01 M citrate buffer (pH 6.0) in a microwave oven for 20 min. Each section was encircled with a hydrophobic pen, and non-specific binding was blocked with normal serum at 37 °C for 15 min. The sections were subsequently incubated with the primary anti-PCNA antibody (ab18197, Abcam, Cambridge, UK; 1:400) for 2 h at 37 °C in a humidified chamber. After washing, the UltraVision Polyvalent HRP kit (TA-125-UDX, LabVision/ThermoScientific, Fremont, CA, USA) was applied, and immunoreactivity was visualized with AEC chromogen (TA-060-HA, AEC Substrate System, LabVision/ThermoScientific, USA), which yields a red–brown reaction product. The reaction was stopped by immersing the slides in distilled water; nuclei were then counterstained with Mayer’s hematoxylin, and the sections were mounted with an aqueous medium under coverslips for light-microscopic examination. PCNA immunoreactivity was evaluated in all 48 rats (12 per group). For each animal, a total of 100 epithelial cells were counted across five villi, starting from the villus bases. The percentage of PCNA-positive cells was calculated by dividing the number of positively stained cells by the total number of cells counted and multiplying by 100 [24]. Histomorphometric and immunohistochemical assessments were performed without blinding to treatment allocation.
2.8. RNA Isolation and Real-Time PCR
Total RNA was extracted from liver and duodenal samples with an RNA purification kit (A.B.T. Laboratory Industry, Atlas Biotechnology, Ankara, Türkiye) following the manufacturer’s protocol. The RNA concentration was quantified spectrophotometrically at 260 nm, and the purity was assessed from the 260/280 nm absorbance ratio; only samples with ratios between 1.8 and 2.0 were regarded as suitable for cDNA synthesis. RNA integrity was further checked on a 1.5% agarose gel run in 0.5× TAE buffer. Two micrograms of total RNA from each sample were reverse-transcribed into first-strand cDNA with a cDNA synthesis kit (A.B.T. Laboratory Industry, Atlas Biotechnology, Ankara, Türkiye). Duodenal TJP1 and hepatic TNF-α mRNA expression was assessed by qPCR in tissue samples from all 48 rats (12 per group, four per cage). β-actin was used as the reference gene. The primer sequences were as follows: TJP1, forward TGCCACACTGTGACCCTAAA and reverse ACAGTTGGCTCCAACAAGGT; TNF-α, forward CATCCGTTCTCTCTACCCAGCC and reverse AATTCTGAGCCCGGAGTTGG. Reactions were performed on a StepOnePlus Real-Time PCR System (Applied Biosystems, Carlsbad, CA, USA) using A.B.T. 2× qPCR SYBR-Green Master Mix (A.B.T. Laboratory Industry, Atlas Biotechnology, Ankara, Türkiye) in a final volume of 20 µL. The thermal protocol consisted of initial enzyme activation at 95 °C for 5 min, followed by 40 cycles of denaturation at 95 °C for 30 s and combined annealing and extension at 60 °C for 60 s. In the duodenal assay, TJP1 Ct values could not be determined for 28 rats, and one additional rat lacked a β-actin Ct value, leaving 19 rats with paired Ct values. For this reason, data from 4, 4, 6, and 5 rats were available in the control, 0.25%, 0.50%, and 1% groups, respectively. In the liver assay, paired Ct values for TNF-α and β-actin were available for all 48 rats. The relative expression was calculated by the 2−ΔΔCt method, using the mean ΔCt of the control group as the calibrator [25].
2.9. Statistical Analysis
Statistical analyses were performed using MedCalc software (v.18, Oostend, Belgium). The feed intake, water intake, and fecal volatile fatty acid concentrations were analyzed at the cage level, with three cages per treatment group. Body weight, blood parameters, and intestinal morphology were analyzed using measurements from individual rats. Performance data collected over time were evaluated using two-way ANOVA, with treatment, time, and their interaction included in the model. Weekly body weights were analyzed using repeated-measures ANOVA, with the individual rat as the subject and week as the repeated factor. Outcomes assessed at a single time point were analyzed using one-way ANOVA, except for gene expression data, which were compared among groups using the Kruskal–Wallis test. Significant treatment effects in the ANOVA were followed by Scheffé’s post hoc comparisons among treatment groups within each outcome. Group means and standard errors of the mean (SEM) are reported in the tables. Statistical significance was set at p < 0.05.
3. Results
The initial body weight of the groups was similar among the groups (p = 0.78). The mean body weight and feed consumptions of the 1% and 0.5% groups were lower than the control and 0.25% groups. On the other hand, the body weight gain was not statistically affected by the treatment. Although water consumption of the 1% group was lower than the 0.25% group, it was not different from the control group (Table 2). All of the performance parameters were affected by the time. However, time × treatment interaction was not significant for all performance parameters.
Table 2.
Effects of potassium humate addition to water at different levels on some performance parameters in rats.
The results of the serum biochemical analysis are presented in Table 3. The serum glucose concentration was lower in the 0.50% group compared to the 0.25% group. However, there was no statistical difference between the control and treatment groups regarding serum glucose concentration. The serum AST, ALT, and total protein concentrations were similar among groups (Table 3). While the serum total cholesterol and HDL levels were significantly higher in the 0.25% group compared to the 1% group, there was no difference between control and treatment groups. It was observed that the serum IgG levels of the control, 0.25% and 0.5% were similar among groups, however; serum IgG was significantly lower in the 1% group than control and other treatment groups. While the serum cortisol level was higher in 0.50% group than the control group it was similar to other treatment groups. On the other hand, serum cortisol levels of 0.25 and 1% groups were similar to control group.
Table 3.
Effects of adding different amounts of potassium humate to water on some serum parameters in rats.
The hematology parameters are presented in Table 4. In the presented study, it was observed that dietary potassium humate supplementation did not affect the hematology parameters except for plateletcrit (Table 4). Plateletcrit was lower in the treatment groups; however, statistically significant value was detected only in the 1% group (p = 0.03).
Table 4.
Effects of potassium humate addition to water at different levels on some hematology parameters in rats.
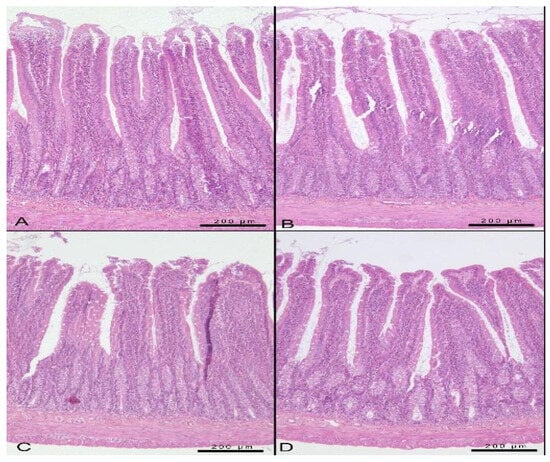
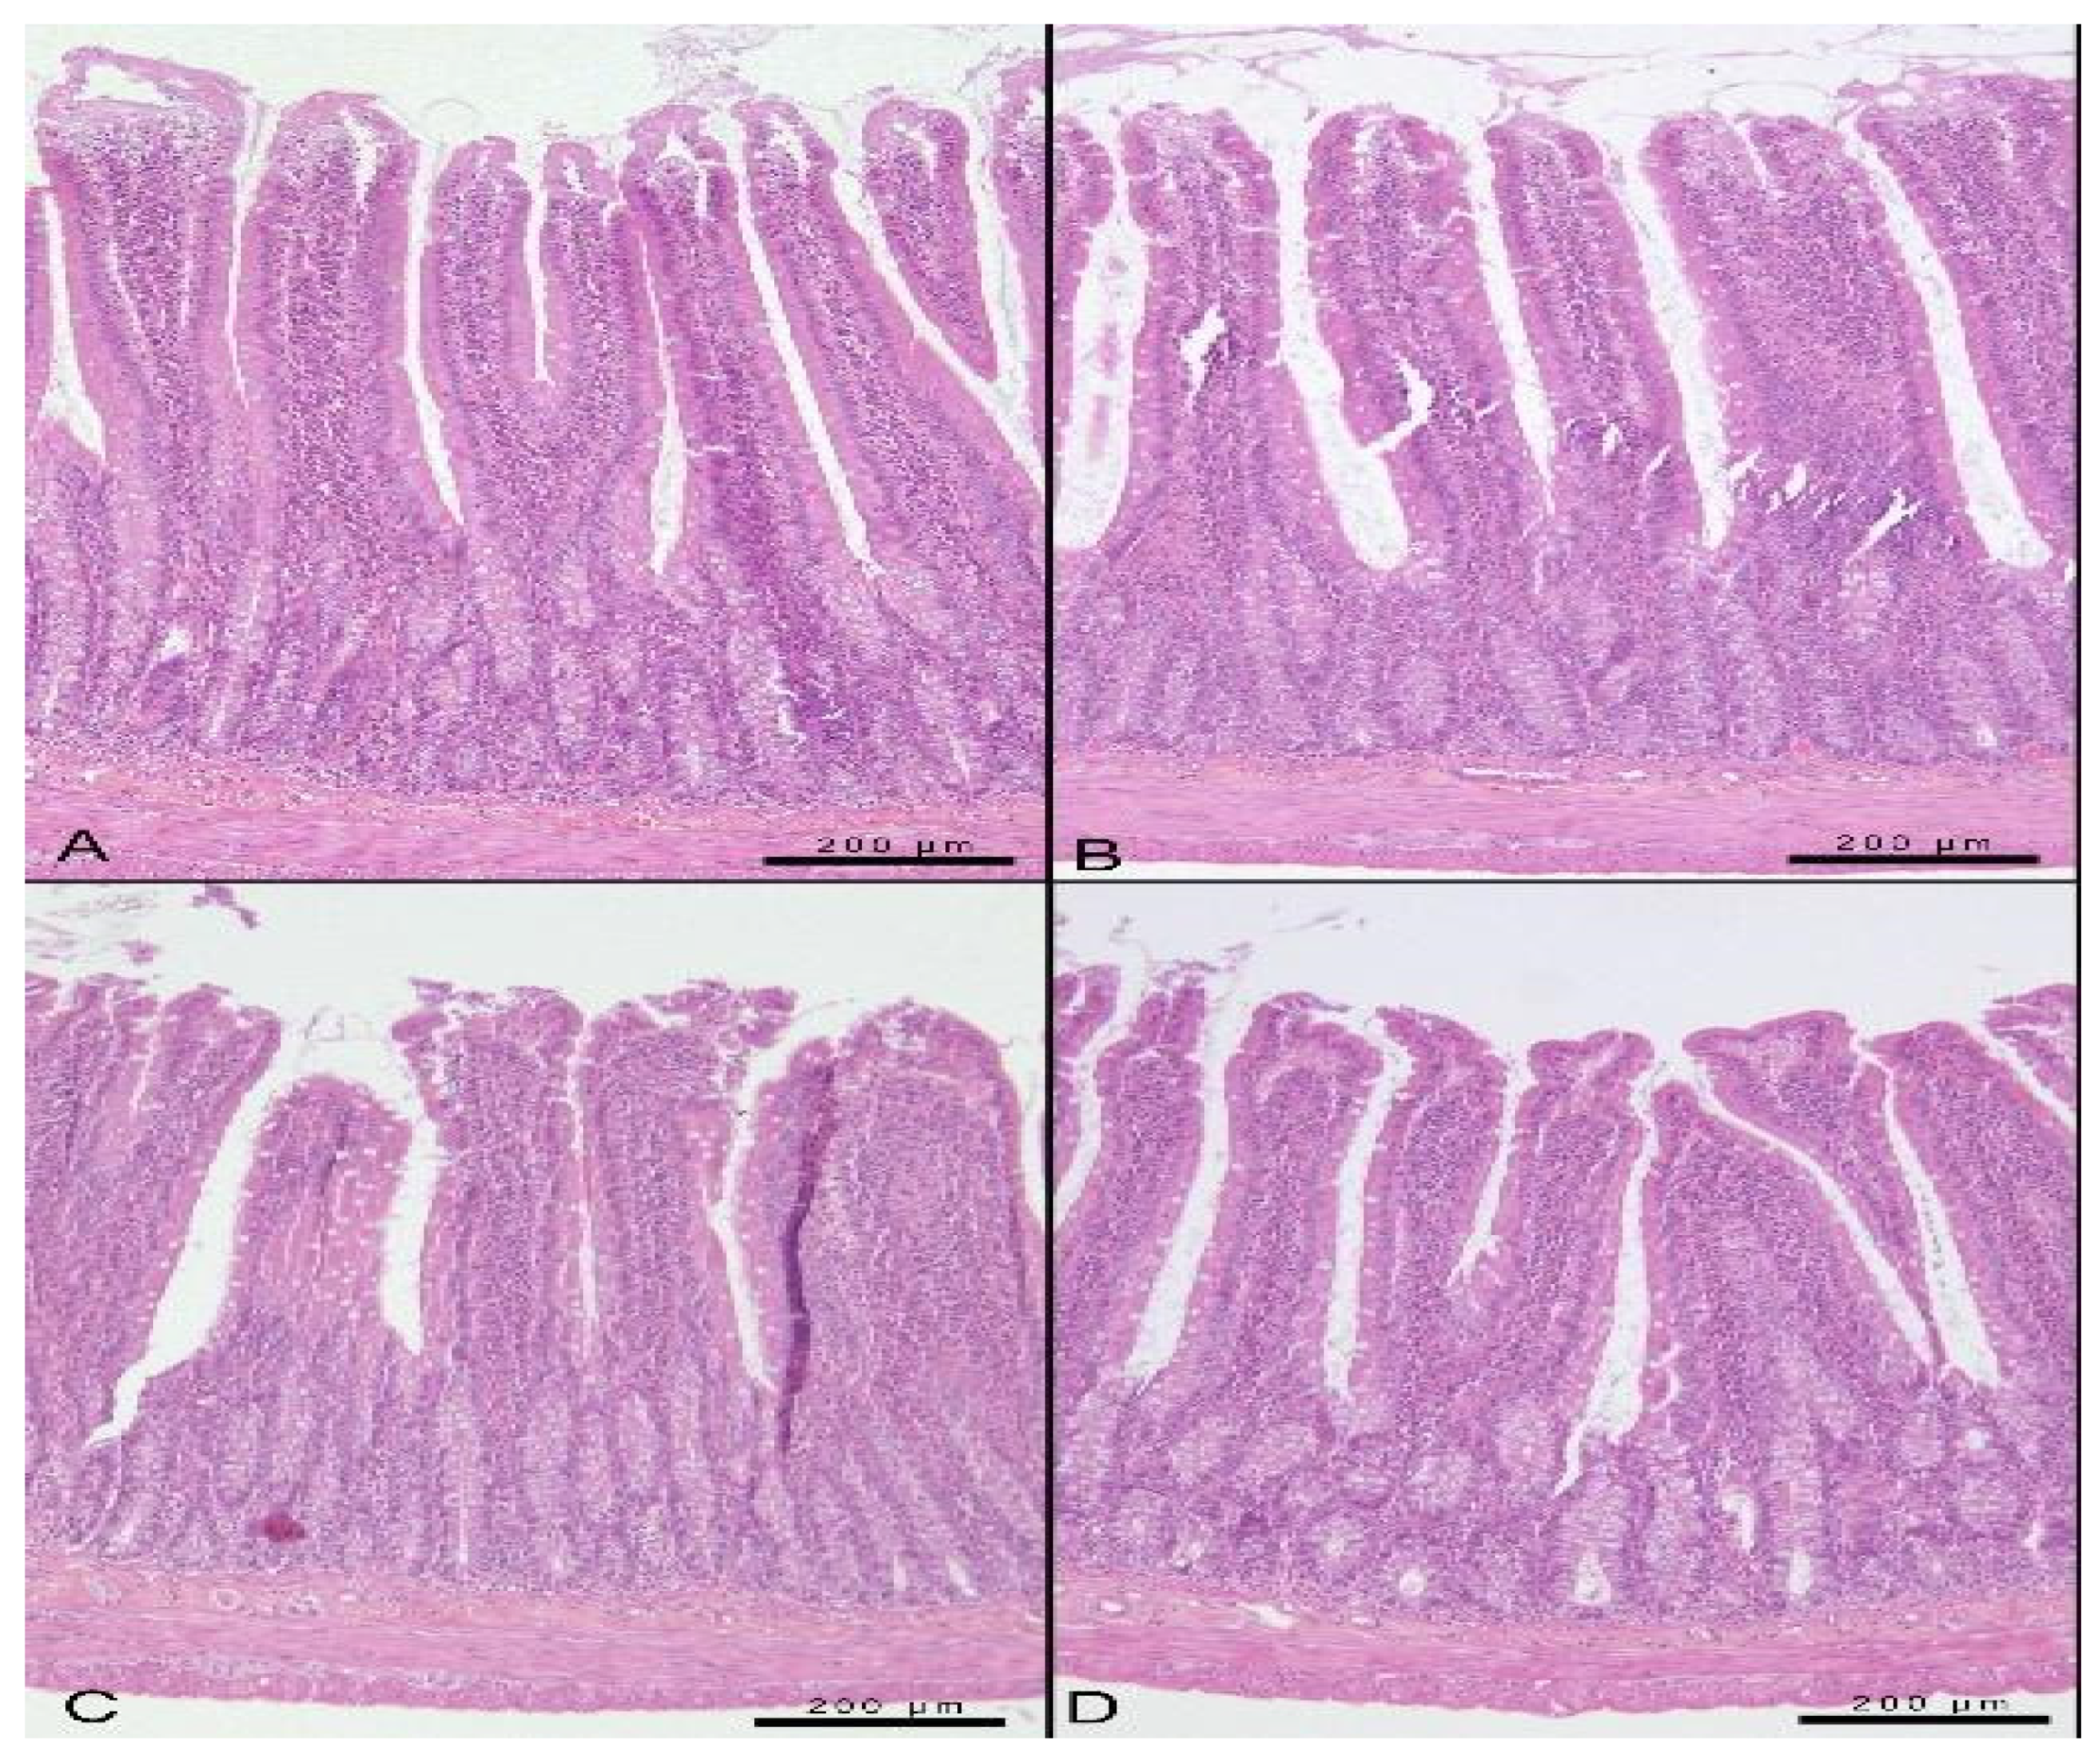
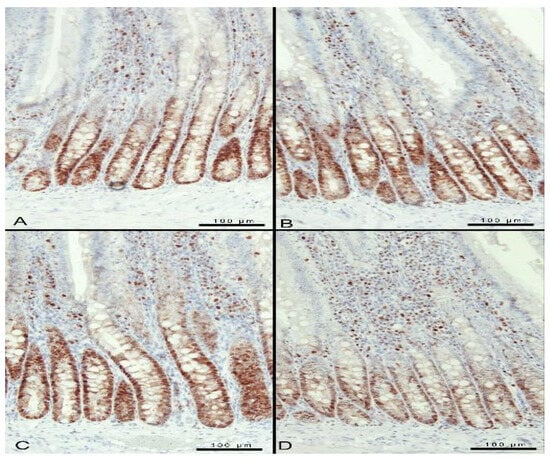
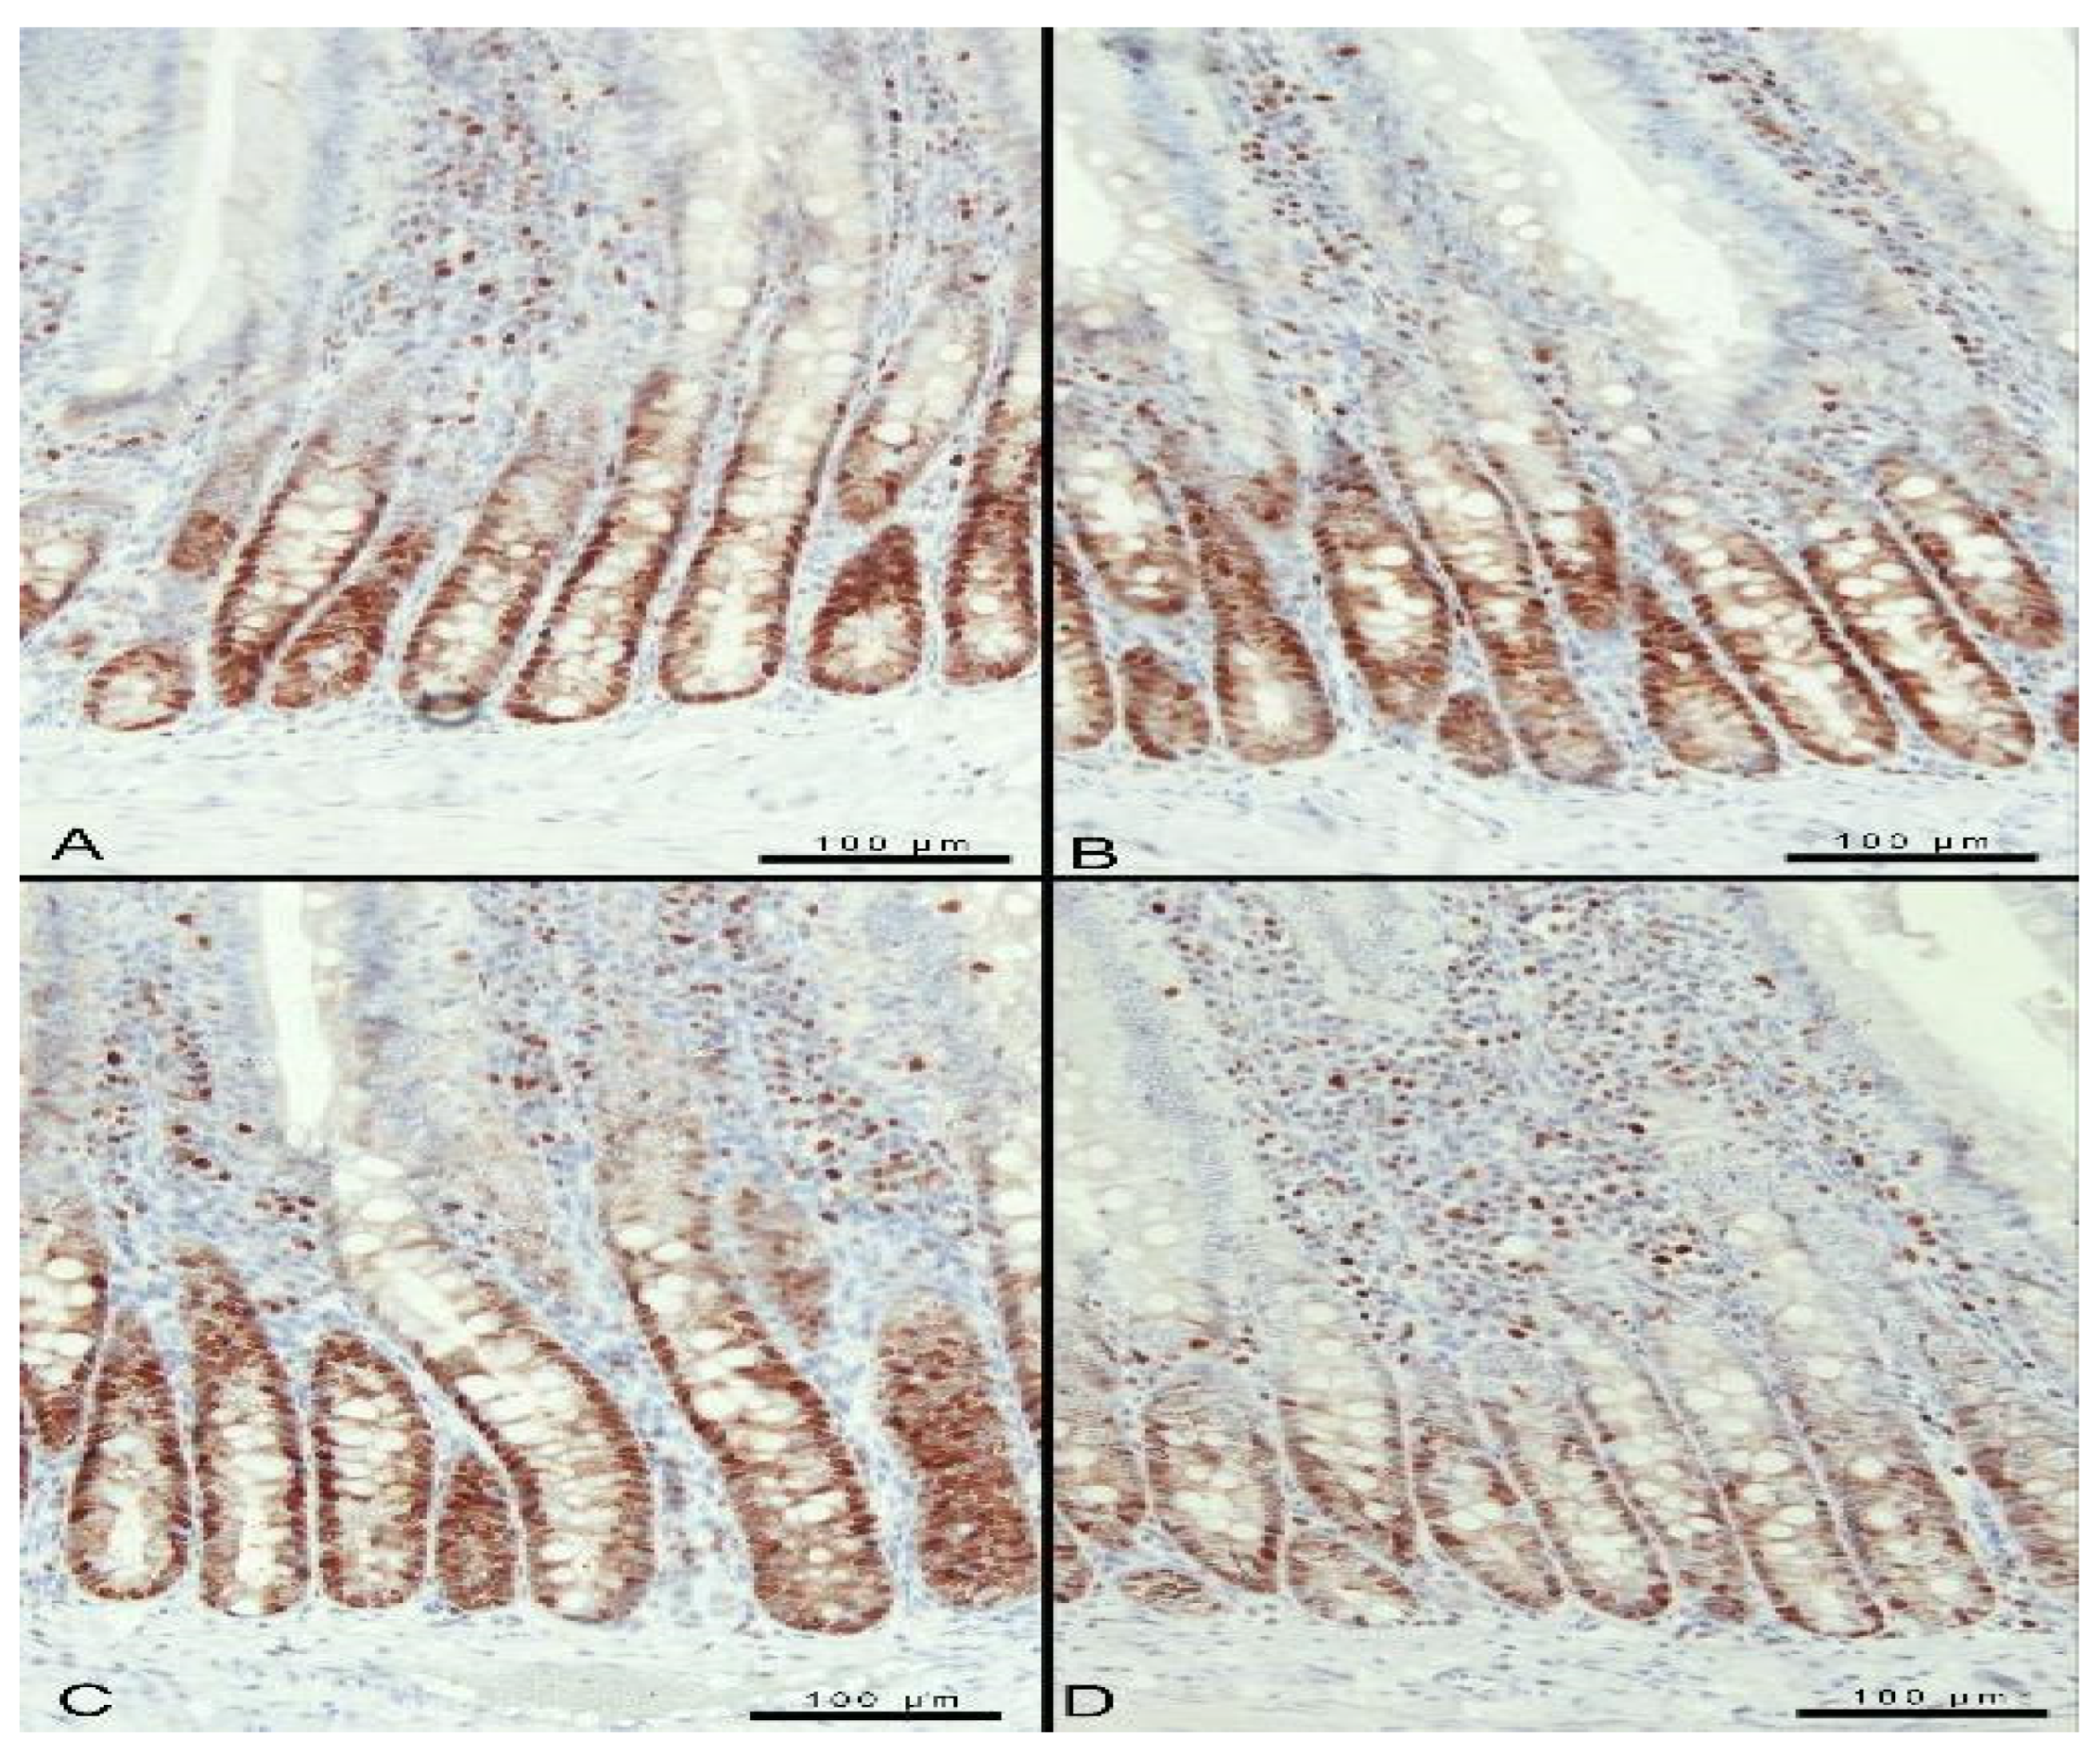
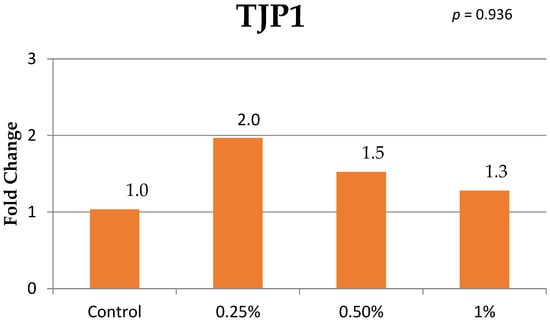
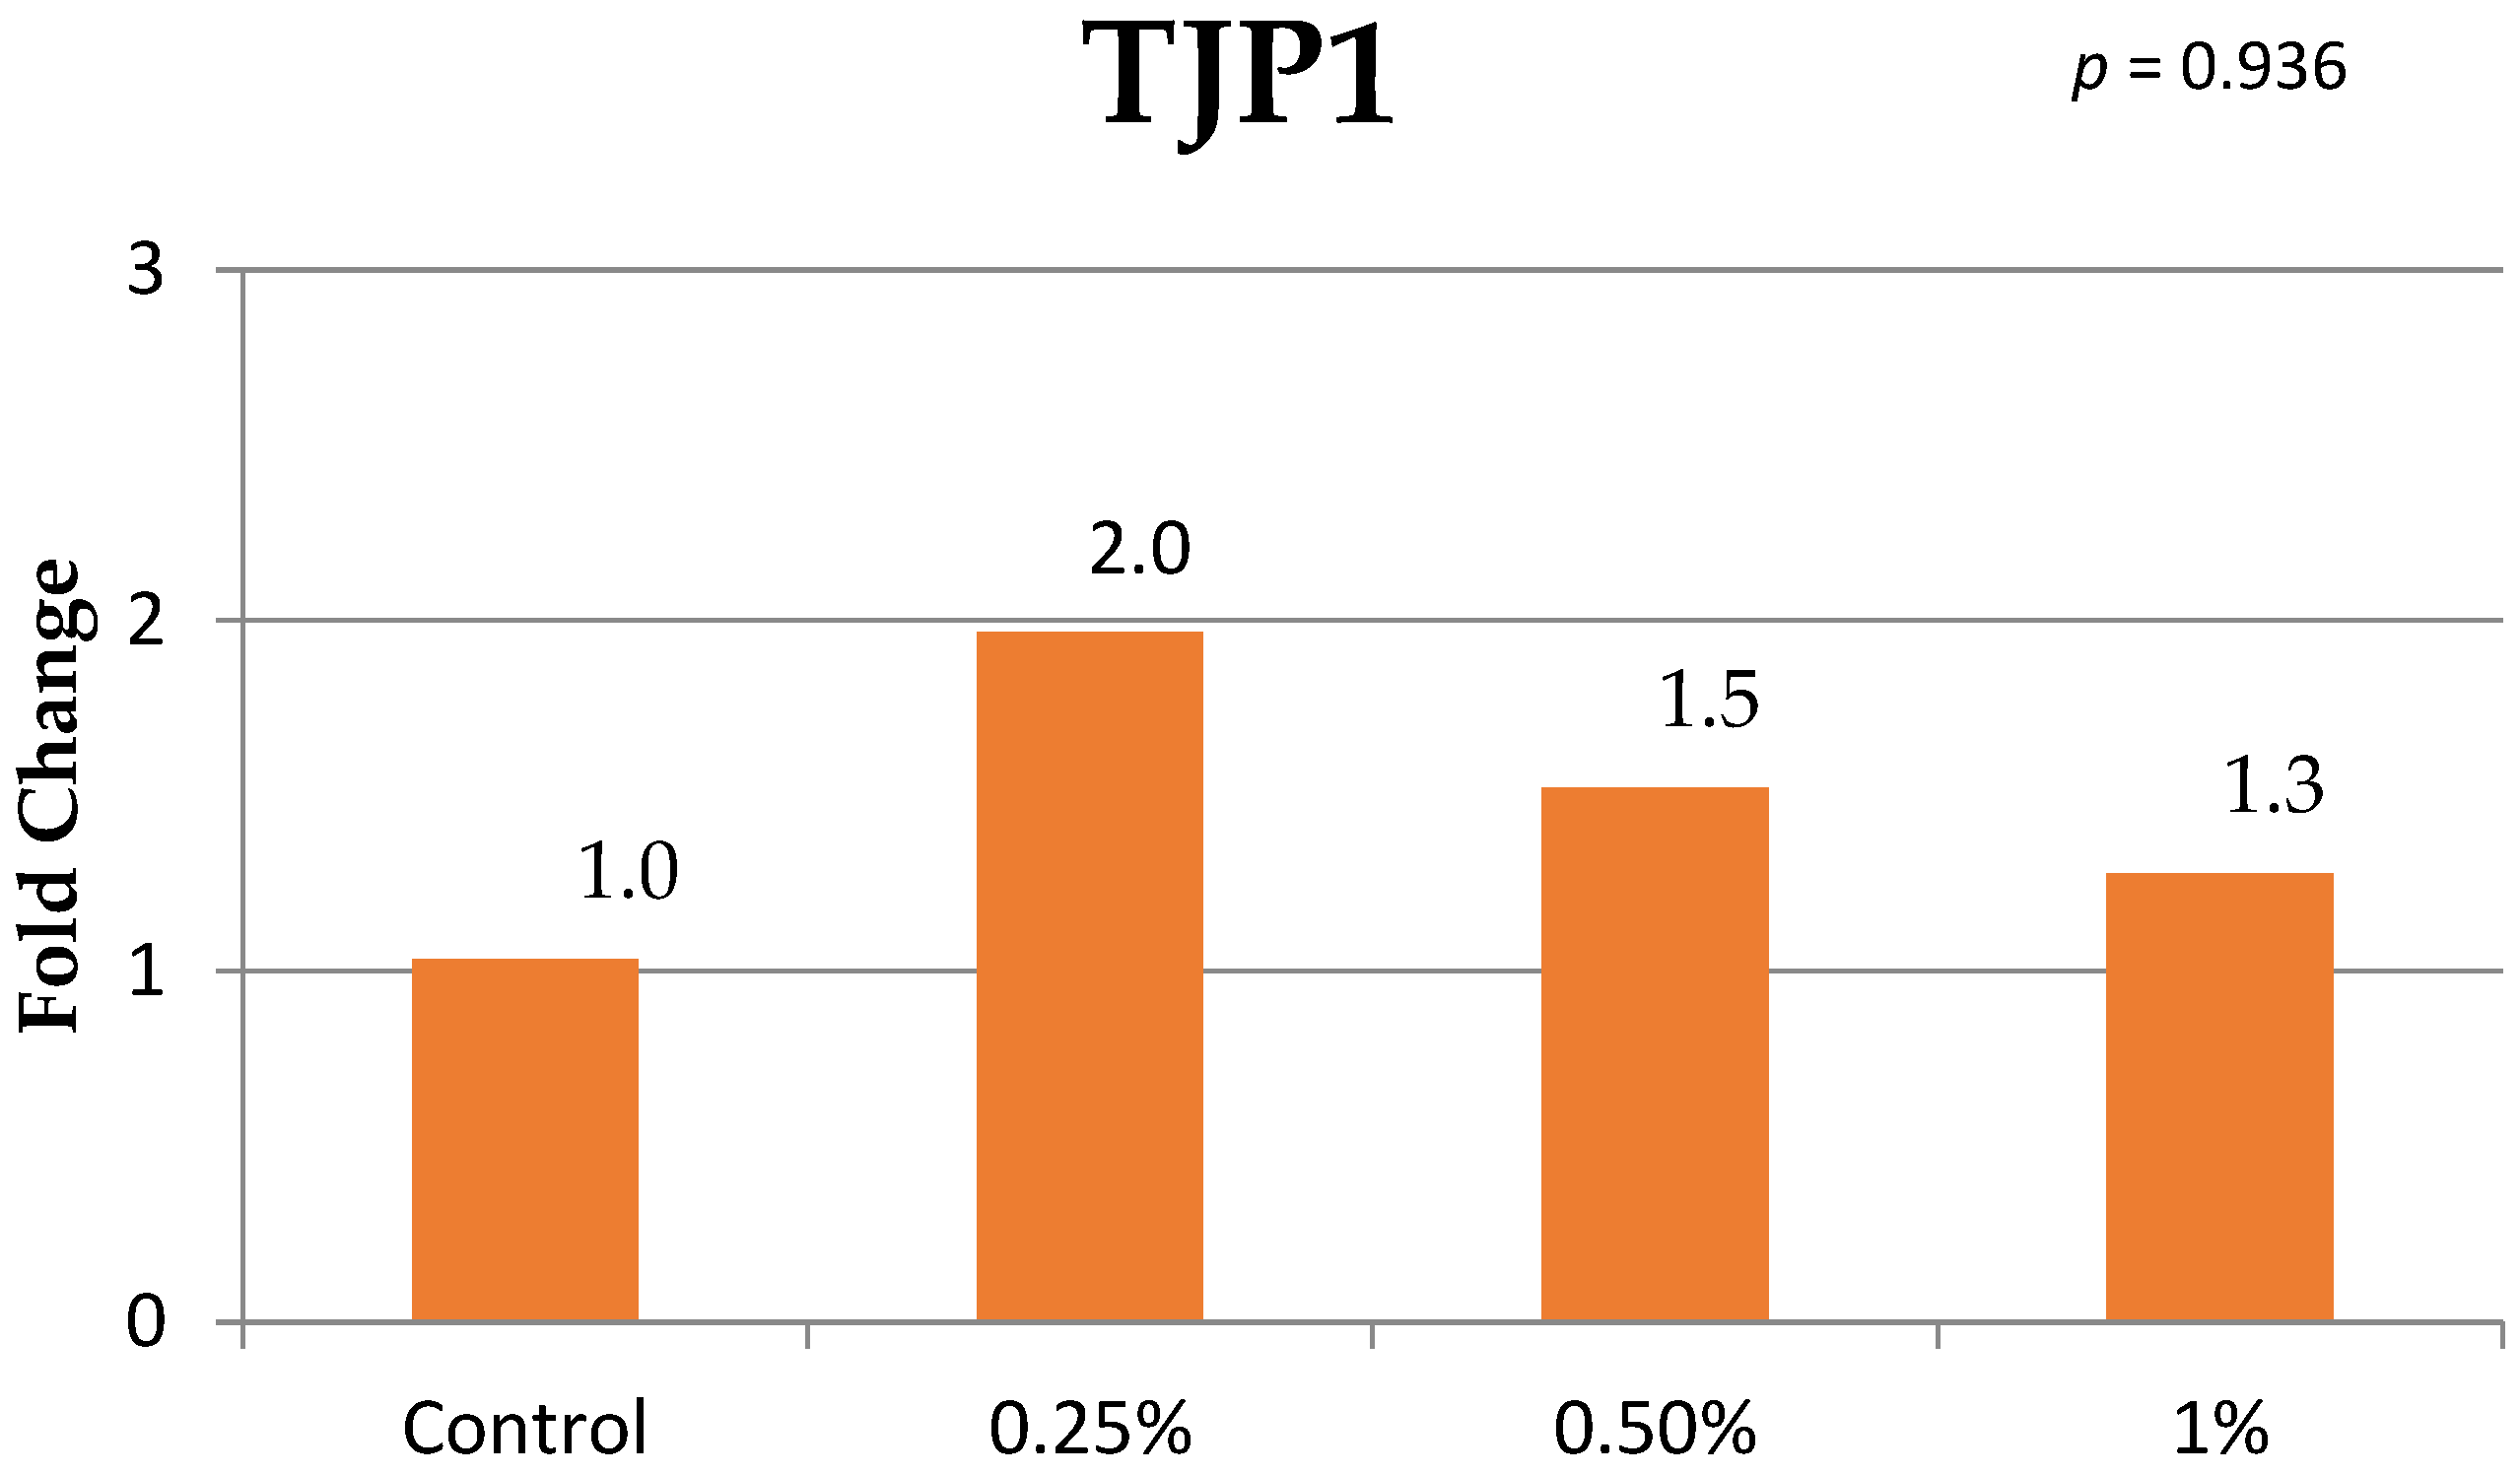
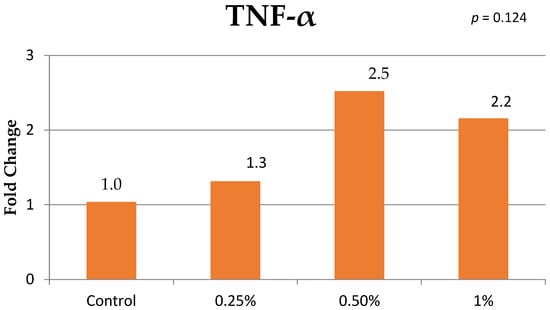
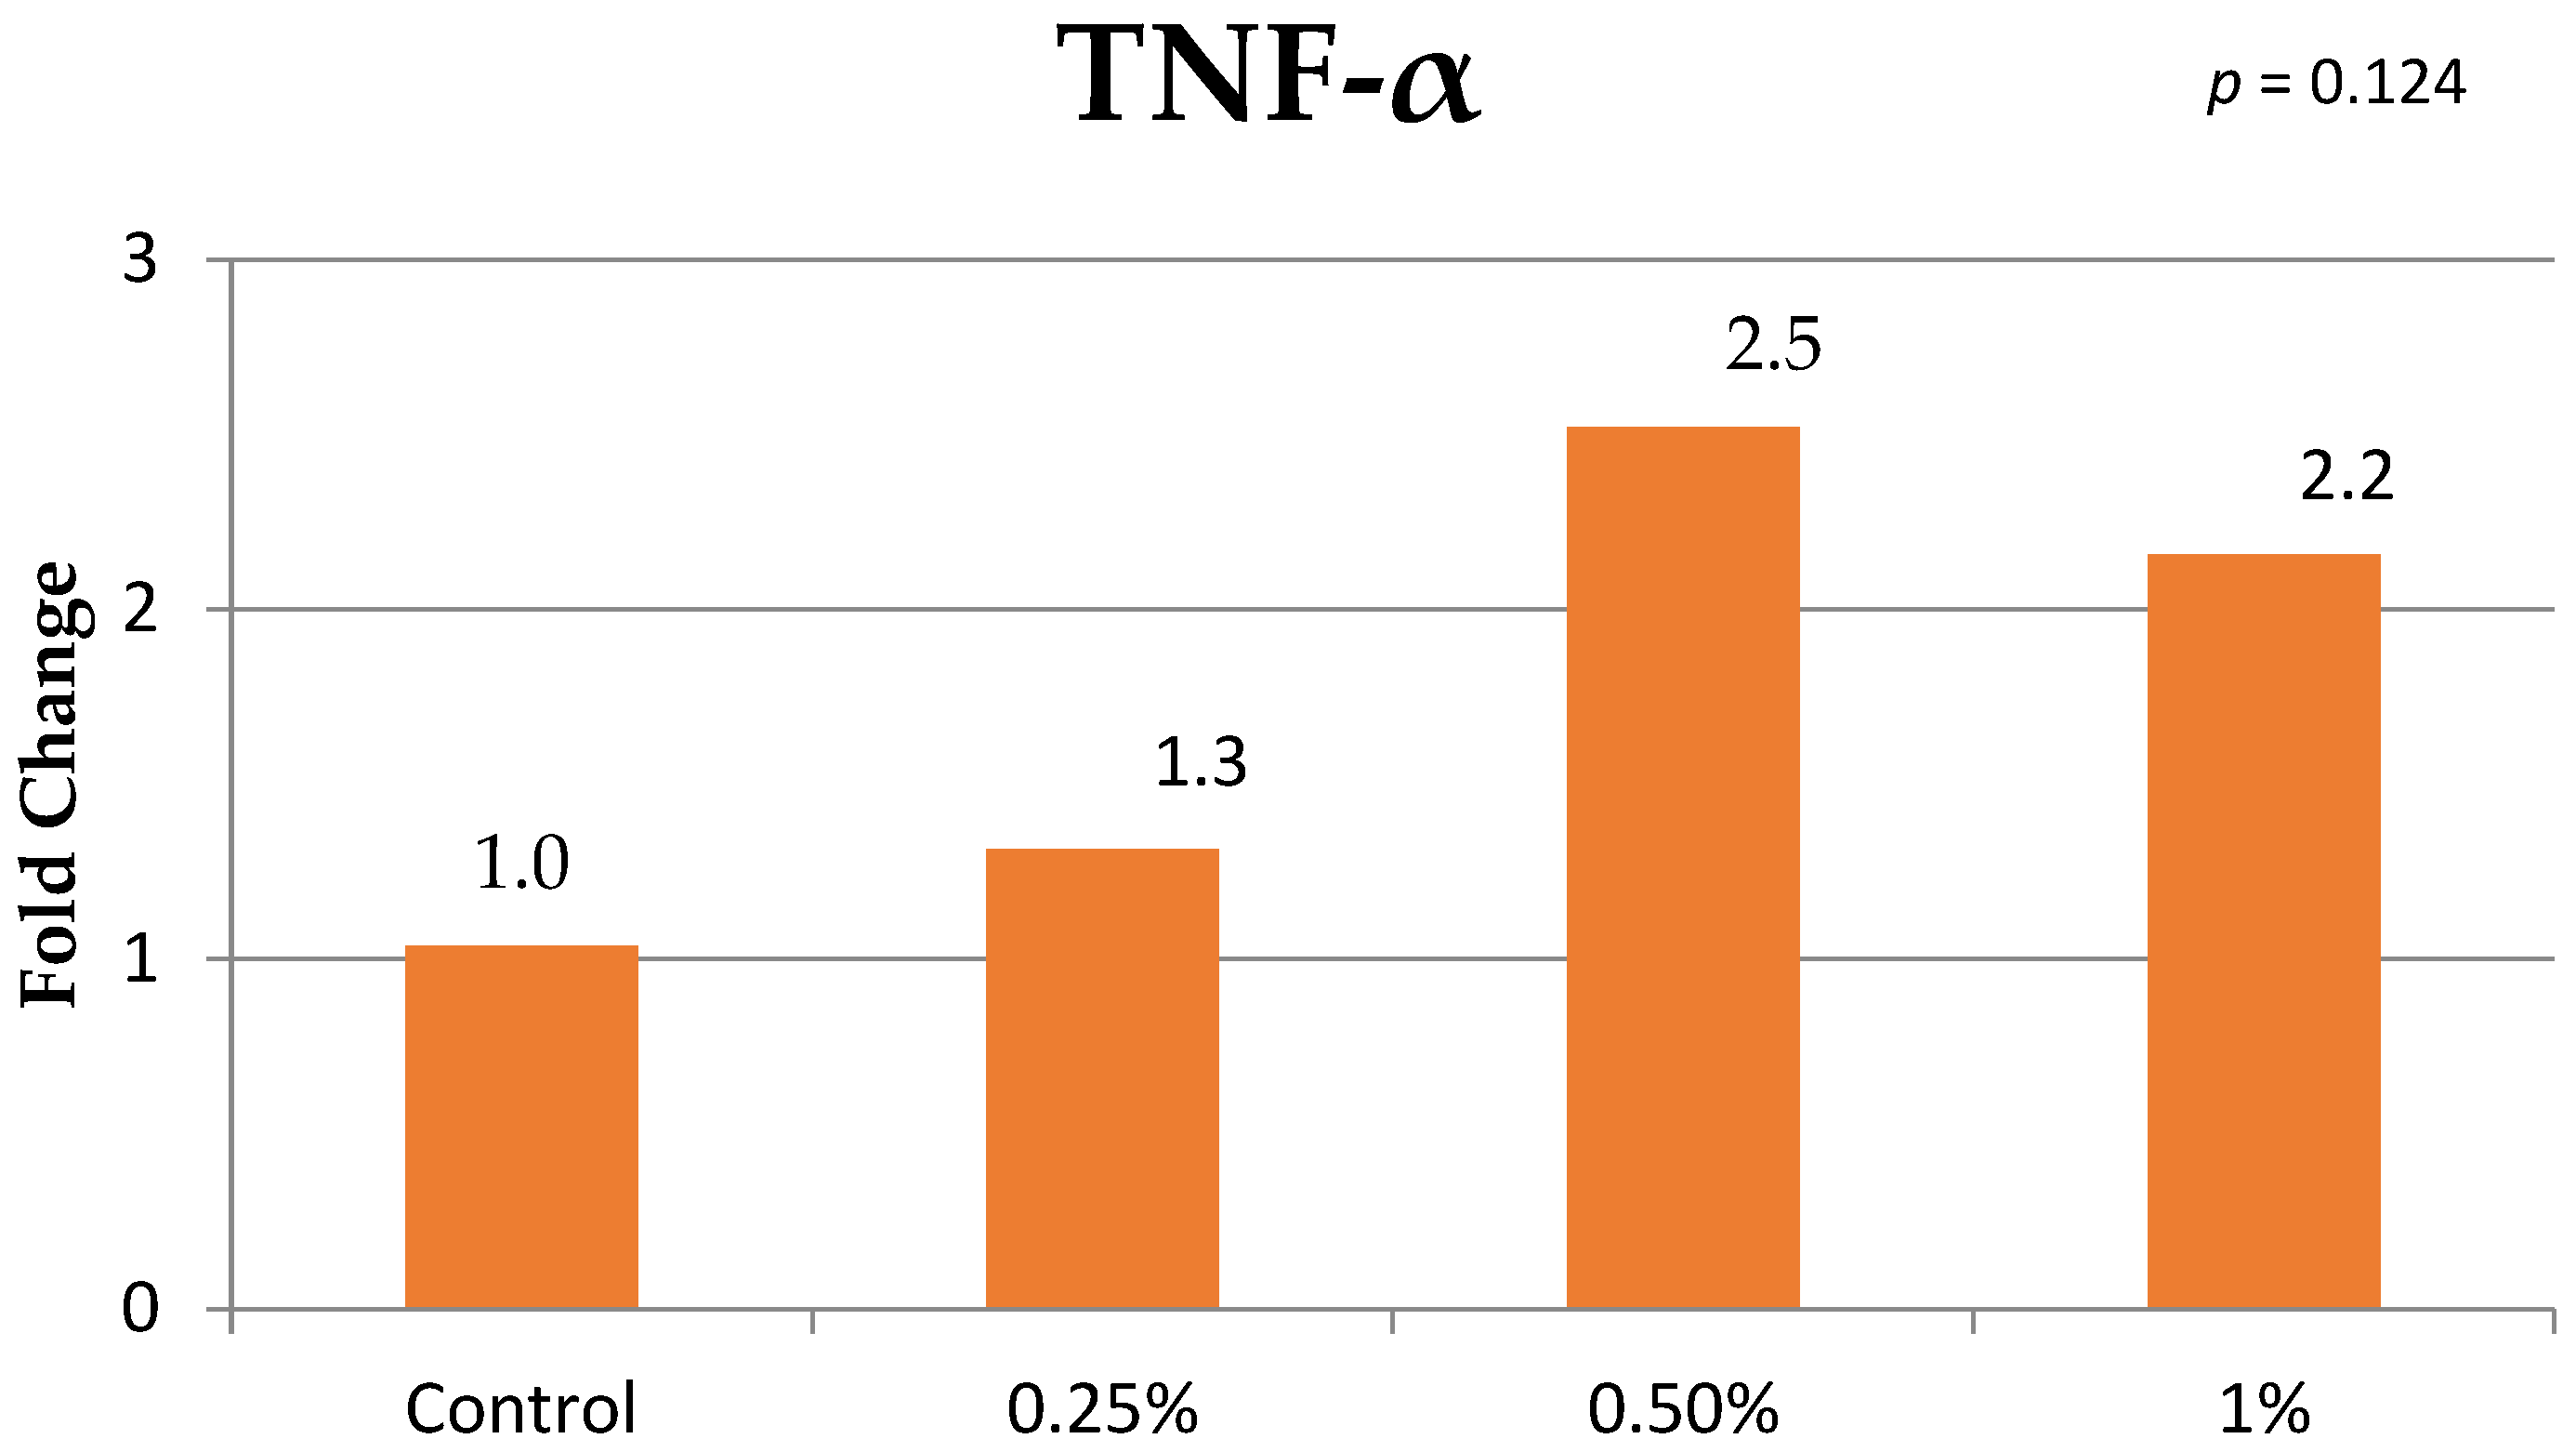
The presented study found no statistical differences in the feces volatile fatty acid concentrations including acetic acid, propionic acid, isobutyric acid, butyric acid, isovaleric acid, valeric acid and caproic acid (Table 5). In our study, although the villus height was lower in the treatment groups, the statistically lower value was detected in the 0.50% group compared to the control group. The villus width, crypt depth and mucosal surface area were not statistically different among groups (Table 6; Figure 1). The PCNA values were similar among the control, 0.25% and 0.50% groups. However, the PCNA value of the 1% group was lower than the control and other treatment groups (Table 6; Figure 2). The liver weight and the liver/body weight ratio were similar among groups. The relative mRNA expression levels of the TJP1 and TNF-α were presented in the Figure 3 and Figure 4, respectively. Fold changes of the TJP1 and TNF-α were similar among groups (p = 0.936 and p = 0.124, respectively). Relative duodenal TJP1 expression values were 2.0, 1.5, and 1.3 in the 0.25%, 0.50%, and 1% groups, respectively, whereas hepatic TNF-α expression values were 1.3, 2.5, and 2.2.
Table 5.
Effects of potassium humate addition to water at different levels on feces volatile fatty acids in rats (μmol/g of feces).
Table 6.
Effects of potassium humate addition to water at different levels on small intestine and liver tissue in rats.
Figure 1.
Representative hematoxylin and eosin (HE)-stained sections of the rat duodenum showing villi and crypts. Panels represent the control (A), 0.25% (B), 0.50% (C), and 1% (D) potassium humate groups. Scale bars = 200 μm in all panels.
Figure 2.
Proliferating cell nuclear antigen (PCNA) immunostaining in rat duodenal sections. Panels represent the control (A), 0.25% (B), 0.50% (C), and 1% (D) potassium humate groups. PCNA-positive cells exhibit red-brown nuclear staining. ABC–peroxidase detection with AEC chromogen and Mayer’s hematoxylin counterstaining. Scale bars = 100 μm in all panels.
Figure 3.
Effects of potassium humate addition to water at different levels on Tight Junction 1 (TJP1) relative mRNA expression in intestinal tissues of rats.
Figure 4.
Effects of potassium humate addition to water at different levels on TNF-α relative mRNA expression in liver tissues of rats.
4. Discussion
The presented study investigated the effects of liquid potassium humate at different doses for 60 days on nutritional metabolism in a rat model. The study found dose dependent effects on the body weight, feed and water consumption in rats consuming potassium humate in drinking water. In a previous study, dietary supplementation with humic or fulvic acid did not affect feed intake, body weight gain, or the feed-to-gain ratio in rats [16]. On the other hand, although mean body weight differed among groups over the experimental period, average daily weight gain did not differ significantly. This contrast may reflect the distinction between body weight development over time and the average rate of gain, as a single growth-rate parameter may not adequately capture the complexity of rat growth trajectories [26]. Differences among studies may be related to the source and chemical composition of the humic product, supplementation level, route of administration, and duration of administration. However, present study did not perform pair-feeding. The absence of a pair-fed control limits our ability to distinguish any direct effects of potassium humate on immune and intestinal outcomes from the potential contribution of reduced feed intake in the 0.50% and 1% groups.
In our study, serum glucose levels were similar between control and the treatment groups; however, a statistically significant difference was observed between the 0.25% and 0.50% treatment groups. It was reported that humic acid has protective effects in the diabetes-induced rats [11]. Although a decline in the serum glucose levels of treatment groups has been determined in our study, it was not statistically significant compared to the control. Contrary to previous studies using metabolically challenged animals, the rats in the present study were not subjected to an experimental model of diabetes or metabolic dysfunction. This may have limited the ability to detect a potential hypoglycemic effect of humic acid. Therefore, our findings do not confirm an antidiabetic effect of potassium humate under the present experimental conditions.
The total cholesterol and HDL concentrations were significantly affected by treatment depending on dose. However, for both parameters, a significant difference was observed only between the 0.25% and 1% groups. Therefore, neither the total cholesterol nor HDL differed significantly between the control and supplemented groups. It was reported that supplementation with humic substances reduced LDL and triglyceride concentrations, whereas HDL remained unaffected in rabbits [27]. The authors proposed that the reductions in circulating lipids might have resulted from increased fat metabolism associated with the effects of humic substances on hepatic detoxifying effect. For this reason, hypolipidemic effect of humic acid should be further investigated.
In our study, the use of potassium humate resulted in a significant decrease in the IgG in the 1% group and increased cortisol concentration in the 0.50% group, while most hematological parameters remained unchanged, except for a reduction in plateletcrit in the 1% group. The marked reduction in serum IgG in the 1% group suggests that the highest supplementation concentration may alter humoral immune regulation. However, the total IgG concentration alone does not establish impaired immune competence or a beneficial anti-inflammatory effect. On the mechanism by which the suppressive effect of humic substances on the immune system, Hudec et al. (2024) have suggested that the large humic molecules may be structurally shielded by other components within the molecule, potentially limiting their interaction with biogenic molecules and immune cell receptors [28]. As a hypothesis, this reduced bioavailability may be one of the possible mechanisms underlying the decrease in IgG levels observed in the present study. In addition, this humic acid molecule can capture some biological substances such as cytocines within their molecular structure, thereby mitigating their impact on immune reactions [28]. Similarly, Trofimova et al. (2022) have reported that humic acid reduced the serum IgG and IgE concentration in mice by stabilizing the mast cell membrane thereby reducing the inflammatory response [29]. However, contrary to our results and previous reports, Uyarlar et al. reported that dietary potassium humate supplementation during the dry period increased the serum IgG concentration in cows [14]. This discrepancy could be attributed to different digestive physiology of the studied animals [30]. Stress-related glucocorticoid changes can accompany altered antibody responses [31]. In our study, cortisol was significantly higher at 0.50% than in the control, whereas the 1% group differed from neither group. Thus, the findings do not demonstrate a progressive increase with the supplementation concentration or a confirmed decline at the highest concentration. The elevation at 0.50% may suggest altered physiological stress regulation, but a single terminal measurement cannot establish the persistence or underlying mechanism of this response. Although stress-related hormonal changes and humoral immune regulation may be associated, the present data do not establish whether cortisol contributed to the reduction in IgG.
In the present study, no significant changes were observed in fecal volatile fatty acid (VFA) levels, including acetate, propionate, butyrate, isobutyrate, isovalerate, and valerate. VFAs are end products resulting from fermentation of carbohydrates by gut microbiota and they are involved in intestinal homeostasis, metabolism, and immune regulation [32,33]. Previous studies have reported different responses to humic preparations. Li et al. (2022) observed higher intestinal acetate, isobutyrate, and isovalerate concentrations in older laying hens receiving dietary sodium humate [34]. On the other hand, Visscher et al. (2019) reported lower cecal acetate and total SCFA concentrations in piglets fed humic acid-rich peat [18]. Differences in animal species, product composition, dietary inclusion level, and sampling site may contribute to the variation among studies, although their individual contributions cannot be revealed in present study. Differences in animal species, product composition, supplementation level, and sampling site may contribute to these contrasting findings. Fecal VFA concentrations reflect the balance between microbial production and intestinal absorption and are also influenced by intestinal transit [35]. Therefore, fecal VFA concentration provides an indirect indication of hindgut fermentation rather than a direct measurement of fermentation rates. Consequently, the absence of significant differences in fecal VFA concentrations does not exclude changes in microbial activity or fermentation within the intestine.
In the present study, villus height and PCNA expression were decreased in 0.50% and 1% groups, respectively, while villus width, crypt depth, mucosal surface area, and liver-related parameters remained unchanged. Although shorter villi may have implications for absorptive architecture, the present measurements do not establish a reduction in nutrient absorption. In an earlier study, Yasar et al. (2002) reported increased ileal villus height and crypt depth following administration of dry or liquid humic acid preparations [15]. The lower PCNA index in the 1% group suggests altered epithelial proliferative activity [36]. Contrary to our results, Zhang et al. (2023) have found that fulvic acid up-regulates the PCNA expression when it is given in the amount of %0.01 of diet of yellow croaker larvae [37]. In another study, it has been demonstrated that humic acid has anti-apoptotic effects and it increases the PCNA expression in gastric ulcer [9]. These responses were observed during larval development or in stimulated gastric ulcer where the requirements for epithelial growth and repair may differ from those in the present nutritional supplementation model which can lead to different responses.
Mean duodenal TJP1 and hepatic TNF-α mRNA expression values were numerically higher in the supplemented groups, although these differences were not statistically significant. TJP1 encodes ZO-1, which contributes to epithelial homeostasis and mucosal repair [17]. The numerical TJP1 findings provide a transcriptional perspective alongside the morphological and PCNA observations, with each endpoint reflecting a different aspect of epithelial biology. Hepatic TNF-α expression showed larger mean fold changes at 0.50% and 1%. Huang et al. (2023) reported reduced serum TNF-α concentrations following humic acid supplementation in mice with dextran sulfate sodium-induced colitis [38]. Differences in health status, tissue compartment, and the assessment of transcripts versus circulating proteins should be considered when comparing these observations. Overall, the numerical expression patterns may inform hypotheses about intestinal and hepatic responses to potassium humate, but their biological significance should be further investigated because corresponding protein-level and functional measurements were not performed.
This study has several limitations. Only male Wistar rats were evaluated over a 60-day period, limiting generalization to females and other exposure durations. Pair-feeding was not performed; therefore, reduced feed intake at higher supplementation concentrations may have contributed to the immune and intestinal findings. Intestinal microbiota composition was not assessed, and fecal VFA concentrations provide an indirect indication of hindgut fermentation rather than a direct measurement of fermentation rates. Furthermore, the final pH of the supplemented water was not measured, preventing assessment of the possible contribution of altered water alkalinity. Product composition was based on manufacturer-reported values without independent chemical characterization. Finally, the absence of supporting protein-level and functional measurements limits mechanistic interpretation of the gene expression findings.
5. Conclusions
Liquid potassium humate supplementation in drinking water provided no clear growth-promoting effect during this 60-day study in male Wistar rats including the lowest dose. Average daily weight gain, fecal VFA concentrations, and intestinal TJP1 and hepatic TNF-α mRNA expression did not differ significantly among groups, and most hematological parameters remained unchanged. However, the 0.50% and 1% groups had lower mean body weight and feed intake than the control group. The highest concentration, 1%, was associated with lower serum IgG concentrations and a lower percentage of PCNA-positive cells. These findings warrant caution when considering the higher concentrations tested, although the functional significance of the immune and intestinal changes requires further investigation.
Author Contributions
Conceptualization, C.U., I.B. and İ.S.Ç.; methodology, C.U., I.B., U.O., M.F.B., A.Ç. and İ.S.Ç.; software, C.U., M.E.O. and A.Ç.; validation, I.B., U.O., M.E.O., M.F.B., A.Ç. and A.Q.; formal analysis, I.B., U.O., M.E.O., S.R.A.S. and A.Q.; investigation, C.U., U.O., M.F.B., A.Ç., M.N.B. and S.R.A.S.; resources, C.U., U.O. and İ.S.Ç.; data curation, I.B., M.E.O., M.F.B., A.Ç., M.N.B. and İ.S.Ç.; writing—original draft preparation, I.B., M.E.O., M.N.B., S.R.A.S., A.Q.; writing—review and editing, C.U., I.B., U.O., M.E.O., M.F.B., A.Ç., M.N.B., S.R.A.S., A.Q. and İ.S.Ç.; visualization, M.N.B., A.Q.; supervision, I.B. and İ.S.Ç.; project administration, C.U. and İ.S.Ç.; funding acquisition, C.U., I.B. and İ.S.Ç. All authors have read and agreed to the published version of the manuscript.
Funding
This research was funded by Scientific Research Projects Commission of Afyon Kocatepe University, grant number 18.KARİYER.279.
Institutional Review Board Statement
The study was approved by the Ethics Committee of Afyon Kocatepe University, Animal Experiments Local Ethics Committee (protocol code 49533702 and date of approval 25 July 2018).
Informed Consent Statement
Not applicable.
Data Availability Statement
The raw data supporting the conclusions of this article will be made available by the authors on request.
Acknowledgments
The authors thank the Animal Breeding Laboratories of the Experimental Animal Research and Application Center (Afyonkarahisar, Türkiye) for their assistance during the study. During the preparation of this manuscript/study, the author(s) used ChatGPT, version GPT-6.1 for the purposes of language editing. The authors have reviewed and edited the output and take full responsibility for the content of this publication.
Conflicts of Interest
The authors declare no conflicts of interest.
References
- Alem, W.T. Effect of herbal extracts in animal nutrition as feed additives. Heliyon 2024, 10, e24973. [Google Scholar] [CrossRef] [Scilit]
- Zykova, M.V.; Trofimova, E.S.; Azarkina, L.A.; Lasukova, T.V.; Mihalyov, D.A.; Drygunova, L.A.; Danilets, M.G.; Ligacheva, A.A.; Tsupko, A.V.; Bashirov, S.R.; et al. Pharmacological Effects of Humic Substances and Their Signaling Mechanisms. Molecules 2026, 31, 114. [Google Scholar] [CrossRef] [Scilit]
- Kambatyrov, M.; Nazarbek, U.; Abdurazova, P.; Nazarbekova, S.; Raiymbekov, Y. Humates from coal mining waste: Synthesis, study of composition and radioactivity. Rasayan J. Chem. 2020, 13, 1308–1312. [Google Scholar] [CrossRef] [Scilit]
- Dębska, B.; Banach-Szott, M. Humic Acids Properties of Luvisol of 40-Year Fertilizer Experiment. Agronomy 2025, 15, 1405. [Google Scholar] [CrossRef] [Scilit]
- Hajdrik, P.; Pályi, B.; Kis, Z.; Kovács, N.; Veres, D.S.; Szigeti, K.; Budán, F.; Hegedüs, I.; Kovács, T.; Bergmann, R.; et al. In Vitro Determination of Inhibitory Effects of Humic Substances Complexing Zn and Se on SARS-CoV-2 Virus Replication. Foods 2022, 11, 694. [Google Scholar] [CrossRef] [Scilit]
- Pipová, M.; Jevinová, P.; Semjon, B.; Regecová, I.; Marcinčák, S.; Nagy, J. Effect of feed supplementation with humic substances on phenotypic resistance profiles of Escherichia coli isolates from the ceca of broiler chickens. Poult. Sci. 2025, 104, 105175. [Google Scholar] [CrossRef] [Scilit]
- Avvakumova, N.P.; Gerchikov, A.Y.; Khairullina, V.R.; Zhdanova, A.V. Antioxidant properties of humic substances isolated from peloids. Pharm. Chem. J. 2011, 45, 192–193. [Google Scholar] [CrossRef] [Scilit]
- Zolghadr, L.; Behbehani, G.R.; Pakbin, B.; Hosseini, S.A.; Gheibi, N. A new insight into the anti proliferative and apoptotic effects of fulvic and humic acids as bio product of humus on breast cancer cells, optimized by response surface methodology. Waste Biomass Valorization 2023, 14, 859–872. [Google Scholar] [CrossRef] [Scilit]
- Şehitoğlu, M.H.; Öztopuz, Ö.; Karaboğa, İ.; Ovalı, M.A.; Uzun, M. Humic Acid Has Protective Effect on Gastric Ulcer by Alleviating Inflammation in Rats. Cytol. Genet. 2022, 56, 84–97. [Google Scholar] [CrossRef] [Scilit]
- Orlando, P.R.; Tavares, H.G.; de Souza Pereira, R.R.; Silva, G.; do Carmo Lima Carvalho, J.; Machado, A.R.T.; Dobbss, L.B.; Peixoto, M.F.D.; Pereira, L.J.; Andrade, E.F. Humic Acid Derived from Agricultural Biomass Mitigates Alveolar Bone Loss and Modulates Systemic Inflammatory Cytokines in Rats with Periodontitis. Curr. Top. Med. Chem. 2025, 25, 645–656. [Google Scholar] [CrossRef] [Scilit]
- Patel, P.; Paul, A. Protective effect of Humic acid against Diabetic Retinopathy in streptozotocin induced diabetic rats. HUJPHARM 2026, 46, 27–38. [Google Scholar] [CrossRef] [Scilit]
- Lasukova, T.V.; Zykova, M.V.; Belousov, M.V.; Gorbunov, A.S.; Logvinova, L.A.; Dygai, A.M. The role of NO synthase in the cardioprotective effect of substances of humic origin on the model of ischemia and reperfusion of isolated rat heart. Bull. Exp. Biol. Med. 2019, 166, 598–601. [Google Scholar] [CrossRef] [Scilit]
- de Melo, B.A.G.; Motta, F.L.; Santana, M.H.A. Humic acids: Structural properties and multiple functionalities for novel technological developments. Mater. Sci. Eng. C. 2016, 62, 967–974. [Google Scholar] [CrossRef] [Scilit]
- Uyarlar, C.; Rahman, A.; Gultepe, E.E.; Cetingul, İ.S.; Akhtar, M.U.; Bayram, I. Prepartum Dietary Supplementation of Potassium Humate Improves Postpartum Lactation Performance, Metabolic Profile of Multiparous Cows, and Immune Response of Their Calves. Animals 2025, 15, 279. [Google Scholar] [CrossRef] [Scilit]
- Yasar, S.; Gokcimen, A.; Altuntas, I.; Yonden, Z.; Petekkaya, E. Performance and ileal histomorphology of rats treated with humic acid preparations. J. Anim. Physiol. Anim. Nutr. 2002, 86, 257–264. [Google Scholar] [CrossRef] [Scilit]
- Hullár, I.; Vucskits, A.V.; Berta, E.; Andrásofszky, E.; Bersényi, A.; Szabó, J. Effect of fulvic and humic acids on copper and zinc homeostasis in rats. Acta Vet. Hung. 2018, 66, 40–51. [Google Scholar] [CrossRef] [Scilit]
- Kuo, W.T.; Zuo, L.; Odenwald, M.A.; Madha, S.; Singh, G.; Gurniak, C.B.; Abraham, C.; Turner, J.R. The Tight Junction Protein ZO-1 Is Dispensable for Barrier Function but Critical for Effective Mucosal Repair. Gastroenterology 2021, 161, 1924–1939. [Google Scholar] [CrossRef] [Scilit]
- Visscher, C.; Hankel, J.; Nies, A.; Keller, B.; Galvez, E.; Strowig, T.; Keller, C.; Breves, G. Performance, Fermentation Characteristics and Composition of the Microbiome in the Digest of Piglets Kept on a Feed with Humic Acid-Rich Peat. Front. Vet. Sci. 2019, 6, 29. [Google Scholar] [CrossRef] [Scilit]
- Cagin, Y.F.; Sahin, N.; Polat, A.; Erdogan, M.A.; Atayan, Y.; Bilgic, Y.; Seckin, Y.; Colak, C. The Acute Effect of Humic Acid on Iron Accumulation in Rats. Biol. Trace Elem. Res. 2016, 171, 145–155. [Google Scholar] [CrossRef] [Scilit]
- Szabó, J.; Vucskits, A.V.; Berta, E.; Andrásofszky, E.; Bersényi, A.; Hullár, I. Effect of fulvic and humic acids on iron and manganese homeostasis in rats. Acta Vet. Hung. 2017, 65, 66–80. [Google Scholar] [CrossRef] [Scilit]
- Ozturk, E.; Ocak, N.; Coskun, I.; Turhan, S.; Erener, G. Effects of humic substances supplementation provided through drinking water on performance, carcass traits and meat quality of broilers. J. Anim. Physiol. Anim. Nutr. 2010, 94, 78–85. [Google Scholar] [CrossRef] [Scilit]
- Calik, A.; Ceylan, A.; Ekim, B.; Adabi, S.G.; Dilber, F.; Bayraktaroglu, A.G.; Tekinay, T.; Özen, D.; Sacakli, P. The effect of intra-amniotic and posthatch dietary synbiotic administration on the performance, intestinal histomorphology, cecal microbial population, and short-chain fatty acid composition of broiler chickens. Poult. Sci. 2017, 96, 169–183. [Google Scholar] [CrossRef] [Scilit]
- Kisielinski, K.; Willis, S.; Prescher, A.; Klosterhalfen, B.; Schumpelick, V. A simple new method to calculate small intestine absorptive surface in the rat. Clin. Exp. Med. 2002, 2, 131–135. [Google Scholar] [CrossRef] [Scilit]
- Bologna-Molina, R.; Damián-Matsumura, P.; Molina-Frechero, N. An easy cell counting method for immunohistochemistry that does not use an image analysis program. Histopathology 2011, 59, 801–803. [Google Scholar] [CrossRef] [Scilit]
- Livak, K.J.; Schmittgen, T.D. Analysis of relative gene expression data using real-time quantitative PCR and the 2−ΔΔCT method. Methods 2001, 25, 402–408. [Google Scholar] [CrossRef] [Scilit]
- Huang, K.; Walker, C.A. Comparisons of statistical models for growth curves from 90-day rat feeding studies. Arch. Toxicol. 2019, 93, 2397–2408. [Google Scholar] [CrossRef] [Scilit]
- Lacková, Z.; Zigo, F.; Farkašová, Z.; Ondrašovičová, S. The Effect of Humic Substances as an Organic Supplement on the Fattening Performance, Quality of Meat, and Selected Biochemical Parameters of Rabbits. Life 2022, 12, 1016. [Google Scholar] [CrossRef] [Scilit]
- Hudec, E.; Mudroňová, D.; Marcinčák, S.; Bartkovský, M.; Makiš, A.; Faldyna, M.; Ratvaj, M.; Karaffová, V. The effect of Limosilactobacillus fermentum 2i3 and 0.6% addition of humic substances on production parameters and the immune system of broilers. Poult. Sci. 2024, 103, 103884. [Google Scholar] [CrossRef] [Scilit]
- Trofimova, E.S.; Zykova, M.V.; Ligacheva, A.A.; Danilets, M.G.; Sherstoboev, E.Y.; Logvinova, L.A.; Belousov, M.V. Anti-Allergic Properties of Humic Acids Isolated from Pine-Sphagnum-Cotton Sedge Peat. Bull. Exp. Biol. Med. 2022, 172, 324–327. [Google Scholar] [CrossRef] [Scilit]
- Santana, D.A.D.; Rolinski, F.; Trombetta, L.G.; Göhringer, R.M.D.; Kaled, T.X.A.; Santos, C.R.D.; Weber, S.H.; Sotomaior, C.S.; Ollhoff, R.D. Effect of humic acid supplementation on lamb gastrointestinal health and performance. Trop. Anim. Health Prod. 2026, 58, 102. [Google Scholar] [CrossRef] [Scilit]
- DeVries, A.C.; Gerber, J.M.; Richardson, H.N.; Moffatt, C.A.; Demas, G.E.; Taymans, S.E.; Nelson, R.J. Stress affects corticosteroid and immunoglobulin concentrations in male house mice (Mus musculus) and prairie voles (Microtus ochrogaster). Comp. Biochem. Physiol. A Physiol. 1997, 118, 655–663. [Google Scholar] [CrossRef] [Scilit]
- Ríos-Covián, D.; Ruas-Madiedo, P.; Margolles, A.; Gueimonde, M.; de Los Reyes-Gavilán, C.G.; Salazar, N. Intestinal Short Chain Fatty Acids and their Link with Diet and Human Health. Front. Microbiol. 2016, 7, 185. [Google Scholar] [CrossRef] [Scilit]
- Mukhopadhya, I.; Louis, P. Gut microbiota-derived short-chain fatty acids and their role in human health and disease. Nat. Rev. Microbiol. 2025, 23, 635–651. [Google Scholar] [CrossRef] [Scilit]
- Li, C.; Li, X.; Li, P.; Wei, B.; Zhang, C.; Zhu, X.; Zhang, J. Sodium humate alters the intestinal microbiome, short-chain fatty acids, eggshell ultrastructure, and egg performance of old laying hens. Front. Vet. Sci. 2022, 9, 986562. [Google Scholar] [CrossRef] [Scilit]
- LaBouyer, M.; Holtrop, G.; Horgan, G.; Gratz, S.W.; Belenguer, A.; Smith, N.; Walker, A.W.; Duncan, S.H.; Johnstone, A.M.; Louis, P.; et al. Higher total faecal short-chain fatty acid concentrations correlate with increasing proportions of butyrate and decreasing proportions of branched-chain fatty acids across multiple human studies. Gut Microbiome 2022, 3, e2. [Google Scholar] [CrossRef] [Scilit]
- Song, S.; Bai, M.; Ling, Z.; Lin, Y.; Wang, S.; Chen, Y. Intermittent administration of a fasting-mimicking diet reduces intestinal inflammation and promotes repair to ameliorate inflammatory bowel disease in mice. J. Nutr. Biochem. 2021, 96, 108785. [Google Scholar] [CrossRef] [Scilit]
- Zhang, C.; Liu, Y.; Yao, C.; Zhang, J.; Wang, Y.; Liu, J.; Hong, Y.; Mai, K.; Ai, Q. Effects of supplemental fulvic acid on survival, growth performance, digestive ability and immunity of large yellow croaker (Larimichthys crocea) larvae. Front. Physiol. 2023, 14, 1159320. [Google Scholar] [CrossRef] [Scilit]
- Huang, J.; Xu, P.; Shao, M.; Wei, B.; Zhang, C.; Zhang, J. Humic acids alleviate dextran sulfate sodium-induced colitis by positively modulating gut microbiota. Front. Microbiol. 2023, 14, 1147110. [Google Scholar] [CrossRef] [Scilit]

Disclaimer/Publisher’s Note: The statements, opinions and data contained in all publications are solely those of the individual author(s) and contributor(s) and not of MDPI and/or the editor(s). MDPI and/or the editor(s) disclaim responsibility for any injury to people or property resulting from any ideas, methods, instructions or products referred to in the content. |
© 2026 by the authors. Licensee MDPI, Basel, Switzerland. This article is an open access article distributed under the terms and conditions of the Creative Commons Attribution (CC BY) license.