


Abstract
Background/Objectives:Tetrastigma hemsleyanum is a traditional medicinal plant whose tuberous roots are rich in flavonoids and phenolic acids, but how the relative abundance of these constituents changes across growth years remains poorly resolved. Methods: Tuberous roots from five growth years (S1–S5; three independently grown plants per year) were analyzed by UHPLC–Orbitrap-MS-based untargeted metabolomics. Annotations were graded using Metabolomics Standards Initiative (MSI) criteria: of 349 curated entries, 252 were Level 2 and 56 Level 3, and none reached Level 1 because authentic standards were not analyzed. Results: Principal component analysis showed non-linear differentiation, with first-year roots the most distinct. Combined VIP, fold-change, and t-test criteria identified 264 differential entries between adjacent growth years, all remaining significant after Benjamini–Hochberg correction (q < 0.01). Flavonol-related features (e.g., quercetin-related signals, myricetin, and rutin) were relatively abundant at S1; flavone C-glycoside, flavan-3-ol, and phenolic-acid features (e.g., vitexin, catechin, and ferulic acid) at S3; and amino-acid, organic-acid, and nucleotide features at S4. KEGG mapping of 46 differential annotations indicated flavonoid- and amino-acid-related pathways. Conclusions: Given the small sample size, relative peak-area data, and putative annotations, these results are hypothesis-generating; they identify candidate stages and constituents for targeted quantification rather than an optimal harvest year.
1. Introduction
Tetrastigma hemsleyanum Diels et Gilg is a perennial climbing vine of the family Vitaceae, distributed mainly in the region south of the Yangtze River in China. It is a traditional Chinese and ethnomedicinal herb with a long history of use. Although the whole plant can be used medicinally, the tuberous root is the most commonly used part, traditionally applied to clear heat, remove toxins, promote blood circulation, and dispel wind and phlegm, and used in folk medicine for the treatment of high fever and convulsions in children, pneumonia, sore throat, and snakebite [1,2]. Modern pharmacological studies have shown that extracts and active fractions of T. hemsleyanum possess diverse bioactivities, including immunomodulatory, antiviral, antitumor, anti-inflammatory, antioxidant, antipyretic, and hepatoprotective effects, and the herb therefore holds considerable medicinal and economic value [1,3].
In recent years, research on the pharmacology and mechanisms of T. hemsleyanum has advanced considerably. Its polysaccharides have been reported to attenuate severe pneumonia via the TLR4/NF-κB pathway [4], to ameliorate ulcerative colitis and psoriasis-like skin lesions through the SOCS1/JAK2/STAT3 and JAK/STAT3 pathways [5], and to promote ferroptosis and enhance immune function in triple-negative breast cancer when combined with chemotherapeutic agents [6]; network pharmacology analyses have further revealed multi-target features of its extracts against ulcerative colitis [7]. With respect to individual constituents, the total flavonoids of T. hemsleyanum exert antitumor activity by inhibiting regulatory T cells [8], and flavonoids derived from this plant, including kaempferol-3-O-rutinoside, suppress lung adenocarcinoma via autophagy induction and calcium signaling [9,10]. These findings collectively indicate that secondary metabolites such as flavonoids constitute an important material basis for the pharmacological effects of T. hemsleyanum [2].
The active constituents of medicinal plants can be broadly divided into primary and secondary metabolites; the latter, including flavonoids, phenolic acids, terpenoids, and alkaloids, play key roles in adaptation to the environment and defense against biotic and abiotic stresses, and are the major source of the plant’s medicinal components [11,12]. As representative active constituents of T. hemsleyanum, flavonoids are synthesized via the phenylpropanoid–flavonoid biosynthetic pathway: phenylalanine enters phenylpropanoid metabolism through phenylalanine ammonia-lyase (PAL) and related enzymes, and is subsequently converted by downstream enzymes such as chalcone synthase into diverse flavones, flavonols, flavan-3-ols, and their glycosides [13,14,15,16,17]. This highly branched network, finely regulated by transcription factors, phytohormones, and environmental signals, endows plants with rich chemical diversity [18,19,20]. As a major class of plant polyphenols, flavonoids and phenolic acids exhibit strong radical-scavenging and antioxidant capacity owing to their phenolic hydroxyl groups [21]; among them, flavonols such as quercetin and kaempferol display marked antioxidant and antitumor activities [22,23], flavone C-glycosides such as vitexin and flavan-3-ols such as catechin show broad antioxidant, anti-inflammatory, and antitumor activities [24,25], and phenolic acids such as ferulic and caffeic acids are well known for their antioxidant and anti-inflammatory properties [26]. Clarifying the types, contents, and accumulation patterns of such active constituents in T. hemsleyanum tuberous roots is therefore of considerable importance for understanding its pharmacological material basis.
However, T. hemsleyanum has demanding habitat requirements and a low natural reproduction rate, and its wild resources have become increasingly scarce owing to long-term over-harvesting [1]. Although artificial cultivation has relieved some of this pressure, the growth cycle is long, and the quality of the medicinal material differs markedly among production areas and growth years, resulting in large price fluctuations and adulteration [27]. Indeed, growth years markedly influence the accumulation of secondary metabolites in medicinal plants, as demonstrated in many species: metabolite and phenotypic changes across growth years revealed the optimal harvest age of Stellaria dichotoma [28], integrated phenotypic–transcriptomic–metabolomic analysis across harvest periods identified the critical stage for yield and flavonoid accumulation in Astragalus membranaceus [29], and the active constituents of root herbs such as ginseng and Salvia miltiorrhiza also change markedly with cultivation age [30]. The dynamic accumulation of secondary metabolites underpins the quality formation and clinical efficacy of herbal medicines and is a core basis for quality evaluation and rational harvesting [12]. Nevertheless, owing to the relatively short history of large-scale cultivation and limited fundamental research, the accumulation patterns of characteristic active metabolites in T. hemsleyanum tuberous roots over the course of development remain poorly understood, which greatly constrains rational harvesting and standardized production.
Although the pharmacological activities and major constituent classes of T. hemsleyanum are increasingly well documented, the temporal dynamics of its metabolites, including constituent classes with reported bioactivity, across successive growth years remain unresolved. Untargeted metabolomics based on high-resolution mass spectrometry can survey small-molecule variation at high throughput and has become an important tool for medicinal-plant constituent discovery and quality evaluation [31]. Previous metabolomics studies of T. hemsleyanum have focused mainly on geographical-origin discrimination [27] and machine-learning-assisted discovery of potential bioactive markers [32,33]. Developmental research has begun to describe molecular changes associated with tuberous-root formation [34], but systematic information on how annotated metabolite classes change across successive cultivation years is still lacking. This is the specific knowledge gap addressed here. Because software-based database matching can also generate false-positive assignments, annotation confidence must be reported explicitly [31,35].
Accordingly, the present study examined cultivated T. hemsleyanum tuberous roots across five successive growth years using UHPLC–Orbitrap-MS-based untargeted metabolomics with explicit MSI confidence grading. We aimed to describe growth-year-associated changes in the relative abundance of major annotated constituent classes, screen differential features using combined multivariate, fold-change, and univariate criteria, and use KEGG enrichment to provide pathway-level context [36,37]. The study was designed to generate testable hypotheses about developmental metabolic reprogramming and to identify candidate stages and compounds for subsequent targeted quantification and harvest-quality evaluation.
2. Materials and Methods
2.1. Plant Material and Sampling
Tuberous-root samples of T. hemsleyanum were collected from a semi-wild cultivation base under a Moso bamboo forest in Lishui, Zhejiang Province, China; all were of the green-vine type. Based on biological characteristics such as tuber size and color, tuberous roots at successive developmental stages under the same cultivation environment were divided into five consecutive growth years, designated S1, S2, S3, S4, and S5 (corresponding to 1-, 2-, 3-, 4-, and 5-year-old roots, respectively). Because the classes were assigned from tuber characteristics of plants grown in the same stand, they represent successive developmental stages corresponding to approximate cultivation ages. For each growth-year class, tuberous roots were collected from three independently grown plants and treated as three biological replicates (n = 3; 15 samples in total). The tuberous roots collected from each plant were processed as one biological sample, and no material was pooled across plants. The number of replicates was limited by the number of plants of each growth-year class available within the semi-wild stand and by the destructive harvesting required for this perennial species. Three biological replicates per group are frequently used in exploratory plant metabolomics, and the study was therefore designed as an exploratory survey rather than a statistically powered comparison (see Section 4). Variability among plants within each growth year is reported in Section 3.1, and sample-level peak areas are provided in Supplementary_Data.xlsx (Candidate_399). After removal of surface soil and rinsing with deionized water, each biological sample was freeze-dried, ground, and passed through a 100-mesh sieve separately, then stored at −80 °C until analysis.
2.2. Chemicals and Instruments
Sample pretreatment used a refrigerated centrifuge (Centrifuge 5804 R, Eppendorf, Hamburg, Germany), an electronic balance (AR224CN, OHAUS, Changzhou, China), a multifunctional grinder (Model 800C, Yongkang Lingsheng, Yongkang, China), and a vertical freeze-dryer (FDU-1200, TOKYO RIKAKIKAI, Tokyo, Japan). Chromatographic-grade methanol and acetonitrile were purchased from Fisher Scientific (Waltham, MA, USA); chromatographic-grade formic acid (~98%) from Sigma-Aldrich (St. Louis, MO, USA); and deionized water (18.2 MΩ) was prepared with a Milli-Q Advantage A10 system (Millipore, Burlington, MA, USA).
2.3. Sample Preparation
A 50 mg portion of lyophilized powder from each biological sample was accurately weighed into a centrifuge tube, and 1.2 mL of methanol/water (70:30, v/v) was added. The mixture was vortexed for 30 s every 30 min for a total of six times (total extraction time 3 h), then centrifuged at 10,000 r/min for 10 min. The supernatant was filtered through a 0.22 μm organic nylon membrane. The resulting solvent-to-sample ratio was 24 mL g−1 (1:24, w/v), which allows the powder to be fully immersed and is within the range commonly used for plant metabolomics. Aqueous 70% methanol was selected because it is widely used to extract polar and semi-polar plant metabolites, including flavonoid glycosides, phenolic acids, amino acids, and organic acids, in a single step [21,31]. Extraction efficiency was not assessed by repeated (exhaustive) extraction. Because the same sample mass, solvent volume, extraction time, and procedure were applied to every sample, the data are used for relative comparisons among growth years rather than for absolute quantification. The three biological samples in each growth-year group were extracted separately using the same procedure. Quality-control (QC) samples were prepared by pooling equal aliquots of all sample extracts to evaluate method reproducibility and instrument response drift.
2.4. UHPLC–MS Conditions
Chromatographic separation was performed on a Vanquish ultra-high-performance liquid chromatography system (Thermo Fisher Scientific, Waltham, MA, USA) and an LC3600N NanoLC (Anhui Wanyi, Hefei, China) using an Acclaim RSLC 120 C18 column (2.2 µm, 2.1 mm × 100 mm, Thermo Scientific, Waltham, MA, USA). Mobile phase A was 0.1% formic acid in water, and mobile phase B was 0.1% formic acid in acetonitrile. The gradient was as follows: 0 min, 5% B; 0–6 min, 30% B; 6–10 min, 95% B; 10–12 min, 95% B; 12–12.1 min, 5% B, followed by column re-equilibration at 5% B before the next injection. The flow rate was 0.35 mL/min, the column temperature 30 °C, and the injection volume 5 µL. Detection was performed on an Orbitrap Exploris 240 mass spectrometer (Thermo Fisher, USA) equipped with a heated electrospray ionization (H-ESI) source. Positive- and negative-ion data were acquired and processed separately. Spray voltages were 3500 V (positive) and 3000 V (negative); sheath, auxiliary, and sweep gas flows were 40, 10, and 0 Arb, respectively; the ion transfer tube and vaporizer temperatures were 320 °C and 350 °C, respectively. Data-dependent acquisition (DDA) was used, with a full-scan Orbitrap resolution of 120,000 over m/z 100–1500; the six most intense precursor ions (threshold 5 × 10⁴ counts) were subjected to MS/MS by stepped higher-energy collisional dissociation (HCD; normalized collision energies of 30%, 50%, and 70%) at a resolution of 15,000, with real-time mass calibration by the EASY-IC internal standard.
2.5. Quality Assurance and Quality Control
All sample pretreatment was carried out in parallel following the same procedure. The analytical sequence began with three solvent blanks to assess background contamination, followed by four QC injections to equilibrate the LC–MS system; thereafter, one QC injection was inserted after every six real samples, and the sequence ended with three QC injections, with one blank following each QC to monitor carryover. The overlap of the total ion chromatograms (TICs) of QC samples in both ionization modes and their clustering in the PCA score plot were used to evaluate the overall stability and reliability of the analysis. The analytical run was accepted when two criteria were met [38]: (i) the TICs of all QC injections overlapped in both ionization modes, without visible retention-time drift or loss of signal intensity; and (ii) the QC injections clustered tightly in a PCA score plot that included all samples. Feature-level RSD values across the QC injections were not part of the archived processing output and were not used as a filtering criterion. The coefficients of variation reported in Section 3.1 are therefore calculated among the three plants of each growth year; they describe variability among biological replicates and are not QC-based precision estimates.
2.6. Data Processing and Metabolite Annotation
Raw data (.raw) were processed following standard untargeted metabolomics workflows [38,39] in Compound Discoverer 3.3 (Thermo Fisher Scientific, Waltham, MA, USA), with positive and negative modes processed separately. Key parameters were as follows: mass error ≤ 5 ppm, signal-to-noise threshold 3, and maximum retention-time shift 0.1 min. Annotation and deduplication were performed by matching against online and offline MS1/MS2 databases including mzCloud, mzVault, ChemSpider, and MassList. Under MSI terminology, Level 1 identification requires concordant accurate mass, retention time, and MS/MS spectra with an authentic reference standard analyzed under the same conditions; no annotation in this study met Level 1 because authentic compound standards were not analyzed. Library-supported probable structure annotations were assigned to Level 2 and subdivided for curation as high-confidence Level 2 (mzCloud MS/MS score ≥ 70, or ≥ 50 with a supporting mzVault full match) and probable Level 2 (mzCloud score 50–70, or 30–70 with mzVault support). Weak spectral similarity without sufficient library support was assigned to Level 3 (tentative structure or class), whereas entries lacking a defensible structural assignment were assigned to Level 4/unidentified. Database placeholder identifiers and biologically implausible matches were removed from structure-level interpretation or retained only as unidentified entries. The archived Compound Discoverer compound exports contained 399 database candidate-annotation rows after software processing (254 positive-mode and 145 negative-mode rows); these exports do not preserve a complete count of all initial ion features before software filtering and should not be interpreted as that count. Manual curation and mode-wise deduplication yielded 349 annotation entries: 215 POS, 106 NEG, and 28 merged NEG + POS entries. The confidence distribution was 189 high-confidence Level 2, 63 probable Level 2, 56 Level 3, 40 Level 4/unidentified, and one requiring further review. Processed tables are provided in the separate supplementary workbook, Supplementary_Data.xlsx. The complete archived 15-sample peak-area matrix is reported for the 399 software candidate rows. Each curated entry and each row of the statistical matrix is linked to its source candidate row(s), so that every reported differential entry can be traced to its sample-level peak areas (Supplementary_Data.xlsx: Curated_349, Differential_349, and Dedup_Audit).
Feature filtering, annotation, and deduplication followed explicit rules. Feature detection and alignment in Compound Discoverer used the settings given above. The archived exports contain only features with a database candidate annotation. Rows carrying database placeholder identifiers (NP-xxxxxx; 49 rows) and one biologically implausible match (6-acetylmorphine) were excluded from statistical analysis, leaving a statistical matrix of 349 feature rows (225 POS and 124 NEG; Differential_349). Rows that shared an annotation within one ionization mode (e.g., different adducts or retention times) were kept as separate rows in this matrix but were collapsed into one entry in the curated annotation list (17 entries). Across ionization modes, features with the same annotation and molecular formula were combined into one NEG + POS curated entry (28 entries). This deduplication was based on annotation name and formula without a retention-time tolerance. The ions and retention times of all 45 collapsed or merged entries are therefore listed in the Dedup_Audit sheet, and the 16 entries whose member features differed by more than 0.5 min are flagged as possible isomers or in-source fragments and are not interpreted as single compounds. Differential results were counted by ionization mode and annotation name (Section 2.7).
2.7. Statistical Analysis and Pathway Enrichment
For multivariate analysis, the peak areas of the 349-row statistical matrix were normalized to the total peak area of each sample, log2-transformed, and scaled to unit variance. Principal component analysis (PCA) was used to examine overall differences among samples, and orthogonal partial least squares discriminant analysis (OPLS-DA) was used as an exploratory visualization of adjacent growth-year separation. The original OPLS-DA models were assessed with 200 random permutation tests. Because each adjacent comparison contained only six samples, a separate one-component partial least squares discriminant analysis (PLS-DA) sensitivity analysis used leave-one-sample-out cross-validation and exhaustive enumeration of all 20 unique balanced class labelings; exact permutation probabilities were calculated from the observed and permuted cross-validated statistics. This separate PLS-DA analysis was used to examine the stability of supervised separation and was not treated as direct validation of the original OPLS-DA models. Differential entries were defined by variable importance in projection (VIP) > 1 from the OPLS-DA model, |log2 fold change| > 1, and p < 0.05 from a two-sided Student’s t-test (equal variances). In this workflow, fold changes (ratio of group means) and t-tests were calculated from untransformed peak areas; every archived fold change and p value can be reproduced from the sample-level data linked in Differential_349. VIP values are archived to two decimal places. The reported total of 264 was obtained by pooling entries marked significant across the four adjacent-year comparisons and deduplicating by ionization mode and compound name. To account for multiple testing, p values were adjusted with the Benjamini–Hochberg (BH) procedure within each adjacent comparison (349 tests per comparison), and BH-adjusted q values are reported alongside the nominal p values. As a sensitivity analysis, the t-test and fold change were recalculated on total-area-normalized, log2-transformed data, retaining the archived VIP values and requiring q < 0.05 and |log2 fold change| > 1. Differential annotations were classified by reference to databases such as HMDB and PubChem [40]. For 21 key annotations discussed in the Results and Discussion, PubChem identifiers and ChEBI cross-references were used for a targeted Reactome cross-check. An exact cross-map required agreement of the reference identifier; broad name hits and ionization-state or stereochemical variants were recorded separately. Database-coverage or nomenclature limitations and MSI-level annotation uncertainty were reported independently in Supplementary_Data.xlsx. This targeted cross-check was descriptive and was not used for a new enrichment analysis. Class-specific hierarchical clustering heatmaps were drawn using group-level z-scores (Ward linkage). KEGG pathway enrichment was performed by over-representation analysis. Differential annotations were mapped to KEGG compound identifiers only when the annotation corresponded unambiguously to a single KEGG compound; tentative structures, unresolved isomers, and glycosides without an exact KEGG entry were left unmapped rather than assigned to related compounds, and each KEGG identifier was counted once regardless of how many ionization modes or comparisons supported it. Nineteen candidate pathways of plant secondary metabolism, amino acid metabolism, and energy metabolism were tested. The query set comprised the 38 unique differential KEGG identifiers present in these pathways, and the background set comprised the 945 unique KEGG compounds annotated to the 19 pathways. Enrichment was evaluated with a one-sided hypergeometric test and BH correction across the 19 pathways. Because this background is not restricted to compounds detectable with the present platform, enrichment p values may be anti-conservative. PCA, OPLS-DA, differential screening, clustering, and enrichment were implemented in Python 3 workflows.
3. Results
3.1. Data Quality and Method Reliability
The overlaid total ion chromatograms of QC samples in both positive and negative modes showed highly consistent retention times and peak areas, indicating stable instrument response. QC samples clustered tightly in the PCA score plot that included the QC injections, so both acceptance criteria in Section 2.5 were met. Biological variability was evaluated separately. Among the three independently grown plants within each growth year, the median coefficients of variation (CVs) of the 399 candidate rows were 5.4% (S1), 5.1% (S2), 3.9% (S3), 4.6% (S4), and 4.8% (S5), and 1.5–4.3% of rows had CVs > 20% (Candidate_399). These among-plant CVs combine biological and analytical variation for plants from a single cultivation stand; they are not QC precision values and do not estimate variability across different stands or sites.
3.2. Global Metabolic Differentiation Among the Five Growth Years
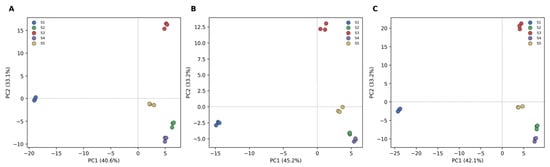
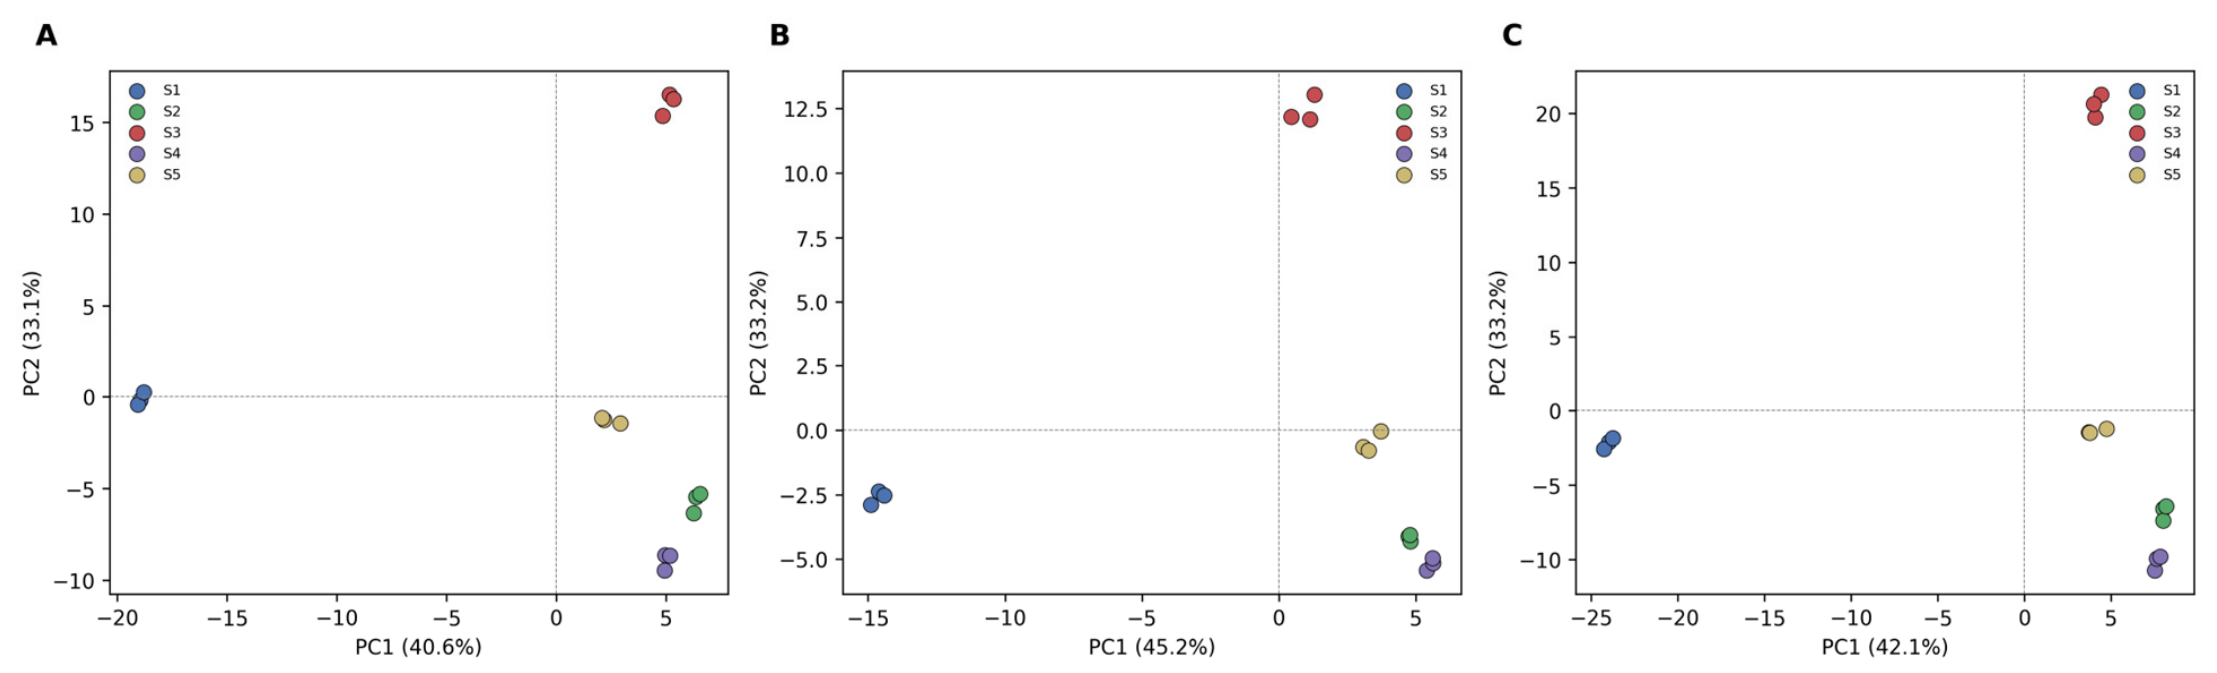
PCA, an unsupervised multivariate method, reflects the overall similarity and differences of annotation profiles among samples. As shown in Figure 1, tuberous-root samples of the five growth years exhibited a clear separation trend in the score plots, with each class forming a relatively independent cluster and the three biological replicates within each group closely grouped. In the combined positive-and-negative-mode analysis, the first and second principal components accounted for 42.1% and 33.2% of the variance, respectively (cumulative 75.3%); the corresponding values were 40.6% and 33.1% in positive mode and 45.2% and 33.2% in negative mode. Notably, the distribution of samples in the principal-component space was not a monotonic progression with growth year—first-year (S1) samples were the most distinct and clearly separated from the other classes, indicating that an annotation profile markedly different from later stages is already established early in tuber development. These results indicate non-linear changes in the detected chemical profile across successive growth years. Because each group comprised only three plants from one cultivation stand, this separation describes the sampled plants; it does not show that growth-year groups would separate equally well in other populations, and the tight within-group clustering partly reflects the low among-plant variability in this stand.
Figure 1.
Principal component analysis (PCA) score plots of metabolite annotation profiles in T. hemsleyanum tuberous roots across five growth years. (A) Positive ion mode; (B) negative ion mode; (C) combined positive and negative modes. S1–S5 denote five successive growth years; each point represents one biological replicate from an independently grown plant.
3.3. Supervised Discriminant Analysis and Model Validation
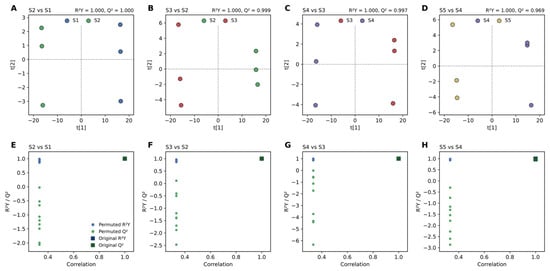
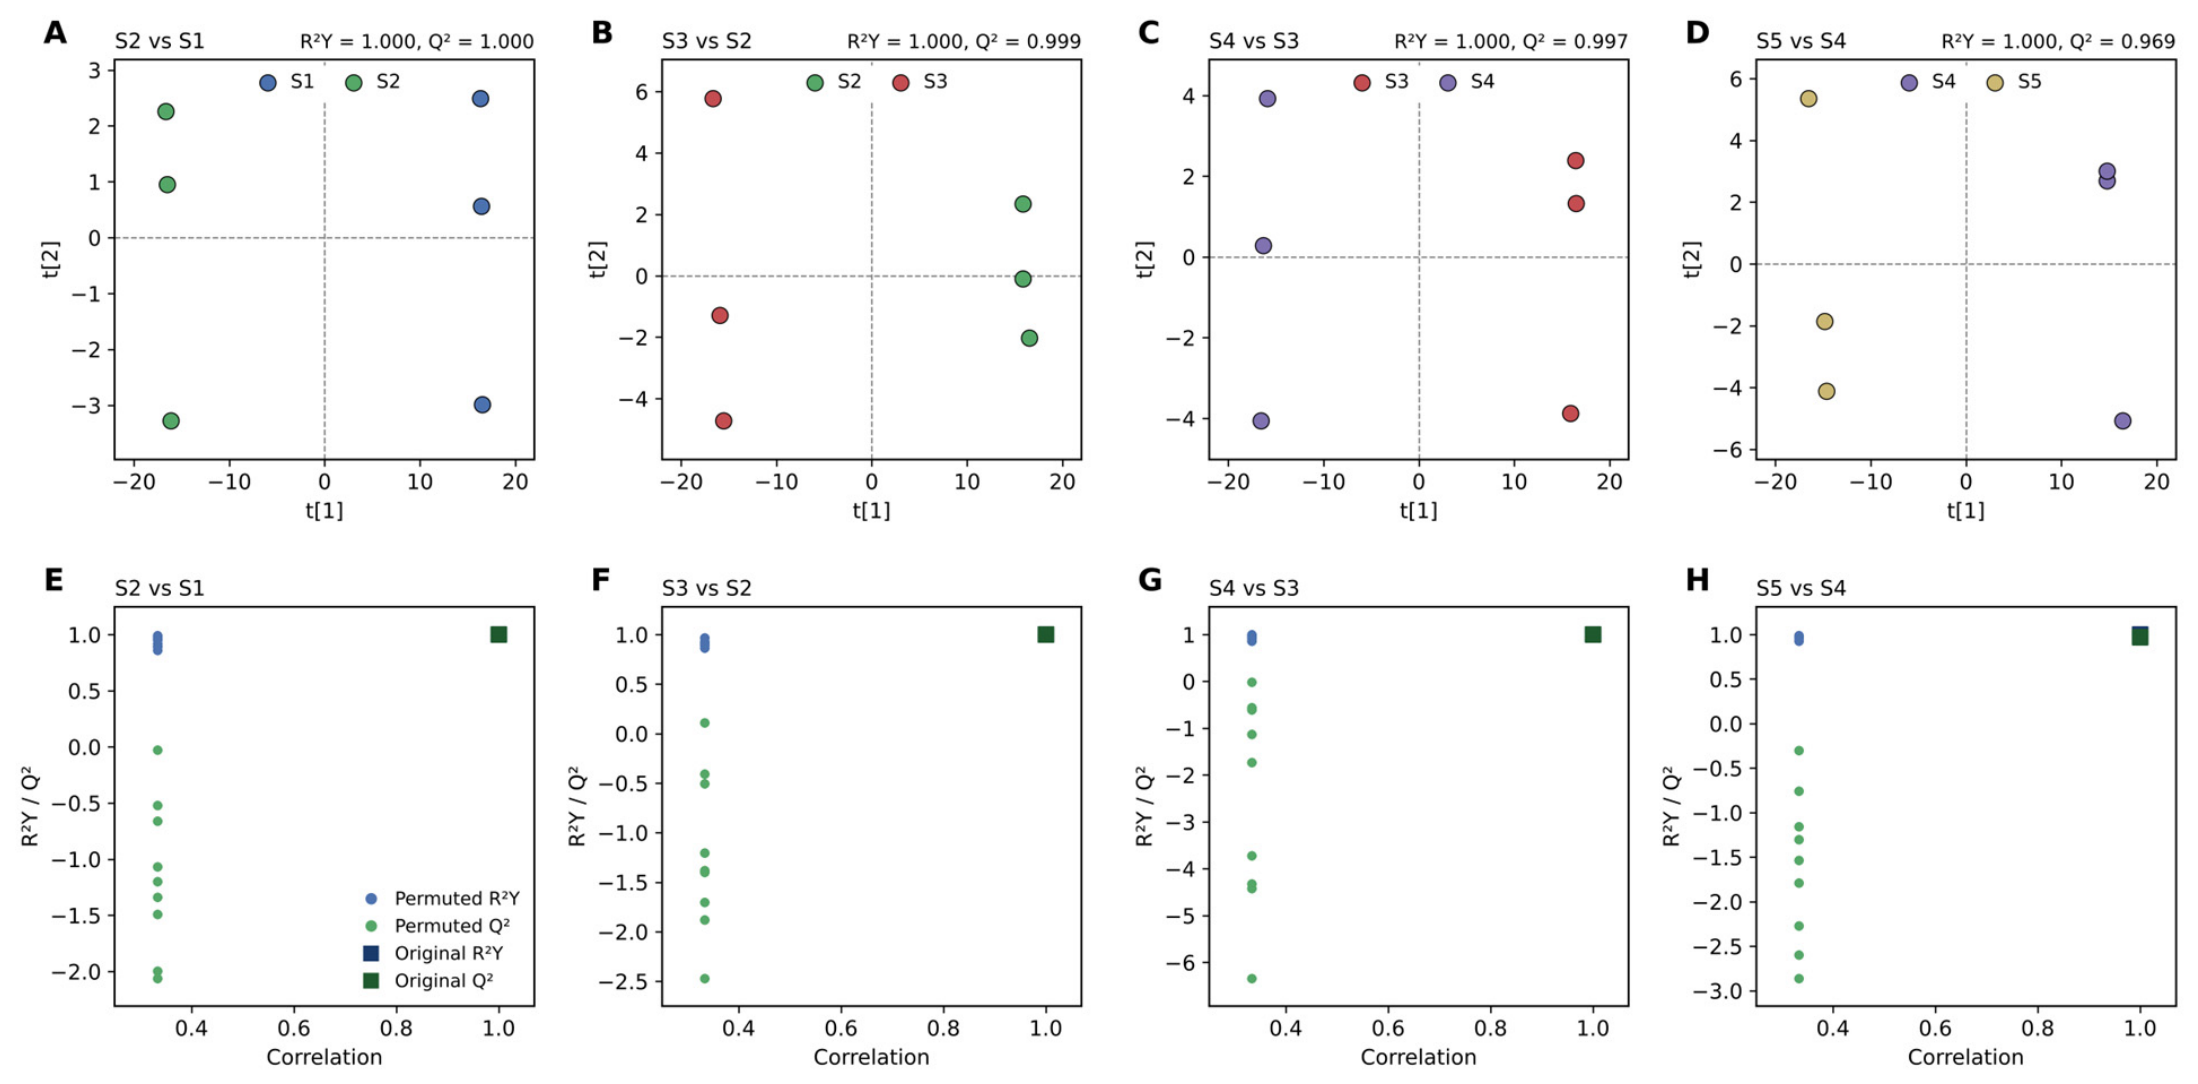
OPLS-DA models were constructed for adjacent growth years (S2 vs. S1, S3 vs. S2, S4 vs. S3, and S5 vs. S4; Figure 2) to visualize supervised group separation. Adjacent growth years separated in the score plots, and the original models had R2X values of 0.942, 0.921, 0.934, and 0.856, R2Y = 1.000 for all comparisons, and Q2 values of 1.000, 0.999, 0.997, and 0.969, respectively. In the separate one-component PLS-DA sensitivity analysis, leave-one-sample-out classification accuracy was 1.00 for all four comparisons, and cross-validated Q2 values were 0.999, 0.998, 0.995, and 0.974. However, only 20 unique balanced labelings are possible for six samples, and exhaustive exact permutation testing of this sensitivity model gave p = 0.10 for both accuracy and Q2 in every comparison. These results do not directly validate the original OPLS-DA models. Rather, together with the small sample size, they show that the near-perfect OPLS-DA R2Y/Q2 values may reflect overfitting and do not establish predictive generalizability. The OPLS-DA results are therefore interpreted only as exploratory descriptions of separation. Accordingly, VIP values from these models were used only as one of three screening criteria, and the univariate part of the screening was additionally checked by FDR control (Section 3.5).
Figure 2.
OPLS-DA score plots (A–D) and corresponding 200-permutation diagnostics (E–H) for adjacent growth years of T. hemsleyanum tuberous roots: S2 vs. S1, S3 vs. S2, S4 vs. S3, and S5 vs. S4 (from left to right). In the permutation panels, blue and green points denote permuted R2Y and Q2, respectively, and the filled squares denote the original model. These panels are internal model diagnostics; no external validation set was available.
3.4. Metabolite Profiling and Classification
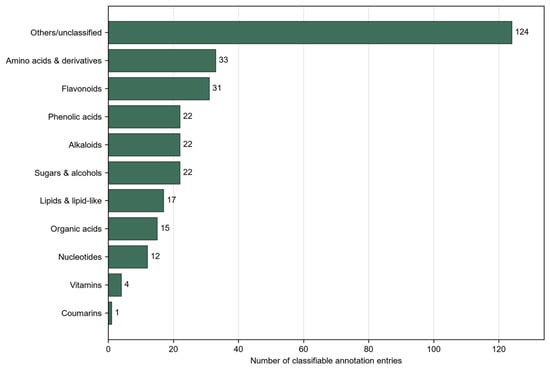
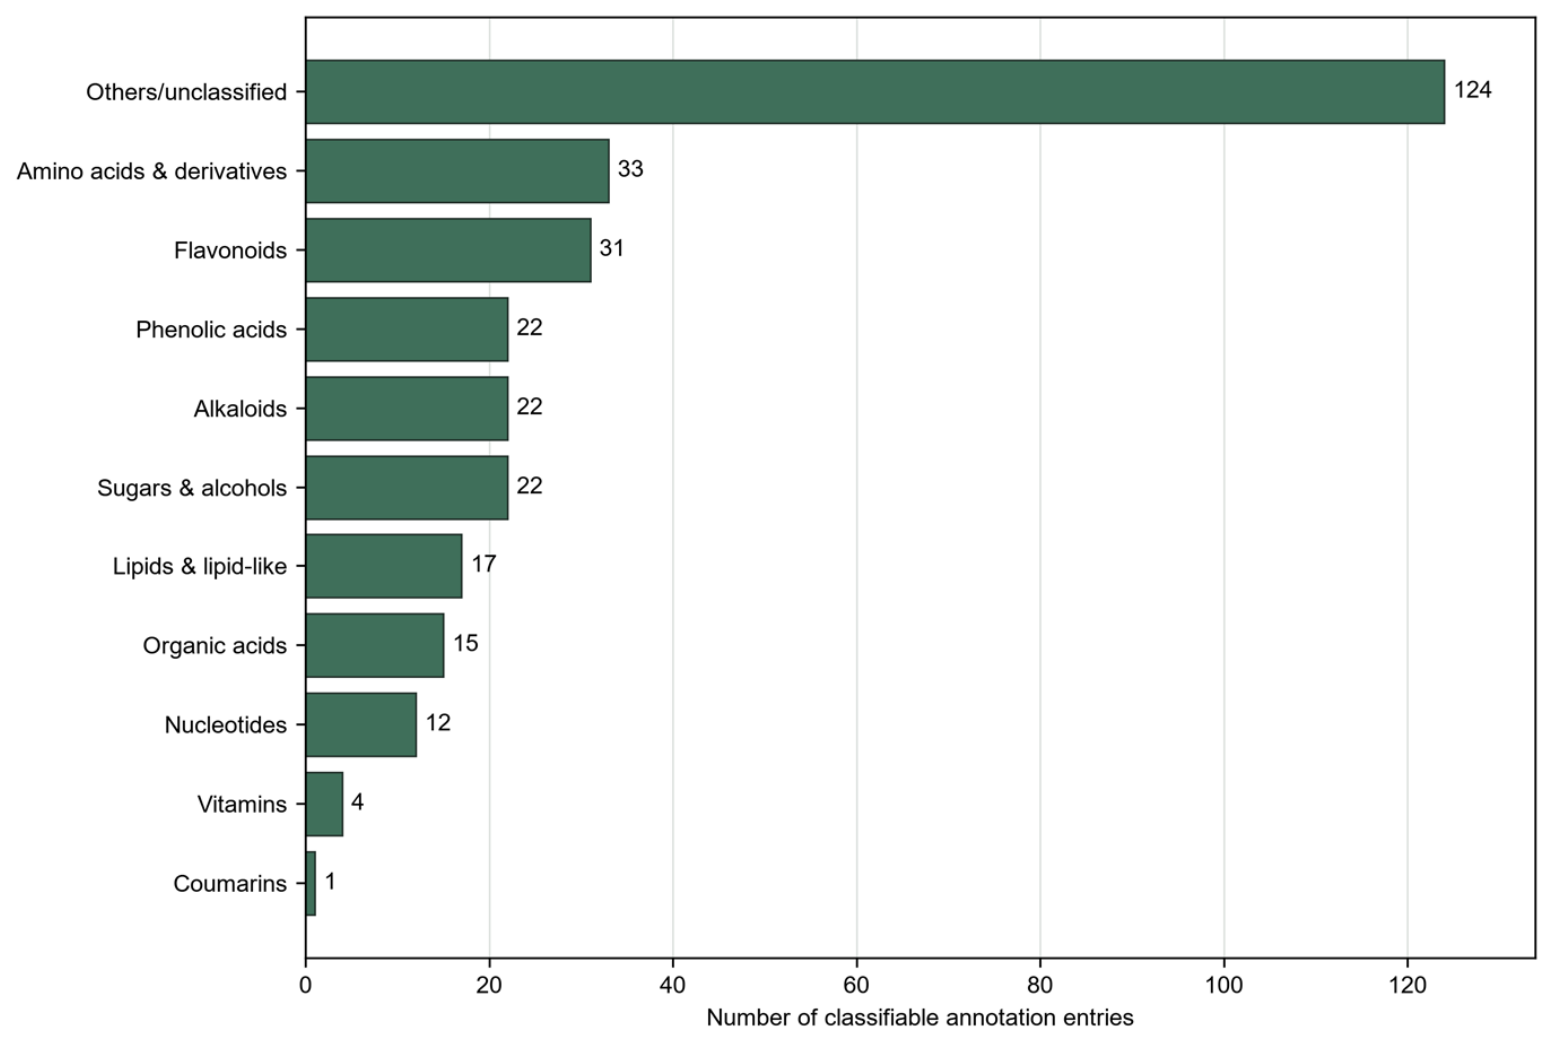
The archived Compound Discoverer exports contained 399 database candidate-annotation rows (254 positive-mode and 145 negative-mode rows) after software processing. Following manual confidence grading, plausibility review, and mode-wise deduplication, 349 curated annotation entries remained: 215 POS, 106 NEG, and 28 merged NEG + POS entries. Their confidence distribution was 252 Level 2 (189 high-confidence and 63 probable), 56 Level 3, 40 Level 4/unidentified, and one requiring further review; none was confirmed at MSI Level 1. The full processed count chain and supporting tables are provided in the separate supplementary workbook, Supplementary_Data.xlsx. Of the 349 entries, 303 had a structurally plausible annotation and could be assigned to a chemical class for descriptive classification (Figure 3). The major classes included amino acids and derivatives (33), flavonoids (31), alkaloids (22), sugars and alcohols (22), phenolic acids (22), lipids and lipid-like molecules (17), organic acids (15), nucleotides and derivatives (12), and vitamins (four). These counts distinguish software-exported candidate rows, curated annotations, and classifiable annotations, and the named compounds below are interpreted according to their reported MSI confidence rather than as confirmed identities. Annotation evidence for the 21 compounds named in the Results and Discussion (formula, ions, retention times, mass errors, spectral-match scores, and MSI level) is summarized in Table 1. This evidence was also checked for retention-time consistency, which revealed problems for several flavonol aglycone annotations. Both positive-mode kaempferol features (5.86 and 7.68 min) and the positive-mode isorhamnetin feature (6.43 min) co-eluted exactly with glycosides of the same aglycone, and the positive- and negative-mode quercetin features differed by 2.34 min. These signals may therefore partly arise from in-source fragmentation of glycosides or from isomers, and they are referred to below as aglycone-related signals.
Figure 3.
Classification of the 303 curated annotation entries retained for descriptive class-level analysis in T. hemsleyanum tuberous roots. Bars indicate the number of classifiable annotation entries in each category.
Table 1.
Annotation evidence for the 21 compounds discussed by name.
3.5. Screening of Stage-Specific Differential Annotation Entries
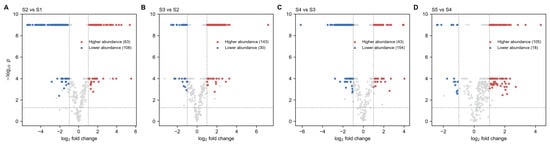
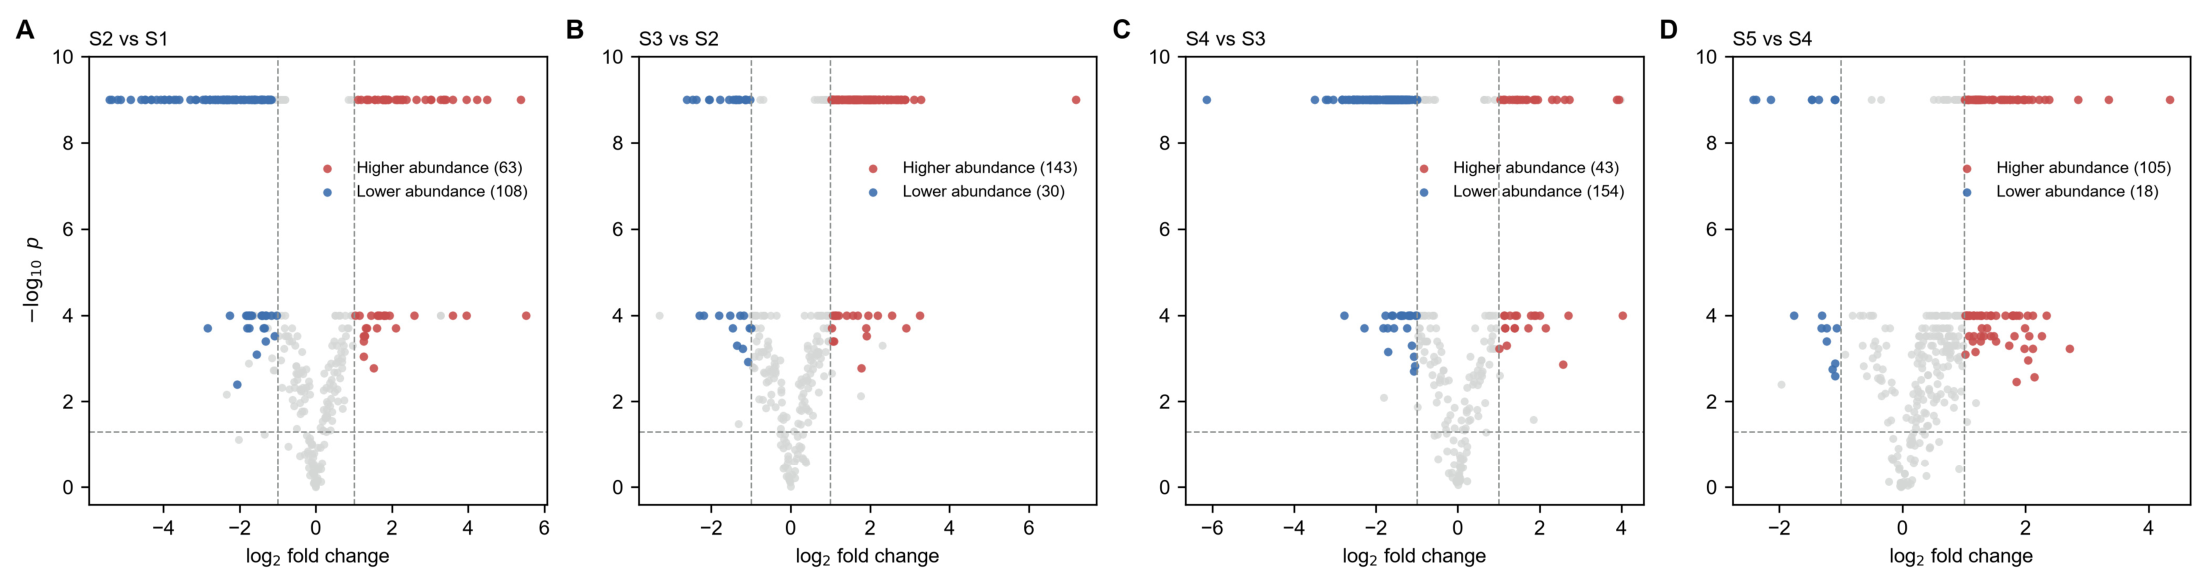
Annotation entries were classified as differential using the combined criteria VIP > 1, |log2 fold change| > 1, and p < 0.05. The results were visualized as volcano plots (Figure 4). Compared with S1, S2 showed 63 higher-abundance and 108 lower-abundance entries (171 in total); S3 vs. S2 showed 143 higher- and 30 lower-abundance entries (173); S4 vs. S3 showed 43 higher- and 154 lower-abundance entries (197); and S5 vs. S4 showed 105 higher- and 18 lower-abundance entries (123). Pooling the final significance calls across these comparisons and deduplicating by ionization mode and compound name yielded 264 reported differential annotation entries. Recalculation from the sample-level data reproduced all archived fold changes and p values; two calls whose archived VIP was displayed as 1.00 could not be re-verified at two-decimal precision and were retained as originally called. After BH correction within each comparison (349 tests), all 664 comparison-level calls (171, 173, 197, and 123) remained significant at q < 0.01 (maximum q = 5.5 × 10⁻³; the largest nominal p among called entries was 4.0 × 10⁻³). Joint BH correction across all four comparisons (1396 tests) gave the same result (maximum q = 5.2 × 10⁻³), so the reported total of 264 entries was unchanged under FDR control (q values in Differential_349). Because no entry meeting the VIP and fold-change thresholds failed the p criterion, the number of differential entries was determined by the VIP and fold-change thresholds. In the sensitivity analysis on total-area-normalized, log2-transformed data, 243 of the 264 entries (92.0%) still met q < 0.05 and |log2 fold change| > 1 in at least one adjacent comparison; the remaining 21 entries, whose classification depends on the data scale, are flagged in Differential_349. The volcano plots indicated stage-associated fluctuations, with the largest number of lower-abundance entries at the S3-to-S4 transition. FDR control does not compensate for the small number of biological replicates: with n = 3, variance estimates and effect sizes are imprecise, and the very small p values partly reflect the low among-plant variability within a single stand. These entries are therefore interpreted as exploratory candidates rather than definitive biomarkers.
Figure 4.
Volcano plots of differential annotation entries between adjacent growth years of T. hemsleyanum tuberous roots: (A) S2 vs. S1; (B) S3 vs. S2; (C) S4 vs. S3; (D) S5 vs. S4. Red and blue points denote entries with higher and lower relative abundance, respectively, in the later growth stage, as classified using VIP > 1, |log2 FC| > 1, and p < 0.05 (two-sided Student’s t-test); all classified entries also had BH-adjusted q < 0.01.
3.6. Growth-Year-Associated Relative-Abundance Patterns of Major Annotated Constituent Classes
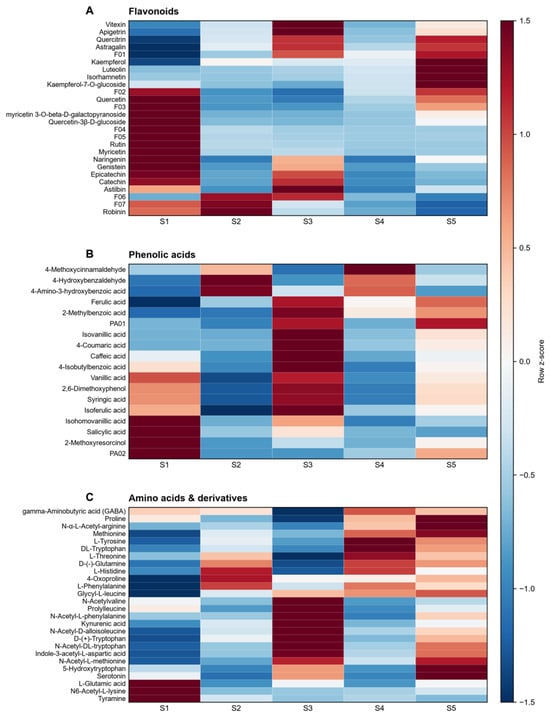
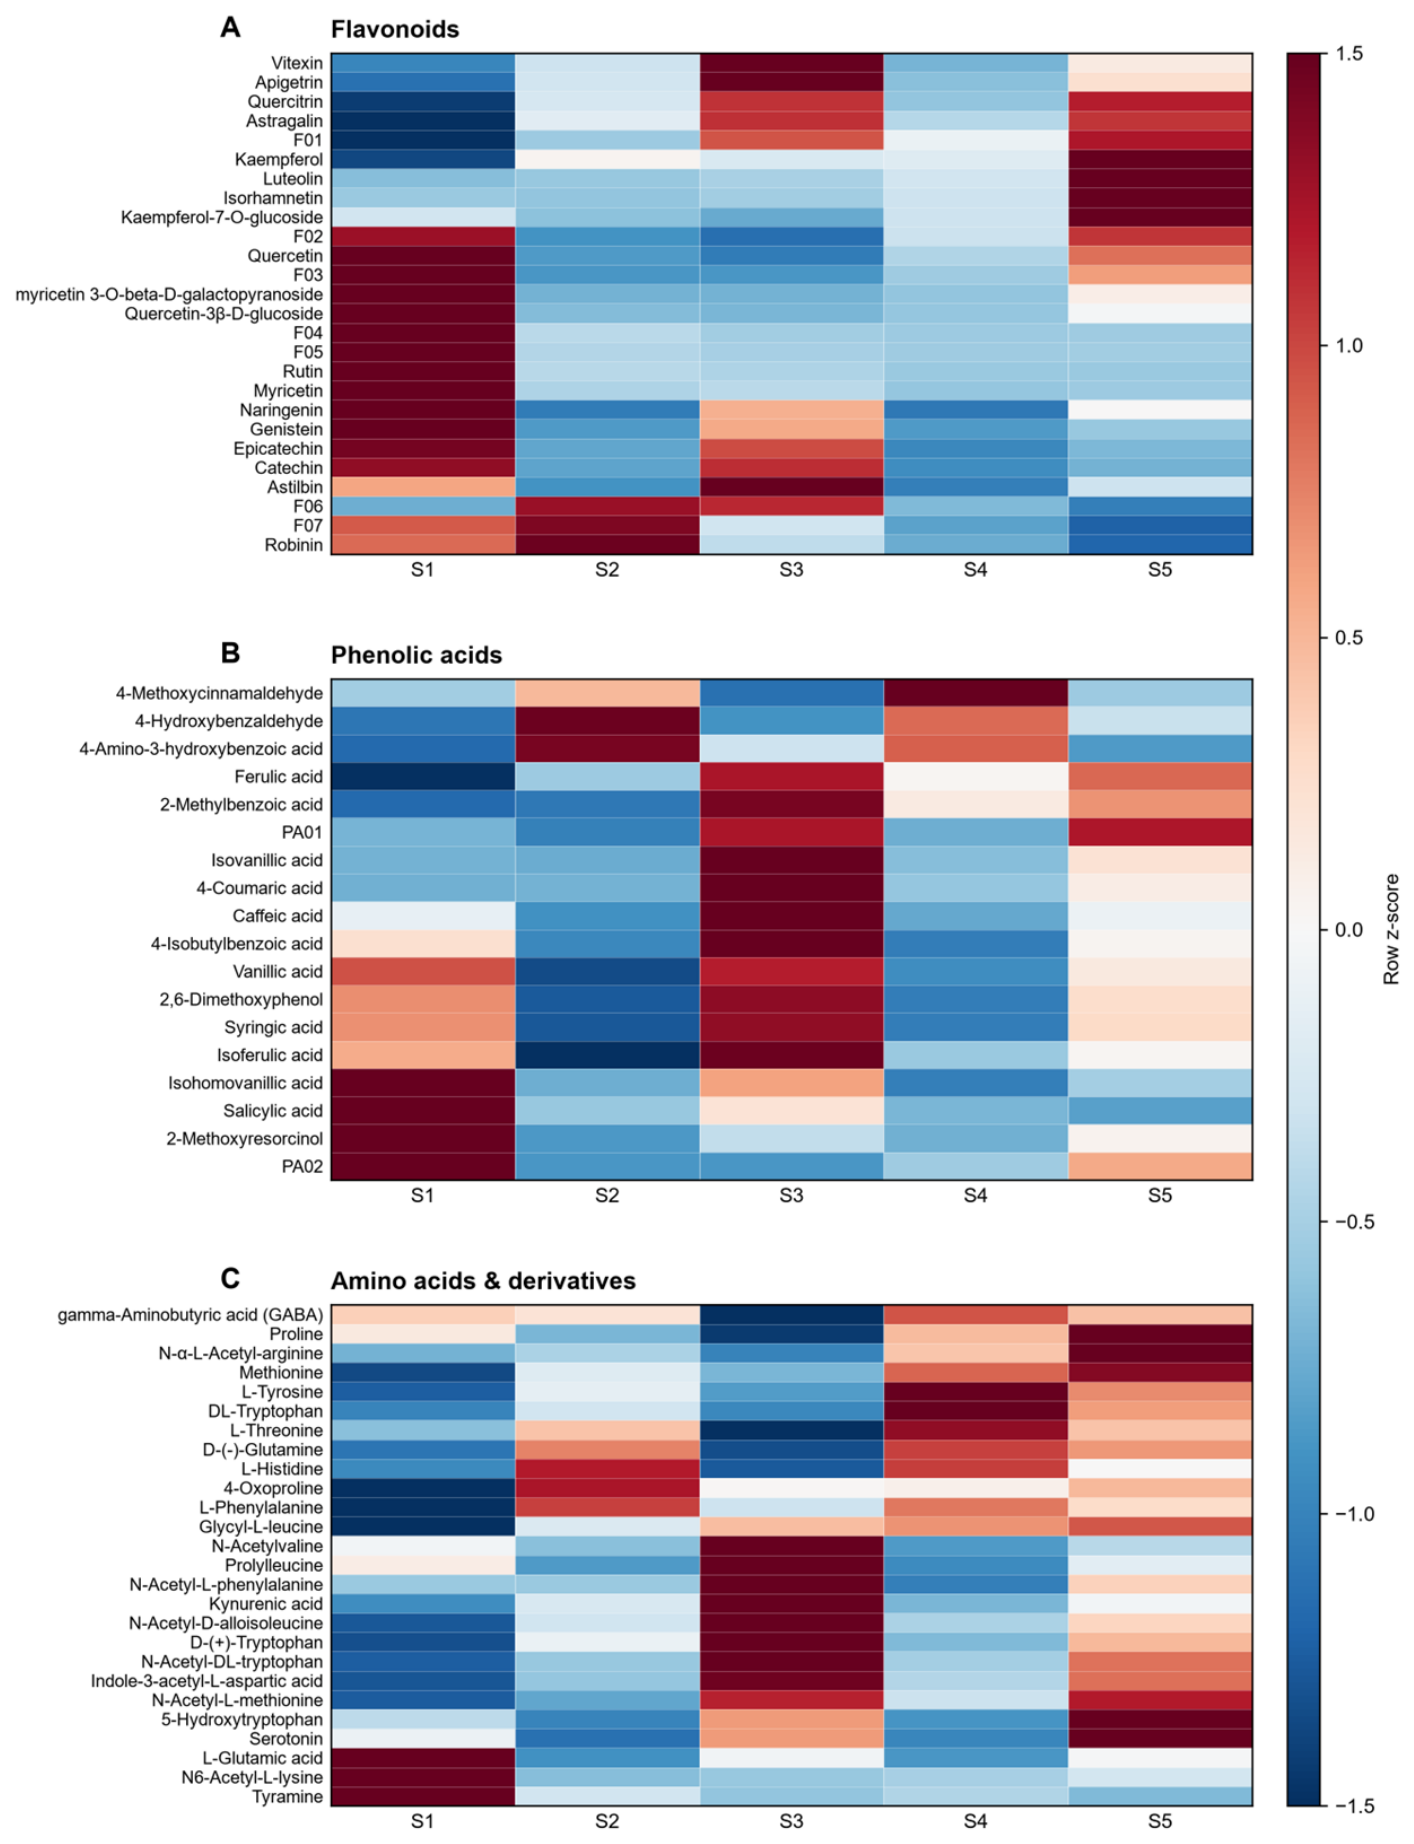
To describe changes in relative abundance across growth years, hierarchical clustering was performed for differential annotations in the major classes (Figure 5). Flavonoid-related annotations showed a bimodal pattern. Features putatively annotated as quercetin glycosides, myricetin, isorhamnetin, and rutin were relatively highest in first-year (S1) roots. In third-year (S3) roots, features assigned to flavone C-glycosides such as vitexin and apigetrin and to flavan-3-ols such as catechin, epicatechin, and epigallocatechin were enriched; features assigned to luteolin, kaempferol, and kaempferol-7-O-glucoside were relatively higher in fifth-year (S5) roots. Phenolic-acid features putatively annotated as ferulic acid, syringic acid, and 2,6-dimethoxyphenol were generally highest at S3, whereas a feature assigned to salicylic acid was higher at S1. These names represent probable or tentative spectral annotations, not standard-confirmed compounds, and the patterns describe relative peak areas rather than absolute contents. Quercetin-, isorhamnetin-, and kaempferol-related signals include the retention-time inconsistencies noted in Section 3.4 and Table 1.
Figure 5.
Hierarchical clustering heatmaps of representative differential annotation entries across the five growth years of T. hemsleyanum tuberous roots: (A) flavonoids; (B) phenolic acids; (C) amino acids and derivatives. Colors indicate group-mean row z-scores. Complete annotations corresponding to abbreviated display labels are listed in the Figure5_Label_Key sheet of Supplementary_Data.xlsx.
Amino-acid-related annotations peaked relatively later: features assigned to kynurenic acid and tryptophan derivatives were enriched at S3; features putatively annotated as methionine, tyrosine, threonine, and proline peaked at S4; and serotonin- and 5-hydroxytryptophan-related features were higher at S5, whereas features assigned to γ-aminobutyric acid (GABA), histidine, and phenylalanine were relatively higher at S2. Organic-acid annotations mostly showed higher relative abundance in the middle-to-late stages, with features assigned to succinate, gluconate, and cis-aconitate peaking at S4. Lipid-related annotations were enriched mainly at S2, including features assigned to several fatty acid ethanolamides; a jasmonic-acid-related signal was higher at S3, and features assigned to 13-HOTrE and 12-oxo-phytodienoic acid were relatively enriched at S5. Sugar and alcohol annotations, including several putative iridoid glucosides, mostly peaked at S3, whereas a sucrose annotation was higher at S4; nucleotide-related annotations were mainly enriched at S4. Overall, the dataset showed stage- and class-associated patterns: S1 was relatively rich in flavonol-related annotations, S3 showed co-enrichment of several secondary-metabolite classes, and S4 showed increased amino-acid-, organic-acid-, and nucleotide-related annotations.
3.7. KEGG Pathway Enrichment Analysis
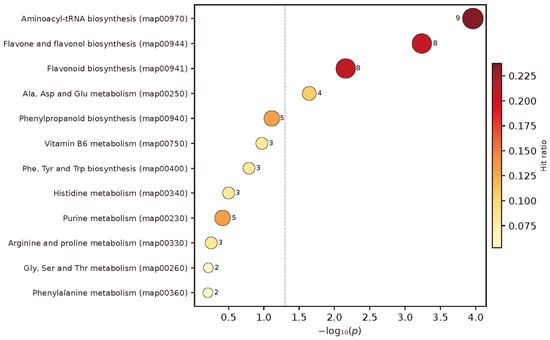
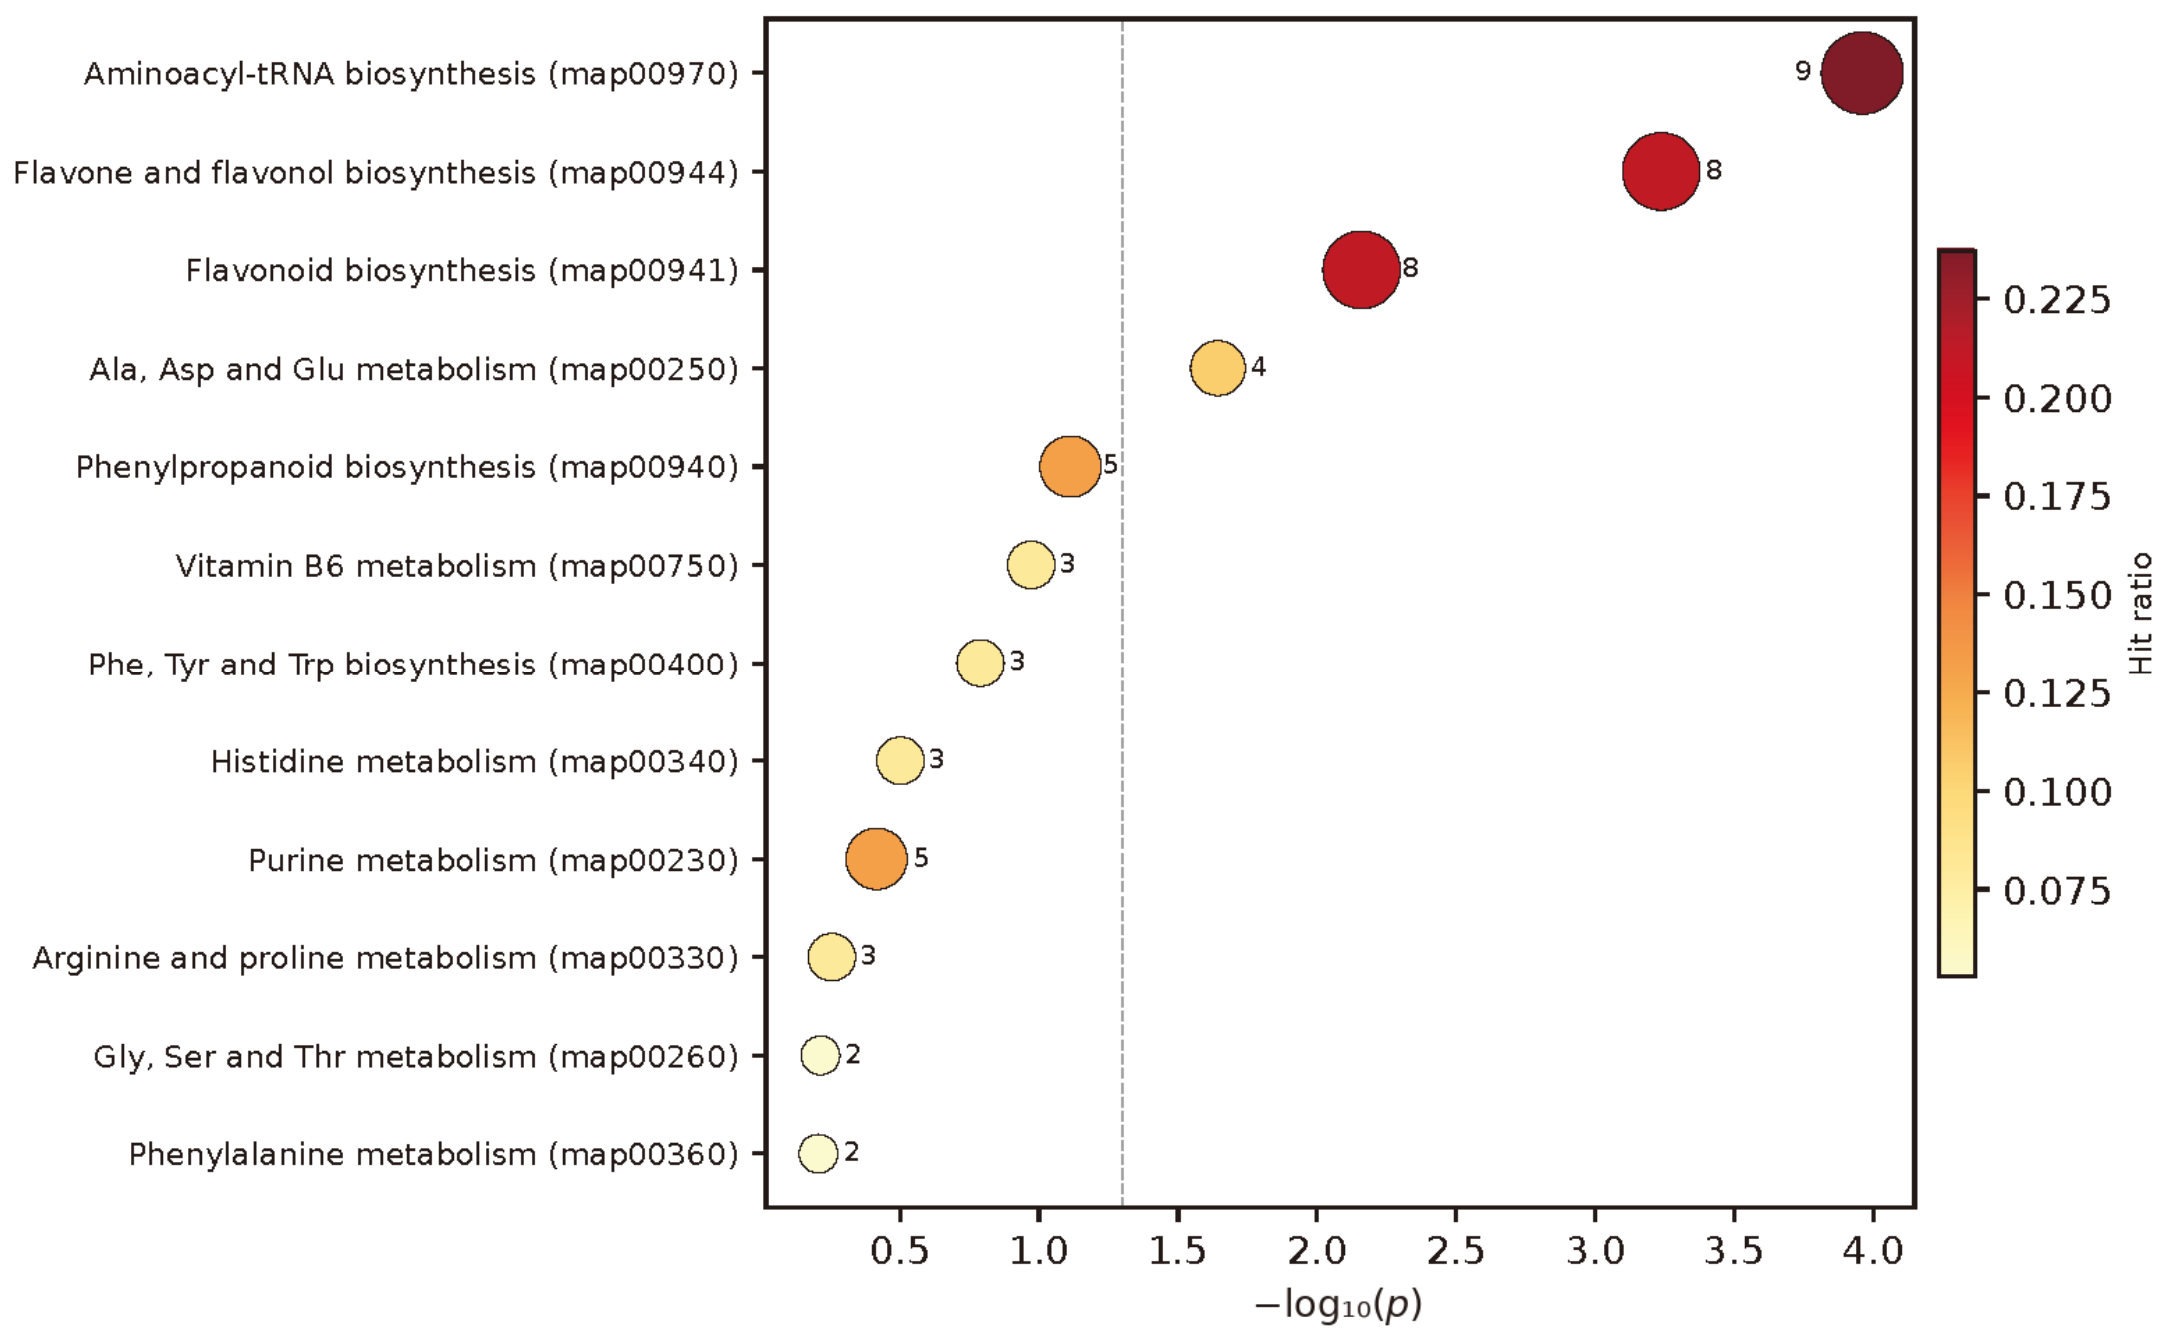
Of the 264 reported differential annotation entries, 46 could be linked to KEGG compound identifiers and 38 fell within the tested candidate pathways. This limited coverage resulted from the stringent annotation curation and the restricted exact name-to-KEGG mapping of tentative structures, isomers, and glycosides. A targeted identifier-supported Reactome cross-check of 21 key annotations found one exact reference-molecule match (sucrose). Quercetin, methionine, proline, serotonin, and 5-hydroxytryptophan returned only related ion-form or stereochemically more specific records, while the other queried annotations had no exact ChEBI-consistent Reactome record. The CrossMap_21 sheet of Supplementary_Data.xlsx reports database-coverage and nomenclature limitations separately from the MSI Level 2 uncertainty of the annotations. The cross-check was not used for new enrichment or mechanistic inference. Pathway enrichment was therefore used to provide pathway-level context rather than comprehensive metabolome coverage (Figure 6, Table 2). In addition, the background set comprised all compounds of the tested pathways rather than only detectable compounds, which may inflate enrichment significance, and the flavonoid-related hits include quercetin- and kaempferol-related signals with the retention-time uncertainty described in Section 3.4. Among the mapped subset, aminoacyl-tRNA biosynthesis (nine hits, p = 1.1 × 10⁻⁴, FDR = 2.1 × 10⁻³), flavone and flavonol biosynthesis (eight hits, p = 5.8 × 10⁻⁴, FDR = 5.5 × 10⁻³), and flavonoid biosynthesis (eight hits, p = 6.9 × 10⁻³, FDR = 4.4 × 10⁻²) met FDR < 0.05; alanine, aspartate and glutamate metabolism, phenylpropanoid biosynthesis, and vitamin B6 metabolism showed enrichment trends. These results are consistent with, but do not comprehensively represent, the stage-associated flavonoid- and amino-acid-related patterns observed in the clustering analysis.
Figure 6.
KEGG pathway enrichment of mapped differential annotation entries among growth years of T. hemsleyanum tuberous roots. Bubble size denotes the number of hits and color the hit ratio (hits divided by the 38 query identifiers); the dashed line corresponds to p = 0.05.
Table 2.
KEGG pathways enriched with mapped differential annotation entries (top entries).
4. Discussion
Using UHPLC–Orbitrap-MS-based untargeted metabolomics, this study described stage-associated variation in T. hemsleyanum tuberous-root annotation profiles across five growth years. PCA showed non-linear differentiation, with S1 the most distinct. The OPLS-DA score plots also separated adjacent groups, but the near-perfect model statistics must be interpreted in the context of three biological replicates per group and the non-significant exact permutation result from the separate one-component PLS-DA sensitivity analysis (P = 0.10); they support exploratory visualization rather than predictive generalization. The observed non-linear profiles are broadly consistent with time-dependent changes reported for other medicinal root crops [28,29,30] and with developmentally regulated allocation between primary and secondary metabolism [18]. In the following discussion, differences in the relative abundance of annotated classes among growth years are direct observations, whereas physiological explanations are proposed as hypotheses that the present data do not test.
Among the annotated constituent classes, flavonoid-related features showed the clearest bimodal pattern. S1 roots were relatively enriched in features putatively annotated as flavonols and their glycosides, including quercetin-related features, myricetin, isorhamnetin, and rutin (some quercetin- and isorhamnetin-related signals may include in-source fragments of glycosides; Table 1). Flavonols participate in plant responses to light, UV, and oxidative stress and are synthesized through the phenylpropanoid–flavonoid pathway under enzymatic and transcriptional regulation [13,14,17]; these compound classes also include constituents with reported antioxidant and antitumor activities [22,23,41]. Their relative enrichment in young roots may be compatible with greater protective demand during early development [11], although this physiological link was not directly tested here. By S3, features assigned to flavone C-glycosides such as vitexin and apigetrin and to flavan-3-ols such as catechin, epicatechin, and epigallocatechin were enriched. These classes have recognized chemical stability or radical-scavenging properties [25] and [24], respectively, and T. hemsleyanum flavonoid fractions or constituents have shown pharmacological activities in previous studies [8,9,19]. The KEGG enrichment of flavone/flavonol and flavonoid biosynthesis is therefore consistent with remodeling of this annotated chemical class across growth years [19], while the exact compound identities still require authentic-standard confirmation.
Features putatively annotated as phenolic acids, including ferulic- and syringic-acid-related signals, were also relatively abundant at S3. Phenolic acids and flavonoids share upstream phenylpropanoid precursors [16,42], so their parallel trends are compatible with coordinated changes in phenylpropanoid-related metabolism. Because phenolic-acid classes include constituents with antioxidant and anti-inflammatory activities [26], the S3 pattern identifies a candidate developmental stage for targeted quantitative validation, but it does not by itself demonstrate superior medicinal quality.
In contrast, amino-acid-, organic-acid-, and nucleotide-related annotations were relatively enriched later, mainly at S4. A developmental study of T. hemsleyanum associated tuberous-root formation with reduced lignification, enhanced starch and sucrose metabolism, downregulated phenylpropanoid/flavonoid-related metabolism, and changes in IAA, GA, ABA, and JA signaling [34]. In that context, the shift from early flavonoid-related profiles toward later primary-metabolite-related profiles may reflect developmental changes in carbon allocation, tissue expansion, and maturation, although this was not tested here. The enrichment of aminoacyl-tRNA biosynthesis and trends in alanine, aspartate and glutamate metabolism are consistent with, but do not demonstrate, altered nitrogen and energy metabolism [36]. Features assigned to GABA were relatively higher at S2; GABA connects stress signaling with carbon metabolism through the GABA shunt [43,44,45]. Features assigned to N-acylethanolamines were also enriched at S2, consistent with the broad developmental and stress-signaling roles reported for this lipid class [46,47], whereas jasmonate- and oxylipin-related annotations at S3/S5 may be relevant to developmental defense and secondary-metabolism signaling [48]. These mechanistic links remain hypotheses because transcript, enzyme, hormone, and flux measurements were not included in the present study.
The relative peak patterns can help prioritize growth stages for subsequent constituent-specific validation. For example, S1 may warrant targeted measurement of flavonol-related compounds, whereas S3 may warrant targeted measurement of flavone C-glycosides, flavan-3-ols, and phenolic acids. However, the present study did not measure tuber weight, biomass yield, absolute compound concentrations, or pharmacological activity. It therefore cannot establish an optimal harvest year or demonstrate that one stage has superior overall medicinal quality. Studies that integrate metabolomics with phenotypic and yield measurements illustrate the type of evidence required for harvest recommendations [28,29]. Accordingly, our results are framed as candidate stage–constituent relationships for future targeted quantification together with biomass, yield, and quality metrics. No harvest-year recommendation is made in this study.
Methodologically, this study re-examined Compound Discoverer candidate assignments using explicit MSI confidence grading and plausibility review. Spectral-library annotation without co-analyzed authentic standards remains susceptible to false-positive or isomeric assignments, and reporting confidence levels improves transparency [31,35]. None of the present annotations reached MSI Level 1. The 252 Level 2 entries are probable structure annotations supported by library MS/MS evidence, the 56 Level 3 entries are tentative structure or class annotations, and the Level 4/unidentified entries are not used for compound-specific interpretation. Accordingly, compound-specific results are described as curated annotation entries, probable or tentative annotations, or features assigned to particular structures, rather than as standard-confirmed identities. In addition, cross-mode deduplication was name-based, and the retention-time check identified aglycone-related signals that may derive from glycosides (Section 3.4; Dedup_Audit). The compounds in Table 1, particularly the flavonol aglycones, are therefore priorities for confirmation with authentic standards and targeted MS/MS.
This study has several limitations. First, samples were obtained from a single cultivation base, and seasonal variation was not examined; geographic, cultivation-environment, and seasonal generalizability therefore remains unknown. Growth-year classes were assigned from tuber characteristics rather than from individual planting records and were not replicated across stands. Second, untargeted peak areas are relative, semi-quantitative measures affected by ionization efficiency and matrix effects; they are not absolute concentrations, and exhaustive extraction efficiency was not determined. Authentic standards are required to confirm identities and quantify key constituents. Third, although the biological replicates were collected from independently grown plants, only three were analyzed per growth year. In this small, high-dimensional setting, near-perfect supervised separation is vulnerable to overfitting. A separate one-component PLS-DA sensitivity analysis showed complete leave-one-sample-out separation, but exhaustive balanced-label permutation testing gave p = 0.10; this analysis does not directly validate the original OPLS-DA models, and no external validation set was available. The low sample size also limits univariate power, increases uncertainty in effect estimates, and may yield both missed and unstable differential candidates. Accordingly, the OPLS-DA and differential annotations are interpreted as exploratory and require validation with larger, independently sampled cohorts. Fourth, metabolite identities remain uncertain: no annotation reached MSI Level 1, cross-mode deduplication was name-based, and some aglycone-related signals may be in-source fragments or isomers. Fifth, KEGG enrichment relied on 38 mapped identifiers and a pathway-based background, so it covers only part of the detected metabolome. Finally, tuber weight, yield, absolute constituent contents, and bioactivity were not measured, preventing a direct harvest-timing recommendation.
5. Conclusions
Using UHPLC–Orbitrap-MS-based untargeted metabolomics with MSI confidence grading, this study described stage-associated annotation patterns in T. hemsleyanum tuberous roots across five growth years. The curated dataset contained 349 annotation entries: 252 Level 2, 56 Level 3, 40 Level 4/unidentified, and one requiring review; none was confirmed at MSI Level 1. The 264 reported differential annotation entries, all of which remained significant after Benjamini–Hochberg correction, suggested relatively greater flavonol-related signals at S1, flavone-C-glycoside-, flavan-3-ol-, and phenolic-acid-related signals at S3, and amino-acid-, organic-acid-, and nucleotide-related signals at S4. KEGG mapping of 46 differential annotations provided limited pathway-level context involving flavonoid and amino acid metabolism. Given n = 3, the non-significant exact permutation result from the separate sensitivity analysis, and incomplete pathway coverage, these results should be treated as hypothesis-generating. They identify candidate developmental stages and constituent classes for future authentic-standard confirmation, targeted quantification, and integration with biomass, yield, and pharmacological-quality metrics, rather than establishing a definitive optimal harvest year.
Supplementary Materials
The following supporting information can be downloaded at: https://www.mdpi.com/article/10.3390/metabo16110831/s1, Supplementary_Data.xlsx: Candidate_399, archived database candidate annotations with the 15-sample peak-area matrix; Curated_349, curated annotation entries; Differential_349, differential statistics linked to sample-level data, with Benjamini–Hochberg-adjusted q values; Dedup_Audit, deduplication audit; Classes_303, chemical class assignments; KEGG_Enrichment, KEGG pathway enrichment output; Key_Annotations_21, annotation evidence for the 21 key compounds; CrossMap_21, targeted Reactome cross-mapping; Figure5_Label_Key, full annotations for the abbreviated labels in Figure 5.
Author Contributions
Conceptualization, M.Y., Y.L., and Y.Z.; methodology, B.L. and X.L.; formal analysis, B.L. and X.L.; investigation, M.Y., H.H., Y.B., and Z.C.; data curation, B.L. and X.L.; validation, H.H.; writing—original draft preparation, M.Y.; writing—review and editing, Y.L. and Y.Z.; supervision, Y.Z.; funding acquisition, Y.Z. All authors have read and agreed to the published version of the manuscript.
Funding
This research was funded by the National Key R&D Program of China, grant number 2023YFF0713900.
Institutional Review Board Statement
Not applicable.
Informed Consent Statement
Not applicable.
Data Availability Statement
The processed annotation, sample-level peak-area, differential-statistics, KEGG-enrichment, and targeted cross-mapping tables are provided in the separate supplementary workbook, Supplementary_Data.xlsx. The raw LC–MS data (.raw files for all samples, pooled-QC, and blank injections in both ionization modes) will be deposited in the MetaboLights repository (EMBL-EBI), and the accession number will be added to this statement before publication. Until then, the raw data are available from the corresponding author upon request.
Acknowledgments
The authors thank the staff of the cultivation base for assistance with sampling. We also thank Ming Ding of the Public Experimental Platform, Research Institute of Subtropical Forestry, Chinese Academy of Forestry, for providing the UHPLC–Orbitrap-MS instrumentation (Vanquish UHPLC system and Orbitrap Exploris 240 mass spectrometer) used for metabolite analysis in this study. During the preparation of this work, the authors used AI-assisted tools for language polishing; the authors reviewed and edited the content and take full responsibility for the content of the publication.
Conflicts of Interest
The authors declare no conflicts of interest.
References
- Ji, T.; Ji, W.W.; Wang, J.; Chen, H.J.; Peng, X.; Cheng, K.J.; Qiu, D.; Yang, W.J. A comprehensive review on traditional uses, chemical compositions, pharmacology properties and toxicology of Tetrastigma hemsleyanum. J. Ethnopharmacol. 2021, 264, 113247. [Google Scholar] [CrossRef] [Scilit] [PubMed]
- Zhu, R.; Xu, X.; Ying, J.; Cao, G.; Wu, X. The Phytochemistry, Pharmacology, and Quality Control of Tetrastigma hemsleyanum Diels & Gilg in China: A Review. Front. Pharmacol. 2020, 11, 550497. [Google Scholar] [CrossRef] [Scilit] [PubMed]
- Liu, C. At the national development strategic height, understanding the magazine responsibilities and capabilities. Chin. Herb. Med. 2022, 14, 1–2. [Google Scholar] [CrossRef] [Scilit] [PubMed]
- Zhou, F.; Guo, Y.; Li, W.; Hu, Y.; Yang, L.; Fu, S.; Bao, X.; Tong, H.; Ye, Y.; Ding, Z. Tetrastigma hemsleyanum polysaccharide protects against “two-hit” induced severe pneumonia via TLR4/NF-κB signaling pathway. Int. J. Biol. Macromol. 2025, 303, 140639. [Google Scholar] [CrossRef] [Scilit] [PubMed]
- Bao, X.; Tang, Y.; Lv, Y.; Fu, S.; Yang, L.; Chen, Y.; Zhou, M.; Zhu, B.; Ding, Z.; Zhou, F. Tetrastigma hemsleyanum polysaccharide ameliorated ulcerative colitis by remodeling intestinal mucosal barrier function via regulating the SOCS1/JAK2/STAT3 pathway. Int. Immunopharmacol. 2024, 137, 112404. [Google Scholar] [CrossRef] [Scilit] [PubMed]
- Shang, Y.; Zhao, M.; Chen, S.; Chen, Y.; Liu, X.; Zhou, F.; Li, Y.; Long, M.; Xu, K.; Ding, Z.; et al. Tetrastigma hemsleyanum polysaccharide combined with doxorubicin promote ferroptosis and immune function in triple-negative breast cancer. Int. J. Biol. Macromol. 2024, 275, 133424. [Google Scholar] [CrossRef] [Scilit] [PubMed]
- Zhang, Q.; Feng, T.; Chang, Q.; Yang, D.; Li, Y.; Shang, Y.; Gao, W.; Zhao, J.; Li, X.; Ma, L.; et al. Exploring the potential active components and mechanisms of Tetrastigma hemsleyanum against ulcerative colitis based on network pharmacology in LPS-induced RAW264.7 cells. J. Ethnopharmacol. 2025, 342, 119384. [Google Scholar] [CrossRef] [Scilit] [PubMed]
- Feng, Z.; Hao, W.; Lin, X.; Fan, D.; Zhou, J. Antitumor activity of total flavonoids from Tetrastigma hemsleyanum Diels et Gilg is associated with the inhibition of regulatory T cells in mice. OncoTargets Ther. 2014, 7, 947–956. [Google Scholar] [CrossRef] [Scilit] [PubMed][Green Version]
- Li, Y.; Feng, X.; Zhang, Y.; Wang, Y.; Yu, X.; Jia, R.; Yu, T.; Zheng, X.; Chu, Q. Dietary flavone from the Tetrastigma hemsleyanum vine triggers human lung adenocarcinoma apoptosis via autophagy. Food Funct. 2020, 11, 9776–9788. [Google Scholar] [CrossRef] [Scilit] [PubMed]
- Li, Y.; Yu, X.; Wang, Y.; Zheng, X.; Chu, Q. Kaempferol-3-O-rutinoside, a flavone derived from Tetrastigma hemsleyanum, suppresses lung adenocarcinoma via the calcium signaling pathway. Food Funct. 2021, 12, 8351–8365. [Google Scholar] [CrossRef] [Scilit] [PubMed]
- Isah, T. Stress and defense responses in plant secondary metabolites production. Biol. Res. 2019, 52, 39. [Google Scholar] [CrossRef] [Scilit] [PubMed]
- Liu, X.; Luo, J. Research progress of plant metabolomics technology. Sci. Technol. Rev. 2015, 33, 33–38. [Google Scholar]
- Mao, Y.; Luo, J.; Cai, Z. Biosynthesis and Regulatory Mechanisms of Plant Flavonoids: A Review. Plants 2025, 14, 1847. [Google Scholar] [CrossRef] [Scilit] [PubMed]
- Nabavi, S.M.; Samec, D.; Tomczyk, M.; Milella, L.; Russo, D.; Habtemariam, S.; Suntar, I.; Rastrelli, L.; Daglia, M.; Xiao, J.; et al. Flavonoid biosynthetic pathways in plants: Versatile targets for metabolic engineering. Biotechnol. Adv. 2020, 38, 107316. [Google Scholar] [CrossRef] [Scilit] [PubMed]
- Saito, K.; Yonekura-Sakakibara, K.; Nakabayashi, R.; Higashi, Y.; Yamazaki, M.; Tohge, T.; Fernie, A.R. The flavonoid biosynthetic pathway in Arabidopsis: Structural and genetic diversity. Plant Physiol. Biochem. 2013, 72, 21–34. [Google Scholar] [CrossRef] [Scilit] [PubMed]
- Vogt, T. Phenylpropanoid biosynthesis. Mol. Plant 2010, 3, 2–20. [Google Scholar] [CrossRef] [Scilit] [PubMed]
- Winkel-Shirley, B. Flavonoid biosynthesis. A colorful model for genetics, biochemistry, cell biology, and biotechnology. Plant Physiol. 2001, 126, 485–493. [Google Scholar] [CrossRef] [Scilit] [PubMed]
- Fang, C.; Fernie, A.R.; Luo, J. Exploring the Diversity of Plant Metabolism. Trends Plant Sci. 2019, 24, 83–98. [Google Scholar] [CrossRef] [Scilit] [PubMed]
- Liu, W.; Feng, Y.; Yu, S.; Fan, Z.; Li, X.; Li, J.; Yin, H. The Flavonoid Biosynthesis Network in Plants. Int. J. Mol. Sci. 2021, 22, 12824. [Google Scholar] [CrossRef] [Scilit] [PubMed]
- Panche, A.N.; Diwan, A.D.; Chandra, S.R. Flavonoids: An overview. J. Nutr. Sci. 2016, 5, e47. [Google Scholar] [CrossRef] [Scilit] [PubMed]
- Dai, J.; Mumper, R.J. Plant phenolics: Extraction, analysis and their antioxidant and anticancer properties. Molecules 2010, 15, 7313–7352. [Google Scholar] [CrossRef] [Scilit] [PubMed]
- Calderon-Montano, J.M.; Burgos-Moron, E.; Perez-Guerrero, C.; Lopez-Lazaro, M. A review on the dietary flavonoid kaempferol. Mini-Rev. Med. Chem. 2011, 11, 298–344. [Google Scholar] [CrossRef] [Scilit] [PubMed]
- Li, Y.; Yao, J.; Han, C.; Yang, J.; Chaudhry, M.T.; Wang, S.; Liu, H.; Yin, Y. Quercetin, Inflammation and Immunity. Nutrients 2016, 8, 167. [Google Scholar] [CrossRef] [Scilit] [PubMed]
- Bernatoniene, J.; Kopustinskiene, D.M. The Role of Catechins in Cellular Responses to Oxidative Stress. Molecules 2018, 23, 965. [Google Scholar] [CrossRef] [Scilit] [PubMed]
- He, M.; Min, J.W.; Kong, W.L.; He, X.H.; Li, J.X.; Peng, B.W. A review on the pharmacological effects of vitexin and isovitexin. Fitoterapia 2016, 115, 74–85. [Google Scholar] [CrossRef] [Scilit] [PubMed]
- Kumar, N.; Goel, N. Phenolic acids: Natural versatile molecules with promising therapeutic applications. Biotechnol. Rep. 2019, 24, e00370. [Google Scholar] [CrossRef] [Scilit] [PubMed]
- Chu, C.; Lv, Y.; Yao, X.; Ye, H.; Li, C.; Peng, X.; Gao, Z.; Mao, K. Revealing quality chemicals of Tetrastigma hemsleyanum roots in different geographical origins using untargeted metabolomics and random-forest based spectrum-effect analysis. Food Chem. 2024, 449, 139207. [Google Scholar] [CrossRef] [Scilit] [PubMed]
- Li, Z.; Feng, L.; Wang, H.; Zhang, L.; Li, H.; Li, Y.; Niu, P.; Tian, G.; Yang, Y.; Mei, X.; et al. The Impact of Growth Years on the Medicinal Material Characteristics and Metabolites of Stellaria dichotoma L. var. lanceolata Bge. Reveals the Optimal Harvest Age. Plants 2023, 12, 2286. [Google Scholar] [CrossRef] [Scilit] [PubMed]
- Li, X.; Mu, Y.; Hua, M.; Wang, J.; Zhang, X. Integrated phenotypic, transcriptomics and metabolomics: Growth status and metabolite accumulation pattern of medicinal materials at different harvest periods of Astragalus Membranaceus Mongholicus. BMC Plant Biol. 2024, 24, 358. [Google Scholar] [CrossRef] [Scilit] [PubMed]
- Yang, L.; Wen, K.S.; Ruan, X.; Zhao, Y.X.; Wei, F.; Wang, Q. Response of Plant Secondary Metabolites to Environmental Factors. Molecules 2018, 23, 762. [Google Scholar] [CrossRef] [Scilit] [PubMed]
- Alseekh, S.; Aharoni, A.; Brotman, Y.; Contrepois, K.; D’Auria, J.; Ewald, J.; Ewald, J.C.; Fraser, P.D.; Giavalisco, P.; Hall, R.D.; et al. Mass spectrometry-based metabolomics: A guide for annotation, quantification and best reporting practices. Nat. Methods 2021, 18, 747–756. [Google Scholar] [CrossRef] [Scilit] [PubMed]
- Ma, L.; Que, H.; Li, W. Untargeted metabolomics for the analysis of metabolite differences in Tetrastigma hemsleyanum leaves from different origins. China Mod. Med. 2025, 32, 4–7. [Google Scholar]
- Wu, Z.; Ye, X.; Bian, F.; Yu, G.; Gao, G.; Ou, J.; Wang, Y.; Li, Y.; Du, X. Determination of the geographical origin of Tetrastigma hemsleyanum Diels & Gilg using an electronic nose technique with multiple algorithms. Heliyon 2022, 8, e10801. [Google Scholar] [CrossRef] [Scilit] [PubMed]
- Hang, S.; Xu, P.; Zhu, S.; Ye, M.; Chen, C.; Wu, X.; Liang, W.; Pu, J. Integrative Analysis of the Transcriptome and Metabolome Reveals the Developmental Mechanisms and Metabolite Biosynthesis of the Tuberous Roots of Tetrastigma hemsleyanum. Molecules 2023, 28, 2603. [Google Scholar] [CrossRef] [Scilit] [PubMed]
- Schymanski, E.L.; Jeon, J.; Gulde, R.; Fenner, K.; Ruff, M.; Singer, H.P.; Hollender, J. Identifying small molecules via high resolution mass spectrometry: Communicating confidence. Environ. Sci. Technol. 2014, 48, 2097–2098. [Google Scholar] [CrossRef] [Scilit] [PubMed]
- Kanehisa, M.; Goto, S. KEGG: Kyoto encyclopedia of genes and genomes. Nucleic Acids Res. 2000, 28, 27–30. [Google Scholar] [CrossRef] [Scilit] [PubMed]
- Pang, Z.; Chong, J.; Zhou, G.; de Lima Morais, D.A.; Chang, L.; Barrette, M.; Gauthier, C.; Jacques, P.E.; Li, S.; Xia, J. MetaboAnalyst 5.0: Narrowing the gap between raw spectra and functional insights. Nucleic Acids Res. 2021, 49, W388–W396. [Google Scholar] [CrossRef] [Scilit] [PubMed]
- Dunn, W.B.; Broadhurst, D.; Begley, P.; Zelena, E.; Francis-McIntyre, S.; Anderson, N.; Brown, M.; Knowles, J.D.; Halsall, A.; Haselden, J.N.; et al. Procedures for large-scale metabolic profiling of serum and plasma using gas chromatography and liquid chromatography coupled to mass spectrometry. Nat. Protoc. 2011, 6, 1060–1083. [Google Scholar] [CrossRef] [Scilit] [PubMed]
- Fernie, A.R.; Trethewey, R.N.; Krotzky, A.J.; Willmitzer, L. Metabolite profiling: From diagnostics to systems biology. Nat. Rev. Mol. Cell Biol. 2004, 5, 763–769. [Google Scholar] [CrossRef] [Scilit] [PubMed]
- Wishart, D.S.; Feunang, Y.D.; Marcu, A.; Guo, A.C.; Liang, K.; Vazquez-Fresno, R.; Sajed, T.; Johnson, D.; Li, C.; Karu, N.; et al. HMDB 4.0: The human metabolome database for 2018. Nucleic Acids Res. 2018, 46, D608–D617. [Google Scholar] [CrossRef] [Scilit] [PubMed]
- Tsao, R. Chemistry and biochemistry of dietary polyphenols. Nutrients 2010, 2, 1231–1246. [Google Scholar] [CrossRef] [Scilit] [PubMed]
- Dixon, R.A.; Paiva, N.L. Stress-Induced Phenylpropanoid Metabolism. Plant Cell 1995, 7, 1085–1097. [Google Scholar] [CrossRef] [Scilit] [PubMed]
- Bown, A.W.; Shelp, B.J. Plant GABA: Not Just a Metabolite. Trends Plant Sci. 2016, 21, 811–813. [Google Scholar] [CrossRef] [Scilit] [PubMed]
- Guo, Z.; Gong, J.; Luo, S.; Zuo, Y.; Shen, Y. Role of Gamma-Aminobutyric Acid in Plant Defense Response. Metabolites 2023, 13, 741. [Google Scholar] [CrossRef] [Scilit] [PubMed]
- Ramesh, S.A.; Tyerman, S.D.; Gilliham, M.; Xu, B. Gamma-Aminobutyric acid (GABA) signalling in plants. Cell. Mol. Life Sci. 2017, 74, 1577–1603. [Google Scholar] [CrossRef] [Scilit] [PubMed]
- Chapman, K.D. Occurrence, metabolism, and prospective functions of N-acylethanolamines in plants. Prog. Lipid Res. 2004, 43, 302–327. [Google Scholar] [CrossRef] [Scilit] [PubMed]
- Wang, Y.S.; Shrestha, R.; Kilaru, A.; Wiant, W.; Venables, B.J.; Chapman, K.D.; Blancaflor, E.B. Manipulation of Arabidopsis fatty acid amide hydrolase expression modifies plant growth and sensitivity to N-acylethanolamines. Proc. Natl. Acad. Sci. USA 2006, 103, 12197–12202. [Google Scholar] [CrossRef] [Scilit] [PubMed]
- Wasternack, C.; Hause, B. Jasmonates: Biosynthesis, perception, signal transduction and action in plant stress response, growth and development. An update to the 2007 review in Annals of Botany. Ann. Bot. 2013, 111, 1021–1058. [Google Scholar] [CrossRef] [Scilit] [PubMed]

Disclaimer/Publisher’s Note: The statements, opinions and data contained in all publications are solely those of the individual author(s) and contributor(s) and not of MDPI and/or the editor(s). MDPI and/or the editor(s) disclaim responsibility for any injury to people or property resulting from any ideas, methods, instructions or products referred to in the content. |
© 2026 by the authors. Licensee MDPI, Basel, Switzerland. This article is an open access article distributed under the terms and conditions of the Creative Commons Attribution (CC BY) license.