


Highlights
What are the main findings?
- An integrated chemical–biological strategy was established to evaluate Maca quality.
- Untargeted metabolomics revealed distinct metabolic profiles among Maca color varieties.
- Characteristic macamides and glucosinolates contributed substantially to varietal differences.
- Targeted HPLC confirmed higher levels of representative macamides in purple and black Maca.
- Purple Maca showed superior neuroprotective activity in an MPTP-induced zebrafish model.
What are the implications of the main findings?
- This combined strategy supports comprehensive quality assessment of Maca.
- The identified differential compounds provide chemical evidence for the functional advantages of colored Maca varieties.
Abstract
Lepidium meyenii (Maca) is an annual herb belonging to the genus Lepidium in the Brassicaceae family. It is cultivated in different color varieties, including purple, black, and yellow types, but systematic comparisons of their chemical composition and neuroprotective effects remain limited, hindering the development of reliable approaches for quality evaluation and variety selection. In this study, an integrated chemical composition–biological effect strategy was established to characterize the quality differences among purple, black, and yellow Maca. Untargeted metabolomic profiling based on UHPLC–LTQ–Orbitrap MS identified 4113 and 1021 metabolic features in positive and negative ion modes, respectively, and revealed distinct metabolic profiles among the three color varieties. A total of 35–48 differential metabolites were identified in pairwise comparisons, mainly involving macamides, glucosinolates, phenylpropanoid derivatives, and phosphatidic acids. Complementary targeted HPLC-DAD analysis was performed to quantify three representative macamides and one macaene, selected based on their characteristic occurrence in Maca and relevance to compositional quality evaluation. Their contents were significantly higher in purple and black Maca than in yellow Maca. In an MPTP-induced zebrafish Parkinson’s disease model, all three Maca varieties showed neuroprotective effects, with purple Maca exhibiting the greatest improvement in locomotor activity and preservation of dopaminergic neurons. Correlation analysis suggested a positive association between characteristic constituent contents and dopaminergic neuronal area. These findings demonstrate distinct chemical and pharmacological differences among Maca color varieties and support characteristic macamides as quality-related markers for the quality evaluation and rational utilization of Maca.
1. Introduction
Maca (Lepidium meyenii), a medicinal and edible plant belonging to the Brassicaceae family, is native to the high-altitude regions of the Peruvian Andes [1] and has attracted increasing attention because of its nutritional value and diverse biological activities. It has also been widely cultivated in several regions of China, including Yunnan, Tibet, Xinjiang, and Sichuan [2,3]. Phytochemical investigations have demonstrated that Maca contains abundant primary metabolites, such as polysaccharides, proteins, and amino acids, as well as characteristic secondary metabolites, including alkaloids, glucosinolates, macamides, and macaenes [4]. Among these constituents, macamides and macaenes are characteristic lipophilic metabolites of Maca and have been widely investigated for their potential biological activities, including neuroprotective and anti-fatigue effects, as well as their potential roles in regulating reproductive function and endocrine activity [5]. Commercial Maca is commonly classified according to hypocotyl color into yellow, black, and purple varieties, and accumulating evidence suggests that these color varieties differ in their chemical composition and biological properties. Therefore, a systematic characterization of the chemical differences among Maca color varieties is important for understanding their quality characteristics and supporting rational quality evaluation and utilization.
Neuroprotective activity represents an important aspect of the functional value of Maca, particularly in the context of neurodegenerative disorders. Parkinson’s disease (PD) is characterized by the progressive degeneration of dopaminergic neurons, a process in which mitochondrial dysfunction, excessive reactive oxygen species (ROS) production, oxidative stress, and apoptosis are considered important pathological processes [6]. Previous studies have suggested that Maca and its characteristic lipophilic constituents, particularly macamides, possess neuroprotective and antioxidant properties with relatively low toxicity. Macamides may regulate neuronal function through multiple mechanisms, including interactions with G protein-coupled receptors such as cannabinoid receptors (cannabinoid receptor 1 (CB1) and cannabinoid receptor 2 (CB2)), the modulation of mitochondrial function, and the regulation of cell-survival signaling pathways. In cellular and animal models, Maca-derived constituents have been reported to attenuate oxidative stress and regulate apoptosis-related signaling, including the protein kinase B (AKT)/cAMP response element-binding protein (CREB) pathway and downstream proteins such as Bcl-2, Bax, and caspase-3 [1,7,8,9]. Our previous study further demonstrated that the macamide enrichment fraction and N-benzylhexadecanamide, a representative macamide, exerted protective effects against 1-methyl-4-phenylpyridinium (MPP+)-induced injury in MN9D dopaminergic neurons and in zebrafish. Meanwhile, we preliminarily clarified that its mechanism mainly involved the regulation of sphingolipid metabolism and mitochondrial function via a multi-omics study [4,10]. Overall, these studies provide additional evidence for the potential neuroprotective properties of Maca-derived lipophilic constituents.
Despite these findings, important gaps remain in understanding the quality differences and functional properties of different Maca color varieties. Previous studies have reported variation in the chemical composition and biological activities of purple, black, and yellow Maca; however, many investigations have focused on individual compounds or limited metabolite classes or have employed analytical platforms with relatively restricted metabolite coverage, such as flow injection mass spectrometry (FIMS) and gas chromatography–mass spectrometry (GC–MS) [11,12]. Consequently, the overall metabolic differences among Maca color varieties remain insufficiently characterized. More importantly, although characteristic constituents such as macamides and macaenes have been associated with the biological activities of Maca, it remains unclear whether differences in their abundance are associated with the variation in neuroprotective effects among different color varieties. Thus, chemical differences identified by conventional quality assessment cannot necessarily be assumed to reflect functional differences, highlighting the necessity of an integrated approach that links comprehensive chemical characterization with biological evaluation.
Recent advances in herbal medicine quality evaluation have emphasized the importance of integrating chemical characterization with biological assessment, particularly when chemical composition alone cannot fully capture functional quality [8,13,14]. In contrast to approaches that evaluate Maca quality from either a chemical or pharmacological perspective, the present study established an integrated chemical composition–biological effect strategy to systematically compare the quality of purple, black, and yellow Maca. Untargeted metabolomic profiling based on ultra-high-performance liquid chromatography (UHPLC)–linear trap quadrupole (LTQ)–Orbitrap mass spectrometry (MS) was first used to obtain a comprehensive overview of metabolic variation among the three color varieties. Based on the observed chemical differences and the known biological relevance of Maca’s characteristic lipophilic constituents, three representative macamides and one macaene were subsequently quantified using a validated high-performance liquid chromatography with diode-array detection (HPLC-DAD) method. The neuroprotective effects of the three varieties were then evaluated in an MPTP-induced zebrafish PD model using locomotor activity and dopaminergic neuronal integrity as complementary indicators. Finally, exploratory correlation analysis was performed to investigate the association between the quantified characteristic constituents and neuroprotective outcomes. This design enabled chemical variation among Maca varieties to be evaluated together with their biological effects and provided a more functionally relevant basis for identifying potential quality-related markers.
Accordingly, this study aimed to systematically evaluate the quality characteristics and neuroprotective potential of purple, black, and yellow Maca. Untargeted metabolomic profiling based on UHPLC–LTQ–Orbitrap MS was performed to characterize the global metabolic differences among the three Maca color varieties, followed by quantitative determination of representative macamides and one macaene using a validated HPLC-DAD method. The neuroprotective effects of the three varieties were further compared in an MPTP-induced zebrafish PD model based on locomotor activity and dopaminergic neuronal integrity. In addition, the associations between characteristic constituent abundance and neuroprotective outcomes were explored through correlation analysis. This integrated strategy was designed to identify potential quality-related chemical markers and provide a scientific basis for the quality evaluation and rational utilization of different Maca varieties.
2. Experimental Design
2.1. Samples and Reference Standards
The Maca (Lepidium meyenii Walp.) raw materials used in this study were supplied by the United States Pharmacopeia (USP). Maca belongs to the family Brassicaceae and the genus Lepidium. The plant material was identified by Hongjie Wang from the Centre for Chemical Analysis of Traditional Chinese Medicines, Institute of Chinese Materia Medica, China Academy of Chinese Medical Sciences. The raw materials were stored in a desiccator at 18 °C.
The reference standards, including N-(9Z,12Z,15Z)-octadecatrienoic amide (M1), N-benzyl-(9Z,12Z)-octadecadienoic amide (M2), N-benzylhexadecanamide (M3), and 5-oxo-6E,8E-octadecadienoic acid (M4), were provided by USP and stored in a refrigerator at 4 °C.
2.2. Chemicals and Reagents
The following chemicals and reagents were used: methanol of HPLC grade (Thermo Fisher Scientific, Waltham, MA, USA; Cat. no.: F24OB1211). acetonitrile of HPLC grade (Thermo Fisher Scientific, Waltham, MA, USA, Cat. no.: F24OBT201). nomifensine (Sigma, Shanghai, China; Cat. no.: 029M4053V). 1-methyl-4-phenyl-1,2,3,6-tetrahydropyridine hydrochloride (MPTP, Aladdin Bio-Chem Technology Co., Ltd., Shanghai, China; Cat. no.: J2210583). methylcellulose of analytical grade (Aladdin Bio-Chem Technology Co., Ltd., Shanghai, China; Cat. no.: C2004046). dimethyl sulfoxide (DMSO) of analytical grade (Sigma, Buchs, Switzerland; Cat. no.: BCCD8942). methanol of analytical grade (Sinopharm Chemical Reagent Co., Ltd., Shanghai, China; Cat. no.: 20220514). Tween-20 (Sinopharm Chemical Reagent Co., Ltd., Shanghai, China; Cat. no.: K1715077). Triton X-100 (Aladdin Bio-Chem Technology Co., Ltd., Shanghai, China; Cat. no.: K1914021). bovine serum albumin (Aladdin Bio-Chem Technology Co., Ltd., Shanghai, China; Cat. no.: A2129150). fetal bovine serum (FBS, Thermo Fisher Scientific Co., Ltd., Shanghai, China; Cat. no.: 2175442P). and tyrosine hydroxylase antibody (Millipore, Massachusetts, MA, USA).
2.3. Equipment
The following were used: Ultimate 3000 ultra-high-performance liquid chromatograph (Thermo Fisher Scientific, USA). 100,000th-precision electronic balance (Mettler Toledo, Oho, USA, XA105-METTLER TOLEDO). 0.0001g precision balance (Shunyu Hengping Instrument Co., Ltd., Shanghai, China; JA503-DualRange). ultrasonic cleaner (Kunshan Ultrasonic Instrument Co., Ltd., Kunshan, China; KQ-250B). high-speed centrifuge (Thermo Fisher Scientific, USA; Thermo Scientific Heraeus Multifuge X1R). dissecting microscope (Olympus, Tokyo, Japan; SZX7). CCD camera (Shanghai Tuson Vision Technology Co., Ltd., Shanghai, China; VertA1). precision electronic balance (OHAUS, Parsippany, NJ, USA; CP214). Zeiss fluorescence microscope (ZEISS, Oberkochen, Germany; AXIO Zoom. V16). zebrafish behavior analysis system (Viewpoint, Frankfurt, France; Zebra Lab 3.22.3.31). rocking decolorization shaker (Taicang Hualida Laboratory Equipment Co., Ltd., Taicang, China; 2D-9556-A). 6-well plates (Zhejiang Beilanbo Biotechnology Co., Ltd., Huzhou, China). and 96-well plates (Nest Biotech, Wuxi, China).
3. Procedure
3.1. Untargeted Metabolomics Analysis
3.1.1. Sample Preparation
For HPLC-LTQ-Orbitrap MS analysis, sample solutions were prepared as follows: 5 g of Maca powder from each batch was mixed with 5 mL of methanol, sonicated in a water bath (40 kHz, 250 W) at room temperature (Kunshan Ultrasonic Instrument Co., Ltd.) for 30 min, and then centrifuged at 10000 r·min−1 for 10 min. Then, 1 mL of supernatant was collected as the sample solution for metabolomic analysis. Each group contained 6 biological replicates; all samples were independently collected, pretreated and subjected to metabolomic analysis without pooled technical replicates. Additionally, sample solutions from each group were combined to obtain twelve mixed sample solutions for systematic characterization. These mixed sample solutions were further combined to prepare a quality control (QC) sample solution to evaluate the system stability of the untargeted metabolomics method.
3.1.2. UHPLC–LTQ–Orbitrap MS Methods
Chromatographic separation was performed on a Waters ACQUITY™ Premier HSS T3 column (2.1 mm × 100 mm, 1.8 μm; Waters Corporation, Milford, MA, USA) at 30 °C and eluted with a binary mobile phase comprising solvent A (0.1% formic acid in water, V/V) and solvent B (acetonitrile) at a flow rate of 0.3 mL·min−1. The gradient elution program was as follows: 0~2 min, 95%A; 2~8 min, 95% → 70%A; 8~15 min, 70% → 30%A; 15~18 min, 30% → 5%A; 18~26 min, 5%A; and 26~32 min, 5% → 95%A. The injection volume was 10 μL. Electrospray ionization (ESI) was operated in both positive and negative ion modes. In positive ion mode, the capillary temperature was set to 350 °C, the capillary voltage to 35 V, and the spray voltage to 3.5 kV, with a sheath gas (N2) flow rate of 40 psi (1 psi ≈ 6.895 kPa) and an auxiliary gas (N2) flow rate of 10 psi. In negative ion mode, the capillary voltage was adjusted to −35 V, the source voltage to −3.5 kV, the sheath gas (N2) flow rate to 35 psi, and the auxiliary gas (N2) flow rate remained at 10 psi. Primary mass spectrometry employed Fourier transform (FT) mode for full-scan analysis, with a scan range of m/z (50–2000) and a resolution of 30,000. Secondary and tertiary mass spectrometry were performed using Data Dependent Acquisition (DDA) mode. Xcalibur 2.1 software (Thermo Fisher Scientific, San Jose, CA, USA) was used for instrument control and data processing.
3.1.3. Data Processing
Metabolomics data were pre-processed using Compound Discoverer 3.3 (Thermo Fisher Scientific, USA), Umetrics (Umea, Sweden), the MzCloud database, and the HMDB (https://hmdb.ca/) to identify unknown compounds, detect differentially expressed metabolites, and perform metabolic pathway analysis.
After feature filtering and normalization, intra-batch signal drift was corrected by locally estimated scatterplot smoothing (LOESS) regression based on QC profiles, and inter-batch variation was further eliminated via empirical Bayes ComBat correction. Raw LC–MS data were processed using Compound Discoverer software. The data-processing workflow included retention time alignment, compound detection, feature merging and grouping, molecular formula prediction, and database-assisted compound annotation. A mass tolerance of 5 ppm was used for mass-based matching, and QC-5 was selected as the reference file for retention time alignment. Candidate compounds were annotated using available database searches and MS/MS spectral matching, where applicable.
Multivariate statistical analyses were performed using SIMCA-P 14.1. PCA was conducted to evaluate the overall distribution of the Maca samples and the QC samples. OPLS-DA was used to assess metabolic differences among purple, black, and yellow Maca varieties. Model performance was evaluated based on the R2X, R2Y, and Q2 values, and 200-permutation tests were performed to assess model robustness and the risk of overfitting. Differential metabolites were screened using the following criteria: variable importance in projection (VIP) > 1, |log2FC| ≥ 1, and p < 0.05.
3.2. Method Validation and Quantitative Determination of Four Characteristic Constituents in Maca Varieties
Untargeted metabolomics was used to characterize global chemical variation among different Maca varieties. Macamides and macaenes were the representative differential constituents among them. In parallel, a targeted HPLC method was established for the quantitative analysis of three representative macamides and one macaene, which are recognized as characteristic constituents of Maca. The purpose of this analysis was to compare the distribution patterns of these quality-related constituents among different color varieties.
3.2.1. Sample Preparation
Three macamides (M1–M3) and one macaene (M4) were selected for quantitative analysis because they are characteristic lipophilic constituents of Maca and have been widely reported as quality-related compounds. Quantitative determination was performed to compare their distribution patterns among different Maca varieties. All target analytes possess conjugated benzene-ring skeletons with characteristic UV absorbance. Accordingly, HPLC-DAD was adopted for quantitative determination, as this technique is free of ion suppression effects, requires minimal sample pretreatment, exhibits excellent reproducibility, and is well-suited for high-throughput multi-component quantification. Sample solutions for HPLC-DAD analysis were prepared by adding 10 mL of methanol to 1 g of Maca powder from each batch, sonicating in a water bath at room temperature for 30 min, and then centrifuging at 10,000 r·min−1 for 10 min. Then, 1 mL of supernatant was collected as the sample solution for analysis.
3.2.2. Chromatographic Conditions
High-performance liquid chromatography was used for the determination of the content of four compounds in Maca sample solutions. Analyses were performed using a Shimadzu LC-20AT system with a photodiode array (PDA) detector. Separation was performed on a reverse-phase column (Agilent SB-C18, 4.6 × 250 mm, 3.5 μm particle size, Agilent Technologies, Santa Clara, CA, USA). The column temperature was maintained at 30 °C. The mobile phases were 0.1% formic acid in water (A) and acetonitrile (B). The total run time was 70 min: initially, 17% A for 38 min, then decreasing to 0% A in 5 min (at 43 min), which was held until 53 min. The gradient was then returned to 17% at 54 min and maintained until 70 min for column re-equilibration. The flow rate was 1 mL min−1. The detection wavelengths in the UV range were 210 nm and 275 nm. The injection volume was 20 µL.
3.2.3. Standard Curve and Linear Range
First, 2 mL of methanol was added to 2.34 mg of M1, 2.21 mg of M2, 1.21 mg of M4, and 4.94 mg of M3. Then, 500 μL of M1 solution, 1000 μL of M2 solution, 2420 μL of M3 solution, and 80 μL of M4 solution were pipetted, and 28 mL of methanol was added to each to dilute them, creating standard stock solutions at 0.07313, 0.13813, 0.29887, and 0.00605 mg·mL−1, respectively. Next, each standard solution was diluted sequentially with methanol at ratios of 1/2, 1/4, 1/8, 1/16, 1/32, 1/64, and 1/128 to prepare a series of standard solutions at various concentrations. Then, 20 μL of each solution was injected, the chromatograms were recorded, and the peak areas of M1, M2, M3, and M4 were measured. The relationship between peak area and concentration was plotted for each compound to generate the standard curves, with peak area on the y-axis and concentration on the x-axis, to determine each analyte’s linear range.
3.2.4. Repeatability
Accurate weights of six portions of Maca powder were measured. Test solutions were prepared following the method described in Section 3.2.1. First, 20 μL of each solution was injected, and the chromatograms were recorded. The peak areas for M1, M2, M3, and M4 were determined separately. The content of each component was calculated to evaluate the method’s repeatability.
3.2.5. Precision
Using the same batch of Maca powder, a test solution was prepared following the method described in Section 3.2.1. A precision test was performed by making six consecutive injections.
3.2.6. Stability
The test solution was prepared following the Maca sample preparation method in Section 3.2.1. The solution was kept at room temperature, and its content was checked at regular intervals for up to 48 h.
3.2.7. Recovery Rate
A total of 0.5 g of Maca powder with known content was accurately weighed. The samples were divided into three groups of three replicates each, adding reference standards at 80%, 100%, and 120% of the sample content, respectively. The content was determined using the chromatographic conditions specified in Section 3.2.2, and the recovery rate was calculated.
3.3. Evaluation of the Biological Effects of Maca Varieties on a Zebrafish Model of Parkinson’s Disease
3.3.1. Maintenance of Zebrafish
Zebrafish were kept in aquaculture water at 28 °C. The water composition included 200 mg of instant marine salt per liter of reverse osmosis water, with a conductivity of 450–550 μS·cm−1, pH of 6.5–8.5, and a hardness of 50–100 mg·L−1 CaCO3. They were bred and supplied by Hunter Biotech Company’s fish center. The experimental animal use license number is SYXK(Zhe)2022-0004. Husbandry management adheres to the International Association for Assessment and Accreditation of Laboratory Animal Care (AAALA) accreditation standards (certification number: 001458). The Institutional Animal Care and Use Committee (IACUC) ethical review number is IACUC-2023-8120-01.
3.3.2. Maximum Test Concentration (MTC) Determination
Wild-type zebrafish of the AB strain, randomly selected at 4 days post-fertilization (dpf), were placed in 6-well plates at 30 fish per well as the experimental group. Each experimental group was treated with water-soluble samples at concentrations of 125, 250, 500, 1000, and 2000 μg·mL−1, with separate control groups for normal and model conditions. A sample volume of 3 mL was added to each well. Except for the normal control group, all other groups had a Parkinson’s disease model induced via water-soluble MPTP administration. After 2 days of treatment at 28 °C, the maximum test concentration (MTC) of the different samples was determined in the model zebrafish [15].
3.3.3. Evaluation of Motor Function Improvement
Wild-type AB strain zebrafish at 4 days post-fertilization (dpf) were similarly selected and placed in a 6-well plate (Zhejiang Beilanbo Biotechnology Co., Ltd., China) at 30 individuals per well [16], as previously described. Experimental groups received samples at various concentrations: 125 μg·mL−1, 250 μg·mL−1, 500 μg·mL−1, 1000 μg·mL−1 and 2000 μg·mL−1, with nomifensine at 1.50 μg·mL−1 serving as the positive control. Normal control and model control groups were also included. Except for the normal control group, all other groups were treated with MPTP to establish a Parkinson’s disease model. After 2 days of treatment at 28 °C, ten zebrafish were randomly chosen from each group and transferred to 96-well plates (Nest Biotech, China). A behavioral analysis system (Zebra Lab 3.22.3.31, Viewpoint, France) recorded their total locomotor distance over one hour [17]. Statistical analysis of this behavioral metric assessed the samples’ effectiveness in improving locomotor dysfunction in zebrafish.
3.3.4. Evaluation of Neuroprotective Effects on Dopaminergic Neurons
Randomly selected 1 dpf melanin allele mutant zebrafish (albino) were placed in 6-well plates, with 30 fish per well, according to the experimental setup described previously. The experimental groups received samples at various concentrations: 250 μg·mL−1, 500 μg·mL−1 and 1000 μg·mL−1. The positive control consisted of 1.50 μg·mL−1 nomifensine, with normal control and model control groups established. Aside from the normal control group, all other groups underwent MPTP-induced modeling. After 2 days of treatment at 28 °C, tyrosine hydroxylase (TH) immunohistochemical staining was used to detect changes in dopaminergic neurons in the zebrafish brain [18]. Following staining, ten zebrafish were randomly selected from each group for fluorescence microscopy imaging with a dissecting microscope (SZX7, Olympus, Japan). Neuronal areas were analyzed using ImageJ (version 1.54). The statistical results of this measure were used to assess the protective effect of the samples against dopaminergic neuronal damage [19].
3.3.5. Correlation Analysis Based on Chemical Composition and Biological Effect
In this study, we calculated the sum of four active ingredients in Maca powder, and then multiplied this sum by different concentrations of Maca solution to obtain the total active ingredient concentration. Correlation analysis was performed between the total concentration of the four target compounds and both the total locomotor distance of zebrafish and the dopaminergic neuron area using GraphPad Prism (version 9.5.0).
3.4. Statistical Methods
Pharmacodynamic statistical results are shown as the mean ± standard error (SE). Intergroup analysis was conducted using SPSS 26.0; p < 0.05 indicated statistical significance.
4. Results
4.1. Analysis of Chemical Composition Variations Among Three Color Maca Varieties
4.1.1. Metabolic Profiling of Maca
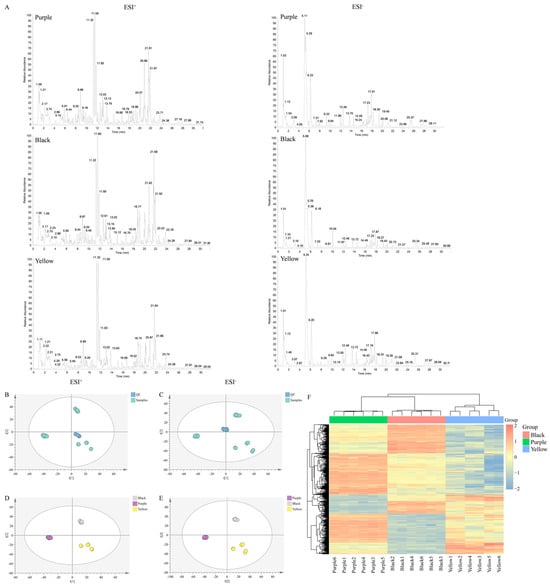
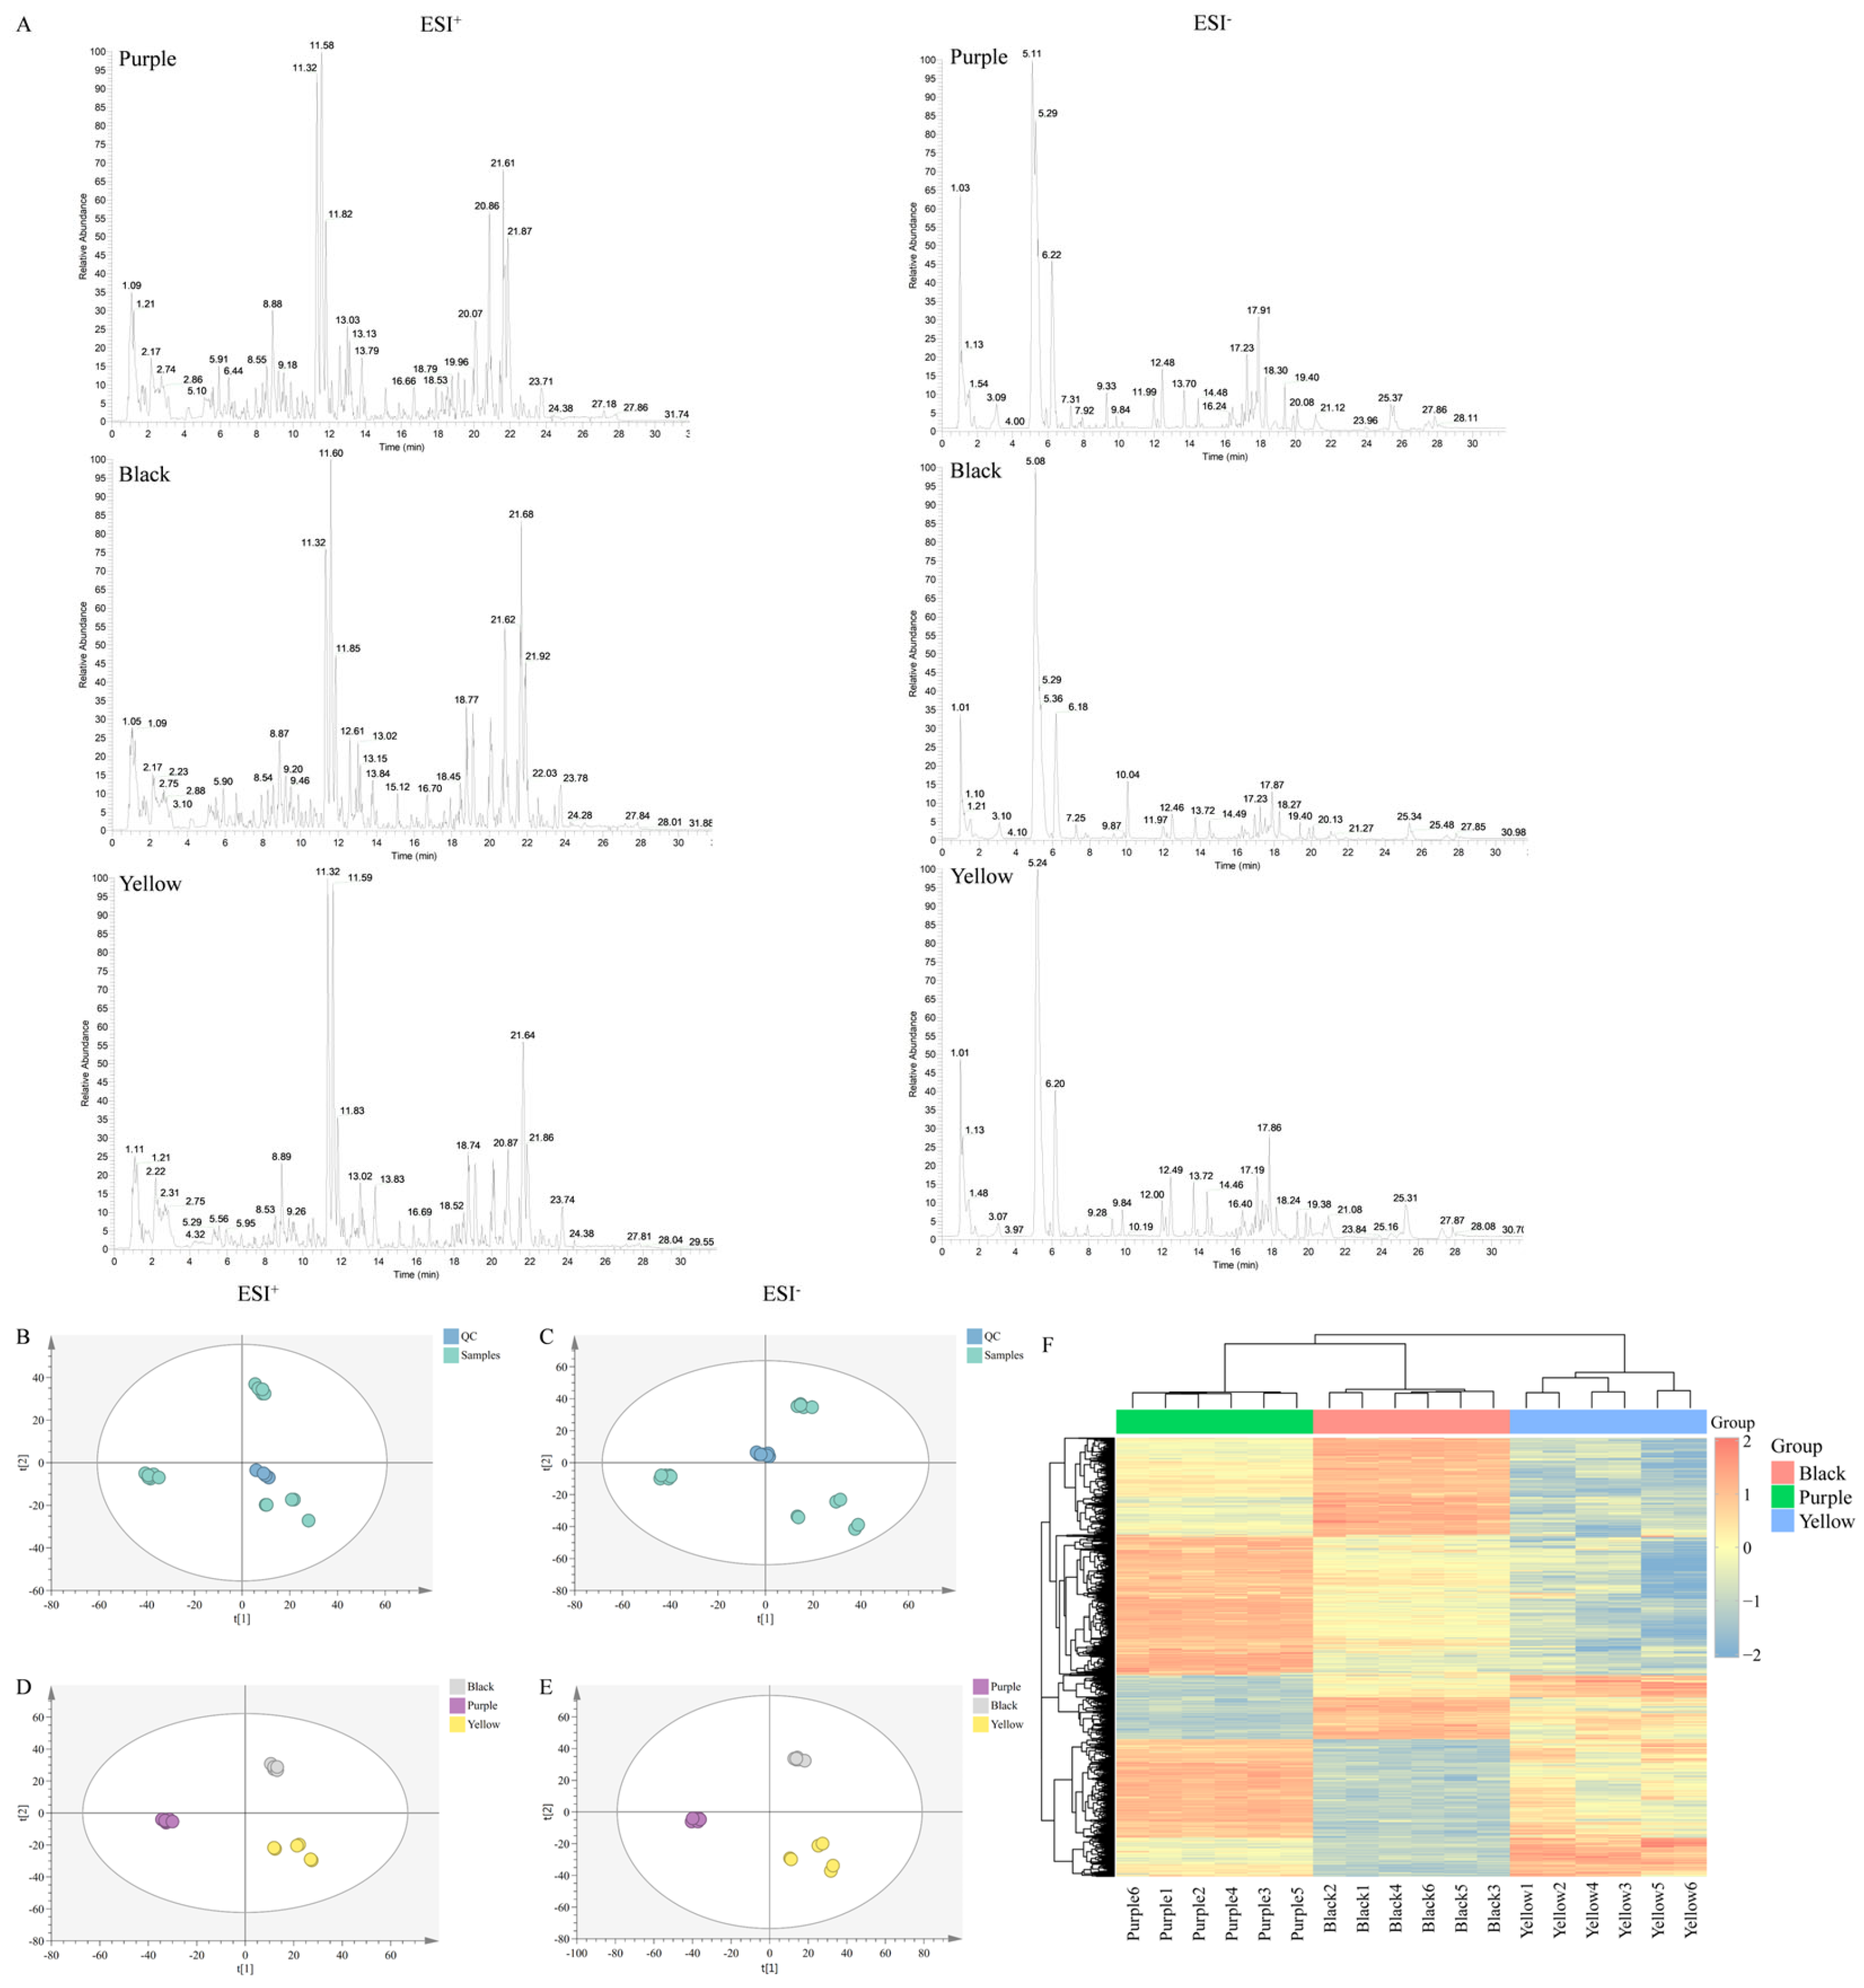
The chromatographic profiles of purple, black, and yellow Maca were acquired in both positive and negative electrospray ionization (ESI) modes (Figure 1A). Differences in chromatographic peak patterns and signal intensities were observed among the three varieties, suggesting variations in their chemical compositions. However, chromatographic profiles alone cannot establish the statistical significance of these differences. Therefore, PCA and hierarchical clustering analysis were subsequently performed to characterize the overall metabolic variation among the three Maca varieties.
Figure 1.
Base peak chromatograms and principal component analysis (PCA) of different colored Maca. (A) Base peak chromatograms of the three Maca varieties acquired in positive and negative electrospray ionization (ESI) modes. (B) PCA score plot of quality control (QC) samples in positive ion mode. (C) PCA score plot of QC samples in negative ion mode. (D) PCA score plot of purple, black, and yellow Maca samples in positive ion mode. (E) PCA score plot of purple, black, and yellow Maca samples in negative ion mode. (F) Hierarchical clustering heatmap of the three Maca varieties based on their metabolic profiles. Purple, black, and yellow represent purple Maca, black Maca, and yellow Maca, respectively; these color designations apply throughout the manuscript.
4.1.2. Multivariate Statistical Analysis
A total of 4113 and 1021 metabolic features were detected in positive and negative ion modes, respectively. Following data preprocessing and normalization, PCA was performed using SIMCA-P 14.1 software. QC samples were included to assess the consistency of the analytical measurements.
As shown in Figure 1B,C, the QC samples clustered closely in the PCA score plots in positive and negative ion modes, respectively, indicating good consistency among QC measurements. This clustering supported the reproducibility of the analytical measurements throughout the analytical sequence.
The PCA score plots of the Maca samples showed distinct distribution patterns among the purple, black, and yellow varieties in both ion modes (Figure 1D,E). The corresponding hierarchical clustering heatmap (Figure 1F) further illustrated differences in metabolic feature abundance and clustering patterns among the samples. Together, these results indicated that the three Maca varieties exhibited distinct overall metabolic profiles.
To identify the metabolic features associated with these differences, pairwise comparisons were subsequently conducted using OPLS-DA, followed by differential feature screening and metabolite annotation.
4.1.3. Screening and Analysis of Differentiating Chemical Constituents in Maca Varieties
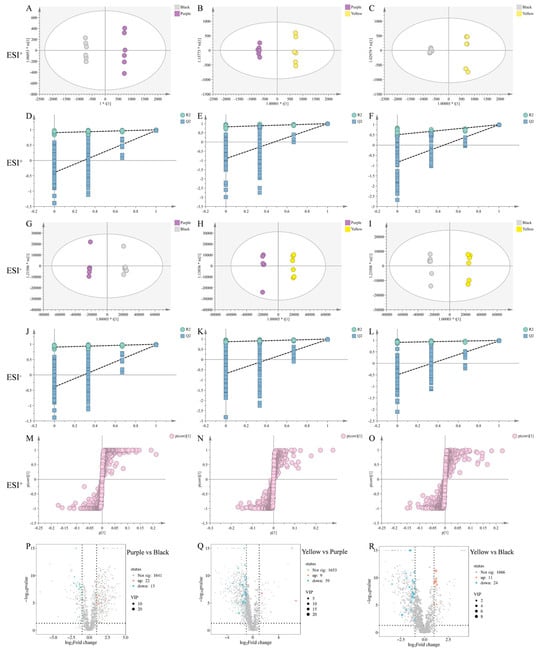
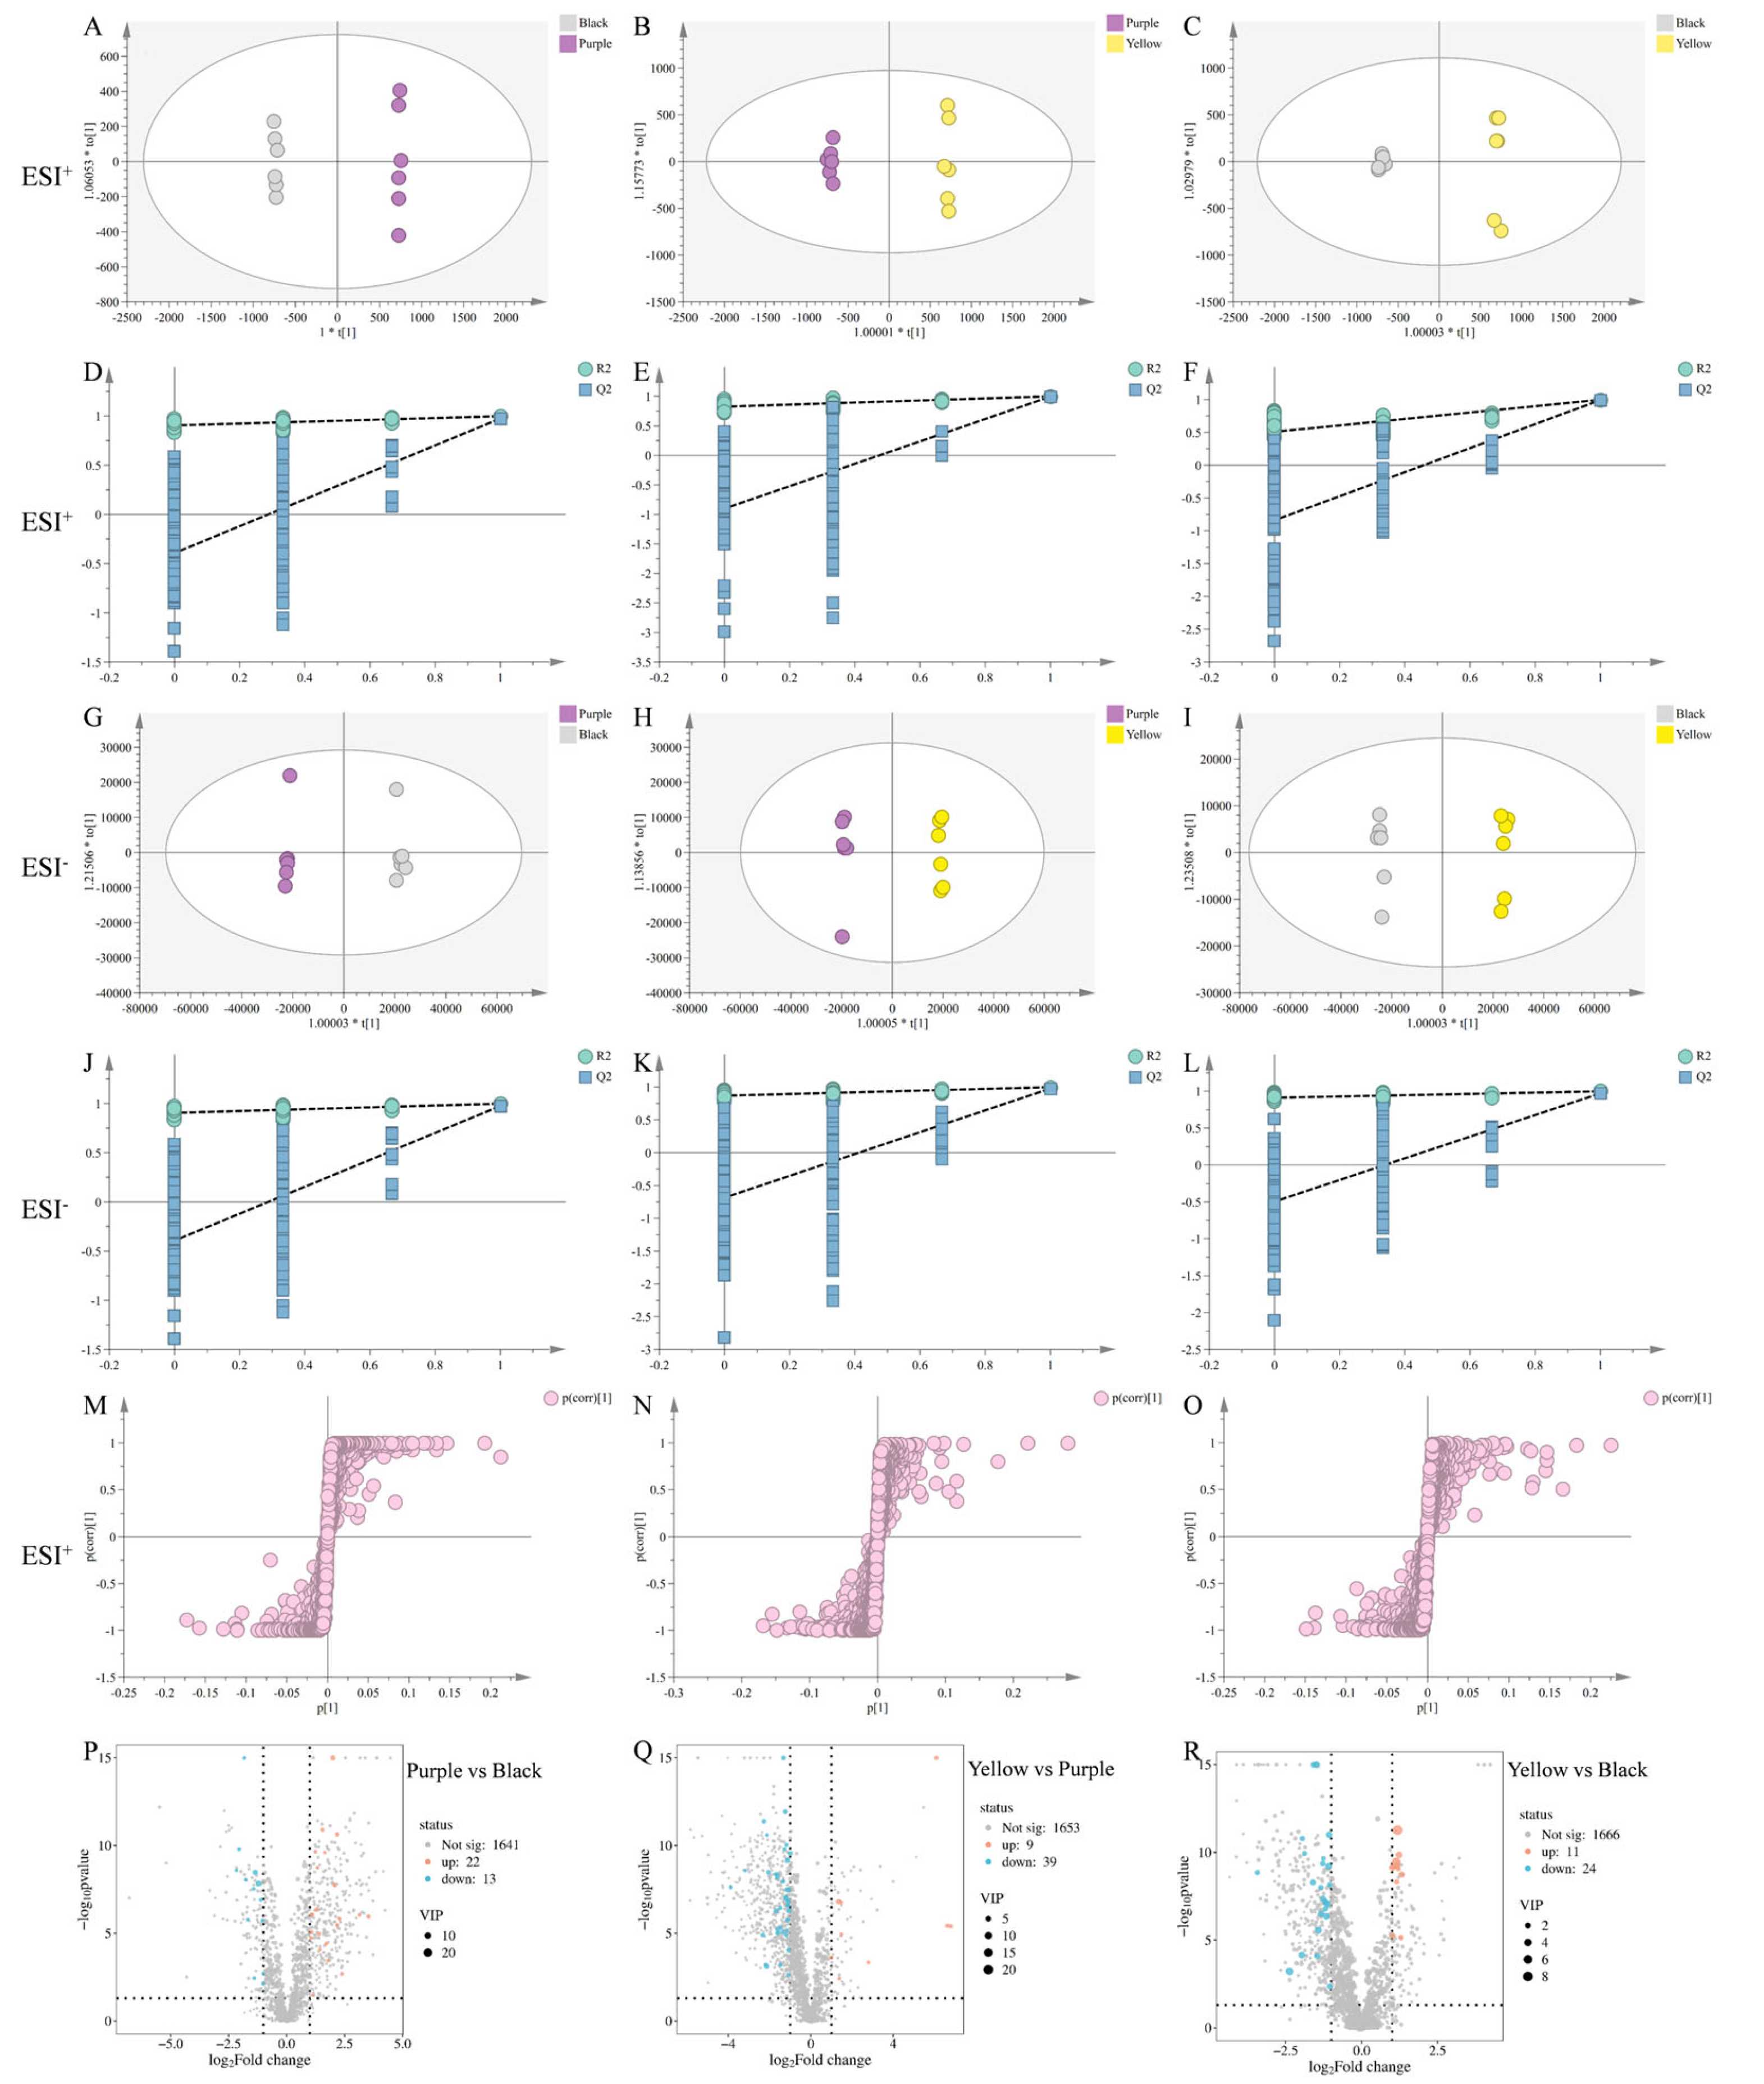
To characterize the metabolic differences between individual Maca varieties, OPLS-DA models were constructed for three pairwise comparisons: purple versus black, purple versus yellow, and black versus yellow. The score plots showed separation between the compared groups in both positive and negative ion modes (Figure 2A–C,G–I), indicating that the groups differed in their multivariate metabolic profiles.
Figure 2.
OPLS-DA, permutation tests, S-plots, and volcano plots for pairwise comparisons of purple, black, and yellow Maca. (A–C) OPLS-DA score plots in positive ion mode for the pairwise comparisons of purple vs. black Maca (A), purple vs. yellow Maca (B), and black vs. yellow Maca (C). (D–F) Corresponding permutation test results for the OPLS-DA models shown in (A–C), respectively. (G–I) OPLS-DA score plots in negative ion mode for the pairwise comparisons of purple vs. black Maca (G), purple vs. yellow Maca (H), and black vs. yellow Maca (I). (J–L) Corresponding permutation test results for the OPLS-DA models shown in (G–I), respectively. (M–O) S-plots derived from the OPLS-DA models in positive ion mode for the pairwise comparisons of purple vs. black Maca (M), purple vs. yellow Maca (N), and black vs. yellow Maca (O). (P–R) Volcano plots showing differential metabolic features for the comparisons of purple vs. black Maca (P), yellow vs. purple Maca (Q), and yellow vs. black Maca (R).
In positive ion mode, the OPLS-DA models yielded R2X values ranging from 0.729 to 0.827, R2Y values ranging from 0.999 to 1.000, and Q2 values ranging from 0.994 to 0.996. In negative ion mode, the corresponding values ranged from 0.771 to 0.829, 0.998 to 0.999, and 0.972 to 0.979, respectively. These values indicated good model fit and apparent predictive performance within the analyzed dataset. Permutation tests involving 200 permutations were performed to further evaluate model validity (Figure 2D–F,J–L). The interpretation of these tests should be based on the observed permutation distributions, regression lines, and intercepts. The separation observed in the OPLS-DA score plots was therefore interpreted in conjunction with the permutation test results rather than on the basis of the score plots alone.
Differential metabolic features were screened using the following criteria: variable importance in projection (VIP) > 1.0, |log2 fold change (FC)| ≥ 1, and p < 0.05. These criteria selected features that contributed to group discrimination, exhibited at least a twofold difference in signal abundance, and met the specified statistical significance threshold. The volcano plots summarize the distribution of differential features in the three pairwise comparisons (Figure 2P–R). Positive and negative log2FC values indicated differences in relative signal abundance between the compared groups, with the direction determined by the group order used in the corresponding analysis.
S-plots were also examined to identify variables contributing to discrimination between groups (Figure 2M–O). Candidate differential metabolites were annotated by matching their accurate mass-to-charge ratios (m/z), molecular formulas, MS/MS fragmentation patterns, and retention behavior against available databases. Because the identities of these compounds were not confirmed using authentic reference standards, the annotations were classified as putatively annotated compounds at MSI Level 2.
After differential feature screening and metabolite annotation, 35 differential metabolites were annotated in the purple-versus-black comparison, 48 in the purple-versus-yellow comparison, and 35 in the black-versus-yellow comparison. The annotated metabolites represented multiple chemical classes, including alkaloids, lipids, amino acids, organic acids, esters, and aromatic compounds (Tables S1–S3). These findings indicated that the metabolic differences among the three Maca varieties involved several chemical classes rather than a single group of metabolites.
Overall, the untargeted metabolomic analysis revealed distinct metabolic profiles among purple, black, and yellow Maca and identified annotated differential metabolites that may help characterize their compositional differences. These results provided a basis for the subsequent targeted quantification of representative characteristic constituents and comparative evaluation of the biological effects of the three varieties.
4.2. Method Validation and Quantitative Analysis of Four Characteristic Constituents in Maca Varieties
4.2.1. HPLC Chromatogram Comparison of Maca Samples and Standards
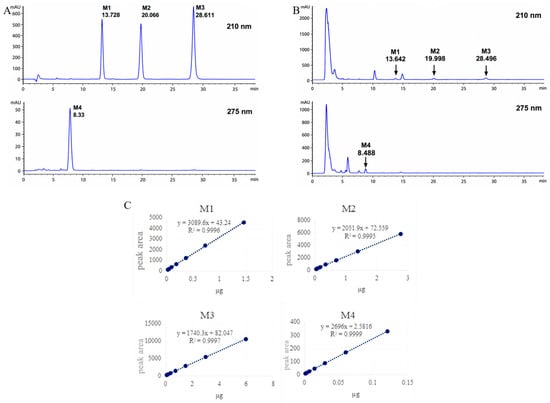
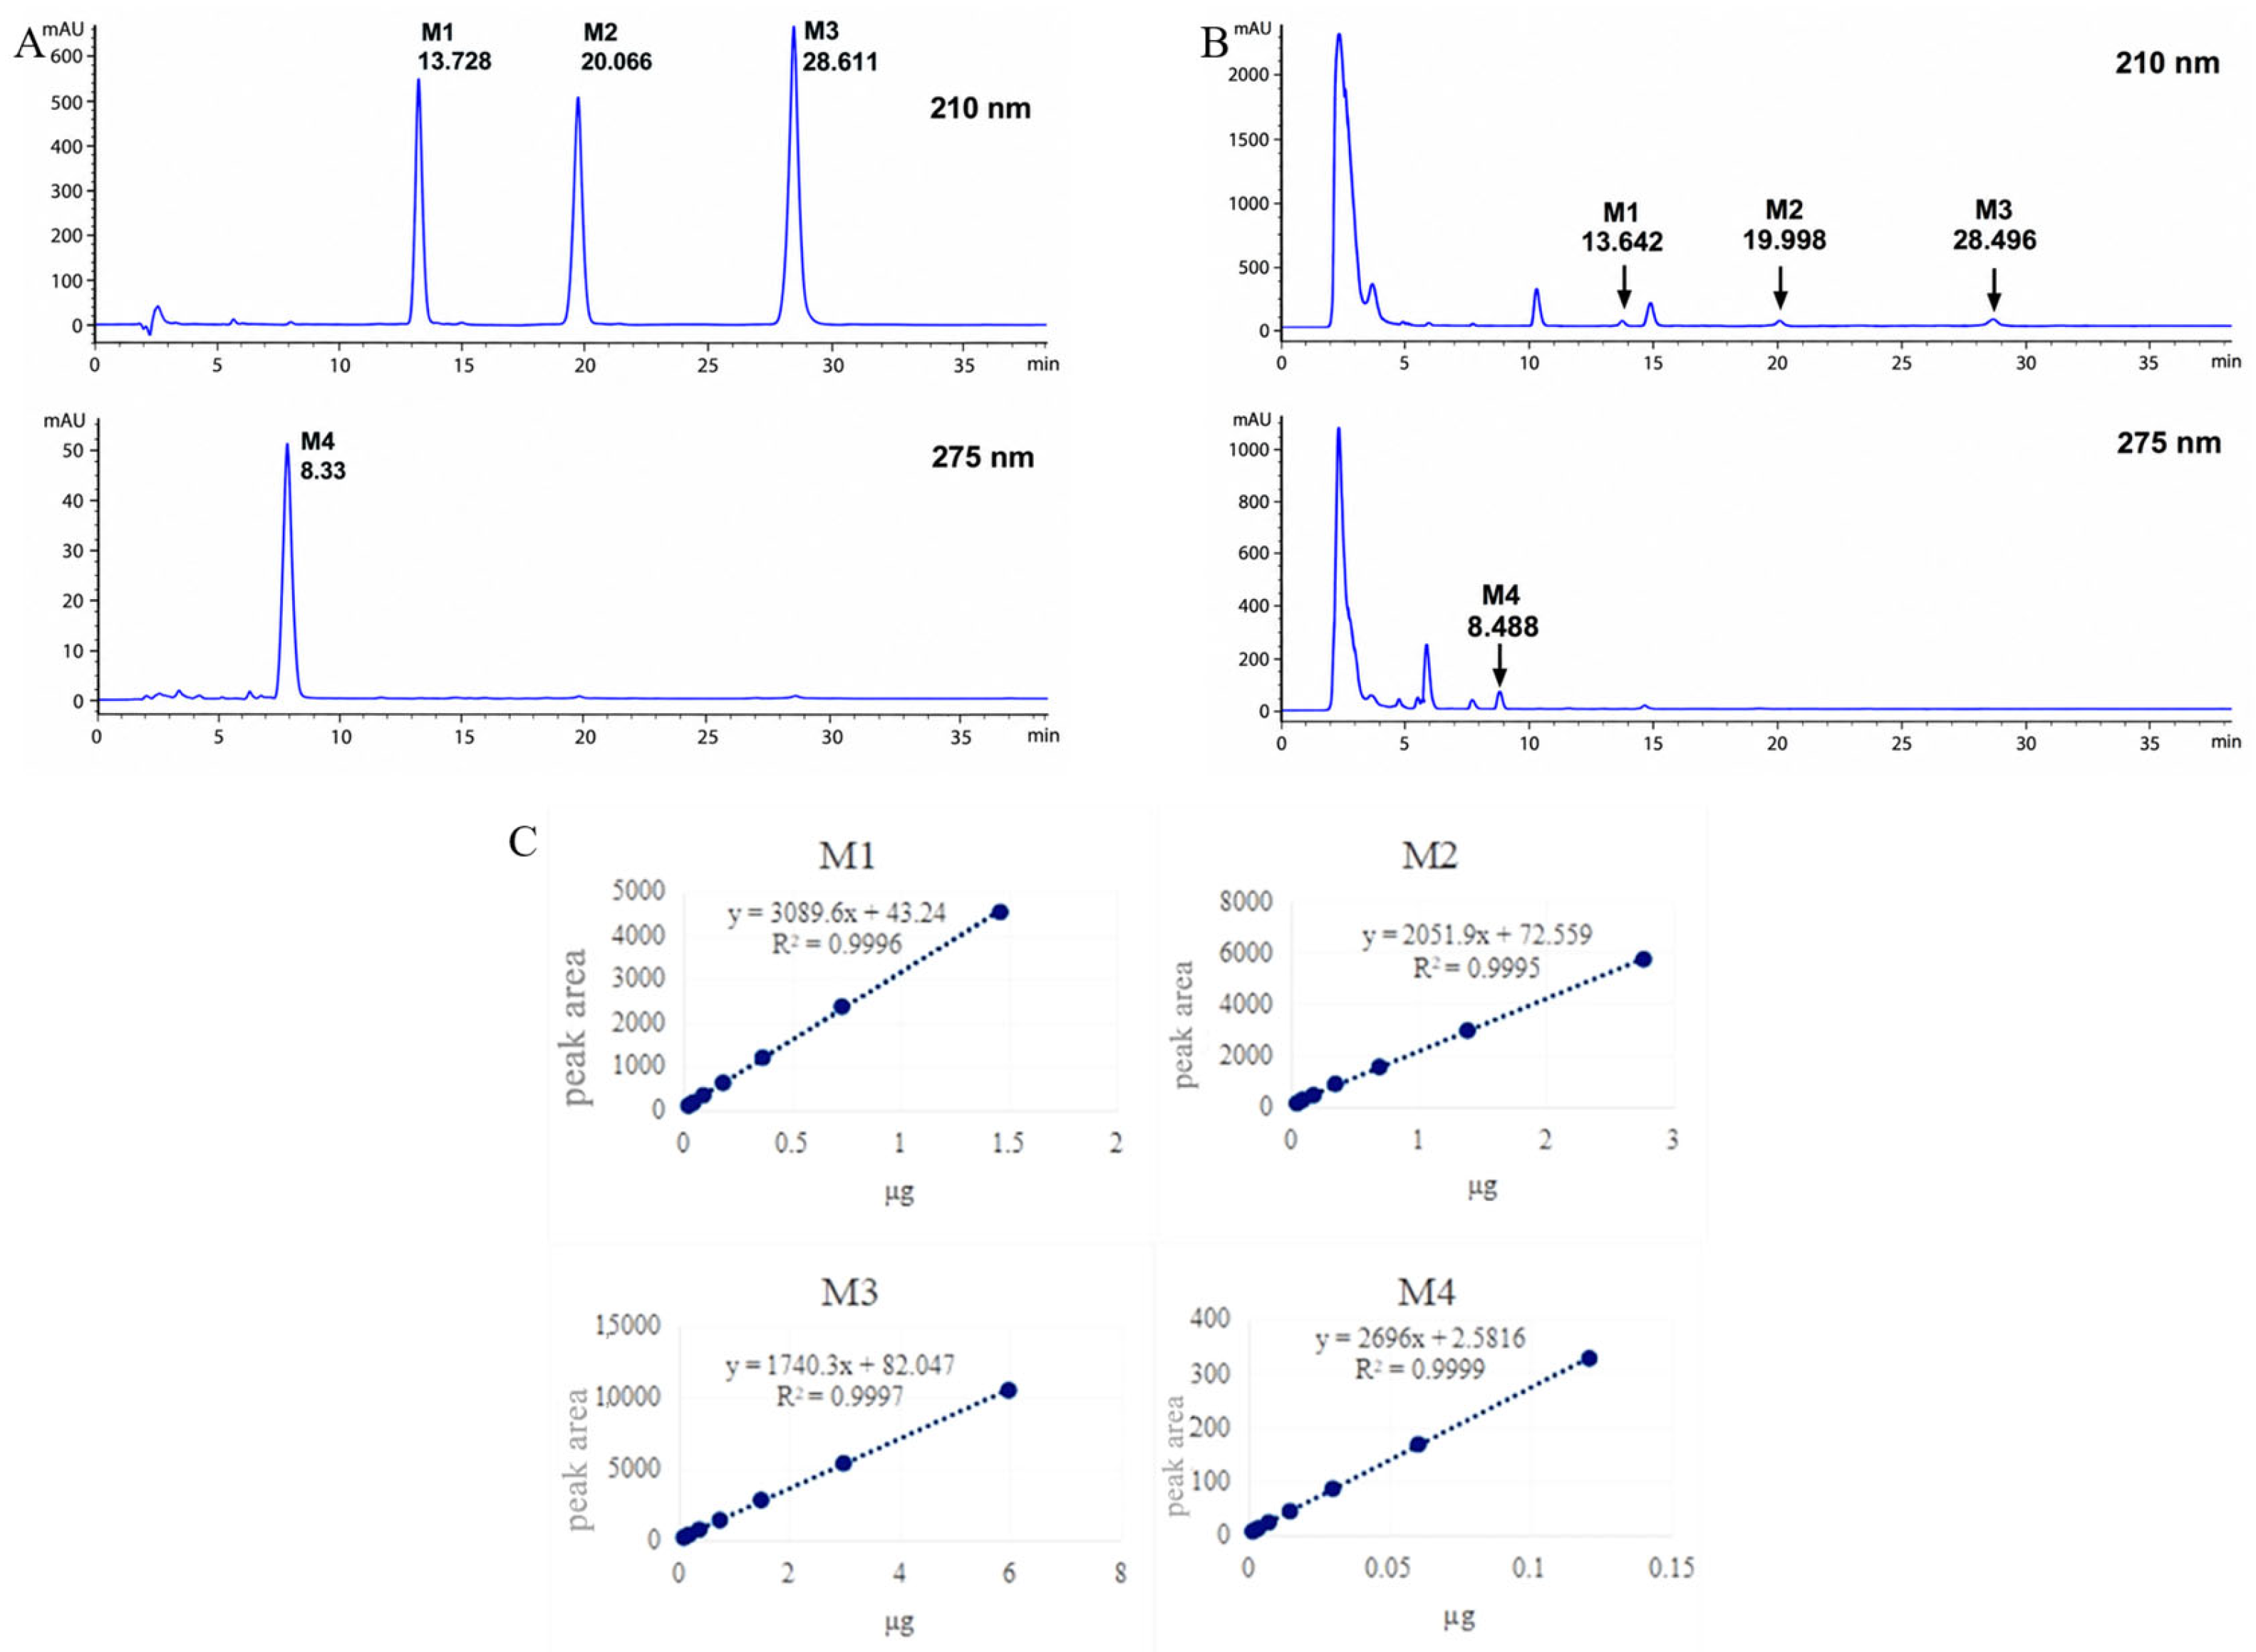
To further compare the distribution of characteristic constituents among different Maca varieties, three representative macamides (M1–M3) and one macaene (M4) were quantitatively analyzed using HPLC-DAD. These compounds were selected based on their characteristic occurrence in Maca and their relevance to compositional quality evaluation, rather than their ranking among the discriminatory variables identified by untargeted metabolomics. Results showed that the retention times and UV absorption spectra of the peaks matched those of the reference standards. Further validation with spiked experiments confirmed that adding the reference standards to the samples produced sharper peaks at the same retention times, indicating that the chromatographic peaks could be conclusively identified as the respective reference standard components (Figure 3).
Figure 3.
HPLC chromatogram comparison of a Maca sample and reference standards. (A) HPLC chromatograms of reference standards. (B) HPLC chromatogram of a Maca sample solution. (C) Standard curves for four analytes M1: N-(9Z,12Z,15Z)-octadecatrienoic amide; M2: N-benzyl-(9Z,12Z)-octadecadienoic amide; M3: N-benzylhexadecanoic amide; M4: 5-oxo-6E,8E-octadecadienoic acid.
4.2.2. Standard Curve
All four analytes showed excellent linearity over their respective concentration ranges, with correlation coefficients (R2) greater than 0.999. The calibration equations and corresponding linear ranges for M1–M4 are summarized in Table 1 and Figure 3C.
Table 1.
Standard curves of four analytes.
4.2.3. Repeatability Test
Six consecutive analyses were conducted on the same sample. The results showed average contents of the four components (M1–M4) were 0.00524%, 0.01175%, 0.02077%, and 0.00022%, respectively, with relative standard deviations (RSD) below 3% for all components. This confirms the method’s good repeatability (Table 2).
Table 2.
Repeatability of analytes.
4.2.4. Precision Test
Six consecutive injections of the same sample under identical conditions yielded RSD values for all measured constituents below 5%, indicating that the instrument possesses good precision (Table 3).
Table 3.
Precision test data.
4.2.5. Stability Test
After standing at room temperature for varying durations (1, 2, 4, 6, 8, 16, 32, and 48 h), the sample solutions were analyzed. The concentrations of all four constituents remained essentially stable within 48 h, indicating that the test solutions exhibit good stability throughout the analytical cycle (Table 4).
Table 4.
Sample stability test data.
4.2.6. Spiked Recovery Test
A total of 0.5 g of the Maca sample (Sample 15) of known content was accurately weighed to prepare nine test solutions for determination using the spiked recovery method. Reference standards at low, medium, and high concentrations (0.8:1, 1:1, and 1:1.2) were precisely added. Test solutions were prepared according to the method outlined in the content determination section of the quality standards for preparing test solutions and analyzed under the chromatographic conditions specified herein. The mean recovery rate for M1 was 102.25%, with an RSD of 2.48%. The mean recovery rates for M2, M3, and M4 were 98.50%, 105.80%, and 92.16%, respectively, with RSDs of 3.33%, 2.09%, and 3.13%, respectively. The experimental results indicate that the recovery rates meet the requirements for content determination. The results are presented in Table S4.
4.2.7. Content of Four Compounds in Nine Batches of Maca Powder
The validated HPLC method was applied to determine the contents of four characteristic constituents (M1–M4) in nine batches of Maca samples. The quantitative results are presented in Table 5. All four analytes were detected in the investigated samples, although their contents varied among different Maca varieties. Overall, purple and black Maca samples tended to contain higher levels of the quantified constituents than yellow Maca samples. Among the four analytes, N-benzylhexadecanamide (M3) was generally present at the highest concentration, whereas 5-oxo-6E,8E-octadecadienoic acid (M4) showed relatively lower abundance (Table 5).
Table 5.
Contents of four compounds in Maca powder (%).
4.3. Pharmacodynamic Evaluation of Maca Varieties in Improving Parkinson’s Disease in a Zebrafish Model
4.3.1. Maximum Test Concentration (MTC) Assay
Prior to pharmacodynamic evaluation, the maximum test concentration (MTC) of Maca extract was determined in zebrafish larvae. Under the experimental conditions described in Section 3.3.1, no obvious toxicity was observed at concentrations up to 1000 μg·mL−1. Therefore, 1000 μg·mL−1 was defined as the MTC and selected as the highest concentration for subsequent pharmacological evaluation (Table 6).
Table 6.
Results of Maca improving Parkinson’s concentration (n = 30).
4.3.2. Evaluation of Motor Function Improvement Effects
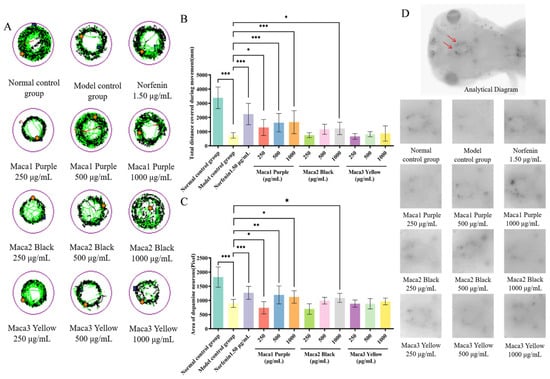
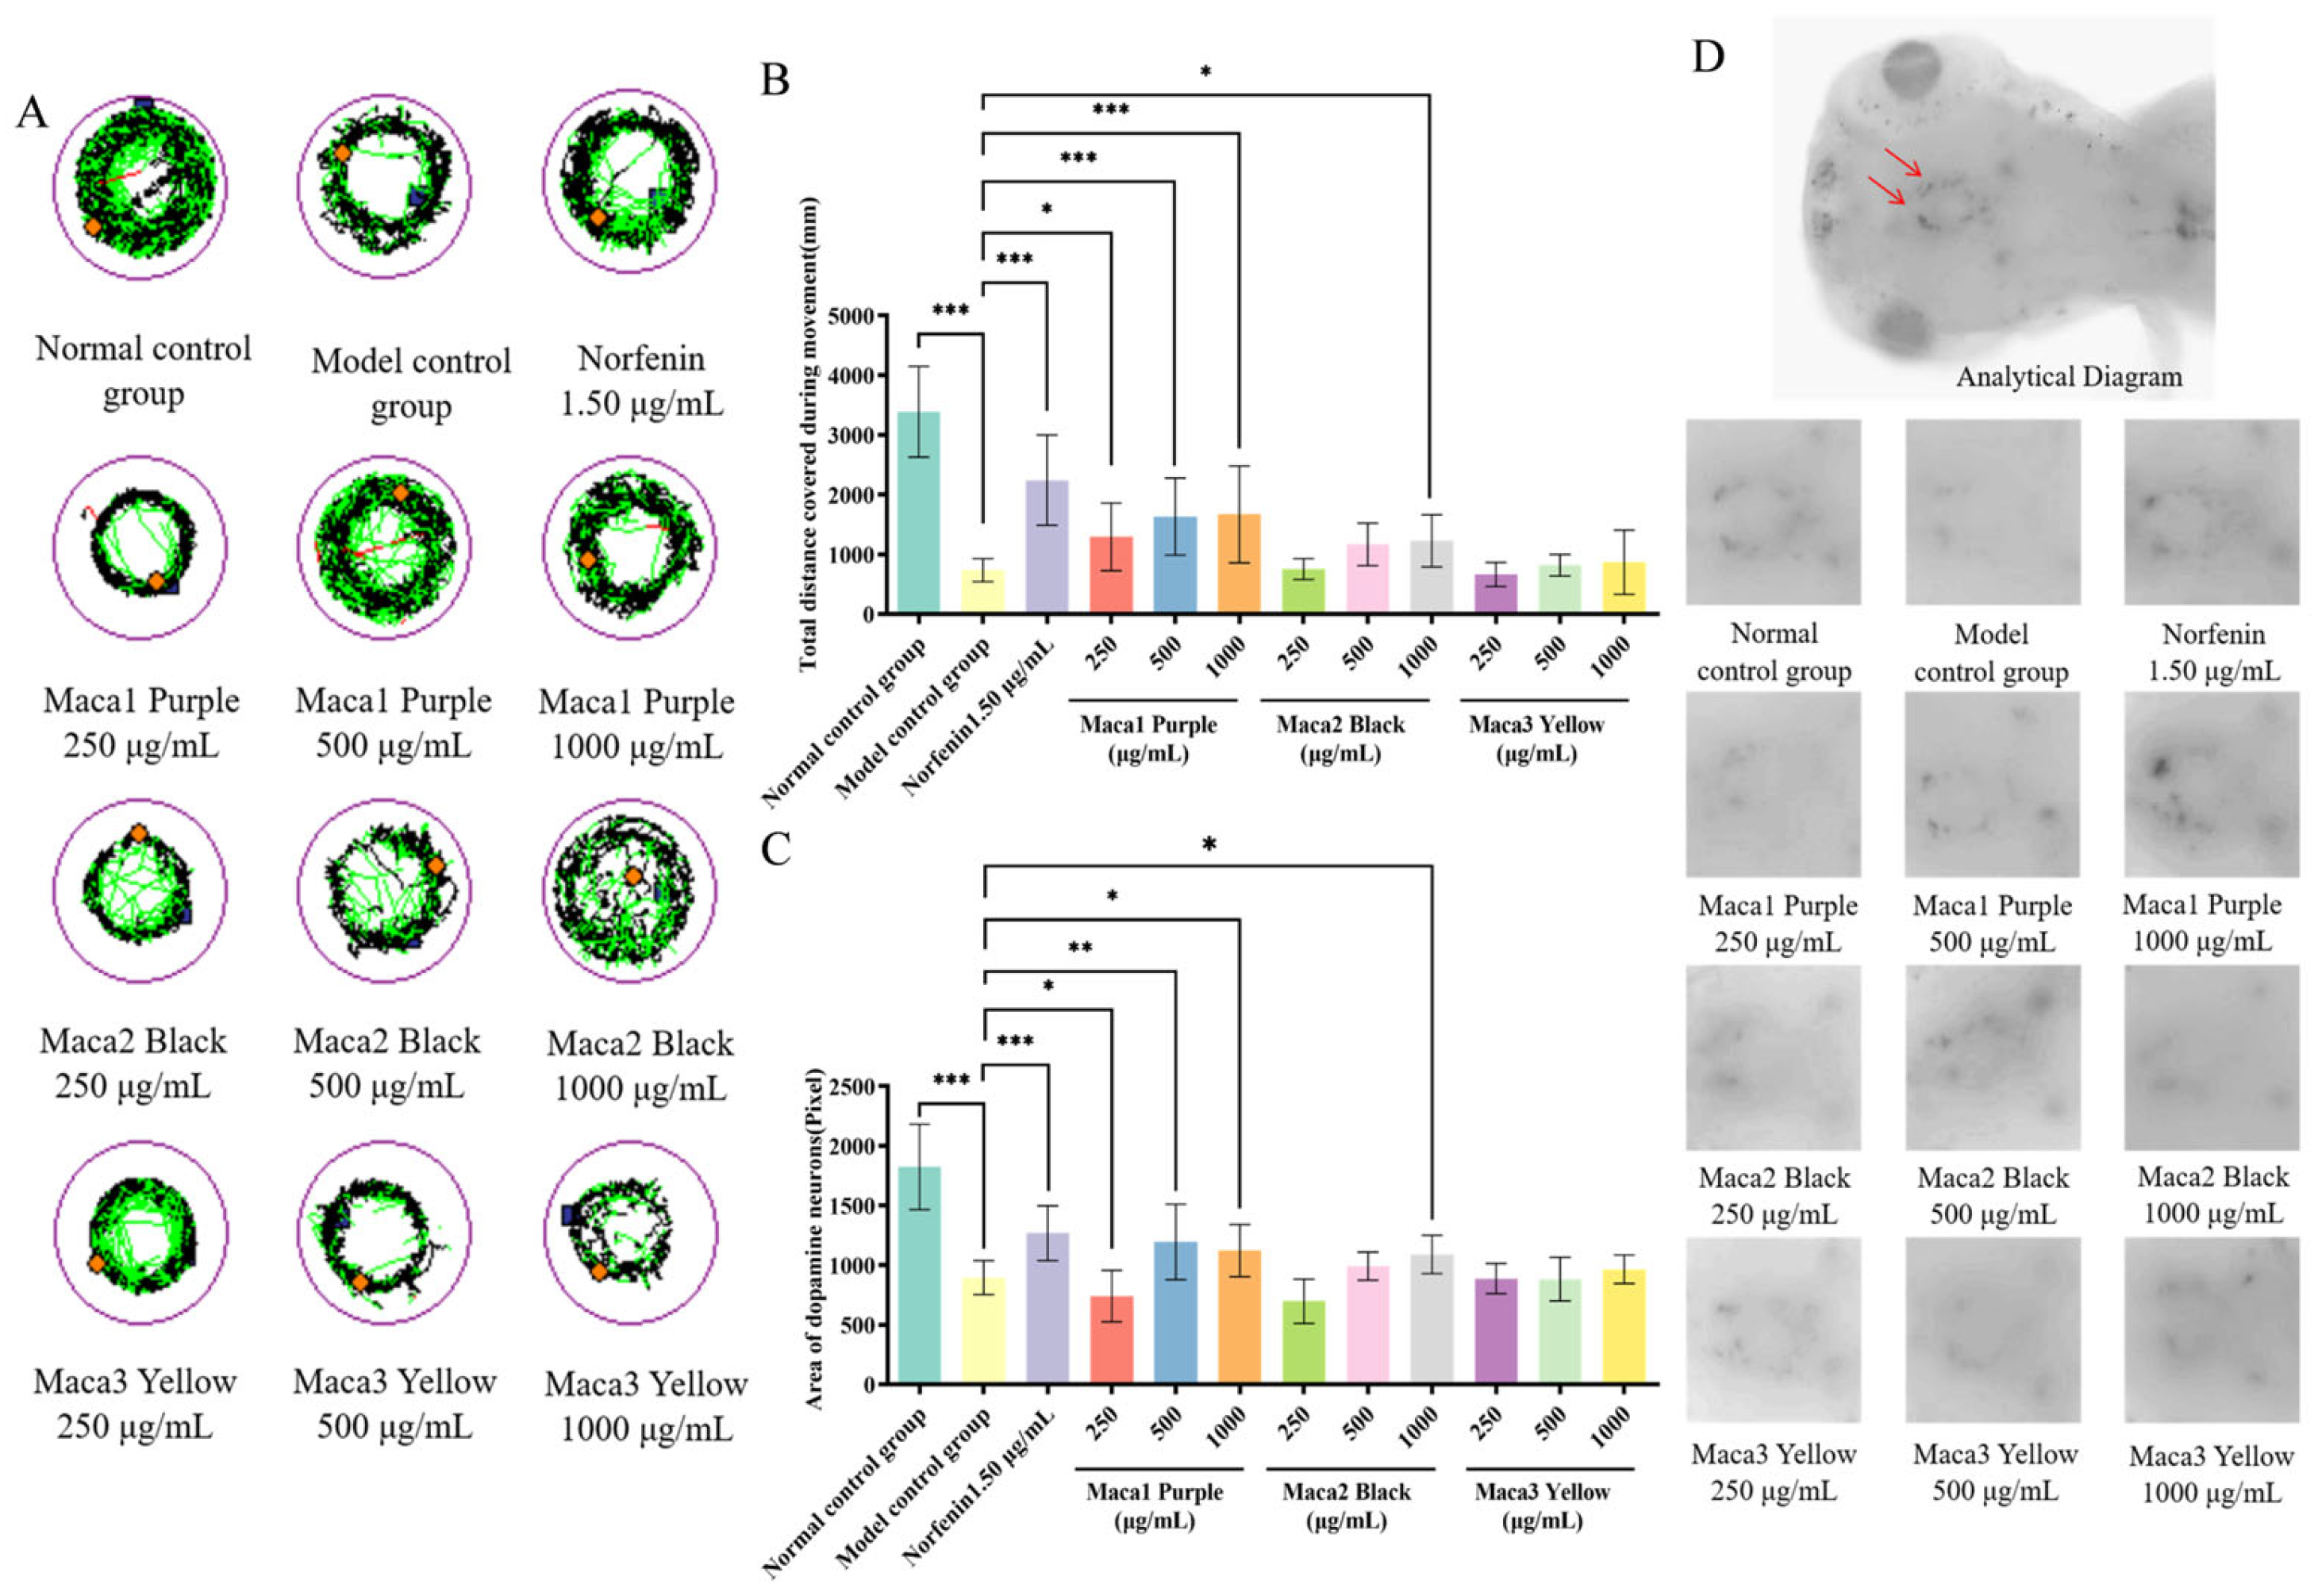
As shown in Table 7 and Figure 4A,B, MPTP exposure markedly reduced the locomotor activity of zebrafish larvae compared with the normal control group. Treatment with Maca1 Purple increased the total swimming distance in a concentration-dependent manner. At higher concentrations, the locomotor activity was significantly improved compared with the model group (p < 0.05).
Table 7.
Efficacy evaluation of the samples in improving the motor function (n =10).
Figure 4.
Effects of Maca on locomotor behavior and dopaminergic neurons in the zebrafish Parkinson’s disease model. (A) Typical plots of zebrafish movement after sample treatment. (B) Total movement distance of zebrafish after sample treatment. (C) Zebrafish dopamine neuron area after sample treatment. (D) Representative plots of dopamine neuron area in zebrafish after sample treatment. Note: The orange diamond indicates the starting point of zebrafish locomotion; The black line indicates the distance covered at slow speed, the green line at medium speed, and the red line at fast speed; The red arrows indicate dopaminergic neurons in the zebrafish brain. Compared with the model control group, * p < 0.05, ** p < 0.01, *** p < 0.001.
Maca2 Black also increased locomotor activity, particularly at the high-dose level. In contrast, the improvement observed in the Maca3 Yellow group was less pronounced under the same experimental conditions.
4.3.3. Evaluation of Efficacy in Improving Dopaminergic Neuronal Damage
As shown in Table 8 and Figure 4C,D, MPTP treatment resulted in a marked reduction in the dopaminergic neuronal area compared with the normal control group. Treatment with Maca1 Purple increased the dopaminergic neuronal area in a concentration-dependent manner. Significant differences were observed between the treated and model groups at higher concentrations (p < 0.05). A similar trend was observed in the Maca2 Black group, whereas the effect observed in the Maca3 Yellow group was comparatively smaller. These results indicate differences in neuroprotective efficacy among Maca varieties under the present experimental conditions.
Table 8.
Results of efficacy evaluation of dopaminergic neurons (n = 10).
Collectively, the zebrafish experiments demonstrated that Maca extracts from different color varieties exhibited distinct neuroprotective effects in the MPTP-induced Parkinson’s disease model. Under the present experimental conditions, purple Maca generally showed the strongest activity, followed by black Maca, whereas yellow Maca displayed comparatively weaker effects.
4.4. Correlation Analysis of Chemical Constituents and Biological Effects
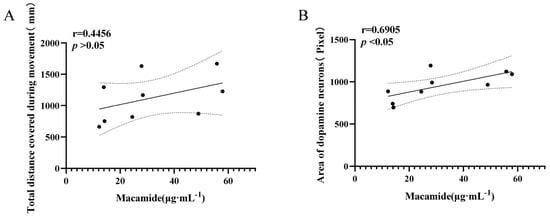
To explore the potential association between characteristic constituent abundance and neuroprotective effects, Pearson correlation analysis was performed using the cumulative contents of four representative Maca constituents (M1–M4) and the corresponding pharmacological indicators obtained from the zebrafish model. As shown in Figure 5A, locomotor performance tended to increase with increasing constituent content (r = 0.4456). However, the correlation did not reach statistical significance (p > 0.05), indicating that variation in the quantified constituents was not significantly associated with locomotor activity under the present experimental conditions. In contrast, a significant positive correlation was observed between constituent content and dopaminergic neuronal area (r = 0.6905, p < 0.05; Figure 5B). Samples containing higher levels of the quantified characteristic constituents generally exhibited larger dopaminergic neuronal areas in the zebrafish model.
Figure 5.
Results of correlation analysis between chemical composition and biological effects. (A) Concentration-dependent positive correlation between macamide concentration (μg·mL−1) and total distance covered during movement (mm) of zebrafish. (B) Stable positive correlation between macamide concentration and dopaminergic neuron area (pixels). Results confirm that macamides can improve motor function and protect dopaminergic neurons in model animals, providing direct evidence for their anti-Parkinson’s disease activity.
These results suggest that the quantified characteristic constituents might be more closely associated with dopaminergic neuron preservation than with behavioral recovery, representing potential Q-markers of Maca. Nevertheless, the present correlation analysis provides only preliminary evidence of a chemical–effect association and does not establish a causal relationship between individual constituents and neuroprotective activity. We will further carry out relevant experiments in vivo.
5. Discussion
Maca is currently available in several commercial color varieties, among which purple, black, and yellow Maca are the most widely cultivated and utilized. Although these varieties are generally considered to differ in quality, systematic evidence linking their chemical characteristics with biological activities remains limited. In the present study, untargeted metabolomic analysis revealed clear metabolic differences among the three color varieties. Pairwise comparisons further demonstrated that the extent and composition of metabolic variation differed among color varieties. Compared with black Maca, purple Maca exhibited differential accumulation of several characteristic secondary metabolites, including macamides, glucosinolates, phenylpropanoid derivatives, and phosphatidic acids. These results indicate that, although purple and black Maca shared relatively similar overall metabolic profiles, they differed in the abundance of several specialized metabolites, particularly lipophilic constituents and sulfur-containing metabolites.
The largest metabolic divergence was observed between purple and yellow Maca. In addition to changes in primary metabolites, substantial differences were detected in characteristic Brassicaceae-related metabolites, including 5-methylsulfinylpentylglucosinolate, 4-O-α-L-rhamnopyranosylglucosinalbin, and the sulfur-containing phytoalexin (S)-spirobrassinin, together with characteristic macamides and several phenylpropanoid derivatives. Pigment-associated metabolites, including anthocyanin-related compounds, were also differentially accumulated, which may contribute to the distinct hypocotyl pigmentation observed between purple and yellow Maca. These findings indicated that the metabolic distinction between purple and yellow Maca extends beyond primary metabolism and involves multiple classes of specialized metabolites associated with plant defense, secondary metabolism, and pigmentation.
Compared with yellow Maca, black Maca also showed significant differences in characteristic sulfur-containing metabolites, phosphatidic acids, and lipid-derived metabolites, whereas fewer pigment-associated metabolites were differentially accumulated than in the purple–yellow comparison. The consistent variation in glucosinolates, macamides, membrane lipids, and phenylpropanoid derivatives in purple and black Maca relative to yellow Maca suggested that these metabolite classes might contribute to the chemical differences underlying the quality characteristics of different Maca varieties. In particular, macamides are characteristic lipophilic constituents of Maca, whereas glucosinolates and spirobrassinin are characteristic metabolites associated with Brassicaceae plants. Their coordinated variation among color varieties suggests that the observed chemical divergence may involve coordinated changes in multiple branches of specialized metabolism rather than alterations in a single metabolic pathway. This interpretation is generally consistent with previous metabolomic studies reporting distinct metabolic profiles among Maca varieties [20,21]. However, the specific biosynthetic mechanisms responsible for these differences remain to be elucidated.
To further characterize quality-related chemical constituents, three representative macamides and one representative macaene were quantitatively determined using a validated HPLC-DAD method. Unlike untargeted metabolomics, which provides a global overview of metabolic variation, targeted quantitative analysis enables accurate determination of selected representative constituents and therefore provides complementary information for quality evaluation. The results showed that purple and black Maca contained significantly higher levels of the four quantified constituents than yellow Maca. This distribution pattern was generally consistent with previous reports describing differences in characteristic lipophilic constituents among Maca color varieties [22,23]. More importantly, the targeted analysis provided quantitative evidence for the differential accumulation of representative characteristic constituents identified or suggested by the metabolomic analysis, thereby complementing the global metabolic profiling and providing potentially useful chemical parameters for routine quality assessment.
The biological evaluation further demonstrated that all three Maca varieties exerted neuroprotective effects in the MPTP-induced zebrafish model, although the magnitude of the effects differed among varieties. Purple Maca produced the greatest improvement in locomotor behavior and the greatest preservation of dopaminergic neurons, followed by black Maca, whereas yellow Maca demonstrated comparatively weaker effects. Previous studies have reported that Maca extracts and Maca-derived lipophilic constituents possess antioxidant and neuroprotective properties in cellular and animal models [24,25]. These effects have been associated with the attenuation of oxidative stress, preservation of mitochondrial function, and regulation of neuronal survival-related signaling pathways. The stronger neuroprotective effect observed for purple Maca in the present study was accompanied by its relatively higher abundance of the quantified characteristic constituents. Nevertheless, the contribution of other metabolites identified by untargeted metabolomics cannot be excluded; further experiments will be carried out.
An important finding of the present study was that the differences in the quantified characteristic constituents generally paralleled the differences in neuroprotective effects among the three Maca varieties. Correlation analysis further showed a significant positive association between the total concentration of the four quantified characteristic constituents and dopaminergic neuronal area, whereas the association with total locomotor distance was not statistically significant. The stronger association with dopaminergic neuronal area may reflect the fact that this parameter more directly represents the preservation of dopaminergic neuronal integrity, whereas locomotor behavior can be influenced by multiple physiological and behavioral processes. However, this interpretation should be considered exploratory because correlation analysis alone cannot establish causality. Taken together, the consistency among metabolomic profiling, targeted quantitative analysis, and biological evaluation suggests that the quantified characteristic constituents, particularly macamides and macaene, may represent potential quality-related chemical candidates for differentiating Maca varieties.
Several limitations of the present study should be acknowledged. First, only three Maca color varieties and four representative characteristic constituents were investigated; therefore, the findings may not fully represent the chemical diversity of Maca resources or the contributions of other metabolites to biological activity. In addition, the samples analyzed in this study may not capture variation associated with geographical origin, cultivation conditions, harvest time, or processing, all of which should be considered in future quality evaluations. Second, neuroprotective activity was evaluated using an MPTP-induced zebrafish model. Although this model provides a useful platform for comparative assessment, validation in mammalian models is necessary to further evaluate the biological relevance and translational potential of the observed effects. Third, although a positive association was observed between characteristic constituent abundance and dopaminergic neuronal preservation, the contributions of individual compounds and their underlying molecular mechanisms remain unclear. Future studies should therefore combine larger and geographically diverse sample sets with bioactivity-guided fractionation, isolation of individual active constituents, and mechanistic investigations. Such studies will help determine whether the quantified macamides and macaene directly contribute to the observed neuroprotective effects and will further support the establishment of robust chemical and biological markers for Maca quality evaluation.
Overall, the present study demonstrated that purple, black, and yellow Maca differ substantially in both their metabolic profiles and neuroprotective activities. The integration of untargeted metabolomics, targeted quantitative analysis, and zebrafish bioactivity evaluation provided complementary chemical and biological evidence for distinguishing Maca color varieties. Purple Maca exhibited the strongest neuroprotective activity and relatively higher levels of the quantified characteristic constituents, while the significant association between constituent abundance and dopaminergic neuronal preservation further supports their potential relevance to functional quality. Although further validation is required to establish causal relationships and reliable quality markers, the integrated chemical composition–biological effect strategy developed in this study provides a useful framework for comprehensive quality evaluation and rational utilization of different Maca varieties.
6. Conclusions
This study systematically evaluated the quality characteristics of purple, black, and yellow Maca using an integrated chemical composition–biological effect strategy. Untargeted metabolomics revealed distinct metabolic profiles among the three Maca varieties, demonstrating substantial variation in their chemical composition. Targeted HPLC-DAD analysis further showed that purple and black Maca contained higher levels of the three quantified macamides and one macaene than yellow Maca. Consistently, all three Maca varieties exhibited neuroprotective effects in the MPTP-induced zebrafish Parkinson’s disease model, with purple Maca showing the strongest effects on locomotor activity and dopaminergic neuronal preservation under the present experimental conditions. Moreover, the abundance of the quantified characteristic constituents was positively associated with dopaminergic neuronal preservation, although no significant association was observed with locomotor behavior. Collectively, these findings indicate that the chemical differences among Maca color varieties are accompanied by differences in neuroprotective effects and suggest that characteristic macamides and macaene may serve as potential quality-related chemical candidates. The integrated strategy established in this study provides complementary chemical and biological evidence for differentiating Maca varieties and offers a useful scientific framework for quality evaluation and rational utilization of Maca resources.
Supplementary Materials
The following supporting information can be downloaded at https://www.mdpi.com/article/10.3390/metabo16110828/s1. Table S1: Differential components of Purple Maca vs. Black Maca; Table S2: Differential metabolites of Yellow Maca vs. Purple Maca; Table S3: Differential metabolites of Yellow vs. Black Maca; Table S4: Recovery test results of four compounds (n = 3).
Author Contributions
R.F.: writing—original draft, visualization, data curation. M.T.: resources, formal analysis. Q.L. and M.J.M.: software, methodology. K.L. and M.W.: validation. J.Y. and F.K.: validation, software. B.B.: review and editing, investigation. H.W.: review and editing, investigation. Y.Z.: supervision, project administration, review and editing, funding acquisition, conceptualization. All authors have read and agreed to the published version of the manuscript.
Funding
This study was funded by the National Natural Science Foundation of China (82404971); the State Key Laboratory of Integration and Innovation of Classic Formula and Modern Chinese Medicine (LSLSKL 2024030); the Scientific and Technological Innovation Project of the China Academy of Chinese Medical Sciences (CI2023C057YLL;CI2026A04506;CI2026A04509); Outstanding young talents training program of China Academy of Chinese Medical Sciences (ZZ15-YQ-038); National Key R&D Program of China (2023YFC2308200).
Institutional Review Board Statement
The animal study protocol was approved by the Institutional Animal Care and Use Committee (IACUC) of Hunter Biotech Company and conducted in accordance with the National Guidelines for Laboratory Animal Welfare (IACUC-2023-8120-01, 27 December 2023).
Informed Consent Statement
Not applicable.
Data Availability Statement
The original contributions presented in this study are included in the article. Further inquiries can be directed to the corresponding author.
Acknowledgments
We extend our sincerest thanks to all the authors for their contributions to the manuscript. The research was supported by the Institute of Chinese Materia Medica, China Academy of Chinese Medical Sciences.
Conflicts of Interest
Fangang Kong is an employee of Cisen Pharmaceutical Co., Ltd. The paper reflects the views of the scientists, and not the company. The other authors declare no conflicts of interest.
References
- Yang, X.; Wang, M.; Zhou, Q.; Bai, Y.; Liu, J.; Yang, J.; Li, L.; Li, G.; Luo, L. Macamide B Pretreatment Attenuates Neonatal Hypoxic-Ischemic Brain Damage of Mice Induced Apoptosis and Regulates Autophagy via the PI3K/AKT Signaling Pathway. Mol. Neurobiol. 2022, 59, 2776–2798. [Google Scholar] [CrossRef] [Scilit]
- Di Lodovico, S.; Napoli, E.; Di Campli, E.; Di Fermo, P.; Gentile, D.; Ruberto, G.; Nostro, A.; Marini, E.; Cellini, L.; Di Giulio, M. Pistacia vera L. oleoresin and levofloxacin is a synergistic combination against resistant Helicobacter pylori strains. Sci. Rep. 2019, 9, 4646. [Google Scholar] [CrossRef] [Scilit]
- Li, Y.L. Study on the Chemical Constituents of MACA. Master’s Thesis, Shenzhen University, Shenzhen, China, 2022. [Google Scholar]
- Zhou, Y.Y. Chemical Analysis of Maca and the Mechanism of the Neuroprotective Effect on Its Active Ingredients. Doctoral Dissertation, China Academy of Chinese Medical Sciences, Beijing, China, 2017. [Google Scholar]
- Mloston, G.; Kowalczyk, M.; Celeda, M.; Gach-Janczak, K.; Janecka, A.; Jasinski, M. Synthesis and Cytotoxic Activity of Lepidilines A–D: Comparison with Some 4,5-Diphenyl Analogues and Related Imidazole-2-thiones. J. Nat. Prod. 2021, 84, 3071–3079. [Google Scholar] [CrossRef] [Scilit]
- Wu, H.; Kelley, C.J.; Pino-Figueroa, A.; Vu, H.D.; Maher, T.J. Macamides and their synthetic analogs: Evaluation of in vitro FAAH inhibition. Bioorganic Med. Chem. 2013, 21, 5188–5197. [Google Scholar] [CrossRef] [Scilit]
- Yu, Z.; Jin, W.; Cui, Y.; Ao, M.; Liu, H.; Xu, H.; Yu, L. Protective effects of macamides from Lepidium meyenii Walp. against corticosterone-induced neurotoxicity in PC12 cells. RSC Adv. 2019, 9, 23096–23108. [Google Scholar] [CrossRef] [Scilit]
- Liu, Z.-j.; Shi, Z.-l.; Tu, C.; Zhang, H.-z.; Gao, D.; Li, C.-y.; He, Q.; Li, R.-s.; Guo, Y.-m.; Niu, M.; et al. An activity-calibrated chemical standardization approach for quality evaluation of Salvia miltiorrhiza Bge. RSC Adv. 2017, 7, 5331–5339. [Google Scholar] [CrossRef] [Scilit]
- Tao, H.; Shi, H.; Wang, M.; Xu, Y. Macamide B suppresses lung cancer progression potentially via the ATM signaling pathway. Oncol. Lett. 2023, 25, 115. [Google Scholar] [CrossRef] [Scilit]
- Zhou, Y.; Wang, H.; Guo, F.; Si, N.; Brantner, A.; Yang, J.; Han, L.; Wei, X.; Zhao, H.; Bian, B. Integrated Proteomics and Lipidomics Investigation of the Mechanism Underlying the Neuroprotective Effect of N-benzylhexadecanamide. Molecules 2018, 23, 2929. [Google Scholar] [CrossRef] [Scilit]
- Chen, Q.; Li, M.; Wang, C.; Li, Z.; Xu, J.; Zheng, Q.; Liu, P.; Zhou, H. Combining Targeted Metabolites Analysis and Transcriptomics to Reveal Chemical Composition Difference and Underlying Transcriptional Regulation in Maca (Lepidium meyenii Walp.) Ecotypes. Genes 2018, 9, 335. [Google Scholar] [CrossRef] [Scilit]
- Geng, P.; Sun, J.; Chen, P.; Brand, E.; Frame, J.; Meissner, H.; Stewart, J.; Gafner, S.; Clark, S.; Miller, J.; et al. Characterization of Maca (Lepidium meyenii/Lepidium peruvianum) Using a Mass Spectral Fingerprinting, Metabolomic Analysis, and Genetic Sequencing Approach. Planta Med. 2020, 86, 674–685. [Google Scholar] [CrossRef] [Scilit]
- Qian, M.; Gu, J.; Zhang, H.; Wang, J.; Xiao, R.; Chen, X.; Cao, L.; Wang, Z.; Xiao, W. A multi-index decision analysis method for saposhnikoviae radix based on biological-chemical integrative evaluation. J. Pharm. Biomed. Anal. 2025, 265, 117059. [Google Scholar] [CrossRef] [Scilit]
- U.S. Food and Drug Administration. Department of Health and Human Services Botanical Drug Development Guidance for Industry (Draft Guidance); U.S. Food and Drug Administration: Silver Spring, MD, USA, 2015.
- Ouyang, J.; Hu, N.; Wang, H. Isolation, Purification and Tyrosinase Inhibitory Activity of Anthocyanins and Their Novel Degradation Compounds from Solanum tuberosum L. Molecules 2024, 29, 1492. [Google Scholar] [CrossRef] [Scilit]
- Babolmorad, G.; Latif, A.; Domingo, I.K.; Pollock, N.M.; Delyea, C.; Rieger, A.M.; Allison, W.T.; Bhavsar, A.P. Toll-like receptor 4 is activated by platinum and contributes to cisplatin-induced ototoxicity. EMBO Rep. 2021, 22, e51280. [Google Scholar] [CrossRef] [Scilit]
- Li, Z.; Fang, F.; Li, Y.; Lv, X.; Zheng, R.; Jiao, P.; Wang, Y.; Zhu, G.; Jin, Z.; Xu, X.; et al. Carbazole and tetrahydro-carboline derivatives as dopamine D(3) receptor antagonists with the multiple antipsychotic-like properties. Acta Pharm. Sin. B 2023, 13, 4553–4577. [Google Scholar] [CrossRef] [Scilit]
- Li, M.; Zhang, X.; He, Q.; Chen, D.; Chen, F.; Wang, X.; Sun, S.; Sun, Y.; Li, Y.; Zhu, Z.; et al. Functional Interactions Between the Parafascicular Thalamic Nucleus and Motor Cortex Are Altered in Hemiparkinsonian Rat. Front. Aging Neurosci. 2022, 14, 800159. [Google Scholar] [CrossRef] [Scilit]
- Que, R.; Zheng, J.; Chang, Z.; Zhang, W.; Li, H.; Xie, Z.; Huang, Z.; Wang, H.T.; Xu, J.; Jin, D.; et al. Dl-3-n-Butylphthalide Rescues Dopaminergic Neurons in Parkinson’s Disease Models by Inhibiting the NLRP3 Inflammasome and Ameliorating Mitochondrial Impairment. Front. Immunol. 2021, 12, 794770. [Google Scholar] [CrossRef] [Scilit]
- Minich, D.M.; Ross, K.; Frame, J.; Fahoum, M.; Warner, W.; Meissner, H.O. Not All Maca Is Created Equal: A Review of Colors, Nutrition, Phytochemicals, and Clinical Uses. Nutrients 2024, 16, 530. [Google Scholar] [CrossRef] [Scilit]
- Zhang, S.Z.; Yang, F.; Shao, J.L.; Pu, H.M.; Ruan, Z.Y.; Yang, W.L.; Li, H. The metabolic formation profiles of macamides accompanied by the conversion of glucosinolates in maca (Lepidium meyenii) during natural air drying. Int. J. Food Sci. Technol. 2020, 55, 2428–2440. [Google Scholar] [CrossRef] [Scilit]
- Chen, H.Y.; Sun, J.H.; Yu, Z.Y.; Chen, M.; Li, H.M. Progress in Pharmacology and Toxicology of Maca. World Chin. Med. 2021, 16, 1031–1035+1040. [Google Scholar]
- Kang, S.; Ahn, B.O.; Park, M.H.; Lim, S.T.; Lee, E. Effects of Black Maca supplement on isokinetics muscular performance of elite women’s handball players: Placebo-controlled, crossover study. Food Nutr. Res. 2023, 67, 10–29219. [Google Scholar] [CrossRef] [Scilit]
- Yu, Z.; Jin, W.; Dong, X.; Ao, M.; Liu, H.; Yu, L. Safety evaluation and protective effects of ethanolic extract from maca (Lepidium meyenii Walp.) against corticosterone and H2O2 induced neurotoxicity. Regul. Toxicol. Pharmacol. 2020, 111, 104570. [Google Scholar] [CrossRef] [Scilit]
- Wang, S.; Zhu, F. Chemical composition and health effects of maca (Lepidium meyenii). Food Chem. 2019, 288, 422–443. [Google Scholar] [CrossRef] [Scilit]

Disclaimer/Publisher’s Note: The statements, opinions and data contained in all publications are solely those of the individual author(s) and contributor(s) and not of MDPI and/or the editor(s). MDPI and/or the editor(s) disclaim responsibility for any injury to people or property resulting from any ideas, methods, instructions or products referred to in the content. |
© 2026 by the authors. Licensee MDPI, Basel, Switzerland. This article is an open access article distributed under the terms and conditions of the Creative Commons Attribution (CC BY) license.