


Abstract
Background/Objectives: Chronic sucrose consumption may contribute to progressive metabolic dysfunction, but the combined influence of long-term exposure, aging, sex, and dietary fiber on hepatic lipid metabolism remains insufficiently understood. This study investigated how time and sex influence hepatic lipid metabolism during chronic sucrose supplementation and characterized responses under different dietary backgrounds. Methods: A total of 120 Wistar Han rats (60 males and 60 females) were allocated to four dietary treatments: control diet (CON), control diet with increased fiber content (CON-fiber), 30% sucrose in drinking water (HS), or 30% sucrose in drinking water with high fiber content (HS-fiber). Five animals of each sex per treatment were euthanized after 1, 12, or 24 months. Glucose homeostasis, hepatic fatty-acid composition, serum malondialdehyde (MDA), and hepatic expression of SCD1, Fads1, Fads2, NRF2, TNFα, and TGFβ were evaluated. Results: Treatment effects became prominent after 12 and 24 months. Chronic sucrose intake increased body mass in HS rats, impaired glucose homeostasis and insulin sensitivity, shifted the hepatic fatty-acid profile toward monounsaturated fatty acids, and reduced several n-3 and n-6 polyunsaturated fatty acids. Increased SCD1 expression accompanied increased relative proportions of palmitoleic and oleic acids, whereas Fads1 and Fads2 showed treatment-associated differences within individual sampling points. Sucrose-exposed groups also developed increased lipid peroxidation and a pro-inflammatory transcriptional response. Conclusions: Metabolic, oxidative, and inflammatory alterations were observed in sucrose-fed groups, with treatment-associated differences depending on sex and sampling time point. These findings emphasize the importance of exposure duration and biological sex in shaping metabolic responses during aging.
1. Introduction
The prevalence of obesity has increased dramatically over recent decades worldwide [1,2]. This trend is driven by greater consumption of energy-dense foods and beverages rich in saturated fats and free sugars, together with decreased levels of physical activity [3]. Obesity is now recognized as a major global public health challenge, contributing to metabolic disorders such as insulin resistance, metabolic dysfunction-associated steatotic liver disease (MASLD), cardiovascular disease, and premature mortality [4,5]. In addition to the increasing prevalence of obesity, population aging is another global trend with profound metabolic implications [6]. Aging is accompanied by physiological changes such as reduced basal metabolic rate, sarcopenia, hormonal alterations, and chronic low-grade inflammation, all of which contribute to increased susceptibility to metabolic dysfunction [7].
Importantly, aging and obesity share overlapping molecular mechanisms, including mitochondrial dysfunction, oxidative stress and altered fatty acid composition, which together exacerbate metabolic deterioration [8,9]. Therefore, the coexistence of aging and long-term obesity represents a compounded metabolic burden, particularly in the liver, where prolonged exposure to excess nutrients accelerates lipid remodeling and functional decline.
The liver plays a central role in lipid metabolism, regulating fatty acid uptake, synthesis, desaturation, elongation, and oxidation [10,11]. Alterations in hepatic fatty acid composition are closely linked to metabolic dysfunction, inflammation, and disease progression in obesity and MASLD [12]. In particular, imbalances between saturated, monounsaturated (MUFAs), and polyunsaturated fatty acids (PUFAs), as well as shifts in n-3 and n-6 PUFA families, have been associated with hepatic steatosis, oxidative stress, and impaired cellular signaling [13,14,15,16].
Endogenous fatty acid desaturases, including stearoyl-CoA desaturase-1 (SCD-1; Δ9 desaturase) and the Δ5 and Δ6 desaturases, are key regulators of hepatic lipid homeostasis [17,18]. Increased SCD-1 activity promotes MUFA synthesis and lipid accumulation, whereas alterations in Δ5 and Δ6 desaturase activities influence the availability of long-chain PUFA derived from essential fatty acids [17,18]. Both obesity and aging have been shown to modify desaturase expression and activity; however, data on their combined long-term effects, particularly across prolonged dietary exposure, remain limited [19,20].
Dietary fiber has attracted considerable interest as a potential modulator of obesity-associated metabolic disturbances. High-fiber diets can influence host metabolism in part through diet–microbiota interactions [21]. Experimental studies, including our previous work in sucrose-fed rats, suggest that a high-fiber dietary background may attenuate selected aspects of hepatic lipid accumulation and lipid remodeling, although the magnitude and persistence of these effects depend on the overall dietary context [22].
Furthermore, sex-specific differences in lipid metabolism are well documented, with sex hormones influencing fatty acid synthesis, desaturation, and storage [23]. Despite this, many studies have focused on a single sex or short experimental durations, limiting insight into whether obesity-related alterations in hepatic fatty acid metabolism persist similarly in males and females over time.
Chronic sucrose consumption may contribute to progressive metabolic dysfunction, yet its long-term effects on hepatic fatty-acid metabolism, lipid peroxidation and inflammation and their interaction with aging and sex remain insufficiently understood. This is particularly relevant to translational medicine, as metabolic alterations that accumulate over years may contribute to age-related metabolic disorders and declining metabolic health in humans. Therefore, the present study aimed to characterize time-dependent changes during long-term sucrose exposure in male and female Wistar Han rats and to describe treatment-associated differences across the dietary groups and sexes at individual sampling points. These findings may provide insights into how prolonged dietary sugar intake and sex influence metabolic health during aging and help identify dietary factors with potential relevance for prevention and nutritional intervention in humans.
2. Materials and Methods
2.1. Animals and Experimental Design
All experimental procedures were performed in accordance with the Croatian Animal Welfare Act and were approved by the Croatian National Ethics Committee and the Veterinary Administration of the Ministry of Agriculture of the Republic of Croatia (authorization EP 410/2023, approved on 18 December 2023). The experimental design was based on previously described sucrose-fed and high-fiber rat models [22,24].
The experiment included 120 Wistar Han rats (60 males and 60 females) housed at the Laboratory Animal Unit of the Institute for Medical Research and Occupational Health, Zagreb, Croatia. Male and female Wistar rats with an average initial body weight of 220 ± 10 g (8 weeks old) were used over the period of 24 months. Animals were maintained in polycarbonate cages under a 12 h light/12 h dark cycle at 20 °C, with ad libitum access to food and drinking fluid. Following a 2-week acclimatization period on the control diet, animals were randomly allocated to four dietary treatments: control diet (CON), control diet with increased fiber content (CON-fiber), diet supplemented with 30% sucrose in drinking water (HS) and diet supplemented with 30% sucrose in drinking water and increased fiber content (HS-fiber) (Table 1). Body mass was recorded weekly, while food intake and water were not measured. Initially, 15 animals of each sex were allocated to each dietary treatment group (n = 15 per sex/group). Five animals per sex, dietary treatment, and sampling time point were euthanized after 1, 12, or 24 months (Figure 1). No animal deaths or exclusions occurred during the study.
Table 1.
Nutrient composition of the experimental diet.
2.2. Sample Collection
Animals were sacrificed by exsanguination in deep anesthesia with ketamine (80 mg/kg body mass) and xylazine (12 mg/kg body mass). Blood samples collected without anticoagulant were centrifuged at 3000 rpm for 10 min to separate the serum. Serum samples were stored at −80 °C until analysis. The liver was excised promptly after the animals were sacrificed, divided, and stored in an RNA-preserving agent (RNAlater, Thermo Fisher Scientific, Waltham, MA, USA) or −80 °C until further analysis.
Glucose Homeostasis Analyses and Serum Biochemistry
Following a 12 h fast, blood glucose concentrations were measured using an Accu-Chek Go blood glucose meter [25]. Serum insulin concentrations were measured using a commercially available rat insulin enzyme-linked immunosorbent assay kit (Rat Insulin ELISA Kit; Mercodia, Uppsala, Sweden) according to the manufacturer’s instructions.
Insulin resistance was estimated using the homeostasis model assessment of insulin resistance (HOMA-IR), calculated as follows:
HOMA-IR = fasting insulin (µU/mL) × fasting glucose (mmol/L)/22.5 [26].
Insulin sensitivity was estimated using the quantitative insulin sensitivity check index (QUICKI), calculated as follows:
QUICKI = 1/[log fasting insulin (µU/mL) + log fasting glucose (mg/dL)] [27].
At the 24-month sampling point, serum biochemical parameters were determined using an automated analyzer (SABA-18, Analyzers Medical System, Rome, Italy).
2.3. Hepatic Fatty-Acid Analysis
Total lipids were extracted from liver tissue using chloroform:methanol (2:1, v/v) according to Folch et al. [28]. Butylated hydroxytoluene was added as an antioxidant, after which the lipid extracts were dried under a stream of nitrogen and stored at −80 °C until further analysis. Fatty-acid methyl esters were prepared by base-catalyzed transmethylation according to Petrović et al. [29]. Briefly, the extracted lipids were transmethylated with 2 M methanolic KOH for 15 min at room temperature. The resulting fatty-acid methyl esters were extracted with n-hexane and transferred into 1.5-mL glass vials.
The hepatic fatty-acid profile was analyzed by gas chromatography–mass spectrometry using a QP2010 Ultra GC–MS system (Shimadzu, Kyoto, Japan) equipped with a BPX70 capillary column (30 m × 0.25 mm internal diameter, 0.25 µm film thickness; SGE Analytical Science, Austin, TX, USA), as previously described by Starčević et al. [30] and Mašek et al. [16]. The injector temperature was maintained at 250 °C, and 1 µL of each sample was injected using a split ratio of 1:80. Helium was used as the carrier gas at a linear velocity of 35 cm/s.
The oven temperature was initially maintained at 40 °C for 3 min, increased to 130 °C at a rate of 20 °C/min, and subsequently raised to 200 °C at a rate of 1.5 °C/min. Finally, the temperature was increased to 250 °C at a rate of 45 °C/min and maintained at 250 °C for 10 min. Individual fatty acids were identified by comparing their retention times with those of a 37-component fatty-acid methyl ester standard mixture (Supelco 37-Component FAME Mix; Merck, Darmstadt, Germany). Methyl tricosanoate (C23:0) was used as an internal standard. Individual fatty acids were expressed as percentages of the total identified fatty acids.
2.4. Malondialdehyde Analysis
Malondialdehyde (MDA) concentrations were determined in serum and liver tissue by high-performance liquid chromatography following derivatization with thiobarbituric acid, using the previously applied analytical approach [24]. The MDA–thiobarbituric acid derivatives were quantified using a Shimadzu LC-2010CHT system (Shimadzu, Kyoto, Japan) equipped with an InertSustain C18 reversed-phase column and detected by UV–visible absorbance at 532 nm. A calibration curve was prepared using 1,1,3,3-tetraethoxypropane as the MDA precursor.
2.5. RNA Isolation and Reverse Transcription Quantitative PCR
Total RNA was isolated from 30 mg of liver tissue using the SV Total RNA Isolation System (Promega, Madison, WI, USA) according to the manufacturer’s instructions and as previously described for rat liver tissue [15]. RNA concentration and purity were assessed using a NanoDrop spectrophotometer (Thermo Fisher Scientific, Wilmington, Delaware, SAD). RNA integrity and primer amplification efficiencies were not independently evaluated. One-step reverse transcription quantitative PCR was performed using the One Step TB Green PrimeScript RT-PCR Kit II (TaKaRa Bio, Shiga, Japan) on a Stratagene Mx3005P real-time PCR system (Agilent Technologies, Santa Clara, CA, USA).
Hepatic messenger RNA expression was determined for genes encoding stearoyl-CoA desaturase 1 (SCD1), fatty acid desaturase 1 (Fads1, D5D), fatty acid desaturase 2 (Fads2, D6D), nuclear factor erythroid 2-related factor 2 (NRF2), tumor necrosis factor (TNFα), and transforming growth factor beta 1 (TGFβ). β-Actin and cyclophilin were used as reference genes for normalization, based on their previous use in the same experimental model [24]. Each sample was analyzed in triplicate. Relative gene expression was calculated using the comparative threshold-cycle method (2−ΔΔCt) described by Livak and Schmittgen [31] and expressed as fold change relative to the corresponding sex- and time-matched control group. Primer sequences are provided in Table 2.
Table 2.
Primer sequences and cycling conditions for polymerase chain reactions.
2.6. Statistical Analysis
The sample size (n = 5 per group) was determined by an a priori power analysis based on variability estimates from our previous data, with a statistical power of 0.80. Fatty acid composition and insulin sensitivity indices were considered the principal variables for power calculations. An alpha level of 0.01 was used for the priori sample size calculation, whereas p < 0.05 was used as the threshold for statistical significance in the analyses. Statistical analyses were performed using GraphPad Prism 8 (GraphPad Software, San Diego, CA, USA). Data distribution was assessed using the Shapiro–Wilk test. Unless stated otherwise, results are presented as mean ± standard deviation, with five animals included per sex, dietary treatment, and sampling time point (n = 5 per group). Differences among dietary treatments were evaluated separately within each sex and sampling time point using one-way analysis of variance followed by Tukey’s multiple-comparison post hoc test. Multivariate analysis was performed using MetaboAnalyst 6.0. The sPLS-DA was exploratory and was not formally validated. Relative RT-qPCR expression was calculated using the 2−ΔΔCt method described by Livak and Schmittgen [31]. Differences were considered statistically significant at p < 0.05. Statistical analyses were performed to assess differences within individual time points, rather than differences between time points. Comparisons between the HS and HS-fiber groups were descriptive only, and no direct statistical comparisons between these groups were performed.
3. Results
3.1. Experimental Design and Body Weight
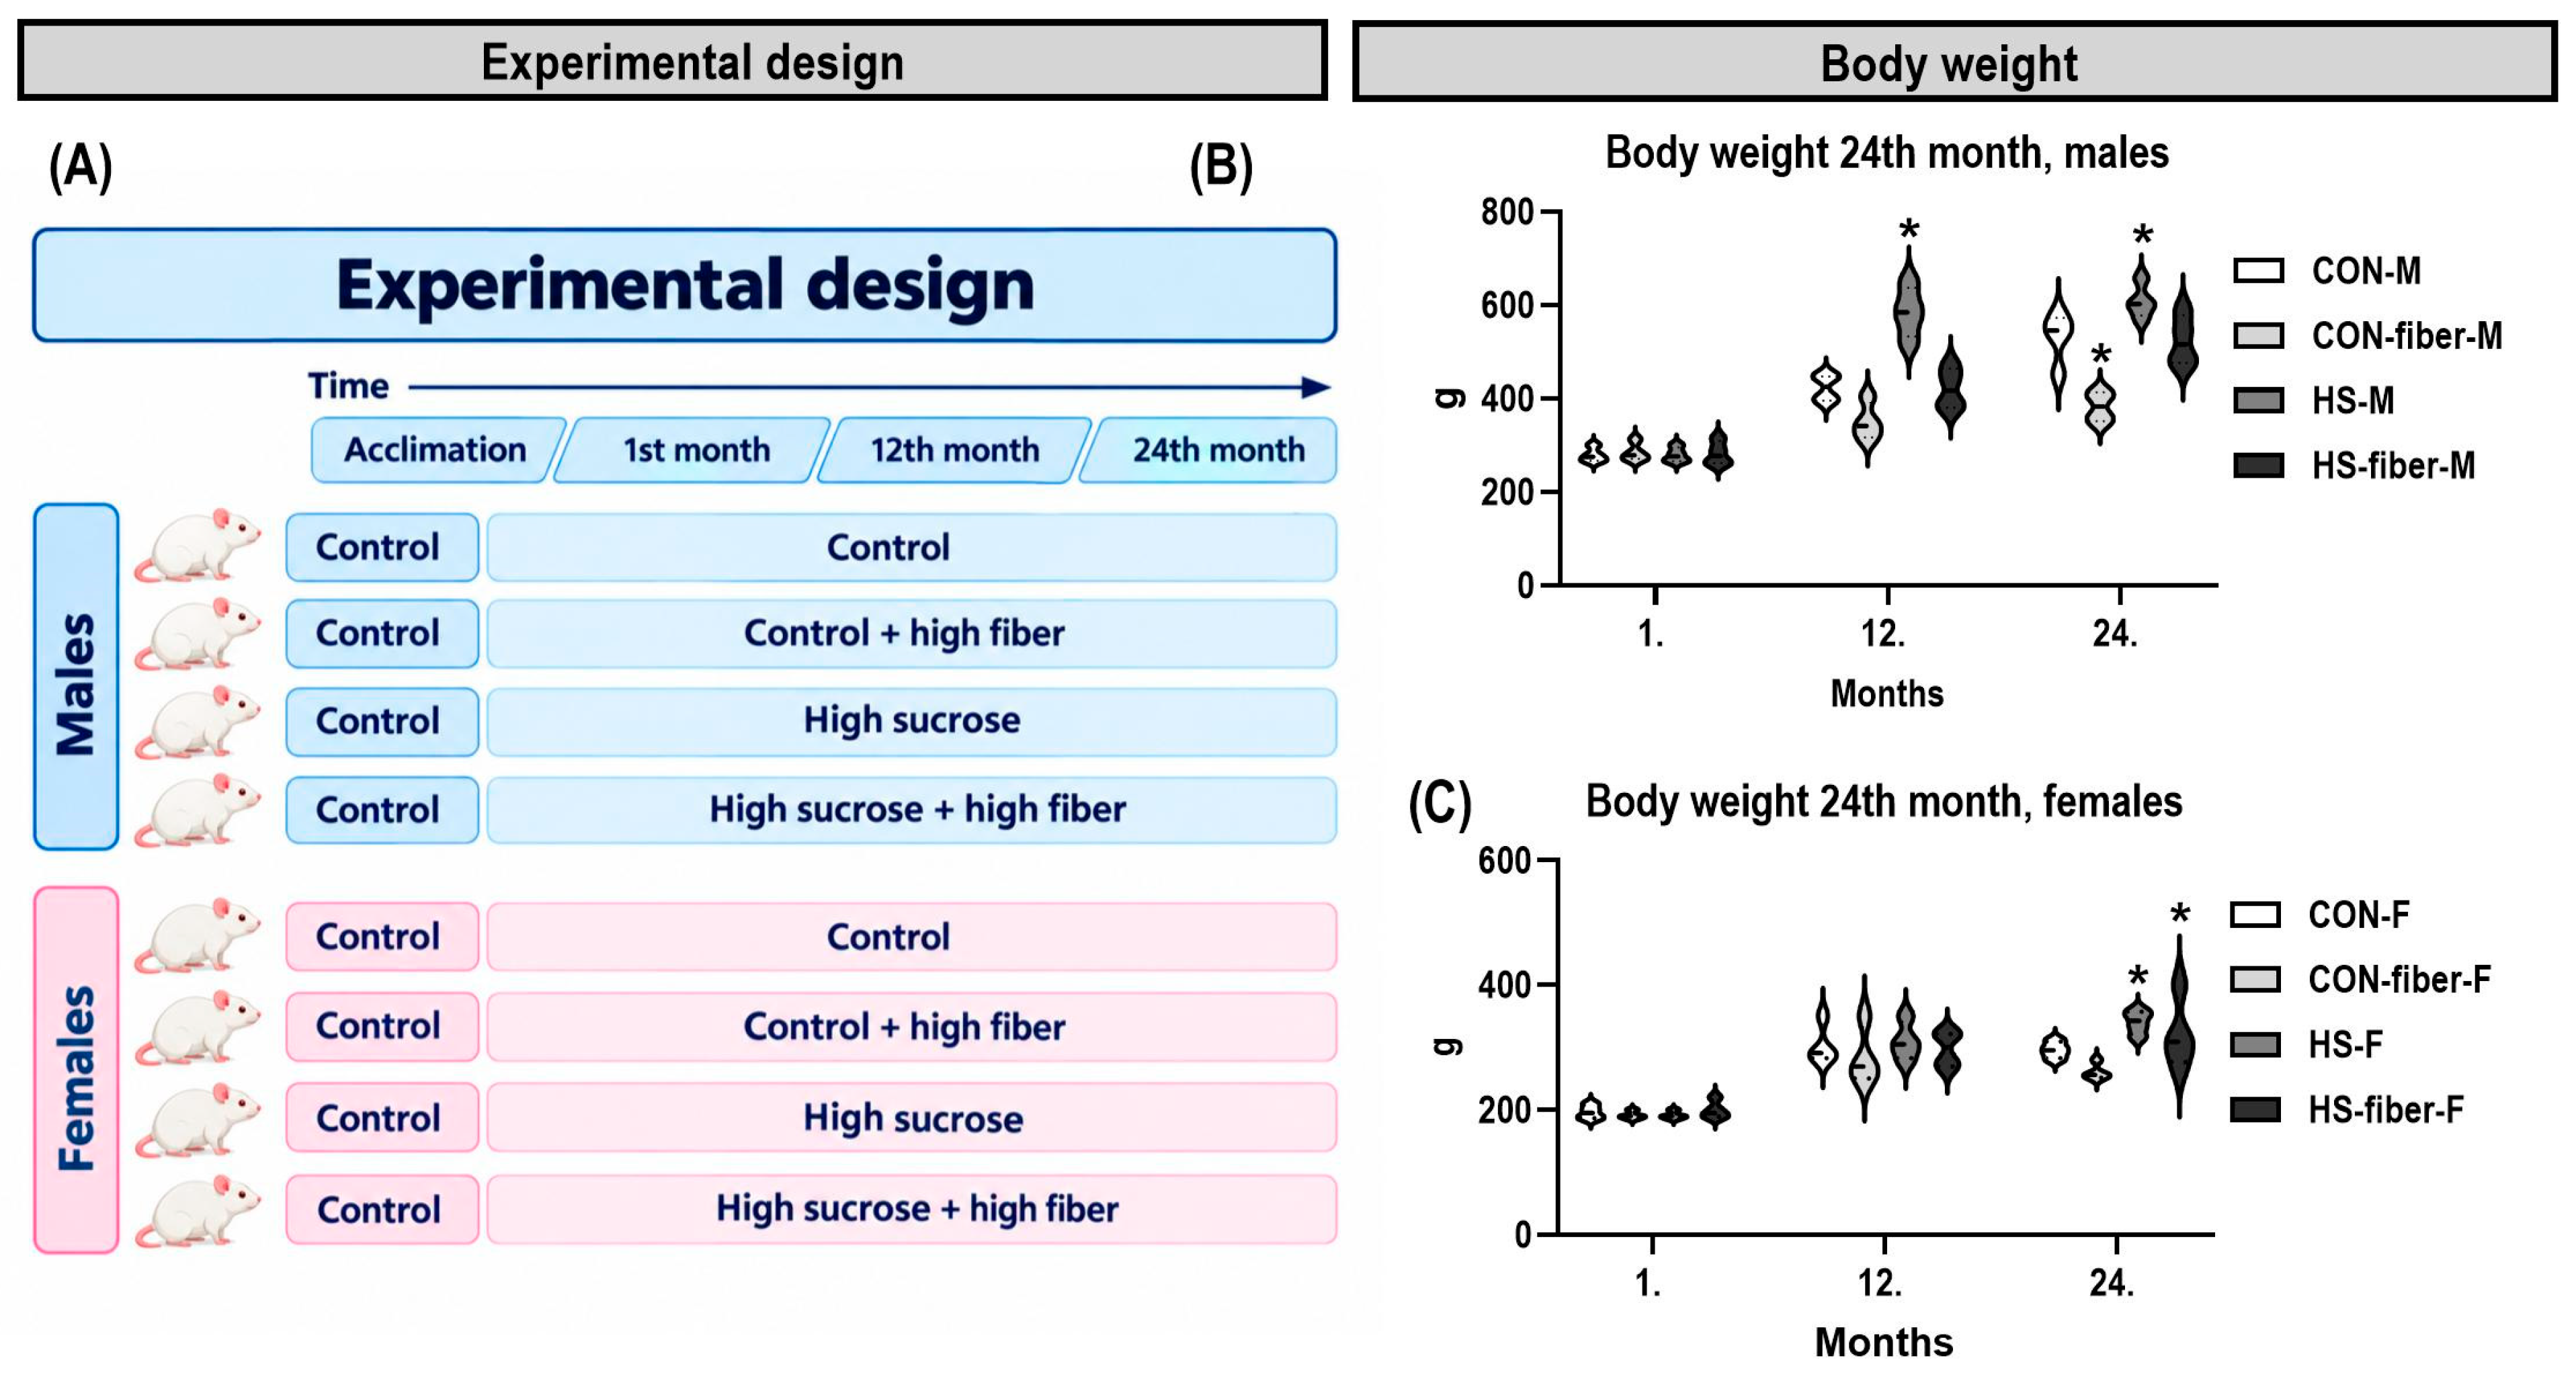
The experimental design is shown in Figure 1A. Body weight differed significantly between treatment groups in both sexes (Figure 1B,C). At 24 months, the CON-fiber groups had lower body weight, whereas the HS groups had higher body weight than the corresponding CON groups.
Figure 1.
Experimental design and body weight changes during the study. (A) Study timeline showing the allocation of male and female Wistar Han rats to four dietary groups after a 2-week acclimatization period and sampling at 1, 12, and 24 months (n = 5 per sex and group at each time point). (B,C) Data are presented as mean ± SD (n = 5). * p < 0.05 compared with sex- and time-matched controls. CON, control; CON-fiber, fiber-enriched control; HS, high sucrose; HS-fiber, high sucrose with increased fiber; M, males; F, females.
3.2. Glucose Homeostasis and Serum Biochemistry
High-sucrose feeding was associated with marked alterations in glucose homeostasis and insulin sensitivity in both male and female rats (Table 3). Changes in HOMA-IR were consistent with the observed alterations in blood glucose (Table 3). The differences between the controls and high-sucrose groups were statistically significant in both sexes. In accordance with the increase in HOMA-IR, QUICKI values were reduced in animals receiving the high-sucrose diet.
Table 3.
Glucose, insulin sensitivity indices and serum biochemistry in experimental groups at 24 months.
The reduction in BUN was observed in both sexes and was associated primarily with high-sucrose feeding (Table 3). In females, serum cholesterol was significantly higher in the HS group than in the CON, CON-fiber, and HS-fiber groups (p < 0.05). Serum creatinine remained within the normal range, with no evidence of a corresponding increase in this marker of renal function. No significant treatment-related differences were detected for TP, ALB, GLO, AST, ALT, ALP, or CK (Table 3).
3.3. Multivariate Analysis Distinguished the Long-Term Sucrose-Associated Fatty-Acid Pattern
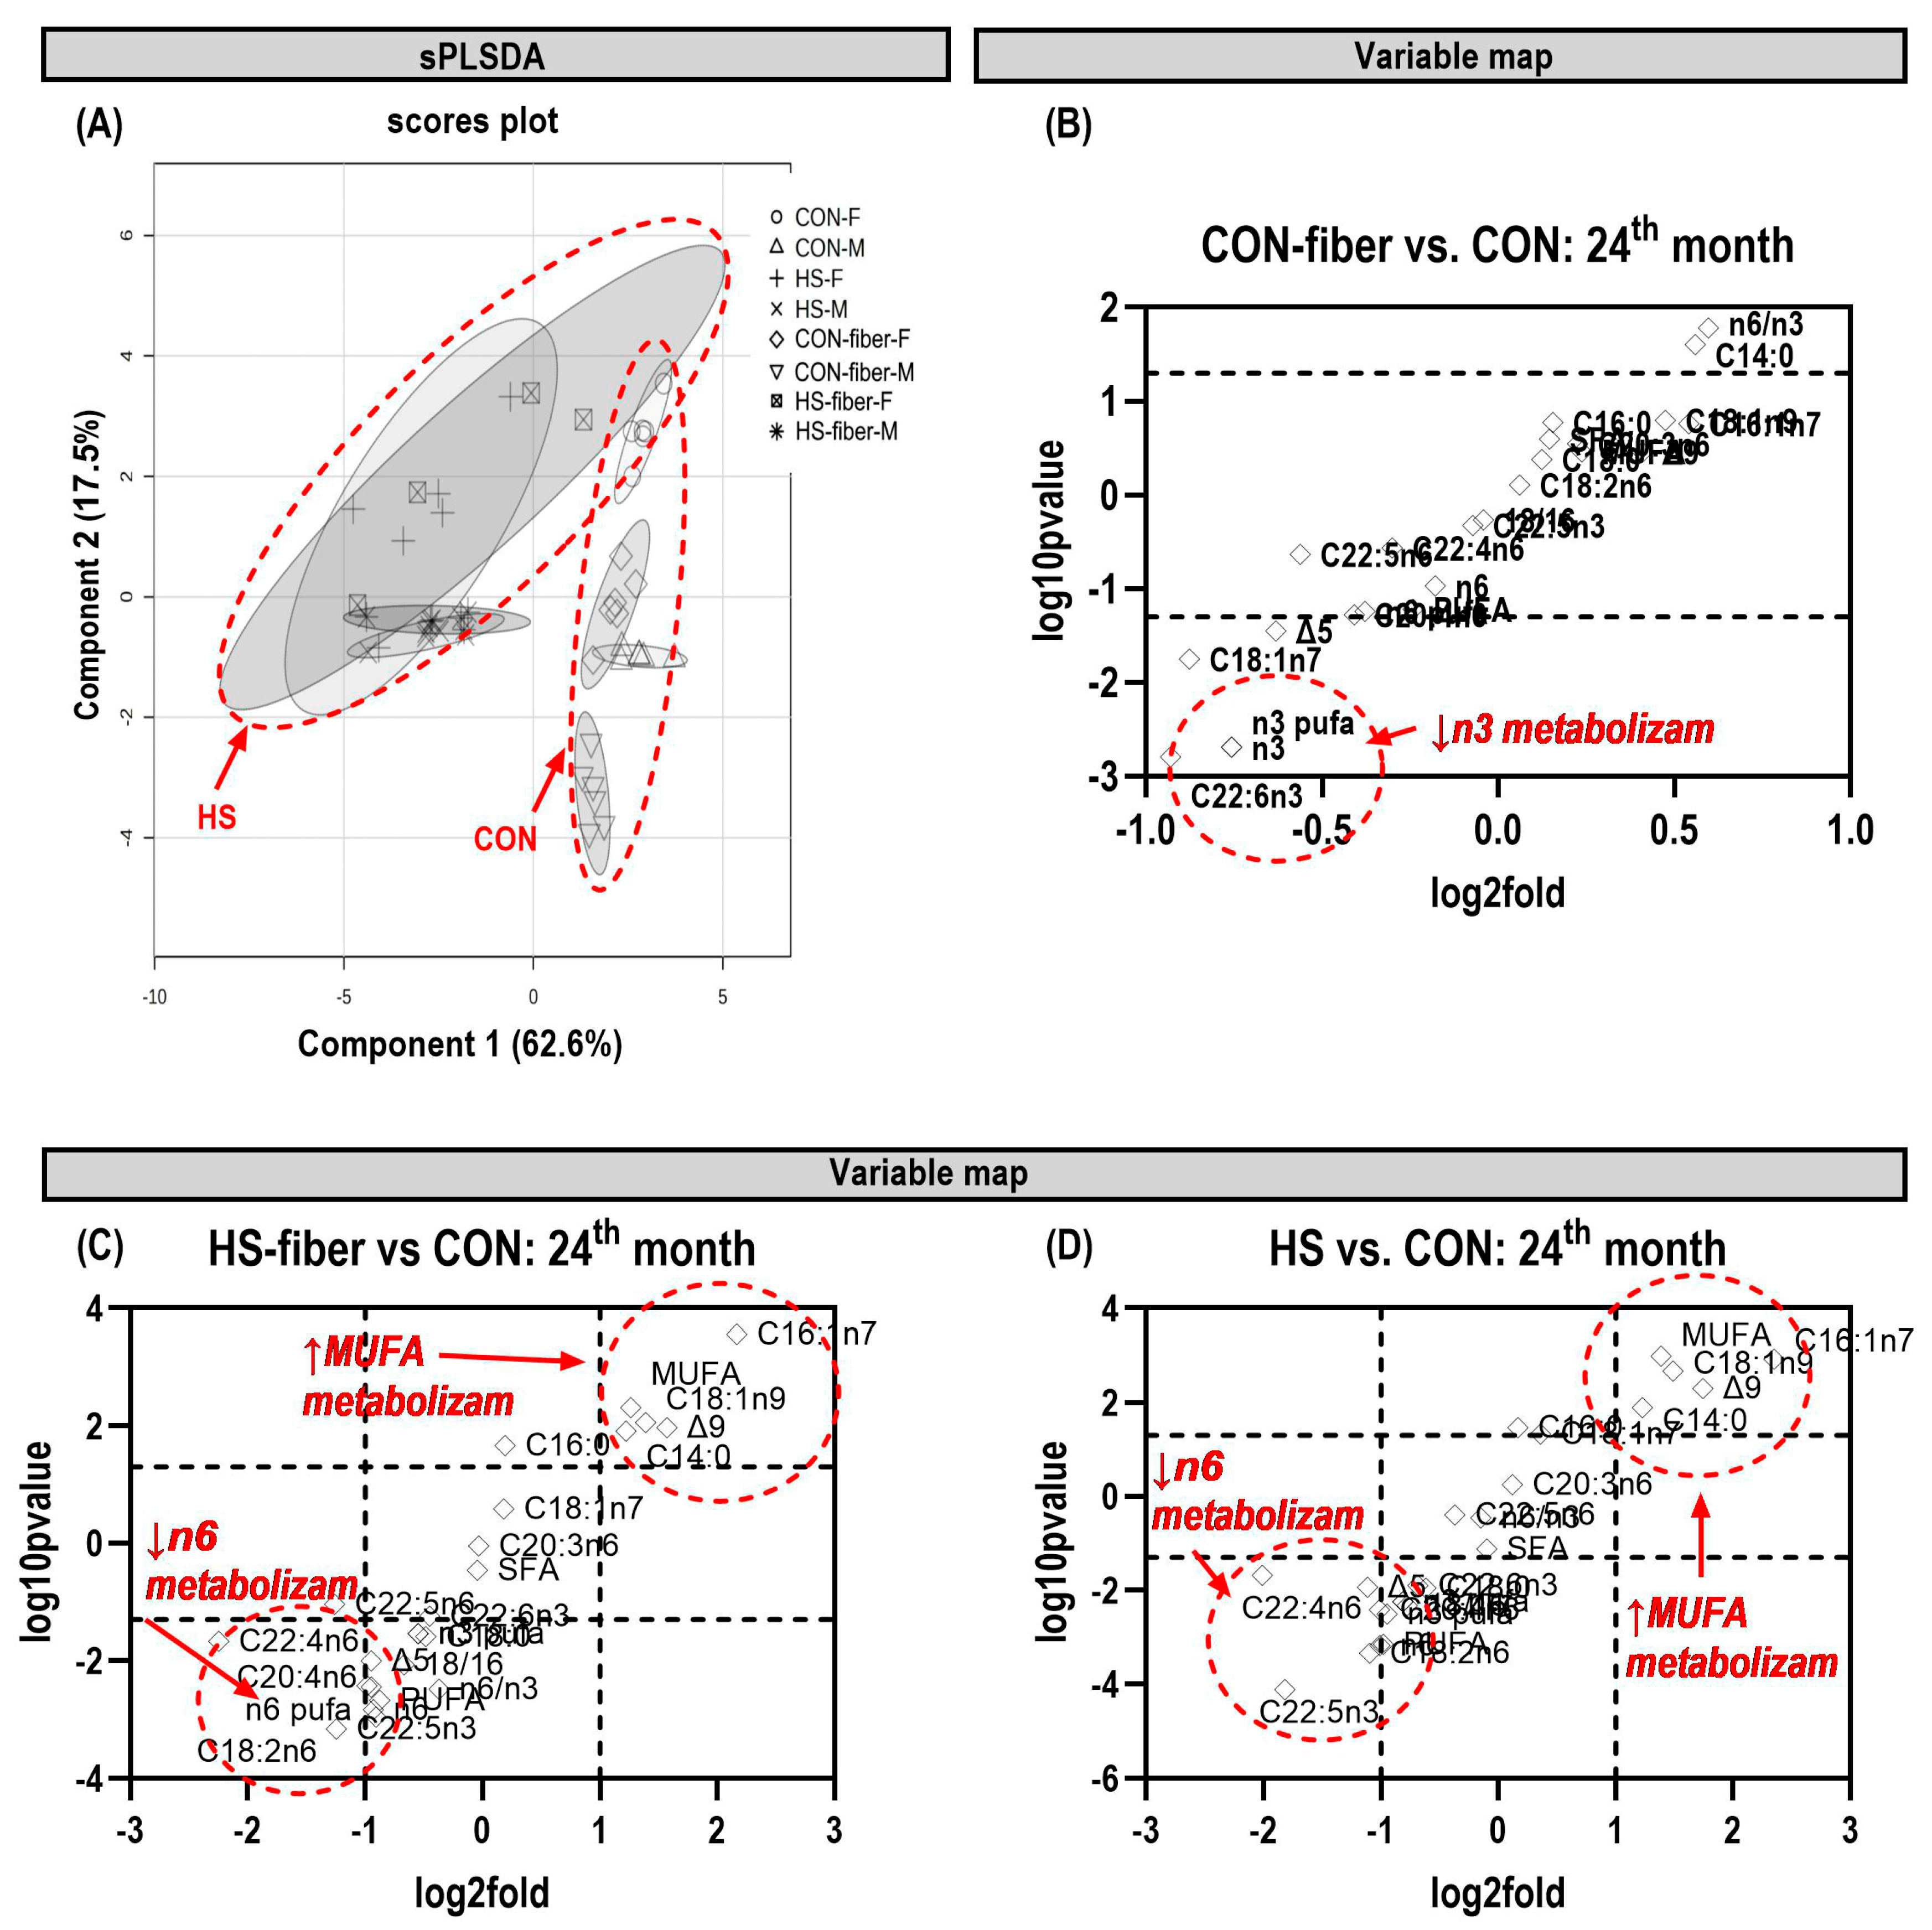
The 24-month sPLS-DA scores plot demonstrated a clear multivariate separation of hepatic fatty-acid profiles (Figure 2A). Component 1 accounted for 62.6% of the displayed variation and primarily separated sucrose-fed animals from the non-sucrose groups, whereas component 2 accounted for 17.5% and contributed additional separation among sex and dietary subgroups. CON and CON-fiber samples were located predominantly toward positive component-1 scores, while HS and HS-fiber samples were shifted toward negative scores. Female CON and CON-fiber samples occupied higher component-2 positions than their male counterparts, indicating an additional sex-related structure within the non-sucrose groups.
Figure 2.
Multivariate analysis of hepatic fatty acid profiles at 24 months. (A) sPLS-DA scores plot; variable maps comparing (B) CON-fiber, (C) HS-fiber, and (D) HS with CON. Components 1 and 2 explained 62.6% and 17.5% of the displayed variation, respectively. CON, control; CON-fiber, fiber-enriched control; HS, high sucrose; HS-fiber, high sucrose with increased fiber; M, males; F, females.
The accompanying variable maps supported the univariate fatty-acid findings (Figure 2B–D). In the CON-fiber versus CON comparison, the strongest negative changes were mainly associated with n-3 fatty-acid variables (Figure 2B). In contrast, the HS versus CON comparison showed a broader coordinated shift characterized by a decrease in n-6-related variables and an increase in MUFA-related variables, including palmitoleic and oleic acids (Figure 2D). The HS-fiber versus CON comparison showed the same general sucrose-associated direction (Figure 2C). Taken together, the sPLS-DA and variable maps showed that long-term sucrose exposure produced a hepatic fatty-acid profile distinct from CON, characterized predominantly by higher MUFA-related and lower n-6-related variables. Additional data on hepatic fatty acid composition are provided in Supplementary Tables S1 and S2.
3.4. Hepatic Monounsaturated Fatty Acids and Δ9-Desaturase Expression Increased During Prolonged Sucrose Exposure
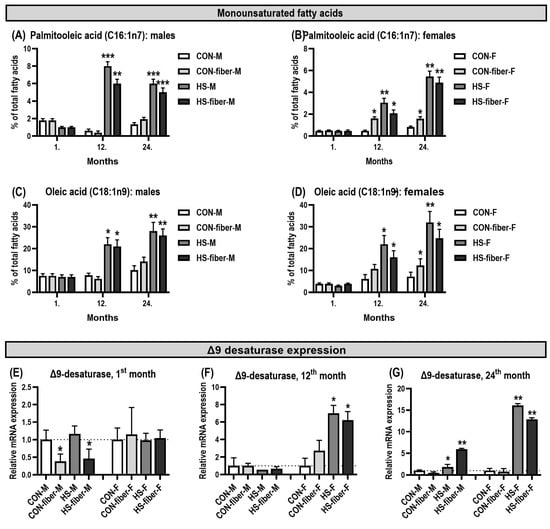
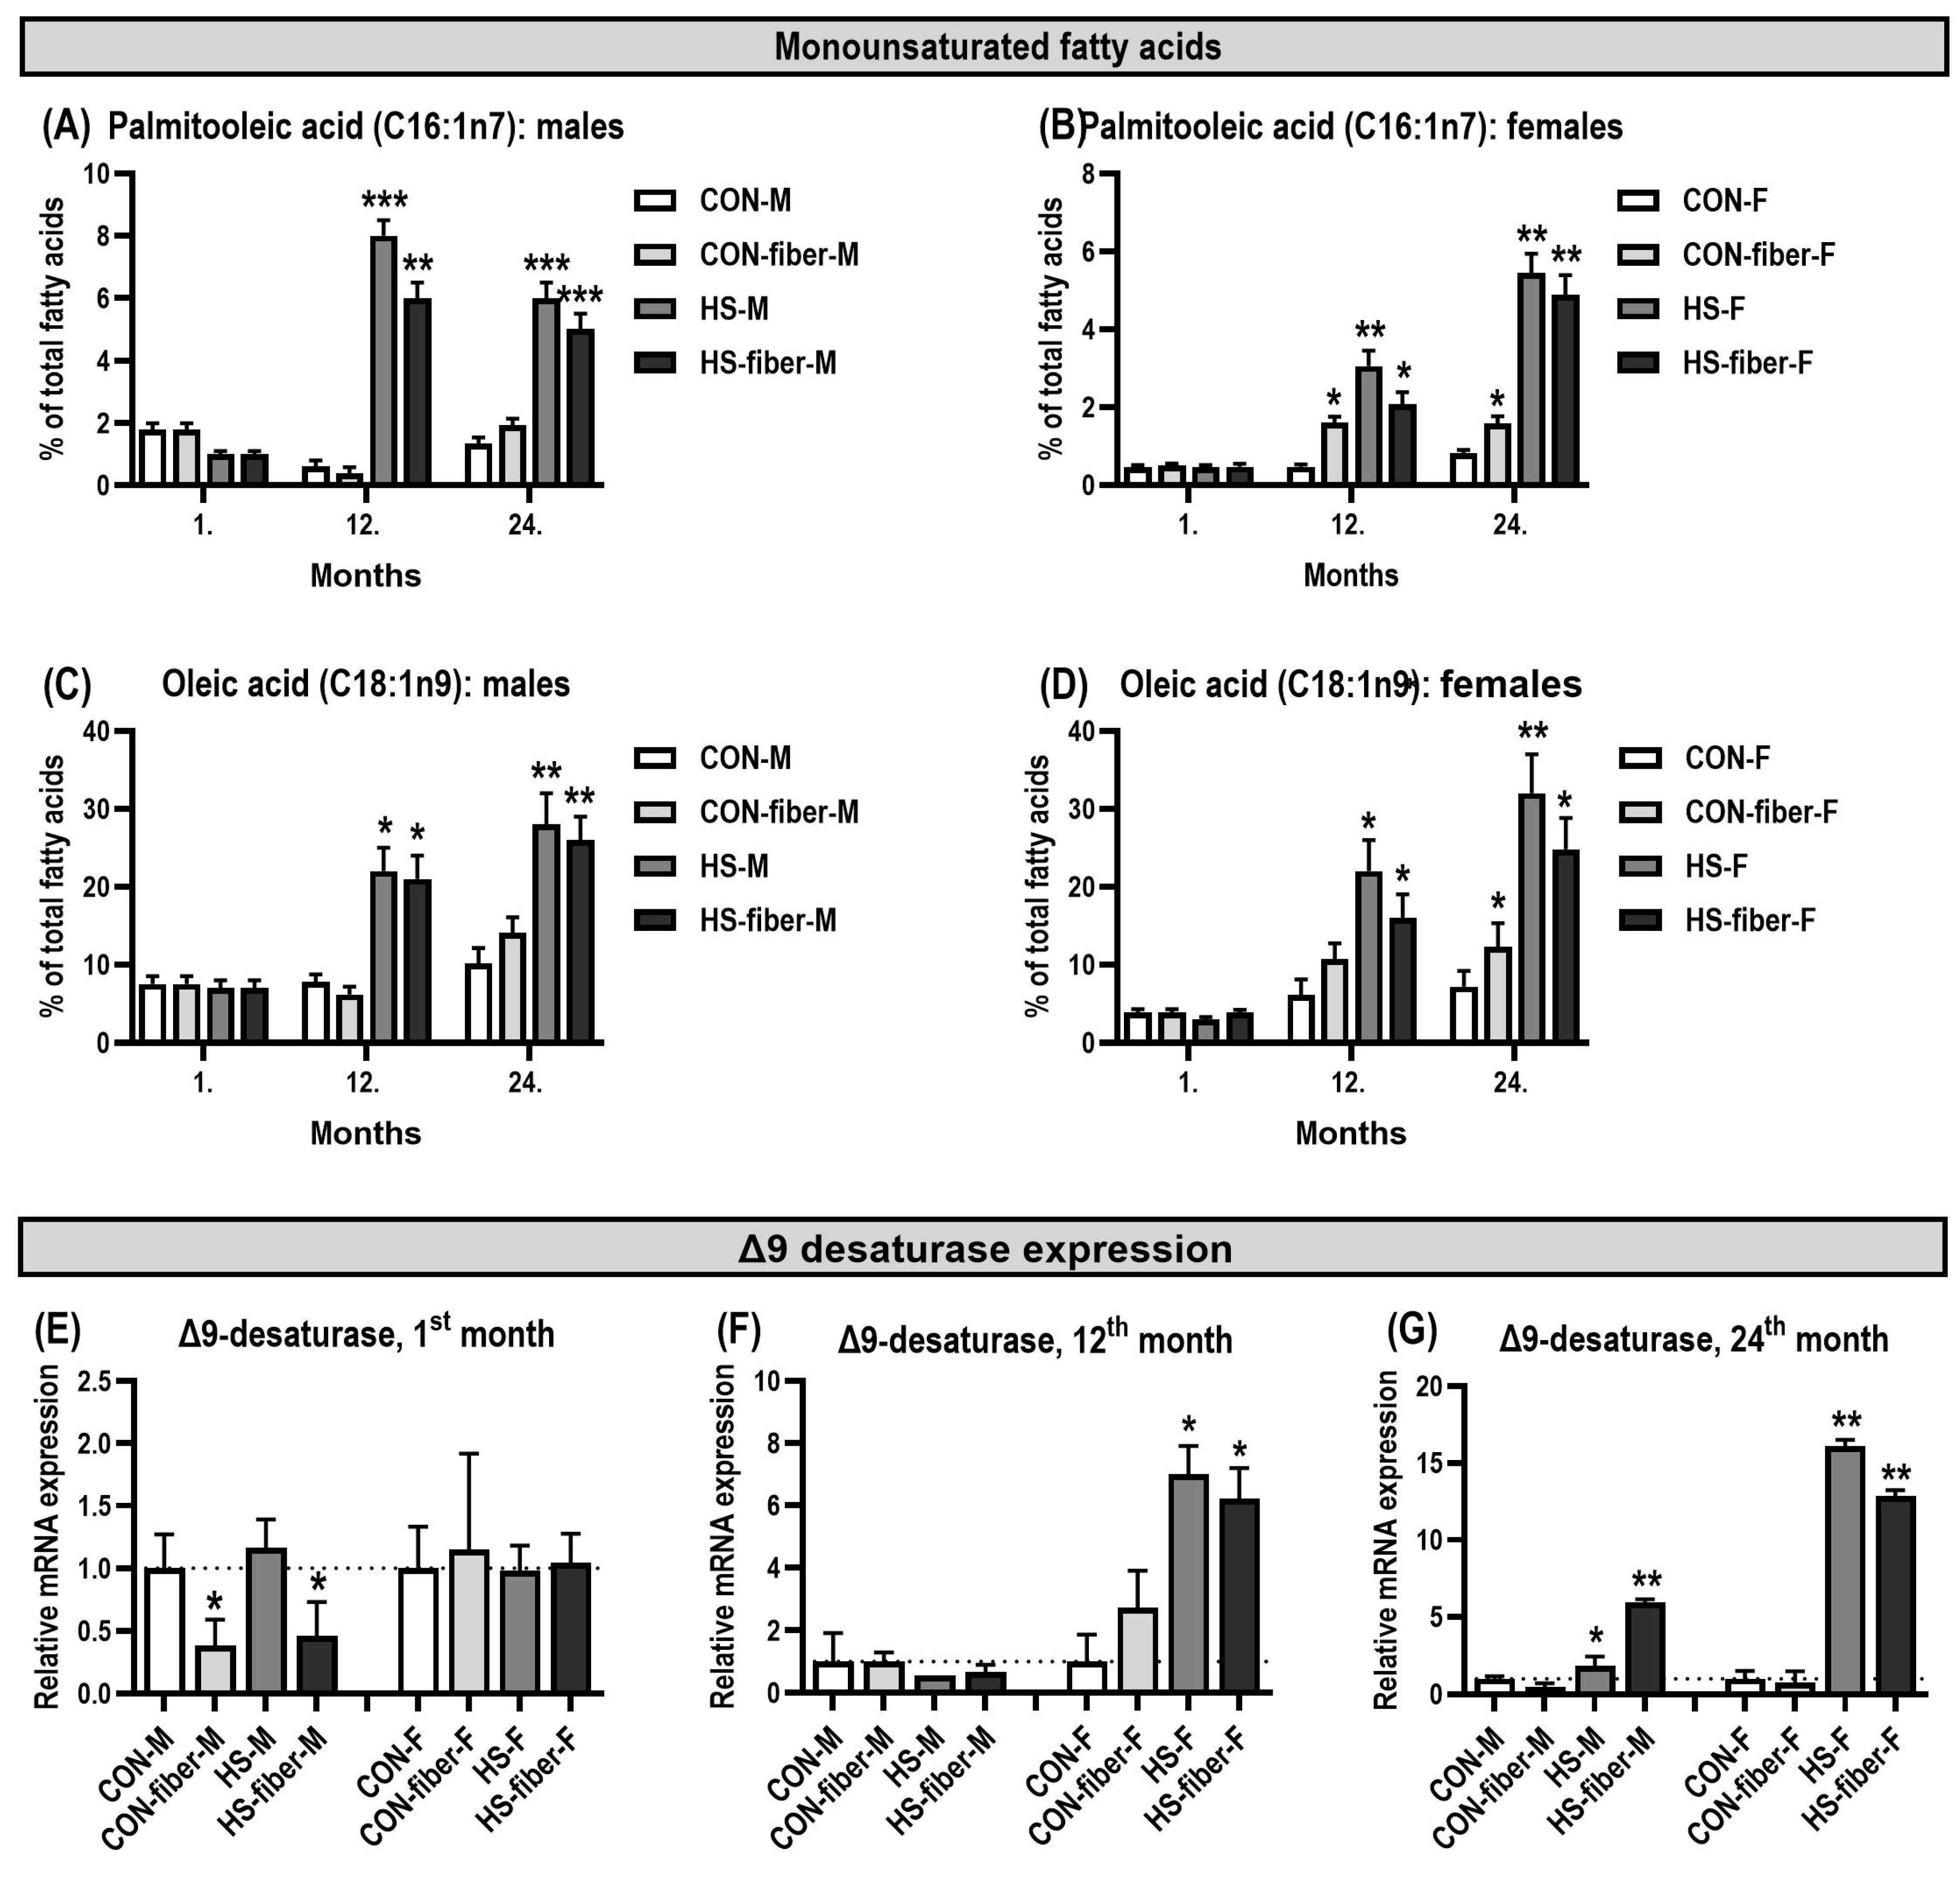
The hepatic monounsaturated fatty-acid profile showed little change after 1 month, whereas clear treatment-related differences emerged after 12 and 24 months (Figure 3A–D). Palmitoleic acid (C16:1n-7) did not differ significantly among groups at 1 month in either males (Figure 3A) or females (Figure 3B). At 12 months, palmitoleic acid increased markedly in HS males (p < 0.001) and HS-fiber males (p < 0.01) (Figure 3A). In females, palmitoleic acid was also higher at 12 months in CON-fiber (p < 0.05), HS (p < 0.01), and HS-fiber (p < 0.05) groups relative to CON (Figure 3B). At 24 months, the increase in palmitoleic acid became more pronounced. In males, both HS and HS-fiber groups remained significantly higher than CON (both p < 0.001; Figure 3A). In females, palmitoleic acid was significantly increased in CON-fiber (p < 0.05), HS (p < 0.01), and HS-fiber (p < 0.01) groups (Figure 3B). Oleic acid (C18:1n-9) followed a similar long-term pattern. In males, oleic acid was higher in HS and HS-fiber at 12 months (both p < 0.05) and remained elevated at 24 months (both p < 0.01; Figure 3C). In females, a significant increase was observed in HS at 12 months (p < 0.05), while at 24 months oleic acid was higher in CON-fiber (p < 0.05), HS (p < 0.01), and HS-fiber (p < 0.05) groups (Figure 3D). The highest mean oleic-acid values were observed in HS animals of both sexes at 24 months.
Figure 3.
Changes in hepatic monounsaturated fatty acids and SCD1 (Δ9-desaturase) mRNA expression during prolonged dietary exposure. (A,B) Palmitoleic acid (C16:1n-7) and (C,D) oleic acid (C18:1n-9) in males and females, respectively; (E–G) SCD1 expression at 1, 12, and 24 months, respectively. Data are presented as mean ± SD (n = 5). * p < 0.05, ** p < 0.01, *** p < 0.001 compared with sex- and time-matched controls. CON, control; CON-fiber, fiber-enriched control; HS, high sucrose; HS-fiber, high sucrose with increased fiber; M, males; F, females.
The changes in MUFA were accompanied by differences in hepatic SCD1 (Δ9-desaturase) mRNA expression relative to sex- and time-matched controls (Figure 3E–G). At 1 month, SCD1 expression was lower in CON-fiber and HS-fiber males (both p < 0.05), whereas no significant differences were detected in females (Figure 3E). At 12 months, no significant treatment-associated differences in SCD1 expression were observed in males but it increased strongly in HS and HS-fiber females (both p < 0.05), reaching approximately six- to seven-fold relative expression (Figure 3F). At the 24-month sampling point, significant treatment-associated differences were also detected. SCD1 expression was higher in HS males (p < 0.05) and HS-fiber males (p < 0.01), and was markedly increased in HS and HS-fiber females (both p < 0.01), reaching approximately 16-fold and 13-fold, respectively (Figure 3G). Thus, higher relative proportions of palmitoleic and oleic acids were observed alongside treatment-associated differences in SCD1 expression at the examined sampling points.
3.5. Long-Term Dietary Treatment Altered Hepatic n-6 Fatty Acids and DHA
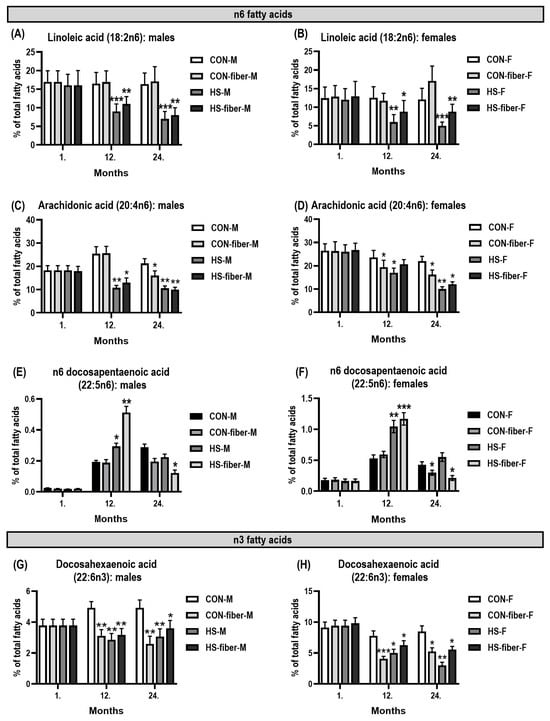
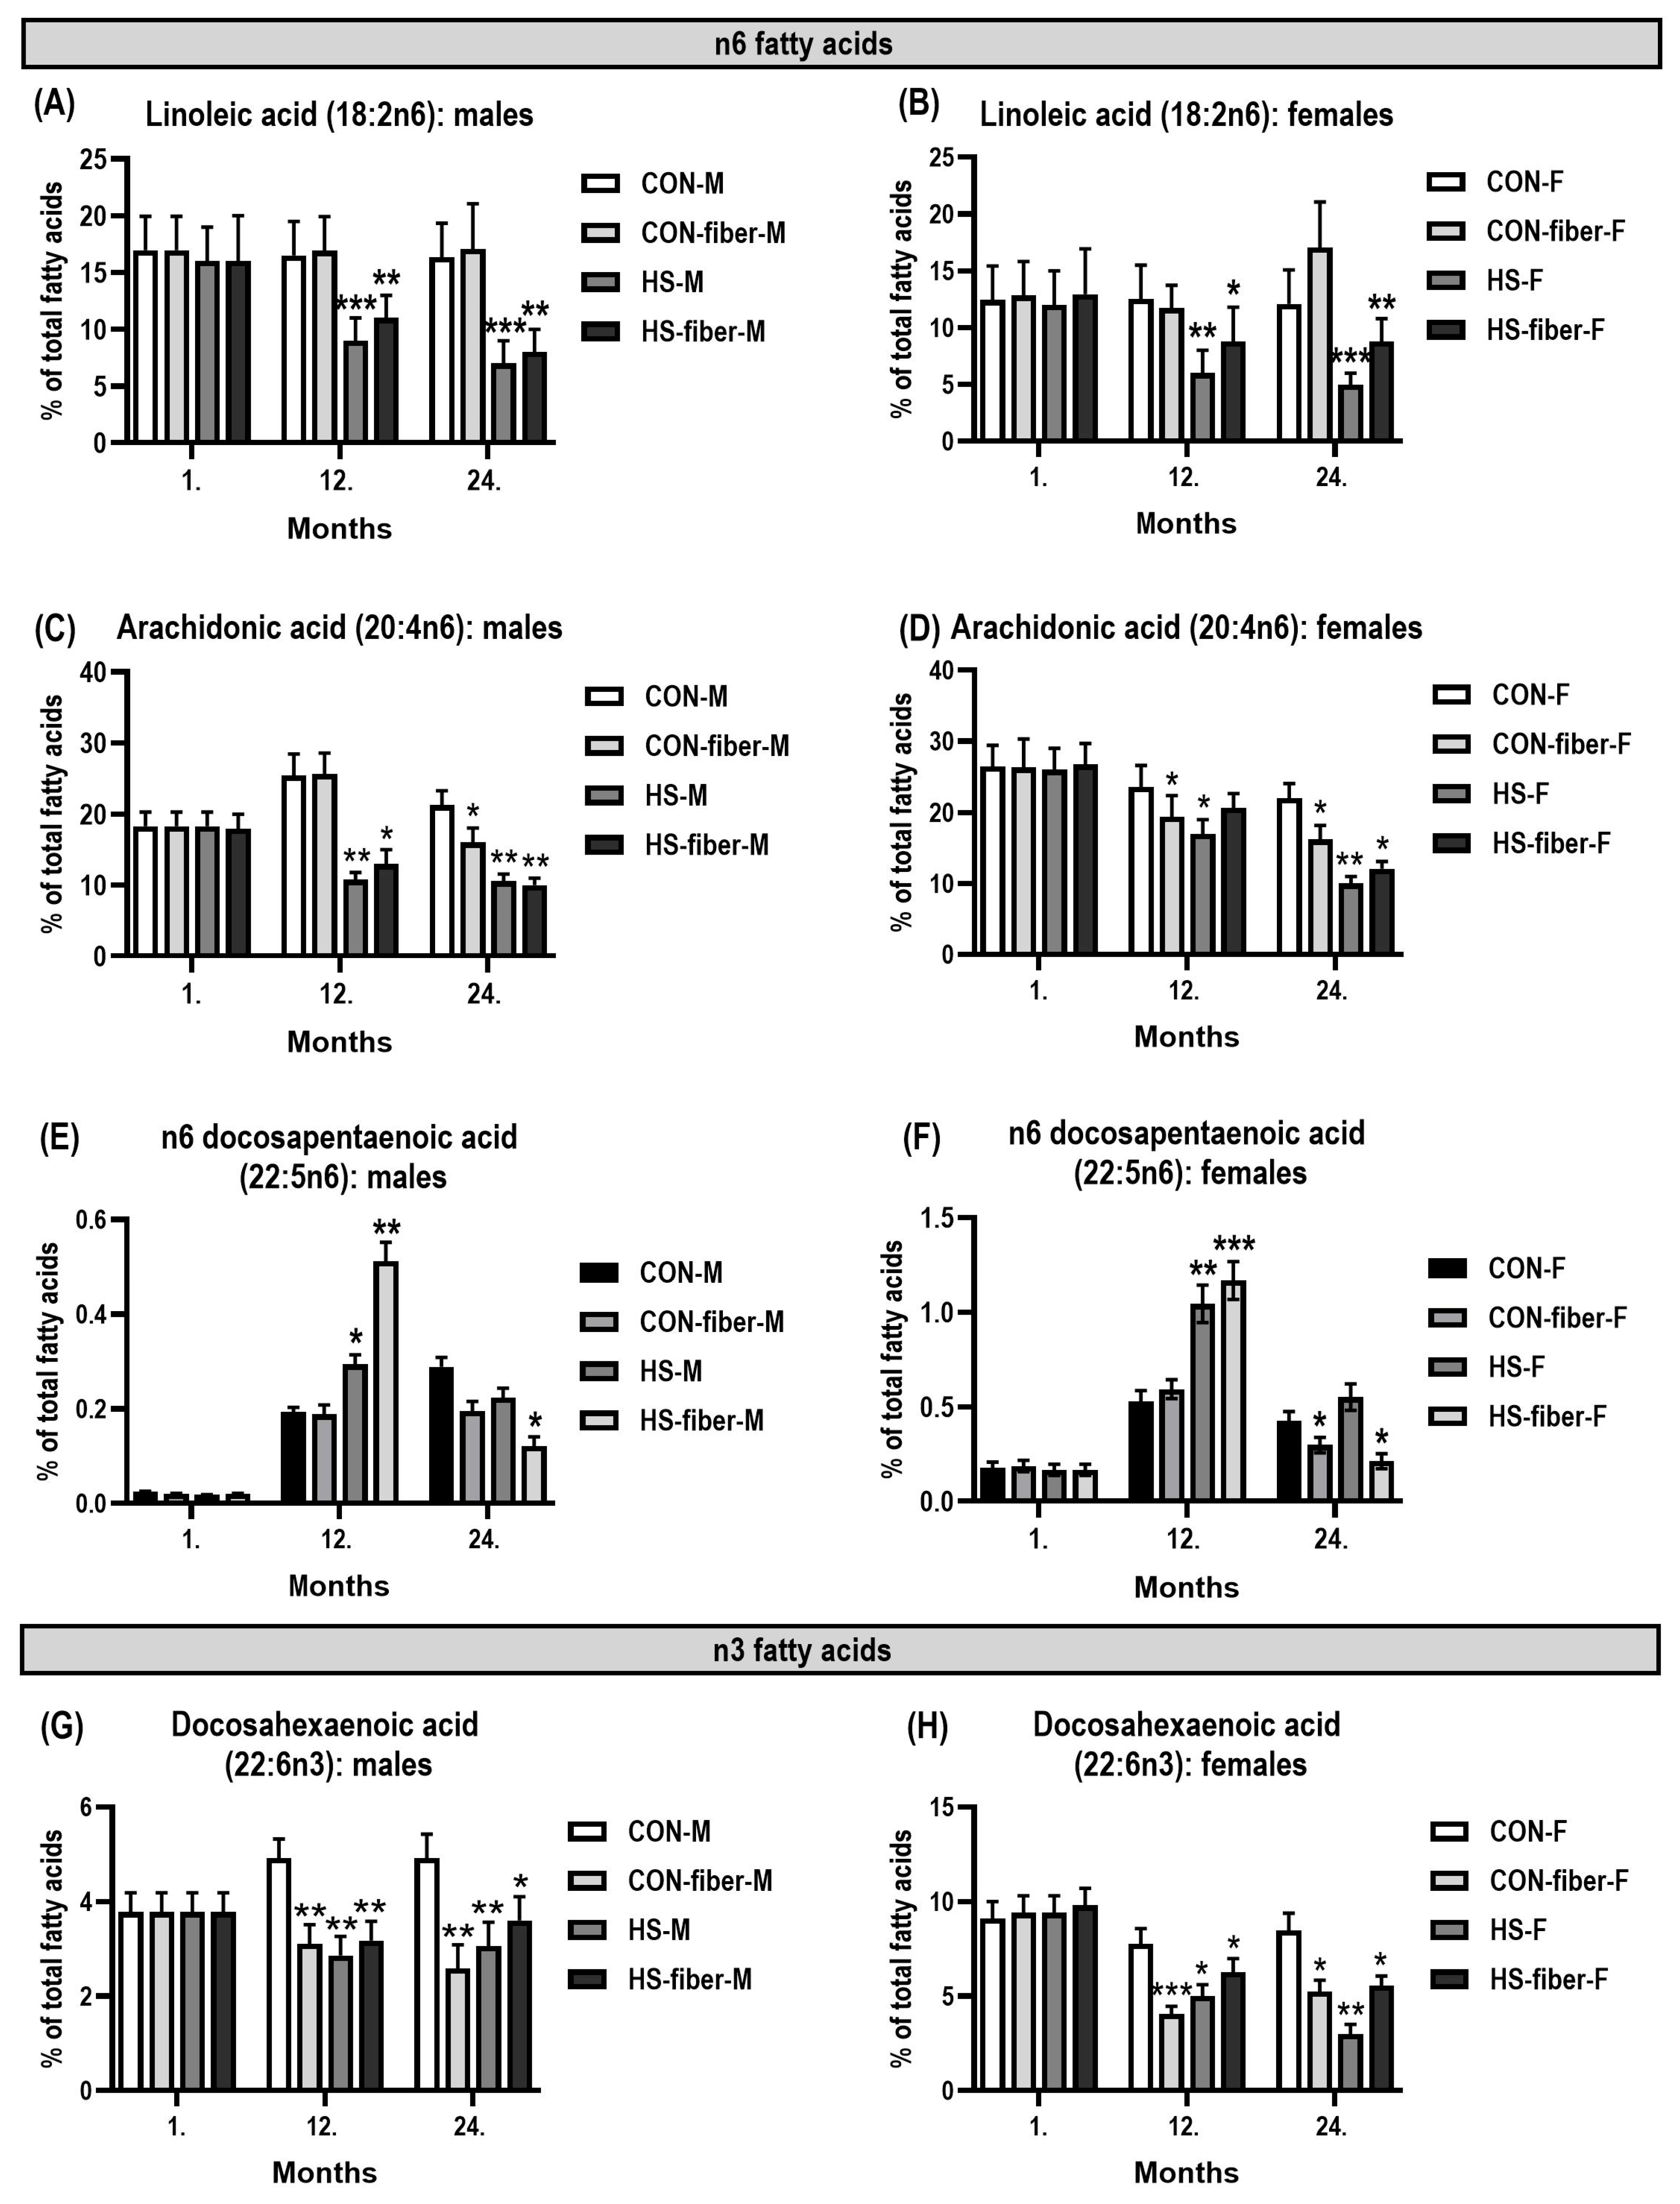
The proportions of the major n-6 fatty acids and DHA were similar among dietary groups after 1 month, but changed substantially with prolonged exposure (Figure 4A–H). At 12 months, linoleic acid was lower in HS males (p < 0.001) and HS-fiber males (p < 0.01; Figure 4A), and in HS females (p < 0.01) and HS-fiber females (p < 0.05; Figure 4B). These reductions persisted at 24 months, when linoleic acid remained significantly lower in both sucrose-fed male groups (both p < 0.001; Figure 4A) and female groups (p < 0.001 and p < 0.01, respectively; Figure 4B).
Figure 4.
Changes in hepatic n-6 fatty acids and docosahexaenoic acid (DHA) during prolonged dietary exposure. (A,B) Linoleic acid (C18:2n-6), (C,D) arachidonic acid (C20:4n-6), (E,F) n-6 docosapentaenoic acid (C22:5n-6), and (G,H) DHA (C22:6n-3) in males and females, respectively, at 1, 12, and 24 months. Data are presented as mean ± SD (n = 5). * p < 0.05, ** p < 0.01, *** p < 0.001 compared with sex- and time-matched controls. CON, control; CON-fiber, fiber-enriched control; HS, high sucrose; HS-fiber, high sucrose with increased fiber; M, males; F, females.
Arachidonic acid (C20:4n-6) showed a similar progressive decrease (Figure 4C,D). In males, arachidonic acid was lower in HS (p < 0.01) and HS-fiber (p < 0.05) at 12 months and was reduced in CON-fiber (p < 0.05), HS (p < 0.01), and HS-fiber (p < 0.001) at 24 months (Figure 4C). In females, arachidonic acid was lower in CON-fiber and HS groups at 12 months (both p < 0.05), and by 24 months it was reduced in all three intervention groups: CON-fiber (p < 0.05), HS (p < 0.01), and HS-fiber (p < 0.05; Figure 4D). The decline was therefore most consistent after prolonged exposure and was particularly marked in the sucrose-fed groups.
In contrast to linoleic and arachidonic acids, n-6 docosapentaenoic acid (C22:5n-6) showed a transient increase at 12 months (Figure 4E,F). In males, C22:5n-6 was higher in HS (p < 0.05) and HS-fiber (p < 0.01; Figure 4E). The increase was more pronounced in females, with higher values in HS (p < 0.01) and HS-fiber (p < 0.001; Figure 4F). By 24 months, this increase had disappeared; C22:5n-6 was instead lower in HS-fiber males and females (both p < 0.05), while the other groups did not differ significantly from CON (Figure 4E,F).
DHA (C22:6n-3) showed a sustained decrease after prolonged treatment (Figure 4G,H). At 12 months, DHA was lower in CON-fiber, HS, and HS-fiber males (all p < 0.01; Figure 4G) and in CON-fiber, HS, and HS-fiber females (p < 0.001, p < 0.05, and p < 0.05, respectively; Figure 4H). The decrease persisted at 24 months in all three intervention groups in both sexes. In males, DHA remained lower in CON-fiber and HS (both p < 0.01) and in HS-fiber (p < 0.05; Figure 4G). In females, DHA remained reduced in CON-fiber (p < 0.05), HS (p < 0.01), and HS-fiber (p < 0.05; Figure 4H).
3.6. Δ5- and Δ6-Desaturase Expression Changed with Duration of Exposure
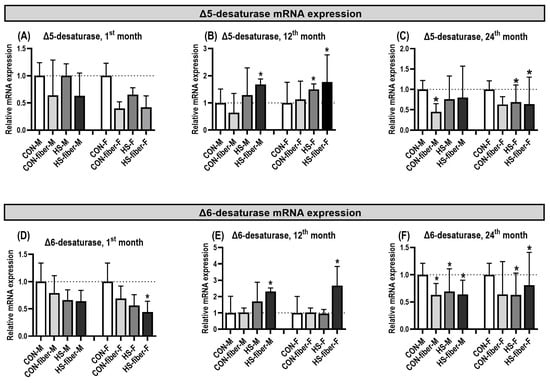
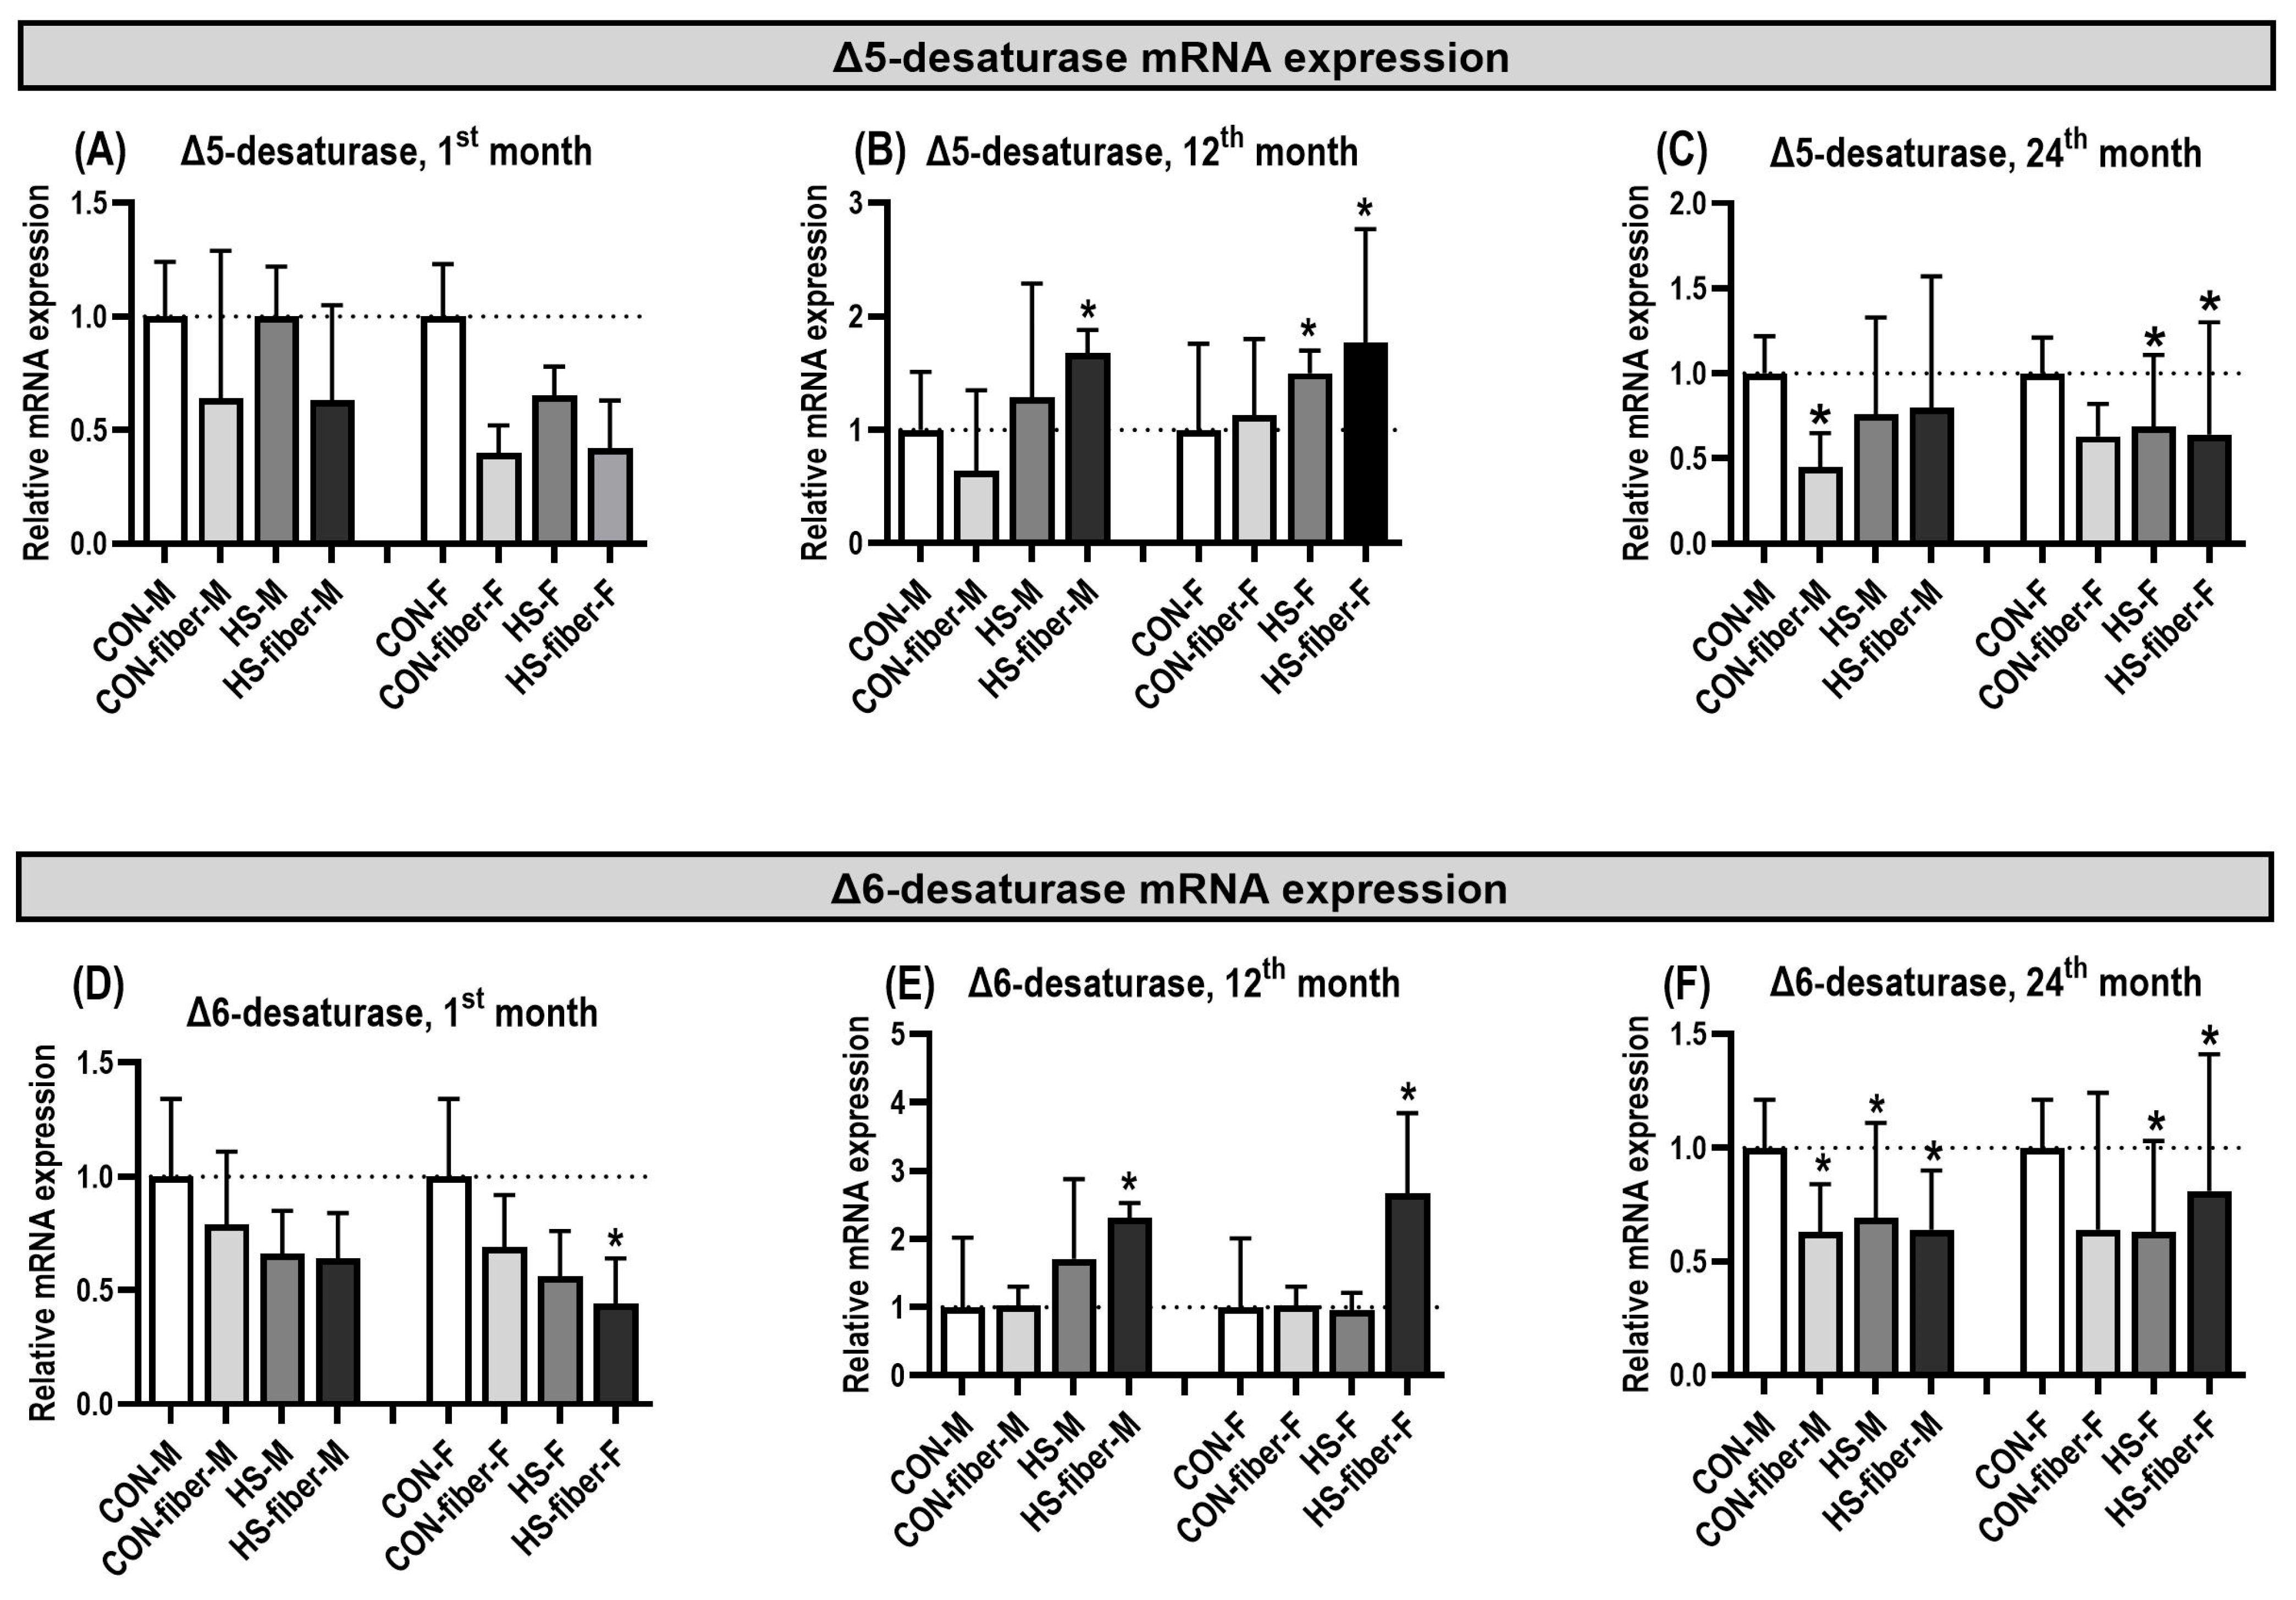
Hepatic Fads1 (Δ5-desaturase) expression showed treatment-associated differences within individual sampling points and sexes (Figure 5A–C). At 1 month, no significant differences from the corresponding CON groups were detected (Figure 5A). At 12 months, Fads1 expression was higher in HS-fiber males (p < 0.05) and in both HS and HS-fiber females (both p < 0.05; Figure 5B). At 24 months, relative to the corresponding sex-matched controls, Fads1 expression was lower in CON-fiber males (p < 0.05), while HS and HS-fiber males were not significantly different from CON. In females, Fads1 was lower in HS and HS-fiber groups (both p < 0.05), whereas CON-fiber females remained comparable with CON (Figure 5C).
Figure 5.
Changes in hepatic desaturase mRNA expression during prolonged dietary exposure. (A–C) Fads1 (Δ5-desaturase) and (D–F) Fads2 (Δ6-desaturase) expression at 1, 12, and 24 months, respectively. Expression was normalized to sex- and time-matched controls. Data are presented as mean ± SD (n = 5). * p < 0.05 compared with the corresponding control. CON, control; CON-fiber, fiber-enriched control; HS, high sucrose; HS-fiber, high sucrose with increased fiber; M, males; F, females.
Fads2 (Δ6-desaturase) expression also showed treatment-associated differences within individual sampling points (Figure 5D–F). At 1 month, expression was lower only in HS-fiber females (p < 0.05; Figure 5D). At 12 months, Fads2 expression was higher in HS-fiber males and females (both p < 0.05), with the largest mean increase in HS-fiber females (Figure 5E). At 24 months, Fads2 expression was lower in CON-fiber, HS, and HS-fiber males (all p < 0.05; Figure 5F). In females, CON-fiber and HS groups were lower than CON (both p < 0.05), whereas HS-fiber females showed a significant increase above CON (p < 0.05; Figure 5F). These findings describe differences in Fads1 and Fads2 expression between dietary treatments within each sampling point; direct temporal comparisons of relative expression were not performed.
3.7. Oxidative Stress Increased with Prolonged Sucrose Exposure
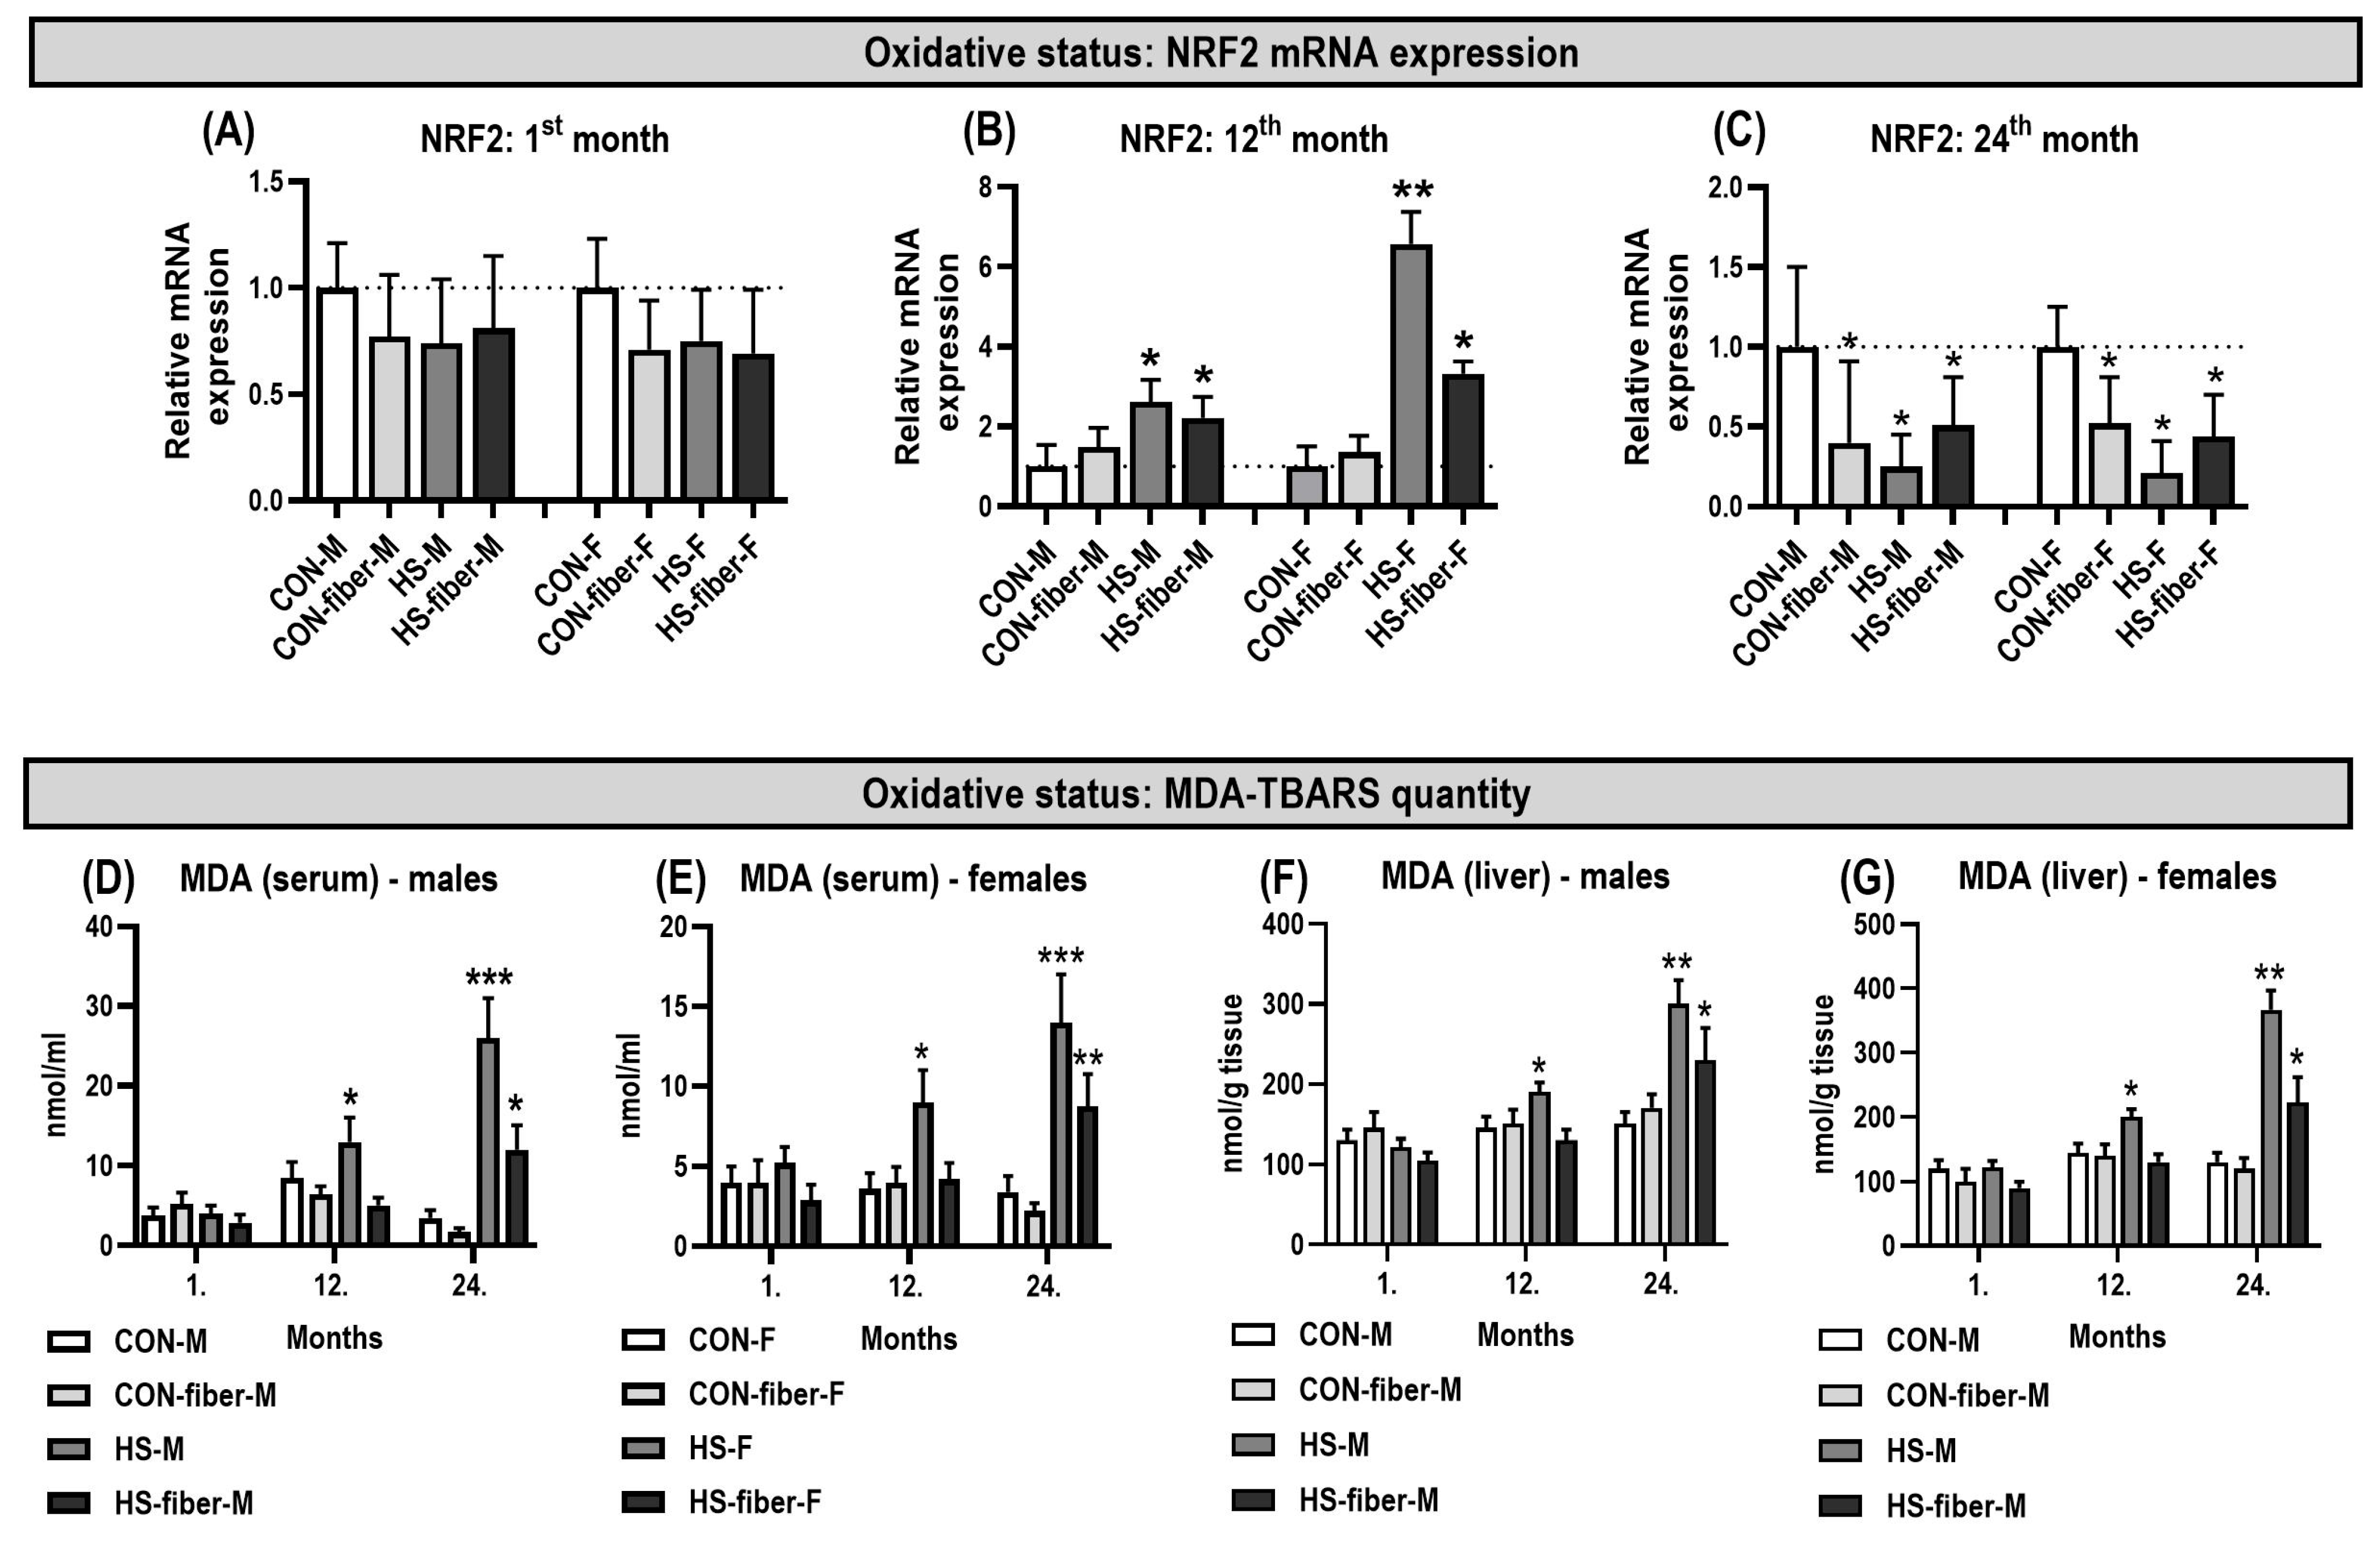
Lipid peroxidation markers and relative hepatic NRF2 mRNA expression showed treatment-associated differences at the examined sampling points (Figure 6A–G).
Figure 6.
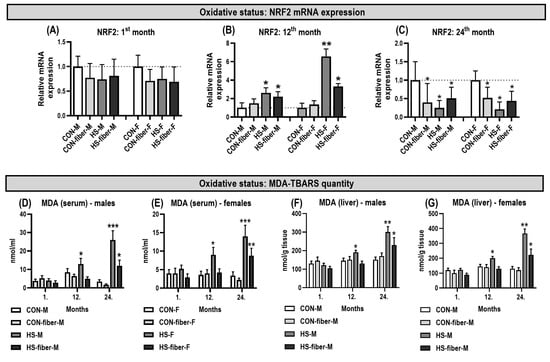
Changes in hepatic NRF2 mRNA expression and malondialdehyde (MDA) concentrations in serum and liver following prolonged dietary exposure. (A–C) NRF2 expression at 1, 12, and 24 months, respectively; serum MDA in (D) males and (E) females; hepatic MDA in (F) males and (G) females. Data are presented as mean ± SD (n = 5). * p < 0.05, ** p < 0.01, *** p < 0.001 compared with sex- and time-matched controls. CON, control; CON-fiber, fiber-enriched control; HS, high sucrose; HS-fiber, high sucrose with increased fiber; M, males; F, females.
Serum MDA, used as an indicator of lipid peroxidation, remained low after 1 month and did not differ significantly among groups in either males (Figure 6D) or females (Figure 6E). Mean values were approximately 3–5 nmol/mL in both sexes, indicating no measurable increase in circulating lipid peroxidation during the initial phase of treatment.
At 12 months, the first significant increase in serum MDA was observed in the HS groups. In males, serum MDA increased to approximately 12–13 nmol/mL in HS animals, compared with approximately 6–8 nmol/mL in CON and CON-fiber animals (p < 0.05; Figure 6D). HS-fiber males remained below the HS mean and did not differ significantly from CON. In females, HS animals showed a similar increase, reaching approximately 9 nmol/mL compared with approximately 4 nmol/mL in CON females (p < 0.05; Figure 6E). Neither CON-fiber nor HS-fiber females differed significantly from CON at this time point.
By 24 months, the serum MDA response had become substantially stronger in both sexes. In males, HS animals showed the highest serum MDA concentration, approximately 25–27 nmol/mL, which was markedly higher than CON (p < 0.001; Figure 6D). MDA was also elevated in HS-fiber males to approximately 11–13 nmol/mL (p < 0.05). In females, HS animals again showed the highest value, approximately 13–15 nmol/mL (p < 0.001), while HS-fiber females reached approximately 8–9 nmol/mL (p < 0.01; Figure 6E). CON-fiber animals of both sexes remained comparable with their respective controls. These findings indicate that circulating lipid peroxidation increased progressively with prolonged sucrose exposure, with the greatest accumulation in HS animals and a smaller but significant increase in HS-fiber animals at 24 months.
A similar pattern was observed for hepatic MDA concentrations, indicating increased lipid peroxidation directly in liver tissue (Figure 6F,G). After 1 month, liver MDA did not differ significantly among groups in either sex, with values remaining in a relatively narrow range of approximately 100–150 nmol/g tissue. At 12 months, hepatic MDA increased significantly in HS males to approximately 190 nmol/g tissue (p < 0.05; Figure 6F) and in HS females to approximately 200 nmol/g tissue (p < 0.05; Figure 6G), whereas CON-fiber and HS-fiber animals remained comparable with controls. At 24 months, hepatic MDA increased further in both sexes. In males, the highest liver MDA concentration was detected in HS animals, reaching approximately 300 nmol/g tissue (p < 0.01), while HS-fiber males also showed a significant increase to approximately 230 nmol/g tissue (p < 0.05; Figure 6F). In females, hepatic MDA rose to approximately 360 nmol/g tissue in HS animals (p < 0.01) and to approximately 220 nmol/g tissue in HS-fiber animals (p < 0.05; Figure 6G). Thus, hepatic MDA closely paralleled the serum MDA pattern, confirming increased hepatic lipid peroxidation during long-term sucrose exposure, particularly in the HS groups.
Hepatic NRF2 mRNA expression was compared between dietary groups separately at each sampling point (Figure 6A–C). At 1 month, NRF2 expression remained close to control levels and no significant differences were detected in either sex (Figure 6A). At 12 months, however, NRF2 expression increased significantly in both sucrose-fed groups (Figure 6B). In males, relative expression rose to approximately 2.5-fold in HS and 2-fold in HS-fiber animals (both p < 0.05). The response was more pronounced in females, where NRF2 increased to approximately 6.5-fold in HS (p < 0.01) and approximately 3-fold in HS-fiber animals (p < 0.05). CON-fiber animals did not differ significantly from CON at this time point.
The mRNA expression of NRF2 at the 24th month is shown in Figure 6C. Expression was significantly lower than CON in CON-fiber, HS, and HS-fiber animals of both sexes (all p < 0.05). In males, the strongest reduction was observed in HS animals, where mean NRF2 expression fell to approximately one-quarter of the CON level; CON-fiber and HS-fiber males also showed clear reductions. Females displayed a comparable pattern, with the lowest mean expression in HS and intermediate reductions in CON-fiber and HS-fiber groups. At 24 months, reduced hepatic NRF2 expression coincided with the highest serum and liver MDA concentrations, particularly in HS animals of both sexes (Figure 6C–G).
Together, these findings indicate increased lipid peroxidation in sucrose-fed animals at the later sampling points. NRF2 expression differed from the corresponding controls within individual sampling points.
3.8. Pro-Inflammatory and Profibrotic Gene Expression Increased Predominantly in Sucrose-Fed Rats
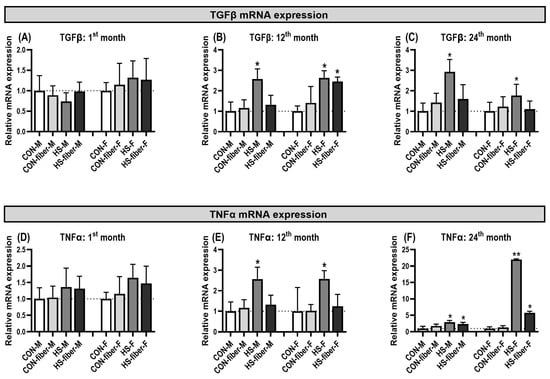
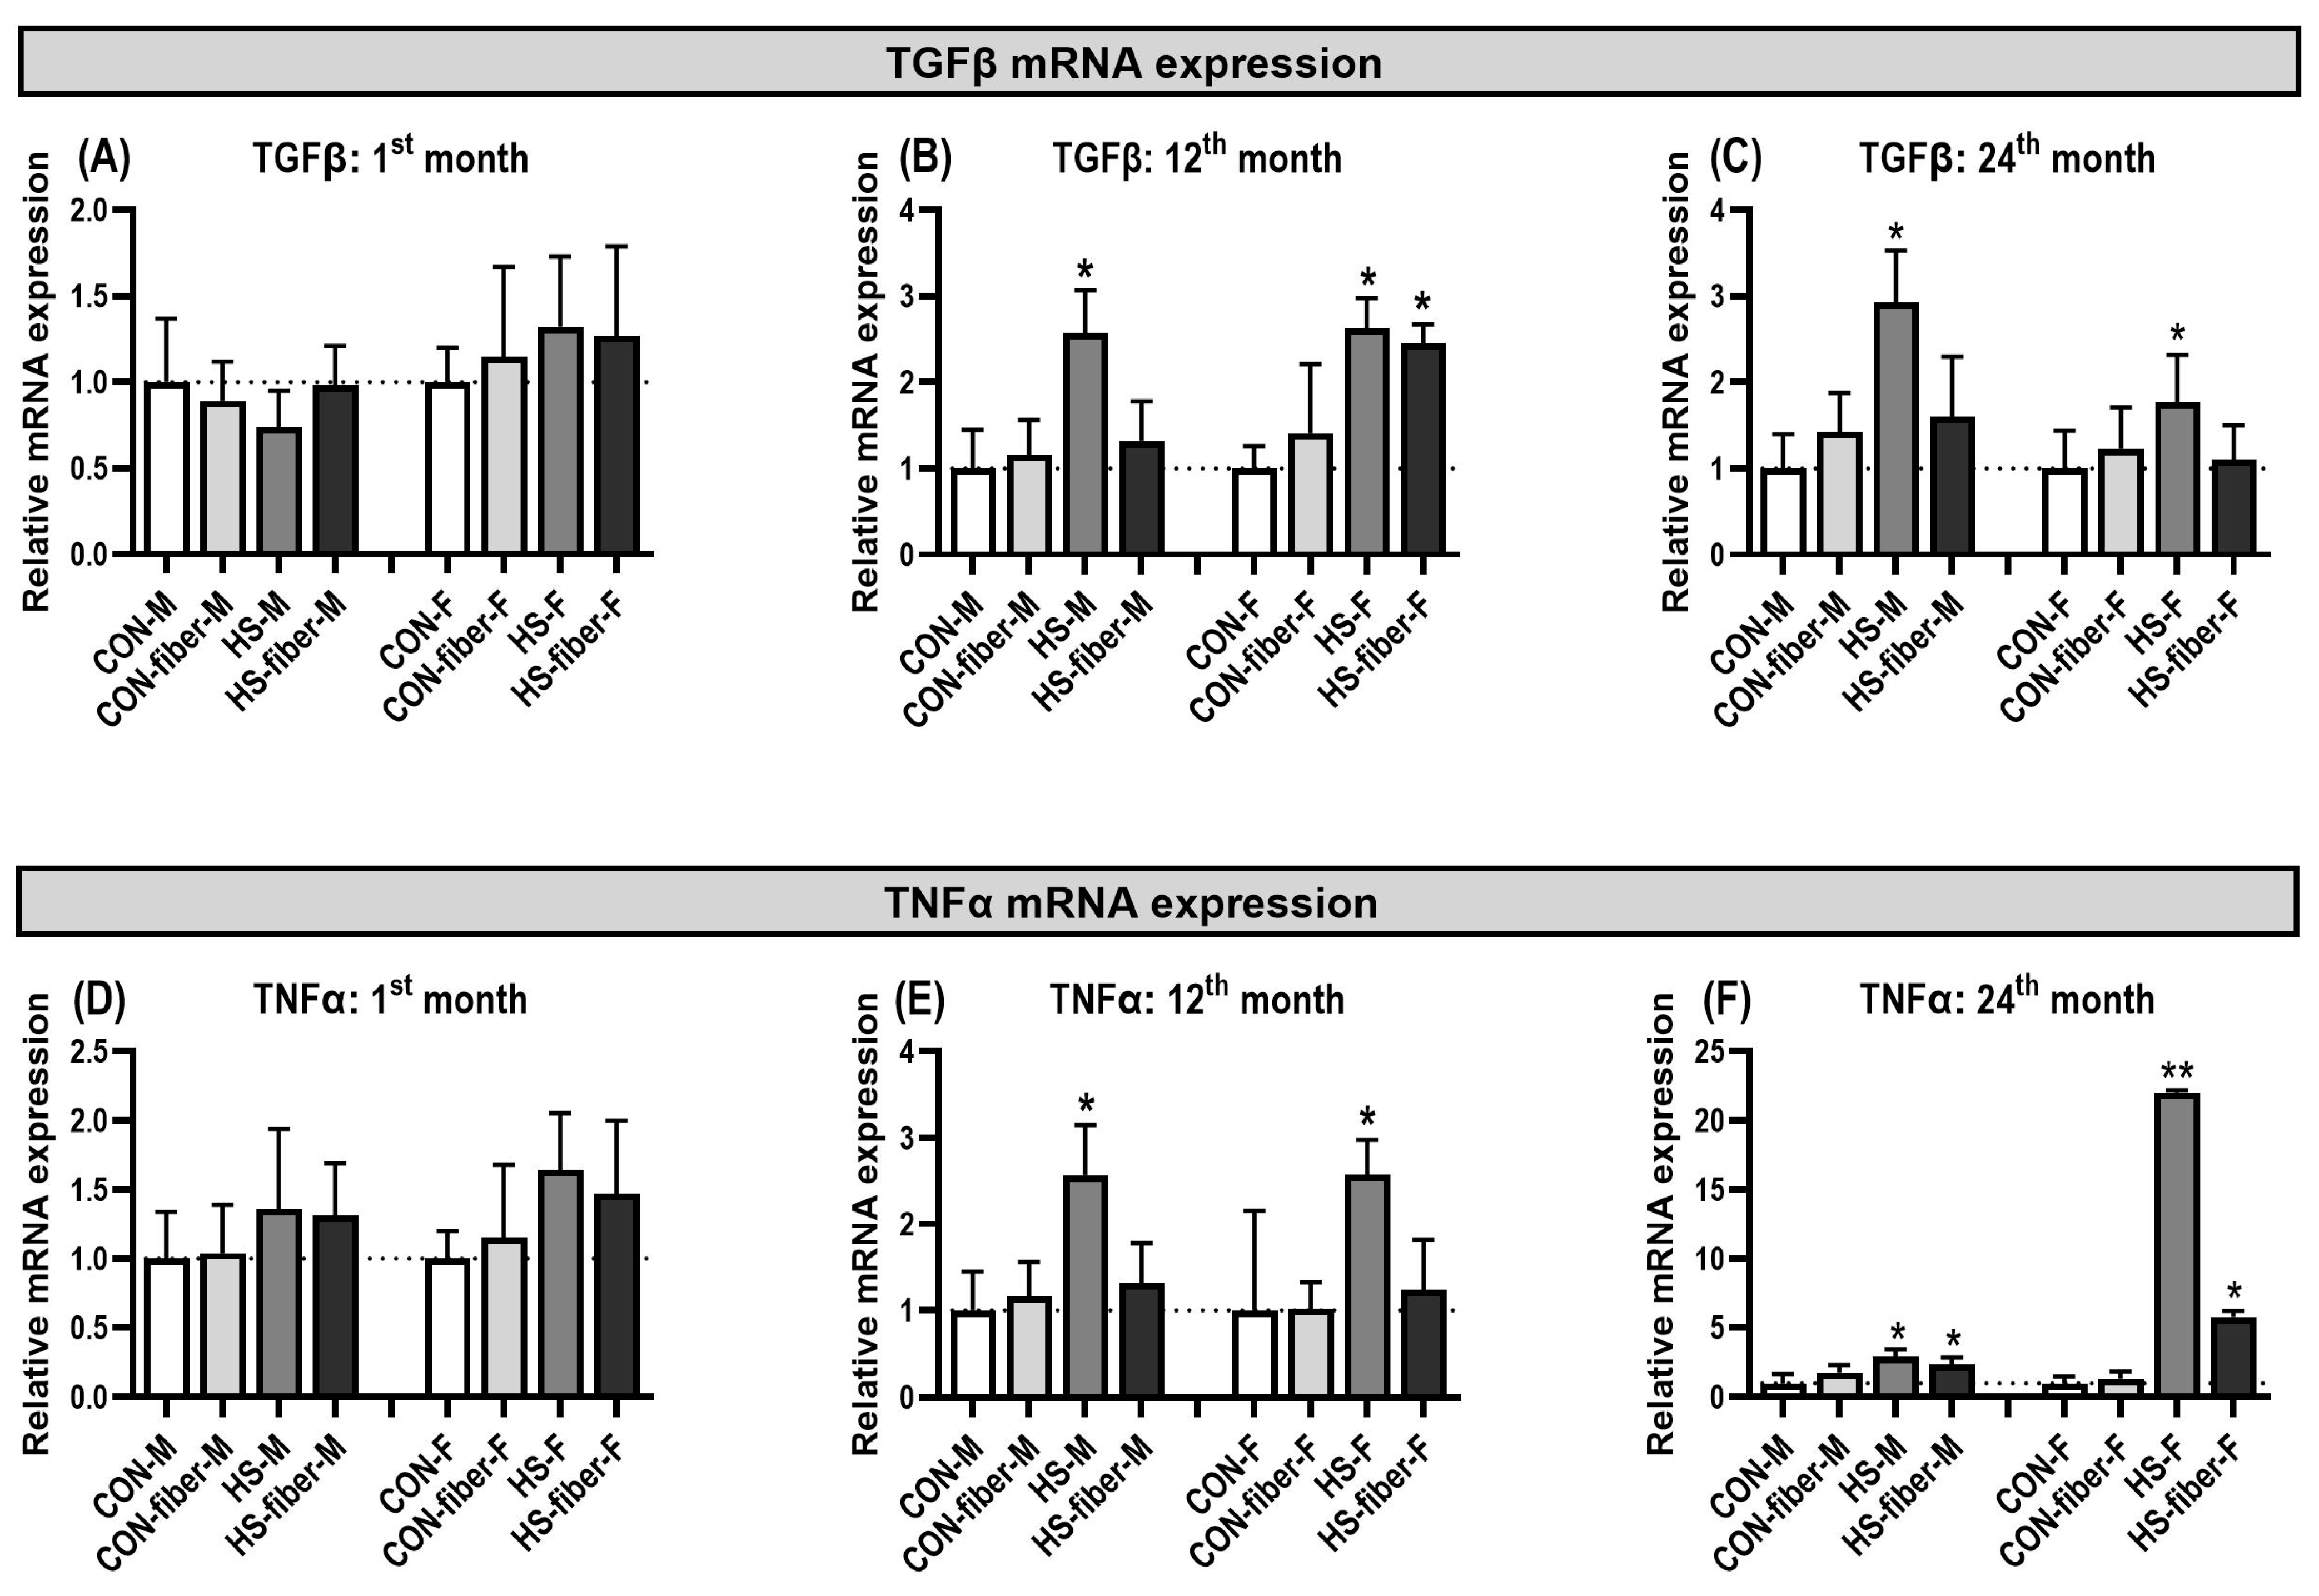
Hepatic TGFβ mRNA expression showed limited changes at 1 month but a clear response after prolonged sucrose exposure (Figure 7A–C). At 1 month, no significant differences were detected in either sex (Figure 7A). At 12 months, TGFβ expression increased in HS males (p < 0.05), reaching approximately 2.5-fold relative to CON. In females, Tgfb1 was higher in both HS and HS-fiber groups (both p < 0.05), with mean expression also near 2.5-fold above CON (Figure 7B). At 24 months, TGFβ remained elevated in HS males and females (both p < 0.05), whereas HS-fiber animals no longer differed significantly from CON; CON-fiber groups also remained comparable with control (Figure 7C).
Figure 7.
Changes in hepatic TGFβ and TNFα mRNA expression during prolonged dietary exposure. (A–C) TGFβ and (D–F) TNFα expression at 1, 12, and 24 months, respectively. Expression was normalized to sex- and time-matched controls. Data are presented as mean ± SD (n = 5). * p < 0.05, ** p < 0.01 compared with the corresponding control. CON, control; CON-fiber, fiber-enriched control; HS, high sucrose; HS-fiber, high sucrose with increased fiber; M, males; F, females.
TNFα mRNA expression followed a more pronounced late inflammatory pattern (Figure 7D–F). Expression was unchanged at 1 month (Figure 7D). At 12 months, TNFα increased in HS males and females (both p < 0.05), reaching approximately 2.5-fold relative expression, whereas CON-fiber and HS-fiber groups were not significantly different from CON (Figure 7E). At 24 months, TNFα expression was significantly increased in both sucrose-fed groups in both sexes (Figure 7F). In males, HS and HS-fiber animals showed modest but significant increases (both p < 0.05). The female response was substantially larger: HS females reached approximately 22-fold relative expression (p < 0.01), while HS-fiber females showed an approximately fivefold increase (p < 0.05). The most prominent inflammatory transcriptional response in the study was therefore observed in 24-month HS females.
4. Discussion
High-sucrose feeding induced a metabolic phenotype characterized by elevated blood glucose and HOMA-IR together with a reduction in QUICKI in both male and female rats [32]. These changes provide evidence for impaired insulin sensitivity and are consistent with the established use of sucrose-fed rodents as an experimental model of metabolic syndrome and insulin resistance [22]. Sucrose-associated alterations were also observed in animals receiving the high-fiber diet. As HS and HS-fiber were not directly compared statistically, the effect of additional dietary fiber on these outcomes cannot be established from the present analysis.
The reduction in BUN represents a different aspect of the metabolic response. Previous studies in fructose-fed rats have likewise reported unchanged or reduced BUN concentrations during fructose-induced obesity [33]. Given the absence of an increase in serum creatinine, the present BUN findings are more appropriately interpreted as a metabolic alteration associated with the sucrose intervention rather than as direct evidence of renal dysfunction.
Hepatic fatty acid composition was markedly altered by sucrose treatment at 12 months and especially at 24 months. The clearest long-term pattern was an increase in the relative proportions of monounsaturated fatty acids, particularly palmitoleic and oleic acids, accompanied by marked increases in SCD1 expression. SCD1 catalyzes the Δ9-desaturation of palmitic and stearic acids to form these MUFAs [17,18]. Hepatic de novo lipogenesis is strongly responsive to carbohydrate availability, and sustained high sugar intake can favor lipogenic pathways [10,14]. In the present experiment, the parallel increase in MUFA proportions and SCD1 expression became especially prominent after prolonged exposure, suggesting that the Δ9-desaturation pathway was an important component of the long-term hepatic adaptation. A similar combination of increased hepatic MUFA and altered lipogenic gene expression was observed in our previous sucrose-fed rat trial [22].
The n-6 fatty-acid profile changed in a different direction. Linoleic acid and arachidonic acid were progressively reduced in the sucrose-fed groups, whereas C22:5n-6 showed a transient increase at 12 months followed by a reduction in HS-fiber animals at 24 months. The formation of long-chain PUFA depends on substrate availability and partitioning into oxidation together with elongation and desaturation reactions, and all these factors are sensitive to nutritional and metabolic regulation [17,20]. Treatment-associated differences in Fads1 and Fads2 expression at individual sampling points may be related to changes in long-chain PUFA metabolism.
DHA was reduced in all intervention groups after 12 and 24 months, including CON-fiber animals. Consequently, the high-fiber dietary background cannot be interpreted as preserving hepatic DHA under the conditions of this study. The reduction in DHA was also evident in both sexes, although the magnitude of individual fatty-acid and desaturase responses differed between males and females. Sex-related differences in hepatic lipid metabolism are well established and can influence fatty-acid synthesis, desaturation, and storage [23]. The present data extend this concept by showing that sex differences were most apparent in the magnitude and timing of individual responses rather than as uniform protection of one sex.
The concentration of 22:5n-6 transiently increased at 12 months of treatment, followed by a marked decrease at 24 months. It has been reported that 22:5n-6 concentrations may increase in response to decreased DHA availability, potentially reflecting a compensatory mechanism. Accordingly, the DHA/22:5n-6 ratio has been proposed as a potential index of DHA deficiency [34]. This mechanism may provide a plausible explanation for the increase in 22:5n-6 observed in our study, as it coincided with a decrease in DHA concentrations. However, at 24 months, 22:5n-6 concentrations decreased concomitantly with DHA, suggesting that this potential compensatory response may be diminished in advanced age. Furthermore, 22:5n-6 concentrations did not increase in the CON-fiber group despite the observed decrease in DHA, suggesting that the proposed compensatory response may not occur uniformly across dietary conditions.
At 12 months, NRF2 mRNA expression was higher in the sucrose-fed groups than in corresponding controls, whereas at 24 months lower relative NRF2 expression was observed in several dietary groups compared with their respective controls. These findings describe treatment-associated differences within individual sampling points rather than a directly measured temporal sequence. Elevated serum and hepatic MDA concentrations support increased lipid peroxidation associated with sucrose exposure, but do not establish progressive structural liver damage. Our previous fructose-fed rat model also showed associations between NRF2 expression, lipid peroxidation, and inflammatory markers [24].
The inflammatory and profibrotic transcriptional responses developed in parallel with the oxidative changes. TNFα was increased in HS animals by 12 months and in both sucrose-fed groups by 24 months, whereas TGFβ showed a more restricted response and remained elevated primarily in HS animals at 24 months. These observations do not establish an effect of dietary fiber because HS and HS-fiber groups were not directly compared. Chronic metabolic dysfunction is closely linked to inflammatory signaling, and changes in hepatic fatty-acid composition can contribute to the metabolic context in which such signaling develops [4,5,12]. However, the absence of histopathological evaluation limits our ability to determine whether these molecular changes were accompanied by structural alterations in the liver, including steatosis, inflammatory cell infiltration, or fibrosis.
The sPLS-DA provided an integrated view of these changes at 24 months. The principal separation distinguished the sucrose-fed groups from the non-sucrose groups, and the variable maps highlighted the same metabolic directions identified in the individual analyses: lower n-6-related variables and higher MUFA-related variables in HS and HS-fiber animals. In contrast, the CON-fiber comparison was more strongly associated with lower n-3-related variables. This distinction is important because it indicates that the high-fiber diet and sucrose exposure did not produce identical lipid signatures even when some individual fatty acids changed in the same direction. Nevertheless, the relatively small sample size (n = 5 per group) and the absence of additional correction across all measured endpoints warrant cautious interpretation of borderline significant findings. The sPLS-DA results should therefore be regarded as exploratory.
Taken together, the principal novelty of this study lies in the long-term characterization of hepatic lipid remodeling across 1, 12, and 24 months of sucrose exposure in both sexes and in the presence or absence of a high-fiber dietary background. Rather than identifying a uniform response, the data reveal differences in hepatic fatty-acid composition, lipid peroxidation, and inflammatory signaling at the examined sampling points, together with treatment-associated gene-expression differences assessed within each time point. This integrated temporal perspective extends previous short-term sucrose-feeding studies and indicates that the metabolic consequences of chronic sugar intake are shaped not only by diet composition but also by duration of exposure and biological sex.
5. Conclusions
Chronic sucrose consumption may contribute to progressive metabolic dysfunction by disrupting hepatic lipid metabolism, oxidative balance, and inflammatory signaling. Treatment-associated differences were observed at different sampling points, suggesting that prolonged dietary sugar exposure and aging may jointly influence metabolic homeostasis. From a translational perspective, these findings highlight the importance of considering both the duration of dietary sugar exposure and biological aging when assessing metabolic risk. The observed differences across sex and dietary treatment groups suggest heterogeneity in metabolic responses, although the effect of additional fiber was not directly tested. However, these findings were obtained in a rodent model involving sucrose supplementation through drinking water and cannot be directly extrapolated to human dietary patterns. Nevertheless, they provide insight into the relationship between prolonged sugar exposure, aging, and metabolic alterations and may help guide future investigations into dietary strategies for preventing age-related metabolic dysfunction.
Supplementary Materials
The following supporting information can be downloaded at: https://www.mdpi.com/article/10.3390/metabo16110827/s1, Table S1: Hepatic fatty acid composition in male and female rats after 24 months of dietary treatment; Table S2: Hepatic fatty acid composition in male and female rats after 12 months of dietary treatment.
Author Contributions
Conceptualization, T.M. and K.S.; methodology, S.H., T.M., P.R., M.M.M., V.M. and K.S.; validation, T.M. and K.S.; formal analysis, K.S. and S.H.; investigation, S.H., T.M., K.S., P.R., V.M. and M.M.M.; resources, K.S.; data curation, S.H. and K.S.; writing—original draft preparation, S.H. and K.S.; writing—review and editing, S.H., T.M. and K.S.; visualization, T.M.; supervision, K.S.; project administration, K.S.; funding acquisition, K.S. All authors have read and agreed to the published version of the manuscript.
Funding
This research was funded by the Croatian Science Foundation as a part of the project “Maternal obesity and aging cause sex-specific adverse effects on lipid metabolism and inflammation in offspring” granted to Kristina Starčević, grant number IP-2022-10-4578.
Institutional Review Board Statement
The animal study protocol was approved by the Croatian National Ethics Committee and the Veterinary Administration of the Ministry of Agriculture of the Republic of Croatia (authorization EP 410/2023 approved on 18 December 2023).
Informed Consent Statement
Not applicable.
Data Availability Statement
The data presented in this study are available on request from the corresponding author.
Conflicts of Interest
The authors declare no conflicts of interest.
References
- Ahmed, S.K.; Mohammed, R.A. Obesity: Prevalence, causes, consequences, management, preventive strategies and future research directions. Metab. Open 2025, 27, 100375. [Google Scholar] [CrossRef] [Scilit]
- Ng, M.; Gakidou, E.; Lo, J.; Abate, Y.H.; Abbafati, C.; Abbas, N.; Abbasian, M.; Abd ElHafeez, S.; Abdel-Rahman, W.M.; Abd-Elsalam, S.; et al. Global, regional, and national prevalence of adult overweight and obesity, 1990–2021, with forecasts to 2050: A forecasting study for the Global Burden of Disease Study 2021. Lancet 2025, 405, 813–838. [Google Scholar] [CrossRef] [Scilit]
- Masood, B.; Moorthy, M. Causes of obesity: A review. Clin. Med. 2023, 23, 284–291. [Google Scholar] [CrossRef] [Scilit]
- Singla, P.; Bardoloi, A.; Parkash, A.A. Metabolic effects of obesity: A review. World J. Diabetes 2010, 1, 76–88. [Google Scholar] [CrossRef] [Scilit]
- Choi, W.; Woo, G.H.; Kwon, T.-H.; Jeon, J.-H. Obesity-driven metabolic disorders: The interplay of inflammation and mitochondrial dysfunction. Int. J. Mol. Sci. 2025, 26, 9715. [Google Scholar] [CrossRef] [Scilit]
- Zhang, K.; Ma, Y.; Luo, Y.; Song, Y.; Xiong, G.; Ma, Y.; Sun, X.; Kan, C. Metabolic diseases and healthy aging: Identifying environmental and behavioral risk factors and promoting public health. Front. Public Health 2023, 11, 1253506. [Google Scholar] [CrossRef] [Scilit]
- Franceschi, C.; Garagnani, P.; Parini, P.; Giuliani, C.; Santoro, A. Inflammaging: A new immune–metabolic viewpoint for age-related diseases. Nat. Rev. Endocrinol. 2018, 14, 576–590. [Google Scholar] [CrossRef] [Scilit]
- Barzilai, N.; Huffman, D.M.; Muzumdar, R.H.; Bartke, A. The critical role of metabolic pathways in aging. Diabetes 2012, 61, 1315–1322. [Google Scholar] [CrossRef] [Scilit]
- López-Otín, C.; Blasco, M.A.; Partridge, L.; Serrano, M.; Kroemer, G. The hallmarks of aging. Cell 2013, 153, 1194–1217. [Google Scholar] [CrossRef] [Scilit]
- Sanders, F.W.B.; Griffin, J.L. De novo lipogenesis in the liver in health and disease: More than just a shunting yard for glucose. Biol. Rev. 2016, 91, 452–468. [Google Scholar] [CrossRef] [Scilit]
- Jump, D.B. Mammalian fatty acid elongases. Methods Mol. Biol. 2009, 579, 375–389. [Google Scholar] [CrossRef] [Scilit]
- Jump, D.B.; Lytle, K.A.; Depner, C.M.; Tripathy, S. Omega-3 polyunsaturated fatty acids as a treatment strategy for nonalcoholic fatty liver disease. Pharmacol. Ther. 2018, 181, 108–125. [Google Scholar] [CrossRef] [Scilit]
- Puri, P.; Wiest, M.M.; Cheung, O.; Mirshahi, F.; Sargeant, C.; Min, H.K.; Contos, J.M.; Sterling, R.K.; Fuchs, M.; Zhou, H.; et al. The plasma lipidomic signature of nonalcoholic steatohepatitis. Hepatology 2009, 50, 1827–1838. [Google Scholar] [CrossRef] [Scilit]
- Softic, S.; Cohen, D.E.; Kahn, C.R. Role of dietary fructose and hepatic de novo lipogenesis in fatty liver disease. Dig. Dis. Sci. 2016, 61, 1282–1293. [Google Scholar] [CrossRef] [Scilit]
- Starčević, K.; Filipović, N.; Galan, A.; Micek, V.; Gudan Kurilj, A.; Mašek, T. Hepatic lipogenesis and brain fatty acid profile in response to different dietary n6/n3 ratios and DHA/EPA supplementation in streptozotocin-treated rats. Mol. Nutr. Food Res. 2018, 62, e1701007. [Google Scholar] [CrossRef] [Scilit]
- Mašek, T.; Barišić, J.; Micek, V.; Starčević, K. Cafeteria diet and high-fructose rodent models of NAFLD differ in the metabolism of important PUFA and palmitoleic acid without additional influence of sex. Nutrients 2020, 12, 3339. [Google Scholar] [CrossRef] [Scilit]
- Nakamura, M.T.; Nara, T.Y. Structure, function, and dietary regulation of delta6, delta5, and delta9 desaturases. Annu. Rev. Nutr. 2004, 24, 345–376. [Google Scholar]
- Ntambi, J.M.; Miyazaki, M. Regulation of stearoyl-CoA desaturases and role in metabolism. Prog. Lipid Res. 2004, 43, 91–104. [Google Scholar] [CrossRef] [Scilit]
- Ulmann, L.; Blond, J.P.; Maniongui, C.; Poisson, J.P.; Durand, G.; Bézard, J.; Pascal, G. Effects of age and dietary essential fatty acids on desaturase activities and on fatty acid composition of liver microsomal phospholipids of adult rats. Lipids 1991, 26, 127–133. [Google Scholar] [CrossRef] [Scilit]
- Wang, Y.; Botolin, D.; Xu, J.; Christian, B.; Mitchell, E.; Jayaprakasam, B.; Nair, M.; Peters, J.M.; Busik, J.; Olson, L.K.; et al. Regulation of hepatic fatty acid elongase and desaturase expression in diabetes and obesity. J. Lipid Res. 2006, 47, 2028–2041. [Google Scholar] [CrossRef] [Scilit]
- Sonnenburg, J.L.; Bäckhed, F. Diet–microbiota interactions as moderators of human metabolism. Nature 2016, 535, 56–64. [Google Scholar] [CrossRef] [Scilit]
- Mašek, T.; Filipović, N.; Vuica, A.; Starčević, K. Effects of treatment with sucrose in drinking water on liver histology, lipogenesis and lipogenic gene expression in rats fed high-fiber diet. Prostaglandins Leukot. Essent. Fat. Acids 2017, 116, 1–8. [Google Scholar] [CrossRef] [Scilit]
- Link, J.C.; Reue, K. Genetic basis for sex differences in obesity and lipid metabolism. Annu. Rev. Nutr. 2017, 37, 225–245. [Google Scholar] [CrossRef] [Scilit]
- Roškarić, P.; Šperanda, M.; Mašek, T.; Verbanac, D.; Starčević, K. Low dietary n6/n3 ratio attenuates changes in NRF2 gene expression, lipid peroxidation, and inflammatory markers induced by fructose overconsumption in rat abdominal adipose tissue. Antioxidants 2021, 10, 2005. [Google Scholar] [CrossRef] [Scilit]
- Hawkins, R.C. Evaluation of Roche Accu-Chek Go and Medisense Optium blood glucose meters. Clin. Chim. Acta 2005, 353, 127–131. [Google Scholar] [CrossRef] [Scilit]
- Matthews, D.R.; Hosker, J.P.; Rudenski, A.S.; Naylor, B.A.; Treacher, D.F.; Turner, R.C. Homeostasis model assessment: Insulin resistance and beta-cell function from fasting plasma glucose and insulin concentrations in man. Diabetologia 1985, 28, 412–419. [Google Scholar] [CrossRef] [Scilit]
- Katz, A.; Nambi, S.S.; Mather, K.; Baron, A.D.; Follmann, D.A.; Sullivan, G.; Quon, M.J. Quantitative insulin sensitivity check index: A simple, accurate method for assessing insulin sensitivity in humans. J. Clin. Endocrinol. Metab. 2000, 85, 2402–2410. [Google Scholar] [CrossRef]
- Folch, J.; Lees, M.; Sloane Stanley, G.H. A simple method for the isolation and purification of total lipides from animal tissues. J. Biol. Chem. 1957, 226, 497–509. [Google Scholar] [CrossRef] [Scilit]
- Petrović, M.; Kezić, N.; Bolanča, V. Optimization of the GC method for routine analysis of the fatty acid profile in several food samples. Food Chem. 2010, 122, 285–291. [Google Scholar] [CrossRef] [Scilit]
- Starčević, K.; Roškarić, P.; Šperanda, M.; Đidara, M.; Kurilj, A.G.; Maurić, M.; Mašek, T. High dietary n6/n3 ratio decreases eicosapentaenoic-to-arachidonic acid ratios and upregulates NFκB/p50 expression in a short-term low-dose streptozotocin and high-fructose rat model of diabetes. Prostaglandins Leukot. Essent. Fat. Acids 2019, 149, 1–7. [Google Scholar] [CrossRef] [Scilit]
- Livak, K.J.; Schmittgen, T.D. Analysis of relative gene expression data using real-time quantitative PCR and the 2−ΔΔCT method. Methods 2001, 25, 402–408. [Google Scholar] [CrossRef] [Scilit]
- Hahn, M.K.; Giacca, A.; Pereira, S. In vivo techniques for assessment of insulin sensitivity and glucose metabolism. J. Endocrinol. 2024, 260, e230308. [Google Scholar] [CrossRef] [Scilit]
- Dupas, J.; Feray, A.; Goanvec, C.; Guernec, A.; Samson, N.; Bougaran, P.; Guerrero, F.; Mansourati, J. Metabolic syndrome and hypertension resulting from fructose enriched diet in Wistar rats. BioMed Res. Int. 2017, 2017, 2494067. [Google Scholar] [CrossRef] [Scilit]
- Desai, A.; Park, T.; Barnes, J.; Kevala, K.; Chen, H.; Kim, H.-Y. Reduced acute neuroinflammation and improved functional recovery after traumatic brain injury by α-linolenic acid supplementation in mice. J. Neuroinflamm. 2016, 13, 253. [Google Scholar] [CrossRef] [Scilit]

Disclaimer/Publisher’s Note: The statements, opinions and data contained in all publications are solely those of the individual author(s) and contributor(s) and not of MDPI and/or the editor(s). MDPI and/or the editor(s) disclaim responsibility for any injury to people or property resulting from any ideas, methods, instructions or products referred to in the content. |
© 2026 by the authors. Licensee MDPI, Basel, Switzerland. This article is an open access article distributed under the terms and conditions of the Creative Commons Attribution (CC BY) license.