


Abstract
Vancomycin (VCN) is a glycopeptide antibiotic widely used to treat Gram-positive infections such as those caused by methicillin-resistant Staphylococcus aureus (MRSA). Its narrow therapeutic window, high interindividual pharmacokinetic variability, and dose-dependent nephrotoxicity support the need for therapeutic drug monitoring (TDM). In this study, a UHPLC-UV method for VCN quantification in human plasma was developed and validated according to ICH M10 guidelines, using a one-step protein precipitation requiring only 100 µL of plasma. Clinical applicability was preliminarily explored in three hospitalized patients, where the area under the concentration-time curve over 24 h to minimum inhibitory concentration ratio (AUC24/MIC) was estimated using PrecisePK, NextDose, and TDMx Bayesian software platforms before and after dose adjustment. The method showed linearity from 0.5 to 100 µg/mL (r2 > 0.99), with accuracy within ±7% and precision below 11%. Acceptance criteria for selectivity and matrix effect were met, and stability was confirmed under multiple conditions, including clinically relevant storage and transport. Pre-adjustment AUC24/MIC values were outside the target window of 400–600 in all patients, confirming the pertinence of implementing model-informed precision dosing as a routine TDM practice in Colombian health institutions.
1. Introduction
Vancomycin (VCN) is a glycopeptide antibiotic produced by Streptomyces orientalis, first isolated in 1957, with demonstrated activity against most Gram-positive bacteria, including methicillin-resistant Staphylococcus aureus (MRSA) [1]. However, its clinical use is complex due to the wide variability in its pharmacokinetic parameters among individuals, a narrow therapeutic window [2,3], and dose-dependent ototoxicity and nephrotoxicity [4,5]. These characteristics make individualized dosing essential for VCN; therefore, therapeutic drug monitoring (TDM), in which drug concentrations in plasma are used to guide dose adjustment, has become a standard clinical practice for this purpose [2,6].
Current consensus guidelines from the American Society of Health-System Pharmacists, the Infectious Diseases Society of America, the Pediatric Infectious Diseases Society, and the Society of Infectious Diseases Pharmacists (ASHP/IDSA/PIDS/SIDP, 2020) [2] recommend TDM of VCN based on monitoring the area under the concentration-time curve to minimum inhibitory concentration ratio (AUC24/MIC) for individualized dosing, targeting a range of 400–600. According to this guideline, AUC24/MIC values above 600 are associated with a high risk of acute kidney injury, and those below 400 with a risk of treatment failure and bacterial resistance [2].
Therefore, modern TDM of VCN requires accurate plasma concentration measurements, the integration of model-informed precision dosing (MIPD) to predict drug exposure (typically implemented through a Bayesian approach) and the availability of trained personnel to interpret software outcomes [2,6,7]. Its implementation remains challenging in clinical settings, particularly in low- and middle-income countries like Colombia. In the past few years, a national survey of critical care specialists revealed problems in the timeliness of reporting TDM results, especially for VCN, identifying the lack of technology for measuring antibiotic levels as the main barrier [8]. Locally, in the Atlántico department—the sixth largest contributor to the national Gross Domestic Product [9]—a low capacity to perform VCN monitoring, as well as deficiencies in sample handling, patient data recording, and result traceability, had already been reported [10]. Furthermore, VCN consumption in adult hospitalization services in the Atlántico department reached 6.54 Defined Daily Doses per 100 bed-days in 2024, corresponding to nearly twice the national average of 3.49, underscoring the local clinical need for accessible and reliable TDM [11].
Several analytical methods have been developed and validated for VCN quantification in biological fluids using different techniques such as radioimmunoassay (RIA), enzyme-multiplied immunoassay (EMIT), fluorescence polarization immunoassay (FPIA), and liquid chromatography with ultraviolet (HPLC-UV) or mass (LC-MS/MS) detection [12]. Immunoassay techniques are widely used in clinical practice due to their speed and simplicity, but they have limitations regarding cross-reactivity and the ability to quantify VCN concentrations outside the range from 2–5 µg/mL to 20 µg/mL [12,13]. LC-MS/MS offers superior specificity and sensitivity but requires expensive instrumentation that is frequently unavailable in routine clinical laboratory settings, and thus HPLC-UV methods represent a more accessible alternative [12,14].
Other HPLC-UV methods reported in the literature for plasma VCN quantification present certain limitations for routine TDM, including the use of highly corrosive reagents such as perchloric acid in sample preparation [13,15,16,17], large plasma volumes [13,14,15,16], or time-demanding extraction procedures involving acetonitrile evaporation and reconstitution [14,18]. In this work, a UHPLC-UV method for VCN quantification in human plasma is presented. The method uses a simple one-step protein precipitation with acidified methanol, requiring only 100 µL of plasma, and was validated against the key parameters established in the ICH M10 bioanalytical method validation guideline, currently implemented by the FDA and EMA [19]. The applicability of this method for TDM of VCN was preliminarily explored in plasma samples from three hospitalized patients using three different Bayesian dosing tools.
2. Materials and Methods
2.1. Materials
Methanol (HPLC grade), formic acid, ortho-phosphoric acid, and sodium dihydrogen phosphate (reagent grade) were acquired from Merck (Darmstadt, Germany). Vancomycin hydrochloride pharmaceutical secondary standard (91.3%) and caffeine (IS, 98%) were acquired from Sigma-Aldrich. HPLC-grade water was prepared using the Aqua Direct Q5 UV-R water purification system (Millipore, Bedford, MA, USA).
2.2. Standard and Working Solution Preparation
Stock solutions of both VCN and IS were individually prepared at 1 mg/mL in HPLC-grade water as solvent. Working solutions were obtained by dilution of the VCN stock in water and addition of the appropriate volume of the IS stock, to produce eight solutions at concentrations corresponding to four times the nominal plasma concentration of VCN in the calibration curve and 100 µg/mL for the IS. A separate VCN stock was prepared, diluted, and spiked with IS stock to produce the working solutions used for quality control samples (QC) preparation. Stock solutions and working solutions were freshly prepared at the beginning of each analytical run.
2.3. Calibration Curve and Quality Control Samples Preparation
Calibration curve levels and QC samples were prepared in blank plasma obtained from voluntary donors at the blood bank associated with the Fundación Hospital Universidad del Norte (Atlántico department, Soledad, Colombia), who provided written informed consent and met the criteria for blood donation in accordance with Colombian regulations [20]. To obtain the required calibration and QC concentrations, each 100 µL aliquot of blank plasma was spiked with 25 µL of the respective working solution. The nominal VCN concentrations of the calibration curve levels were 0.5, 1, 5, 12.5, 25, 50, 75, and 100 µg/mL (upper limit of quantification, ULOQ); these refer to concentrations in the original 100 µL of plasma. Calibration curves were completed with a blank plasma sample and a plasma sample spiked with IS only.
QC nominal concentrations were 0.5 µg/mL (lower limit of quantification, LLOQ), 1 µg/mL (double the LLOQ, LQC), 50 µg/mL (50% of the calibration range, MQC), and 75 µg/mL (75% of the ULOQ, HQC) [19]. The IS concentration in the final 125 µL of all spiked samples was 20 µg/mL.
2.4. Plasma Sample Processing
Several protein precipitation methods from the literature were assessed for plasma sample extraction: acetonitrile [18], methanol, and methanol followed by solvent evaporation and reconstitution [21].
The final procedure, selected based on sample processing time, analyte recovery, and baseline stability in the chromatogram, was as follows. Each sample consisted of 100 µL of plasma spiked with 25 µL of the respective working solution (VCN plus IS), as described in Section 2.3, yielding a total volume of 125 µL. This spiked plasma was treated with 200 µL of methanol acidified with formic acid at 0.5% v/v. Samples were then vortexed for 60 s and centrifuged at 14,000 rpm (21,693× g, Rmax 99 mm), with a temperature ramp from 0 °C for the first 10 min to 20 °C for 10 additional min, which was found to be necessary to obtain a clear supernatant suitable for injection. The supernatant was collected and placed in an HPLC vial with a glass insert for injection and analysis. For patient samples, 100 µL of plasma were spiked with 25 µL of an IS working solution at 100 µg/mL, yielding a final volume of 125 µL with an IS concentration of 20 µg/mL, matching the conditions of the calibration curve and QC samples.
Recovery was established by comparing the analytical response of VCN and the IS between quality controls prepared by spiking unprocessed blank plasma and by spiking processed blank plasma, both at concentrations equivalent to LQC, MQC, and HQC.
2.5. Chromatographic Conditions
Chromatographic analysis was carried out on a Chromaster RS Ultra (Hitachi, Tokyo, Japan) equipped with a Kinetex EVO C18 column (100 × 2.1 mm, 2.6 µm, Phenomenex, Torrance, CA, USA), with the column oven set to 25 °C and an injection volume of 5 µL. A mobile phase consisting of 20 mM ammonium acetate buffer pH 4.0:methanol (88:12, v/v) was initially evaluated [18]. A gradient elution of sodium dihydrogen phosphate buffer 20 mM, pH 2.5 and methanol (Table 1), with a flow rate of 0.18 mL/min, was selected as the final mobile phase. Both 214 and 240 nm were monitored as detection wavelengths (λ) throughout method development and validation, being 214 nm selected as the final λ as it provided a higher analytical signal for VCN.
Table 1.
Mobile phase gradient of UHPLC method to quantify blood plasma vancomycin concentration.
2.6. Validation
2.6.1. Selectivity
Blank plasma from 6 different sources was processed, injected, and compared with a LLOQ injection to assess potential interferences in the matrix at the retention times of the VCN and the IS [19]. Interference was considered acceptable if the response at the retention time of each analyte was less than 20% of the LLOQ response for VCN and less than 5% of the IS response [19]. The plasma lots were also spiked with lysed whole blood (2% v/v) to investigate the selectivity in hemolyzed samples.
2.6.2. Carry-Over
A blank plasma sample was injected after the ULOQ injection and assessed for any signal of VCN or the IS at their respective retention times [19].
2.6.3. Calibration Curve and Range
Calibration curves were fitted by linear regression, using the peak-area ratio between VCN and the IS as the analytical signal. The parameters (slope, intercept, and coefficient of determination, R2) were calculated in OpenLab EZChrom using a 1/x2 weighting, selected based on R2 and error in back-calculated concentrations. The calibration range was confirmed if R2 was >0.99 and the back-calculated concentrations were within 15% of the nominal value at each level [19]. Inter-run slope variability was assessed using Grubbs’ test.
2.6.4. Accuracy and Precision
Five independent replicates of QC samples were analyzed in a single run (within-run accuracy and precision), and in three runs on 3 different days (between-run accuracy and precision). QC concentrations were calculated using fresh calibration curve data, and the relative errors with respect to the theoretical concentration (%E), as well as the coefficient of variation (CV) of the replicates, were evaluated for compliance with the ICH M10 acceptance criteria of ±15%, or ±20% for the LLOQ [19].
2.6.5. Matrix Effect
Matrix effect was evaluated by analyzing 3 replicates of LQC and HQC prepared from 6 different blank plasma lots and assessing accuracy and precision, keeping the acceptance criteria of ±15% for %E and CV already established in the previous section [19].
2.6.6. Stability
LQC and HQC samples were prepared in triplicate, stored under various conditions, and then analyzed against a freshly prepared calibration curve. The conditions evaluated were the following: 3 freeze–thaw cycles (freeze at −20 °C for 12 h and thaw at room temperature for 30 min), storage in a styrofoam box with ice packs for 12 h, and storage at −20 °C for 15 d (long-term stability). Stability of standard stock solutions, stored at −20 °C for 7 days, and of processed samples stored on the UHPLC autosampler for 24 h, were also evaluated in triplicate. Mean accuracy within ±15% was considered acceptable according to ICH M10 [19].
2.6.7. Dilution Integrity
Plasma samples were spiked with VCN at a concentration of 150 µg/mL, and blank plasma was then added at a dilution factor of 3-fold to yield a theoretical concentration equivalent to the MQC level (50 µg/mL). Five replicates of diluted samples were processed on two different days, following the procedure described in Section 2.4, and %E and CV were calculated and compared with the acceptance criteria of ±15% [19].
2.7. Method Application
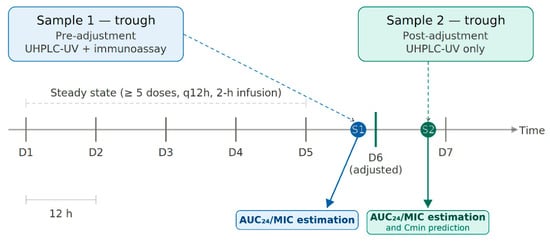
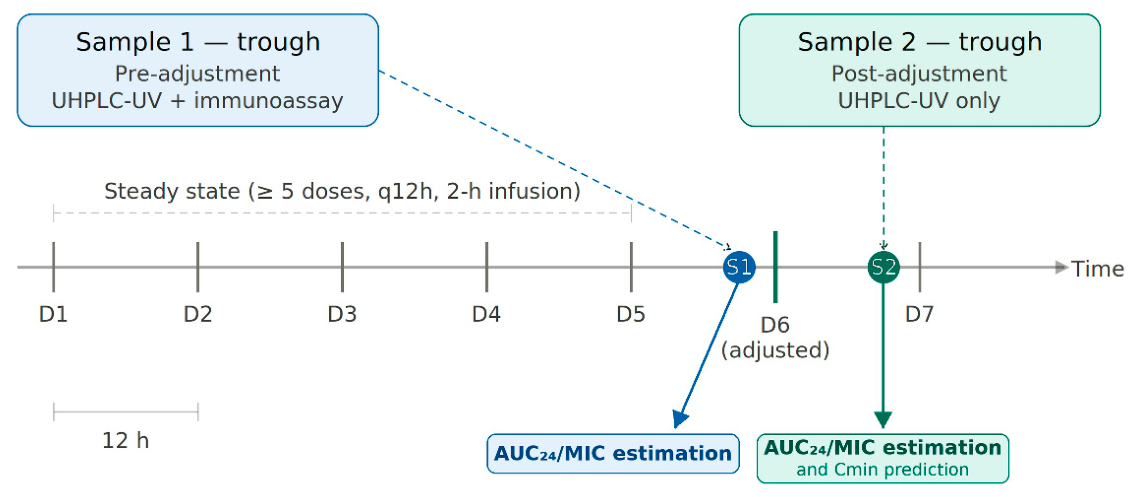
The method developed was assessed in a first attempt of validation in a relevant scenario, using samples from three hospitalized patients receiving VCN intravenously over 2 h for intermittent infusions every 12 h, at the Fundación Hospital Universidad del Norte (HUN, Soledad, Atlántico, Colombia). The protocol for this study was approved by the Ethics Committee of the HUN (approval number: Act 335, 24 April 2025), and written informed consents were obtained from all patients prior to their participation. Two blood samples were collected from each patient in EDTA tubes, shortly before dose administration at steady state (after at least five doses), following the usual protocol and by the usual personnel of the institution. The first samples corresponded to a trough before dose adjustment and the second to a trough after dose adjustment. The adjustment was made by the hospital using a routine immunoassay method and an independent dosing tool.
Demographic, clinical, and treatment information were collected from each patient, i.e., sex, age, body weight, serum creatinine, dosage regimen, time of the last dose, and time of sampling. The trough concentrations were measured with the UHPLC-UV method described herein and introduced into the software platforms PrecisePK (v3.5.0, https://www.precisepk.com/, accessed on 8 April 2026), NextDose (v2.5.02, https://www.nextdose.org/, accessed on 8 April 2026), and TDMx (v0.98.0 beta, https://www.tdmx.eu/, accessed on 8 April 2026) to estimate individual AUC24/MIC values using a Bayesian approach, before and after dose adjustment. For the post-adjustment estimation, the complete dosing and sampling history of each patient was considered, and AUC24/MIC was projected at steady state. The MIC was assumed to be 1 µg/mL for all patients, consistent with the recommendation of the ASHP/IDSA/PIDS consensus guideline [2].
The pre-adjustment AUC24/MIC was also estimated using the trough concentrations reported by the hospital, and the percent difference between both estimates was calculated as a preliminary comparison between analytical methods. In all cases, the population pharmacokinetic (popPK) model was initially selected by visual inspection of concentration-time curves from the population model against the individual patient curve. The trough concentrations after dose adjustment were predicted by TDMx and PrecisePK, and the percent difference between predicted and measured values was calculated as an exploratory indicator of the predictive performance of these two tools (Figure 1).
Figure 1.
Sampling protocol and data analysis. Blood samples were obtained from patients receiving intravenous vancomycin every 12 h at steady state, before and after dose adjustment. The area under the concentration-time curve over 24 h related to the minimum inhibitory concentration (AUC24/MIC) was estimated from each sample using Bayesian software platforms. The trough concentration after dose adjustment was also predicted using the population pharmacokinetics model selected for each patient.
3. Results
3.1. Sample Processing and Chromatographic Conditions
The use of acetonitrile as a precipitation solvent, along with ammonium acetate buffer as the weak mobile phase component in an isocratic elution, produced undesired inconsistencies in peak asymmetry and retention times of both analytes. The combination of methanol precipitation with a mobile phase containing sodium dihydrogen phosphate buffer pH 2.5 resulted in consistent signals but with baseline alterations that hindered peak integration. This was corrected by slight acidification of the precipitation solvent with formic acid at 0.5% v/v. Solvent evaporation and reconstitution were discarded due to the long processing time (>2 h).
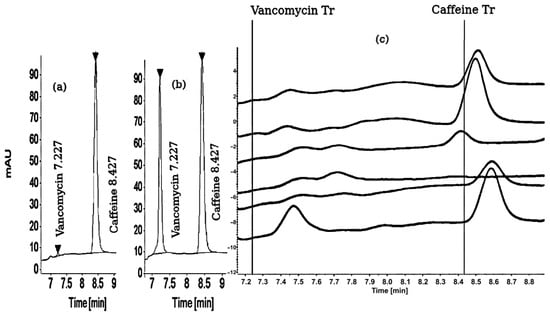
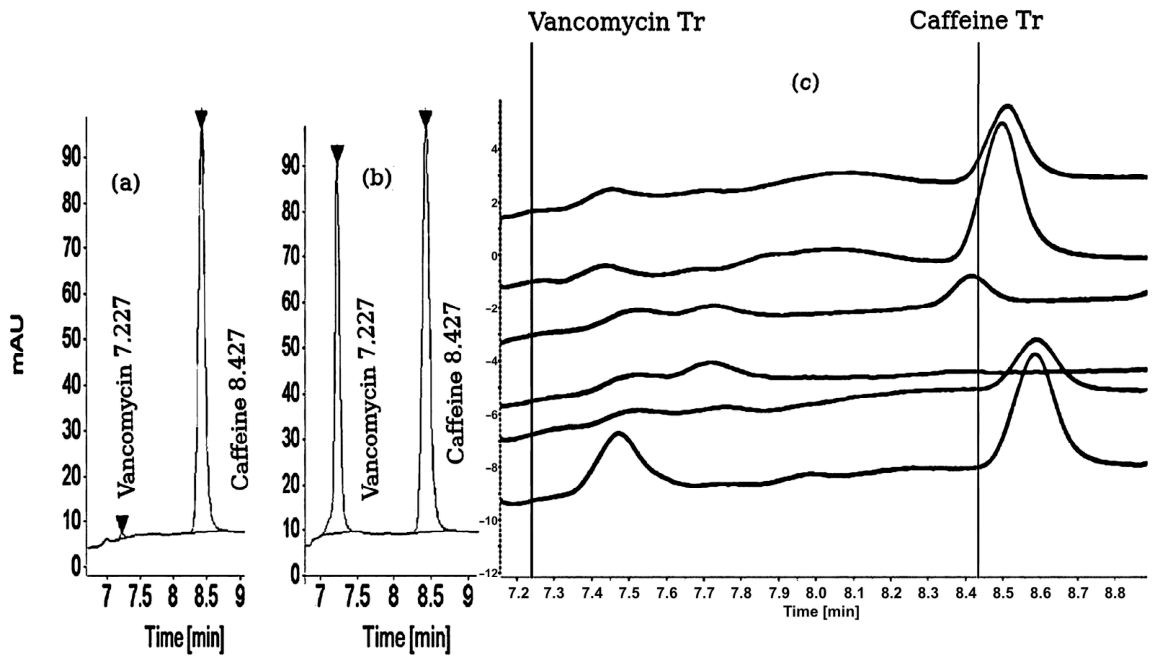
Recovery at the final processing and chromatographic conditions (Section 2.4 and Section 2.5) ranged from 74.0 to 78.0% for all QC levels and from 73.5 to 77.0% for the IS, with a global CV of 2.0%. The run time was 16 min, with a typical retention time of VCN and the IS of 7.2 and 8.4 min, respectively (Figure 2a,b). The routine system suitability test (SST) was performed at the beginning and end of each analytical run, using five injections of a solution containing VCN and IS at 12.5 and 6.8 µg/mL, respectively. The acceptance criteria for SST were fixed based on the validation results as CV ≤ 2.0%, resolution ≥ 7.5, and tailing factor between 0.8 and 1.5. These criteria were met in all validation and clinical runs.
Figure 2.
Plasma vancomycin (VCN) chromatogram and method selectivity. (a) Representative chromatogram of the lower limit of quantification level (0.5 µg/mL). (b) Representative chromatogram of the high quality control level (75 µg/mL). (c) Overlays of chromatograms from six different plasma sources. The vertical lines indicate the retention times expected for VCN and the internal standard.
3.2. Selectivity
No interferences were found at the VCN retention time from any of the 6 sources of blank plasma analyzed. Signals at a retention time close to that of the IS were found, but with responses representing between 1.2 and 3.5% of that of the IS, meeting the ICH M10 acceptance criterion [19] (Figure 2c). Simulated hemolyzed samples showed no additional interference with the analytes, confirming the applicability of the method to this matrix condition.
3.3. Carry-Over
After injection of a ULOQ sample followed by blank plasma, carry-over was observed, predominantly for VCN. This was addressed by using a syringe/needle washing solution consisting of water:methanol (33:67, v/v) with 0.3% formic acid, which is similar to the diluent of the processed samples. The autosampler syringe/needle washing times were set to 10 s, and no carry-over was observed once these adjustments were applied (see Supplementary Figure S1). All validation runs were performed with these measures in place. Diluent injections after ULOQ calibration standard and HQC, and before patient samples, were included within each analytical run as a conservative monitoring practice, consistently showing no carry-over and confirming that this was not a required corrective measure.
3.4. Calibration Curve and Range
Six calibration curves, all prepared in blank plasma from a single source, were obtained during the validation process. The linear regression parameters are presented in Table 2. The back-calculated concentrations were within 15% of the nominal value at each level of the different curves, confirming the quantification range of 0.5−100 µg/mL. The IS response across all runs ranged from 2,116,078 to 2,882,863 for calibration levels, and from 2,137,585 to 2,881,148 for QC samples, showing no systematic trend. None of the calibration slopes was identified as a statistically significant outlier (Grubbs’ test, p > 0.05).
Table 2.
Calibration curve parameters.
3.5. Accuracy and Precision
The relative errors and CV of QCs from within-run and between-run accuracy and precision tests are shown in Table 3. All levels complied with ICH M10 criteria [19], with a maximum %E of 6.9% and maximum CV of 10.6%.
Table 3.
Accuracy and precision results.
3.6. Matrix Effect
No effect on accuracy and precision of the method was observed across the different plasma sources, as all LQC and HQC samples presented %E and CV below 9.5% (Table 4).
Table 4.
Matrix effect on accuracy and precision.
3.7. Stability
VCN in plasma samples remained stable for at least 12 h in a styrofoam box with ice packs, for 15 days in a freezer at −20 °C, and after three cycles of freeze–thaw, with %E and CV below 10%. Processed samples remained stable in the UHPLC autosampler at 25 °C for at least 24 h (Table 5). For stock standard solutions stored for 7 days at −20 °C, VCN showed a %E of 6.0% with a CV of 6.2%, and the IS showed a %E of 8.3% with a CV of 10.3%, indicating the stability of both analytes in water under this condition.
Table 5.
Stability on tested storage conditions.
3.8. Dilution Integrity
The 3-fold diluted samples showed %E of 1.9% and CV of 9.1%, meeting the ICH M10 acceptance criteria for this parameter [19].
3.9. Clinical Application
The UHPLC-UV method was applied in a preliminary exploration to measure VCN plasma concentration in three patients (two males, one female) aged between 26 and 63 years, with a body mass index ranging from 22.4 to 34.2, and normal serum creatinine. Patients, who provided their signed consent, were hospitalized at the HUN and received the drug by intravenous intermittent infusion over 2 h every 12 h, with an initial VCN dose between 705 and 1500 mg that was subsequently adjusted by the responsible clinician to between 750 and 1250 mg (Table 6). None of the patients reported recent caffeine consumption prior to sampling.
Table 6.
Demographic, clinical, and vancomycin dosing characteristics of patients included in the preliminary clinical application.
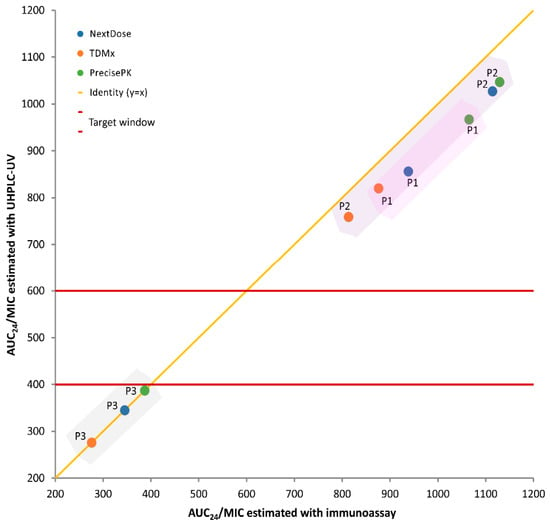
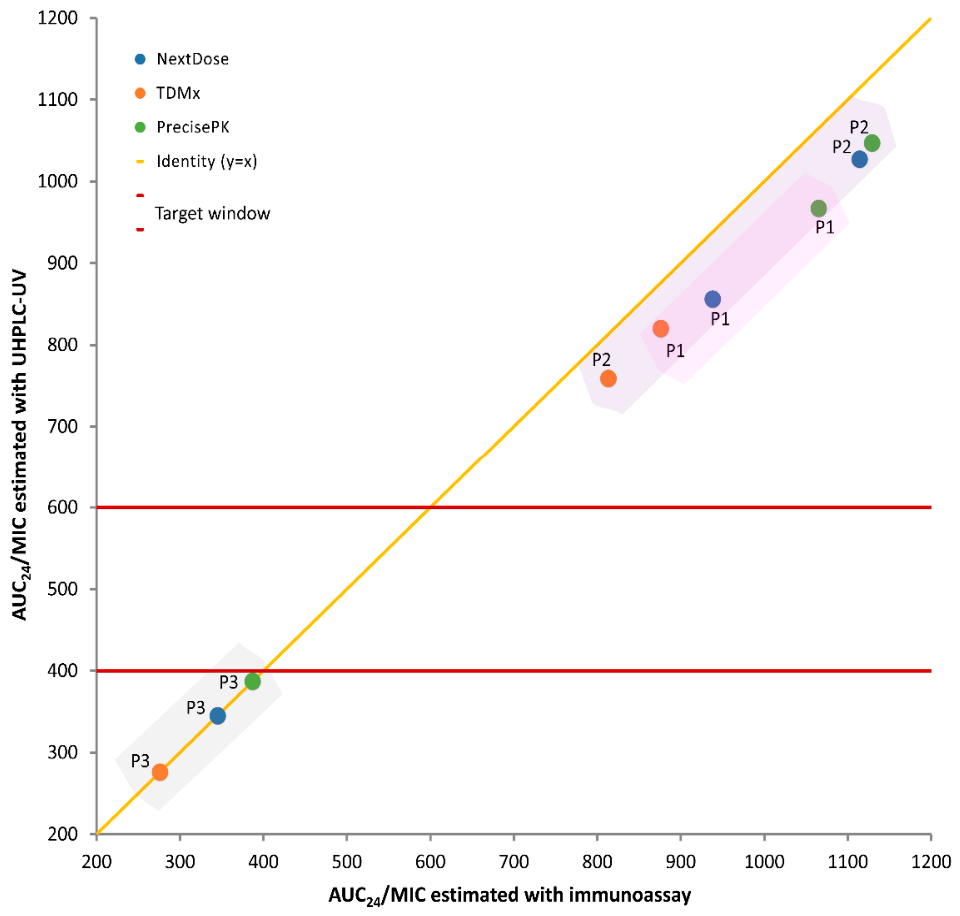
The first trough concentrations measured with the UHPLC-UV method were 27.5, 25.6, and 11.5 µg/mL for patients 1, 2, and 3, respectively. Compared to 32.00, 29.33, and 11.54 µg/mL reported by the hospital immunoassay, the corresponding relative differences were −14.1%, −12.7%, and −0.3%. The individual AUC24/MIC values estimated from both data sources with the software platforms PrecisePK, NextDose, and TDMx are presented in Table 7. The maximum difference between AUC24/MIC values estimated using UHPLC-UV data versus the clinical report was 9.2%, corresponding to patient 1 with PrecisePK. It was observed that TDMx consistently estimated the lowest AUC24/MIC values for all patients with both datasets, while PrecisePK produced the highest. However, all estimated values were outside the target window of 400–600, justifying the dose adjustment applied in all patients (Figure 3, Table 7).
Table 7.
Pre-adjustment and post-adjustment AUC24/MIC values estimated using a Bayesian approach with the population pharmacokinetic models from NextDose, TDMx, and PrecisePK for patients P1, P2, and P3.
Figure 3.
Scatter plot of pre-adjustment AUC24/MIC values estimated using UHPLC-UV measured trough concentration versus clinical immunoassay data for patients P1, P2, and P3. Estimated values were obtained using a Bayesian approach with the population pharmacokinetic models from NextDose (blue points), TDMx (orange points), and PrecisePK (green points). The shaded regions group the three estimates for a single patient. The diagonal yellow line represents the perfect agreement of AUC24/MIC between methods (y = x). Horizontal red lines indicate the target window of 400–600. AUC24/MIC: area under the concentration-time curve over 24 h related to the minimum inhibitory concentration. MIC = assumed to be 1 µg/mL.
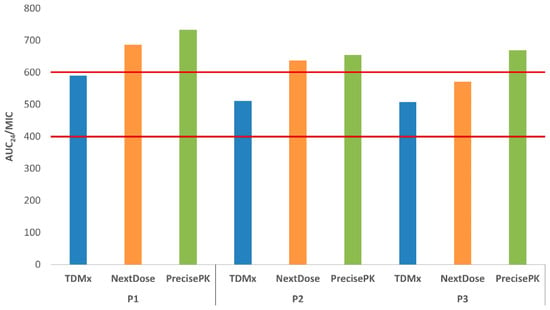
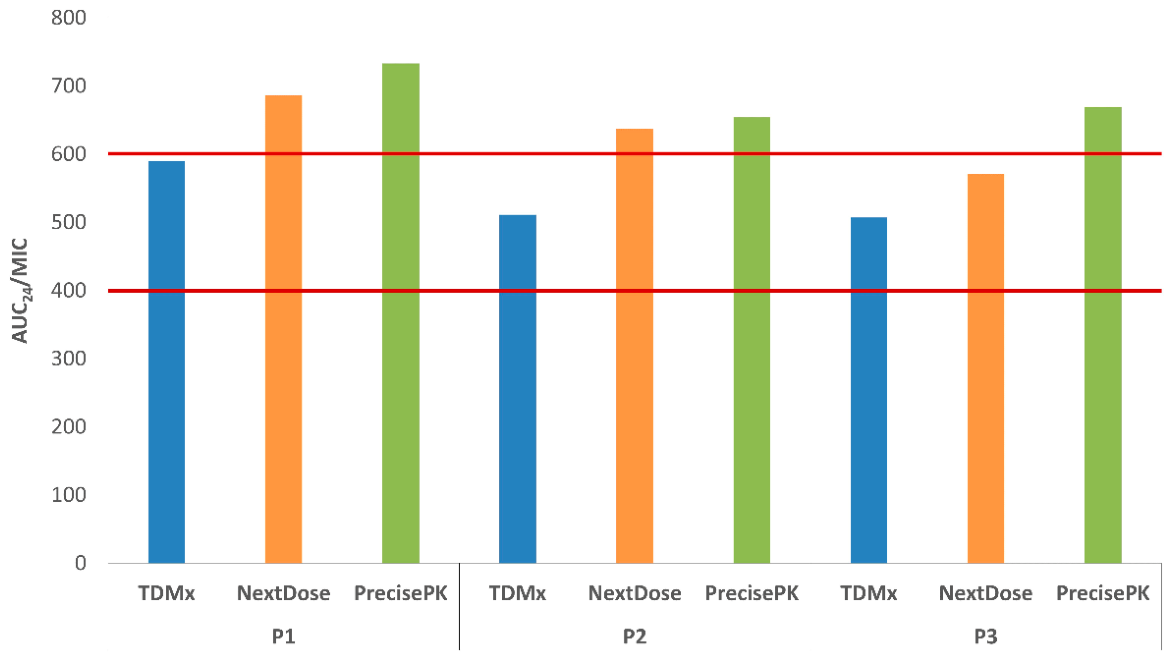
The second trough concentrations measured with the UHPLC-UV method after VCN dose adjustment were 26.1, 23.1, and 18.3 µg/mL for patients 1, 2, and 3, respectively. The popPK models from TDMx and PrecisePK predicted these concentrations with maximum relative errors of 10.3 and 19.5%, respectively, both for patient 1 (Table 8). Trough concentration prediction was not possible with NextDose. The individual AUC24/MIC values estimated after dose adjustment, incorporating the second measured trough concentrations, were variable around the target window of 400–600. Once again, TDMx estimated the lowest values, being the only software with AUC24/MIC below 600 for all patients, while PrecisePK estimated the highest, exceeding the upper limit in all patients. In turn, NextDose also estimated AUC24/MIC values above the target window for patients 1 and 2 (Table 7, Figure 4).
Table 8.
Post-adjustment trough concentrations predicted using a Bayesian approach with the population pharmacokinetic models from TDMx and PrecisePK for patients P1, P2, and P3.
Figure 4.
AUC24/MIC estimated after vancomycin dose adjustment incorporating the second trough concentrations measured with the UHPLC-UV method. Estimated values were obtained using a Bayesian approach with the population pharmacokinetic models from NextDose (blue bars), TDMx (orange bars), and PrecisePK (green bars). Horizontal red lines indicate the target window of 400–600. AUC24/MIC: area under the concentration-time curve over 24 h related to the minimum inhibitory concentration. MIC = assumed to be 1 µg/mL.
4. Discussion
A UHPLC-UV method for VCN plasma quantification was developed with the intention of clinical use; therefore, a simple and time-efficient procedure was pursued and achieved, with sample processing times of less than one hour using a one-step protein precipitation for sample preparation. Furthermore, only 100 µL of plasma was required, which is relevant for implementing this method for TDM in special populations such as neonates and elderly patients, in whom sample collection may be limited in volume [22], thereby broadening its potential scope of application.
During method development, two analytical challenges were identified and successfully addressed. Baseline instability was resolved by acidifying the extraction solvent, which resulted in consistent and reproducible chromatographic performance throughout the analytical runs. Additionally, carry-over, observed predominantly for VCN, was eliminated through modification of the injector washing protocol. These adjustments are particularly relevant in TDM practice, where high- and low-concentration samples are frequently analyzed within the same batch. Although several diluent injections were included across the runs during validation as a conservative monitoring practice, the consistent absence of carry-over suggests that this frequency may be reduced in routine practice, for instance, limiting them to after the highest concentration of standards and controls, to improve analytical throughput for routine TDM workloads.
Method selectivity against endogenous matrix components was demonstrated at the selected λ (214 nm). Although a low UV λ may be considered nonspecific in spectrophotometric methods, the chromatographic separation mitigates the risk of interferences; in fact, λ values even below 214 nm have been successfully used in HPLC-UV methods for plasma VCN quantification [13,16,17]. However, the evaluation of potential interference from lipemic samples, as well as from co-administered drugs, should be addressed as part of the clinical implementation of the method.
Caffeine was selected as a practical, cost-effective IS given its availability as an analytical-grade reagent, its aqueous solubility compatible with the sample diluent, and its recovery comparable to that of VCN under the sample processing method applied. Furthermore, caffeine has been reported as an IS in other TDM HPLC methods, including for glycopeptides [16,23]. Other published methods for plasma VCN quantification have employed non-structural analogues as IS, such as zidovudine [18], cefotaxime [14], and acetaminophen [15], with satisfactory accuracy and precision, as observed in the present work. During method development, acetaminophen was also tested experimentally as an alternative internal standard but was discarded due to a retention time too close to that of VCN, which compromised chromatographic separation.
It has been reported that a moderate dietary intake of caffeine, corresponding to one to three cups of coffee, could produce Cmax around 0.25–6 µg/mL [24]. Such endogenous caffeine could contribute to the IS signal, representing a potential limitation of this method. Therefore, when used routinely for VCN TDM, caffeine-containing beverages should not be administered to patients during the sampling period, and verification of caffeine intake by patients should remain a mandatory pre-analytical step, as already performed in the present preliminary application.
The established quantification range of 0.5–100 µg/mL is expected to cover the vast majority of VCN concentrations encountered in clinical TDM practice, minimizing the need for sample dilution. However, dilution integrity was demonstrated at a concentration of 150 µg/mL. Any occasional sample with a concentration above this level will require validation of an appropriate dilution factor before being measured.
Regarding stability, the present method evaluated analyte integrity in extracted samples in the autosampler at 25 °C for 24 h, directly simulating a full working day in a clinical laboratory setting. Additionally, stability was assessed under storage in a styrofoam box with ice packs for 12 h, simulating conditions without freezer storage, such as prolonged cold-chain transport from the hospital to the analytical laboratory. This is particularly relevant in low- and middle-income countries, where sample collection and analysis may not occur at the same site, and where maintaining ideal storage conditions throughout the process can be challenging. In routine laboratory practice, samples are expected to be aliquoted to the required volume and kept frozen until immediate processing. However, if samples remain without temperature control for longer than the validated thaw time (30 min), a dedicated assessment will be necessary to confirm the absence of analyte loss under such conditions.
Compared to other HPLC-UV and UHPLC-UV methods developed for the same purpose, the present method offers advantages in terms of plasma volume requirements [13,14,15,16], simplicity of the extraction procedure [13,14,18], the absence of corrosive reagents such as perchloric acid [13,15,16,17], and a wider clinically relevant quantification range [13,14,15,16,17,18]. Together, these features represent incremental, practical improvements that support the routine implementation of the method for TDM.
The integration of a Bayesian dosing approach for the clinical application represents an additional distinguishing feature of this work. A recent systematic review of real-world implementation of MIPD worldwide identified only one prior Colombian study, which focused on the retrospective validation of VCN popPK models in predicting trough concentrations [25,26]. To the authors’ knowledge, the present work constitutes the first exploration in Colombia of Bayesian forecasting to estimate AUC24/MIC in a real clinical scenario, using an independently validated analytical method.
The application of the method in a real clinical scenario supports the pertinence of implementing TDM of VCN as a routine practice in Colombian health institutions that use the drug. The three patients whose AUC24/MIC was estimated from VCN plasma concentrations showed values outside the target window of 400 to 600 [2], whether data obtained with the UHPLC-UV method developed here or with the immunoassay were used, and regardless of the Bayesian software platform applied.
When comparing measured trough concentrations, the UHPLC-UV method yielded lower values than the immunoassay. This pattern is consistent with the known positive bias of immunoassay methods for VCN, which has been attributed to cross-reactivity with its degradation products [12,13]. The discrepancy of up to 14.1% observed in the present study falls within the inter-method variability previously reported for VCN plasma measurements. Using HPLC as reference, Usman and Hempel reported 95% limits of agreement of −33.4% to +34.6% against immunoassay in 289 paired samples [13]. Variability has also been documented among commercial immunoassay platforms themselves, with relative percentage differences of −14.75% to +13.34% across 75 laboratories [27]. Another factor that could also have contributed to the lower UHPLC-UV values observed is the unreported intake of caffeine. Nonetheless, the small sample size in this preliminary study does not allow a formal quantification of the systematic bias between methods in this specific population.
In terms of AUC24/MIC—the parameter currently recommended for VCN TDM rather than trough concentration alone [2]—the values estimated from the two analytical sources (laboratory and hospital) were reasonably close (maximum difference 9.2%). Importantly, despite this difference, both analytical sources led to the same clinical conclusion in all three patients, with AUC24/MIC values outside the target window of 400–600, providing an early indication of the clinical relevance of this method.
One critical aspect of MIPD of VCN is the fit of the popPK model. Bayesian dose calculators include several models that do not necessarily perform well across all populations [28,29,30]. In this preliminary application, model selection was first made by visual inspection of the concentration-time curves from the population against the individual curve. As a further evaluation of model fit, a second trough concentration was predicted with each selected popPK model and compared with the concentration observed by the UHPLC-UV method, showing that the relative prediction errors were lower with the TDMx popPK models. This observation is exploratory given the limited number of patients; nonetheless, it provides an initial basis for prioritizing TDMx in future studies with larger cohorts in this Colombian health institution.
The second trough concentration corresponded to the dose adjustment performed by the hospital according to its standard protocols, without laboratory intervention. Of note, only the AUC24/MIC values newly estimated with TDMx fell within the target range for the three patients, although one was close to the upper limit. Clinical follow-up of patient outcomes remains necessary to draw conclusions about VCN dosing optimization.
Taking into account that the lack of technology for measuring antibiotic levels has been identified as the main barrier to implementing VCN TDM in Colombia [8], the UHPLC-UV method developed here constitutes a viable candidate to help address this need. Even where immunoassay capacity already exists, an orthogonal method may prove valuable for resolving discrepant results, as cross-reactivity has occasionally caused severe quantification errors with clinical consequences [31]. Broader studies across larger and more diverse patient populations would further strengthen the evidence base for the adoption of the method.
5. Conclusions
A UHPLC-UV method for VCN quantification in human plasma was successfully developed, and its analytical performance was validated according to ICH M10 guidelines [19], showing adequate accuracy and precision under laboratory conditions. Its preliminary application to plasma samples from hospitalized patients, combined with Bayesian dosing software platforms, suggested the suitability of the method for TDM of VCN in a real clinical setting, supporting the pertinence of implementing MIPD of VCN based on AUC24/MIC as a routine practice in Colombian health institutions. Further studies with larger and more diverse patient cohorts are warranted to broaden the evidence base for its adoption under real operational conditions.
Supplementary Materials
The following supporting information can be downloaded at: https://www.mdpi.com/article/10.3390/scipharm94030081/s1, Figure S1: Carry-over. The purple chromatogram shows the positive carry-over observed in blank plasma after injection of a ULOQ sample, before implementation of corrective measures in the autosampler syringe/needle washing protocol. The green chromatogram represents a typical blank injection after a ULOQ sample, once carry-over was resolved with the adjusted washing protocol, consisting of a washing solution of water:methanol (33:67, v/v) with 0.3% formic acid, applied for a washing time of 10 s.
Author Contributions
Conceptualization, G.P.D.M. and Y.P.G.; methodology, G.P.D.M. and Y.P.G.; validation, J.P.S.; formal analysis, J.P.S.; investigation, J.P.S., E.E.T.J. and D.d.l.H.S.; resources, G.P.D.M., Y.P.G., D.d.l.H.S., E.E.T.J. and O.H.G.; data curation, J.P.S.; writing—original draft preparation, J.P.S.; writing—review and editing, G.P.D.M.; visualization, J.P.S. and G.P.D.M.; supervision, G.P.D.M.; project administration, G.P.D.M. and O.H.G.; funding acquisition, G.P.D.M. and O.H.G. All authors have read and agreed to the published version of the manuscript.
Funding
This research and the APC were funded by Universidad del Atlántico, grant number QYF679-CII2023.
Institutional Review Board Statement
The study was conducted in accordance with the Declaration of Helsinki and approved by the Research Ethics Committee of the Health Sciences Division of Universidad del Norte (protocol code 2504-8268, Act 335, 24 April 2025).
Informed Consent Statement
Informed consent was obtained from all subjects involved in the study.
Data Availability Statement
Public data supporting reported results can be found in the repository of Universidad del Atlántico: https://repositorio.uniatlantico.edu.co/communities/305f56c3-03a2-4dcf-9a32-bdc288446e1b/search (accessed on 15 September 2026). More information is available to interested researchers upon request from the corresponding author.
Acknowledgments
The authors wish to thank PrecisePK for providing access to the software. Special thanks to Paulo Cáceres Guido for his technical support during the analysis of clinical data. During the preparation of this manuscript, the authors used Claude (Anthropic, San Francisco, CA, USA, claude.ai, Sonnet 5.0) for the purposes of English language editing, grammar revision, and manuscript formatting. ConceptViz AI was used to generate the graphical abstract.
Conflicts of Interest
The authors declare no conflicts of interest. The funders had no role in the design of the study; in the collection, analyses, or interpretation of data; in the writing of the manuscript; or in the decision to publish the results.
Abbreviations
The following abbreviations are used in this manuscript:
| %E | Relative error |
| ASHP/IDSA/PIDS/SIDP | American Society of Health-System Pharmacists/Infectious Diseases Society of America/Pediatric Infectious Diseases Society/Society of Infectious Diseases Pharmacists |
| AUC24/MIC | Area under the concentration-time curve over 24 h to minimum inhibitory concentration ratio |
| Cmax | Maximum plasma concentration |
| CV | Coefficient of variation |
| EDTA | Ethylenediaminetetraacetic acid |
| EMIT | Enzyme-multiplied immunoassay technique |
| FPIA | Fluorescence polarization immunoassay |
| HPLC-UV | High-performance liquid chromatography with ultraviolet detection |
| HQC | High quality control |
| HUN | Fundación Hospital Universidad del Norte |
| ICH M10 | ICH Guideline M10 on Bioanalytical Method Validation |
| IS | Internal standard |
| LC-MS/MS | Liquid chromatography tandem mass spectrometry |
| LLOQ | Lower limit of quantification |
| LQC | Low quality control |
| MIC | Minimum inhibitory concentration |
| MIPD | Model-informed precision dosing |
| MQC | Medium quality control |
| MRSA | Methicillin-resistant Staphylococcus aureus |
| popPK | Population pharmacokinetic |
| QC | Quality control |
| RIA | Radioimmunoassay |
| SST | System suitability test |
| TDM | Therapeutic drug monitoring |
| UHPLC | Ultra-high-performance liquid chromatography |
| ULOQ | Upper limit of quantification |
| VCN | Vancomycin |
References
- Levine, D.P. Vancomycin: A History. Clin. Infect. Dis. 2006, 42, S5–S12. [Google Scholar] [CrossRef] [Scilit] [PubMed]
- Rybak, M.J.; Le, J.; Lodise, T.P.; Levine, D.P.; Bradley, J.S.; Liu, C.; Mueller, B.A.; Pai, M.P.; Wong-Beringer, A.; Rotschafer, J.C.; et al. Therapeutic Monitoring of Vancomycin for Serious Methicillin-Resistant Staphylococcus aureus Infections: A Revised Consensus Guideline and Review by the American Society of Health-System Pharmacists, the Infectious Diseases Society of America, the Pediatric Infectious Diseases Society, and the Society of Infectious Diseases Pharmacists. Am. J. Health-Syst. Pharm. 2020, 77, 835–864. [Google Scholar] [CrossRef] [Scilit] [PubMed]
- Aljutayli, A.; Marsot, A.; Nekka, F. An Update on Population Pharmacokinetic Analyses of Vancomycin, Part I: In Adults. Clin. Pharmacokinet. 2020, 59, 671–698. [Google Scholar] [CrossRef] [Scilit] [PubMed]
- Rybak, L.P.; Ramkumar, V.; Mukherjea, D. Ototoxicity of Non-Aminoglycoside Antibiotics. Front. Neurol. 2021, 12, 652674. [Google Scholar] [CrossRef] [Scilit] [PubMed]
- Filippone, E.; Kraft, W.; Farber, J. The Nephrotoxicity of Vancomycin. Clin. Pharmacol. Ther. 2017, 102, 459–469. [Google Scholar] [CrossRef] [Scilit] [PubMed]
- Wicha, S.G.; Märtson, A.-G.; Nielsen, E.I.; Koch, B.C.P.; Friberg, L.E.; Alffenaar, J.-W.; Minichmayr, I.K. From Therapeutic Drug Monitoring to Model-Informed Precision Dosing for Antibiotics. Clin. Pharmacol. Ther. 2021, 109, 928–941. [Google Scholar] [CrossRef] [Scilit] [PubMed]
- Turner, R.B.; Kojiro, K.; Shephard, E.A.; Won, R.; Chang, E.; Chan, D.; Elbarbry, F. Review and Validation of Bayesian Dose-Optimizing Software for Vancomycin AUC Calculation in Critically Ill Patients. Pharmacotherapy 2018, 38, 1174–1183. [Google Scholar] [CrossRef] [Scilit] [PubMed]
- Fuentes, Y.V.; Blanco, J.; Díaz-Quijano, D.M.; Lechtig-Wasserman, S.; Liebisch-Rey, H.; Díaz-Pinilla, N.; Vergara-Ramirez, P.; Bustos, R.H. Administration and TDM of β-Lactams and Vancomycin in Critical Care Units in Colombia: The ANTIBIOCOL Study. Pharmaceutics 2021, 13, 1577. [Google Scholar] [CrossRef] [Scilit] [PubMed]
- Departamento Administrativo Nacional de Estadística (DANE). Producto Interno Bruto por Departamento 2023 [Gross Domestic Product by Department 2023]; DANE: Bogotá, Colombia, 2025. Available online: https://www.dane.gov.co/files/operaciones/PIB/bol-PIBDep-2023p.pdf (accessed on 28 May 2026).
- Domínguez Moré, G.; Fruto Algarín, C.; Jiménez Rivera, R.; Torres Saumeth, K. Diagnóstico de las Condiciones Técnico-Científicas de los Servicios de MTF en el Departamento del Atlántico [Diagnosis of the Technical-Scientific Conditions of TDM Services in the Atlántico Department]. Pharm. Care Esp. 2015, 17, 696–697. [Google Scholar]
- Instituto Nacional de Salud (Colombia). Boletín Epidemiológico Semanal (BES), Semana Epidemiológica 06 de 2025 [Weekly Epidemiological Bulletin (BES), Epidemiological Week 06 of 2025]; Instituto Nacional de Salud: Bogotá, Colombia, 2025; pp. 1–43. [CrossRef] [Scilit]
- Cheng, X.; Ma, J.; Su, J. An Overview of Analytical Methodologies for Determination of Vancomycin in Human Plasma. Molecules 2022, 27, 7319. [Google Scholar] [CrossRef] [Scilit] [PubMed]
- Usman, M.; Hempel, G. Development and Validation of an HPLC Method for the Determination of Vancomycin in Human Plasma and Its Comparison with an Immunoassay (PETINIA). SpringerPlus 2016, 5, 124. [Google Scholar] [CrossRef] [Scilit] [PubMed]
- Milla, P.; Ferrari, F.; Muntoni, E.; Sartori, M.; Ronco, C.; Arpicco, S. Validation of a Simple and Economic HPLC-UV Method for the Simultaneous Determination of Vancomycin, Meropenem, Piperacillin and Tazobactam in Plasma Samples. J. Chromatogr. B 2020, 1148, 122151. [Google Scholar] [CrossRef] [Scilit] [PubMed]
- Ghasemiyeh, P.; Vazin, A.; Zand, F.; Azadi, A.; Karimzadeh, I.; Mohammadi-Samani, S. A Simple and Validated HPLC Method for Vancomycin Assay in Plasma Samples: The Necessity of TDM Center Development in Southern Iran. Res. Pharm. Sci. 2020, 15, 529–540. [Google Scholar] [CrossRef] [Scilit] [PubMed]
- Aboelezz, A.; Tesfamariam, N.S.; Kharouba, M.; Gligoric, T.; Mahmoud, S.H. The Development and Validation of a Simple HPLC-UV Method for the Determination of Vancomycin Concentration in Human Plasma and Application in Critically Ill Patients. Molecules 2025, 30, 1062. [Google Scholar] [CrossRef] [Scilit] [PubMed]
- Fang, F.; Li, N.; Xu, C.; Tan, R.; Yang, J.; Zheng, Z. An UHPLC-UV Method for the Determination of Vancomycin in Human Serum. Curr. Pharm. Anal. 2021, 17, 847–852. [Google Scholar] [CrossRef] [Scilit]
- Lima, T.M.; Seba, K.S.; Gonçalves, J.C.S.; Cardoso, F.L.L.; Estrela, R.C.E. A Rapid and Simple HPLC Method for Therapeutic Monitoring of Vancomycin. J. Chromatogr. Sci. 2018, 56, 115–121. [Google Scholar] [CrossRef] [Scilit] [PubMed]
- ICH. Bioanalytical Method Validation and Study Sample Analysis M10; ICH: Geneva, Switzerland, 2022; Available online: https://database.ich.org/sites/default/files/M10_Guideline_Step4_2022_0524.pdf (accessed on 28 May 2026).
- Ministerio de Salud. Resolución 901 de 1996. Por la cual se Adopta el Manual de Normas Técnicas, Administrativas y de Procedimientos para Bancos de Sangre [Resolution Number 901 of 1996, Adopting the Manual of Technical, Administrative, and Procedural Standards for Blood Banks]; Ministerio de Salud: Bogotá, Colombia, 1996. Available online: https://normograma.invima.gov.co/compilacion/docs/resolucion_minsalud_r0901_96.html (accessed on 14 September 2026).
- Ramadon, D.; Courtenay, A.J.; Permana, A.D.; Tekko, I.A.; McAlister, E.; McCrudden, M.T.; McCarthy, H.O.; Donnelly, R.F. A Sensitive HPLC-UV Method for Quantifying Vancomycin in Biological Matrices. J. Pharm. Biomed. Anal. 2020, 189, 113429. [Google Scholar] [CrossRef] [Scilit] [PubMed]
- Coggins, S.A.; Wade, K.C.; Downes, K.J. Advances in Pediatric Therapeutic Drug Monitoring. Pediatrics 2026, 157, e2025073013. [Google Scholar] [CrossRef] [Scilit] [PubMed]
- Chiriac, U.; Rau, H.; Frey, O.R.; Röhr, A.C.; Klein, S.; Meyer, A.L.; Morath, B. Validation and Application of an HPLC-UV Method for Routine Therapeutic Drug Monitoring of Dalbavancin. Antibiotics 2022, 11, 541. [Google Scholar] [CrossRef] [Scilit] [PubMed]
- Song, X.; Singh, M.; Lee, K.E.; Vinayagam, R.; Kang, S.G. Caffeine: A Multifunctional Efficacious Molecule with Diverse Health Implications and Emerging Delivery Systems. Int. J. Mol. Sci. 2024, 25, 12003. [Google Scholar] [CrossRef] [Scilit] [PubMed]
- Aisyah, N.D.; Nugroho, A.K.; Andayani, T.M. Population Pharmacokinetic-Based Model-Informed Precision Dosing: Current Implementation Status and Global Equity Gaps—A Structured Narrative Review. J. Farm. Ilmu Kefarmasian Indones. 2026, 13, 31–50. [Google Scholar] [CrossRef] [Scilit]
- Mena, M.; Garcia, J.-C.; Bustos, R.-H. Implementing Vancomycin Population Pharmacokinetic Models: An App for Individualized Antibiotic Therapy in Critically Ill Patients. Antibiotics 2023, 12, 301. [Google Scholar] [CrossRef] [Scilit] [PubMed]
- Chen, C.Y.; Li, M.Y.; Ma, L.Y.; Zhai, X.Y.; Luo, D.H.; Zhou, Y.; Liu, Z.M.; Cui, Y.M. Precision and Accuracy of Commercial Assays for Vancomycin Therapeutic Drug Monitoring: Evaluation Based on External Quality Assessment Scheme. J. Antimicrob. Chemother. 2020, 75, 2110–2119. [Google Scholar] [CrossRef] [Scilit] [PubMed]
- Broeker, A.; Nardecchia, M.; Klinker, K.P.; Derendorf, H.; Day, R.O.; Marriott, D.J.; Carland, J.E.; Stocker, S.L.; Wicha, S.G. Towards Precision Dosing of Vancomycin: A Systematic Evaluation of Pharmacometric Models for Bayesian Forecasting. Clin. Microbiol. Infect. 2019, 25, 1286.e1–1286.e7. [Google Scholar] [CrossRef] [Scilit] [PubMed]
- Chung, E.; Tabbara, N.; Seto, W.; Shah, V. Vancomycin Therapeutic Drug Monitoring, Clinical Outcomes and Population Pharmacokinetic Model Evaluation in Neonates. Children 2026, 13, 649. [Google Scholar] [CrossRef] [Scilit] [PubMed]
- Quereilhac, M.I.; Taboada, G.F.; Caceres Guido, P. Herramientas Informáticas Gratuitas y Online para Dosificación de Precisión de Vancomicina, y Otros Fármacos [Free Online Software Tools for Precision Dosing of Vancomycin, and Other Drugs]. Rev. Fac. Cien. Med. Univ. Nac. Cordoba 2025, 82, 633–655. [Google Scholar] [CrossRef] [Scilit] [PubMed]
- Galán-Caballero, L.; Salas-Butrón, M.R.; Lozano-Martín, D.; Díaz-Rengifo, I.A.; Ortega-Madueño, I.; Diaz-Garcia, L.; Terleira-Fernández, A.I. Unexpected Falsely High Vancomycin Concentrations in a Patient with Endocarditis During Routine Therapeutic Drug Monitoring. Eur. J. Case Rep. Intern. Med. 2025, 12, 005464. [Google Scholar] [CrossRef] [Scilit] [PubMed]

Disclaimer/Publisher’s Note: The statements, opinions and data contained in all publications are solely those of the individual author(s) and contributor(s) and not of MDPI and/or the editor(s). MDPI and/or the editor(s) disclaim responsibility for any injury to people or property resulting from any ideas, methods, instructions or products referred to in the content. |
© 2026 by the authors. Published by MDPI on behalf of the Österreichische Pharmazeutische Gesellschaft. Licensee MDPI, Basel, Switzerland. This article is an open access article distributed under the terms and conditions of the Creative Commons Attribution (CC BY) license.