


Abstract
Parkinson’s disease (PD) is a progressive neurodegenerative disorder for which dopamine transporter single-photon emission computed tomography (DaT-SPECT) is widely used to support clinical diagnosis. Recent convolutional neural network (CNN)-based studies have reported high classification accuracy on DaT-SPECT datasets. However, the relative contributions of network architecture and training protocol design to these results remain insufficiently explored, particularly for small and moderately sized medical imaging datasets. In this study, a training-oriented evaluation of CNNs for PD classification is conducted using two DaT-SPECT datasets derived from the Parkinson’s Progression Markers Initiative (PPMI). First, a previously published experimental setup is faithfully reproduced on a curated dataset of 645 DaT-SPECT images using identical preprocessing procedures, data splits, and model architectures. Under the reproduced experimental setting, previously reported classification accuracies for individual CNN architectures ranged from 93.02% to 95.34%, while an ensemble approach achieved 98.45% accuracy. The same architectures are then evaluated using a unified training protocol incorporating standardized optimization and regularization strategies. Using this protocol, ResNet50 achieves 100% classification accuracy, with all evaluation metrics reaching 1.0, while VGG16, Inception V3, and Xception each achieve an accuracy of 99.22%. On a larger, independently constructed PPMI-derived dataset with higher spatial resolution, previously reported classification accuracies ranged from 93.27% for PD vs. SWEDD to 95.33% for PD vs. control. Using the proposed unified training protocol, the evaluated CNN architectures achieve classification accuracies of 98% for PD vs. SWEDD and 100% for PD vs. control. These results indicate that training protocol design has a stronger influence on DaT-SPECT-based PD classification performance than the specific choice of CNN architecture.
1. Introduction
Parkinson’s disease (PD) is a chronic and progressive neurodegenerative disorder that affects motor and non-motor systems, primarily due to the loss of dopaminergic neurons in the substantia nigra [1]. Clinically, PD diagnosis relies on a combination of neurological evaluations and imaging biomarkers, with dopamine transporter single-photon emission computed tomography (DaT-SPECT) using 123I-ioflupane playing a pivotal role in differentiating PD and Parkinson syndrome from other non-neurodegenerative movement disorders [2]. DaT-SPECT provides functional images reflecting striatal dopamine transporter availability, which typically decreases in PD compared to healthy controls.
In recent years, advances in deep learning have significantly influenced medical image analysis, including automated classification of DaT-SPECT images. Convolutional neural networks (CNNs) have been widely applied to this task due to their ability to learn discriminative spatial features directly from pixel intensities, obviating the need for handcrafted feature design. Several studies report high classification performance on DaT-SPECT datasets using CNN architectures such as VGG, ResNet, Inception, and their variants. One approach that has gained attention is ensemble learning, where predictions from multiple CNNs are combined to achieve improved accuracy [3]. While ensembles often yield competitive results, they incur additional computational complexity and may obscure the contribution of individual network properties.
Despite these promising results, the relative impact of training protocols (including data preprocessing, regularization, learning rate scheduling, and calibration analysis) versus architectural choice remains under-explored. Prior work has focused predominantly on network design and fusion strategies, often without thoroughly examining how training dynamics and data handling influence model generalization and reliability. Such oversight is critical, as small and moderately sized medical imaging datasets are susceptible to overfitting and poor probability calibration if training protocols are not carefully controlled.
The present study addresses this gap by systematically comparing multiple standard CNN architectures under consistent training protocols on DaT-SPECT datasets derived from the Parkinson’s Progression Markers Initiative (PPMI) [4]. We first reproduce baseline results reported in the literature using identical settings. We then introduce a unified training pipeline incorporating anatomically informed preprocessing, optimizer regularization, and adaptive learning schedules. In addition to classification accuracy, we evaluate calibration, confusion metrics, ROC characteristics, confidence distributions, Grad-CAM interpretability, and latent representation structure. Our aim is to assess whether training design plays a more significant role than architecture in achieving robust PD classification performance. Across two PPMI-derived datasets and four standard CNN backbones, we observe that protocol-level choices, particularly anatomically constrained preprocessing, regularization, and learning rate scheduling, account for most of the gains often attributed to architecture design or ensemble learning.
2. Related Works
Dopamine transporter single-photon emission computed tomography (DaT-SPECT) is widely used in the diagnostic evaluation of Parkinson’s disease (PD), as it provides an objective imaging marker of nigrostriatal dopaminergic degeneration. Reduced radiotracer uptake in the striatum, particularly in the putamen and caudate nucleus, is considered one of the most clinically established signatures of PD. This has motivated extensive research on automated PD classification using machine learning and deep learning methods applied to DaT-SPECT imaging, as summarized in Table 1.
Table 1.
Overview of machine learning and deep learning approaches for PD classification using DaT-SPECT imaging.
Earlier studies often relied on quantitative striatal uptake descriptors and engineered imaging features combined with conventional machine learning classifiers. Prashanth et al. reported 96.14% accuracy using an SVM classifier based on striatal binding ratio features, achieving 95.74% sensitivity and 77.35% specificity [5]. Brahim et al. proposed an SVM-based computer-aided diagnosis pipeline for 123I-FP-CIT imaging and reported 92.6% accuracy with 91.2% sensitivity and 93.1% specificity [6]. Challa et al. demonstrated that boosted logistic regression can achieve 97.159% accuracy on DaT-SPECT data derived from the PPMI database [7]. Castillo-Barnes et al. explored robust classification strategies for 123I-ioflupane SPECT and reported 96.0% accuracy using a linear SVM-based framework [8]. These works illustrate that competitive PD classification can be achieved when the input representation captures diagnostically meaningful striatal uptake patterns.
Deep learning approaches have become the dominant direction in DaT-SPECT classification due to their ability to learn hierarchical feature representations directly from imaging data. Martinez-Murcia et al. proposed a 3D convolutional neural network model and reported 95.50% accuracy on a PPMI-derived DaT-SPECT cohort [9]. In a related evaluation incorporating SWEDD subjects, Martinez-Murcia et al. reported 95.5 ± 0.44% accuracy with sensitivity 96.2 ± 0.051%. Wenzel et al. investigated robustness to variations in imaging characteristics and reported 97.20% accuracy using deep CNN models trained under heterogeneous acquisition conditions [10].
Several studies have explored alternative feature representations and architecture-level modifications. Ortiz et al. proposed an isosurface-based representation designed to emphasize the geometric properties of striatal uptake patterns and evaluated it using CNN-based classification [11]. In a related experimental setting, conventional CNN architectures such as AlexNet and LeNet were applied to DaT-SPECT images, achieving approximately 95.0 ± 0.3% accuracy for Parkinson’s disease versus control classification. These results indicate that strong classification performance is not necessarily tied to highly complex architectures, and that preprocessing and image representation can play a central role.
Choi et al. proposed PDNet and evaluated it on a PPMI DaT-SPECT cohort (431 PD, 193 healthy controls, and 77 SWEDD), reporting 96% accuracy [12]. The same model was also tested on an external private dataset (72 PD and 10 healthy controls), achieving 98.8% accuracy. Kim et al. evaluated an Inception-V3 transfer learning pipeline and reported 96.3% sensitivity on a cohort of 54 PD and 54 healthy control subjects [13]. Keles et al. introduced PARNet, a model derived from a CNN architecture originally developed for COVID-19 diagnosis and retrained for PD classification using DaT-SPECT images. PARNet achieved 95.43% accuracy, 95.25% sensitivity, 95.70% specificity, 97% precision, and 96% F1-score on a dataset of 1213 images (1000 PD and 213 healthy controls) [14]. This work demonstrated that networks trained in one medical imaging domain can be repurposed to achieve competitive performance in DaT-SPECT-based PD classification. Kurmi et al. evaluated VGG16, ResNet50, Inception-V3, and Xception models and proposed a fuzzy fusion ensemble strategy. Their ensemble achieved 98.45% accuracy with precision 98.84%, sensitivity 98.84%, specificity 97.67%, and F1-score 98.84% on a PPMI-derived DaT-SPECT dataset [4]. This study remains one of the most frequently cited ensemble-based baselines for PD classification using DaT-SPECT imaging. Thakur et al. proposed a soft-attention DenseNet approach and reported 99.2% accuracy with AUROC 99%, sensitivity 99.2%, specificity 99.4%, and F1-score 99.1% [15]. Their model incorporated attention maps and feature visualization, highlighting the putamen and caudate as key discriminative regions. Chien et al. proposed an artificial neural network approach focusing on putamen-centered discrimination and reported 99.22% accuracy with sensitivity 81.8% [16]. Multimodal strategies have also been investigated. Kollia et al. proposed a CNN–RNN framework combining MRI and DaT-SPECT information and reported 98.0% accuracy on a dataset of 55 PD and 23 healthy controls [17].
Most prior work has been framed around identifying superior architectures, introducing attention modules, or improving classification performance through ensemble fusion of heterogeneous models [4]. The present study follows a different direction. Instead of proposing a new backbone or designing a fusion rule, the primary objective is to evaluate whether systematic improvements in the training protocol, including preprocessing design, augmentation strategy, regularization, learning-rate scheduling, and reliability-oriented evaluation, can consistently outperform architecture-driven gains. Using the same set of commonly adopted CNN backbones reported in the ensemble baseline study [4,14], this work demonstrates that a carefully optimized training pipeline can surpass the ensemble-level benchmark while retaining the simplicity of single-model inference and enabling deeper reliability analysis through calibration metrics and interpretability-driven visualization. Latest advances have explored hybrid architectures that combine CNN-based feature extraction with graph neural networks to model relationships between samples and improve cross-domain generalization. For example, spatial-channel collaborative multi-scale graph interaction deep transfer learning introduces joint spatial-channel feature refinement and multi-scale graph interaction mechanisms, enabling improved feature representation and transferability across domains [18].
3. Materials and Methods
3.1. Study Design and Experimental Overview
The objective of this study is to determine whether classification performance in DaT-SPECT-based Parkinson’s disease detection is primarily influenced by neural network architecture or by the structure of the training protocol. Previous studies report strong results using ensemble architectures. However, the contribution of training dynamics, preprocessing consistency, and regularization is often not systematically analyzed. To isolate the effect of the training pipeline from architectural design, three experimental conditions were applied to the same set of backbone architectures.
Four convolutional neural networks were evaluated: VGG16 [19], ResNet50 [20], InceptionV3 [21], and Xception [22]. The following experimental settings were defined:
- Baseline reproduction protocol, replicating the configuration reported in the original ensemble study. All models were trained for 500 epochs with batch size 16, learning rate 0.001, and Adam optimizer [23];
- Optimized protocol with transfer learning, incorporating anatomically constrained preprocessing, controlled augmentation, weight decay regularization, ImageNet initialization, and cosine annealing with warm restarts [24];
- Optimized protocol without transfer learning, identical to condition (2) but trained from random initialization.
This design enables direct comparison between baseline training, structured optimization with pretrained initialization, and structured optimization without pretrained initialization. All splits were performed at the subject/scan level to prevent information leakage between training and test sets. No slices or derived images from the same subject were shared across. To fully replicate the results of prior studies, all preprocessing operations were applied independently to the training and test sets. No global normalization statistics or dataset-wide transformations were computed across splits. The final model was selected based on its performance on the test set, in order to closely match the reported outcomes of previous work. While this approach may lead to slightly optimistic estimates of generalization, it ensures that the replication accurately reflects the original experimental setup. This protocol also guarantees that preprocessing itself did not introduce direct data leakage.
3.2. Dataset
3.2.1. PPMI DaT-SPECT Dataset (Small)
The first dataset used in this study was obtained from the Parkinson’s Progression Markers Initiative (PPMI) database [25]. It contains 645 DaT-SPECT images and was originally curated and preprocessed by Kurmi et al. The distribution of samples across classes and experimental splits is summarized in Table 2.
Table 2.
Class distribution and train–test split for each binary classification task in the PPMI-PD (Small) dataset.
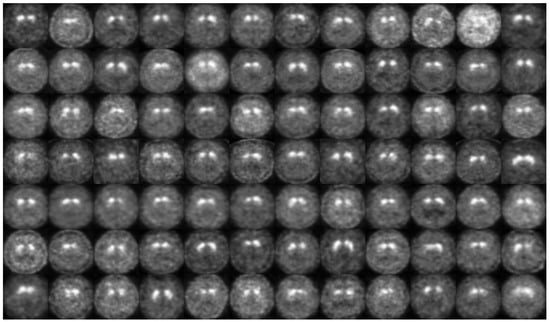
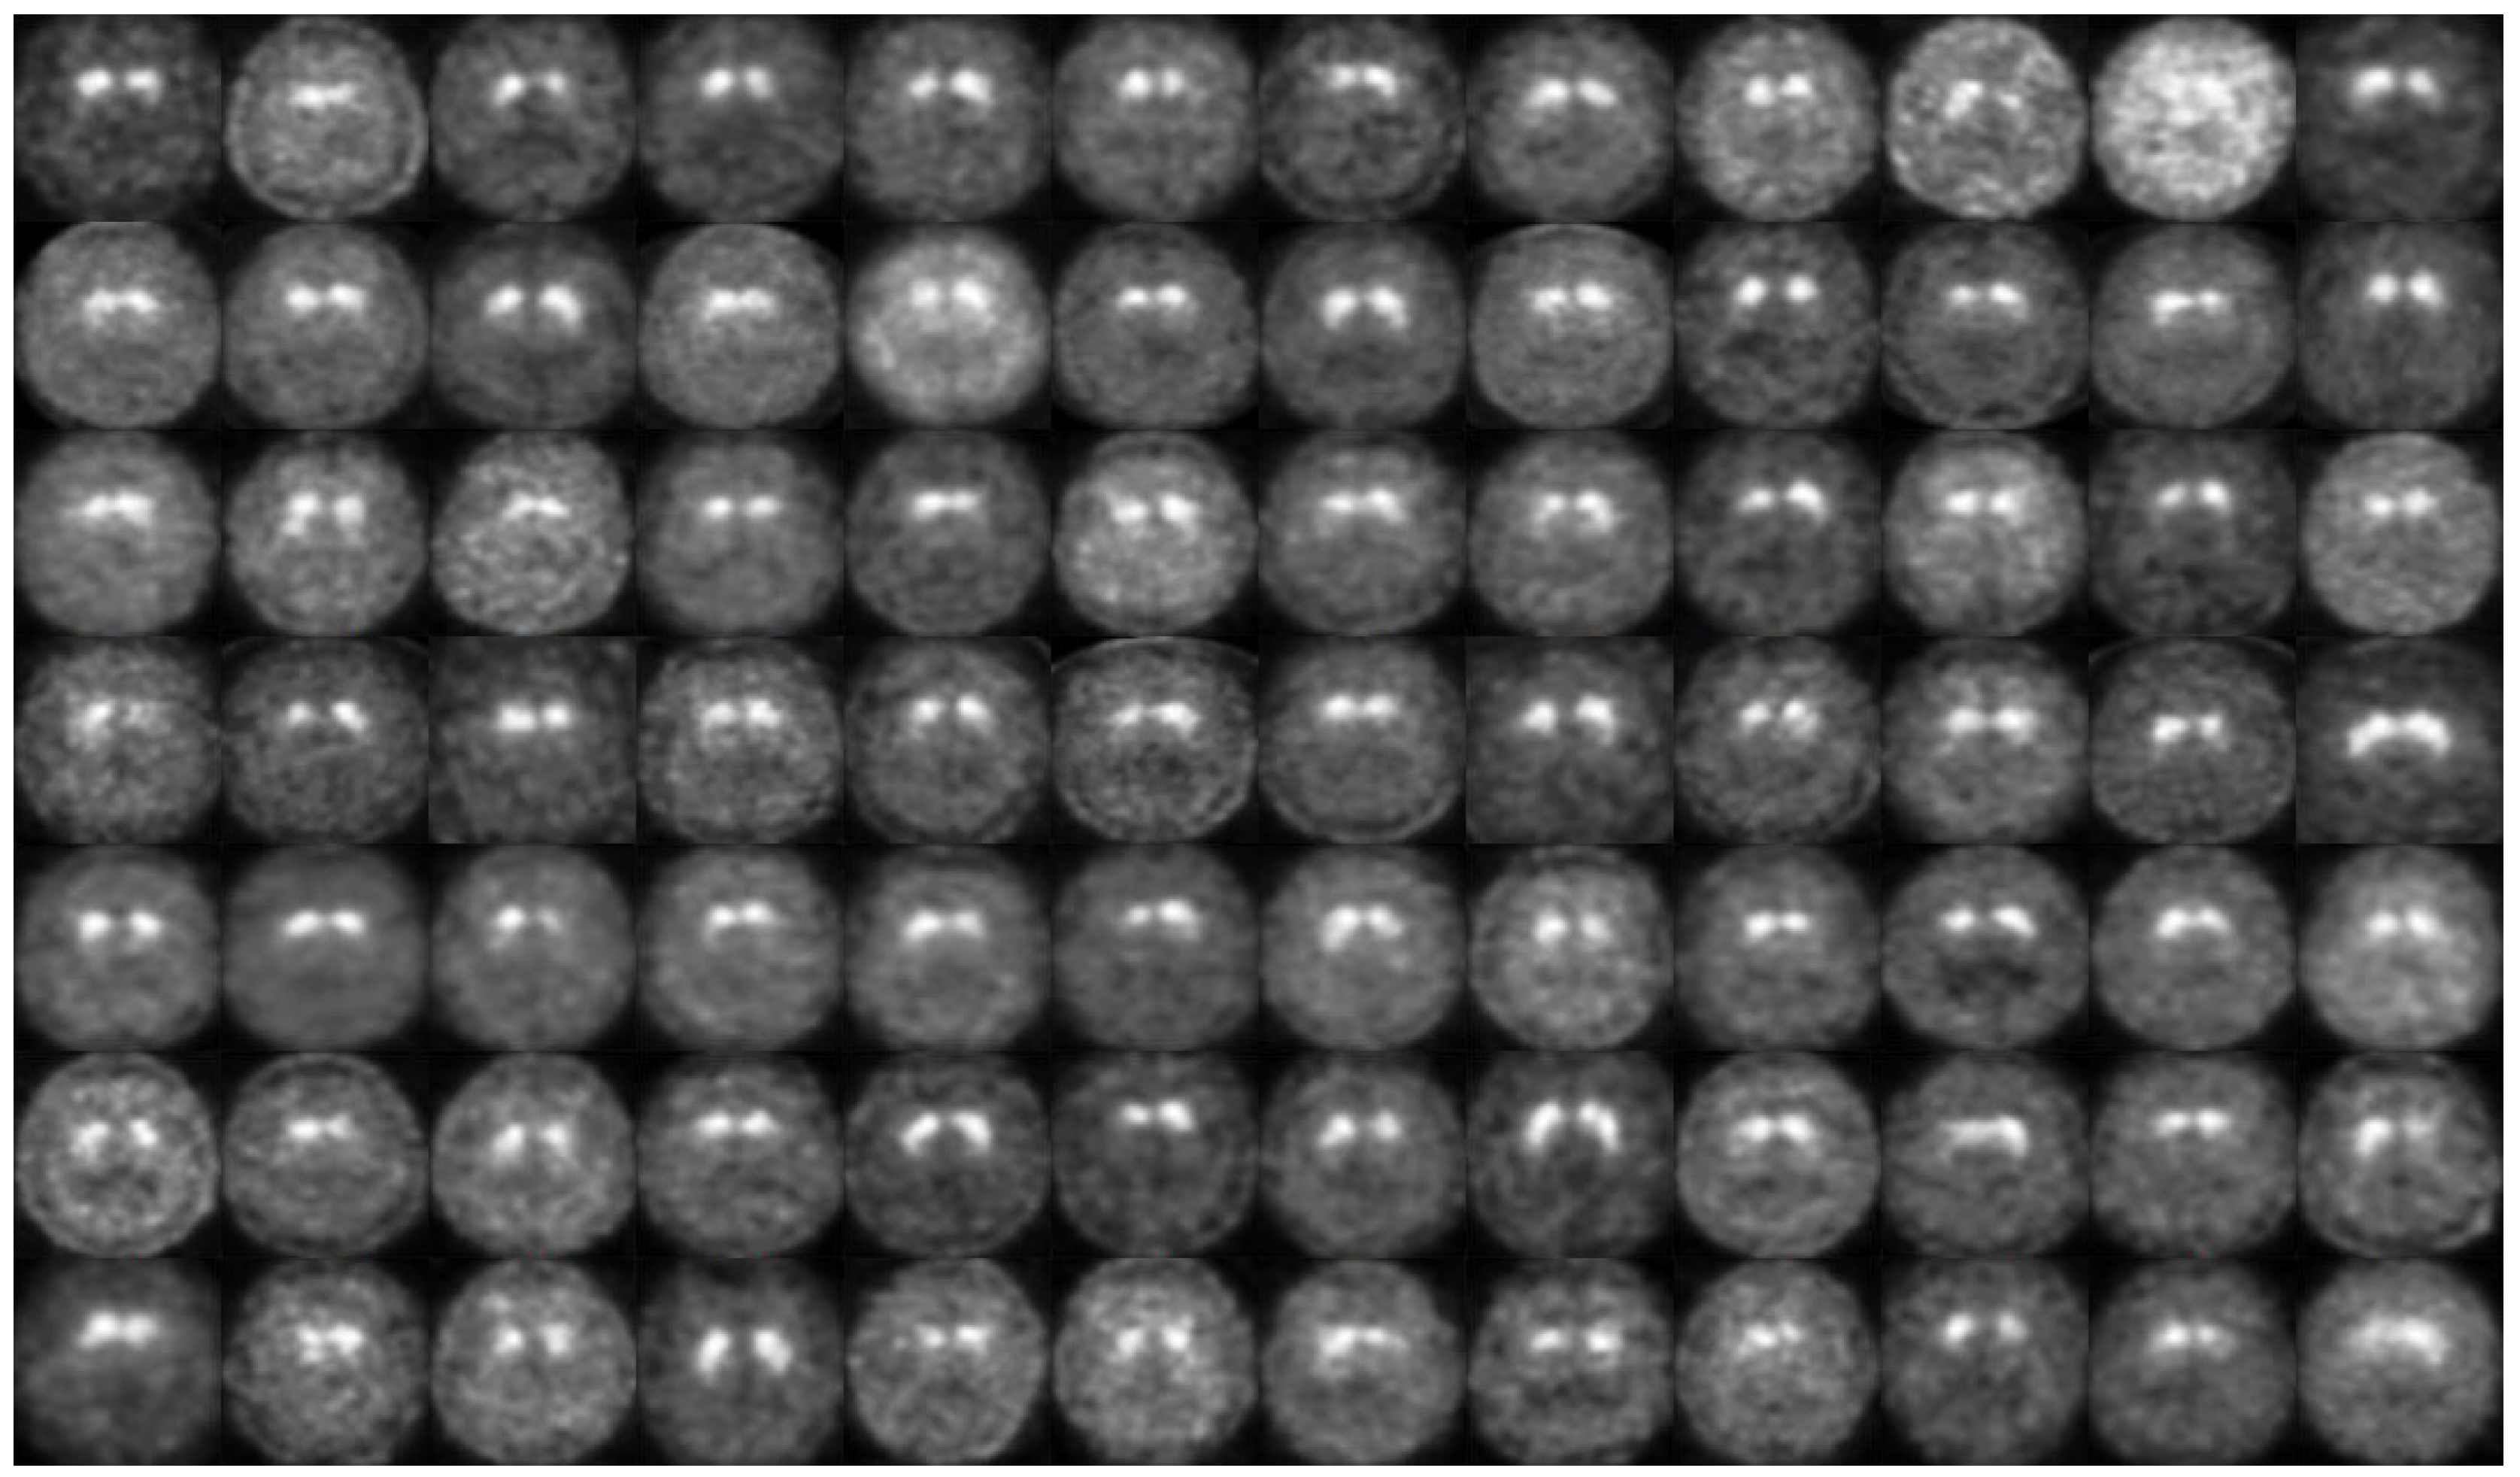
Each original PPMI DaT-SPECT scan is represented as a 3D SPECT volume of size 91 × 109 × 91, stored in DICOM format. Following the published protocol, a single axial slice was extracted from each volume, specifically the 41st slice, which is commonly used to evaluate dopaminergic uptake in the striatum. The extracted slices were converted into PNG format. Figure 1 shows example images from the PPMI-PD (Small) dataset corresponding to a patient with Parkinson’s disease.
Figure 1.
Example DaT-SPECT slices from the PPMI-PD (Small) dataset.
To remove non-informative background, the original preprocessing pipeline applied cropping of unnecessary black regions caused by inter-subject variability. Since cropping led to irregular spatial dimensions, all extracted images were resized to 224 × 224 pixels to ensure compatibility with CNN architectures. Pixel intensities were scaled into the range [0, 1], and brightness augmentation was applied within [0.1, 1.5].
The dataset was used for binary classification between Parkinson’s disease and non-Parkinson’s disease. The training and testing split was performed identically to the original study to ensure reproducibility. This dataset is referred to as PPMI-PD (Small).
3.2.2. PPMI DaT-SPECT Dataset (Large)
To assess generalization across different preprocessing and dataset construction protocols, a second dataset was obtained from the publicly available ParkinSIGHT repository [26]. This dataset was constructed using PPMI SPECT volumes categorized into three clinical classes: Parkinson’s disease (PD), Control, and SWEDD (Scans Without Evidence of Dopaminergic Deficit). The dataset included 1528 DaT-SPECT images. The distribution of samples across classes and experimental splits is summarized in Table 3.
Table 3.
Class distribution and train–test split for each binary classification task in the PPMI-PD (Large) dataset.
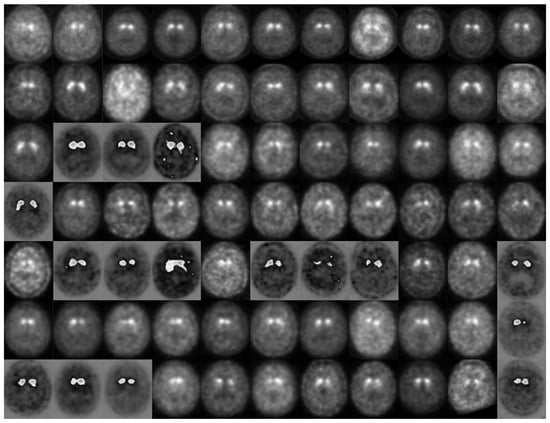
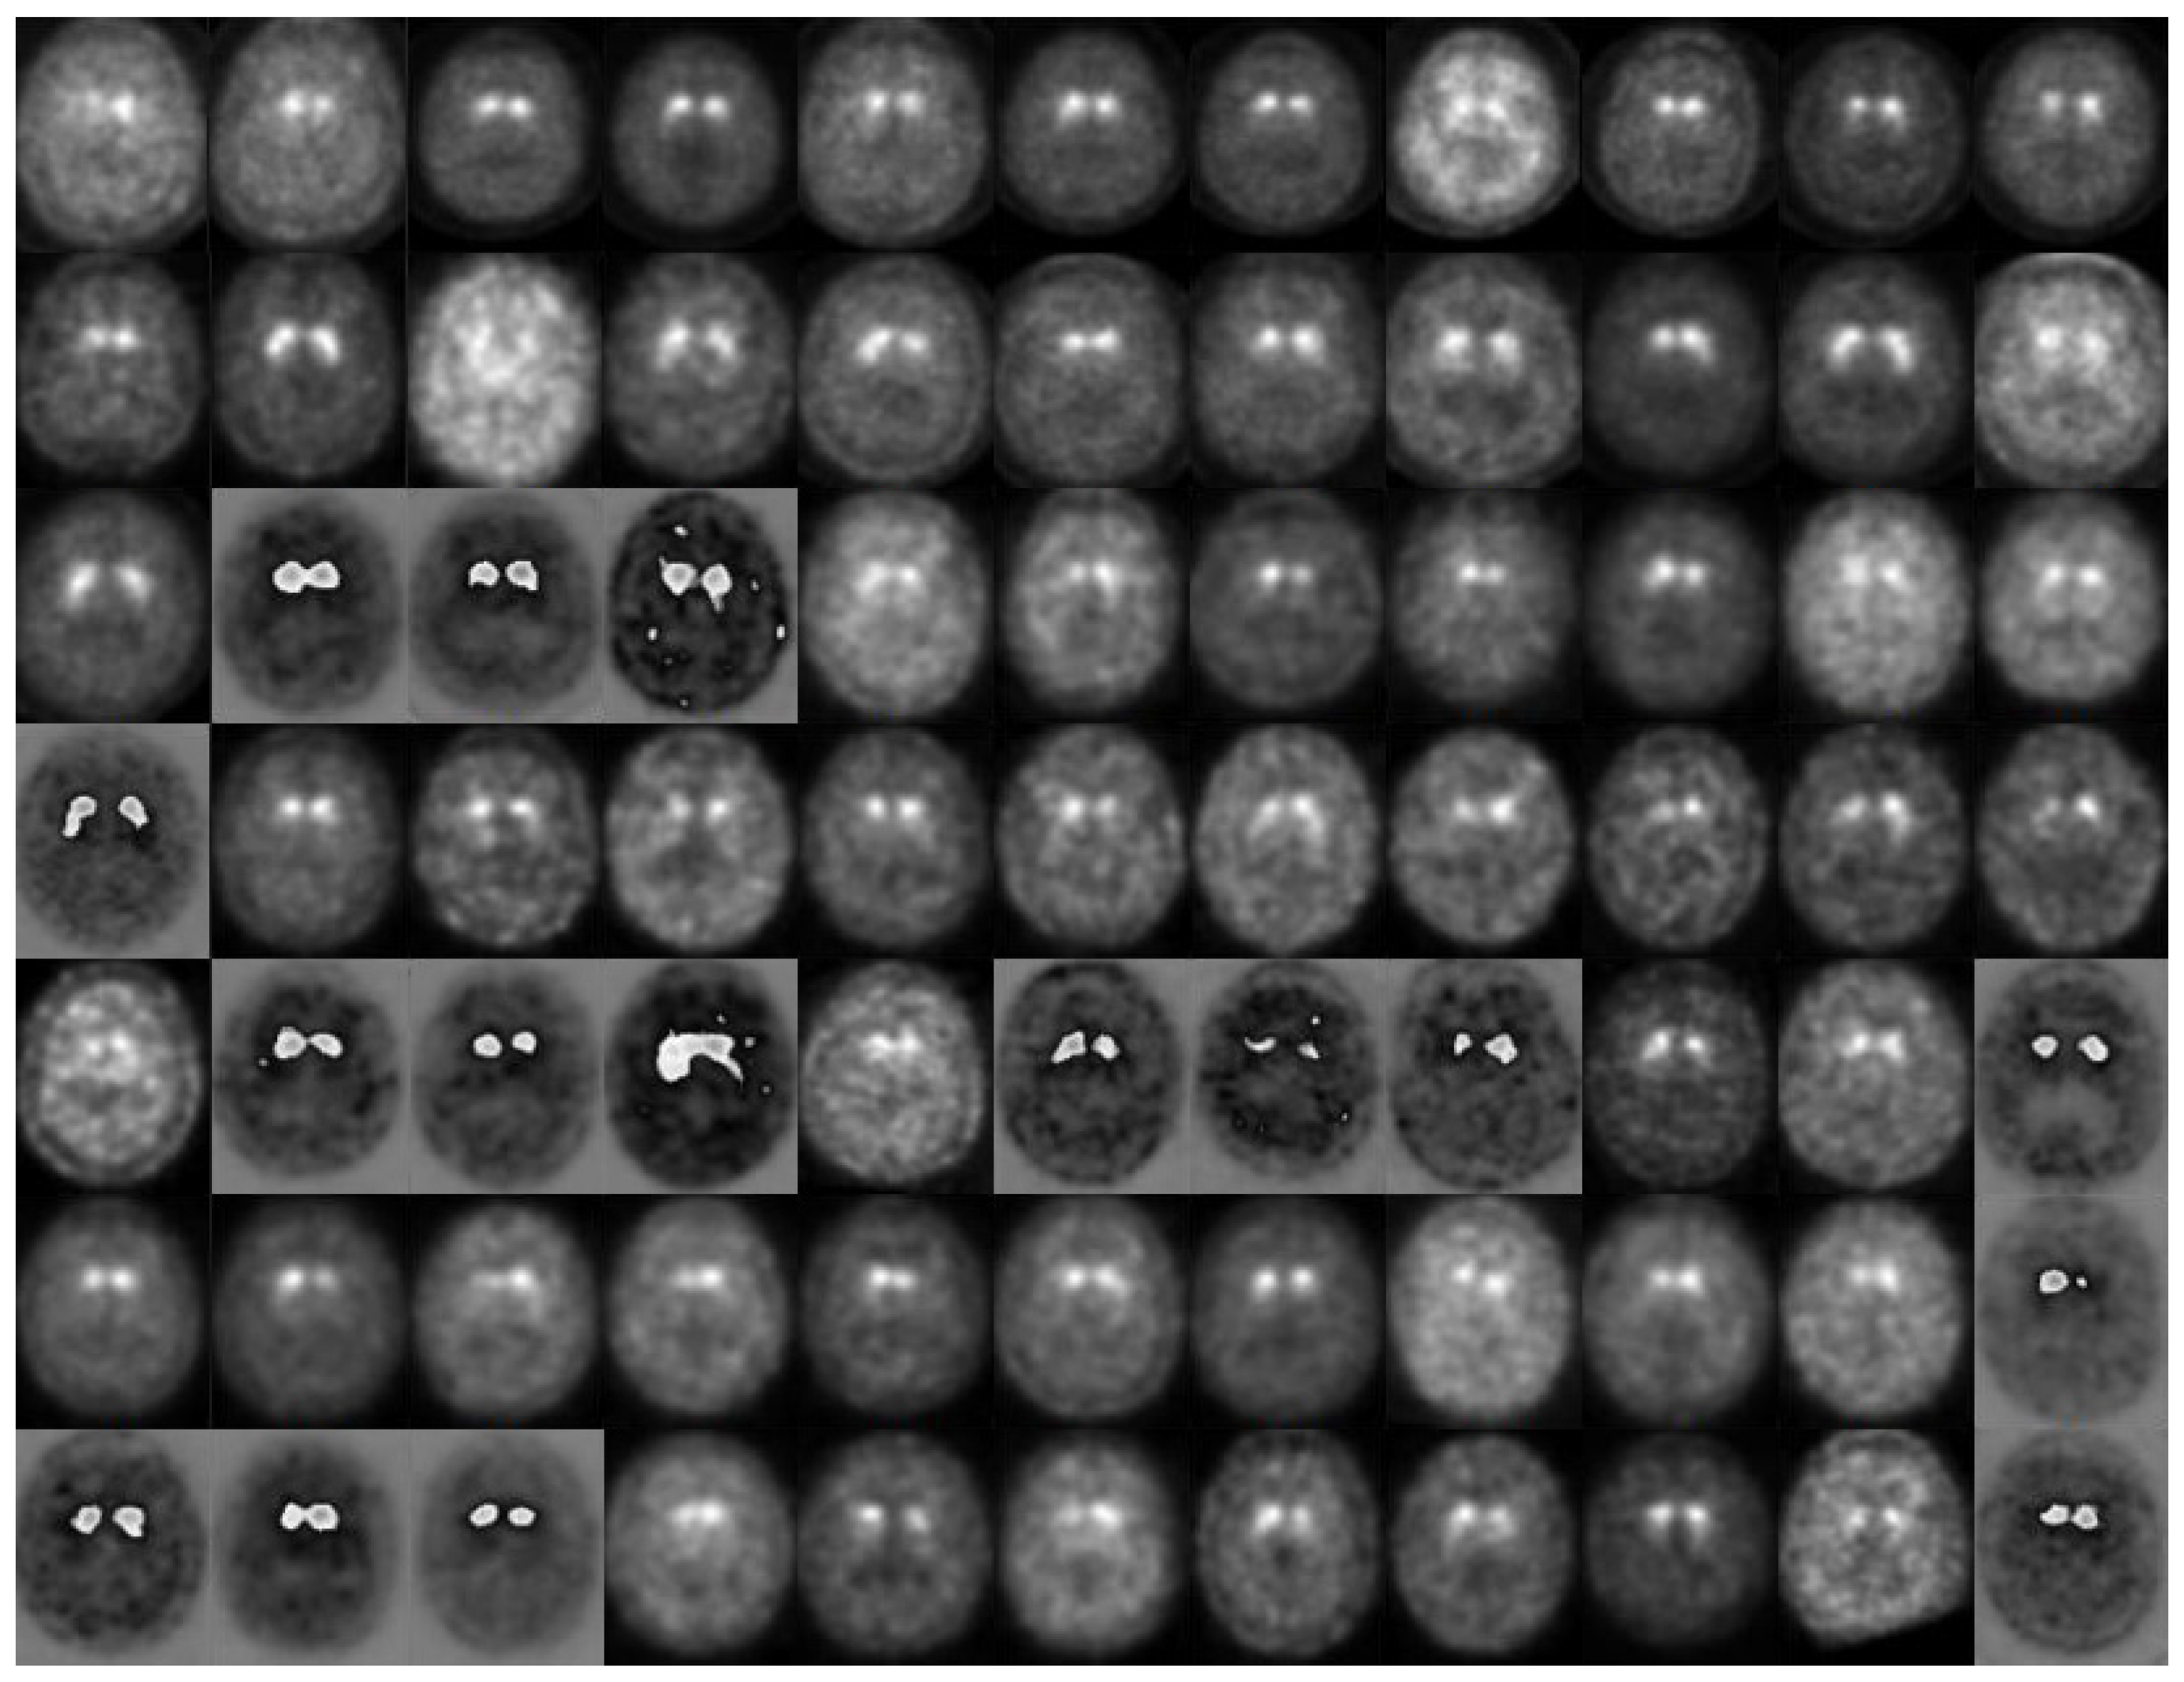
To create 2D representations, the dataset authors averaged the 42nd, 43rd, and 44th axial slices, reducing slice-specific noise and providing a more stable representation of striatal uptake patterns. Figure 2 displays example images from the PPMI-PD (Large) dataset for a patient diagnosed with Parkinson’s disease.
Figure 2.
Example averaged axial slices from the PPMI-PD (Large) dataset.
Unlike the small cohort, the resulting images had a native resolution of approximately 612 × 733 pixels, introducing a substantial change in spatial scale and anatomical coverage. The dataset was randomly divided into training and test sets using an 80:20 split ratio. This dataset is referred to as PPMI-PD (Large). The PD vs. SWEDD classification task involves class imbalance due to the relatively limited number of SWEDD samples. This factor may affect statistical reliability and should be considered when interpreting performance metrics.
Three binary classification tasks were defined:
- PD vs. Non-PD;
- PD vs. Control;
- PD vs. SWEDD.
3.3. Image Preprocessing
DaT-SPECT imaging primarily reflects dopaminergic activity in the striatum. Parkinson’s disease is characterized by reduced uptake in the caudate nucleus and putamen, which are located centrally in axial projections. Therefore, large peripheral regions of DaT-SPECT slices often contain minimal diagnostic information and can act as sources of spurious correlation. To enforce anatomical consistency, all images were resized to 440 pixels on the shorter side and then center cropped to the architecture-specific input size. This approach preserves the central anatomical region while minimizing the influence of irrelevant borders. While 3D volumetric approaches may capture additional spatial context, the use of 2D slice-based representations was intentionally chosen to ensure direct comparability with prior studies and to maintain consistency with previously published experimental protocols. Moreover, 2D approaches significantly reduce computational requirements and are more aligned with real-world clinical deployment constraints, where rapid inference and limited hardware resources are critical factors. Importantly, the goal of this study is not to maximize absolute performance, but to isolate the effect of training protocol design under controlled conditions.
3.4. Data Augmentation
To reduce overfitting under limited cohort size, stochastic augmentation was applied exclusively to the training split.
The augmentation pipeline included:
- central cropping to the required input size;
- random horizontal flipping;
- random rotation within ±10 degrees;
- brightness variation within the range 0.1–1.5.
Horizontal flipping was applied to encourage invariance to left–right orientation, under the assumption that dopaminergic deficit patterns are clinically relevant regardless of hemispheric side. Rotation was restricted to small angles to avoid unrealistic anatomical distortion. Brightness variation simulates acquisition-related intensity variability without altering structural uptake patterns.
3.5. Training Procedure
All models were trained using categorical cross-entropy loss:
Optimization was performed using the Adam optimizer. In the optimized configurations, L2 regularization (weight decay) was applied with coefficient . Cosine annealing with warm restarts was used to schedule the learning rate (, , ). Model selection was performed using the checkpoint with the highest validation accuracy. The training protocol was designed as a structured combination of commonly adopted deep learning practices, including data augmentation, weight decay, and learning rate scheduling. The objective was not to perform exhaustive hyperparameter optimization, but to define a stable and reproducible training framework. Importantly, the same training protocol was applied across all evaluated architectures to ensure a fair comparison and isolate the effect of training design from architectural differences.
3.6. Evaluation Metrics
For each model, a confusion matrix was computed, consisting of true positives (TP), true negatives (TN), false positives (FP), and false negatives (FN).
Accuracy measures the proportion of correctly classified samples among all evaluated cases:
This metric reflects overall classification performance but may be influenced by class imbalance.
Precision quantifies the proportion of correctly predicted positive cases among all samples predicted as positive:
High precision indicates a low false positive rate.
Recall, also referred to as sensitivity, measures the proportion of correctly identified positive cases among all true positive samples:
High recall indicates a low false negative rate, which is clinically important for disease detection.
Specificity measures the proportion of correctly identified negative cases:
Specificity is particularly relevant for minimizing false alarms in screening settings.
The F1-score represents the harmonic mean of precision and recall:
It provides a balanced measure when both false positives and false negatives are relevant.
To account for potential class imbalance, weighted precision, weighted recall, and weighted F1-score were computed using class support as weights.
In addition to these metrics, the area under the receiver operating characteristic curve (AUROC) was calculated to assess class separability independently of a fixed decision threshold [27].
3.7. Reliability and Uncertainty Analysis
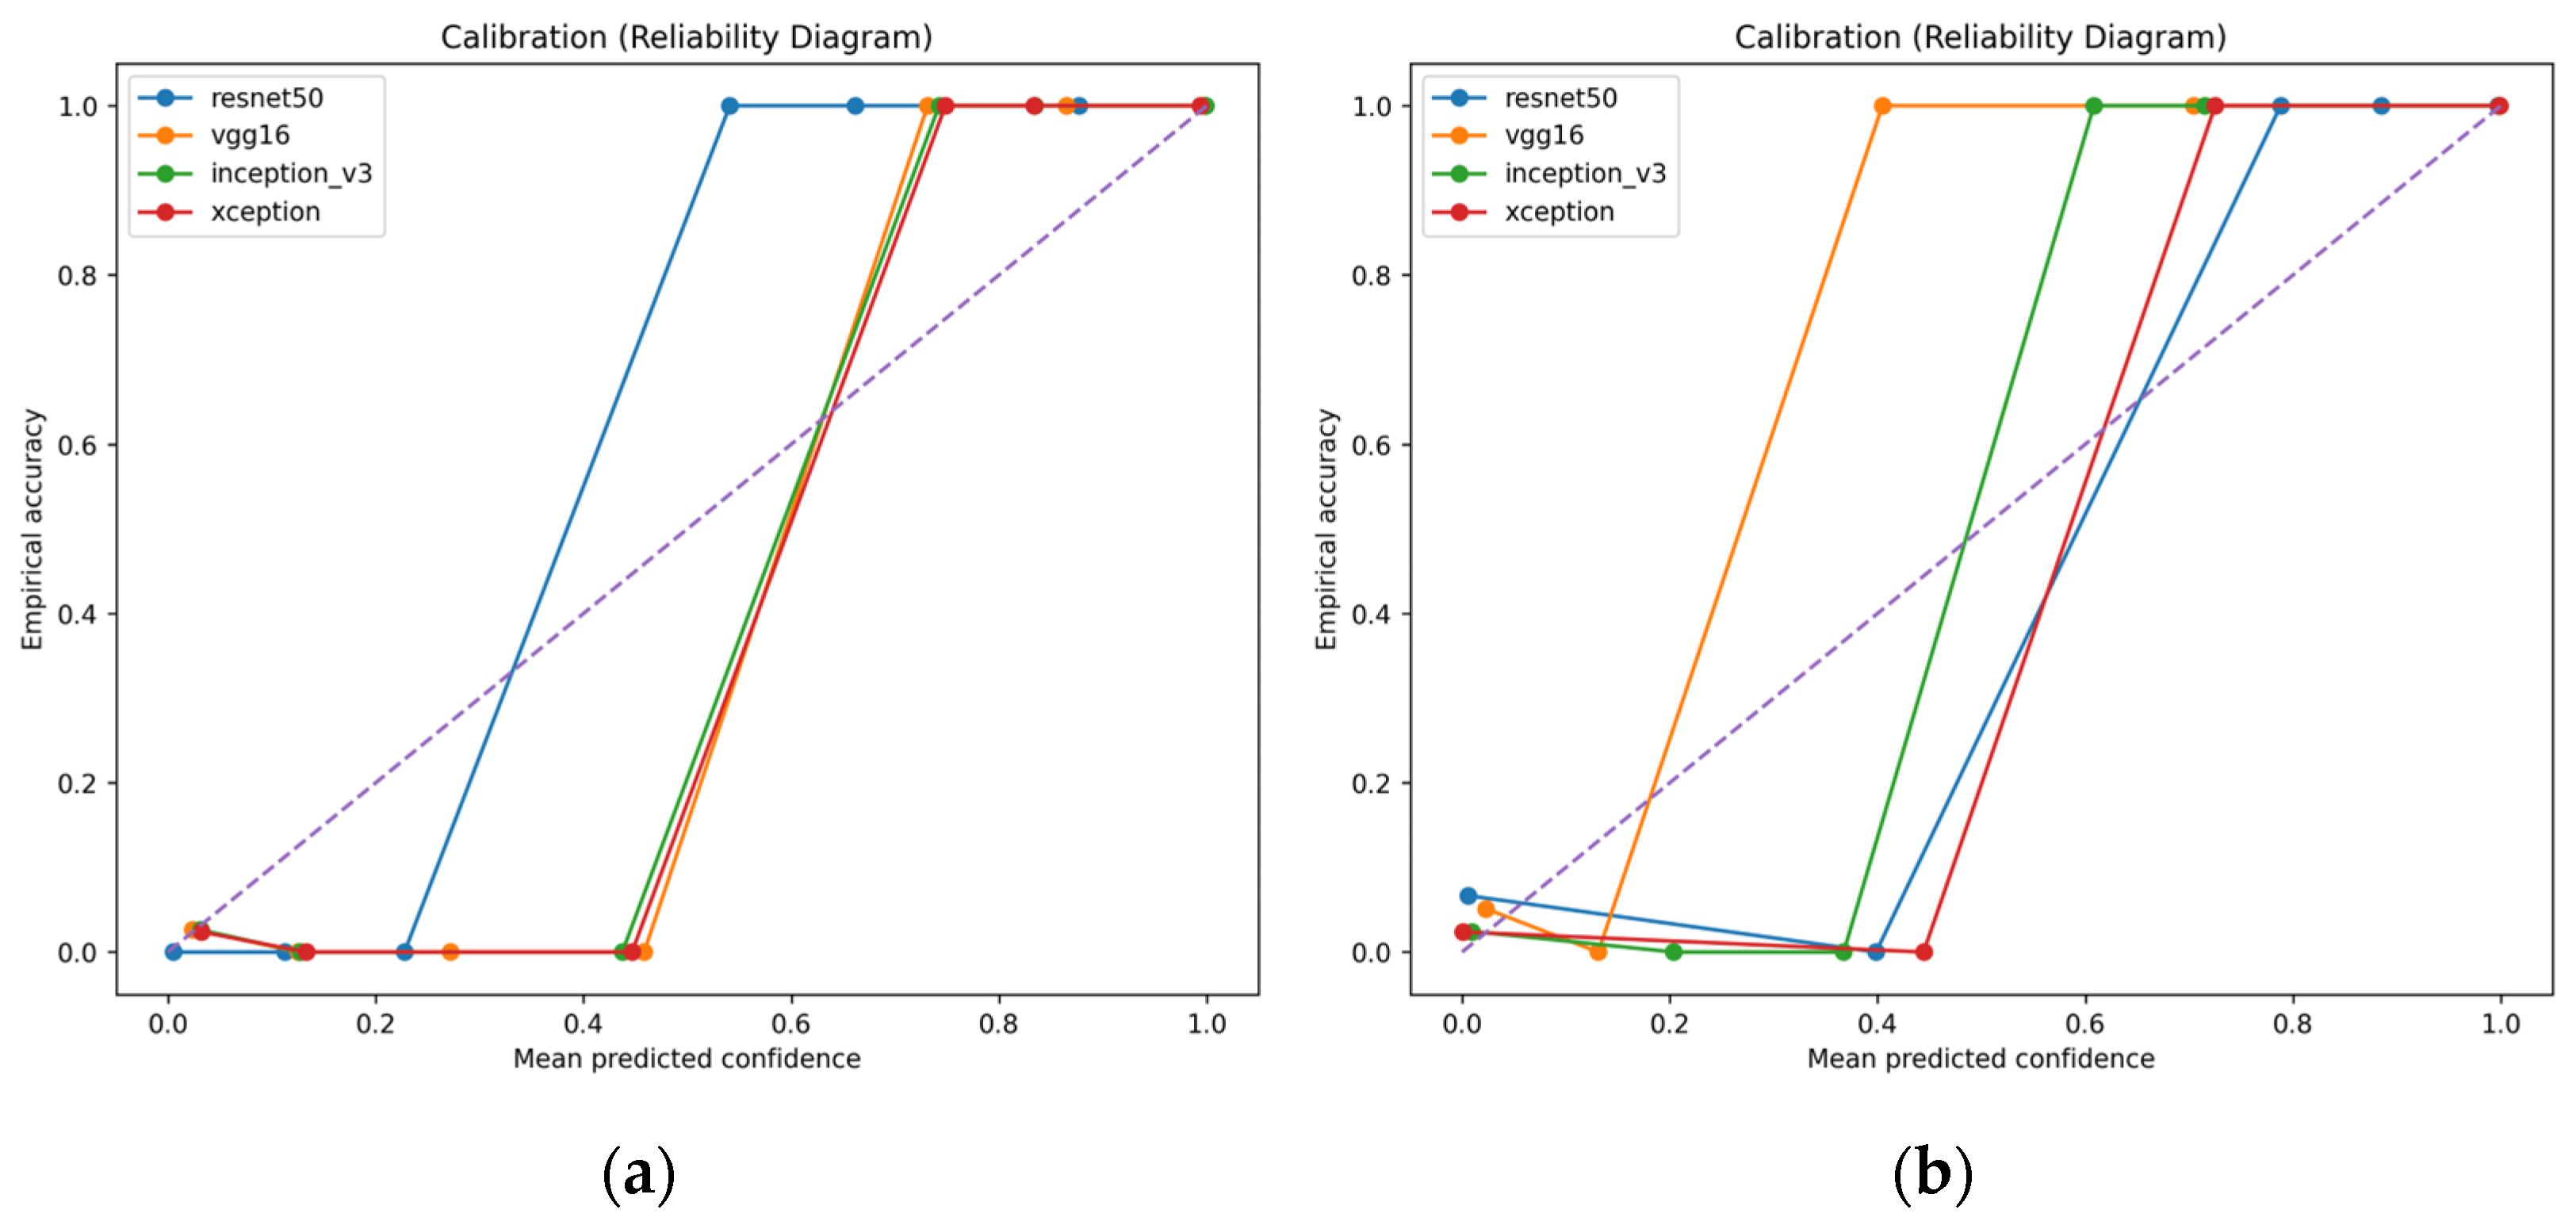
In addition to accuracy, reliability-related metrics such as calibration curves and expected calibration error were analyzed to assess the consistency of probabilistic predictions, which is critical for clinical applicability. Calibration was evaluated following Guo et al. [28]. Predictions were grouped into confidence bins. For each bin , empirical accuracy and average predicted confidence were computed.
Expected Calibration Error (ECE) was defined as:
where is the number of samples in bin and is the total number of samples. Lower ECE indicates better agreement between predicted confidence and empirical correctness.
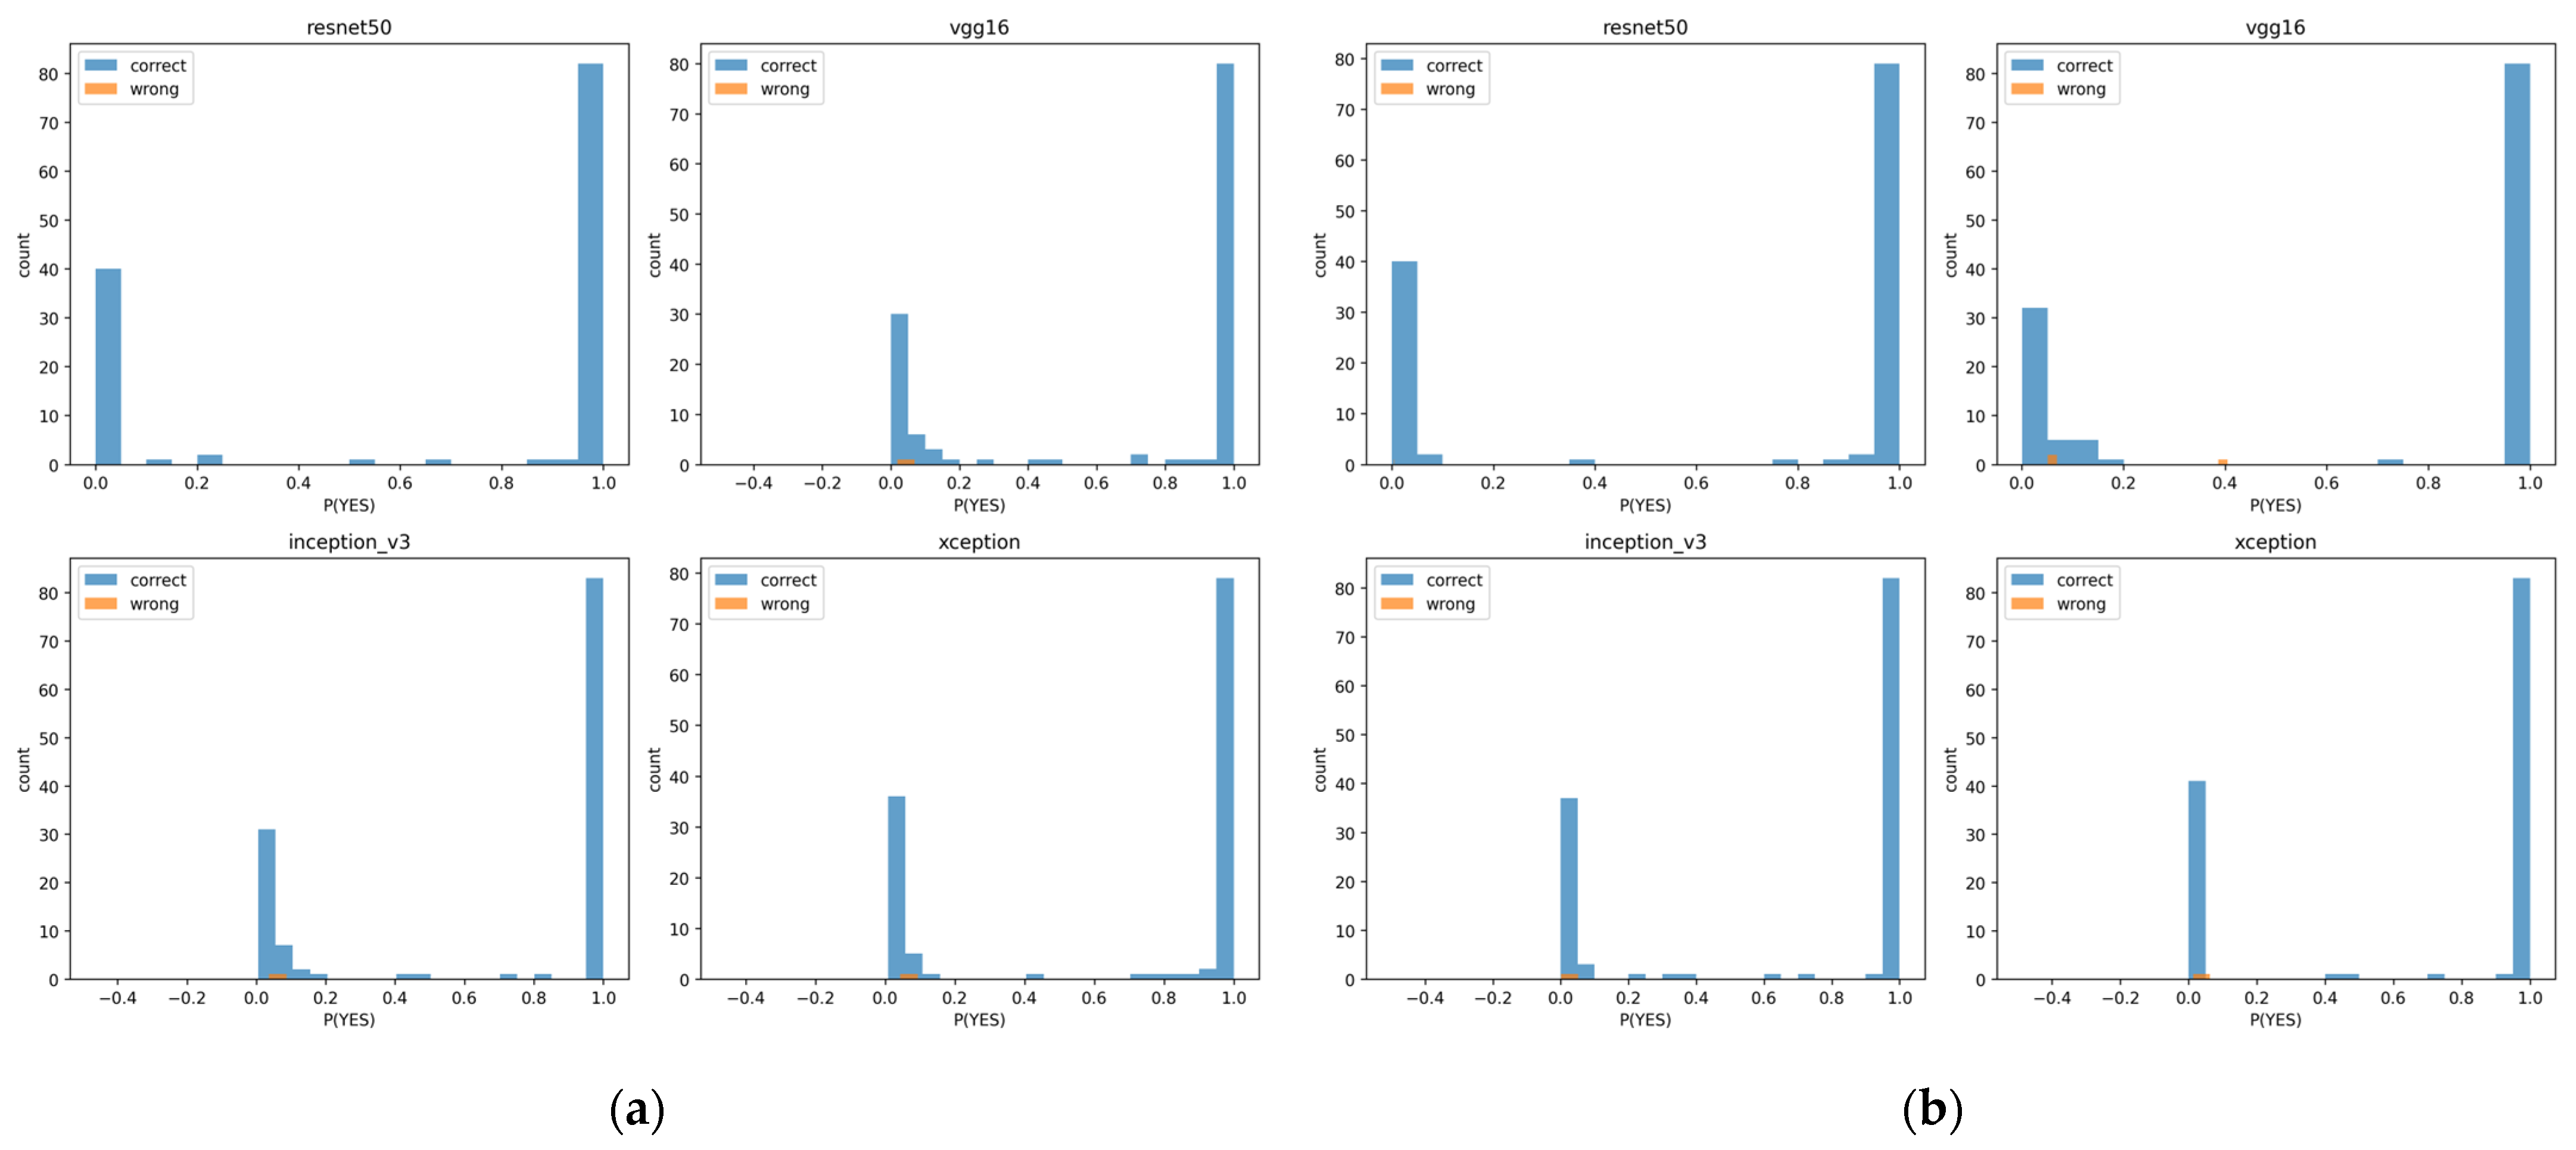
Confidence histograms were constructed separately for correctly and incorrectly classified samples to analyze the distribution of prediction confidence. This visualization allows inspection of whether misclassified cases are predicted with high confidence, which is undesirable in clinical applications. For each sample, the confidence score was defined as the predicted probability of the PD class.
3.8. Interpretability and Representation Analysis
Grad-CAM [29] produces a heatmap over the input image indicating which spatial regions contributed most strongly to the predicted class. All Grad-CAM visualizations were generated using a fixed resolution of 224 × 224 to ensure consistent comparison across architectures. To avoid numerical issues related to in-place ReLU operations, in-place activation was disabled only during Grad-CAM computation. This modification did not affect training.
To analyze the structure of learned feature representations, latent embeddings were extracted from each trained model. Specifically, the output of the final convolutional feature extractor was globally averaged, yielding a feature vector for each sample. Dimensionality reduction was then performed using Uniform Manifold Approximation and Projection (UMAP) [30], producing a 2D embedding for visualization. UMAP was selected due to its ability to preserve local neighborhood relationships, making it suitable for analyzing class clustering.
UMAP was configured with:
- 15 nearest neighbors;
- minimum distance 0.1;
- Euclidean metric;
- random seed 42.
3.9. Implementation Details and Reproducibility
All experiments were implemented in Python 3.10.14 using the PyTorch 2.2.0 framework and the timm 1.0.20 model library. Experiments were performed on a single NVIDIA GeForce RTX 3090 GPU (24 GB VRAM) (produced by NVIDIA (Santa Clara, CA, USA)). Training logs, evaluation plots, and model checkpoints were automatically saved. The best-performing checkpoint was selected based on validation accuracy. All reported metrics were computed on held-out test data.
4. Results
4.1. PPMI-PD (Small): Impact of Training Protocol on Discrimination and Reliability
Table 4 reports the performance obtained without preprocessing, weight decay, or additional regularization. Under these conditions, we fully reproduced the results reported by Kurmi et al. on the same dataset, using identical training and test splits.
Table 4.
Baseline performance on the PPMI-PD (Small) dataset without preprocessing or regularization.
Table 5 shows the results after applying the proposed preprocessing pipeline and regularization strategy. Under baseline training, Inception-V3 and Xception already achieved high discriminative performance. However, ResNet50 and VGG16 demonstrated less stable validation behavior and higher calibration error.
Table 5.
Performance on the PPMI-PD (Small) dataset with optimized preprocessing and regularization.
After introducing structured preprocessing and regularization in Table 5:
- ResNet50 improved from 0.9767 to 1.000 accuracy
- ECE decreased from 0.0288 to 0.0142.
- Validation trajectories became stable across all architectures.
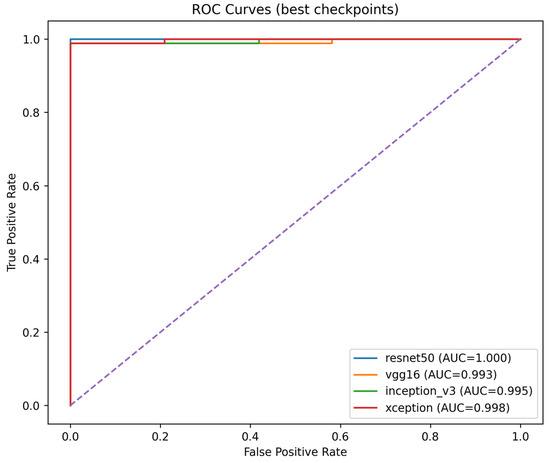
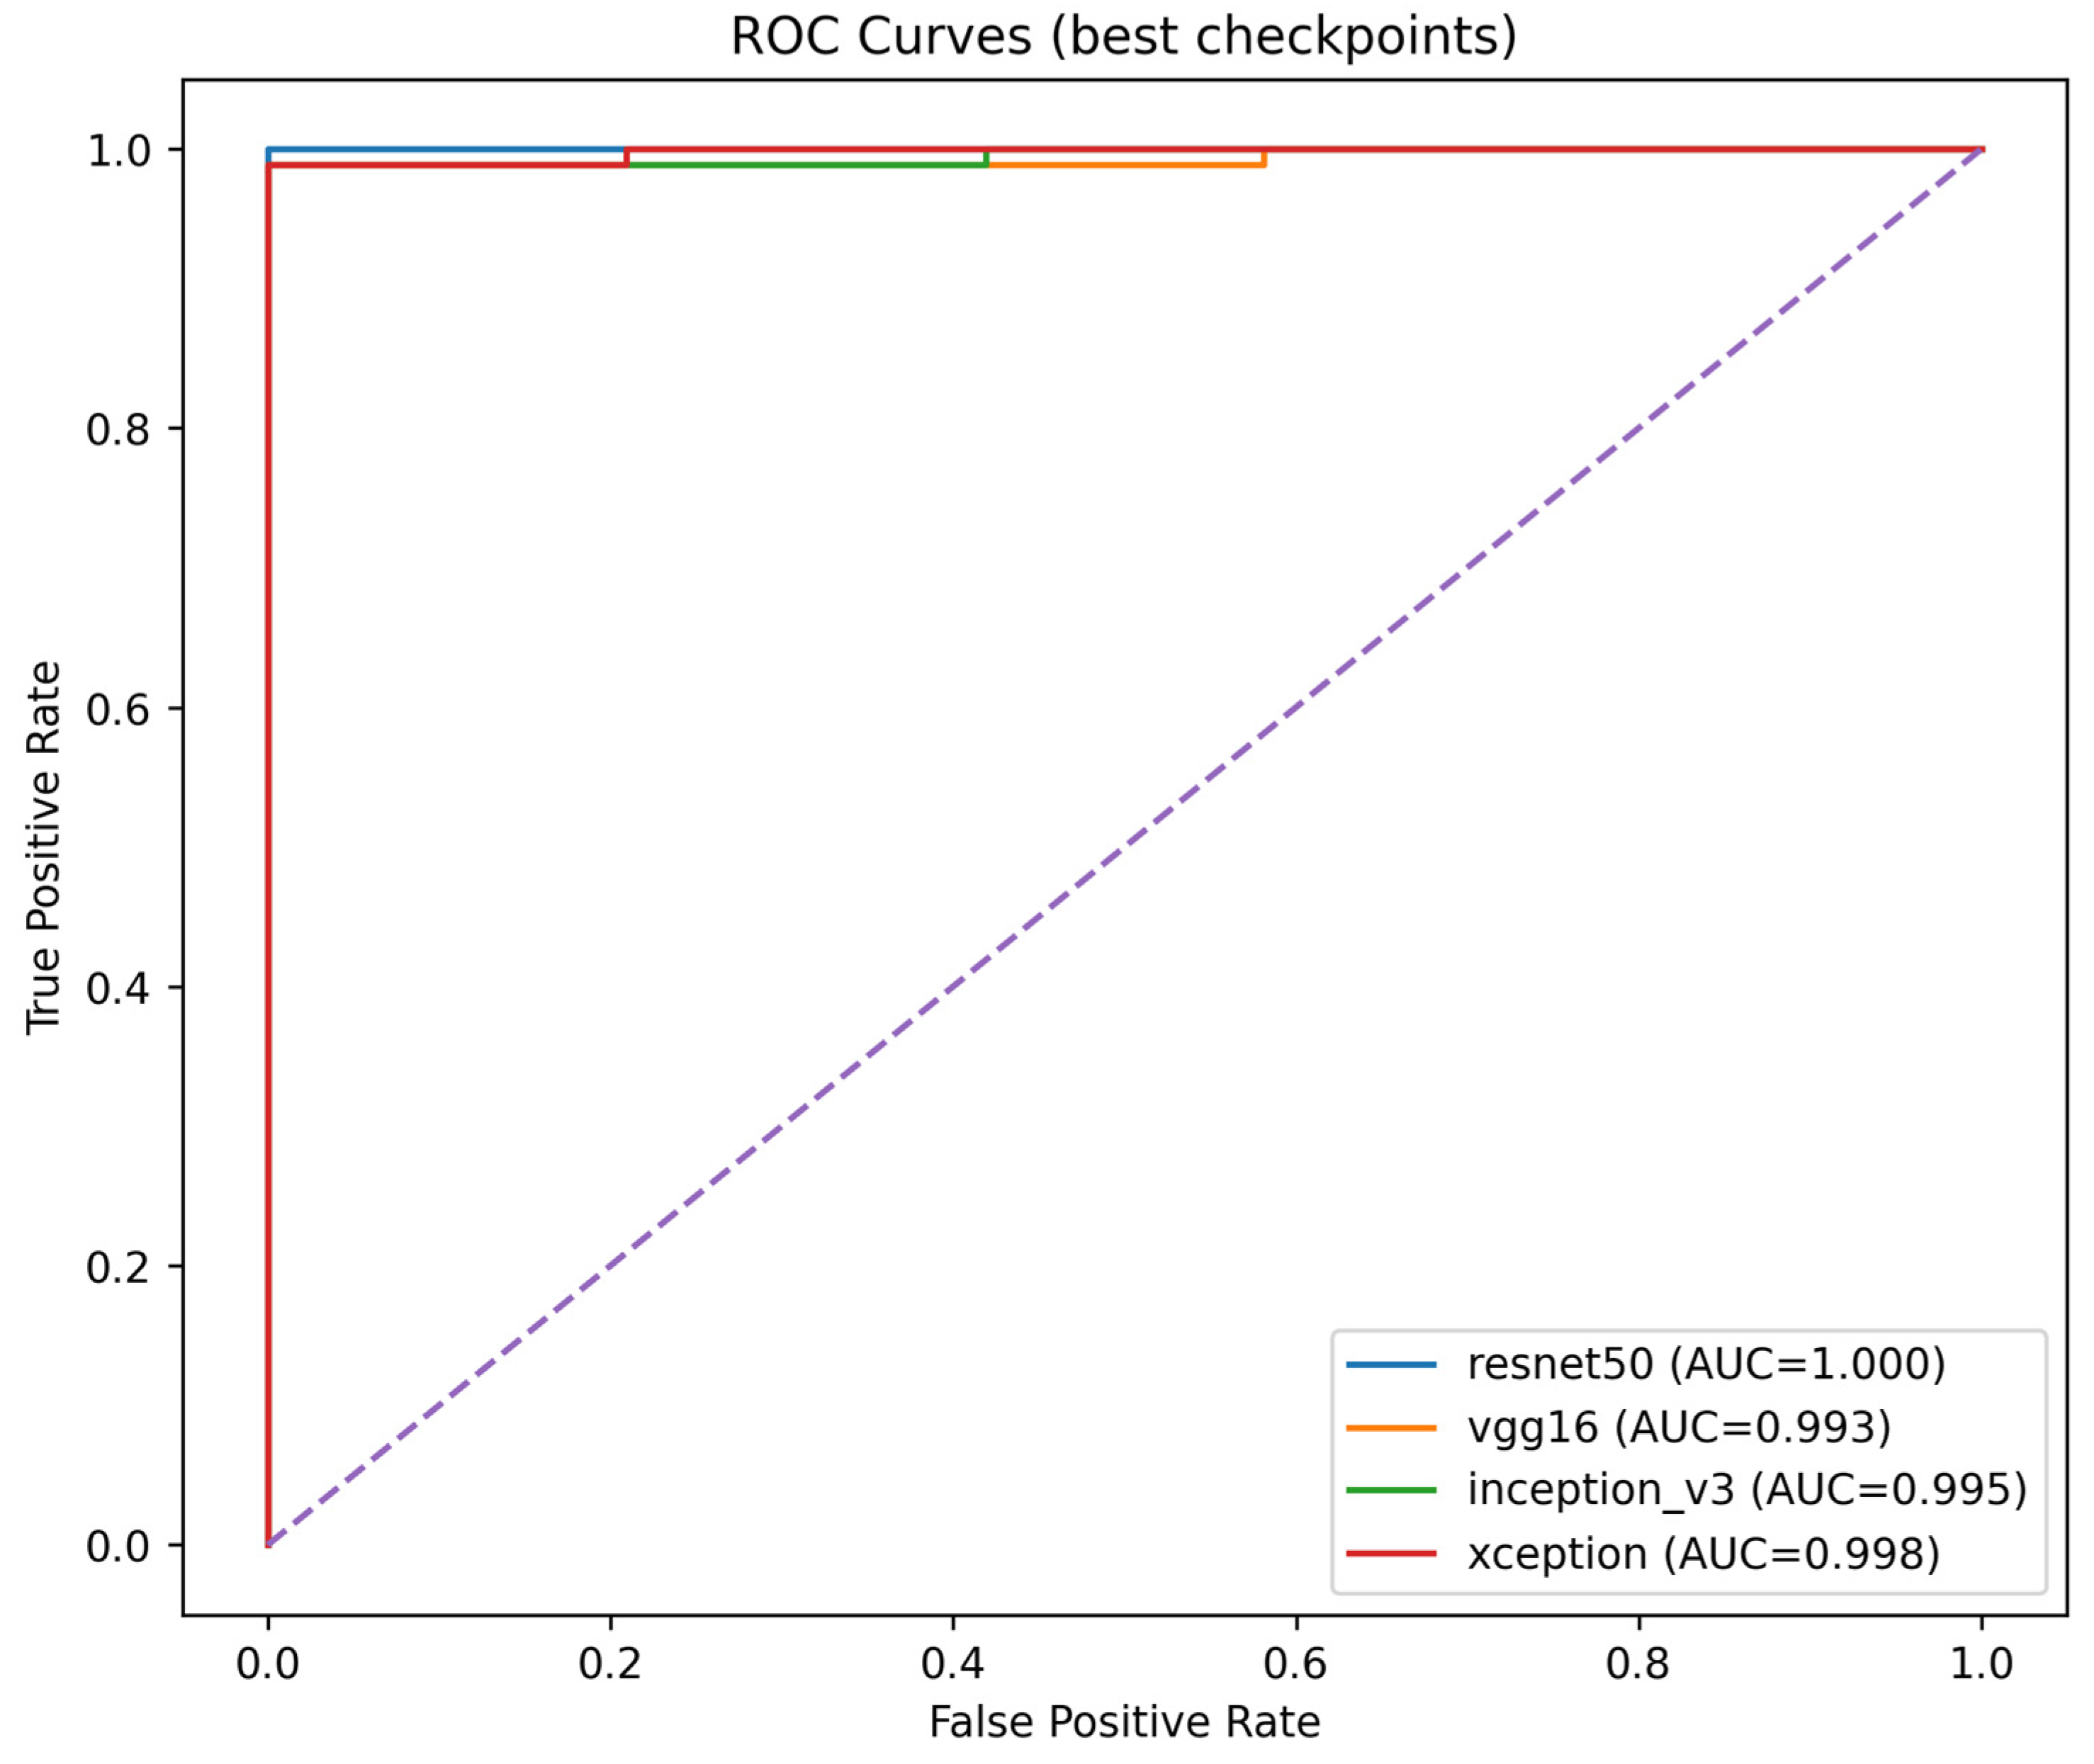
Figure 3 shows ROC curves for all architectures under optimized training. The curves cluster near the top-left corner, confirming strong separability.
Figure 3.
ROC curves for CNN architectures on the PPMI-PD (Small) dataset under optimized training.
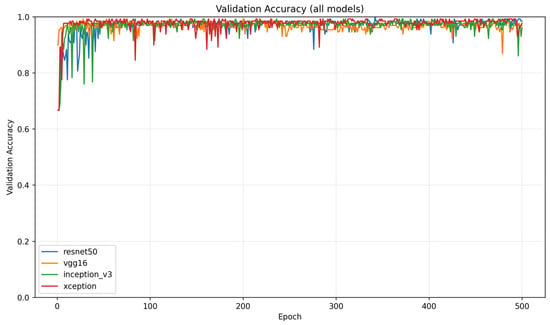
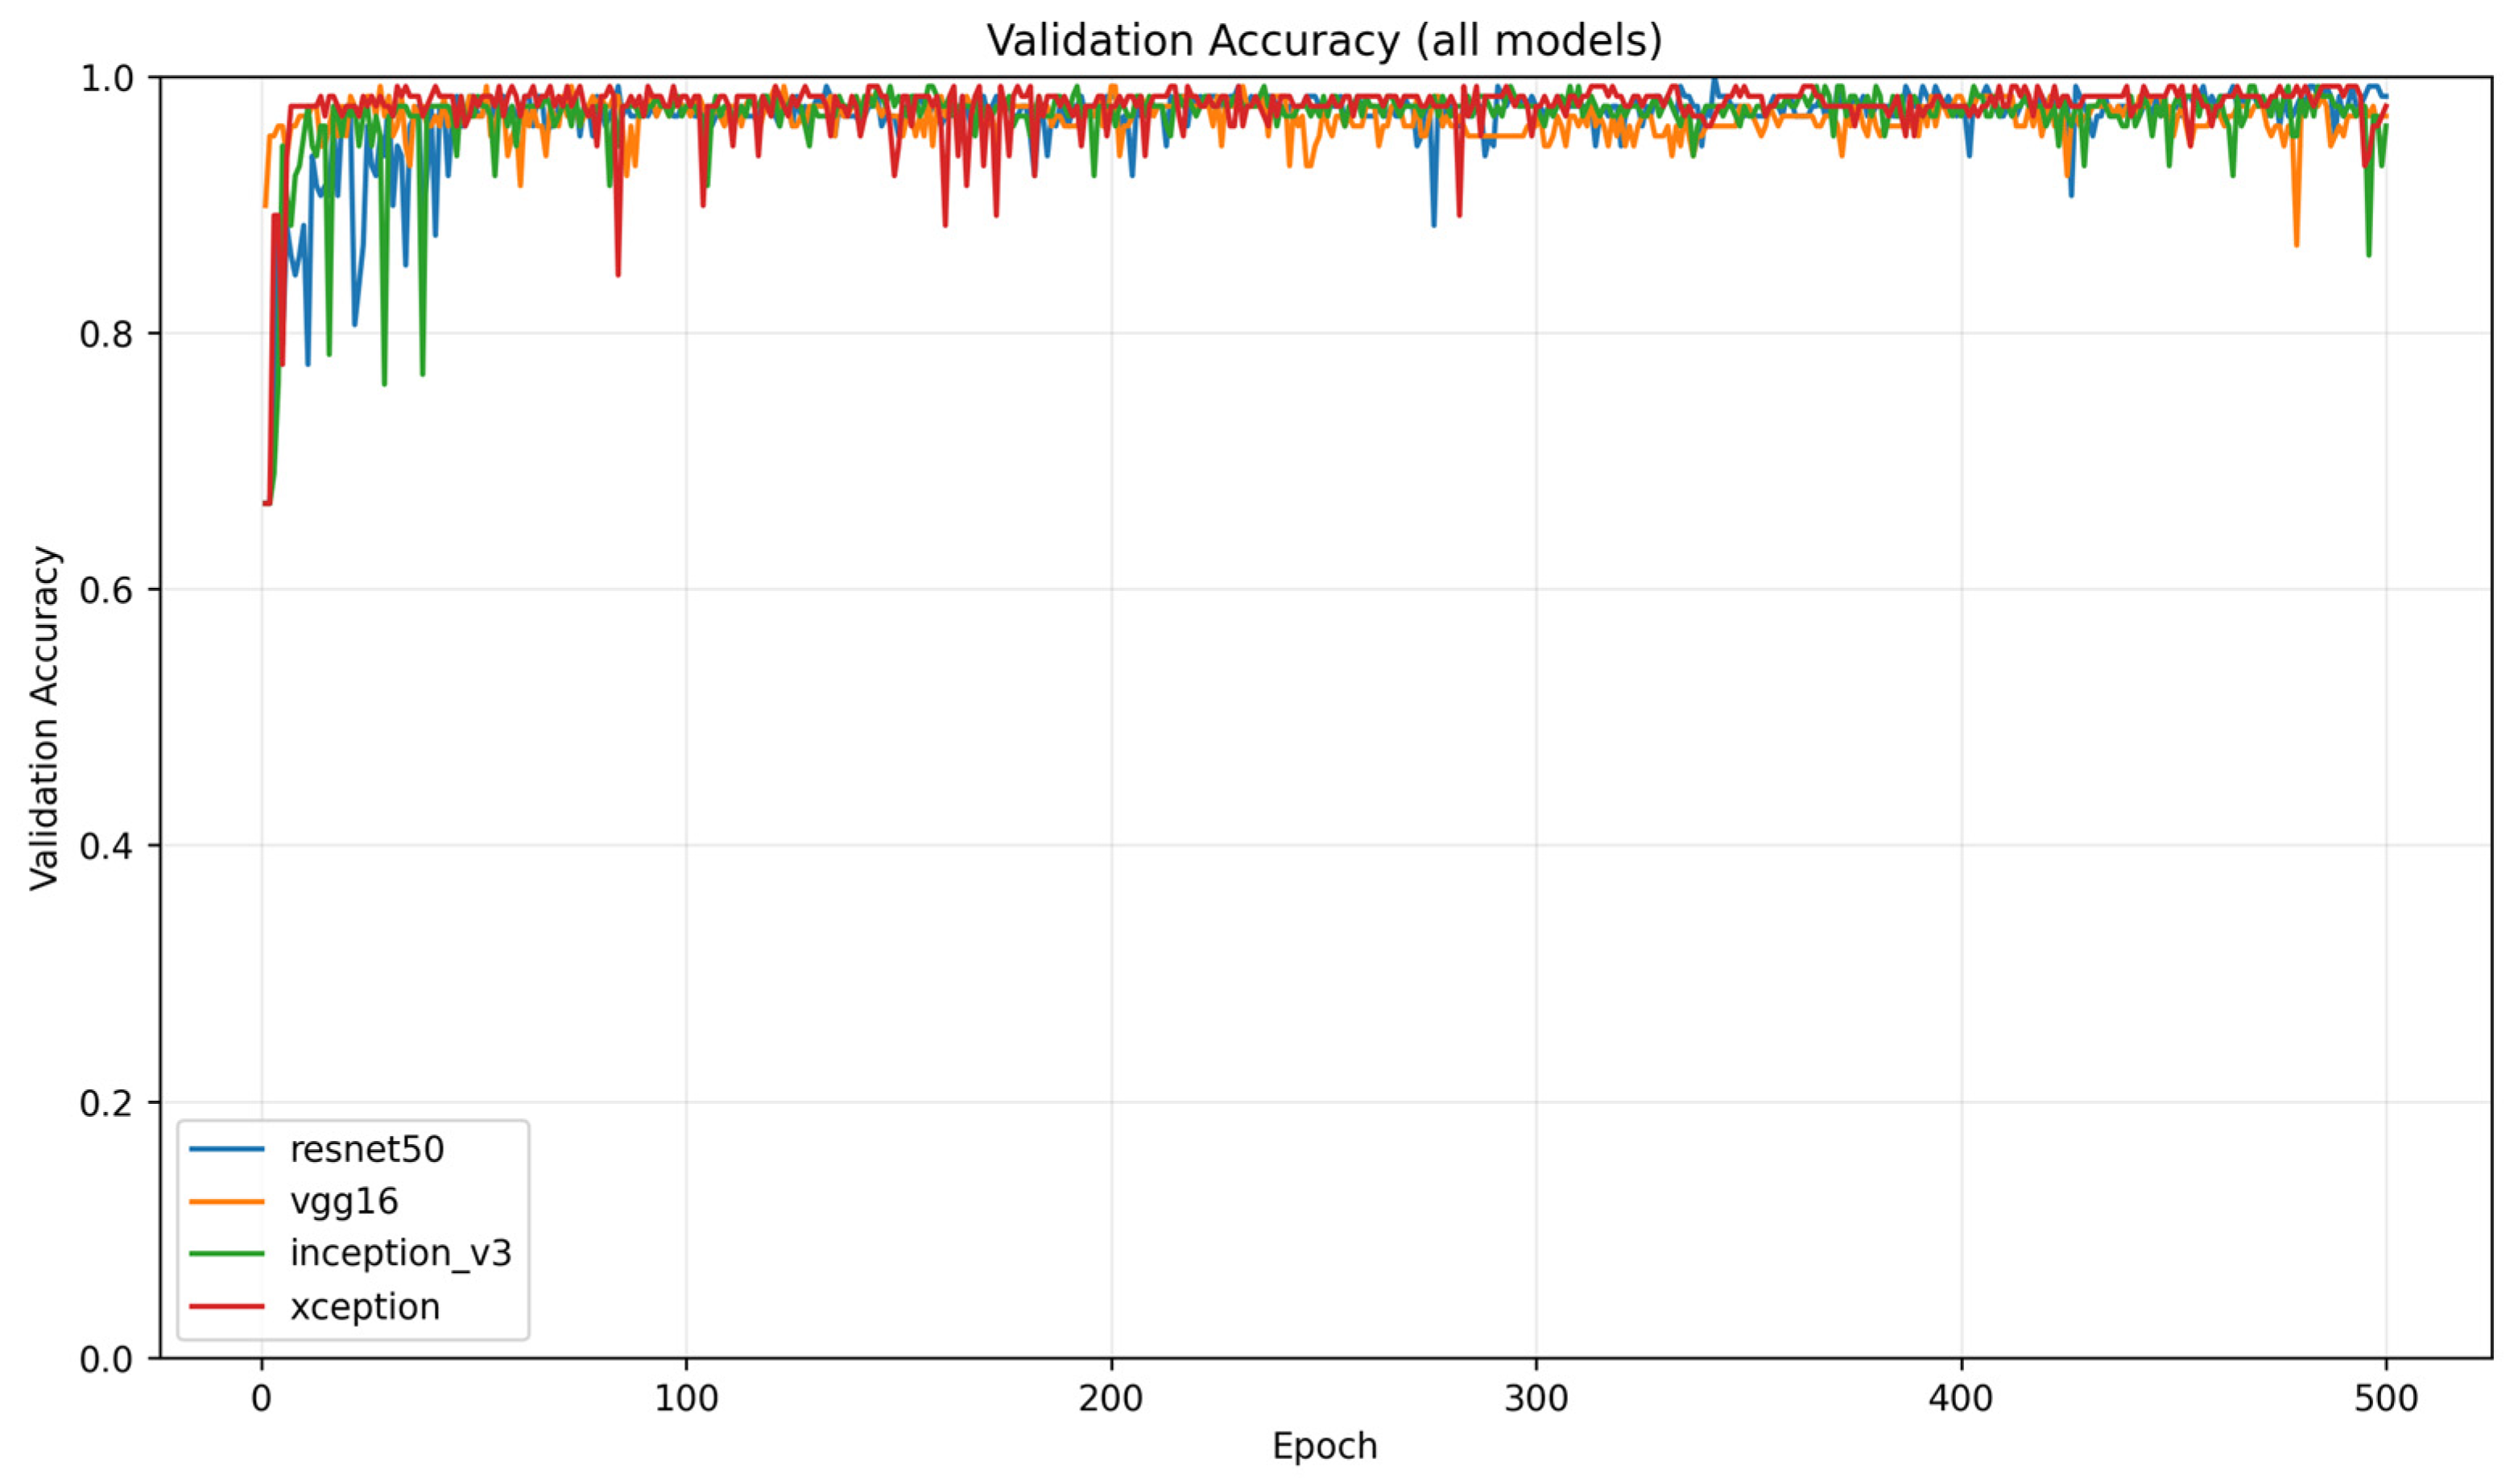
Figure 4 illustrates validation accuracy curves for all models. Optimized training produces smoother convergence and reduced oscillation.
Figure 4.
Validation accuracy across 500 epochs for all CNN backbones under the optimized protocol. The plot illustrates convergence speed and variability across architectures using the best-checkpoint selection criterion.
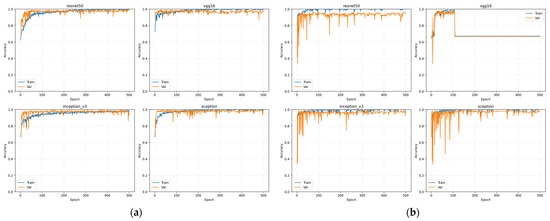
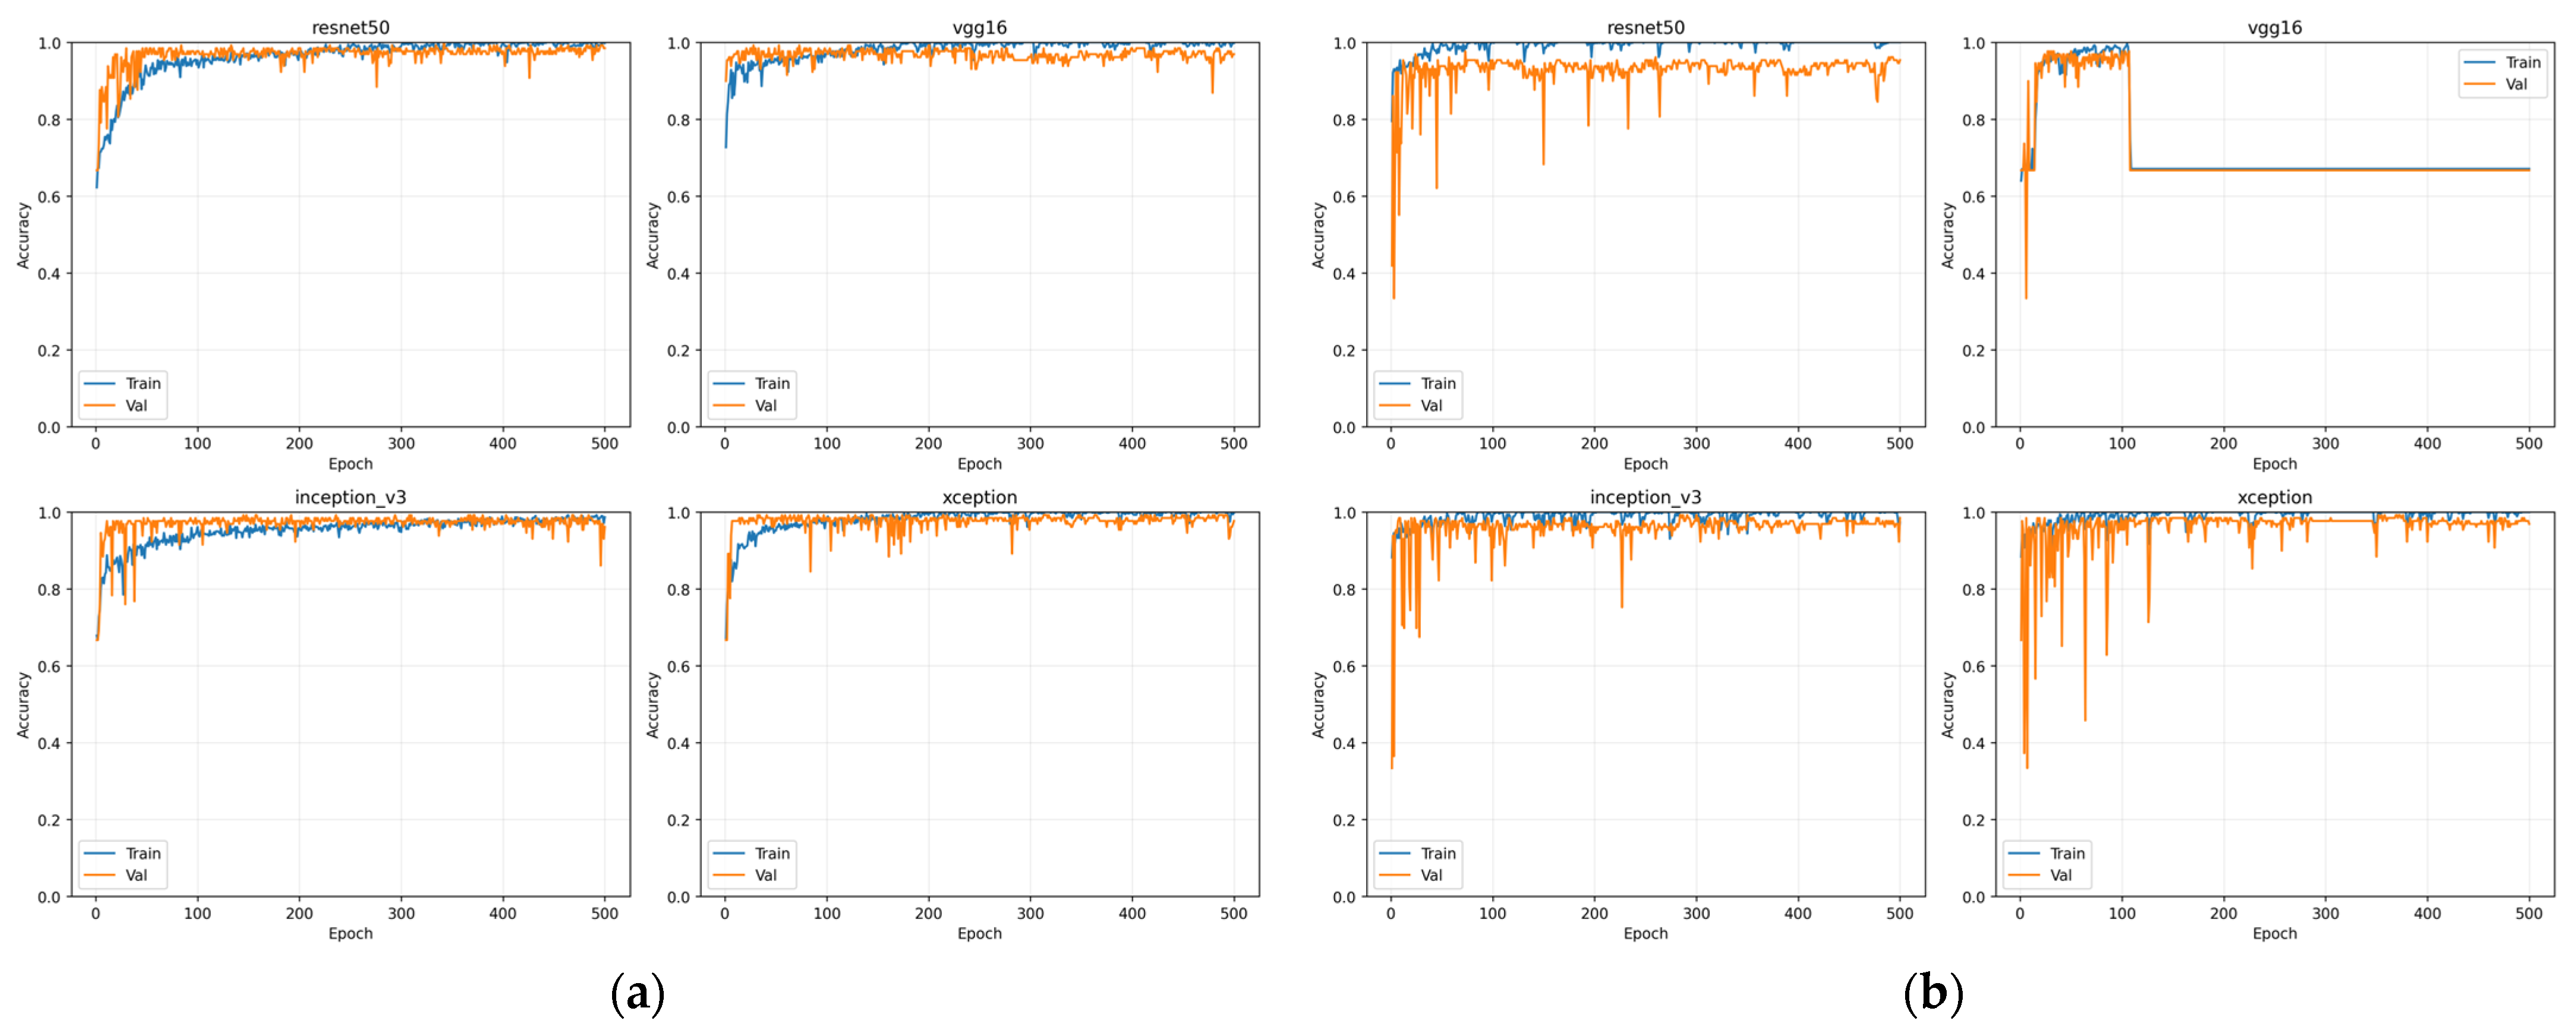
Figure 5 presents learning curves for each architecture separately in a 2 × 2 layout. These plots make the difference clearer: baseline training shows fluctuations in validation accuracy and occasional instability, especially for VGG16 and ResNet50. With preprocessing and weight decay, convergence becomes monotonic and stable.
Figure 5.
Learning curves under different training protocols. (a) Training and validation accuracy obtained with anatomical preprocessing and L2 regularization; (b) training and validation accuracy under the baseline reproduction protocol without additional preprocessing or regularization.
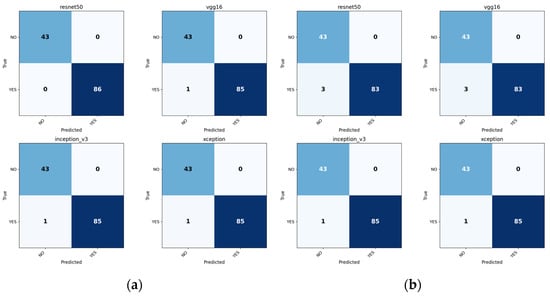
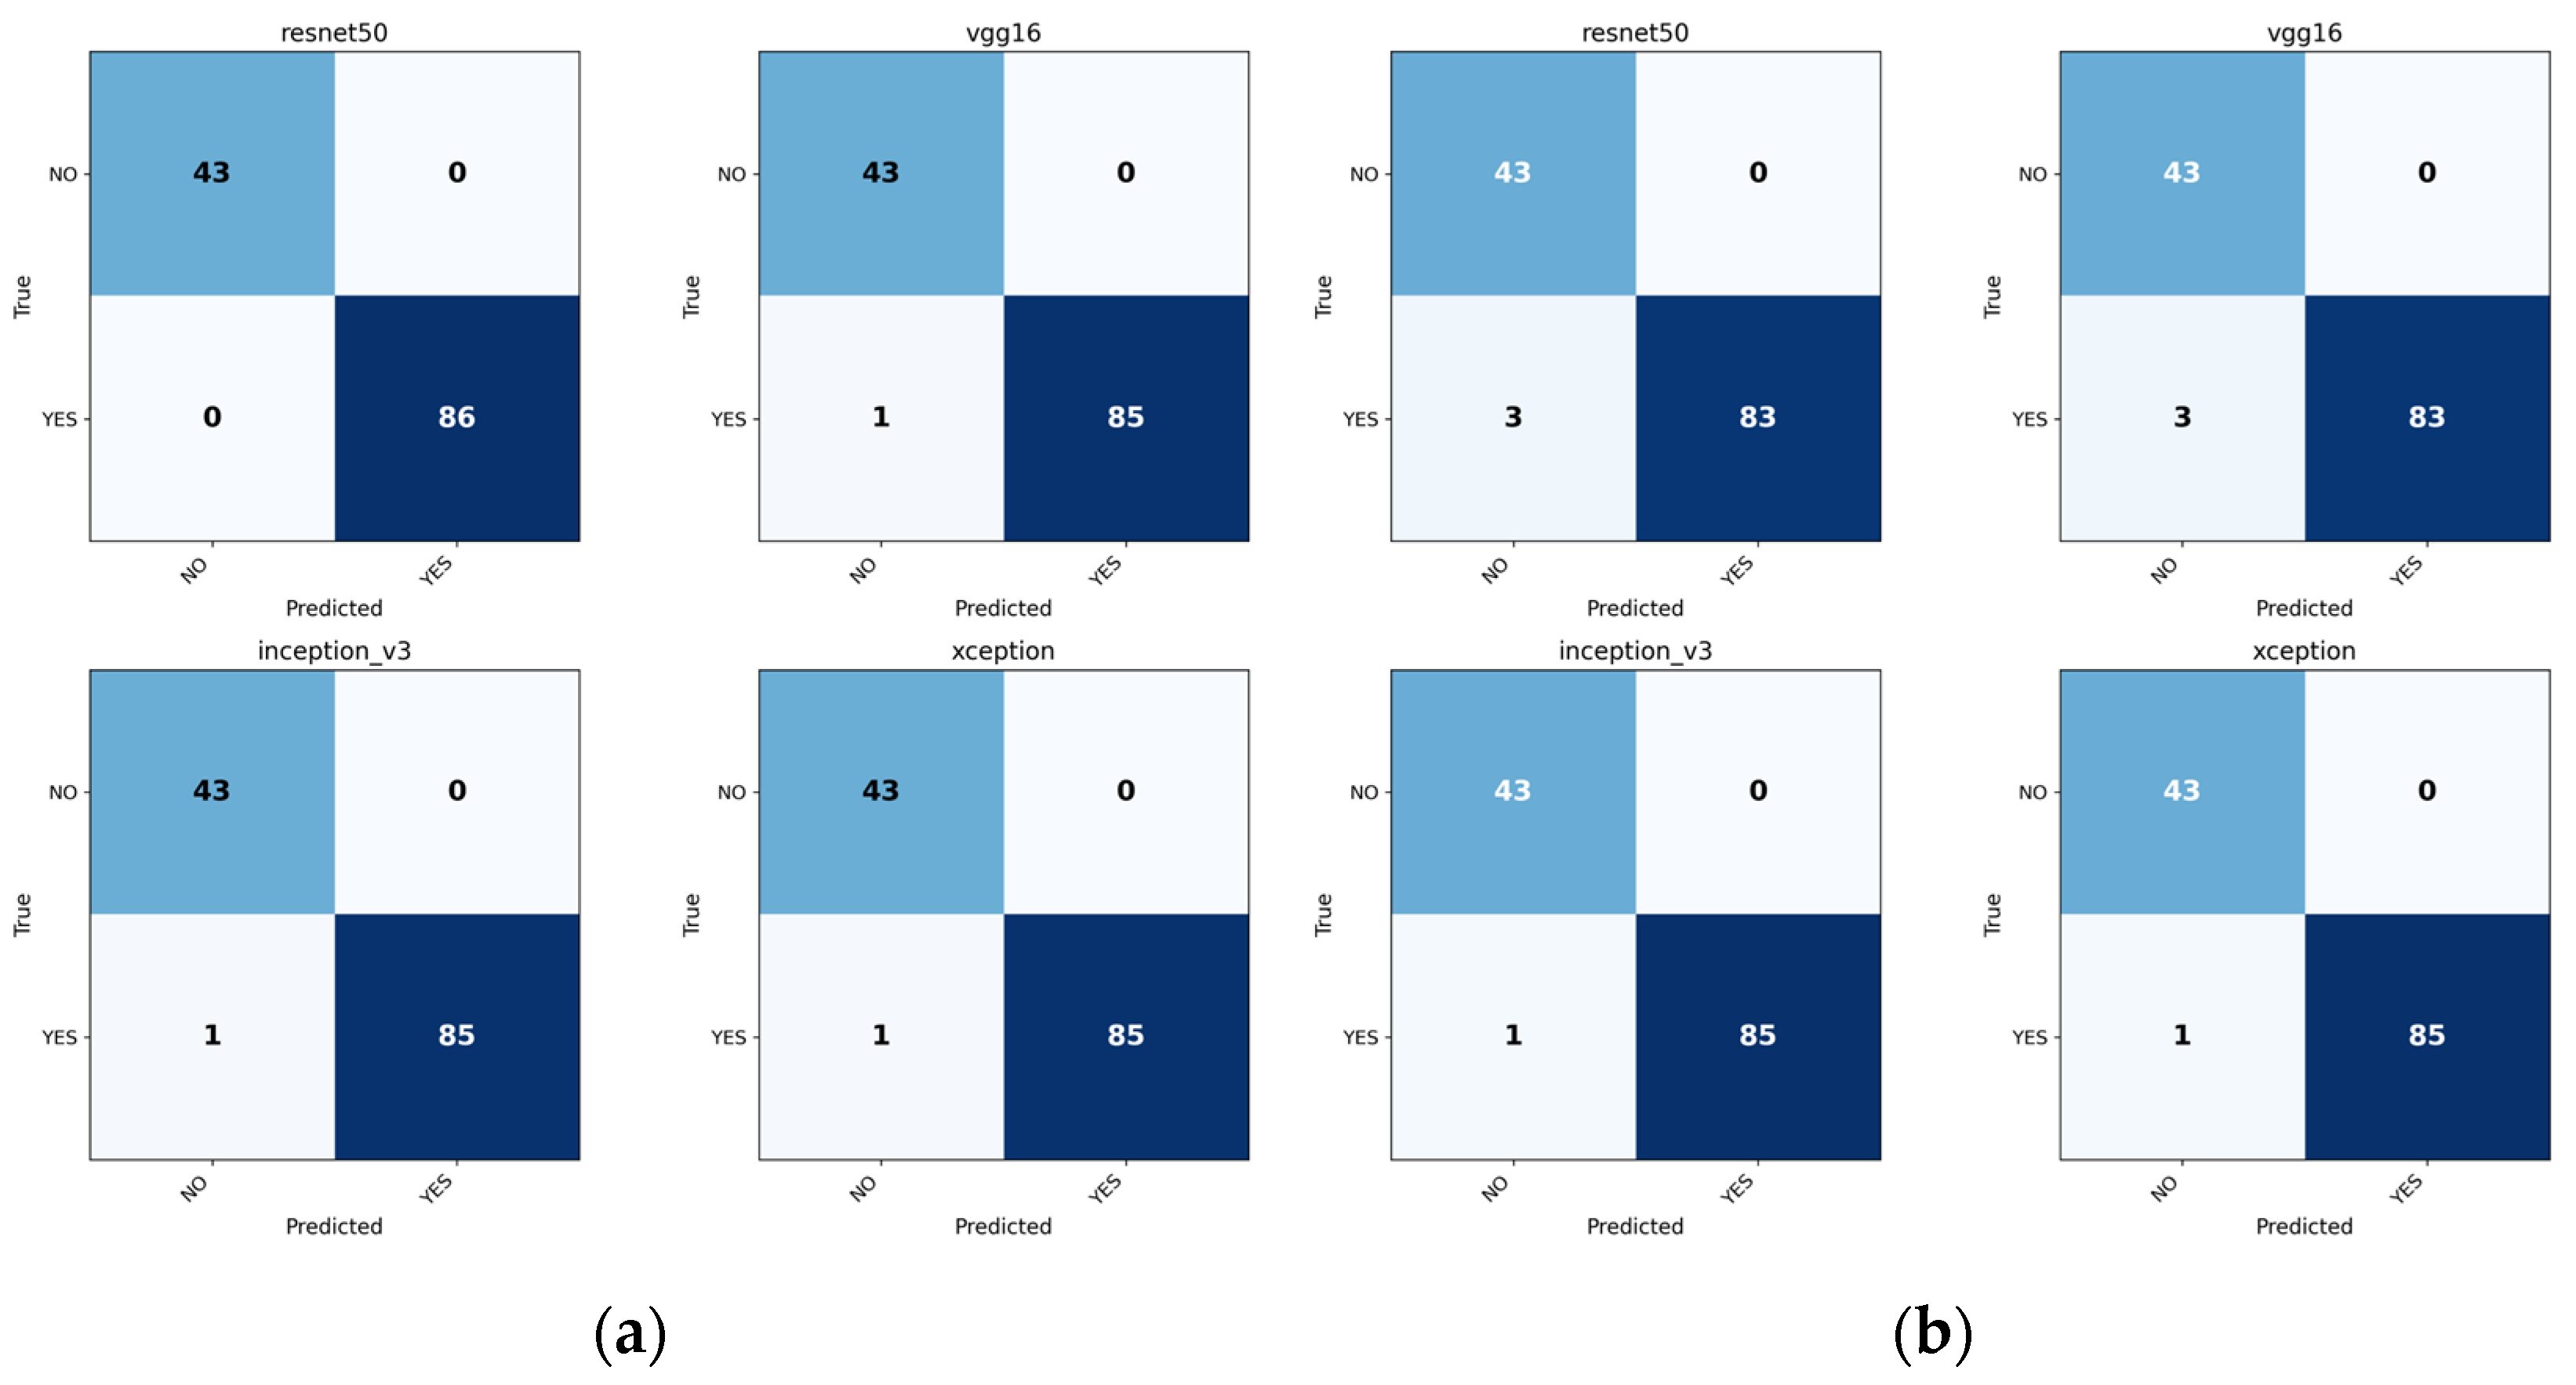
Figure 6 shows confusion matrices under optimized training. Misclassifications are rare, and false negatives are minimized compared to baseline training.
Figure 6.
Confusion matrices for the PPMI-PD (Small) dataset. (a) Predictions obtained using the optimized training protocol; (b) predictions obtained under baseline training conditions.
Figure 7 presents calibration curves. Predictions under optimized training are closer to the diagonal, consistent with lower ECE values reported in Table 5.
Figure 7.
Reliability diagrams for CNN architectures. (a) Calibration under optimized training; (b) calibration under baseline training.
Figure 8 shows confidence histograms for correctly and incorrectly classified samples. Under optimized training, incorrect predictions tend to receive lower confidence, indicating better probabilistic behavior.
Figure 8.
Confidence histograms for correctly and incorrectly classified samples. (a) Confidence distribution under optimized training; (b) confidence distribution under baseline training.
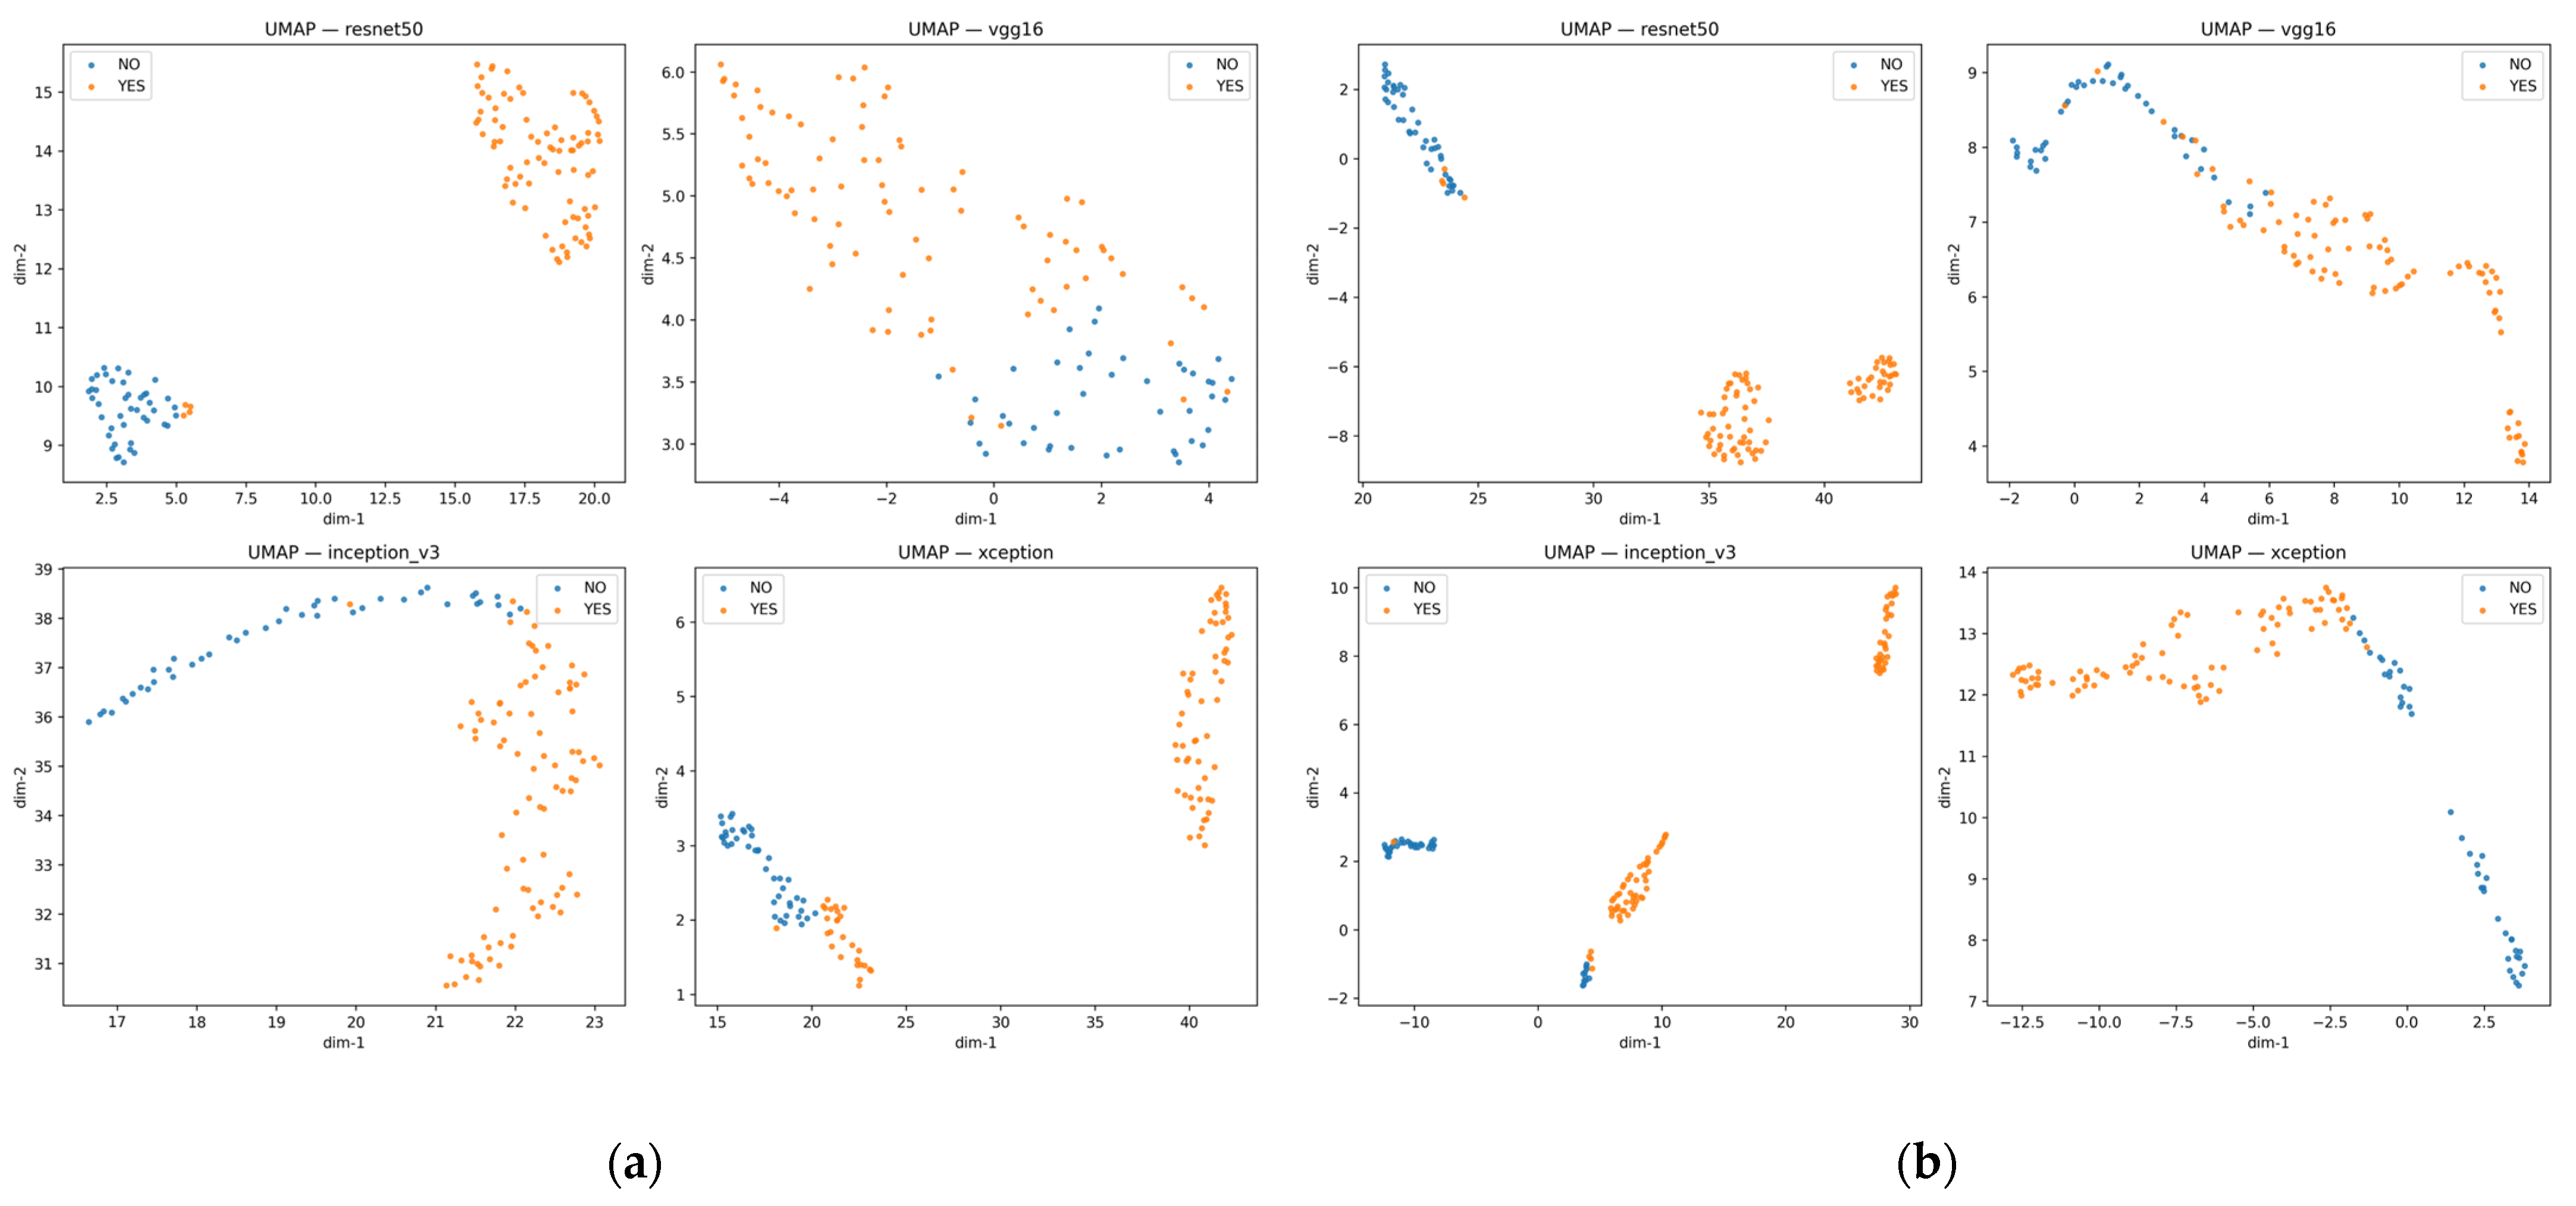
Figure 9 shows UMAP projections of learned feature embeddings. After preprocessing, intra-class clustering becomes tighter and inter-class separation becomes more structured.
Figure 9.
UMAP projections of learned feature embeddings. (a) Embeddings obtained after structured preprocessing and regularization; (b) embeddings obtained under baseline training; samples labeled “YES” correspond to Parkinson’s disease (PD), and samples labeled “NO” correspond to Non-PD.
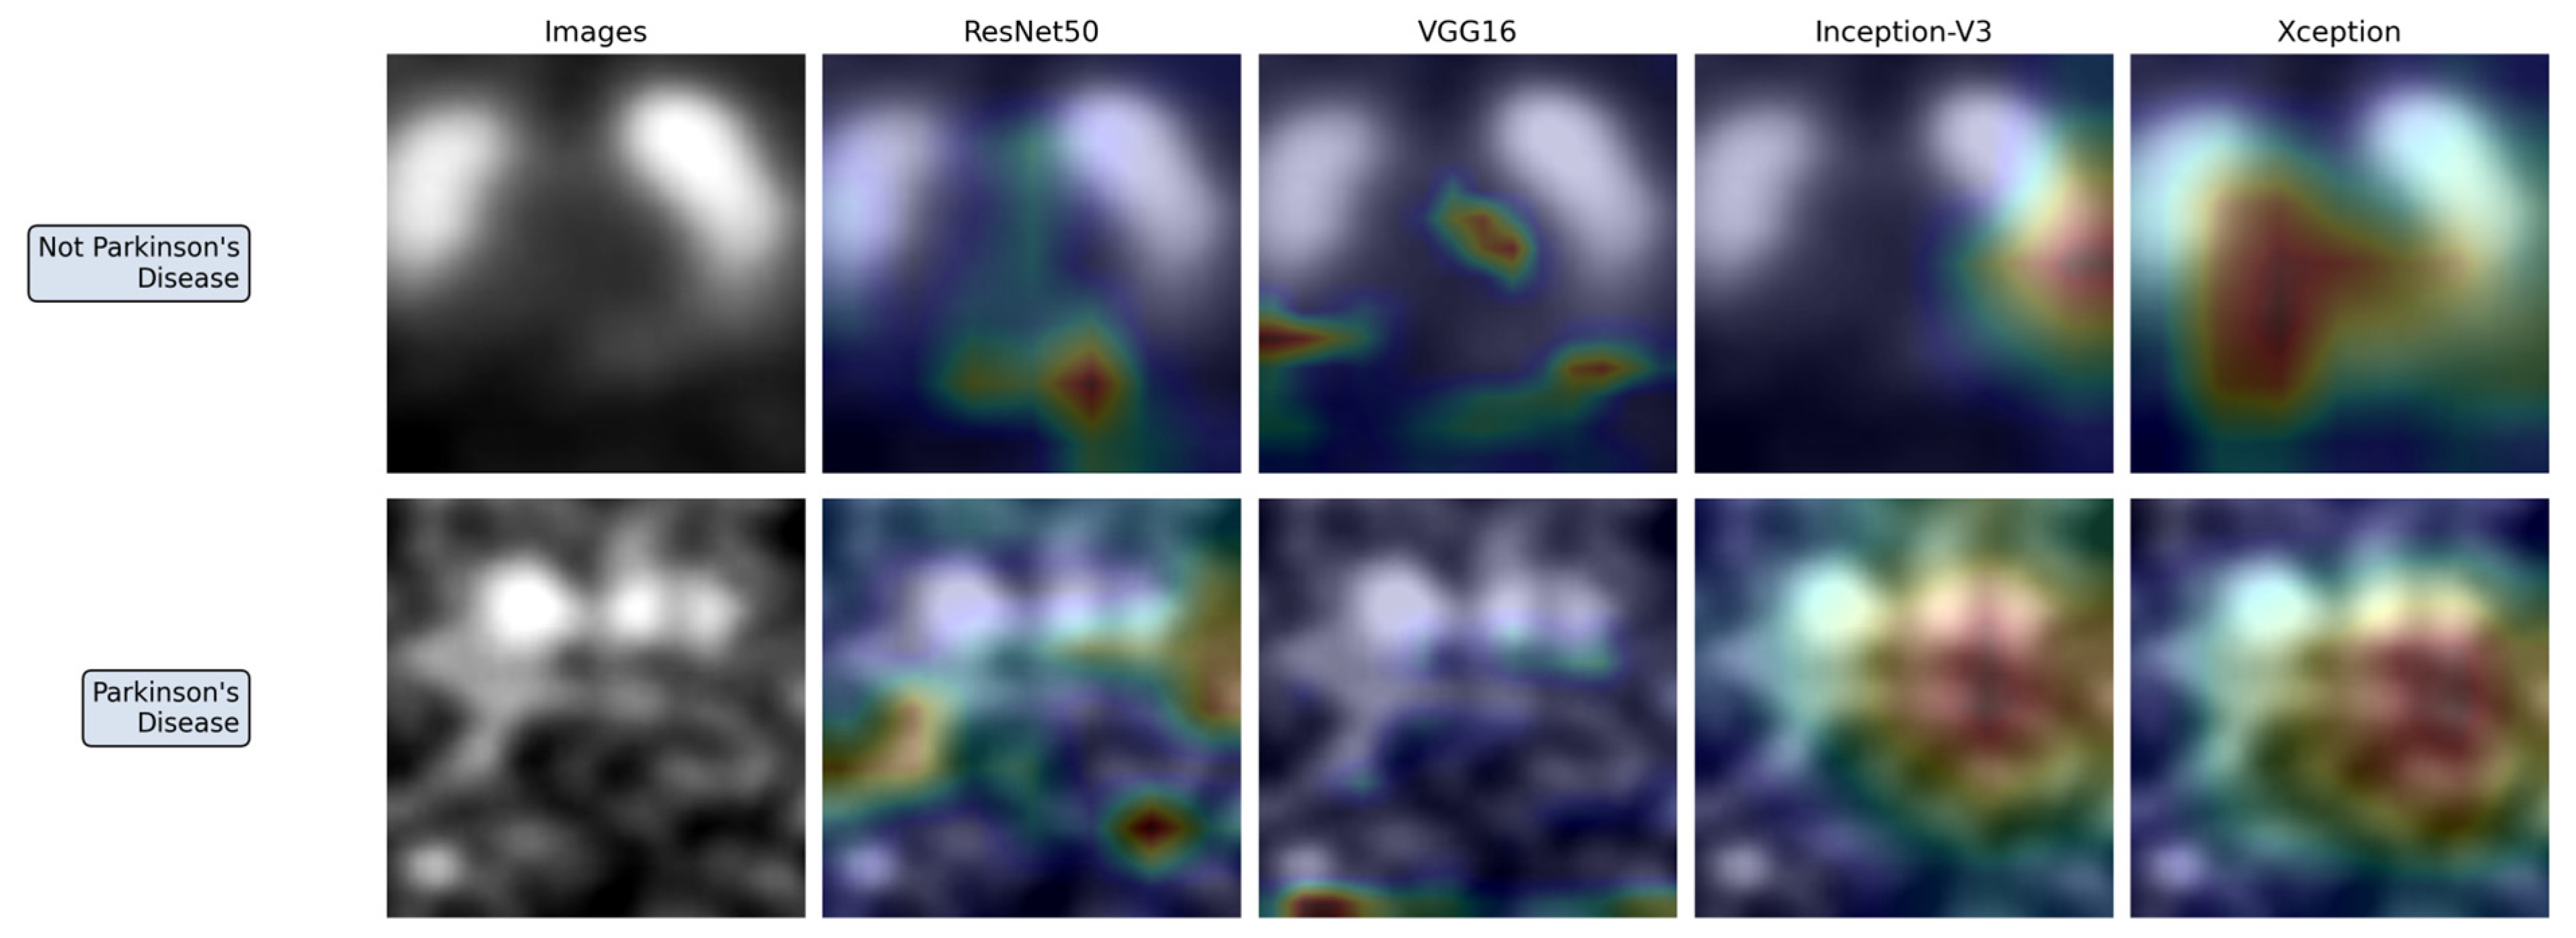
Figure 10 presents Grad-CAM visualizations for representative correctly classified samples under the optimized configuration. Activation maps consistently concentrate in striatal regions, particularly the putamen and caudate areas, which are clinically relevant in dopaminergic degeneration. These maps suggest that the network focuses on anatomically meaningful regions rather than diffuse background patterns.
Figure 10.
Grad-CAM visualizations of representative samples.
Transfer learning was intentionally excluded from PPMI-PD (Small) dataset. Preliminary experiments showed that pretrained ImageNet weights produced unstable convergence and, in some cases, inferior results compared to random initialization. Given the relatively small dataset size, pretrained feature priors likely did not align with SPECT intensity distributions. Therefore, PPMI-PD (Small) dataset comparisons were performed using randomly initialized backbones to isolate the effect of preprocessing and regularization.
PPMI-PD (Small) dataset demonstrates that protocol optimization improves convergence behavior, calibration quality, and representation structure even when discrimination performance is already high.
4.2. PPMI-PD (Large): Comparison with Dimensionality-Reduction-Based Approach
In PPMI-PD (Large) dataset, performance was evaluated across three binary tasks:
- PD vs. Non-PD;
- PD vs. SWEDD;
- PD vs. Control.
Previously published results on this dataset are summarized in Table 6.
Table 6.
Previously reported results using dimensionality-reduction-based classification on the PPMI-PD (Large) dataset.
Importantly, the prior study did not use ensemble fusion. Instead, it applied dimensionality reduction before classification. Specifically, an autoencoder was used to compress high-dimensional SPECT features into an 8-dimensional latent representation. The encoder compressed the input, and the decoder reconstructed it. The bottleneck layer output was then used as a reduced-dimensional feature vector for subsequent machine learning classification.
The authors hypothesized that dimensionality reduction was necessary to handle redundancy and high dimensionality in SPECT data. They compared models with and without reduction techniques such as autoencoders and PCA and reported improved performance when dimensionality reduction was applied. The following sections compare our CNN-based training protocol to that dimensionality-reduction-based approach.
4.2.1. PD vs. Non-PD
Table 7 shows that under preprocessing and regularization with transfer learning, Xception achieved 0.980 accuracy and 0.991 AUROC. Inception-V3 achieved 0.976 accuracy.
Table 7.
Non-PD classification with optimized training protocol and transfer learning.
As shown in Table 8, when transfer learning was removed but preprocessing was retained, performance remained stable for ResNet50 and Inception-V3.
Table 8.
Non-PD classification without transfer learning.
According to Table 9, without preprocessing and regularization, performance decreased, particularly for VGG16, whereas Xception maintained comparatively more stable performance under these conditions. Notably, ECE should be interpreted jointly with discrimination metrics: a low ECE can occur even for a poorly performing classifier if predicted probabilities are systematically conservative.
Table 9.
Non-PD classification under baseline training (no preprocessing or regularization).
4.2.2. PD vs. SWEDD
Table 10 shows that with preprocessing and regularization but without transfer learning, VGG16 achieved 0.979 accuracy and 0.981 AUROC, while ResNet50 reached 0.975 accuracy.
Table 10.
PD vs. SWEDD classification with optimized preprocessing and regularization.
Baseline training without preprocessing led to performance degradation, particularly for VGG16, as shown in Table 11.
Table 11.
PD vs. SWEDD classification under baseline training.
In Table 12, the introduction of transfer learning improved performance for VGG16 compared with the baseline configuration, but it led to a slight decrease in performance for the Xception architecture.
Table 12.
PD vs. SWEDD classification with transfer learning.
In Table 6, the dimensionality-reduction-based approach demonstrated lower AUROC and accuracy values for this subgroup, indicating that the optimized CNN models outperform the feature-compression pipeline.
4.2.3. PD vs. Control
Table 13 shows that with preprocessing, all CNN architectures achieved perfect discrimination with accuracy and AUROC equal to 1.0.
Table 13.
PD vs. Control classification with optimized training protocol.
Even without transfer learning, performance remained saturated in Table 14.
Table 14.
PD vs. Control classification without transfer learning.
However, the baseline configuration reported in Table 15 demonstrated substantially lower performance for ResNet50 and VGG16.
Table 15.
PD vs. Control classification under baseline training.
The dimensionality-reduction approach presented in Table 6 achieved lower performance values and did not reach perfect discrimination. Its results were inferior to the optimized CNN models and outperformed only the baseline VGG16 configuration.
These findings indicate that explicit compression to an 8-dimensional latent representation is not required to achieve high discrimination in this setting when the training protocol is properly optimized. Furthermore, the applied training strategies enabled consistent achievement of accuracy equal to 1.0 across different datasets, clearly demonstrating improved performance. Importantly, even older architectures achieved strong results under the optimized training conditions.
5. Discussion
This study examined whether performance gains in DaT-SPECT-based Parkinson’s disease classification are primarily attributable to CNN architecture or to training protocol design. Across both datasets, the results indicate that structured training strategies play a more decisive role than architectural variation.
The training protocol used in this study was not the result of exhaustive hyperparameter optimization, but rather a structured combination of commonly adopted practices, including data augmentation, transfer learning, weight decay, and learning rate scheduling. The same protocol was applied consistently across all architectures to ensure a controlled comparison and isolate the effect of training design from architectural differences.
On the smaller PPMI-PD cohort, baseline reproduction already yielded high classification accuracy. However, introducing anatomical preprocessing and weight decay led to measurable improvements in calibration and convergence stability. ResNet50 improved from 0.9767 to perfect discrimination after protocol optimization. This suggests that the observed performance differences may be more strongly related to training dynamics than to representational limitations of the backbone architecture.
On the larger dataset, comparison with the dimensionality-reduction-based approach is especially informative. The prior study assumed that compressing high-dimensional SPECT data into an 8-dimensional latent space was necessary to mitigate redundancy. The present results, however, indicate that explicit compression is not required when the training protocol is carefully controlled. Direct end-to-end CNN training with appropriate regularization achieved comparable or superior performance without dimensionality reduction. This indicates that modern CNNs can learn compact and discriminative representations under well-defined optimization constraints.
Transfer learning did not provide uniform benefit across architectures. While it improved stability for VGG16 in certain configurations, its effect on Xception was inconsistent. This observation further supports the central hypothesis of this study: performance differences are not solely determined by architectural design, but are strongly influenced by how models are trained and optimized under specific data conditions.
The PD vs. Control task reached saturated performance across architectures under optimized training. Although this confirms strong discriminability between advanced dopaminergic degeneration and healthy controls, it also suggests that this binary task may be comparatively less challenging than clinically ambiguous settings such as PD vs. SWEDD. The latter demonstrated greater sensitivity to protocol design, underscoring the importance of carefully controlled training procedures in borderline diagnostic scenarios. From a clinical perspective, this observation is particularly relevant. In screening-oriented scenarios, sensitivity is often more critical than overall accuracy, as missed diagnoses may delay treatment. Therefore, the sensitivity–specificity trade-off should be carefully considered, especially in borderline cases such as PD vs. SWEDD.
Reliability analysis further supports the importance of protocol optimization. Reduced expected calibration error and more conservative confidence behavior for misclassified samples indicate improved probabilistic consistency. In clinical decision-support systems, such reliability characteristics are critical. Overconfident incorrect predictions may undermine trust more than modest reductions in overall accuracy. Well-calibrated probabilistic predictions are essential for clinical deployment, as they directly influence decision confidence and physician trust in AI-assisted systems. Visualization techniques such as Grad-CAM were used to qualitatively assess spatial attention patterns, providing partial insight into model behavior beyond purely numerical metrics. While these approaches do not fully eliminate the black-box nature of CNNs, they contribute to improving transparency and trust in model predictions.
From a practical perspective, the optimized single-model CNN also offers advantages in computational efficiency and deployment simplicity. Unlike ensemble-based approaches that require multiple backbone networks and fusion strategies at inference time, the proposed configuration maintains lower computational cost and reduced memory requirements while achieving comparable performance. This simplification facilitates validation, reduces inference latency, and supports integration into resource-constrained clinical environments. Beyond domain-specific approaches, recent advances in medical image analysis have introduced more complex architectures, including transformer-based models and hybrid approaches that combine convolutional and relational modeling. For example, spatial-channel collaborative multi-scale graph interaction frameworks integrate CNN-based feature extraction with graph neural networks to model relationships between data samples and improve generalization [18]. Such hybrid CNN–graph approaches highlight the growing importance of relational modeling in deep learning. However, they also increase architectural complexity, whereas the present study focuses on isolating the effect of training protocol design under controlled conditions. This is particularly important in clinical environments, where computational constraints and integration requirements often limit the feasibility of more complex architectures.
Several limitations should be acknowledged. The SWEDD subset remains relatively small, which may increase variance in PD vs. SWEDD performance estimates and affect statistical reliability. Both datasets were evaluated using 2D slice-based representations rather than full 3D volumes, potentially limiting volumetric context. While this choice was made to ensure comparability with prior work and reduce computational complexity, it may restrict anatomical completeness. External multi-center validation was not performed. Variability across acquisition sites, scanners, and imaging protocols may affect generalization performance and should be addressed in future studies.
A detailed ablation study quantifying the individual contribution of each component of the training protocol was not conducted, as the primary objective was to evaluate the combined effect of a unified training strategy. However, such analysis would provide additional insights and is considered an important direction for future work.
Although the present study focuses on empirical performance analysis, integration with physics-based or hybrid modeling approaches may further improve robustness and interpretability. This direction was not explored in the current work and remains an important area for future research.
Furthermore, extensions to transformer-based models, multimodal approaches, and physics-informed methods remain important directions for future investigation.
Taken together, these observations suggest that methodological rigor in training design may be more impactful than architectural novelty in small- to medium-scale neuroimaging studies.
6. Conclusions
This work demonstrates that training protocol design exerts a stronger influence on DaT-SPECT-based Parkinson’s disease classification performance than the selection of CNN architecture. Structured preprocessing, regularization, and learning-rate scheduling consistently improved discrimination, calibration, and representation quality across datasets. Explicit dimensionality reduction and ensemble fusion were not required to achieve high performance. Optimized single-model CNNs matched or exceeded previously reported ensemble and compression-based approaches while reducing computational complexity and simplifying deployment. These findings emphasize the importance of careful protocol design and controlled experimentation in medical image classification, particularly for small to moderately sized neuroimaging datasets. The findings of this study are primarily applicable to 2D DaT-SPECT classification tasks using small- to medium-sized datasets and standard CNN architectures.
This study has several limitations. First, the use of 2D representations may limit the ability to capture full volumetric information compared to 3D approaches. Second, the dataset size, particularly for the SWEDD class, remains relatively limited, which may affect statistical robustness. Third, external multi-center validation was not performed, and therefore generalization across scanners and acquisition protocols remains to be established.
Future work will focus on extending the proposed framework to 3D and multi-slice inputs, validating the approach on larger and multi-center datasets, and exploring integration with more advanced architectures, including hybrid CNN–graph and transformer-based models.
Author Contributions
Conceptualization, D.C. and K.S.; methodology, D.C., T.S. and R.S.; software, D.C.; validation, D.C., T.S. and K.N.; formal analysis, D.C.; investigation, D.C. and L.H.; resources, T.S., K.N. and K.S.; data curation, D.C. and L.H.; writing—original draft preparation, D.C.; writing—review and editing, D.C., L.H., R.S., T.S., K.N. and K.S.; visualization, D.C.; supervision, K.S.; project administration, D.C. All authors have read and agreed to the published version of the manuscript.
Funding
This research received no external funding.
Data Availability Statement
Dataset used here is a public one.
Conflicts of Interest
The authors declare no conflicts of interest.
Abbreviations
The following abbreviations are used in this manuscript:
| PD | Parkinson’s disease |
| SPECT | Single-photon emission computed tomography |
| DaT-SPECT | Dopamine transporter SPECT imaging |
| PPMI | Parkinson’s Progression Markers Initiative |
| CNN | Convolutional neural network |
| AUROC | Area under the receiver operating characteristic curve |
| ECE | Expected calibration error |
| TP | True positive |
| TN | True negative |
| FP | False positive |
| FN | False negative |
| F1 | F1-score |
| UMAP | Uniform Manifold Approximation and Projection |
| L2 | L2 regularization |
| RBF | Radial basis function |
| ANN | Artificial neural network |
| MRI | Magnetic resonance imaging |
| SWEDD | Scans Without Evidence of Dopaminergic Deficit |
References
- Poewe, W.; Seppi, K.; Tanner, C.M.; Halliday, G.M.; Brundin, P.; Volkmann, J.; Schrag, A.E.; Lang, A.E. Parkinson disease. Nat. Rev. Dis. Primers 2017, 3, 17013. [Google Scholar] [CrossRef] [Scilit] [PubMed]
- Akdemir, Ü.Ö.; Tokçaer, A.B.; Atay, L.Ö. Dopamine transporter SPECT imaging in Parkinson’s disease and parkinsonian disorders. Turk. J. Med. Sci. 2021, 51, 400–410. [Google Scholar] [CrossRef] [Scilit] [PubMed]
- Kurmi, A.; Biswas, S.; Sen, S.; Sinitca, A.; Kaplun, D.; Sarkar, R. An Ensemble of CNN Models for Parkinson’s Disease Detection Using DaTscan Images. Diagnostics 2022, 12, 1173. [Google Scholar] [CrossRef] [Scilit] [PubMed]
- Marek, K.; Jennings, D.; Lasch, S.; Siderowf, A.; Tanner, C.; Simuni, T.; Coffey, C.; Kieburtz, K.; Flagg, E.; Chowdhury, S.; et al. The Parkinson Progression Marker Initiative (PPMI). Prog. Neurobiol. 2011, 95, 629–635. [Google Scholar] [CrossRef] [Scilit] [PubMed]
- Prashanth, R.; Roy, S.D.; Mandal, P.K.; Ghosh, S. High-Accuracy Classification of Parkinson’s Disease through Shape Analysis and Surface Fitting in 123I-Ioflupane SPECT Imaging. IEEE J. Biomed. Health Inform. 2017, 21, 794–802. [Google Scholar] [CrossRef] [Scilit] [PubMed]
- Brahim, A.; Khedher, L.; Górriz, J.M.; Ramírez, J.; Toumi, H.; Lespessailles, E.; Jennane, R.; El Hassouni, M. A Proposed Computer-Aided Diagnosis System for Parkinson’s Disease Classification Using 123I-FP-CIT Imaging. In Proceedings of the International Conference on Advanced Technologies for Signal and Image Processing (ATSIP), Fez, Morocco, 22–24 May 2017; IEEE: Piscataway, NJ, USA, 2017; pp. 1–6. [Google Scholar] [CrossRef] [Scilit]
- Challa, K.N.R.; Pagolu, V.S.; Panda, G.; Majhi, B. An Improved Approach for Prediction of Parkinson’s Disease Using Machine Learning Techniques. In Proceedings of the International Conference on Signal Processing, Communication, Power and Embedded System (SCOPES), Paralakhemundi, India, 3–5 October 2016; IEEE: Piscataway, NJ, USA, 2016; pp. 1446–1451. [Google Scholar] [CrossRef] [Scilit]
- Castillo-Barnes, D.; Ramírez, J.; Segovia, F.; Martínez-Murcia, F.J.; Salas-Gonzalez, D.; Górriz, J.M. Robust Ensemble Classification Methodology for I123-Ioflupane SPECT Images and Multiple Heterogeneous Biomarkers in the Diagnosis of Parkinson’s Disease. Front. Neuroinform. 2018, 12, 53. [Google Scholar] [CrossRef] [Scilit] [PubMed]
- Martínez-Murcia, F.J.; Ortiz, A.; Górriz, J.M.; Ramírez, J.; Segovia, F.; Salas-Gonzalez, D.; Castillo-Barnes, D.; Illán, I.A. A 3D Convolutional Neural Network Approach for the Diagnosis of Parkinson’s Disease. In International Work-Conference on the Interplay Between Natural and Artificial Computation (IWINAC 2017); Lecture Notes in Computer Science; Springer: Cham, Switzerland, 2017; Volume 10337, pp. 324–333. [Google Scholar] [CrossRef] [Scilit]
- Wenzel, M.; Milletari, F.; Krüger, J.; Lange, C.; Schenk, M.; Apostolova, I.; Klutmann, S.; Ehrenburg, M.; Buchert, R. Automatic Classification of Dopamine Transporter SPECT: Deep Convolutional Neural Networks Can Be Trained to Be Robust with Respect to Variable Image Characteristics. Eur. J. Nucl. Med. Mol. Imaging 2019, 46, 2800–2811. [Google Scholar] [CrossRef] [Scilit] [PubMed]
- Ortiz, A.; Munilla, J.; Martínez-Ibañez, M.; Górriz, J.M.; Ramírez, J.; Salas-Gonzalez, D. Parkinson’s Disease Detection Using Isosurfaces-Based Features and Convolutional Neural Networks. Front. Neuroinform. 2019, 13, 48. [Google Scholar] [CrossRef] [Scilit] [PubMed]
- Choi, H.; Ha, S.; Im, H.J.; Paek, S.H.; Lee, D.S. Refining Diagnosis of Parkinson’s Disease with Deep Learning-Based Interpretation of Dopamine Transporter Imaging. NeuroImage Clin. 2017, 16, 586–594. [Google Scholar] [CrossRef] [Scilit] [PubMed]
- Kim, D.H.; Wit, H.; Thurston, M. Artificial Intelligence in the Diagnosis of Parkinson’s Disease from Ioflupane-123 SPECT Dopamine Transporter Scans Using Transfer Learning. Nucl. Med. Commun. 2018, 39, 887–893. [Google Scholar] [CrossRef] [Scilit] [PubMed]
- Keles, A.; Keles, A.; Keles, M.B.; Okatan, A. PARNet: Deep Neural Network for the Diagnosis of Parkinson’s Disease. Multimed. Tools Appl. 2024, 83, 35781–35793. [Google Scholar] [CrossRef] [Scilit]
- Thakur, M.; Kuresan, H.; Dhanalakshmi, S.; Lai, K.W.; Wu, X. Soft Attention Based DenseNet Model for Parkinson’s Disease Classification Using SPECT Images. Front. Aging Neurosci. 2022, 14, 908143. [Google Scholar] [CrossRef] [Scilit] [PubMed]
- Chien, C.Y.; Hsu, S.W.; Lee, T.L.; Sung, P.S.; Lin, C.C. Using Artificial Neural Network to Discriminate Parkinson’s Disease from Other Parkinsonisms by Focusing on Putamen of Dopamine Transporter SPECT Images. Biomedicines 2021, 9, 12. [Google Scholar] [CrossRef] [Scilit] [PubMed]
- Kollia, I.; Stafylopatis, A.G.; Kollias, S. Predicting Parkinson’s Disease Using Latent Information Extracted from Deep Neural Networks. arXiv 2019, arXiv:1901.07822. [Google Scholar]
- Wang, X.; Jiang, H.; Dong, Y.; Mu, M. Spatial-Channel Collaborative Multi-Scale Graph Interaction Deep Transfer Learning for Unsupervised Rotating Machinery Fault Diagnosis. Eng. Appl. Artif. Intell. 2026, 176, 114691. [Google Scholar] [CrossRef] [Scilit]
- Simonyan, K.; Zisserman, A. Very Deep Convolutional Networks for Large-Scale Image Recognition. arXiv 2014, arXiv:1409.1556. [Google Scholar]
- He, K.; Zhang, X.; Ren, S.; Sun, J. Deep Residual Learning for Image Recognition. In Proceedings of the 2016 IEEE Conference on Computer Vision and Pattern Recognition (CVPR), Las Vegas, NV, USA, 27–30 June 2016; IEEE: Piscataway, NJ, USA, 2016; pp. 770–778. [Google Scholar] [CrossRef] [Scilit]
- Szegedy, C.; Vanhoucke, V.; Ioffe, S.; Shlens, J.; Wojna, Z. Rethinking the Inception Architecture for Computer Vision. In Proceedings of the 2016 IEEE Conference on Computer Vision and Pattern Recognition (CVPR), Las Vegas, NV, USA, 27–30 June 2016; IEEE: Piscataway, NJ, USA, 2016; pp. 2818–2826. [Google Scholar] [CrossRef] [Scilit]
- Chollet, F. Xception: Deep Learning with Depthwise Separable Convolutions. In Proceedings of the 2017 IEEE Conference on Computer Vision and Pattern Recognition (CVPR), Honolulu, HI, USA, 21–26 July 2017; IEEE: Piscataway, NJ, USA, 2017; pp. 1251–1258. [Google Scholar] [CrossRef] [Scilit]
- Kingma, D.P.; Ba, J. Adam: A Method for Stochastic Optimization. arXiv 2014, arXiv:1412.6980. [Google Scholar]
- Loshchilov, I.; Hutter, F. SGDR: Stochastic Gradient Descent with Warm Restarts. arXiv 2016, arXiv:1608.03983. [Google Scholar]
- Parkinson’s Progression Markers Initiative. Available online: https://www.ppmi-info.org/ (accessed on 10 October 2025).
- ParkinSIGHT: Computer Vision-Based Early Parkinson’s Detection. Available online: https://github.com/RishitToteja/ParkinSIGHT (accessed on 10 October 2025).
- Fawcett, T. An Introduction to ROC Analysis. Pattern Recognit. Lett. 2006, 27, 861–874. [Google Scholar] [CrossRef] [Scilit]
- Guo, C.; Pleiss, G.; Sun, Y.; Weinberger, K.Q. On Calibration of Modern Neural Networks. In Proceedings of the 34th International Conference on Machine Learning (ICML), Sydney, Australia, 6–11 August 2017; PMLR 2017; JMLR, Inc.: New York, NY, USA, 2017; Volume 70, pp. 1321–1330. [Google Scholar]
- Selvaraju, R.R.; Cogswell, M.; Das, A.; Vedantam, R.; Parikh, D.; Batra, D. Grad-CAM: Visual Explanations from Deep Networks via Gradient-Based Localization. In Proceedings of the 2017 IEEE International Conference on Computer Vision (ICCV), Venice, Italy, 22–29 October 2017; IEEE: Piscataway, NJ, USA, 2017; pp. 618–626. [Google Scholar] [CrossRef] [Scilit]
- McInnes, L.; Healy, J.; Saul, N.; Großberger, L. UMAP: Uniform Manifold Approximation and Projection for Dimension Reduction. J. Open Source Softw. 2018, 3, 861. [Google Scholar] [CrossRef] [Scilit]

Disclaimer/Publisher’s Note: The statements, opinions and data contained in all publications are solely those of the individual author(s) and contributor(s) and not of MDPI and/or the editor(s). MDPI and/or the editor(s) disclaim responsibility for any injury to people or property resulting from any ideas, methods, instructions or products referred to in the content. |
© 2026 by the authors. Licensee MDPI, Basel, Switzerland. This article is an open access article distributed under the terms and conditions of the Creative Commons Attribution (CC BY) license.