


Abstract
Given the expanding scale of offshore wind power development, strict spatial constraints on offshore platforms and multi-source power coupling present operational challenges during the collaborative transmission of near-shore and far-offshore wind power through a shared corridor. To address these issues, this paper proposes a collaborative transmission scheme based on the Self-Adaption Statcom and Line-Commutation Converter (SLCC). The technical and economic characteristics of three typical topologies—Modular Multilevel Converter (MMC) onshore grid connection, MMC direct transmission, and SLCC direct transmission—are compared and analyzed. The results demonstrate the advantages of the SLCC scheme in reducing the offshore platform footprint and lowering engineering costs. Furthermore, a hierarchical collaborative control strategy is designed to mitigate the power coupling between near-shore AC wind generation and far-offshore DC wind generation at the converter bus. The bottom layer utilizes a valve-side parallel Static Var Generator (SVG) to achieve reactive power self-balance and quasi-resonant suppression of specific harmonics. In the top layer, an LCC active power-following control strategy based on instantaneous power feedback is implemented. This achieves the logical decoupling of near-shore and far-offshore wind power transmission. The effectiveness of the proposed scheme in managing wind power fluctuations, riding through AC faults, and maintaining stable operation under weak grid conditions is verified using the PSCAD/EMTDC software.
1. Introduction
Driven by carbon reduction targets, offshore wind power development is expanding toward deep-water regions and large-scale clusters [1,2,3]. Due to the long electrical distances and large transmission capacities associated with far-offshore wind farms, High-Voltage Direct Current (HVDC) has become the standard transmission technology [4,5,6,7]. However, in scenarios where offshore platforms serve as aggregation hubs, offshore wind power transmission systems face strict spatial constraints [8,9,10].
Currently, Line-Commutated Converters (LCCs) are utilized widely due to their established technology and cost-effectiveness [11]. However, LCCs inherently rely on the AC grid voltage for commutation and require substantial reactive power compensation [12,13]. To satisfy reactive power and harmonic filtering requirements, LCC stations must be equipped with large AC filter banks and reactive power compensation devices. This configuration results in large and costly offshore converter platforms [14,15]. While Modular Multilevel Converters (MMCs) resolve reactive power support issues, their higher construction costs and operating losses limit their application in highly capacity-sensitive projects [16,17]. Furthermore, during the concurrent development of near-shore and far-offshore wind power, near-shore AC aggregation and far-offshore DC transmission often share a common transmission corridor. This multi-source wind power aggregation reduces the short-circuit strength of the sending-end AC system and introduces voltage fluctuations. Consequently, conventional LCCs are exposed to risks of operational instability and interrupted power transmission [18,19,20,21,22].
To address these issues, references [23,24,25,26,27,28] proposed a novel converter technology based on the Self-Adaption Statcom and Line-Commutation Converter (SLCC). The SLCC achieves reactive power self-compensation and harmonic self-suppression by integrating a Static Var Generator (SVG) directly in parallel with the valve side of the converter transformer [23]. Reference [24] demonstrated that the elimination of passive AC filter banks allows the footprint of SLCC stations to be reduced, indicating practical potential for offshore platform applications. Reference [25] established the electromagnetic transient model of the SLCC and verified its mechanism for reducing the equivalent commutation reactance and enhancing immunity to commutation failure under weak grid conditions.
However, existing research primarily focuses on the topological modeling of the SLCC unit or point-to-point transmission characteristics. Few studies have evaluated its adaptability in the specific multivariable scenario of near-shore and far-offshore wind power collaborative transmission. In this topology, near-shore AC wind power and far-offshore DC wind power aggregate at the SLCC bus. The generation fluctuations of wind power can induce power flow violations within the near-shore AC transmission channel, imposing stricter requirements on the coordinated control of active and reactive power in the SLCC.
Therefore, this manuscript proposes a collaborative transmission scheme utilizing the SLCC. First, the technical characteristics of this scheme, particularly regarding offshore platform space requirements and system economics, are compared against standard topologies. Second, to address the strong power coupling of multi-source wind integration, an active power-following control strategy based on instantaneous power feedback and a reactive power decoupling strategy are formulated to logically decouple near-shore and far-offshore wind power transmission. Finally, the dynamic performance of the proposed scheme is verified using the PSCAD/EMTDC 5.0 environment.
2. Transmission Schemes for Coexistence of Near-Shore and Far-Offshore Wind Power
As offshore wind power expands into deeper waters, the concurrent development of near-shore AC integration and far-offshore DC transmission becomes increasingly common. To evaluate the associated transmission technology routes, this section details three typical topological schemes for large-scale collaborative transmission scenarios. These schemes are subsequently compared across the dimensions of footprint, system loss, weak grid adaptability, and engineering cost.
2.1. Construction of Typical Transmission Scheme Topologies
2.1.1. Scheme 1: MMC Onshore Grid Connection Transmission Scheme
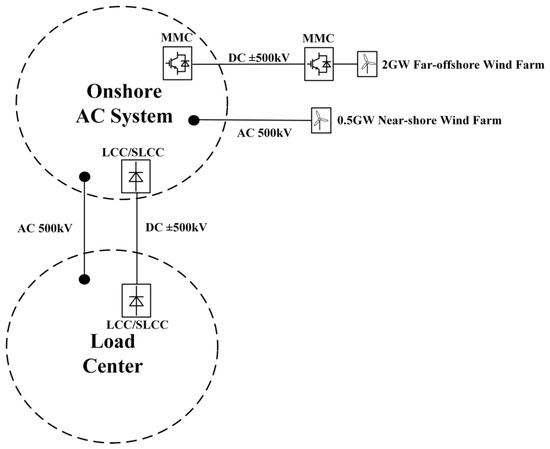
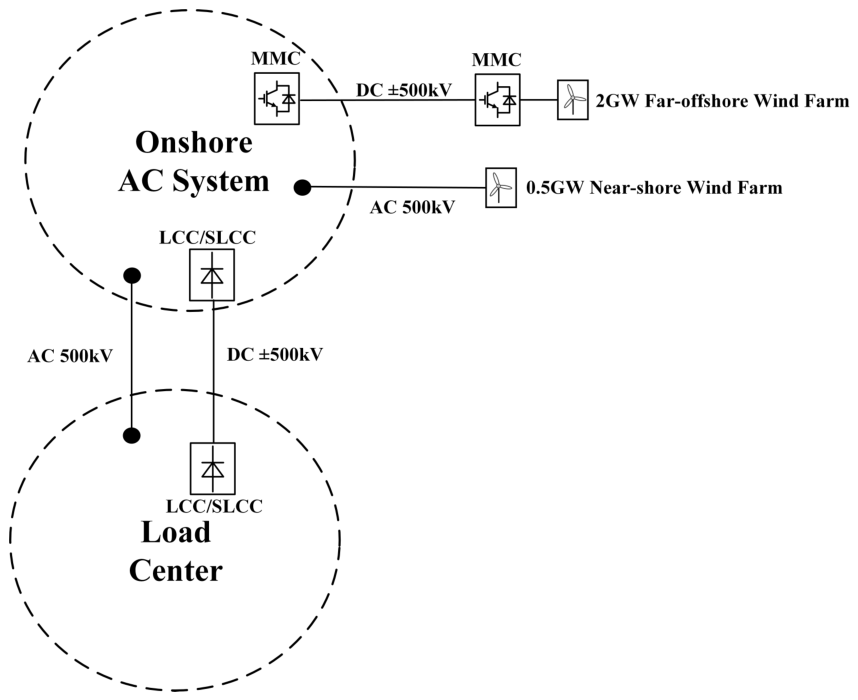
This scheme adopts a split-grid connection combined with an onshore transfer mode. The system topology is illustrated in Figure 1. Far-offshore wind power is transmitted to the shore via Voltage Source Converter-based HVDC (VSC-HVDC), while near-shore wind power is routed to the shore via AC submarine cables. After aggregating at the onshore AC hub, the power is transmitted to the remote load center via a large-capacity LCC-HVDC or SLCC-HVDC system and ultrahigh-voltage (UHV) AC lines. While this scheme relies on established technology, it involves four separate converter stations (offshore, onshore, and receiving end) and necessitates multiple “AC-DC-AC-DC-AC” energy conversions. Consequently, cascading system losses accumulate, and the onshore hub station faces power flow distribution challenges and potential corridor congestion.
Figure 1.
Topology of MMC onshore grid connection transmission system (Scheme 1).
2.1.2. Scheme 2: MMC Direct Transmission to Load Center Scheme
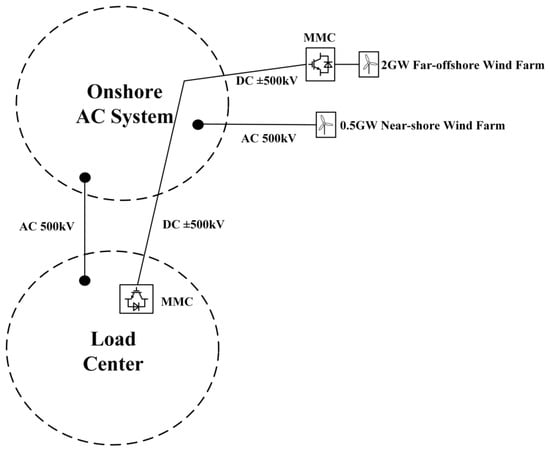
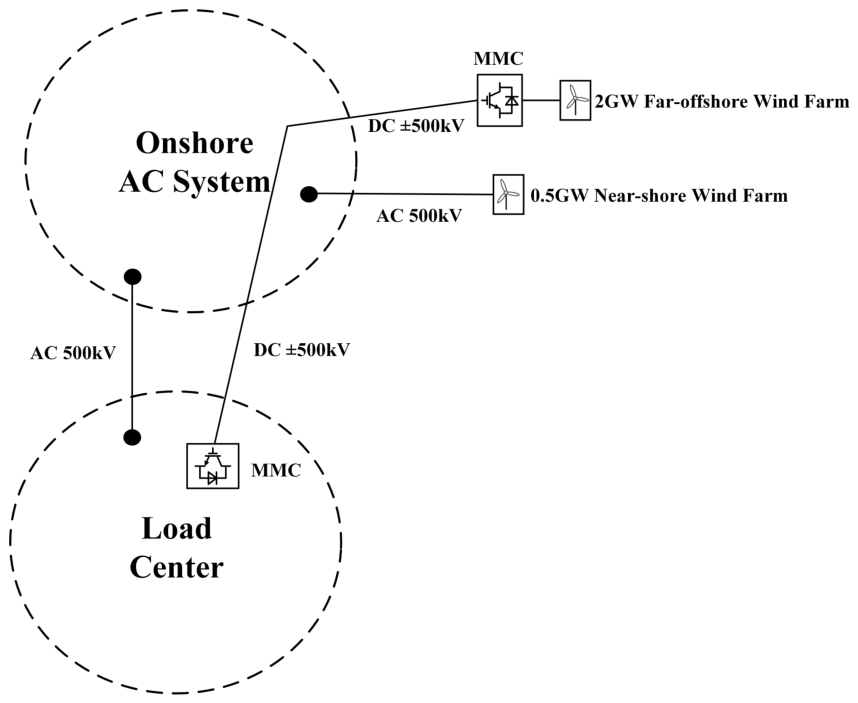
The system topology of this scheme is shown in Figure 2. Far-offshore wind power is rectified by an offshore MMC station and transmitted directly to the load center, while near-shore wind power is exported via independent AC submarine cables. The MMC possesses black-start capability and allows independent control of active and reactive power, making it technically suitable for weak AC system integration. However, the substantial volume and mass of the offshore MMC station introduce high costs for offshore platform construction, transportation, and installation. Additionally, the switching losses of IGBT devices and the required capital expenditures limit the economic competitiveness of this scheme in ultralarge-capacity scenarios.
Figure 2.
Topology of offshore wind MMC-HVDC direct transmission system (Scheme 2).
2.1.3. Scheme 3: Collaborative Direct Transmission Scheme Based on SLCC
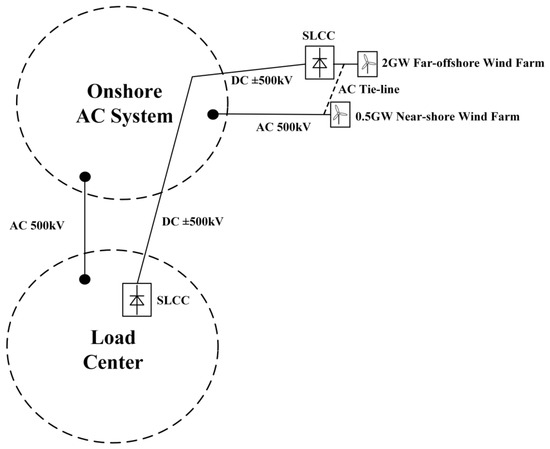
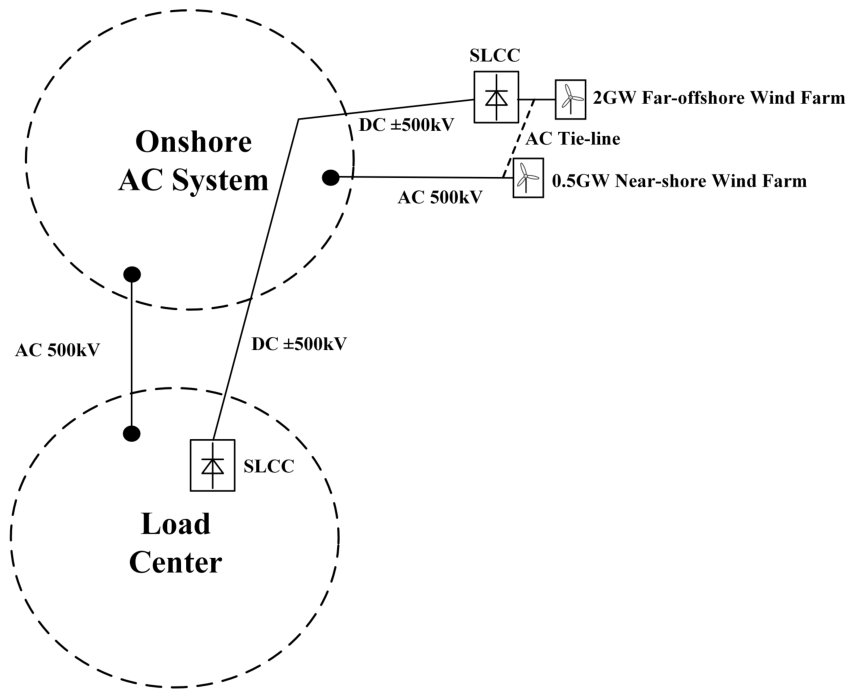
The scheme proposed in this manuscript is depicted in Figure 3. Far-offshore wind power is exported via an offshore SLCC rectifier station, and near-shore wind power is aggregated to the SLCC bus through AC tie lines. This scheme leverages SLCC technology by connecting the SVG directly in parallel to the valve side of the converter transformer. Compared with the traditional LCC, the fundamental characteristics of the SLCC scheme are:
Figure 3.
Topology of collaborative transmission system based on SLCC (Scheme 3).
- 1.
- Omission of AC Filters: Utilizing the SVG to balance reactive power and suppress harmonics eliminates the need for large-scale AC filter banks. This configuration improves the spatial efficiency of the converter station compared to the MMC option, thereby enhancing the overall system economics.
- 2.
- Dynamic Reactive Power Support: To address voltage fluctuations caused by near-shore wind power integration, the SVG provides rapid dynamic reactive power support. This mechanism stabilizes the sending-end AC bus voltage and mitigates the voltage instability associated with traditional LCCs in offshore weak grids.
2.2. Comprehensive Comparison of Technical and Economic Aspects
To quantitatively evaluate the spatial and economic feasibility of the proposed topology, a comparative analysis of the three schemes is conducted. Based on preliminary cost estimations from a specific offshore transmission project, metrics for the equivalent platform footprint and the overall static investment are calculated. These metrics are normalized into per-unit (p.u.) values to maintain the confidentiality of commercial engineering data. Establishing the MMC direct transmission (Scheme 2) as the 1.00 p.u. baseline, the quantified technical and economic boundaries are detailed in Table 1.
Table 1.
Quantitative technical and economic comparison of collaborative transmission schemes.
Combining the quantitative analysis from Table 1, the three transmission configurations exhibit distinct deployment characteristics:
Scheme 1 is limited by the complex architecture of sea–land separation and onshore transfer. Although the technical threshold is low, the utilization of four distinct converter stations generates cascaded losses. Consequently, its normalized spatial footprint and investment increase to approximately 1.95 p.u. and 1.65 p.u., respectively. Furthermore, the onshore aggregation of large-scale far-offshore wind power occupies AC channel resources, increasing susceptibility to regional power flow congestion.
Scheme 2 achieves direct DC transmission through MMC technology, bypassing near-shore AC intermediaries. However, acting as the quantitative benchmark (1.00 p.u.), the MMC architecture requires a large quantity of sub-modules and high-capacity sub-module capacitors. This design results in substantial platform mass and dimensions, complicating the construction process. The reliance on fully controlled semiconductor devices limits its economic viability in ultra-large capacity applications.
In contrast, Scheme 3 provides a balanced techno-economic configuration. Supported by the equivalent static engineering assessments, the SLCC topology eliminates the deployment of passive AC filter banks. This structural advantage yields an approximately 9% reduction in the platform footprint index (0.91 p.u.) compared to the MMC scheme, systematically reducing the load-bearing stress on the offshore platform. Economically, by coupling high-capacity thyristor valves with localized SVG dynamic support, the overall static investment decreases to 0.85 p.u. This 15% capital expenditure reduction, combined with lower transmission losses and reduced near-shore AC channel occupation, confirms the SLCC architecture as a practical and economically viable solution for collaborative offshore wind power transmission.
3. Operation and Control of Collaborative Transmission System Based on SLCC
When near-shore and far-offshore wind power are collaboratively transmitted through a shared channel, the system experiences strong power coupling, insufficient reactive power support, and potential overloading of the near-shore AC channel. To address these issues, this section first constructs the topological model of the SLCC collaborative transmission system and analyzes its power flow mechanisms. Subsequently, a hierarchical collaborative control strategy is proposed. This strategy encompasses SVG-based autonomous reactive power and harmonic control at the bottom layer, and an LCC active power-following control at the top layer, aiming to achieve dynamic decoupling and stable transmission.
3.1. System Topology and Power Coupling Mechanism
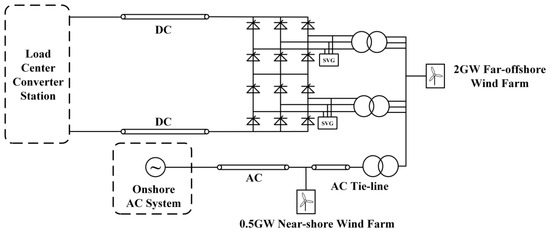
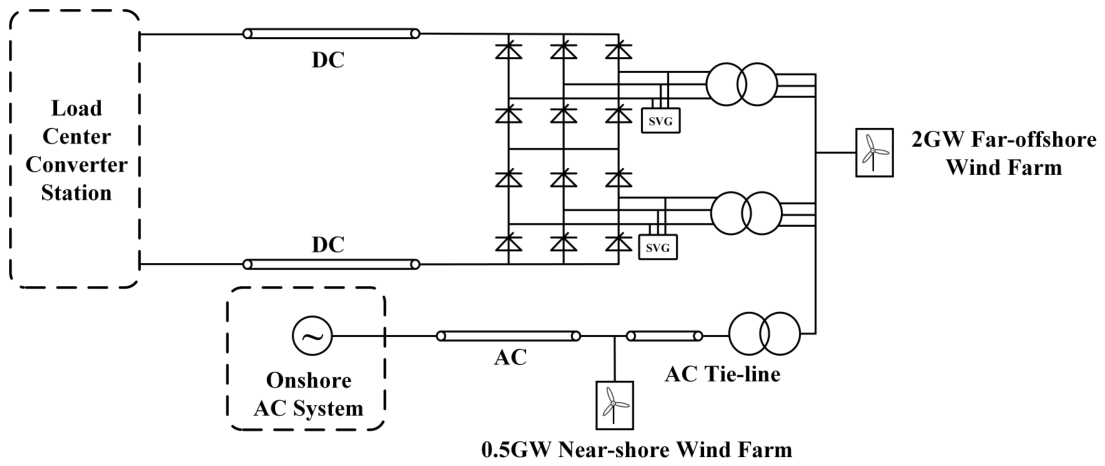
Figure 4 shows the topology of the collaborative transmission system. Large-scale far-offshore wind farms are aggregated and converted to DC for transmission via the SLCC rectifier station. Near-shore wind farms are integrated through the AC aggregation bus (Point of Common Coupling, PCC). On one hand, near-shore power is transmitted to the onshore grid through dedicated AC channels; on the other hand, it connects to the SLCC bus through tie transformers to provide commutation voltage support for the converter station.
Figure 4.
Topology structure of collaborative transmission system for near-shore and offshore wind power based on SLCC.
In this topology, the SLCC station not only transmits the far-offshore wind power but also utilizes the valve-side parallel SVG to suppress voltage fluctuations caused by wind power variations.
Let the output power of the near-shore wind farm be , the output power of the far-offshore wind farm be , the DC transmission power of SLCC be , the transmission power of the near-shore AC channel be , and the interaction power of the tie-line be . Ignoring system losses, the power balance relationships for the near-shore and far-offshore sides can be expressed as:
Equation (1) indicates that if the SLCC employs traditional constant current or constant power control, the transmission power remains fixed. Consequently, to maintain power balance, any random fluctuation in far-offshore wind power forces a proportional change in the tie-line power . This mechanism transmits generation fluctuations to the near-shore wind power network via the tie line. Under severe conditions, this transfer can cause power flow limit violations in the near-shore AC channel () or voltage instability at the converter bus. Therefore, the SLCC requires a real-time active power-following capability. Specifically, the control target must satisfy (implying ), thereby decoupling the active power flows of the near-shore and far-offshore components.
3.2. Hierarchical Collaborative Control Strategy for SLCC System
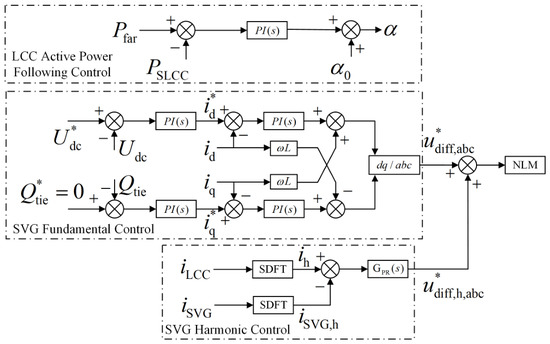
The control architecture of the SLCC system comprises two layers. The bottom layer consists of the SVG reactive power and harmonic autonomous controllers, programmed to maintain commutation voltage stability and power quality. The top layer executes the LCC active power-following control to regulate the dynamic power balance. The overall control strategy diagram is shown in Figure 5.
Figure 5.
Diagram of hierarchical collaborative control strategy for SLCC system.
3.2.1. SVG Reactive Power and Harmonic Decoupling Control
In the collaborative transmission system, the SVG is mounted directly on the valve side of the converter transformer. Its control objective is to achieve self-balance of reactive power in the far-offshore AC network and self-filtering of LCC characteristic harmonics.
To maintain near-zero reactive power exchange between the far-offshore and near-shore wind power AC systems, the SVG must compensate for the dynamic reactive power consumed during LCC commutation, along with the reactive power variations of the far-offshore wind farm. A vector control strategy based on grid voltage orientation is adopted to balance the reactive power utilizing the output capacity of the SVG. In the rotating coordinate system, the SVG reactive current command is generated by the reactive power outer loop:
where and are Proportional-Integral (PI) controller parameters. Simultaneously, the DC capacitor voltage balance of the SVG sub-modules is maintained by regulating the active current component.
For the characteristic harmonics generated by the LCC, the SVG implements a specific harmonic compensation strategy. A Sliding Discrete Fourier Transform (SDFT) extracts the load-side harmonic current components, and a Proportional Resonant (PR) controller is introduced to track specific frequency signals with zero steady-state error. The transfer function of the PR controller is given by:
where h is the harmonic order, is the fundamental angular frequency, is the resonant gain, and represents the cut-off bandwidth of the resonant peak.
Although the PR controller improves tracking accuracy, the dynamic interaction between the SVG harmonic control loop and the equivalent leakage inductance of the converter transformer introduces a risk of local high-frequency resonance. This resonance risk increases during varying load conditions induced by wind power fluctuations, which alter the equivalent grid impedance. To mitigate this interaction, the proposed control system bounds the operating limits of the PR controller. By mathematically restricting the cross-over bandwidth () and regulating the proportional gain () to secure a phase margin near the selected harmonic frequencies, the closed-loop output impedance of the SVG is prevented from intersecting the resonant points of the transformer’s leakage reactance. This structural constraint maintains harmonic stability across the designated operating range.
The final SVG modulation wave is formed by superimposing the fundamental component and the harmonic compensation component, driving the IGBTs through Nearest Level Modulation (NLM).
3.2.2. LCC Active Power-Following Control Strategy
To address the power coupling described by Equation (1), this manuscript introduces an active power-following control strategy based on instantaneous power feedback, replacing the conventional constant current control.
To improve the system response during wind power fluctuations, the instantaneous active power absorbed by the SLCC is measured using instantaneous power theory. By sampling the three-phase voltages of the converter bus and the valve-side currents of the converter transformer, and applying the Clark transformation to the stationary coordinate system, the SLCC instantaneous active power is obtained:
The measured output power of the far-offshore wind farm serves as the LCC power command value, . The control system utilizes the power deviation as the input to a PI regulator, dynamically adjusting the rectifier firing angle . The controller is designed as follows:
where is the rated firing angle. When the far-offshore wind power output increases (), the error input to the PI controller is positive. Based on the negative feedback design in Equation (5), this results in a reduction of . The reduced firing angle elevates the DC voltage and DC current, thereby increasing the SLCC transmission power to match the required generation export. Conversely, a reduction in wind power causes the logic to operate in reverse, increasing to lower the transmitted power.
Through closed-loop tracking, this strategy dynamically maintains . This ensures that near-shore wind power is transported solely via its designated AC channel, logically decoupling the near-shore and far-offshore wind energy transmission channels.
4. Simulation Verification
To verify the effectiveness of the proposed control strategy, a simulation model of the near-shore and far-offshore wind power collaborative transmission DC system was established using the PSCAD/EMTDC electromagnetic transient simulation software. The simulation system consists of near-shore wind farms, far-offshore wind farms, AC tie transformers, and the SLCC station, as depicted in Figure 4. The SLCC station utilizes a 12-pulse LCC topology with a valve-side parallel SVG. The key electrical parameters of the system are listed in Table 2.
Table 2.
Main parameters of the simulation system.
4.1. Steady-State Operation and Dynamic Power-Following Characteristics
To quantitatively verify the operational improvements of the proposed SLCC scheme concerning dynamic response and decoupling capability, a traditional LCC-HVDC system integrated with conventional passive AC filter banks was simulated as a benchmark control group under identical operating conditions.
The primary feature of the SLCC scheme is its ability to decouple the power transmission of near-shore and far-offshore wind energy. This ensures that active and reactive power fluctuations from the far-offshore wind farm do not destabilize the near-shore AC channel. Initially, the system operates in a steady state, with the far-offshore wind farm outputting 1.0 p.u. (2000 MW). At s, a modeled wind speed decrease causes the far-offshore wind power output to step down from 2000 MW to 840 MW ( p.u.). At s, the wind power output steps up to 1150 MW ( p.u.). Finally, at s, the wind power output returns to 2000 MW.
4.1.1. Active Power-Following and Decoupling Performance
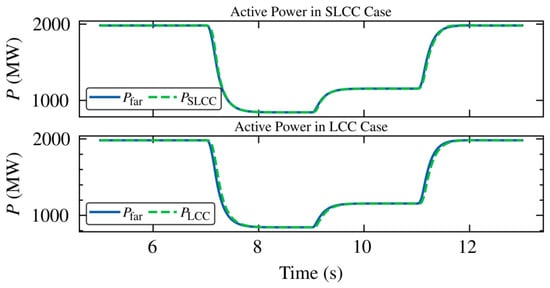
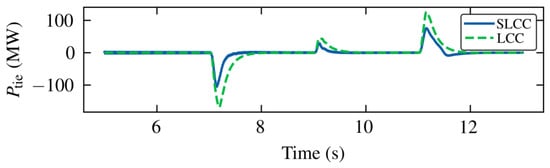
Figure 6 provides a comparative view of the active power tracking performance ( versus and ) during the wind power fluctuation periods. To quantitatively evaluate dynamic tracking capabilities between different control strategies, a dynamic response time constant is applied. This metric represents the time required from the initiation of a wind farm power step until the transmission power tracking error enters and remains within a error band. Based on the topological power balance presented in Equation (1), this active power tracking error physically manifests as the transient power exchange on the AC tie-line (). Therefore, given the 2000 MW rated system capacity, the tracking accuracy criterion corresponds to a boundary condition of MW.
Figure 6.
Comparison of active power tracking capability between the far-offshore wind farm and converters in SLCC and traditional LCC scenarios.
The transient waveforms in Figure 7 demonstrate that the two control architectures exhibit distinct response time constants during the active power step at s. Operating under standard control logic, the traditional LCC system exhibits a measurable tracking delay. Its transient tracking error () reaches approximately MW (an deviation). Consequently, the conventional configuration requires a settling time measured in hundreds of milliseconds to re-enter the error band.
Figure 7.
Active power waveform of AC tie-line () demonstrating the transient decoupling of SLCC compared to the traditional LCC.
In contrast, the SLCC system utilizing the active power-following control strategy constrains the dynamic tracking error. During the fluctuation periods, the maximum transient deviation of remains within the MW threshold. Thus, the SLCC system satisfies the tracking error criterion without a macroscopic response delay. Following the step transient, converges to a zero steady-state error. This responsive tracking characteristic logically isolates the near-shore AC channel from far-offshore generation variations, protecting the near-shore grid from subsequent power shocks.
4.1.2. Reactive Power Self-Balance Mechanism
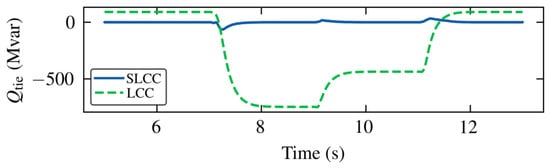
In standard LCC-HVDC implementations, active power fluctuations cause proportional variations in reactive power consumption. The limitation of the traditional LCC lies in its reliance on fixed or discretely switched passive AC filters. Figure 8 quantifies this functional limitation.
Figure 8.
Reactive power characteristics of AC tie-line () demonstrating the minimized reactive exchange of the SLCC compared to the reactive mismatch of the LCC.
As shown by the traditional LCC trace (dashed green line) in Figure 8, when the active power drops at s, the LCC extracts less reactive power from the grid. However, the passive filter banks continue generating a constant volume of capacitive reactive power sized for the 2000 MW condition. Because a continuous dynamic compensation mechanism is absent, this surplus reactive power (reaching approximately −750 Mvar) flows into the near-shore AC grid through the tie-line. In physical applications, this var backflow induces overvoltage issues at the sending-end bus.
The SLCC scheme mitigates this issue using the valve-side parallel SVG. During active power steps, the reactive power exchange on the tie line for the SLCC remains constrained within 70 Mvar. Mechanistically, the bottom-layer control loop detects voltage variations and changes in the LCC firing angle, subsequently adjusting the SVG output to compensate for real-time converter consumption. Operating with a response time of approximately 5 ms, the SVG maintains a minimized reactive exchange. This observation confirms that the SLCC station achieves continuous reactive power self-balance, reducing dependence on the near-shore grid for voltage support.
4.1.3. Harmonic Compensation Performance and THD Verification
To evaluate power quality at the PCC during dynamic wind power fluctuations, the harmonic filtering performance of the SVG is quantified. Based on Equation (3), the PR controller targets the characteristic harmonics of the 12-pulse LCC. Due to the practical switching frequency constraints of the SVG valves and the natural attenuation of higher-order harmonics, the compensation range is restricted to an upper index of . Therefore, resonant compensators are assigned to the 11th, 13th, 23rd, 25th, 35th, and 37th harmonic frequencies.
To maintain closed-loop stability and prevent the amplification of high-frequency noise, the resonant gain for each targeted harmonic uses an inverse-proportional weighting method relative to its order h. This setup provides sufficient open-loop bandwidth to suppress low-order dominant harmonics while adhering to phase margin limits at higher frequencies.
During the active power step sequences modeled in Section 4.1.1, the harmonic current components injected into the near-shore AC grid were recorded. Table 3 details the maximum transient distortions for specific harmonics and the Total Harmonic Distortion (THD) of the grid-side current.
Table 3.
Maximum harmonic distortion of grid-side current during wind power fluctuations.
According to Table 3, the peak transient distortions for the dominant 11th and 13th harmonics are 2.13% and 1.68%, respectively. The higher-order components remain below 1.0%. Under the maximum transient mismatch, the overall THD of the AC grid-side current peaks at 2.75%. These limits comply with the parameters of the IEEE Standard 519 (individual harmonic distortion , THD ). Consequently, the simulation verifies that the SVG tracking algorithm maintains standard harmonic grid thresholds independently of passive filter banks.
4.2. Impact of Communication Delays on Control Stability
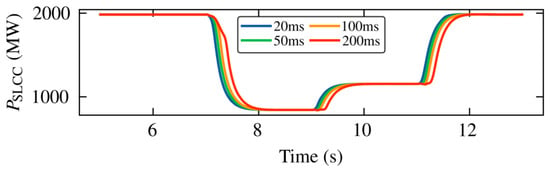
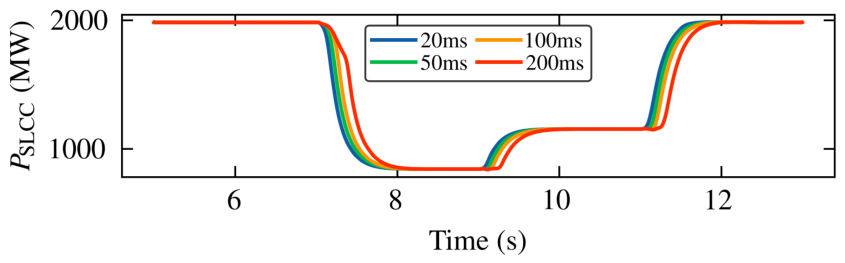
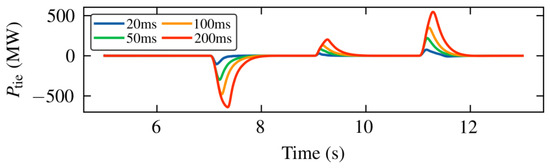
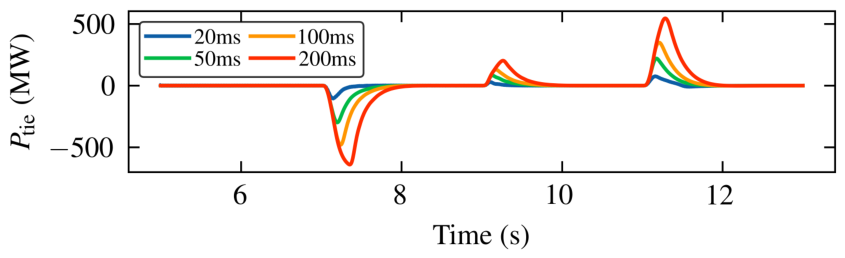
In practical offshore engineering, active power-following control relies on instantaneous power measurements at the remote wind farm PCC. Consequently, long-distance communication lines introduce signal measurement and transmission delays. To quantitatively evaluate the impact of these delays on the stability of the PI regulators and the transient power flow during rapid wind fluctuations, a sensitivity analysis is conducted.
A baseline measurement and communication delay of 20 ms is established to represent typical fiber-optic communication conditions in offshore projects. Additional delay conditions of 50 ms, 100 ms, and 200 ms are tested to simulate degraded scenarios such as communication medium congestion. The far-offshore wind power step conditions remain identical to those described in Section 4.1.
Figure 9 and Figure 10 illustrate the dynamic active power characteristics of the SLCC () and the AC tie line (). As observed in Figure 9, an increase in communication delay introduces a phase lag in the SLCC active power tracking response. Based on the power balance relationship in Equation (1), a temporary mismatch occurs between the physical power variations of the wind farm and the delayed response of the SLCC. This transient active power deviation is absorbed or supplied by the near-shore AC tie line, manifesting as transient overshoots in , as shown in Figure 10. Under the baseline 20 ms scenario, the overshoot is minor and converges quickly. Conversely, at a 200 ms delay, the peak transient power on the tie line increases visibly.
Figure 9.
Transmission power of SLCC () under different communication delay conditions during rapid wind power fluctuations.
Figure 10.
Active power of AC tie-line () revealing transient power mismatches caused by communication delays.
Despite these transient impacts, the simulation results indicate that the proposed PI regulators maintain operational stability. At a 200 ms communication delay, the active power tracking mechanism avoids divergent oscillations. The dynamic peak values of remain bounded, and the system returns to the decoupled state () after the control loop synchronizes with the real-time wind power generation.
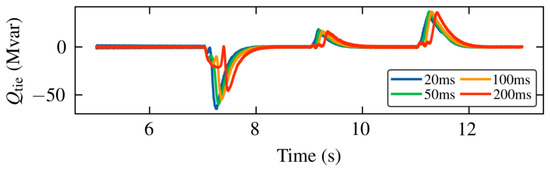
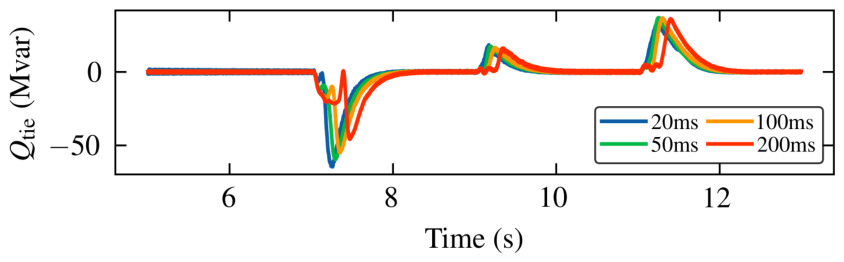
Furthermore, Figure 11 demonstrates the reactive power exchange () during the delayed tracking process. The transient active power deviations perturb the AC bus voltage, which prompts the bottom-layer SVG control to adjust its dynamic output. The reactive power oscillations remain damped and rapidly converge to zero. This analysis confirms that the proposed hierarchical control strategy possesses sufficient phase margin to tolerate both typical and degraded communication delays.
Figure 11.
Reactive power of AC tie-line () dynamic response under various communication delays.
4.3. Transient Stability and Fault Recovery Analysis
Adaptability to grid faults is a critical metric for offshore transmission systems. To quantitatively benchmark the fault ride-through and post-fault recovery performance of the proposed scheme, a traditional LCC system equipped with passive filters was simulated alongside the SLCC model under identical fault conditions. A three-phase solid short-circuit fault was applied to the PCC bus at s, with a fault duration of 50 ms.
4.3.1. AC Bus Voltage Dynamic Response
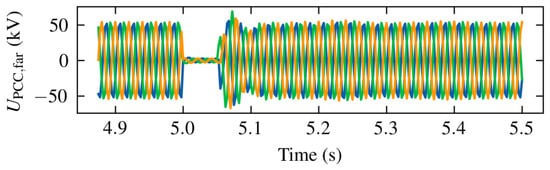
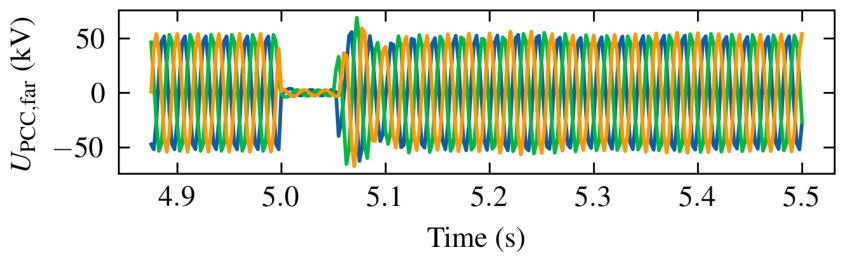
Figure 12 displays the three-phase AC voltage waveform at the converter bus for the SLCC system. Upon fault inception, the bus voltage drops to near zero. Following fault clearance at s, the voltage recovers to the nominal value within 100 ms. During this phase, the valve-side SVGs function as active voltage sources. Because passive filters lose reactive output proportional to the square of the voltage drop, the continuous dynamic var support provided by the SVG assists in re-establishing the requisite commutation voltage.
Figure 12.
Three-phase voltage waveform of SLCC AC bus under 50ms three-phase short-circuit fault.
4.3.2. Transient Power Recovery and Reactive Power Decoupling
To evaluate the dynamic enhancements, the transient responses of the AC tie-line and the power tracking characteristics are compared directly between the SLCC and the traditional LCC baseline.
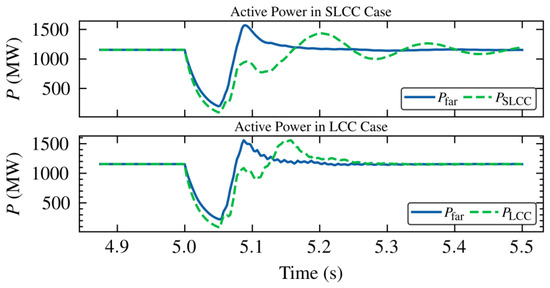
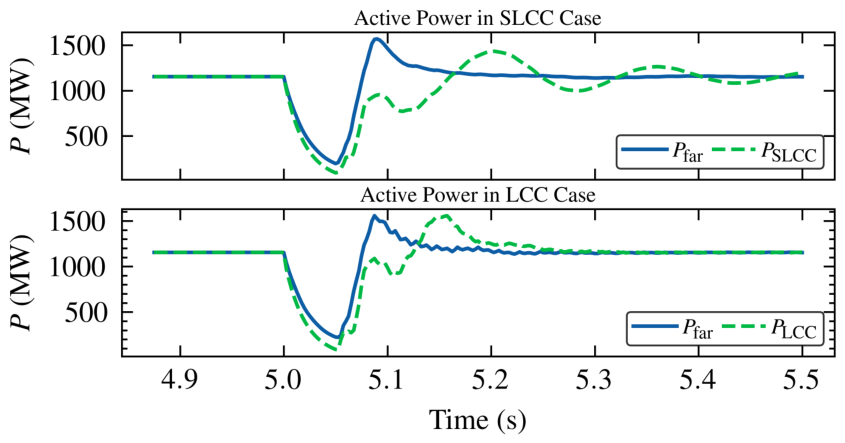
Figure 13 compares the DC transmission power with the far-offshore wind farm output () during the transient process. The voltage dip at s forces the wind turbines into a fault ride-through mode, decreasing . Following fault clearance, the wind power output recovers. The traditional LCC recovery process (dashed green line) exhibits delayed tracking and low-frequency oscillations. Conversely, the SLCC control loop (solid blue line) tracks the wind power recovery curve with a shorter settling time.
Figure 13.
Comparison of active power tracking during an AC fault. The SLCC (top) demonstrates a more responsive and damped recovery trajectory compared to the traditional LCC benchmark (bottom).
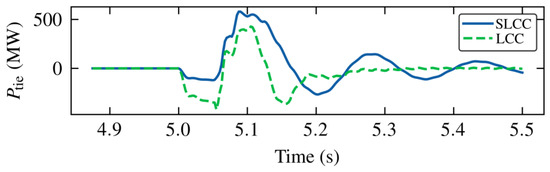
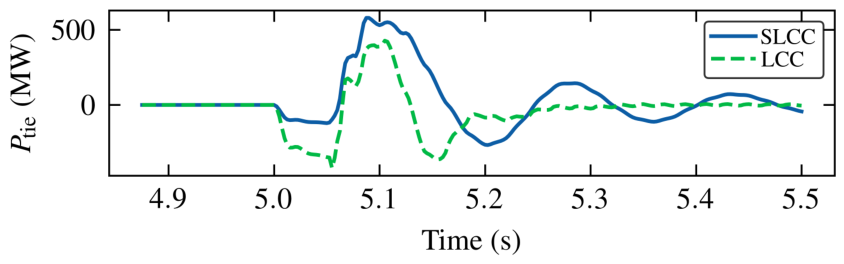
The implications of this dynamic tracking difference on the near-shore grid interface are characterized in Figure 14. During the transient phase immediately following the fault clearance (5.05–5.3 s), the traditional LCC exhibits prolonged active power absorption and oscillatory mismatch on the tie line (). While the SLCC configuration records a transient peak in to accommodate the wind power recovery rate, it dampens the transient dynamics and converges to a zero active power exchange after 5.3 s.
Figure 14.
Active power waveform of AC tie-line () under AC fault, indicating a swifter convergence for the SLCC scheme.
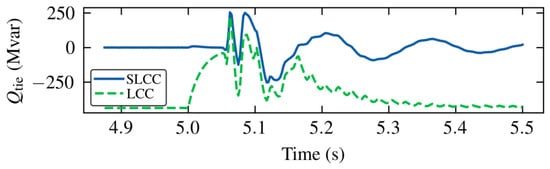
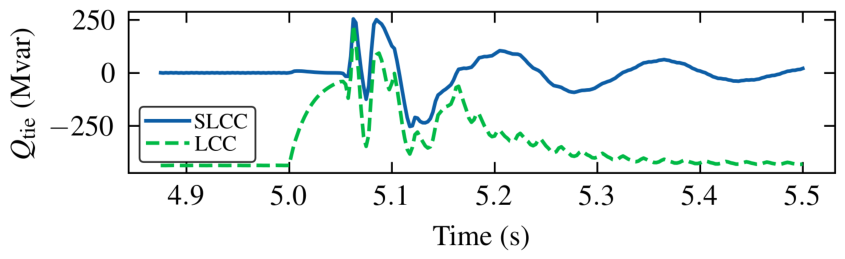
The reactive power recovery dynamics explicitly highlight the difference between the two configurations, as illustrated in Figure 15. For the traditional LCC system, the fixed passive filters become a disadvantage during the post-fault recovery phase. As the active power has not yet fully recovered, LCC reactive consumption remains low, resulting in a reactive power surplus from the passive banks. This causes significant reactive power backflow into the near-shore AC grid ( exceeding Mvar) extending well past the fault duration, which can trigger temporary overvoltages and secondary commutation failures.
Figure 15.
Reactive power characteristics of AC tie line () under AC fault, quantifying the elimination of the extended reactive surplus typical of traditional LCC architectures.
The SLCC configuration mitigates this operational risk. Over the duration of the fault and subsequent recovery, the SVG limits the reactive mismatch. Dynamic modulation bounds the transient var excursions and returns the tie-line reactive flow to the decoupled state () shortly after 5.3 s. This comparative assessment confirms the capability of the SLCC in mitigating AC fault effects and accelerating the return to steady-state operation.
4.3.3. Sensitivity Analysis Under Different Fault Severities
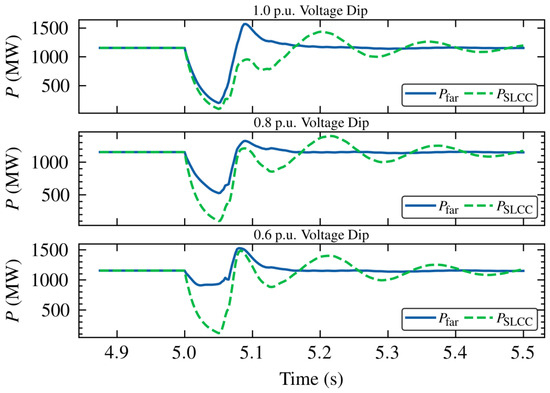
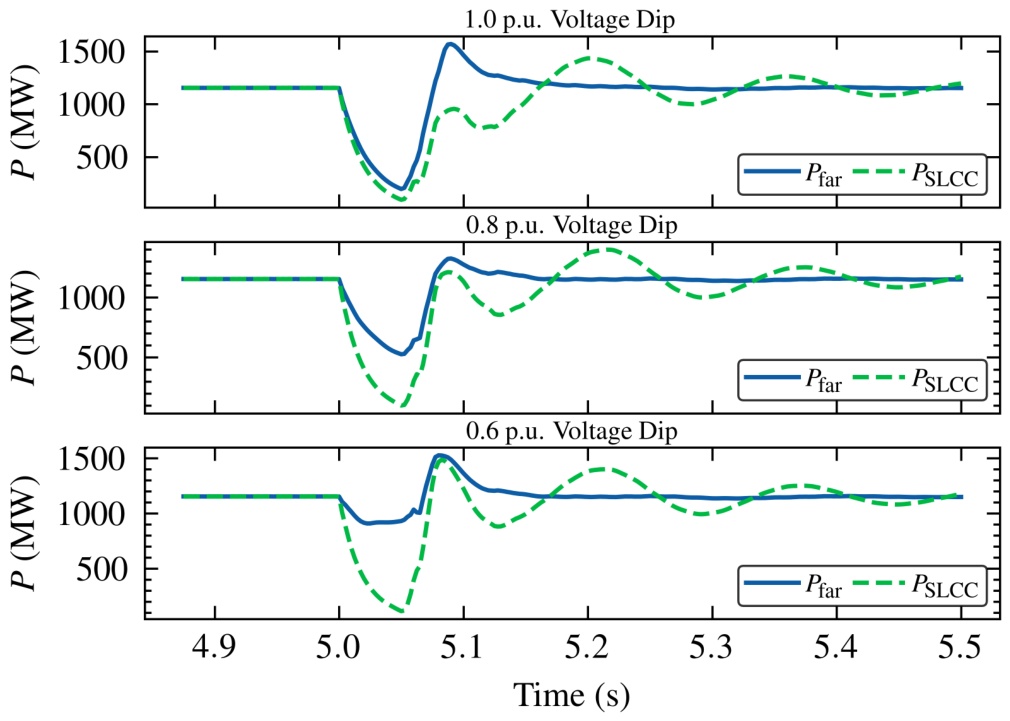
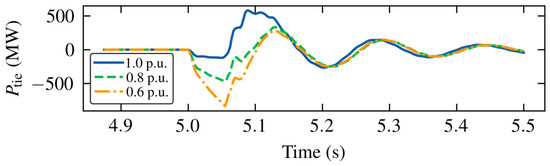
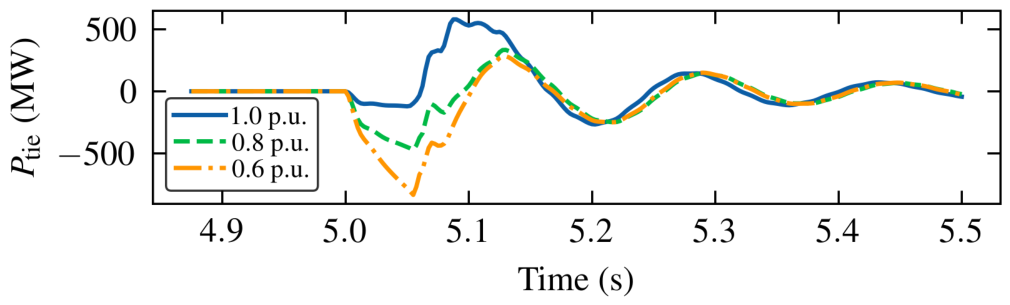
Because real AC faults occur at various electrical distances from the converter station, they result in different residual voltage levels at the PCC bus. To ensure that conclusions are not limited to near-end solid faults, a sensitivity analysis regarding fault severity is conducted. In addition to the 1.0 p.u. voltage dip, faults resulting in 0.8 p.u. and 0.6 p.u. voltage dips at the PCC are evaluated under the same fault duration.
Figure 16 depicts the active power tracking performance under varying fault depths. For partial voltage dips (0.8 p.u. and 0.6 p.u.), the far-offshore wind farm () avoids a deep fault-ride-through state and sustains partial generation during the fault window. Concurrently, the SLCC transmission capacity () is proportionally restricted by the depressed commutation voltage. The dynamic controller successfully tracks the distinct recovery trajectories across all severity levels.
Figure 16.
Dynamic active power tracking characteristics under different fault severities (1.0 p.u., 0.8 p.u., and 0.6 p.u. voltage dips).
The differing fault logic introduces a unique physical phenomenon on the AC tie-line interface, as captured in Figure 17. During the fault period (5.0–5.05 s), the negative power surge on the tie-line increases under partial dips compared to the solid 1.0 p.u. fault. Based on the power continuity relationship, wind turbines continue injecting substantial active power during partial faults, while the SLCC evacuation capability decreases due to the reduced AC voltage. This transient power surplus transfers to the near-shore AC tie line. Despite the increased transient power stress, the active power-following control prevents the PI regulators from saturating. Post fault, the system navigates the damped oscillations and reinstates the steady state.
Figure 17.
Transient active power on the AC tie line () under different fault severities.
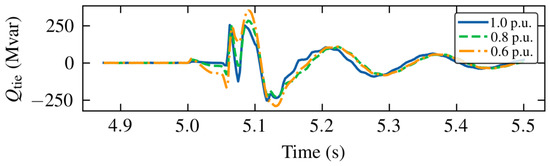
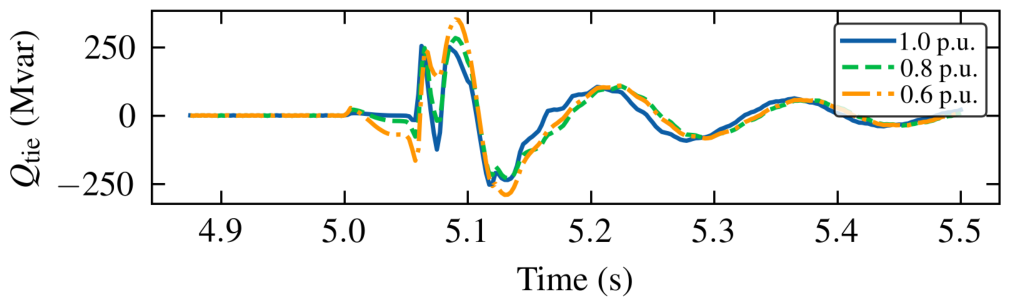
Furthermore, Figure 18 demonstrates the reactive power response (). The SVG modulates its phase angle to synthesize dynamic reactive limits depending on the residual voltage. Regardless of the varying transient magnitudes caused by different dip severities, the coordinated reactive power logic dampens the fluctuations, returning to the zero-exchange boundary within 0.3 s after fault clearance.
Figure 18.
Reactive power dynamics on the AC tie-line () under different fault severities.
This sensitivity analysis demonstrates that the post-fault recovery capability of the SLCC system applies across a range of grid fault severities, rather than being an isolated attribute for extreme scenarios.
4.4. Adaptability to Weak Grid Conditions
To evaluate the limitations of traditional converters and quantify the robustness improvements of the SLCC scheme, comparative simulations were conducted under varying Short Circuit Ratios (SCR). In this framework, the SCR at the PCC is defined as the ratio of the near-shore AC system’s short-circuit capacity () to the rated active power of the integrated wind farm (). To isolate the influence of macroscopic grid strength and ensure comparability, the SCR is modified exclusively by adjusting the equivalent inductive impedance of the near-shore AC grid. The equivalent system inertia and the operational parameters of the SVG remain constant across all evaluated SCR scenarios. The wind power variation profile adopted for this assessment is identical to the transient steps described in Section 4.1.
4.4.1. Benchmark: Instability Mechanism of Traditional LCC Under Weak Grids
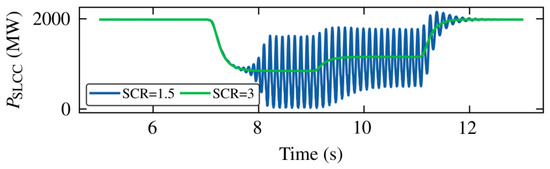
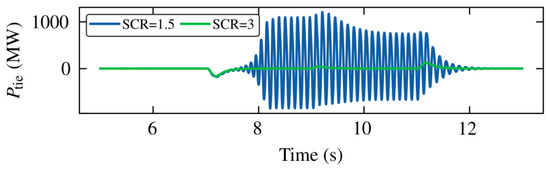
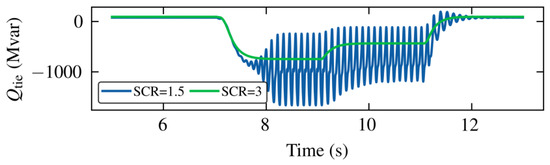
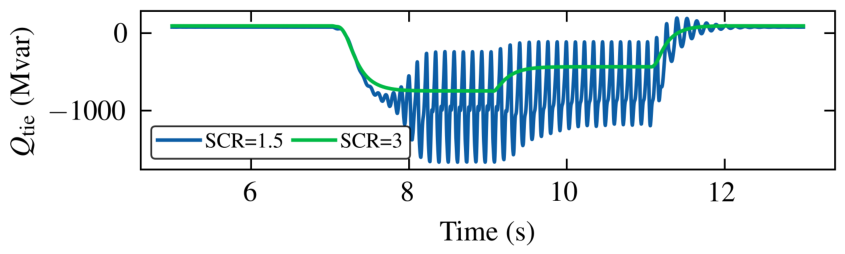
A traditional LCC-HVDC system with passive filters was first evaluated as the benchmark control group. Figure 19, Figure 20 and Figure 21 illustrate its dynamic responses under a strong grid (SCR = 3.0) and a weak grid (SCR = 1.5).
Figure 19.
Transmission power of traditional LCC under different SCRs.
Figure 20.
Active power of AC tie line () for traditional LCC exhibiting severe oscillations under weak grid conditions.
Figure 21.
Reactive power of AC tie line () for traditional LCC under weak grid conditions.
Under the strong grid condition (SCR = 3.0, green lines), the traditional LCC maintains stability despite the reactive power mismatch during wind power variations. However, when the grid strength degrades to SCR = 1.5 (blue lines), continuous divergent oscillations occur during the low wind power interval.
The underlying mechanism relates to the interaction between the undamped reactive power and the high equivalent grid impedance. In a weak grid environment, the voltage sensitivity to reactive power () increases. During an active power drop, the required commutation reactive power decreases. However, the passive filter banks continue to generate a constant volume of static reactive power. This excess reactive power flows into the high-impedance AC grid, causing significant voltage distortion at the PCC. The traditional PLL and PI regulators fail to adapt to such rapid voltage variations, driving the system into continuous resonance and power transmission failure. This confirms the dependence of standard LCCs on high-strength AC grids.
4.4.2. Enhanced Robustness and Stability Boundary of SLCC
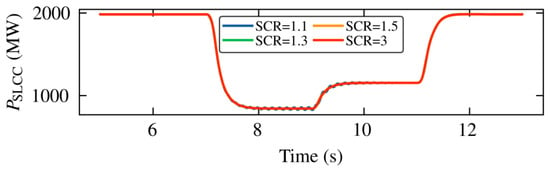
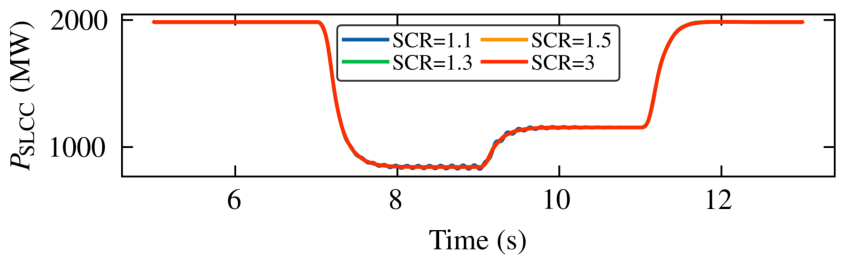
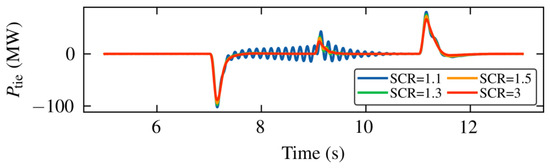
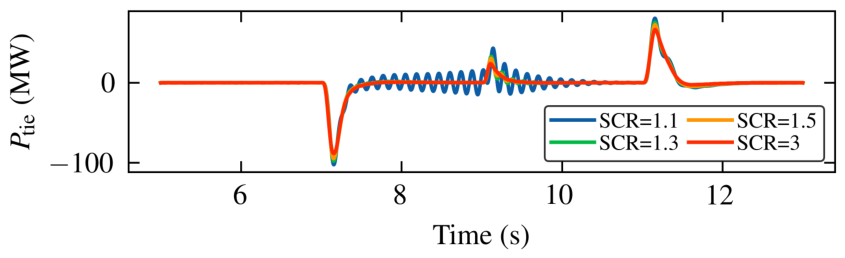
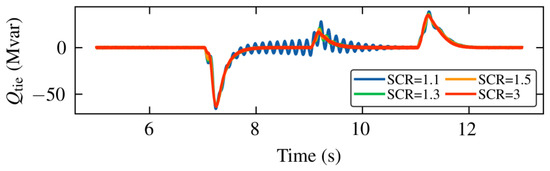
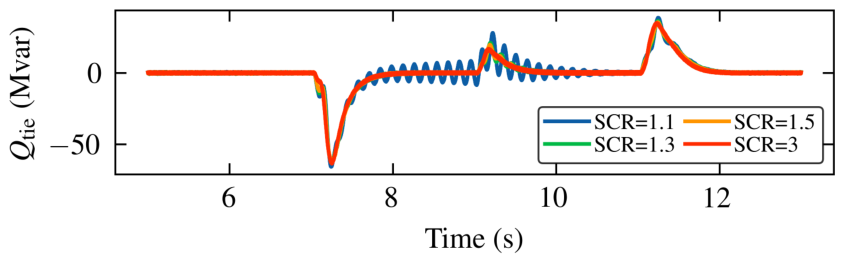
In contrast, the proposed SLCC scheme was evaluated under four distinct grid strength levels: strong grid (SCR = 3.0), weak grid (SCR = 1.5 and SCR = 1.3), and extremely weak grid (SCR = 1.1). The dynamic responses are presented in Figure 22, Figure 23 and Figure 24.
Figure 22.
Transmission power of SLCC () under different SCRs, maintaining consistent tracking performance.
Figure 23.
Active power of AC tie-line () for SLCC under different SCRs.
Figure 24.
Reactive power of AC tie-line () for SLCC under different SCRs.
Comparing Figure 22 with Figure 19, the transmission power of the SLCC consistently tracks the far-offshore wind power variations, mitigating the oscillations observed in the traditional LCC system at SCR = 1.5.
Furthermore, as illustrated by the orange (SCR = 1.5) and green (SCR = 1.3) curves in Figure 23 and Figure 24, the SLCC maintains stable tracking. Specifically, under the boundary condition of SCR = 1.3, converges to zero following transient steps, while exhibits minimal fluctuation. The integrated SVG dynamic compensation reduces the exchanged with the AC grid, continuously mitigating the deviation at the converter bus. This control mechanism isolates the weak impedance of the grid from the firing characteristics of the LCC.
A marginal stability boundary is identified when the grid drops to an extreme condition of SCR = 1.1 (blue curves in Figure 23 and Figure 24). At this level, continuous low-amplitude oscillations emerge during the low power intervals. This phenomenon is attributed to the high equivalent grid impedance. Under these conditions, the control bandwidth of the SVG voltage loop interacts with the grid’s resonance frequencies, resulting in dynamic limit cycles.
Nevertheless, the comparative analysis demonstrates that the SLCC technology expands the operational stability margin. This highlights the adaptability of the proposed collaborative transmission scheme to the challenging weak grid conditions prevalent in large-scale offshore wind energy integration.
5. Conclusions
This manuscript proposes a direct transmission scheme utilizing SLCC technology and an optimized control strategy for the collaborative transmission of near-shore and far-offshore wind power. Based on theoretical deduction, techno-economic comparison, and electromagnetic transient simulations, the following conclusions are established:
- (1)
- Topology Economics and Spatial Adaptability: The SLCC technology enables an “AC filterless” operation of converter stations through the use of a valve-side parallel SVG. This scheme retains the low-loss characteristics of thyristor converters while reducing the footprint and construction costs of the offshore platform. Consequently, it is suitable for offshore wind power projects subject to strict spatial constraints.
- (2)
- Dynamic Decoupling of Power Transmission: To mitigate power coupling at the aggregation bus, the proposed active power-following control strategy enables the DC transmission power to track far-offshore wind generation variations, maintaining the tie-line active power exchange near zero. This mechanism prevents far-offshore operational fluctuations from impacting the near-shore AC transmission channel, achieving coordinated physical interfacing and logical decoupling.
- (3)
- Operational Adaptability: Simulation results indicate that the scheme maintains tracking response during wind power steps, and the dynamic reactive power support from the SVG stabilizes local voltages. Under severe AC short-circuit faults, the SLCC system demonstrates improved recovery capability. Furthermore, sensitivity analyses confirm that the proposed strategy maintains stability across reduced Short Circuit Ratios, verifying its robustness in weak grid environments.
Despite the verified advantages, certain limitations in the current study define the trajectory for future research. First, because the validity of the proposed scheme is grounded in electromagnetic transient simulations, Hardware-in-the-Loop (HIL) testing will be conducted in future work to substantiate the control strategies on physical platforms. Second, as observed under ultraweak grid conditions, limit–cycle oscillations can emerge. Because the top-layer LCC active power control and the bottom-layer SVG reactive power control interact via the PCC bus voltage, the precise excitation mechanism of these oscillations requires detailed investigation. Consequently, future research will focus on small-signal stability analysis and impedance-based network modeling. Building upon these models, advanced stabilization methods—such as integrating Active Damping Control or Virtual Synchronous Generator (VSG) algorithms into the SVG loops—will be explored to mitigate specific instability modes in ultraweak AC networks.
In conclusion, SLCC technology balances the constraints of offshore spatial limits, channel utilization, and system stability, providing a viable technical configuration for large-scale far-offshore wind power development.
Author Contributions
Conceptualization, H.C. and Y.H.; methodology, H.C. and J.H.; software, T.H. and X.H.; validation, G.W. and X.W.; formal analysis, Z.W.; investigation, G.W. and X.H.; resources, Y.H.; writing—original draft preparation, H.C.; writing—review and editing, H.C., J.H. and Y.H.; visualization, T.H. and X.W.; supervision, Y.H.; project administration, Y.H.; funding acquisition, Y.H. All authors have read and agreed to the published version of the manuscript.
Funding
This research was supported by the Science and Technology Project of the State Grid Electric Power Co., Ltd. (Grant number: J2024157).
Data Availability Statement
The original contributions presented in this study are included in the article. Further inquiries can be directed to the corresponding author.
Conflicts of Interest
Authors Hui Cai, Junhui Huang, Xingning Han, Xu Wang and Zhiwei Wang were employed by the company State Grid Jiangsu Electric Power Co., Ltd. The remaining authors declare that the research was conducted in the absence of any commercial or financial relationships that could be construed as a potential conflict of interest.
References
- Díaz, H.; Guedes Soares, C. Review of the Current Status, Technology and Future Trends of Offshore Wind Farms. Ocean Eng. 2020, 209, 107381. [Google Scholar] [CrossRef] [Scilit]
- Zhou, H.; Yao, W.; Zhou, M.; Ai, X.; Wen, J.; Cheng, S. Active Energy Control for Enhancing AC Fault Ride-Through Capability of MMC-HVDC Connected with Offshore Wind Farms. IEEE Trans. Power Syst. 2023, 38, 2705–2718. [Google Scholar] [CrossRef] [Scilit]
- Lin, J.; Yang, X.; Niu, S.; Yu, H.; Zhong, J.; Jian, L. Inflatable Savonius Wind Turbine with Rapid Deployment and Retrieval Capability: Structure Design and Performance Investigation. Energy Convers. Manag. 2024, 310, 118480. [Google Scholar] [CrossRef] [Scilit]
- Reidy, A.; Watson, R. Comparison of VSC Based HVDC and HVAC Interconnections to a Large Offshore Wind Farm. In Proceedings of the IEEE Power Engineering Society General Meeting, San Francisco, CA, USA, 12–16 June 2005; pp. 71–78. [Google Scholar]
- Alassi, A.; Bañales, S.; Ellabban, O.; Adam, G.; MacIver, C. HVDC Transmission: Technology Review, Market Trends and Future Outlook. Renew. Sustain. Energy Rev. 2019, 112, 530–554. [Google Scholar] [CrossRef] [Scilit]
- Yang, R.; Shi, G.; Zhang, C.; Li, G.; Cai, X. Internal Energy Based Grid-Forming Control for MMC-HVDC Systems with Wind Farm Integration. IEEE Trans. Ind. Appl. 2023, 59, 503–512. [Google Scholar] [CrossRef] [Scilit]
- Guo, C.; Xu, L.; Yang, S.; Jiang, W. A Supplementary Damping Control for MMC-HVDC System to Mitigate the Low-Frequency Oscillation Under Low Inertia Condition. IEEE Trans. Power Deliv. 2023, 38, 287–298. [Google Scholar] [CrossRef] [Scilit]
- Gan, H.; Xiao, H.; Huang, Y.; Zhang, L. Cost-Efficient Hybrid Converter for Large-Scale Offshore Wind Power Transmission. IEEE Trans. Power Deliv. 2025, 40, 1621–1633. [Google Scholar] [CrossRef] [Scilit]
- Chang, Y.; Cai, X. Hybrid Topology of a Diode-Rectifier-Based HVDC System for Offshore Wind Farms. IEEE J. Emerg. Sel. Top. Power Electron. 2019, 7, 2116–2128. [Google Scholar] [CrossRef] [Scilit]
- Zhang, Z.; Zhao, X. Startup Control of Grid-Forming Offshore Wind Turbines Connected to the Diode-Rectifier-Based HVDC Link. IEEE Trans. Sustain. Energy 2025, 16, 407–418. [Google Scholar] [CrossRef] [Scilit]
- Cai, X.; Zhang, N.; Wang, J.; Jiang, H.; Du, E.; Kang, C. Planning Inverter-Based Resource Generation Base Considering LCC-HVDC Transient Overvoltage Constraints. IEEE Trans. Power Syst. 2026, 41, 171–184. [Google Scholar] [CrossRef] [Scilit]
- Lee, G.-S.; Hwang, P.-I.; Moon, S.-I. Reactive Power Control of Hybrid Multi-Terminal HVDC Systems Considering the Interaction Between the AC Network and Multiple LCCs. IEEE Trans. Power Syst. 2021, 36, 4562–4574. [Google Scholar] [CrossRef] [Scilit]
- Guo, H.; Zhang, Z.; Xu, Z. Parallel Converter-Based Hybrid HVDC System for Integration and Delivery of Large-Scale Renewable Energy. J. Mod. Power Syst. Clean Energy 2024, 13, 688–697. [Google Scholar] [CrossRef] [Scilit]
- Liu, X.; Ma, W.; Jia, H.; Dong, C. A Novel AC Filter System for the Line Commutated Converter High Voltage DC Transmission System. CSEE J. Power Energy Syst. 2019, 5, 550–556. [Google Scholar]
- Chen, L.; Wang, J.; Li, Z.; Guo, C.; Zhang, B.; Li, Z. Steady-State Analysis of the DR-MMC Based Hybrid Topology for Offshore Wind Power Transmission. IEEE Trans. Power Electron. 2025, 40, 3177–3188. [Google Scholar] [CrossRef] [Scilit]
- Xiao, H.; Huang, X.; Huang, Y.; Liu, Y. Self-Synchronizing Control and Frequency Response of Offshore Wind Farms Connected to Diode Rectifier Based HVDC System. IEEE Trans. Sustain. Energy 2022, 13, 1681–1692. [Google Scholar] [CrossRef] [Scilit]
- Cardiel-Álvarez, M.Á.; Nami, A.; Arnaltes, S.; Rodriguez-Amenedo, J.L. Hybrid Bipolar VSC-DRU HVdc Connection for Offshore Wind Farms. Int. J. Electr. Power Energy Syst. 2023, 151, 109170. [Google Scholar] [CrossRef] [Scilit]
- Yu, Z.; Wang, J.; Fu, C.; Wang, H.; He, Q.; Li, H.; Xin, Q. A Method for Modifying LCC-HVDC Control Considering Dynamic Reactive Power Balance During AC Fault and System Recovery Period. IEEE Trans. Power Deliv. 2025, 40, 2167–2180. [Google Scholar] [CrossRef] [Scilit]
- Gao, C.; Yang, J.; He, Z.; Tang, G.; Zhang, J.; Li, T.; He, D. Novel Controllable-Line-Commutated Converter for Eliminating Commutation Failures of LCC-HVDC System. IEEE Trans. Power Deliv. 2023, 38, 255–267. [Google Scholar] [CrossRef] [Scilit]
- Xu, C.; Yu, Z.; Zhao, B.; Chen, Z.; Wang, Z.; Ren, C.; Zeng, R. A Novel Hybrid Line Commutated Converter Based on IGCT to Mitigate Commutation Failure for High-Power HVdc Application. IEEE Trans. Power Electron. 2022, 37, 4931–4936. [Google Scholar] [CrossRef] [Scilit]
- Luo, C.; Guo, Q.; Hu, Y.; Li, S.; Zhu, Y.; Guo, H. Analysis and Countermeasures of Harmonic Instability in a Practical HVDC System with Fixed Series Compensation and STATCOM. IEEE Trans. Ind. Appl. 2023, 59, 2509–2518. [Google Scholar] [CrossRef] [Scilit]
- Hu, C.; Wu, X.; Cai, H. Research on the Operation Performance Enhancement of Hybrid AC/DC Power System with Multi-Type Embedded HVDC. IEEE Trans. Power Deliv. 2025, 40, 606–617. [Google Scholar] [CrossRef] [Scilit]
- Ma, W.; Wang, L.; Li, M.; Shen, X.; Wu, F.; Xu, Y. SLCC conversion technology of UHVDC transmission new power systems. High Volt. Eng. 2022, 48, 4941–4948. [Google Scholar]
- Zheng, J.; Xia, L.; Lin, S.; Liu, J.; Kong, X.; Wang, C. Model and fault characteristics analysis of SLCC-HVDC system (I): Electromagnetic transient simulation model. Power Syst. Technol. 2025; online.
- Ding, R.; Deng, X.; Zhao, C.; Jia, X.; Shen, X.; Liang, C.; Guo, C. SLCC topology and control strategy for improving commutation process. Power Syst. Prot. Control 2024, 52, 86–94. [Google Scholar]
- Zhu, Z.; Sun, Y.; Li, C.; Wang, C. Simplified SLCC Model Based on Dynamic Phasor Model of Converters. In Proceedings of the 2025 5th International Conference on Electrical Engineering and Mechatronics Technology (ICEEMT), Shenzhen, China, 24–26 October 2025; pp. 23–28. [Google Scholar]
- Zhao, Y.; Zhu, Z.; Wang, C. High-Precision Calculation Method for SLCC Commutation Overlap Angle Incorporating SVF-LCC Coupling Dynamics. In Proceedings of the 2025 8th International Conference on Electrical Engineering and Green Energy (CEEGE), Yangzhou, China, 4–6 July 2025; pp. 19–24. [Google Scholar]
- Long, H.; Sun, Y.; Zou, Y.; Wang, C. Coordinated Control Strategy of SLCC Considering the Carrying Capacity of SVF. In Proceedings of the 2025 8th International Conference on Electrical Engineering and Green Energy (CEEGE), Yangzhou, China, 4–6 July 2025; pp. 1–6. [Google Scholar]

Disclaimer/Publisher’s Note: The statements, opinions and data contained in all publications are solely those of the individual author(s) and contributor(s) and not of MDPI and/or the editor(s). MDPI and/or the editor(s) disclaim responsibility for any injury to people or property resulting from any ideas, methods, instructions or products referred to in the content. |
© 2026 by the authors. Licensee MDPI, Basel, Switzerland. This article is an open access article distributed under the terms and conditions of the Creative Commons Attribution (CC BY) license.