


Abstract
Electromagnetic vortex waves carrying orbital angular momentum (OAM) provide an additional modal dimension for electromagnetic scattering analysis, but the resulting OAM mode-purity spectra are highly nonlinear and expensive to characterize through repeated full-parameter simulations. To address this issue, this work proposes a dual-path data-driven surrogate framework for the simulation-level prediction of OAM mode-purity spectra in metallic-target vortex-wave scattering. High-frequency datasets were generated within a prescribed workflow that combined an angular-spectrum formulation of Bessel vortex beams with a facet-based physical-optics method. Five representative metallic targets were considered, namely, Plate, Spiral, Spite, Missile, and Dihedral. In the first surrogate path, a numerical-parameter-based regression model was developed to predict the mode-purity spectrum from physical scattering variables for canonical targets. In the second surrogate path, a phase-map-based regression model was introduced to predict the spectrum directly from scattered-field phase maps without explicit geometric parameterization. The results show that the parameter-based surrogate achieves low prediction errors for canonical targets, while the proposed ConvNeXt + GAM model provides strong regression performance across multiple target categories in the phase-map-based setting. Overall, the proposed framework offers an efficient surrogate approximation of the nonlinear mapping between the scattering conditions and OAM mode-purity spectra under simulated conditions. This study is positioned as a simulation-level surrogate modeling investigation, and extension to experimental measurements or real-scene applications remains as future work.
1. Introduction
Radar systems infer target properties by transmitting electromagnetic waves and analyzing the returned echoes. However, under increasingly complex detection environments, conventional radar sensing based on plane-wave illumination faces growing challenges in feature diversity, target discrimination, and the efficient characterization of complicated scattering responses. In this context, electromagnetic vortex waves carrying orbital angular momentum (OAM) introduce an additional modal degree of freedom for scattering analysis and radar sensing, thereby enabling target characterization in both spatial and modal domains [1,2].
More broadly, structured wave modes have attracted sustained interest across multiple areas of physics and photonics. For example, higher-order Hermite–Gauss modes have been investigated in gravitational-wave detection to alleviate thermal-noise limitations [3], while spatial modes of light have been exploited in optical communication and quantum information to enhance the transmission dimensionality and capacity [4]. These developments underscore the broader value of modal-domain representations and further motivate their application in electromagnetic scattering and radar sensing [1,2].
In the radar and microwave domains, recent studies have demonstrated the feasibility of OAM-based sensing and imaging. Early efforts mainly focused on theoretical formulations and proof-of-concept systems, such as three-dimensional vortex-wave radar imaging based on multi-mode OAM processing [5]. Subsequent studies further extended OAM-based signal analysis and experimental imaging, confirming the potential of vortex waves for enhanced sensing performance [6,7]. Meanwhile, early theoretical and numerical investigations of structured vortex-beam scattering from canonical targets revealed important modal and field-distribution characteristics, particularly for Bessel-type and related beams interacting with simple scatterers [8,9,10]. More recently, high-frequency asymptotic methods and numerical simulations have been widely adopted to analyze vortex-wave scattering from metallic targets, revealing rich amplitude, phase, and modal features [11,12,13,14,15].
Recent studies published in 2023 and 2024 further show that OAM-related research is expanding toward more systematic analyses of scattering fields, spectral distributions, light–matter interactions, and mode-detection methodologies in increasingly complex scenarios [14,16,17]. These works primarily emphasize physical characterization, interaction mechanisms, and mode analysis or detection. Nevertheless, direct data-driven prediction of OAM mode-purity spectra from scattering conditions remains relatively underexplored.
In parallel, OAM-based scattering analysis has gradually evolved from qualitative observation toward more systematic modal characterization [18].
Despite these advances, accurate prediction of the OAM mode-purity spectrum remains challenging. The scattered modal response depends on multiple coupled factors, including target geometry, frequency, incidence angle, scattering angle, azimuth, and incident OAM order. Consequently, the mapping from scattering conditions to modal spectra is highly nonlinear, and repeated full-wave or high-frequency simulations become computationally expensive when broad parametric sweeps are required. Existing studies have primarily focused on physical modeling and scattering analyses [11,12,13,14,15,18], or on downstream recognition tasks based on OAM spectral features [19]. By contrast, the direct surrogate prediction of OAM mode-purity spectra remains relatively underexplored. In particular, a unified framework that can simultaneously accommodate both explicitly parameterized canonical targets and geometrically complex targets without compact numerical descriptions is still lacking.
To address this gap, this work proposes a dual-path data-driven surrogate framework for predicting OAM mode-purity spectra in metallic-target vortex-wave scattering. High-frequency datasets were generated under a unified workflow that combined angular-spectrum-based Bessel vortex-beam representation with a facet-based physical-optics method [8,9,11,12,13]. On this basis, two complementary regression paths were developed: a numerical-parameter-based model for canonical targets and a phase-map-based model for geometrically complex targets using a ConvNeXt backbone enhanced with a global attention mechanism (GAM).
The main contributions of this work are summarized as follows:
- A dual-path surrogate modeling framework is proposed to approximate the nonlinear mapping between scattering conditions and OAM mode-purity spectra under a unified simulation workflow.
- A numerical-parameter-based regression model is developed for canonical targets, enabling high-precision prediction using compact physical input variables.
- A phase-map-based regression model is introduced for complex targets, allowing for direct spectrum prediction from scattered-field phase maps without explicit geometric parameterization.
- Systematic evaluations across multiple target categories demonstrate the complementary roles of the two regression paths in balancing prediction accuracy and modeling flexibility.
The remainder of this paper is organized as follows: Section 2 introduces the theoretical modeling and simulation data-generation process. Section 3 presents the two surrogate regression settings. Section 4 reports the prediction results and comparative analyses. Finally, Section 5 concludes the paper and discusses future directions.
2. Theoretical Modeling and Simulation Data Generation
The main symbols and variables used in this section are introduced where needed and kept consistent throughout.
2.1. Bessel-Vortex Excitation and PO-Based Scattering Model
Bessel beams were first introduced by Durnin [20]. As an important class of vortex electromagnetic waves, Bessel vortex beams possess several distinctive properties, including orbital angular momentum (OAM), quasi-nondiffracting propagation, and self-healing capability. Owing to these characteristics, they have been widely studied in radar sensing, target recognition, and electromagnetic imaging [21,22,23,24].
In this work, the incident vortex field is described by the plane-wave angular-spectrum formulation, in which the beam is represented as a superposition of plane-wave components with different propagation directions. Under this formulation, the electric and magnetic fields of a Bessel beam with arbitrary polarization can be written as
where is the half-cone angle of the beam, l is the OAM mode index, and .
For the x-linearly polarized case, the incident electric field becomes
with
After decomposing the incident beam into plane-wave components, the target scattering response is evaluated using the high-frequency physical-optics (PO) approximation. For each plane-wave component with wave vector , the incident electric field is decomposed as
where
The local incidence angle is given by
The scalar components are
The scattered electric field is
where
For perfectly conducting targets, and .
The total magnetic field is
with
The induced surface current is
The scattered near field is then expressed as
where n denotes the facet index, M is the total number of illuminated facets, is the vector from the facet center to the observation point, and .
2.2. OAM Spectrum Extraction
The OAM spectrum is obtained through modal decomposition. The phase function is expanded as
with
The mode purity is defined as
which satisfies and .
2.3. Simulation Dataset Construction
Simulation datasets were generated under a unified workflow that combines the angular-spectrum formulation of Bessel vortex beams with the facet-based physical-optics (PO) approximation. The parameter ranges were selected to remain consistent with typical high-frequency scattering conditions and with the applicability of the PO model. Sampling was performed over predefined parameter ranges so as to provide broad coverage of the scattering-condition space under the present simulation setting.
For the numerical-parameter-based regression setting, three canonical metallic targets, namely, Plate, Spiral, and Spite, were considered. The input variables included the incident OAM order, operating frequency, incidence angle, scattering angle, and azimuth. These samples were used to construct the training, validation, and test sets for supervised regression of the OAM mode-purity spectrum from compact physical variables.
For the phase-map-based regression setting, two additional targets, namely, Missile and Dihedral, were further included in order to extend the study to more geometrically complex structures. In this setting, the scattered-field phase distributions were converted into two-dimensional phase maps with consistent scaling and resolution. This representation enabled image-based regression without requiring explicit low-dimensional geometric parameterization.
All datasets were generated using the same simulation workflow to ensure consistency across target categories and regression settings. Although the full dataset is not publicly available, the above implementation details are provided to improve reproducibility. The present study is therefore positioned as a simulation-level surrogate modeling investigation.
Due to data-access restrictions, detailed geometric parameters such as exact dimensions and mesh discretization levels cannot be disclosed. Therefore, Table 1 provides a qualitative comparison of the five targets to support interpretation of their different regression behaviors under the same simulation workflow.
Table 1.
Summary of the metallic targets considered in this study.
3. Surrogate Modeling for OAM Mode-Purity Spectrum Prediction
Based on the simulation-generated datasets described in Section 2, this section presents the surrogate models used to predict the OAM mode-purity spectrum. Consistent with the two data representations introduced earlier, two regression paths are considered. For canonical targets whose scattering responses can be described by a compact set of physical variables, a numerical-parameter-based regression model is adopted. For targets with more complex geometries, for which explicit low-dimensional parameterization is less convenient, a phase-map-based regression model is introduced to predict the OAM mode-purity spectrum directly from two-dimensional scattered-field phase distributions. Together, these two paths constitute the dual-path surrogate framework proposed in this work. Within the prescribed simulation workflow, the parameter-based path emphasizes accuracy and interpretability for canonical cases, whereas the phase-map-based path offers greater representational flexibility for geometrically more complex targets.
3.1. Numerical-Parameter-Based Regression Model
For canonical metallic targets, prediction of the OAM mode-purity spectrum can be formulated as a supervised regression problem in which a small set of physical variables is mapped to the corresponding scattered modal-purity distribution. To approximate this nonlinear relationship, a deep neural network (DNN) is adopted as the surrogate model.
In this setting, three canonical targets, namely, Plate, Spiral, and Spite, are considered. A separate DNN is trained for each target category so that the mapping characteristics of different geometries can be learned individually. The input to the network consists of five physical parameters, namely, operating frequency, incident OAM order, incidence angle, scattering angle, and incident azimuth. The output is a 17-dimensional mode-purity vector corresponding to the scattered OAM modes from to .
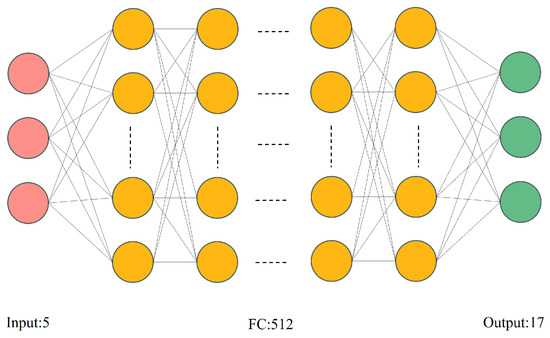
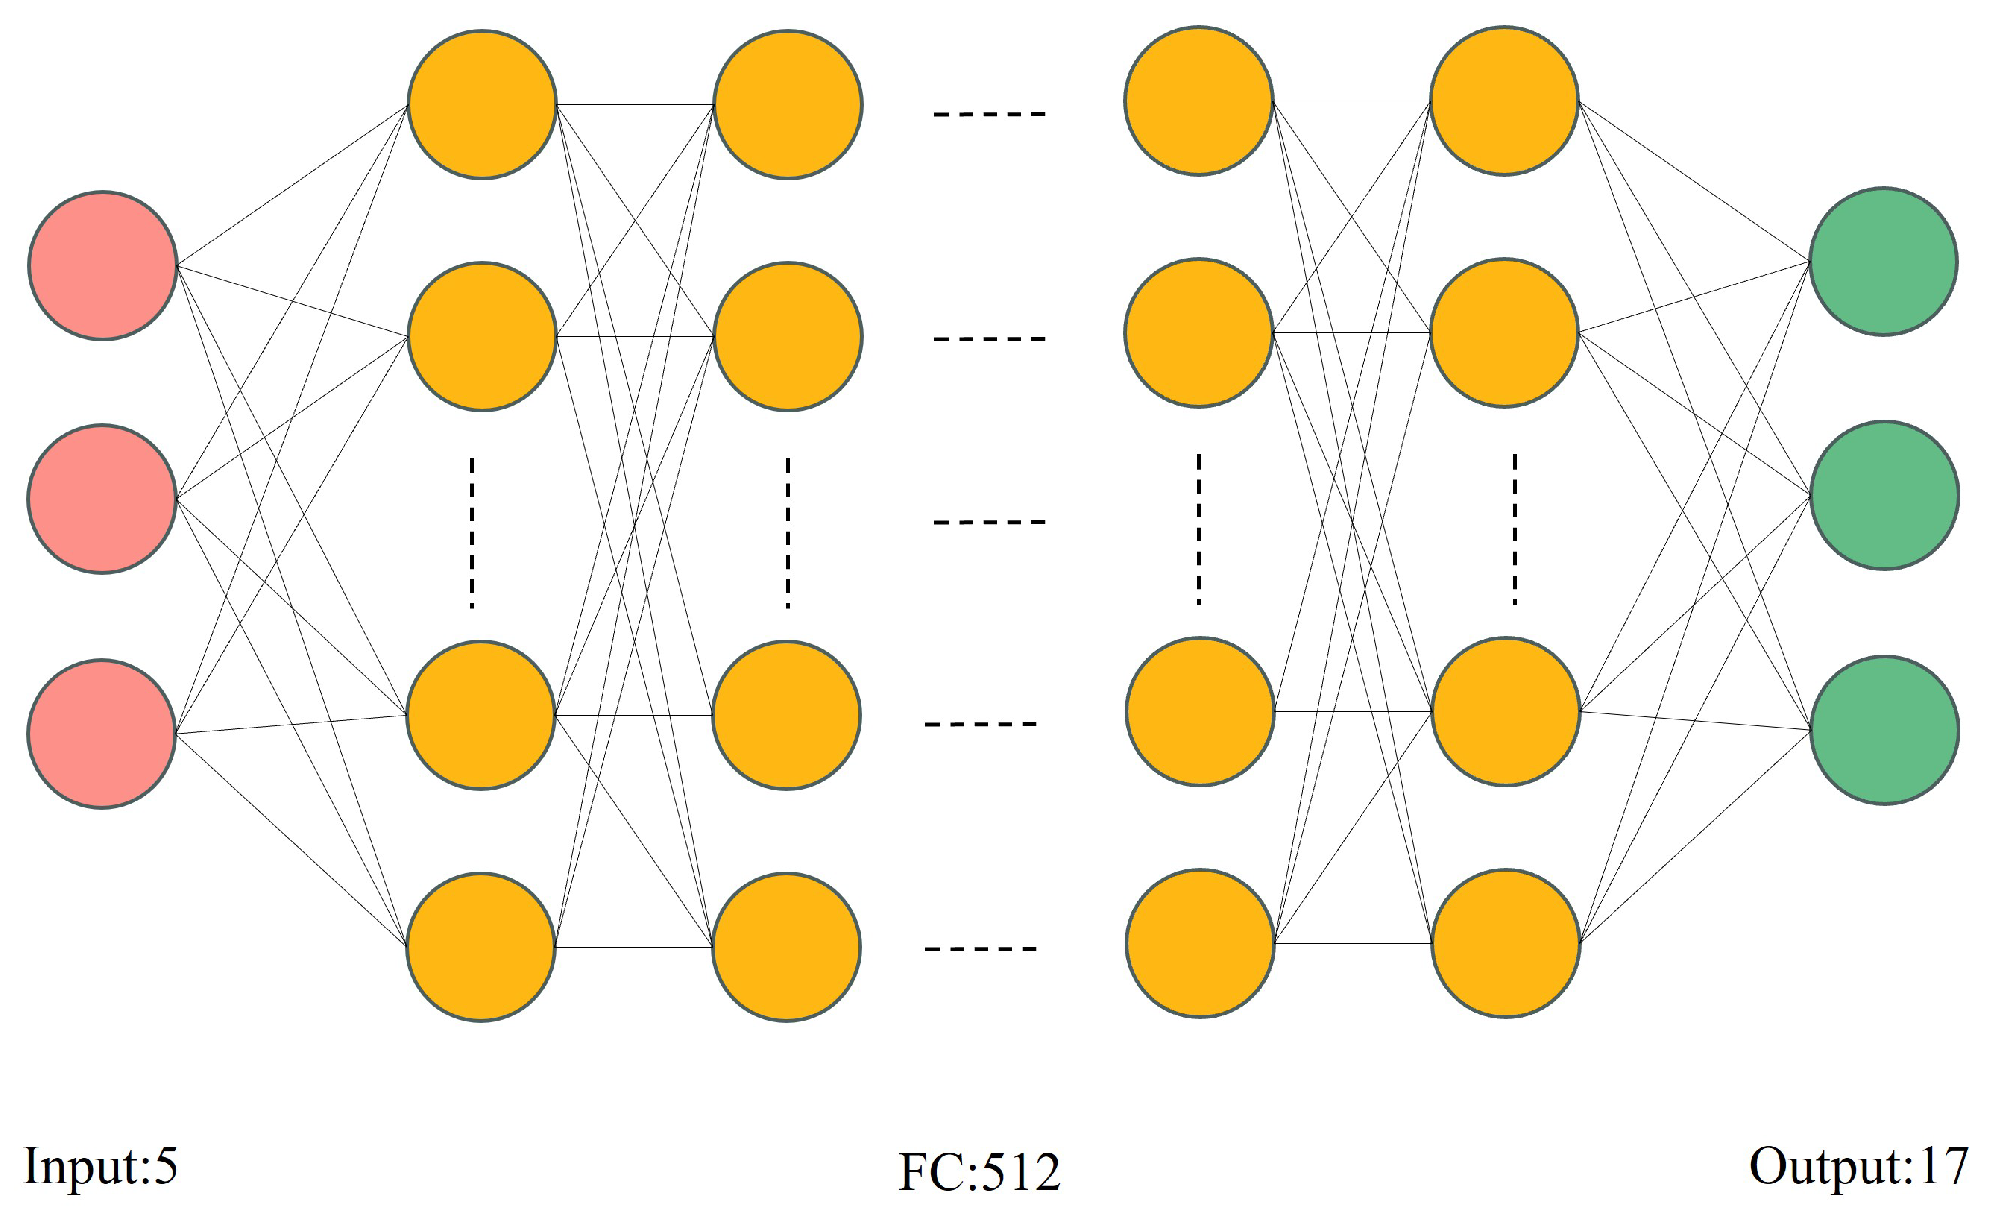
The surrogate network is implemented as a fully connected DNN with eight hidden layers and 512 neurons in each hidden layer. Rather than being fixed a priori, this configuration was selected through a controlled hyperparameter tuning process over candidate depths and widths, as discussed below. The final choice was made according to the validation set performance under a unified training protocol, with particular emphasis on the MAE, convergence stability, and overfitting tendency. In this sense, the adopted architecture should be regarded as the outcome of comparative optimization within the present dataset and simulation conditions rather than as an arbitrary preset. It provides sufficient capacity to model the coupled nonlinear dependence of the OAM mode-purity spectrum on the input parameters while avoiding unnecessary model expansion. The architecture of the adopted model is shown in Figure 1.
Figure 1.
Architecture of the parameter-based regression model used for canonical targets.
3.1.1. Training Configuration
The network parameters are optimized using the Adam optimizer, which was adopted after preliminary trials because it provided more stable convergence than the other tested optimization settings in this regression task. The remaining training-related settings, including the stopping strategy and regularization strength, were also determined through preliminary validation-oriented tuning rather than being manually fixed so that optimization stability and generalization performance could be balanced under the present dataset scale. All hidden layers use the rectified linear unit (ReLU) activation function [25]:
which introduces a simple non-saturating nonlinearity and helps mitigate vanishing-gradient issues during training.
To improve the generalization and reduce overfitting, early stopping is employed so that training terminates when the validation loss no longer decreases for a preset number of epochs. In addition, L2 regularization is incorporated into the objective to suppress excessively large weights and improve the robustness of the learned mapping.
For consistency with the later phase-map-based experiments, the mean absolute error (MAE) is treated as the primary error metric:
where N is the number of samples, is the reference value, and is the predicted value. MAE is adopted as the core accuracy indicator because it directly reflects the prediction deviation and is less sensitive to occasional outliers than the mean squared error.
To complement MAE, the coefficient of determination is also reported in the final evaluation so that the goodness of fit can be compared across the two surrogate settings using a common criterion. In addition, the relative error (RE) is used only as an auxiliary quantity for mode-wise qualitative analysis:
Because RE becomes numerically unstable when the reference value is close to zero—especially for weak modes—it is not used as a primary metric for model selection.
3.1.2. Architecture Comparison and Model Selection
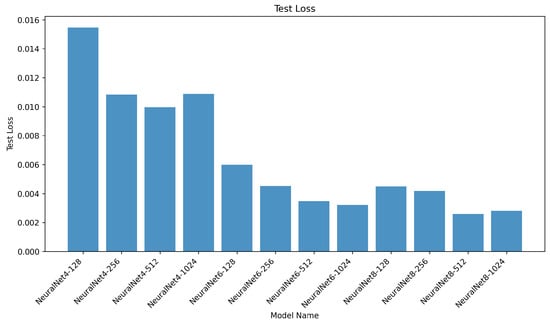
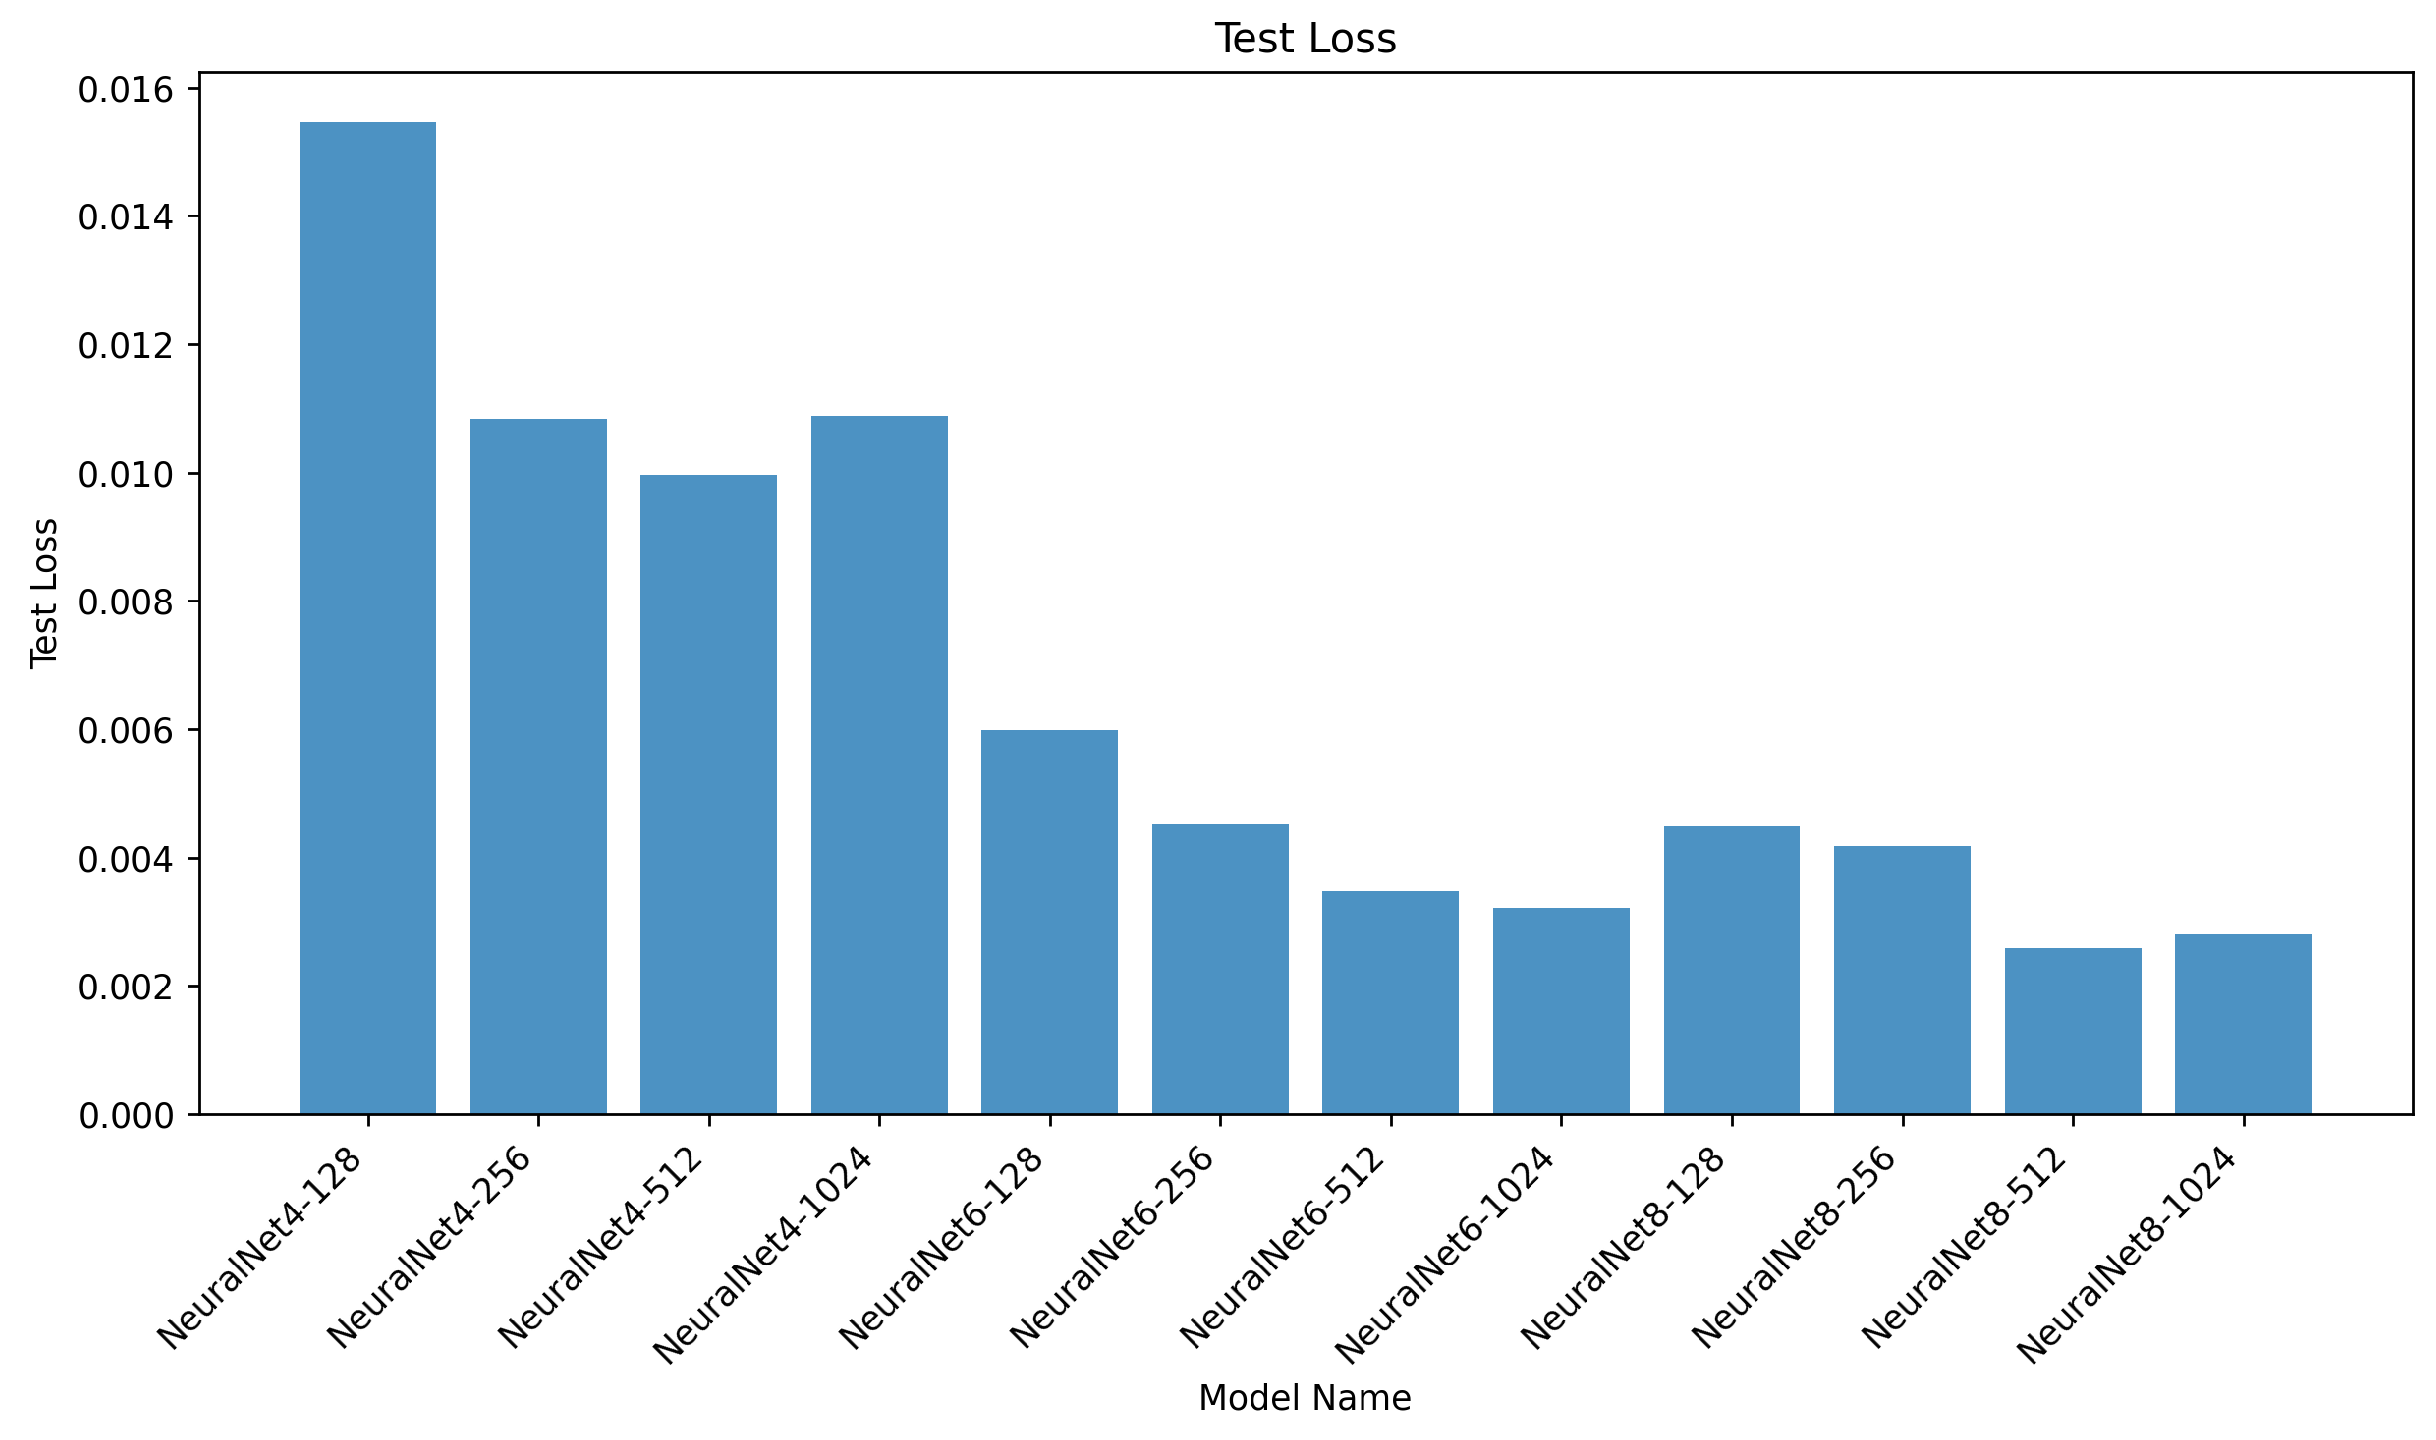
To determine a practical network configuration for numerical-parameter-based regression, several candidate fully connected DNN architectures were compared across different depths (4, 6, and 8 hidden layers) and widths (128, 256, 512, and 1024 neurons per layer). All candidate models were trained using the same data split, preprocessing procedure, optimizer type, stopping criterion, and evaluation protocol so that the comparison remained controlled and fair. The architectural selection was therefore based on comparative tuning within the same experimental setting rather than on arbitrarily chosen hyperparameters. The comparison results are summarized in Figure 2.
Figure 2.
Comparison of different architectures for the numerical-parameter-based regression model.
The comparison shows that the eight-layer network provides a favorable balance between the prediction accuracy and training stability. Relative to the four-layer and six-layer alternatives, it offers stronger representational capability while maintaining stable optimization behavior. In terms of width, 512 neurons per layer provide a practical compromise between model capacity and model complexity. Networks with 128 or 256 neurons show insufficient capacity for the present nonlinear regression task, whereas 1024 neurons yield only marginal improvement while increasing the complexity and showing a clearer tendency toward overfitting. Accordingly, the final numerical-parameter-based surrogate model adopted eight hidden layers with 512 neurons per layer. This setting was therefore retained as the optimized architecture for the subsequent experiments on the parameter-based regression path.
3.2. Phase-Map-Based Regression Model
Although explicit numerical parameterization is suitable for canonical targets, it becomes less convenient when the target geometry becomes more complex. To address this limitation, a phase-map-based regression model was constructed to learn the mapping from scattered-field phase distributions to the OAM mode-purity spectrum. In this setting, the scattered-field phase distribution is represented as a two-dimensional phase map and then regressed to the corresponding 17-dimensional OAM mode-purity vector. A ConvNeXt backbone [26] is used for feature extraction, and a global attention mechanism (GAM) [27] is incorporated to enhance feature aggregation for phase patterns that vary across target categories. This design was not fixed arbitrarily. Instead, the backbone family and attention-enhancement strategy were determined through comparative experiments under a unified validation protocol, and the ConvNeXt + GAM configuration was retained because it provided the most favorable trade-off between the regression accuracy, feature-extraction capability, and training stability for the present phase-map dataset.
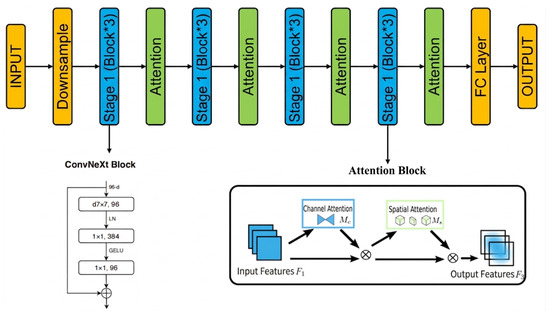
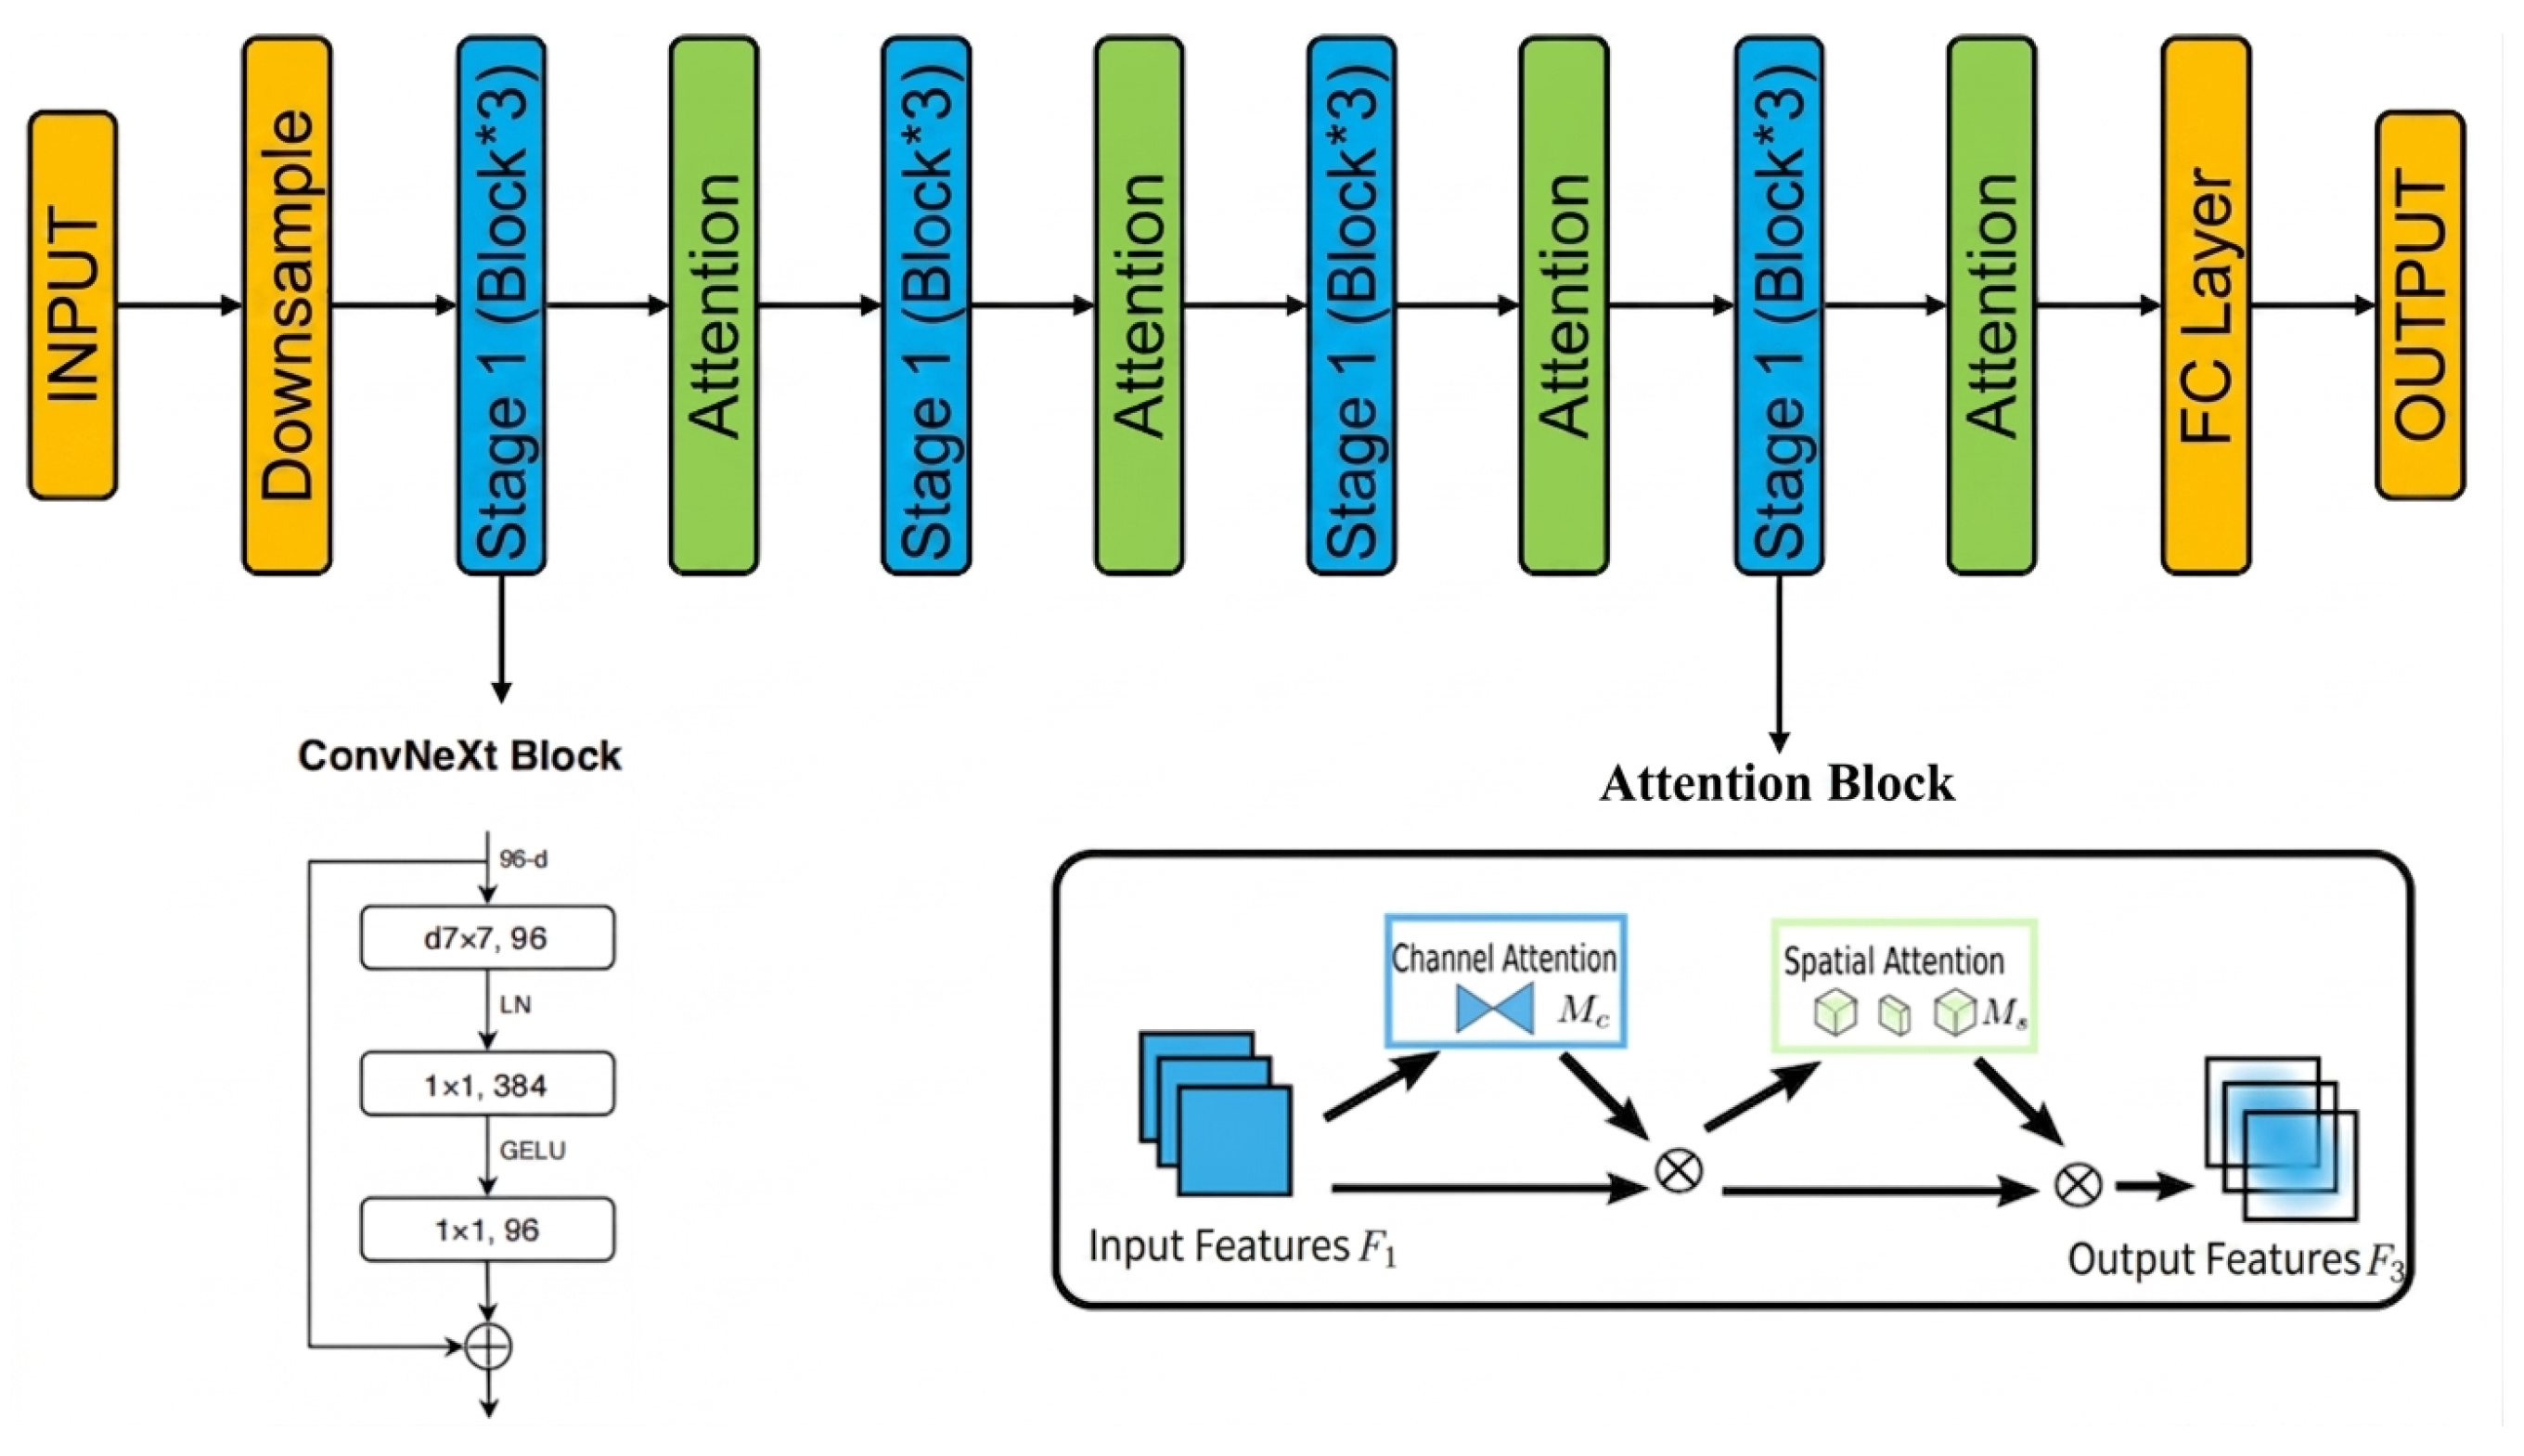
The overall architecture is shown in Figure 3. It follows a four-stage hierarchical design with progressive downsampling and channel expansion. The shallow stages mainly capture local phase variations, whereas the deeper stages extract more global structural patterns that are informative for regression of the OAM mode-purity spectrum. Compared with the parameter-based path, this representation sacrifices some physical explicitness but provides a more flexible surrogate description for geometrically complex targets within the same simulation framework.
Figure 3.
Overall architecture of the phase-map-based regression model built on a ConvNeXt backbone with GAM.
3.2.1. ConvNeXt Backbone
The ConvNeXt backbone contains four stages with progressively increasing channel dimensions, and each stage consists of several ConvNeXt blocks. A typical block includes depthwise convolution for spatial feature extraction, followed by pointwise operations, nonlinear activation, residual connections, and LayerNorm. Depthwise convolution reduces computational complexity while preserving spatial modeling capability, whereas LayerNorm improves the robustness under varying input distributions and practical batch sizes during regression training.
The Gaussian error linear unit (GELU) is adopted as the activation function. It provides a smooth nonlinearity that is widely used in modern convolutional architectures and supports stable optimization in deep networks. It is defined as
where is the cumulative distribution function of the standard normal distribution. An equivalent form using the Gaussian error function is
where denotes the Gaussian error function. Residual connections are used throughout the backbone to facilitate information flow and stabilize the optimization of deeper architectures.
3.2.2. Global Attention Mechanism
To improve feature aggregation for phase-map inputs, GAM modules are inserted at the end of selected ConvNeXt stages. Each module contains a channel-attention branch and a spatial-attention branch. In the channel-attention branch, global average pooling and global max pooling are used to aggregate spatial information, and a lightweight multilayer perceptron generates channel-wise attention weights. These weights are then used to rescale the feature maps and emphasize informative channels.
In the spatial-attention branch, channel-compressed feature maps are convolved to generate a spatial attention map that highlights salient regions in the phase image. The resulting spatial weights are broadcast and multiplied with the feature maps to strengthen the representation of locally important structures. When introduced at multiple scales, the attention mechanism helps the network focus on phase-sensitive regions that are relevant to regression of the OAM mode-purity spectrum across the target set, namely, Plate, Spiral, Spite, Missile, and Dihedral, while avoiding the need for explicit geometric parameterization.
After feature extraction and attention enhancement, global average pooling compresses the two-dimensional feature maps into a one-dimensional feature vector. This vector is normalized by LayerNorm and then passed through a fully connected layer to obtain a 17-dimensional prediction of the OAM mode-purity spectrum.
3.2.3. Experimental Configuration for Phase-Map Regression
All experiments for the phase-map-based regression model are implemented in PyTorch (version 2.1.0). The dataset was stored in CSV format, where each row contains the file path of a phase map and its corresponding 17-dimensional OAM mode-purity vector. To reduce the scale differences between different output dimensions, Min–Max normalization was applied to each component of the mode-purity vector:
where y is the original value, and are the minimum and maximum values along that output dimension, and is the normalized result.
The dataset was divided into training, validation, and test sets with a ratio of 7:1.5:1.5. Data augmentation, including random cropping, resizing, and intensity normalization, was applied only to the training set in order to improve the robustness to phase-map variations. The validation and test sets remained fixed except for the above output normalization so as to ensure stable and fair evaluation. As noted in Section 2, the splits were constructed from non-overlapping samples under the prescribed simulation workflow, which reduced the risk that closely related neighboring samples led to overoptimistic test performance.
To further stabilize the training and improve generalization, lightweight regularization strategies, such as DropPath and LayerScale, were employed. DropPath randomly removes residual branches during training, while LayerScale introduces learnable scaling factors on residual paths to support stable optimization in deep architectures.
For model comparison, all candidate backbones were trained and evaluated under the same data split, preprocessing procedure, augmentation policy, optimizer setting, and stopping criterion. Baseline models were therefore not compared under arbitrary default settings, but under a unified experimental protocol intended to improve fairness. In this sense, the final phase-map-based configuration should also be interpreted as the result of validation-driven model selection rather than as a manually fixed architecture. The comparison was used to identify which architectural family was more suitable for this simulation-level regression task rather than to claim universal superiority beyond the present data conditions.
3.2.4. Evaluation Metrics
To ensure consistency between the two surrogate settings, MAE and are reported as the primary metrics throughout the main comparative analysis results. MAE reflects the absolute prediction deviation, whereas measures the goodness of fit. In the phase-map-based setting, MSE and RMSE are additionally reported as supplementary metrics because they are useful for describing the error magnitude in squared and root-squared forms and are commonly used in image-based regression studies.
The MSE is defined as
the RMSE is
and the MAE is given by
where N is the number of samples, is the true value, and is the predicted value.
The coefficient of determination is defined as
where is the mean of the true values. The value of lies within , and values closer to 1 indicate better agreement between the prediction and the reference data.
Taken together, the two surrogate settings provide complementary routes for the OAM mode-purity spectrum prediction under the present simulation framework. The numerical-parameter-based model is more suitable when the target can be described by a compact set of physically meaningful inputs, whereas the phase-map-based model extends the regression task to targets whose geometry is more difficult to encode explicitly. This complementarity is a central feature of the proposed dual-path surrogate framework and also clarifies the intended scope of the present study as a simulation-level investigation rather than a direct validation for real measurement environments.
4. Results and Discussion
This section evaluates the proposed dual-path surrogate framework for predicting OAM mode-purity spectra in metallic-target vortex-wave scattering. The analysis follows the two regression settings introduced in Section 3. First, numerical-parameter-based regression results are reported for the canonical targets Plate, Spiral, and Spite. Then, phase-map-based regression results are presented for the broader target set, namely, Plate, Spiral, Spite, Missile, and Dihedral. In addition to predictive accuracy, the discussion examines how target characteristics, modal distributions, and input representations affect surrogate-model behavior. All results are obtained under the prescribed simulation workflow and should therefore be interpreted as validation of a simulation-level surrogate framework.
4.1. Numerical-Parameter-Based Prediction Results
4.1.1. Correlation Analysis
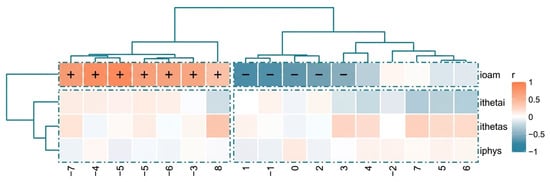
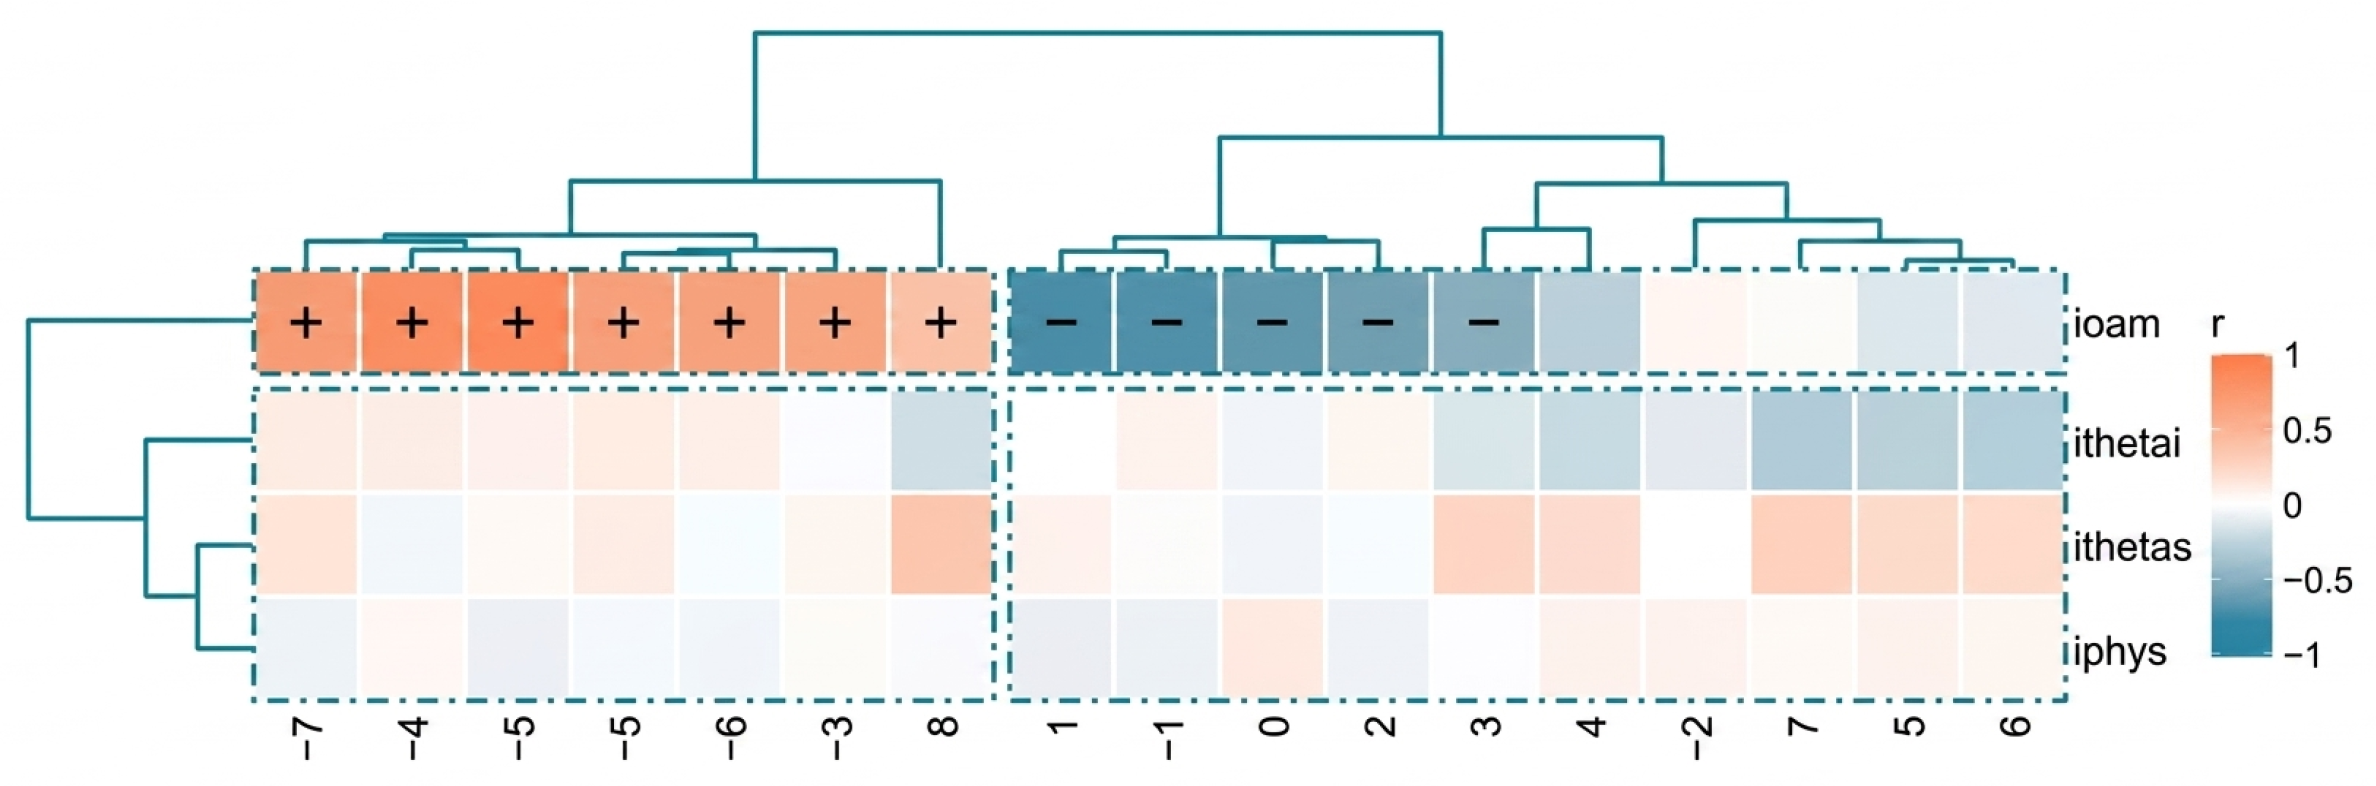
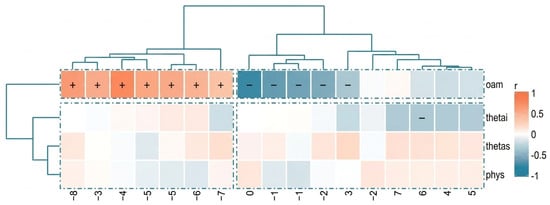
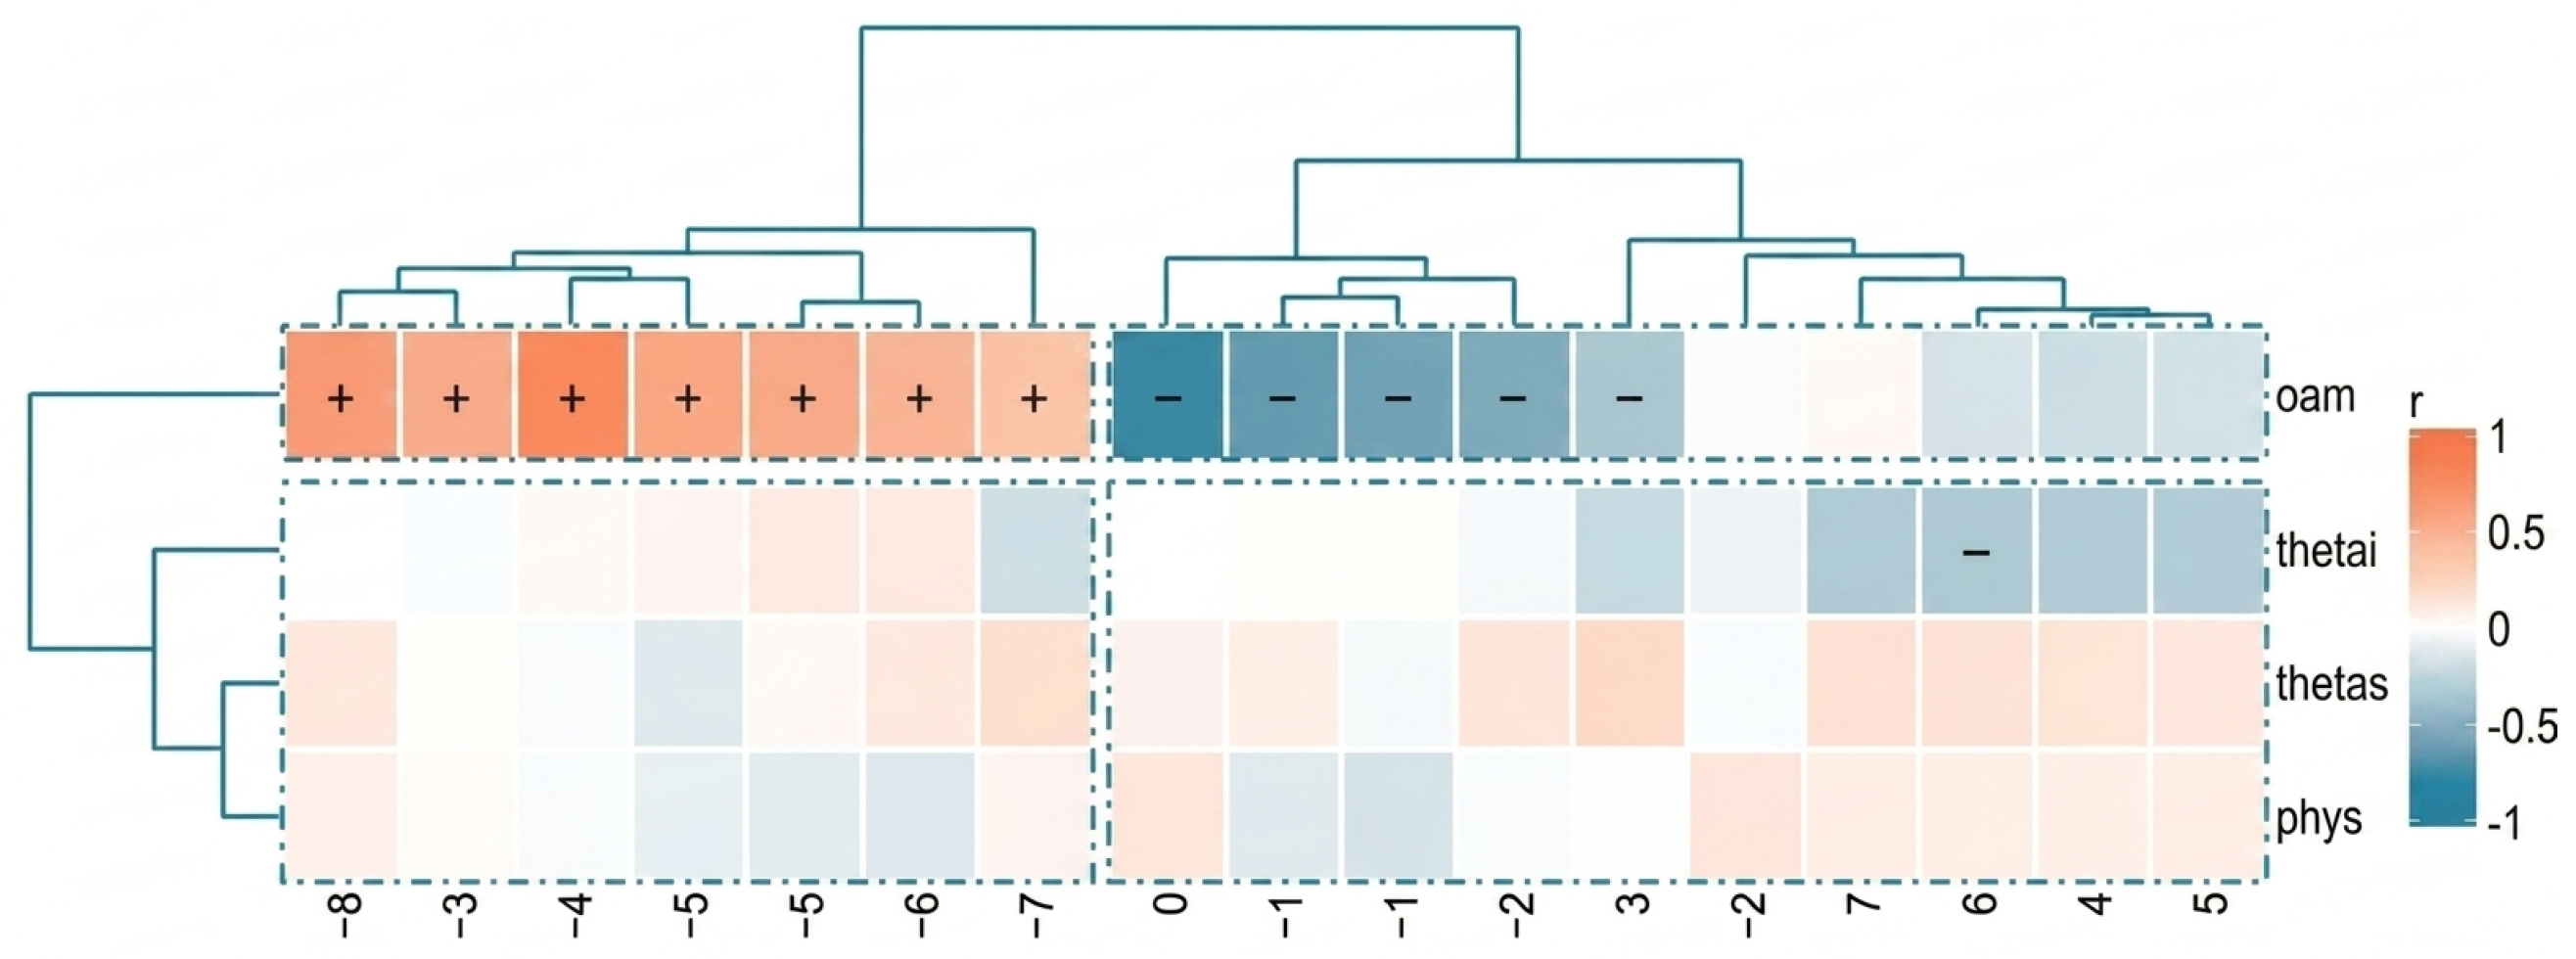
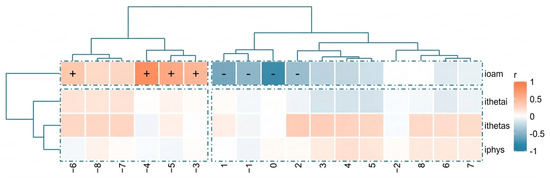
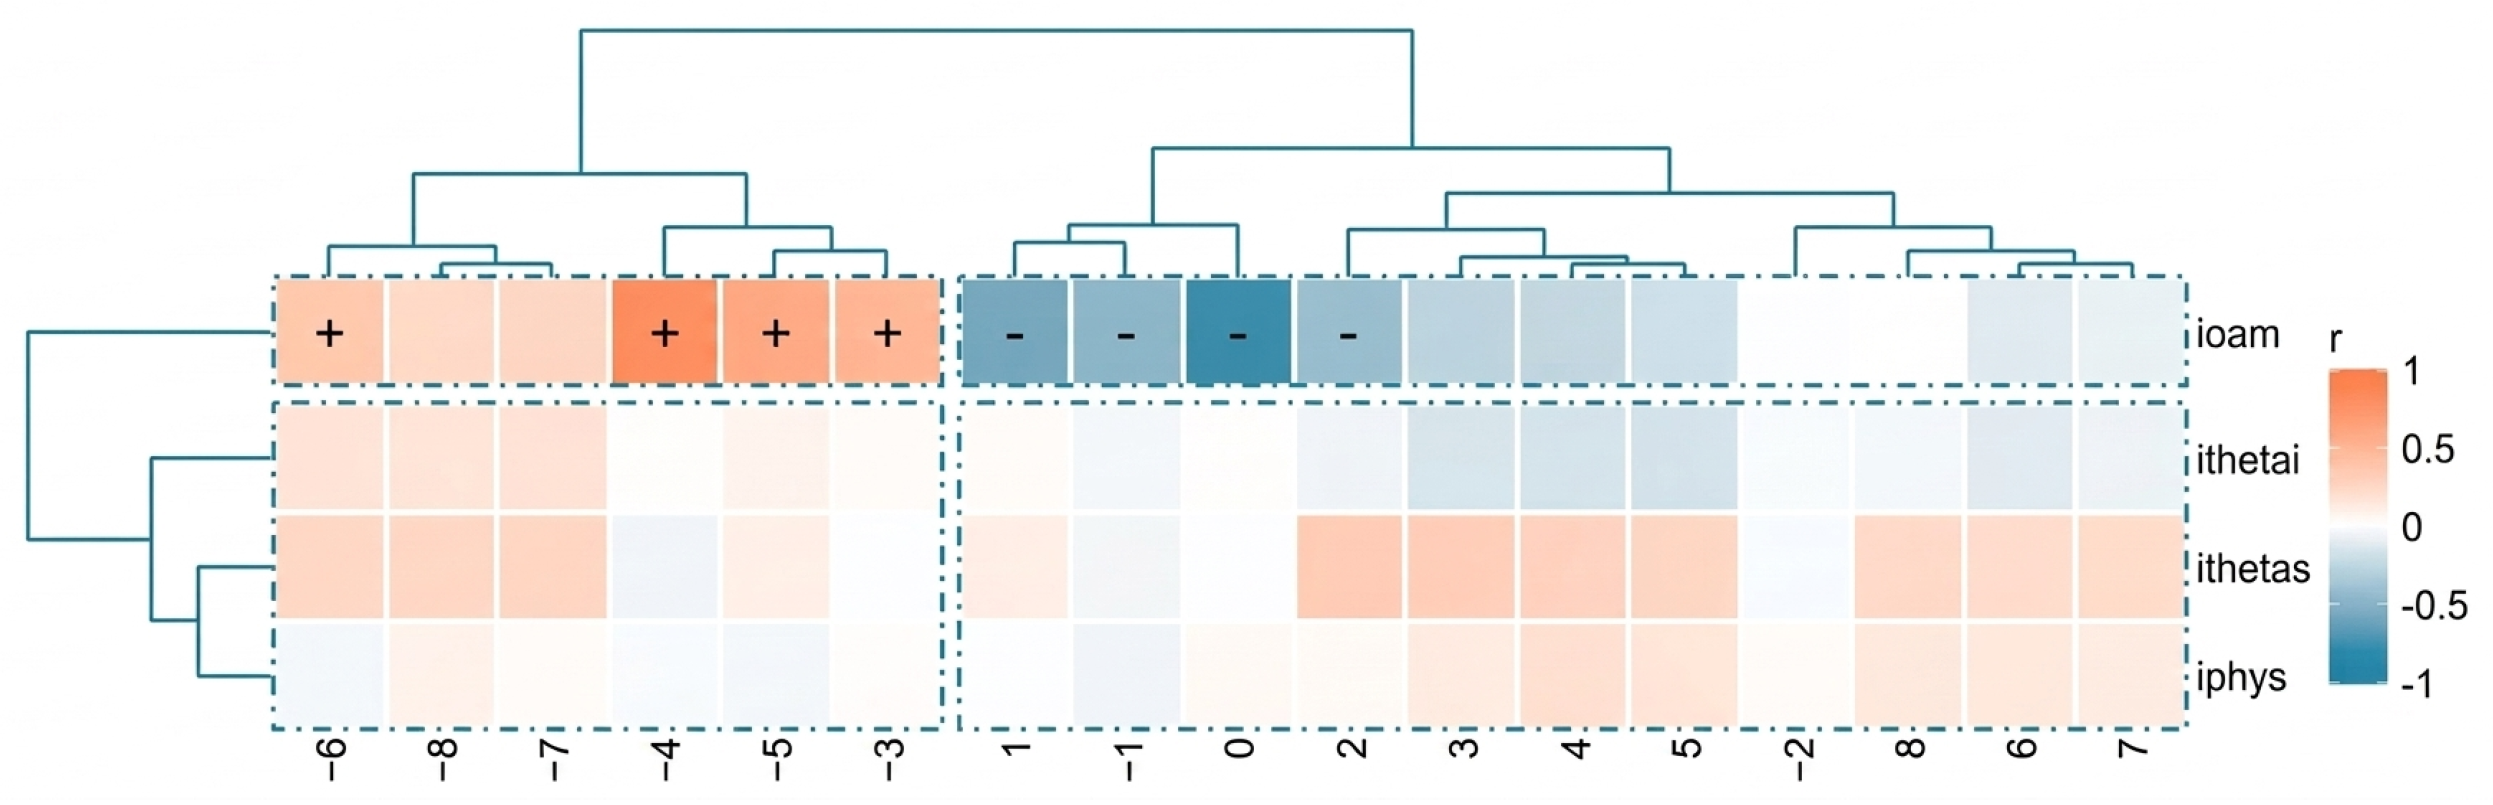
Before evaluating the regression model, Pearson correlation coefficients are calculated to characterize the linear relationships between the five input variables, namely, frequency, incident OAM order, incidence angle, scattering angle, and azimuth, as well as the 17-dimensional OAM mode-purity vector. The correlation maps for Plate, Spiral, and Spite provide a preliminary view of the parameter sensitivity and help explain why a nonlinear surrogate is required.
For Plate, as shown in Figure 4, the incident OAM order exhibits the strongest correlation with the output modal purities, whereas the angular variables show a comparatively weaker influence. This suggests that for the planar target under the present PO-based reference workflow, the scattered modal response is dominated mainly by the incident topological charge, with relatively limited coupling from the other physical variables.
Figure 4.
Pearson correlation coefficient matrix for the Plate target.
For Spiral and Spite, the correlation patterns differ markedly from that of Plate, as shown in Figure 5 and Figure 6. In these two cases, both the incident OAM order and the angular variables exhibit more distributed and more pronounced correlations with the output modes. This reflects stronger geometric and directional effects, as well as a higher degree of parameter coupling in the scattering response.
Figure 5.
Pearson correlation coefficient matrix for the Spiral target.
Figure 6.
Pearson correlation coefficient matrix for the Spite target.
Overall, most input–output pairs show only modest linear correlation. This indicates that the mapping from scattering parameters to OAM mode-purity spectra is inherently nonlinear, and therefore, motivates the use of nonlinear surrogate models.
4.1.2. Results for the Plate Target
The numerical-parameter-based regression model was first evaluated on the Plate dataset. Before training, all angular variables were converted from degrees to radians, and Min–Max normalization was applied to both the input features and the output labels:
where y is the raw value, and are the minimum and maximum values in the dataset, and is the normalized value.
The dataset was divided into training, validation, and test sets with a ratio of 70%/15%/15%. The training set was used for parameter optimization, the validation set was used for early stopping and model selection, and the test set was reserved for final evaluation. As noted in Section 2, these subsets were formed from non-overlapping parameter combinations to reduce the risk of overly optimistic generalization estimates.
During training, both the training loss and the validation loss decrease rapidly and stabilize after approximately 200 epochs, with no clear increase in the validation loss. This indicates stable convergence and no obvious sign of severe overfitting under the present setting.
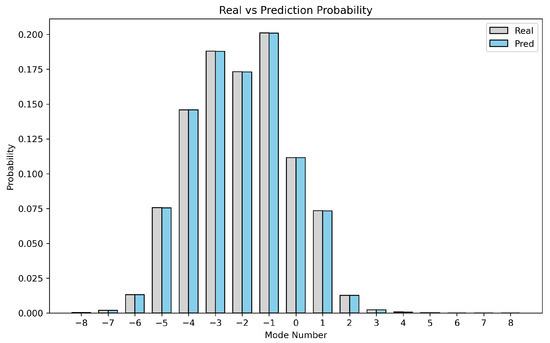
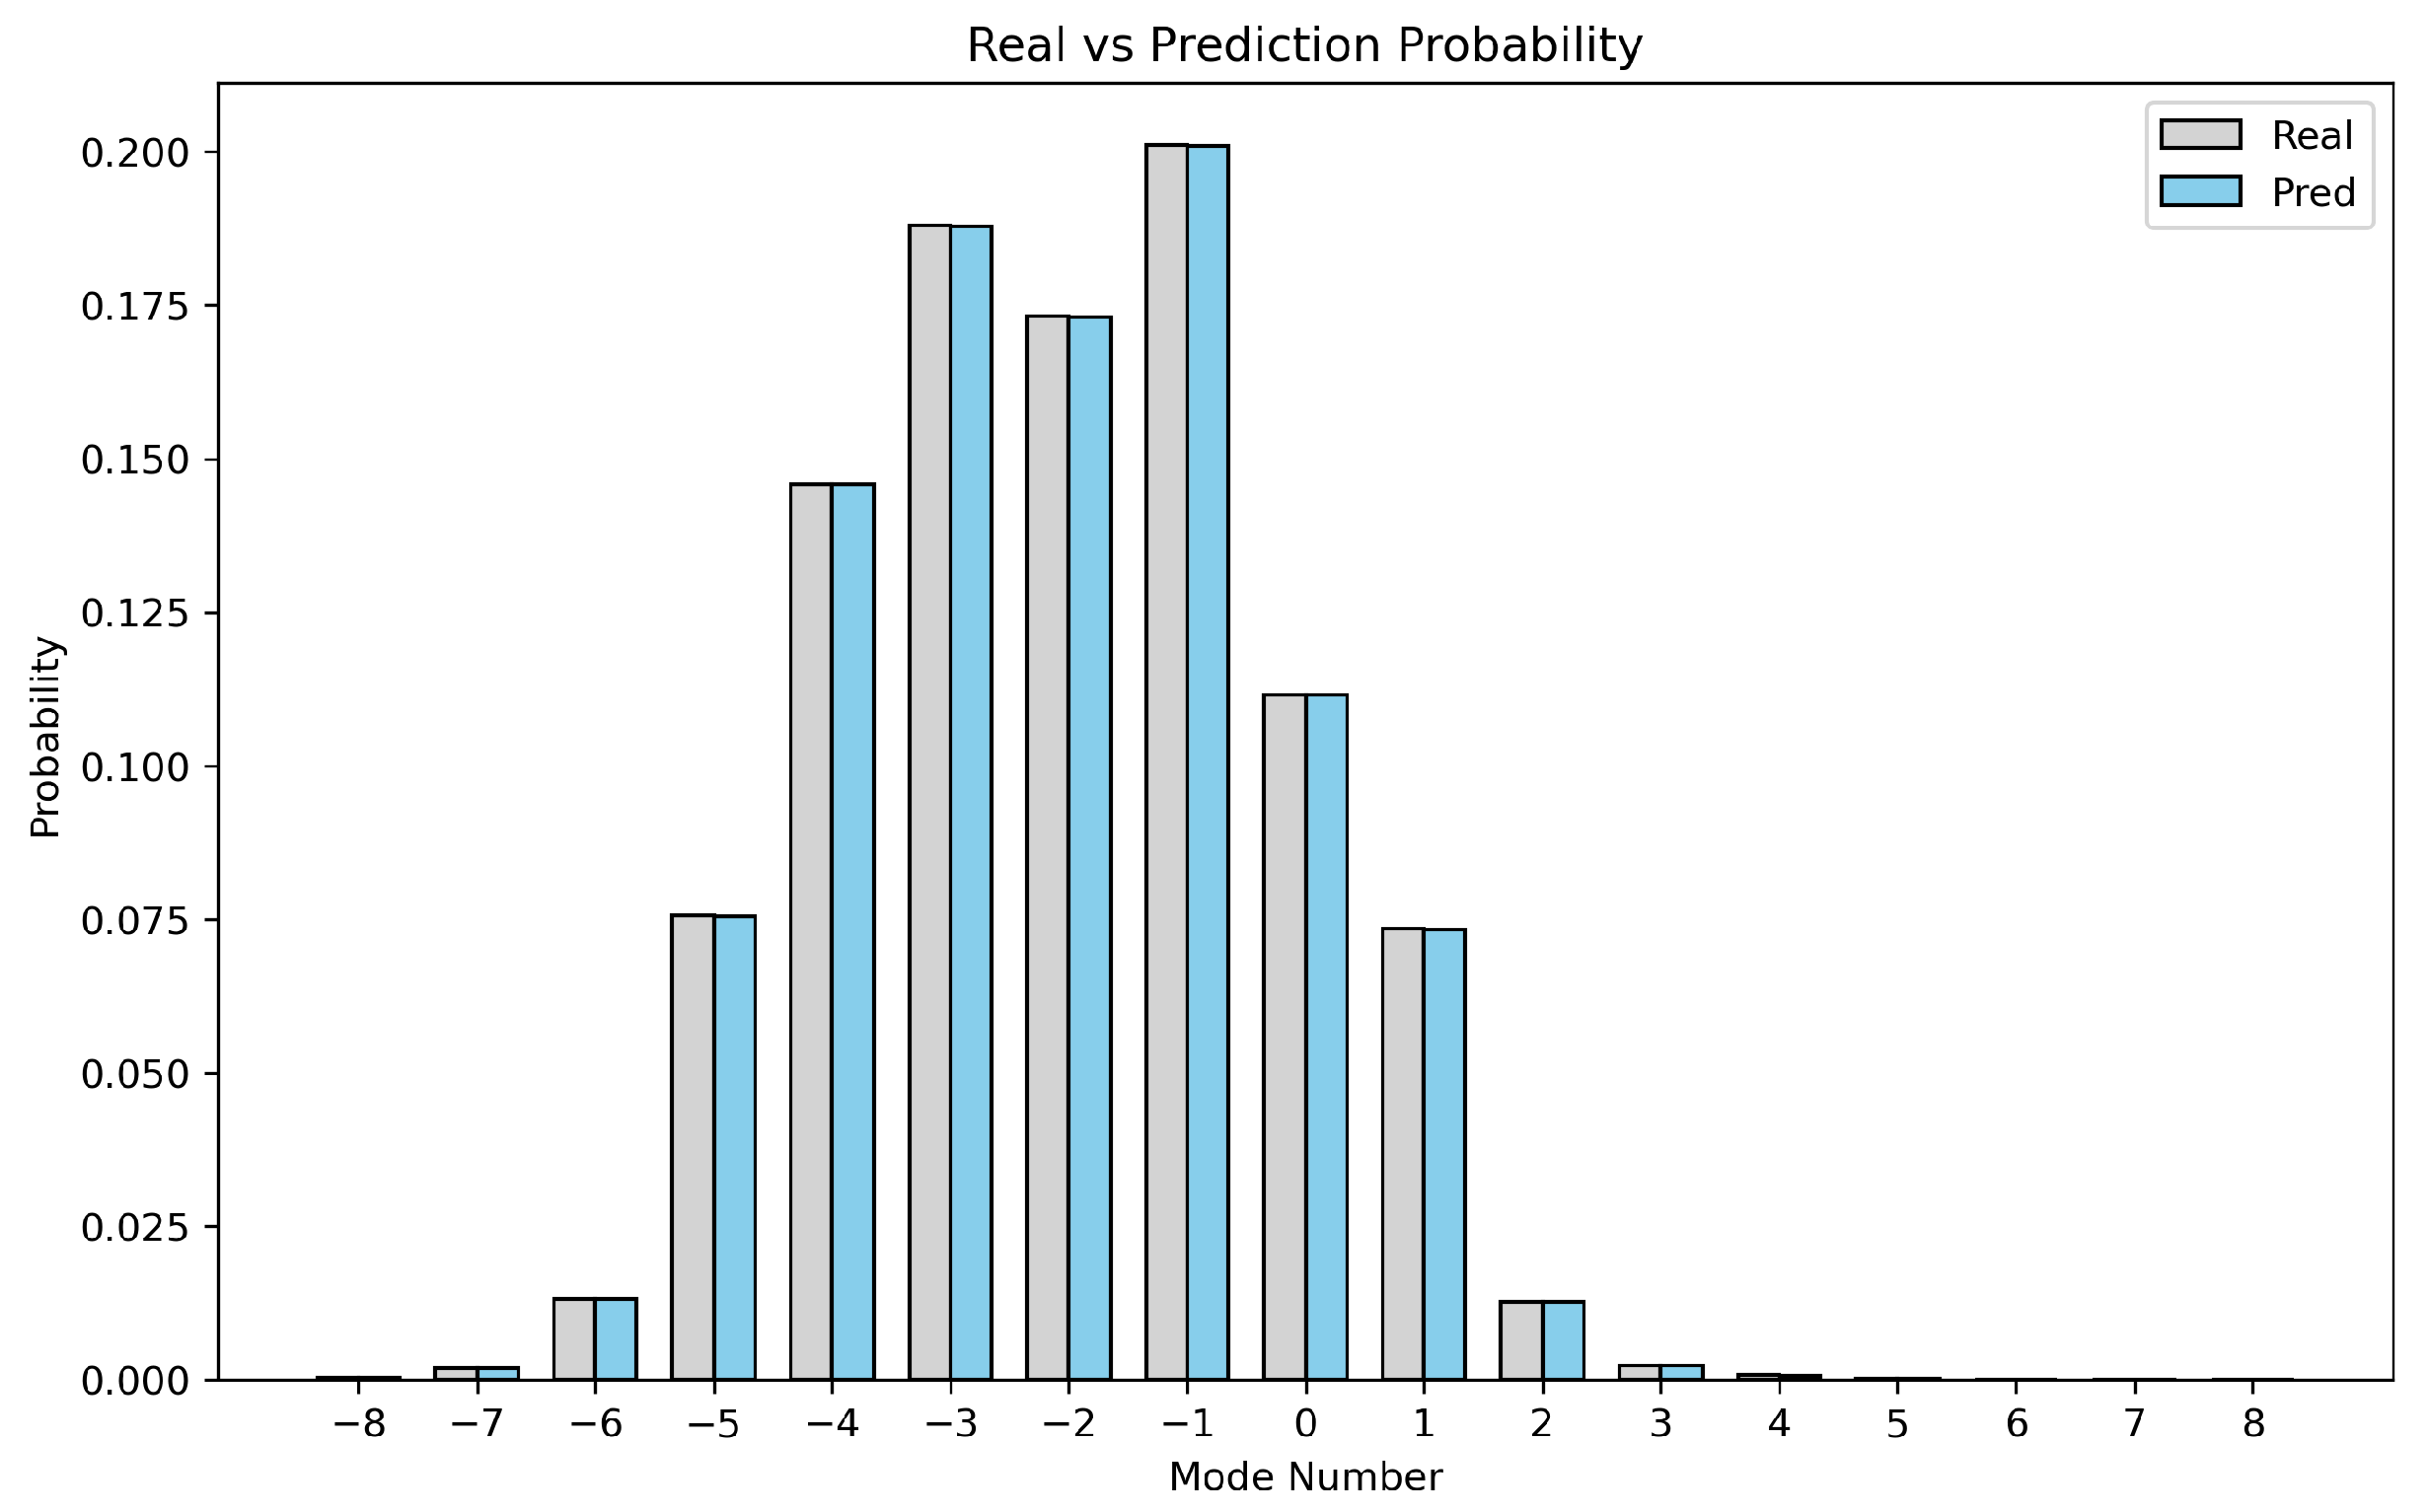
On the Plate test set, the surrogate achieves a mean absolute error of , indicating a highly accurate prediction of the scattered OAM mode-purity spectrum. Representative examples are shown in Figure 7. The dominant modes and the overall spectral shape are reproduced with close agreement across different incidence conditions. These results confirm that for well-parameterized canonical targets, the numerical-parameter-based model can accurately approximate the nonlinear mapping from scattering parameters to OAM modal spectra.
Figure 7.
Comparison between predicted and reference mode-purity spectra for the Plate target using the numerical-parameter-based regression model.
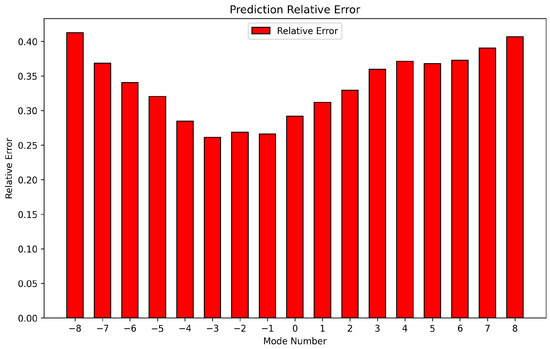
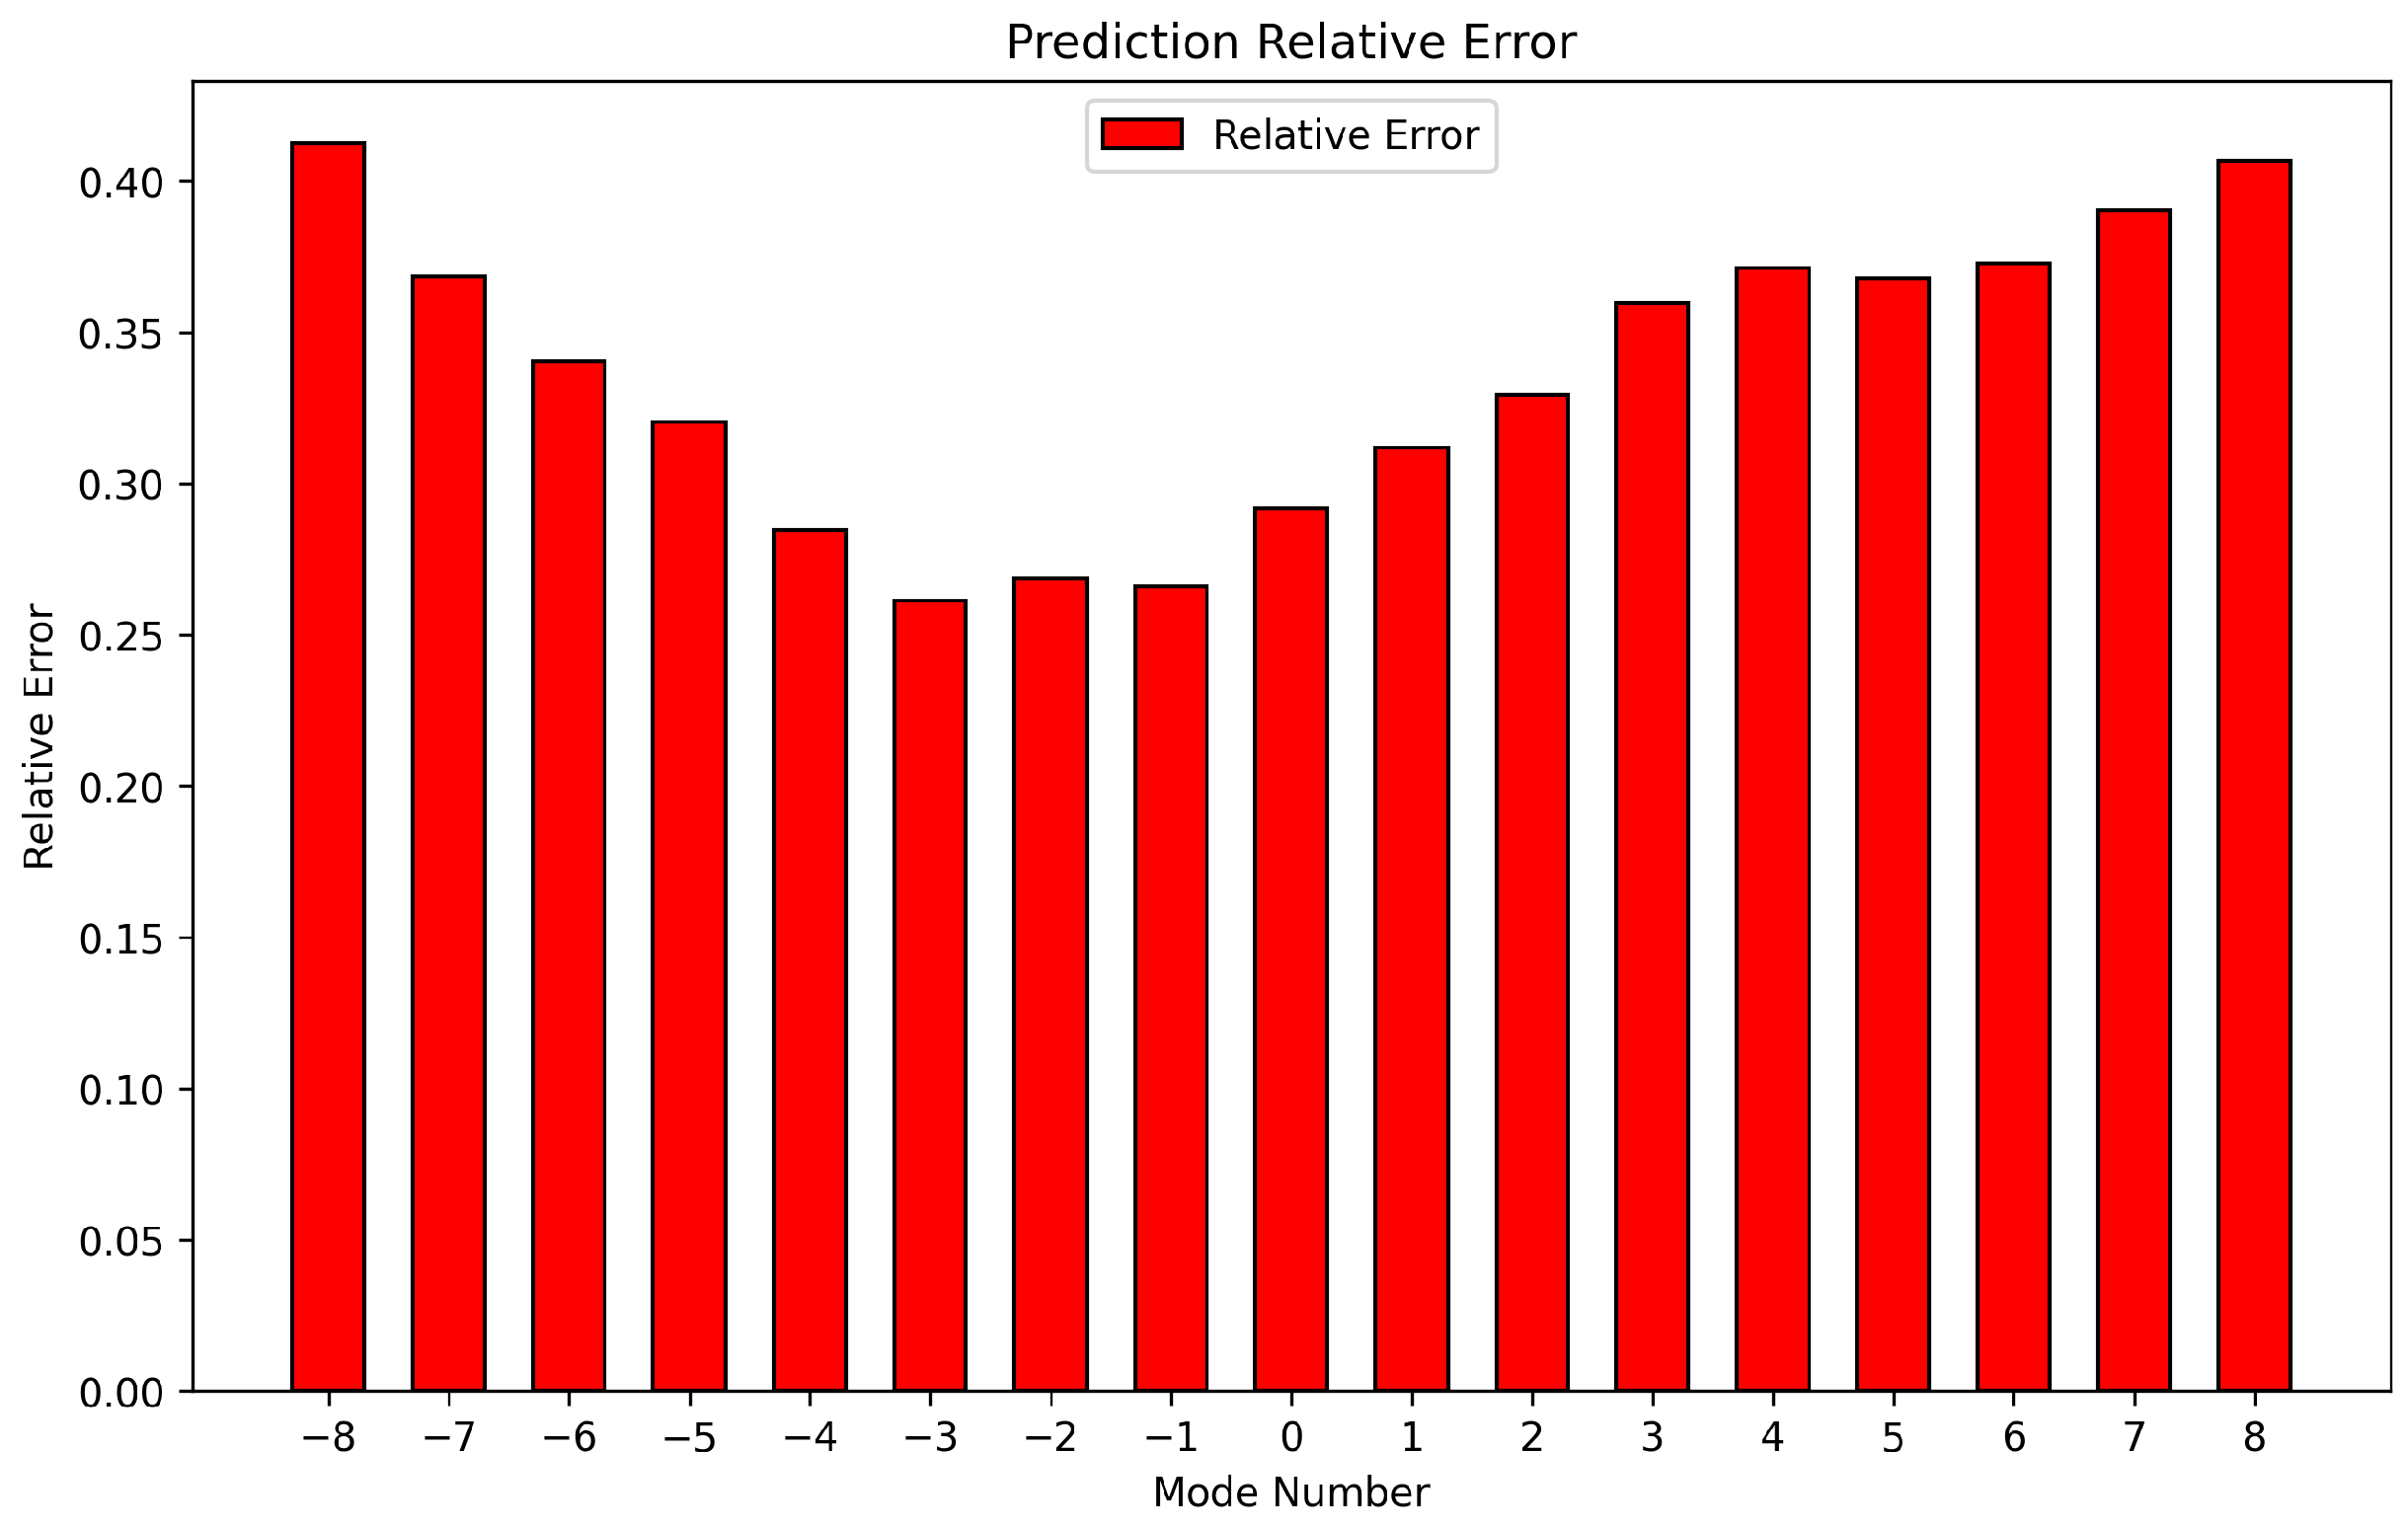
Modes with low purity tend to exhibit larger relative errors. This is mainly due to two factors. First, weak modes account for only a small fraction of the total modal energy, and thus, even a small absolute deviation may correspond to a relatively large normalized error. Second, such modes appear less frequently as dominant responses in the dataset, and therefore, contribute less to the overall training objective. As a result, the surrogate is naturally optimized toward accurate recovery of the dominant spectral components.
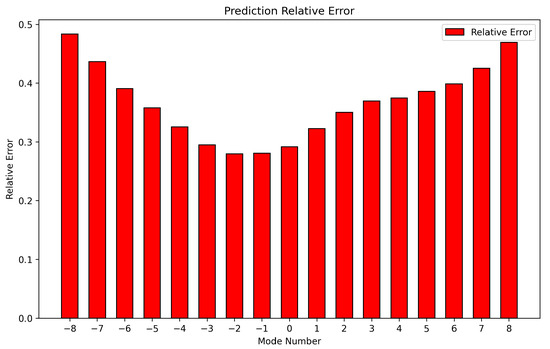
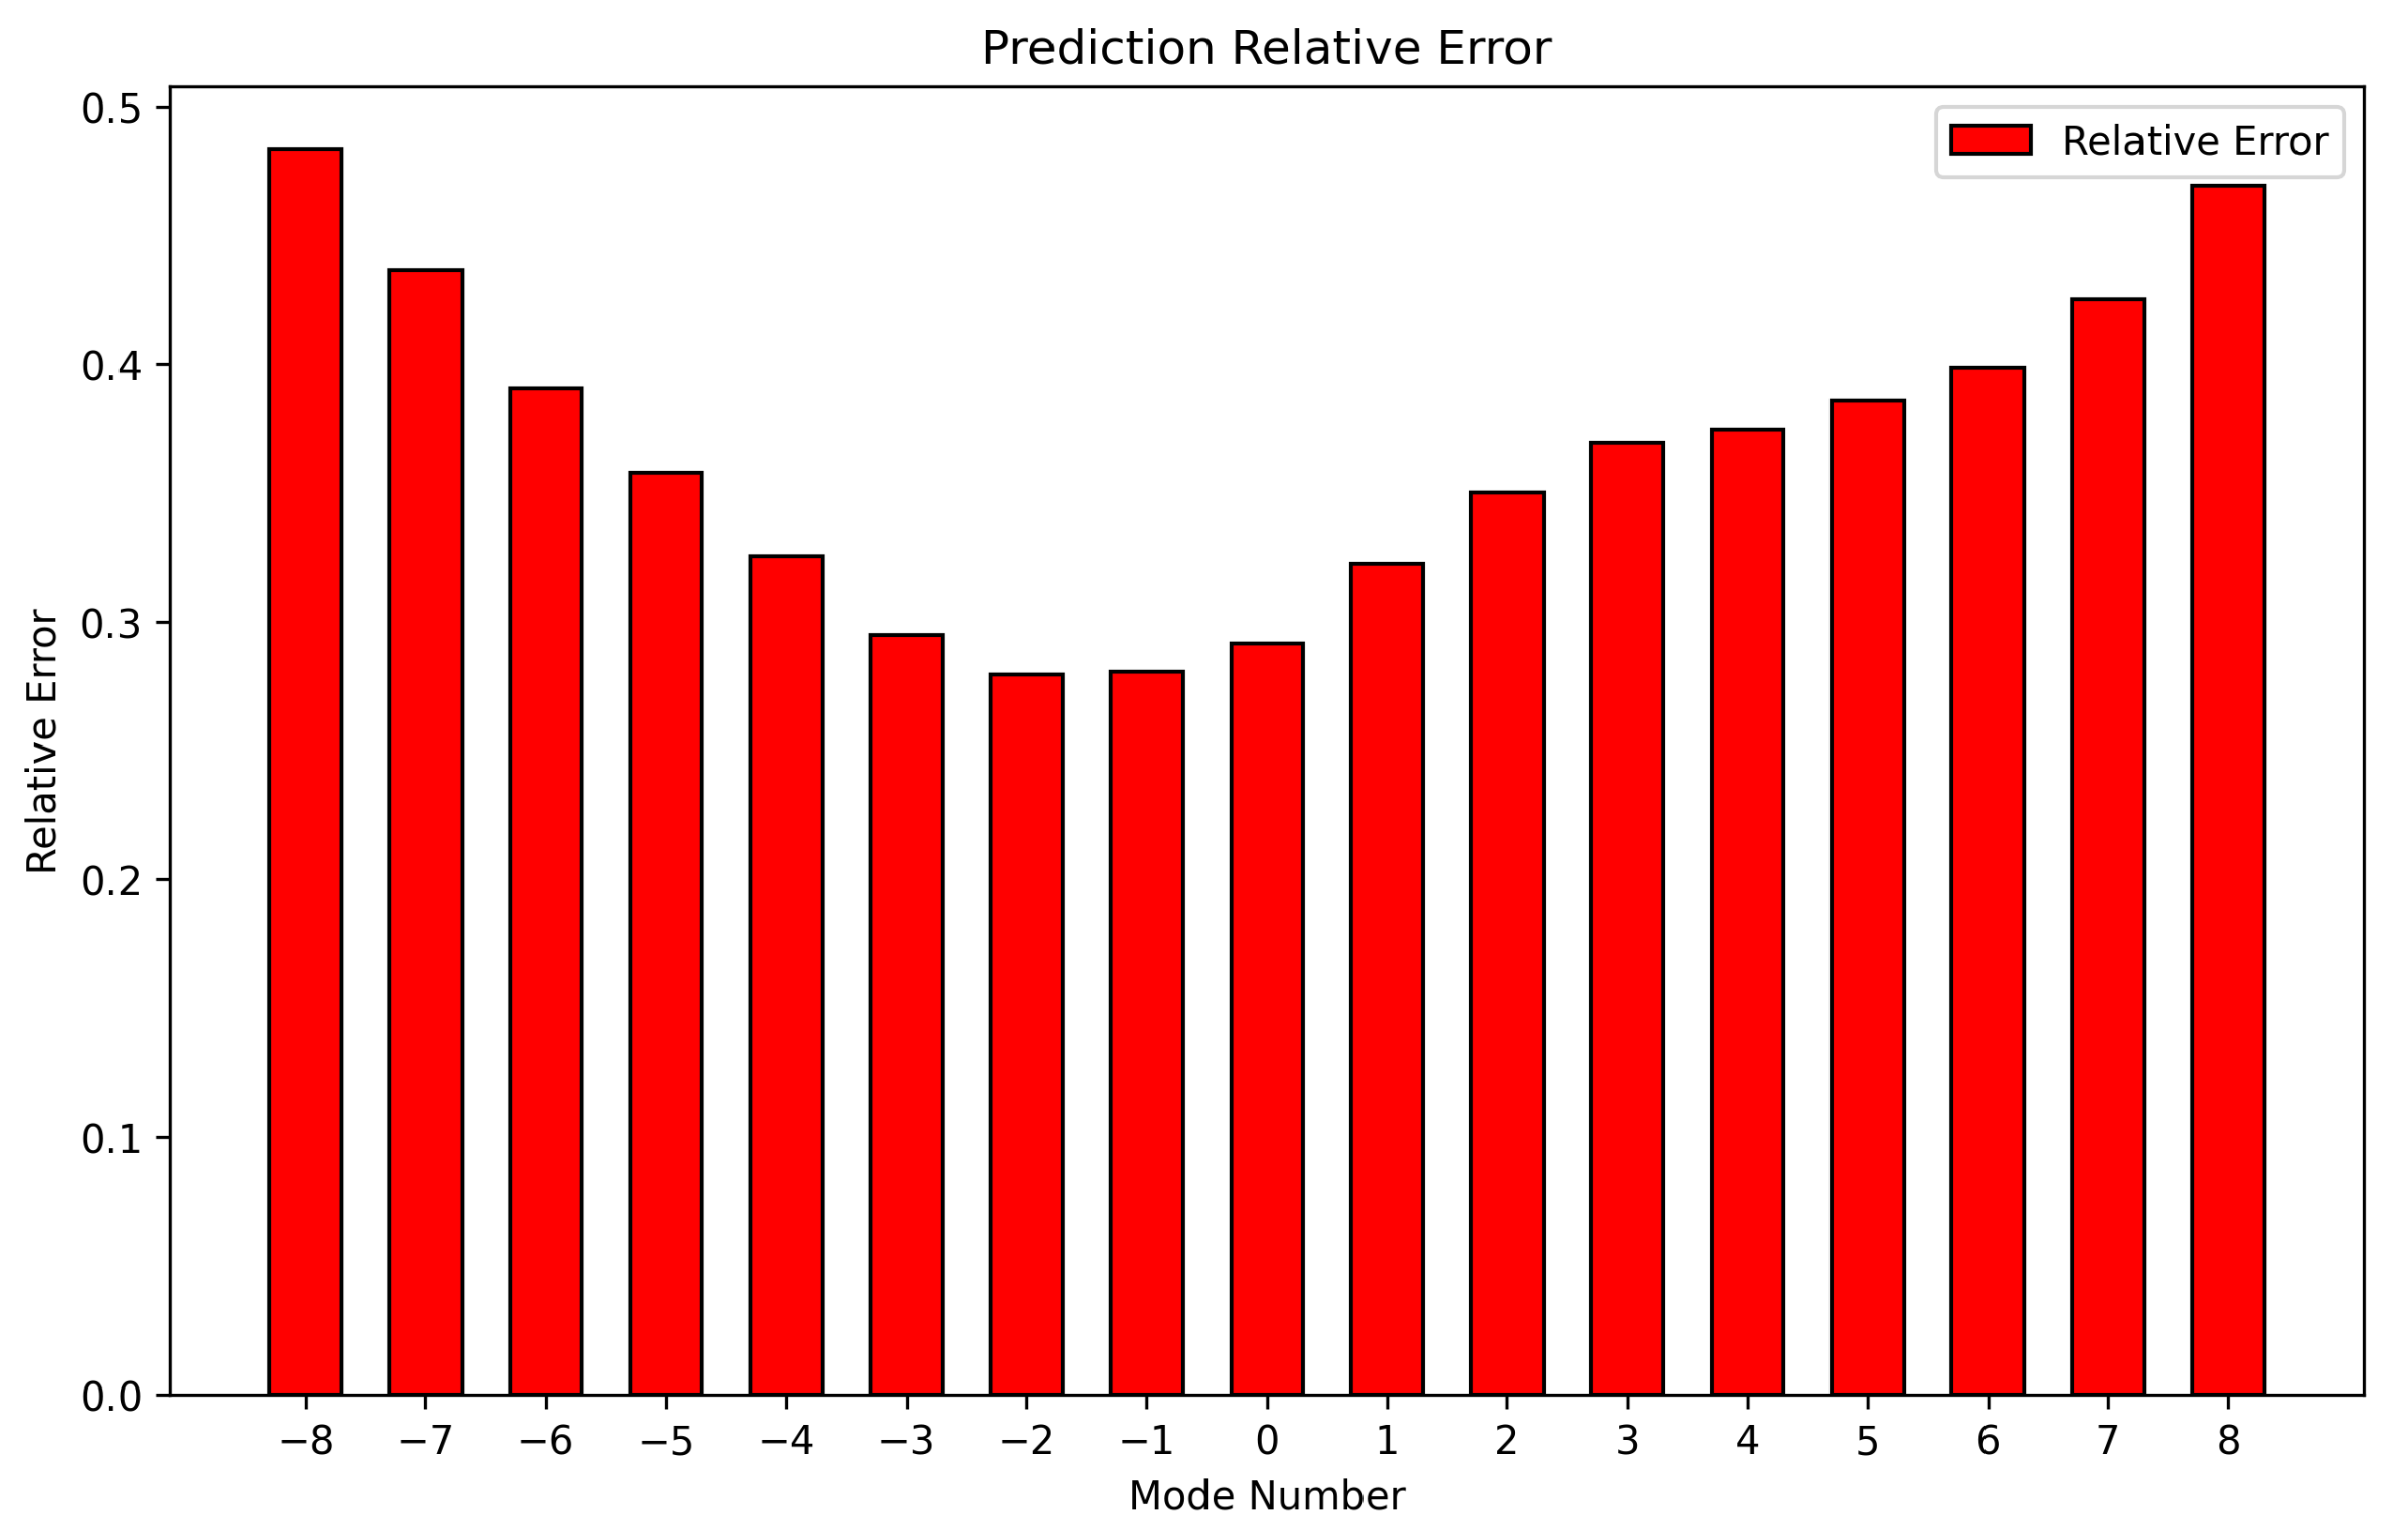
Figure 8 further shows the mode-wise relative errors for the Plate dataset. The dominant modes exhibit low errors, whereas larger deviations mainly appear in weaker modes with limited sample support. Compared with the phase-map-based regression model discussed later, the numerical-parameter-based model achieves substantially higher precision for this target (MAE versus MAE ), although its applicability remains limited to cases with explicit physical parameterization.
Figure 8.
Normalized relative error distribution across the 17 OAM modes for the Plate dataset.
4.1.3. Results for Spite and Spiral
The numerical-parameter-based regression model was further evaluated on the Spite and Spiral datasets to examine its robustness across canonical targets with different scattering characteristics. These datasets share the same simulation settings and input features as the Plate case, and each target contained samples.
For Spite, the average test MAE is , whereas for Spiral, it is . Together with the Plate result, these values indicate that the proposed model remains effective across canonical targets with different modal structures and different degrees of parameter coupling. Although the prediction difficulty varies between targets, the surrogate consistently preserves the dominant spectral information.
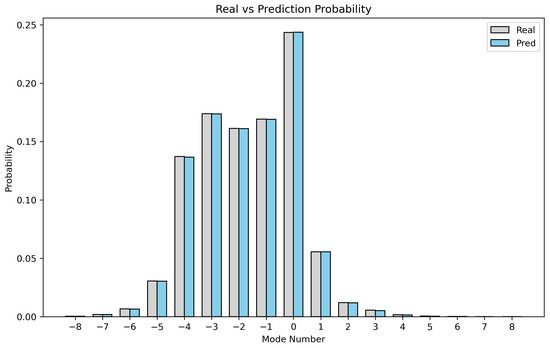
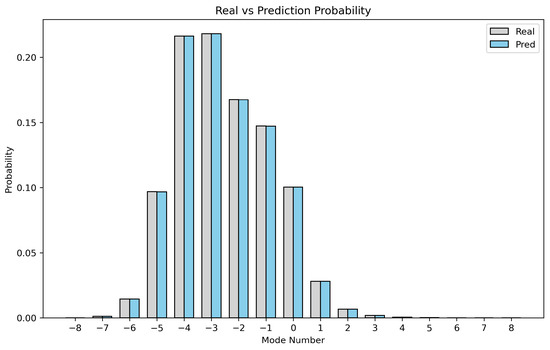
Figure 9 and Figure 10 compare the predicted and reference mode-purity spectra for Spite and Spiral, respectively. Despite clear differences from the Plate case, including different modal proportions and angular dependence, the model reproduces the dominant modes and the overall spectral envelope with good agreement. This suggests that the DNN-based surrogate learns a flexible nonlinear mapping rather than merely fitting a single target-specific response pattern.
Figure 9.
Predicted and reference mode-purity spectra for the Spite target.
Figure 10.
Predicted and reference mode-purity spectra for the Spiral target.
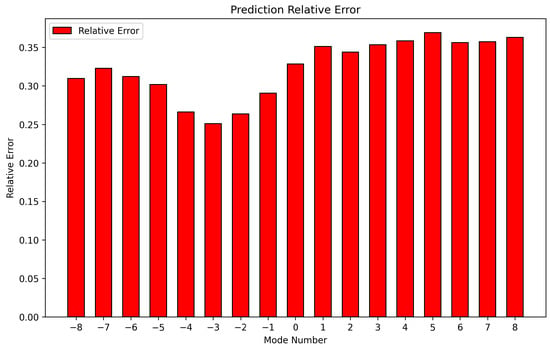
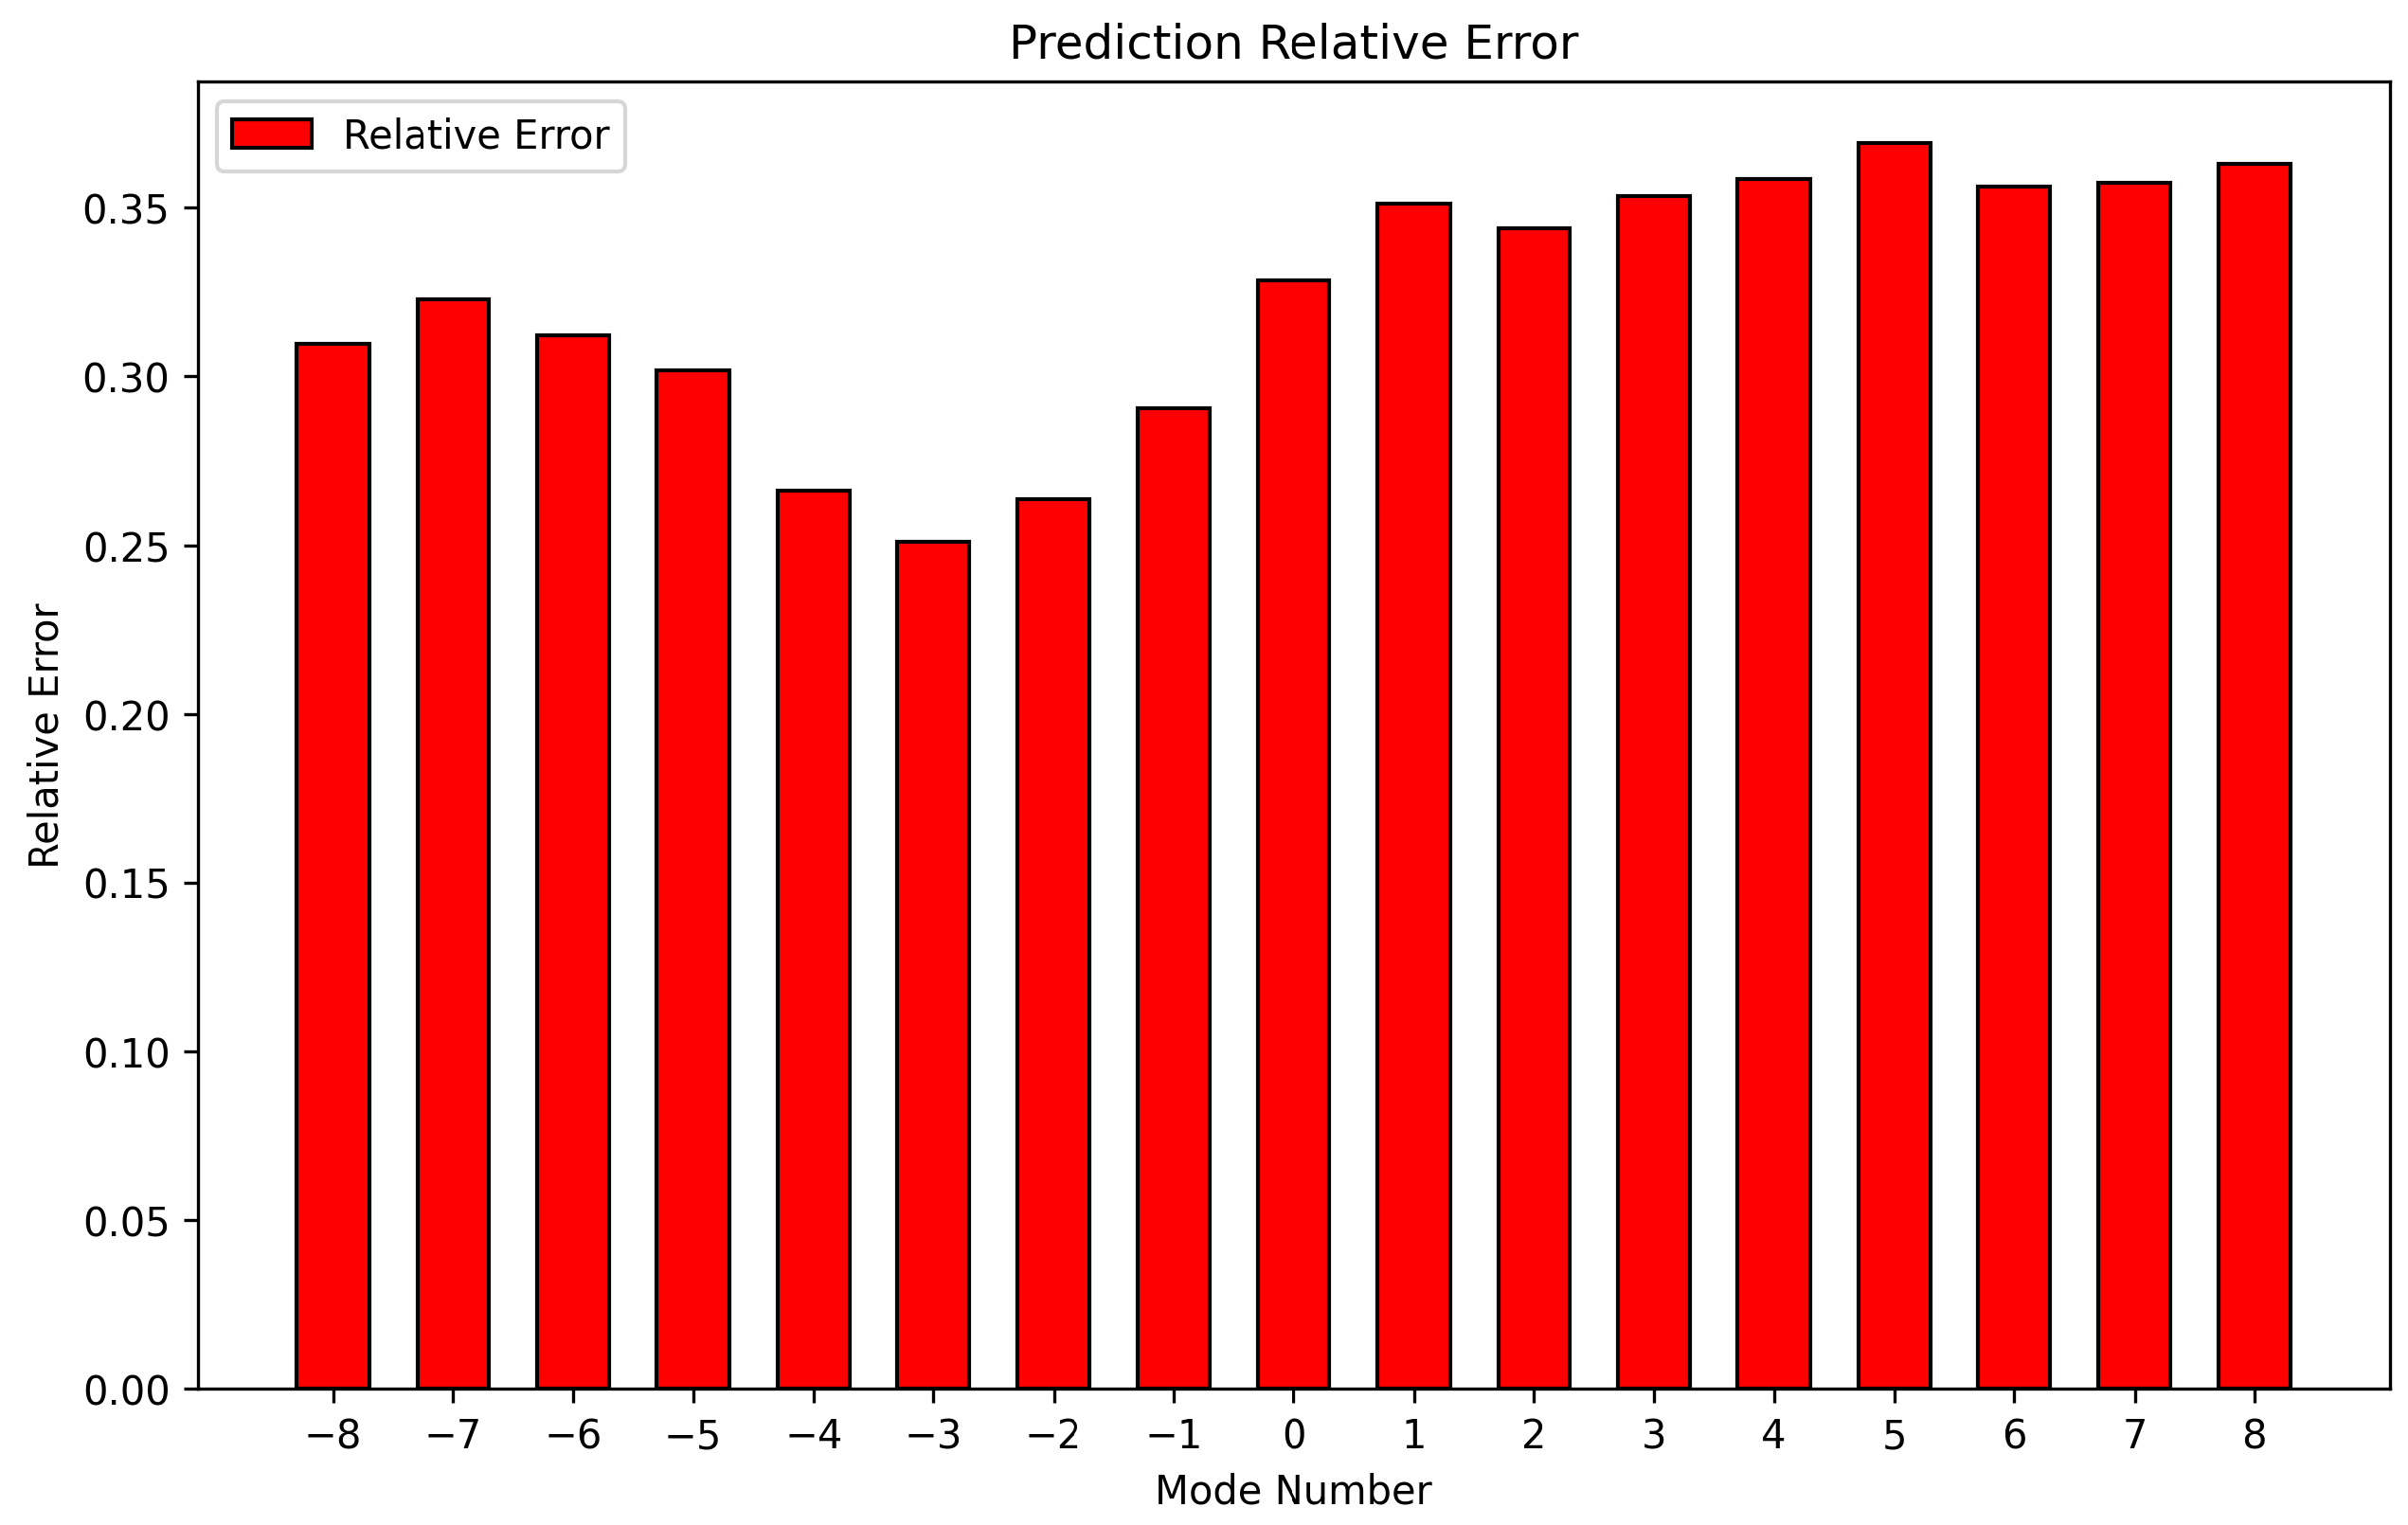
Figure 11 and Figure 12 show the relative error distributions across the 17 modes for Spite and Spiral. The same general tendency observed for Plate is retained: dominant modes exhibit smaller errors, whereas weak modes show larger relative errors. This pattern is consistent with modal imbalance in the dataset and further indicates that weak-mode prediction remains the most challenging component of the regression task. Future improvement may be achieved through targeted data augmentation, sample rebalancing, loss reweighting, or hybrid objectives that place greater emphasis on low-purity modal components.
Figure 11.
Relative error distribution across the 17 OAM modes for the Spite dataset.
Figure 12.
Relative error distribution across the 17 OAM modes for the Spiral dataset.
Taken together, the results for Plate, Spite, and Spiral show that the numerical-parameter-based regression model is highly effective in the canonical-target setting. It achieves very low prediction errors, preserves the dominant modal structure, and benefits from a compact set of physically meaningful input variables. At the same time, its scope is limited to targets that can be represented through explicit numerical parameterization.
4.2. Phase-Map-Based Prediction Results
4.2.1. Phase-Map-Based Results for the Plate Target
The phase-map-based regression model using ConvNeXt and GAM was first evaluated on the Plate dataset. Under the same training protocol, the model achieves , , and on the test set. Since MAE and are the primary metrics used throughout this study, these values indicate strong regression performance, although the absolute accuracy is lower than that of the numerical-parameter-based path.
The predicted spectra show close agreement with the reference data. The model reproduces the dominant modes and also captures the behavior of secondary modes, confirming that scattered-field phase maps contain informative modal-interference signatures that can be exploited for OAM mode-purity regression without explicit geometric parameterization. Compared with the numerical-parameter-based setting, the error level is higher, but the representation is more general, and therefore, more suitable for geometrically complex targets.
4.2.2. Performance Comparison Across Different Models
To compare the regression performance across different architectures, a phase-map dataset was generated for the Plate target under the same prescribed PO-based simulation configuration. Each sample included a phase map and its corresponding mode-purity spectrum. As described in Section 3, all candidate models are trained and evaluated under the same data split, preprocessing procedure, augmentation policy, optimizer setting, and stopping criterion so that the comparison remains as fair as possible within the present simulation framework. Table 2 summarizes the results.
Table 2.
Performance comparison of different models on the Plate target for phase-map-based regression.
Overall, the ConvNeXt-based surrogates outperform both the classic CNN baselines and the tested Transformer variants on this phase-map regression task. Attention enhancement further improves performance within the ConvNeXt family. In particular, ConvNeXt + GAM achieves the best results on the Plate dataset, reducing the MAE to 0.007 and increasing to 0.892. Other attention variants, including HighDiv, CBAM, and EMA, also improve upon the baseline ConvNeXt, although they remain slightly below the GAM configuration.
Transformer-based models show moderate performance, whereas the classic CNN baselines exhibit substantially larger errors. Within the present simulation setting, these results suggest that hierarchical convolution combined with lightweight attention is particularly effective for extracting spatial–modal correlations from scattered-field phase maps.
4.2.3. Model Performance on Five Target Categories
To further examine the generalization across target types, the phase-map-based regression models were evaluated on the five target categories Plate, Spiral, Spite, Missile, and Dihedral under a unified pipeline. In line with the evaluation strategy defined in Section 3, MAE and remain the primary indicators, while RMSE is additionally reported as a supplementary metric. Table 3 and Table 4 summarize the RMSE and values for all candidate models.
Table 3.
Comparison of RMSE values of different models on five target categories.
Table 4.
Comparison of values of different models on five target categories.
From the overall results, the ConvNeXt-based surrogates show consistent advantages in phase-map-based regression. The baseline ConvNeXt achieves a mean RMSE of 0.0224 and a mean of 0.887, while the introduction of attention further improves the performance. Among all the tested configurations, ConvNeXt + GAM achieves the best overall results, with a mean RMSE of 0.0168 and a mean of 0.918. The CBAM, EMA, and HighDiv variants also improve upon the baseline model.
Performance differences across targets are also evident. The five targets differ in symmetry and relative geometric complexity, and these differences are reflected in the regression results. Dihedral and Spiral exhibit comparatively higher prediction accuracy, whereas Plate and Spite show relatively lower accuracy under the same settings, with Missile lying between these two extremes. These trends are broadly consistent with the richness and regularity of the phase structures generated by different targets. Targets with clearer and more distinctive phase organization are easier for the network to represent, whereas targets with more complicated or less stable phase patterns produce a more difficult regression task.
Although the phase-map-based model captures dominant modal behavior well, prediction of weak modal components remains more difficult, especially for targets whose phase patterns are less regular. This limitation is consistent with the observations from the numerical-parameter-based setting. In the image-based path, weak modes are affected not only by modal imbalance in the target spectra but also by the fact that subtle phase differences may be compressed or smoothed during image generation and feature extraction. Future improvements may therefore come from phase-preserving input representations, weak-mode-aware loss design, multiscale supervision, or data-construction strategies that place greater emphasis on low-purity modal responses.
Overall, the phase-map-based regression model provides a practical extension of surrogate prediction to more complex geometries, and ConvNeXt + GAM offers the best balance of accuracy and generalization across the five-target set.
Finally, comparison of the two regression settings reveals a clear trade-off. The numerical-parameter-based model provides substantially higher accuracy when the target can be described through explicit physical parameters, whereas the phase-map-based model sacrifices some precision in exchange for greater flexibility and broader applicability to geometrically more complex targets. This complementary behavior is central to the proposed dual-path surrogate framework and further supports the positioning of this work as a simulation-level surrogate study for OAM spectrum prediction under the prescribed numerical workflow.
5. Conclusions
This work investigated the data-driven prediction of OAM mode-purity spectra for vortex electromagnetic waves scattered by metallic targets. Under a unified angular-spectrum Bessel-vortex-beam and physical-optics (PO) simulation workflow, a dual-path surrogate framework was developed to approximate the nonlinear mapping between scattering conditions and OAM spectral responses.
For canonical targets, a numerical-parameter-based regression model was established using five physically meaningful input variables. The results show that this model achieves very low prediction errors and accurately reproduces the dominant modal structure of the scattered OAM spectrum. For targets with more complex geometries, a phase-map-based regression model was introduced by using scattered-field phase maps as inputs. Among the evaluated architectures, ConvNeXt + GAM achieved the best overall performance, reaching a mean of 0.918 across the five target categories considered in this study.
The results demonstrate that the two regression paths play complementary roles. The numerical-parameter-based path provides higher prediction accuracy when compact physical parameterization is available, whereas the phase-map-based path offers greater flexibility and broader applicability for geometrically more complex targets. Together, these two paths form a unified surrogate framework for OAM mode-purity spectrum prediction under different target-description conditions.
At the same time, this study should be regarded as a simulation-level surrogate modeling investigation. All datasets and evaluations were generated under controlled numerical conditions, and the reported results do not yet constitute direct validation in experimental or real-scene environments. In addition, weak modal components remain more difficult to predict than dominant modes, especially in the phase-map-based setting.
Future work will focus on extending the present framework toward higher-fidelity simulations, noisy observations, and experimental measurements. Further improvements may also be achieved through weak-mode-aware learning strategies, enhanced phase-preserving representations, and extension to a broader range of target geometries and scattering conditions.
Author Contributions
L.M. conceived the study and supervised the research. H.S. carried out the PO-based reference simulations, implemented the surrogate regression workflow, and analyzed the results. T.W. contributed to the physical modeling and dataset generation. L.H. contributed to the analysis and manuscript revision. All authors have read and agreed to the published version of the manuscript.
Funding
This work was supported by the National Natural Science Foundation of China (Grant No. 62301417).
Data Availability Statement
The data used in this study were provided by the Xi’an Space Radio Technology Research Institute. Due to restrictions on use, the data are not publicly available. For inquiries regarding data access, please contact the corresponding author.
Acknowledgments
Generative AI tools were used only for limited language editing and wording refinement during manuscript preparation. No AI tool was used to generate, alter, or interpret the scientific data, results, figures, or conclusions of this study. All scientific content, analysis, and final wording were reviewed, verified, and approved by the authors, who take full responsibility for the manuscript.
Conflicts of Interest
The authors declare no conflicts of interest.
References
- Zhou, Y.; Chen, Y.; Xie, W.; Zhu, Y. Overview of Radar Detection Technology Based on Vortex Electromagnetic Waves. Mod. Radar 2021, 43, 57–66. [Google Scholar]
- Liu, K.; Cheng, Y.; Gao, Y.; Li, X.; Qin, Y.; Wang, H. Super-resolution radar imaging based on experimental OAM beams. Appl. Phys. Lett. 2017, 110, 161901. [Google Scholar] [CrossRef] [Scilit]
- Ast, S.; Pichot, M.; Traverso, G.; Mackowski, J.M.; Christensen, N.L.; Di Pace, S. Higher-order Hermite–Gauss modes for gravitational waves detection. Phys. Rev. D 2021, 103, 042008. [Google Scholar] [CrossRef] [Scilit]
- Meyer, J.; Reches, Y.; Rozenman, G.G.; Oz, Y.; Suchowski, H.; Arie, A. Analogy of free-space quantum key distribution using spatial modes of light: Scaling up the distance and the dimensionality. Opt. Lett. 2025, 50, 3297–3300. [Google Scholar] [CrossRef] [Scilit]
- Liang, X.; Chen, Y.; Zhang, Q.; Luo, Y.; Li, X. Three-Dimensional Imaging of Vortex Electromagnetic Wave Radar with Integer and Fractional OAM Modes. Remote Sens. 2023, 15, 2903. [Google Scholar] [CrossRef] [Scilit]
- Dang, Y.; Li, D.; Fu, Y.; Liao, Y. Orbital Angular Momentum Radar Detection Characteristics Analysis Based on Ambiguity Function. Digit. Signal Process. 2025, 162, 105197. [Google Scholar] [CrossRef] [Scilit]
- Li, C.; Tan, X.; Zhu, S.; Li, S.; You, D.; Liu, J.; Peng, W.; Wu, T.; He, Y.; Zhang, Z. The Aggregated Electromagnetic Vortex Wave and Multi-Modal Imaging Experiment. Sensors 2025, 25, 6578. [Google Scholar] [CrossRef] [Scilit]
- Velchev, I.; Ubachs, W. Higher-order stimulated Brillouin scattering with nondiffracting beams. Opt. Lett. 2001, 26, 530–532. [Google Scholar] [CrossRef] [Scilit] [PubMed]
- Mitri, F.G.; Silva, G.T. Off-axial acoustic scattering of a high-order Bessel vortex beam by a rigid sphere. Wave Motion 2011, 48, 392–400. [Google Scholar] [CrossRef] [Scilit]
- Qu, T.; Wu, Z.; Wei, Y.; Li, Z.; Bai, L. Scattering Characteristics of Laguerre–Gaussian Vortex Beams on Biological Cells. Acta Opt. Sin. 2015, 35, 129002. [Google Scholar]
- Shi, C.; Cheng, M.; Guo, L.; Lavery, M.P.; Wang, P.; Liu, S.; Li, R.; Li, J. Particle scattering induced orbital angular momentum spectrum change of vector Bessel–Gaussian vortex beam. Remote Sens. 2022, 14, 4550. [Google Scholar] [CrossRef] [Scilit]
- Wu, Z.; Wu, J.J.; Li, H.Y.; Qu, T.; Meng, X.; Xu, Q.; Wu, Z.; Bai, J.; Yang, L.; Gong, L. Integrated physical optics for calculating electrically large metallic sphere scattering irradiated by vortex waves. IEEE Antennas Wirel. Propag. Lett. 2022, 21, 1288–1292. [Google Scholar] [CrossRef] [Scilit]
- Chen, X.-M.; Li, H.-Y.; Wu, T.; Meng, X.-S.; Li, F.-X. Near-Field Electromagnetic Scattering of Bessel Vortex Beam by Metal Target. Acta Phys. Sin. 2023, 72, 100302. [Google Scholar] [CrossRef] [Scilit]
- Sun, M.; Liu, S.; Guo, L. Scattering Field Intensity and Orbital Angular Momentum Spectral Distribution of Vortex Electromagnetic Beams. Remote Sens. 2024, 16, 754. [Google Scholar] [CrossRef] [Scilit]
- Sun, M.; Liu, S.; Guo, L.; Huang, K.; Cheng, M. Scattering Characteristics of Electrically Large Targets Illuminated by Off-Axis Vortex Beams. J. Appl. Phys. 2023, 133, 124905. [Google Scholar]
- Porfirev, A.; Khonina, S.; Kuchmizhak, A. Light–matter interaction empowered by orbital angular momentum: Control of matter at the micro- and nanoscale. Prog. Quantum Electron. 2023, 88, 100459. [Google Scholar] [CrossRef] [Scilit]
- Lv, J.; Liu, C.; Shen, M.; Wang, D.; Si, G.; Ou, Q. Review of vortex beam orbital angular momentum mode detection methods. Mater. Today Commun. 2024, 40, 109767. [Google Scholar] [CrossRef] [Scilit]
- Liu, Y.; Zhang, Z.; Wu, T.; Cheng, X. A New Dimensional Target Scattering Characterization Method Based on Electromagnetic Vortex-Polarization Joint Scattering Matrix. Electronics 2025, 14, 3346. [Google Scholar]
- Chen, G.; Wang, H.; Yun, H.; Shi, Z.; Zhang, Z.; Cui, C.; Wu, D.; Lyu, X.; Zhao, Y. Research on Enhancing Target Recognition Rate Based on Orbital Angular Momentum Spectrum with Assistance of Neural Network. Photonics 2025, 12, 771. [Google Scholar] [CrossRef] [Scilit]
- Durnin, J.; Miceli, J.J.; Eberly, J.H. Diffraction-free beams. Phys. Rev. Lett. 1987, 58, 1499–1501. [Google Scholar] [CrossRef] [Scilit] [PubMed]
- Liu, K.; Li, X.; Gao, Y.; Wang, H.; Cheng, Y. Microwave imaging of spinning objects using orbital angular momentum. J. Appl. Phys. 2017, 122, 124903. [Google Scholar] [CrossRef] [Scilit]
- Liu, H.; Liu, K.; Cheng, Y.; Wang, H. Microwave vortex imaging based on dual-coupled OAM beams. IEEE Sens. J. 2019, 20, 806–815. [Google Scholar] [CrossRef] [Scilit]
- Yuan, T.; Wang, H.; Cheng, Y.; Qin, Y. Electromagnetic vortex-based radar imaging using a single receiving antenna. Sensors 2017, 17, 630. [Google Scholar] [CrossRef] [Scilit] [PubMed]
- Xie, G.; Song, H.; Zhao, Z.; Milione, G.; Ren, Y.; Liu, C.; Zhang, R.; Bao, C.; Li, L.; Wang, Z. Using a complex optical orbital-angular-momentum spectrum to measure object parameters. Opt. Lett. 2017, 42, 4482–4485. [Google Scholar] [CrossRef] [Scilit] [PubMed]
- Nair, V.; Hinton, G.E. Rectified linear units improve restricted Boltzmann machines. In Proceedings of the 27th International Conference on Machine Learning (ICML 2010), Haifa, Israel, 21–24 June 2010; pp. 807–814. [Google Scholar]
- Liu, Z.; Mao, H.; Wu, C.; Feichtenhofer, C.; Darrell, T.; Xie, S. A ConvNet for the 2020s. In Proceedings of the IEEE/CVF Conference on Computer Vision and Pattern Recognition, New Orleans, LA, USA, 18–24 June 2022; pp. 11976–11986. [Google Scholar] [CrossRef] [Scilit]
- Liu, Y.; Shao, Z.; Hoffmann, N. Global Attention Mechanism: Retain Information to Enhance Channel-Spatial Interactions. arXiv 2021, arXiv:2112.05561. [Google Scholar] [CrossRef] [Scilit]

Disclaimer/Publisher’s Note: The statements, opinions and data contained in all publications are solely those of the individual author(s) and contributor(s) and not of MDPI and/or the editor(s). MDPI and/or the editor(s) disclaim responsibility for any injury to people or property resulting from any ideas, methods, instructions or products referred to in the content. |
© 2026 by the authors. Licensee MDPI, Basel, Switzerland. This article is an open access article distributed under the terms and conditions of the Creative Commons Attribution (CC BY) license.