


Abstract
To address the challenge of achieving high-precision and ordered calibration of strong-scatter points in inverse synthetic aperture radar (ISAR) images, this paper proposes a collaborative framework that integrates YOLOv12-pose with Peak-Constrained Watershed (PCW). The method first employs the YOLOv12-pose model to produce an initial localization of scatter points. PCW is then applied to fine-segment individual points. Finally, a three-stage global optimal matching strategy is introduced to achieve high-precision fusion between index labels and their geometric positions. Experimental results on a microwave photonic radar ISAR dataset demonstrated that the proposed method achieved an average error of 1.89 pixels, with accuracy, recall, and F1 scores exceeding 95%. The approach significantly outperformed standalone YOLO, Mask R-CNN, and traditional SVM-based methods while maintaining label consistency and substantially improving precision and robustness for the recognition, localization, and tracking of strong scatter points in ISAR imagery.
1. Introduction
Inverse Synthetic Aperture Radar (ISAR) [1] imaging technology offers advantages such as ultra-wide bandwidth, strong anti-jamming capability [2], and high resolution [3], demonstrating broad application prospects [4]. In ISAR imaging, high-precision localization and the stable tracking of target strong-scatter points [5] are critical prerequisites for achieving fine target recognition, attitude inversion, and motion parameter estimation.
To detect strong-scatter points in ISAR, traditional detection methods primarily learn shallow target features by extracting image characteristics and training classifiers on labeled training data. Zhao [6] proposed a SAR target recognition method that combines linear and nonlinear feature extraction, demonstrating that Support Vector Machine (SVM) can effectively perform target recognition in SAR images. Wang [7] optimized SVM using the adaptive evolutionary particle swarm algorithm to recognize targets in radar High-Resolution Range Profile (HRRP), which enhanced the adaptability and accuracy of radar HRRP target identification. While such methods offer enhanced interpretability, their limited feature representation capability leads to insufficient robustness in complex imaging environments. Furthermore, they did not rank the scatter points in their recognition results, which are essential for attitude-inversion tasks.
In recent years, the rapid development of deep learning technology has provided new technical pathways for radar imaging recognition. Deep-learning methods in this area are primarily divided into two major categories: region-based two-stage detection methods and regression-based one-stage detection methods. In the context of two-stage detection methods, Ridvan Y [8] proposed a SAR image segmentation method that combines Mask R-CNN with a sparsity-driven despeckling algorithm, thereby increasing the target segmentation accuracy and recognition success rate in complex backgrounds to 90%. Jiang [9] improved the accuracy of contour extraction for observed ships using Faster R-CNN [10] by introducing filters and optimizing the extraction model. Chen [11] proposed Marine-Faster R-CNN for ISAR image detection, demonstrating higher accuracy and robustness than the original Faster R-CNN, as well as strong generalization capability. Zhou [12] introduced the Attention-enhanced Deformation-Robust ISAR Image Recognition Network (ADRISAR-Net), achieving robust ISAR target recognition. Liao [13] developed the MFFN-FCSA model for ISAR space-target recognition via multi-modal feature fusion. Similarly, He [14] proposed a multi-scale self-supervised network based on wavelet transform (WS2Net) for change detection in SAR images. These two-stage methods achieve high-precision localization through region proposal generation and refine detection, but they suffer from high computational complexity and slow inference speed, making them difficult to meet the real-time detection requirements.
In contrast, one-stage detection methods, such as the YOLO [15] series, are widely used in radar imaging recognition. Pan [16] proposed a reconstructed model framework, EMO-YOLO, integrated with feature-extraction modules, to achieve a lightweight structure while maintaining recognition accuracy. RLE-YOLO [17] optimizes feature representation and the computational process, thereby improving multi-scale target detection performance while reducing computational load, making it suitable for scatter point detection scenarios with complex scale distributions. Yao [18] proposed a multitask YOLO model that incorporates a segmentation-decoupling head and an attention mechanism, enhancing the ability to recognize scattered points and increasing the average precision of image target recognition to 86.58%. Zhang [19] proposed SegS-YOLO, which improved the detection of small- and medium-sized objects while maintaining strong multi-scale object recognition performance. Hou [20] efficiently achieved radar target recognition and localization by employing a dual YOLOv8-pose model for detection and precise positioning. The core advantage of one-stage methods is their simple structure and fast inference speed, enabling them to meet real-time requirements. However, due to the lack of a reliable candidate-region screening mechanism, their localization accuracy is often insufficient and prone to drift.
This study introduces a collaborative framework [21,22] called Watershed YOLO to overcome the limitations of the methods mentioned earlier. As a fusion algorithm that combines YOLOv12-pose with the Peak-Constrained Watershed (PCW), Watershed YOLO follows a pipeline approach to detect scatter points, comprising coarse localization, precise segmentation, and optimal matching. Additionally, a globally optimal matching strategy is developed that accounts for label transfer and position correction during the “deep learning + image segmentation” process. Finally, the method is validated on a customized microwave photonic radar ISAR dataset, demonstrating high-precision automatic labeling, cross-frame tracking, and accurate recognition for strong-scatter points.
Although hybrid frameworks combining deep learning detectors with watershed-based segmentation have been reported in related vision and SAR literature, the contribution relative to existing YOLO–watershed hybrids is insufficiently differentiated—their primary objective is usually limited to improving pixel-level segmentation accuracy or refining object contours. In contrast, the proposed Watershed YOLO framework is specifically designed for the ordered calibration of strong scatter points in ISAR imagery, which poses additional constraints beyond generic detection or segmentation.
The main contributions and distinctions of this work are summarized as follows:
Ordered scatter-point calibration: Unlike existing YOLO–watershed hybrids that focus on unordered instance segmentation, the proposed framework explicitly addresses the ordered labeling problem of ISAR scatter points, which is essential for downstream tasks such as attitude inversion and motion parameter estimation.
Three-stage global optimal matching strategy: A novel three-stage matching mechanism is introduced to progressively correct localization drift and label inconsistency by integrating geometric constraints, scattering intensity cues and global assignment optimization.
Physics aware intensity geometry fusion: The matching strategy is guided by both geometric centers and scattering intensity distributions, implicitly incorporating the physical characteristics of electromagnetic scattering centers into the learning segmentation fusion process.
Pipeline optimized for ISAR scenarios: Rather than serving as a generic vision framework, the proposed method is tailored to microwave photonic radar ISAR data, where scatter-point morphology, intensity stability, and ordered correspondence across frames are critical.
These distinctions collectively differentiate the proposed method from existing YOLO–watershed hybrids and establish its novelty in the context of ISAR scatter-point recognition.
2. Methodology
2.1. Fusion Algorithm Framework
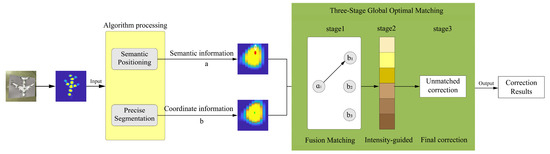
Microwave photonic radar uses photonic technology to generate ultra-wideband signals, enabling high-resolution target imaging via the “motion synthetic aperture” principle of ISAR. To recognize and rank scatter points in ISAR images, this paper proposes a deep-learning-based fusion method and the PCW (Figure 1). In this architecture, YOLOv12-pose first labels key points [23], and PCW then precisely segments scatter points in the image. Finally, a three-stage global optimal matching algorithm is employed to fuse location labels with coordinates, thereby achieving precise localization and ranking of the strong scatter points.
Figure 1.
Radar Scatter Points Recognition and Labeling Framework.
2.2. Labeling and Localization Module
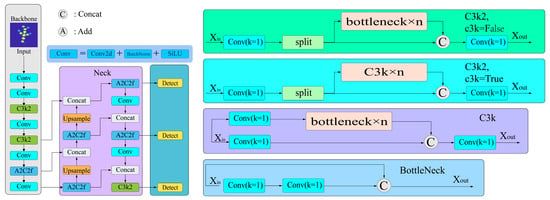
The YOLOv12-pose [24] algorithm incorporates the A2C2f feature-extraction module to estimate the pose of scatter points in the image (Figure 2). The A2C2f feature extraction module improves the detection accuracy for small targets by incorporating several kernel modules, including the backbone network, neck, and detection head. The backbone network realizes multi-scale feature extraction through downsampling; the neck part utilizes a feature pyramid to achieve multi-level feature fusion and semantic enhancement; and the detection head, based on the fused features, simultaneously outputs the target’s bounding box, class, and coordinates of several predefined key points, thereby accomplishing the sequential labeling of scatter points.
Figure 2.
Network Structure of the YOLOv12-pose Algorithm.
As shown in Figure 3, A2C2f adopts a dual-path parallel architecture, in which one path retains local features through standard convolution, and the other path captures long-range dependencies by cascading two Attention Blocks (ABlocks) [25]. Each ABlock contains two sub-modules named Area Attention (A2) and Multi-Layer Perceptron (MLP), so the computation within an ABlock module can be expressed as:
where X1 is the output produced by a convolution layer using Xin, the input to the ABlock. Taking X1 as input, the self-attention module A2 produces an output that is then added back to X1 to obtain an intermediate output (Equation (1)). Consequently, the sum of and its output generated by MLP produces X2 (Equation (2)), which is eventually transformed to X3 by a convolution layer. Finally, summing X3 and the original input Xin produces ABlock’s final output,
Figure 3.
The Structure of A2C2f.
2.3. Fine Segmentation Module
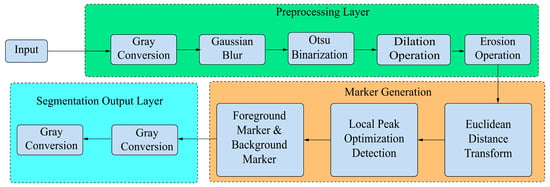
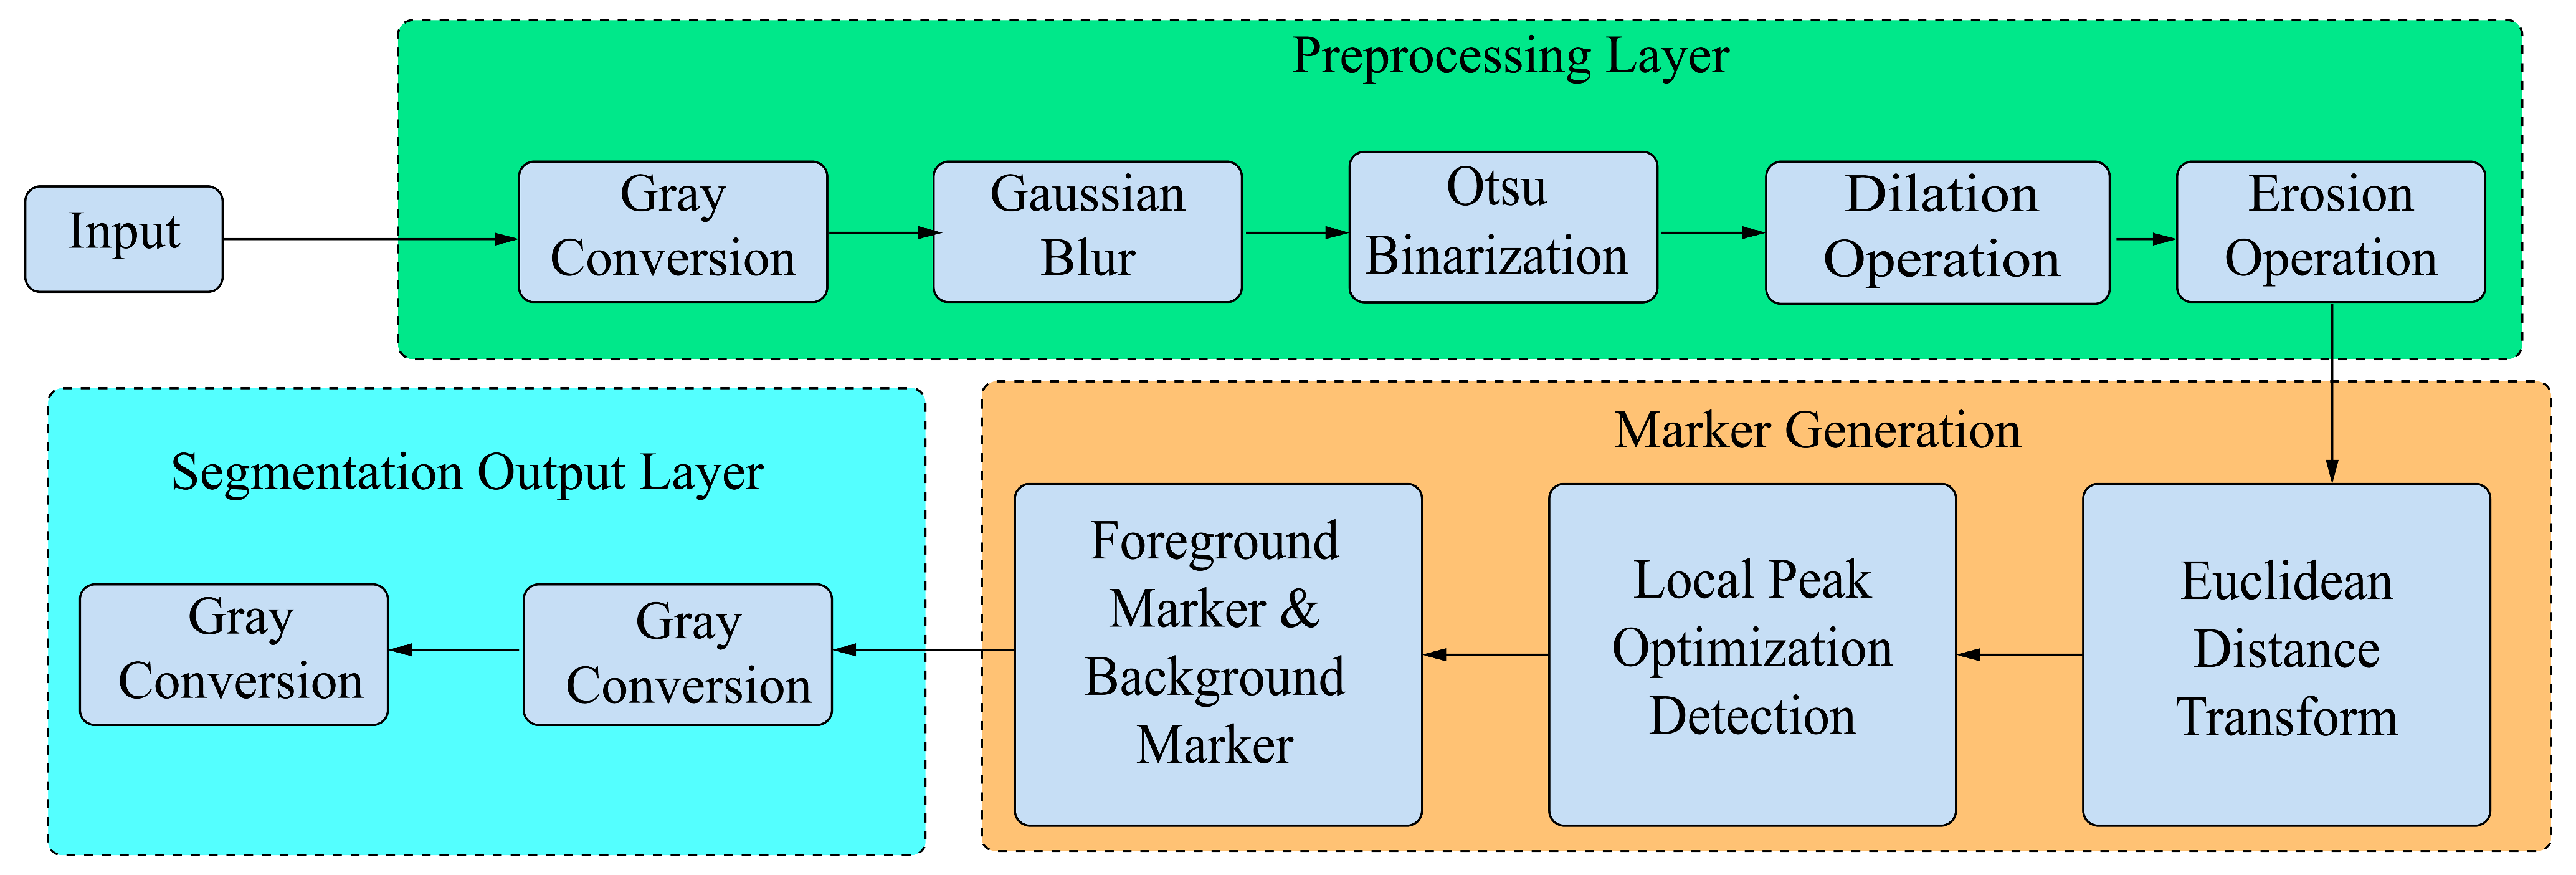
PCW adopts a “noise suppression algorithm (preprocessing layer) + local peak optimization detection” mechanism to address YOLOv12-pose’s localization drift. PCW comprises three parts: a preprocessing layer, a marker-generation layer, and a segmentation output layer.
As illustrated in Figure 4, the preprocessing layer first uses an anisotropic Gaussian kernel to suppress noise and enhance the prominent scatter points in the image. Then, the optimal threshold is automatically calculated using the OTSU method to separate the foreground from the background. Finally, erosion and dilation are performed to eliminate isolated noise and fill small holes.
Figure 4.
The Process of the PCW.
Next, for foreground and background images generated by the preprocessing layer, the marker-generation layer first calculates the Euclidean distance from each foreground point to its nearest background point:
where D(x, y) calculates the shortest distance from a foreground point (x, y) to its nearest point in the background region . i and j represent the coordinate components of any pixel in the background region. (x, y) means that we iterate over all background points. Later, D(x, y) is normalized to the range [0, 1] for subsequent constrained optimization. Local maximum peaks in the foreground images that meet the following constraints are selected as foreground markers:
Local Maximum Condition: The peak point (x, y) should have the maximum distance D(x, y) within its local neighborhood D(x, y):
Peak Threshold Constraint: The distance value D(x, y) of the peak point (x, y) should not be lower than a preset peak threshold to suppress false responses caused by noise:
Peak Spacing Constraint: For a set P including multiple peak points, the distance between a peak point (x, y) and other peak points must be no less than the minimum peak spacing , ensuring distinctiveness among the markers:
Finally, the segmentation output layer receives foreground markers and segments independent scatter-point regions. The outputs of the segmentation layer are collectively recorded as the segmentation result .
where pixel label L(x, y) is generated using distance D(x, y) and the foreground marker set P, k is the number of foreground markers, and is the foreground pixel region.
2.4. Global Optimal Matching Module
A three-stage global-optimal matching strategy is proposed to rank scatter points, aiming to align the key points predicted by YOLOv12-pose with the geometric centers of scatter points segmented by the PCW (Section 2.3).
Stage 1: Assignment Inspection
First, an assignment inspection is performed to identify key points that are already accurately located within watershed regions, and they are directly assigned to the corresponding region’s geometric center.
In this stage, a key point within a segmented region is directly assigned to the region’s geometric center , yielding the corrected position set and an uncorrected point set .
Stage 2: Intensity-Guided Local Connectivity Optimization
Next, local intensity optimization and a watershed region competition allocation are performed for point set , which is composed of unoccupied segmentation regions and the unused geometric centers denoting strong scatter regions. Since a strong scatter point region typically has a grayscale intensity higher than its background, this strategy searches for the position with the maximum grayscale value if no key point exists in this region, such as:
where is the position identified by the current stage, is the image intensity at point p, and is a circular area centered at with a radius r.
If multiple points meeting Equation (11) appear in the same region, a “distance priority” competition mechanism is introduced to ensure a unique allocation, such as
where is the key point label, and set includes candidate key points in that region. The above equations select an intensity-optimized key point out of set if it has the smallest Euclidean distance to the geometric center of region .
Stage 3: Matching Unassigned Points with a Bipartite Graph
For uncorrected points and unoccupied segmentation regions , a bipartite graph matching model is constructed to assign each unmatched point to the geometric center of a nearest vacant watershed region. Let U and V be the index sets of and , respectively, and the assignment process can be formulated as:
where is the point position produced by the current stage, and is the index set of points determined by this matching strategy.
3. Experiments and Results Analysis
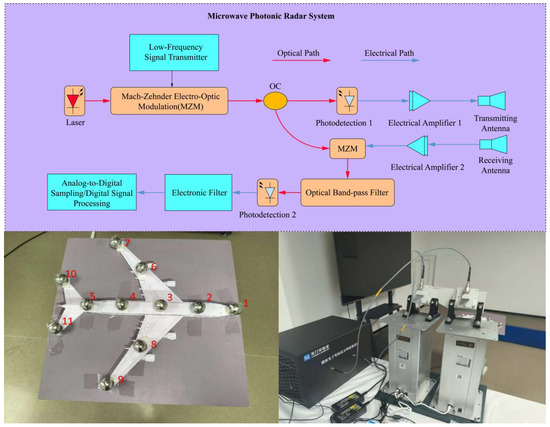
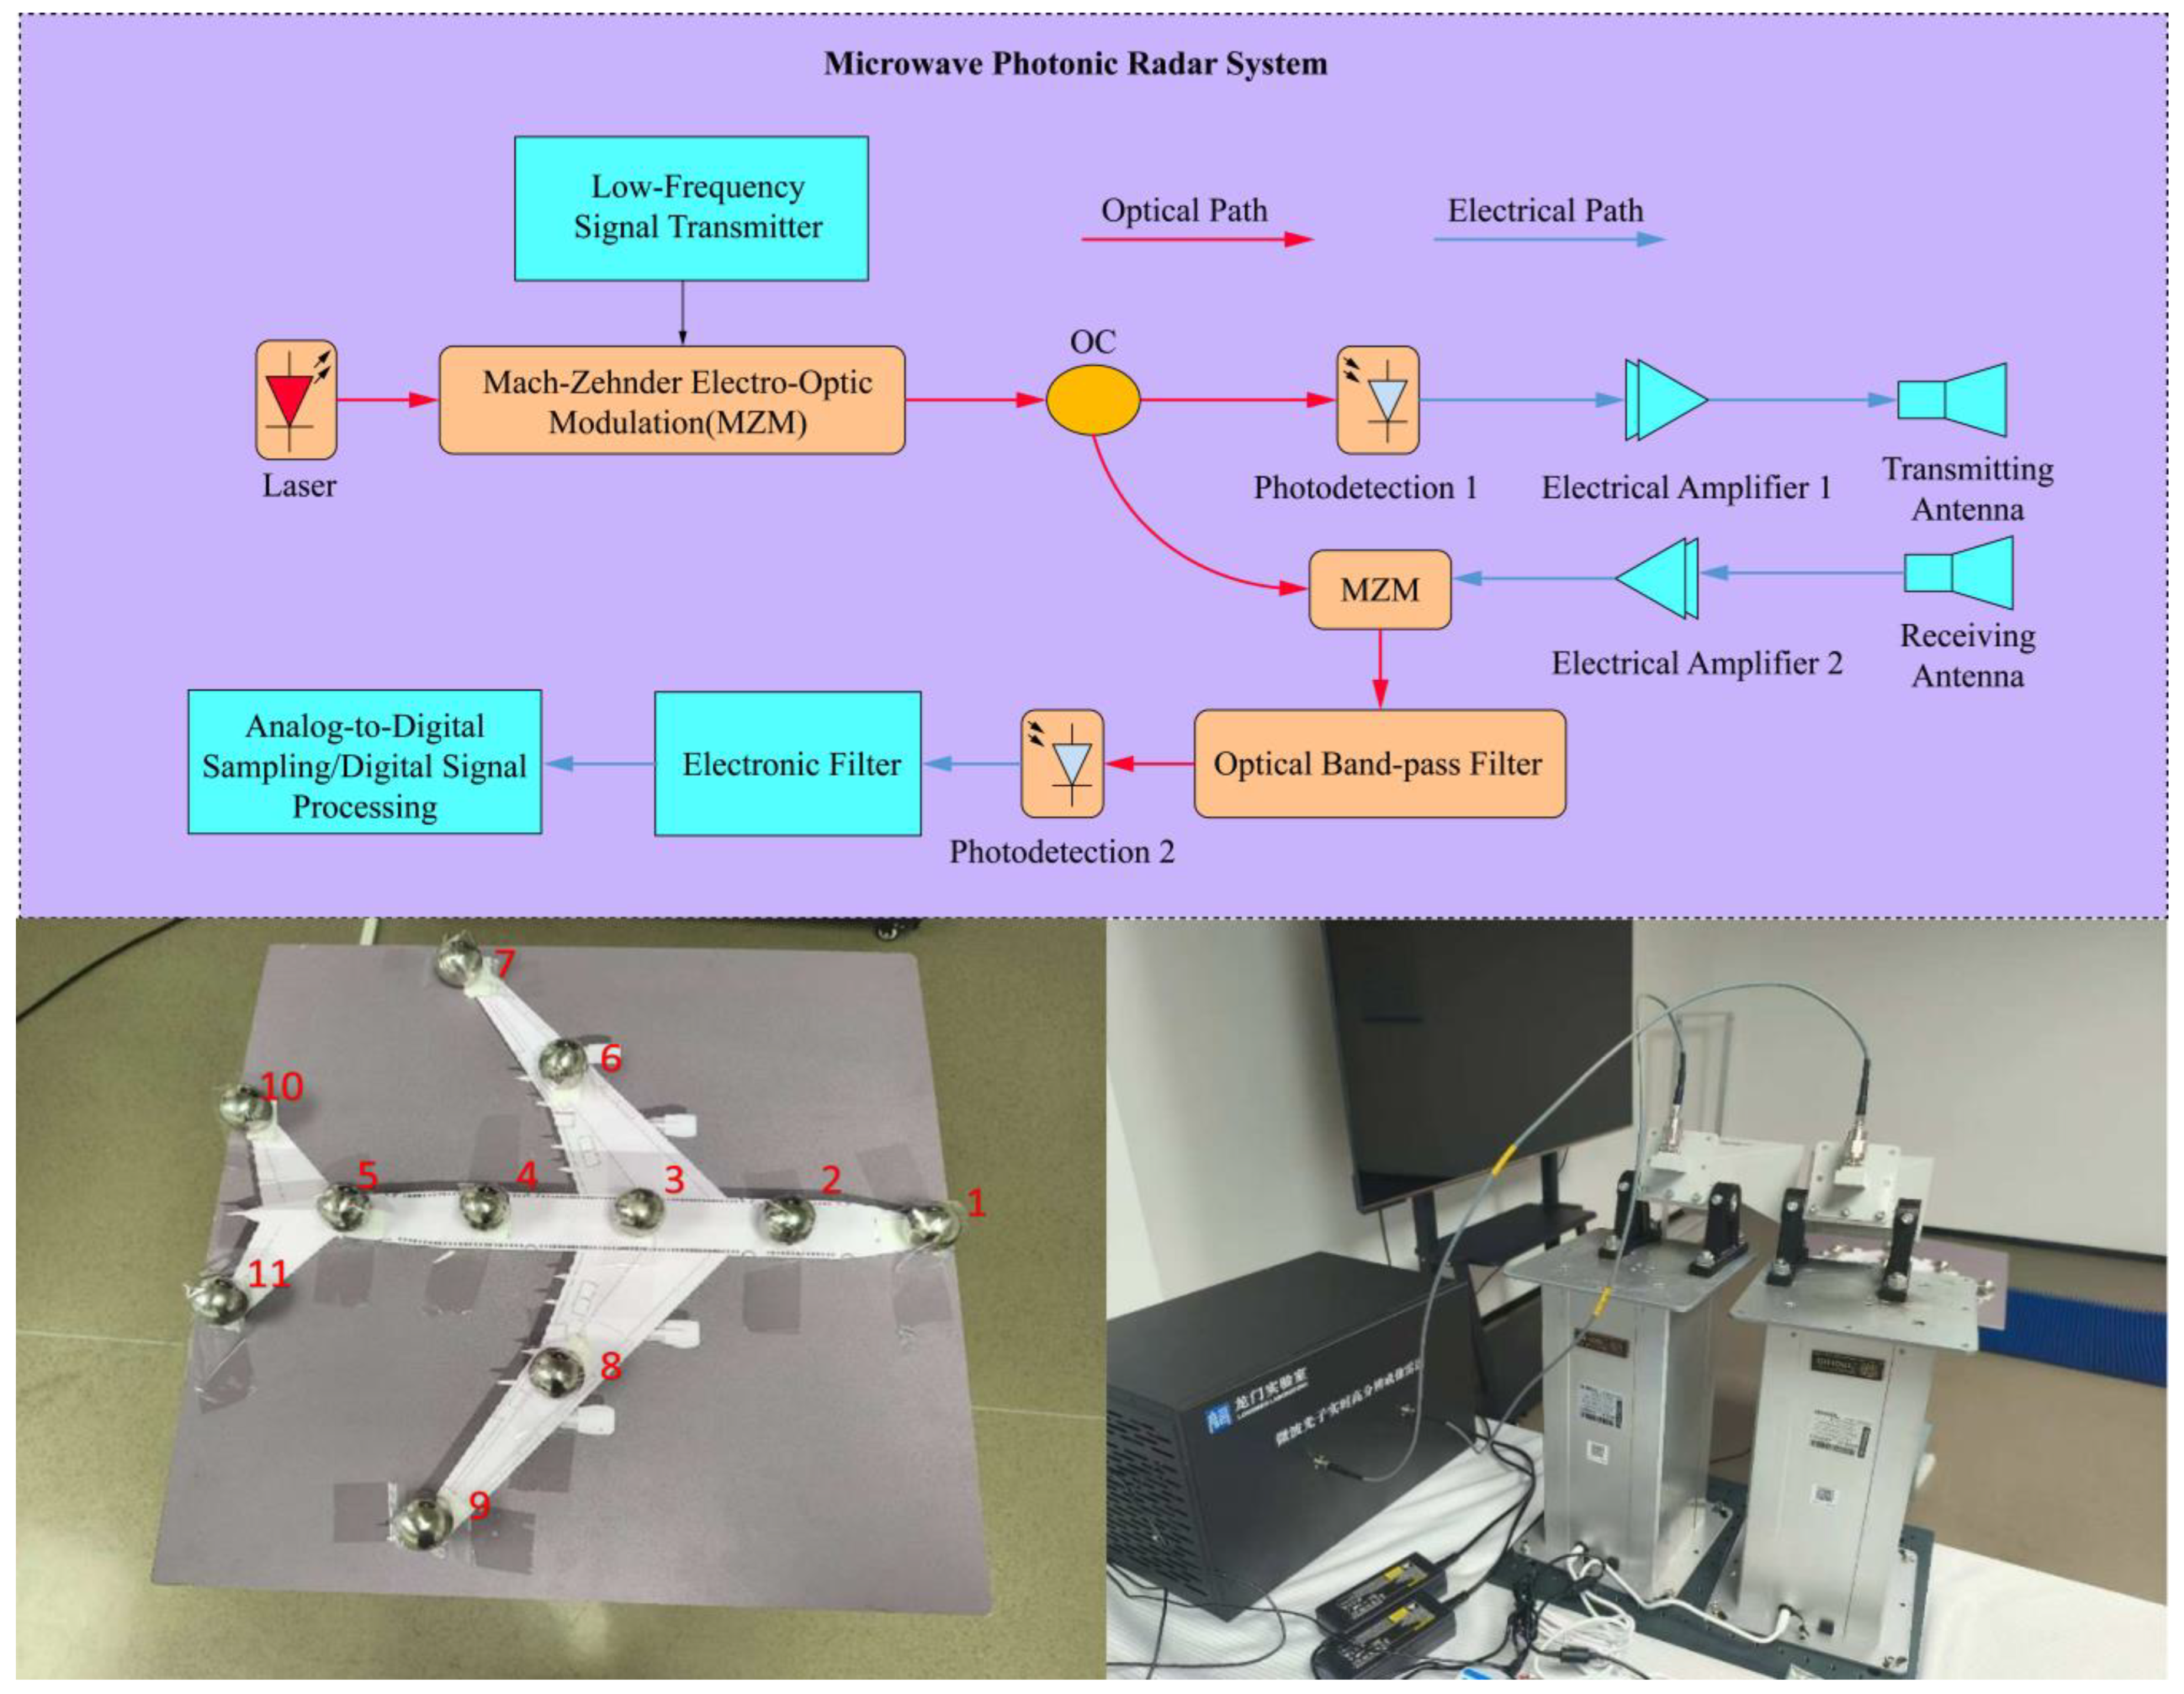
The microwave photonic radar system used in this study is shown in Figure 5, which scanned an aircraft model mounted on a rotating platform to construct a dataset, ISAR_DATASET, and evaluate the effectiveness of the proposed algorithm. The hardware and software platforms, as well as the acquisition conditions used in the experiment, are listed in Table 1. A total of 200 sets of raw images were first collected under different configurations to establish the initial dataset, which was then expanded to 1000 images using data augmentation techniques such as brightness adjustment, noise addition, rotation, and scaling.
Figure 5.
The Microwave Photonic Radar System Schematic Diagram, Turntable Measurement Platform with Scatter Points, and System Physical Composition.
Table 1.
Experimental Platform Parameters.
YOLOv12-pose was set as follows: the data split ratio of the training set to validation set was 8:2, the number of training epochs was 300, the input image size was 640 × 640, and the initial learning rate was 0.001.
3.1. Experimental Evaluation Metrics
The experiment selected the Mean Error (ME), Success Rate (SR), Precision, Recall, F1-Score, and Inference Time as evaluation metrics, which are defined as,
where M and N are the total number of images and key points in the test set, respectively, and and are the predicted and true coordinates of the i-th key point in an image, respectively. is an indicator function that equals 1 when the condition in parentheses is true, otherwise 0. is the distance threshold (unit: pixels). , , and represent the numbers of true positive, false positive, and false negative key points, respectively, and is the time taken to process the j-th image.
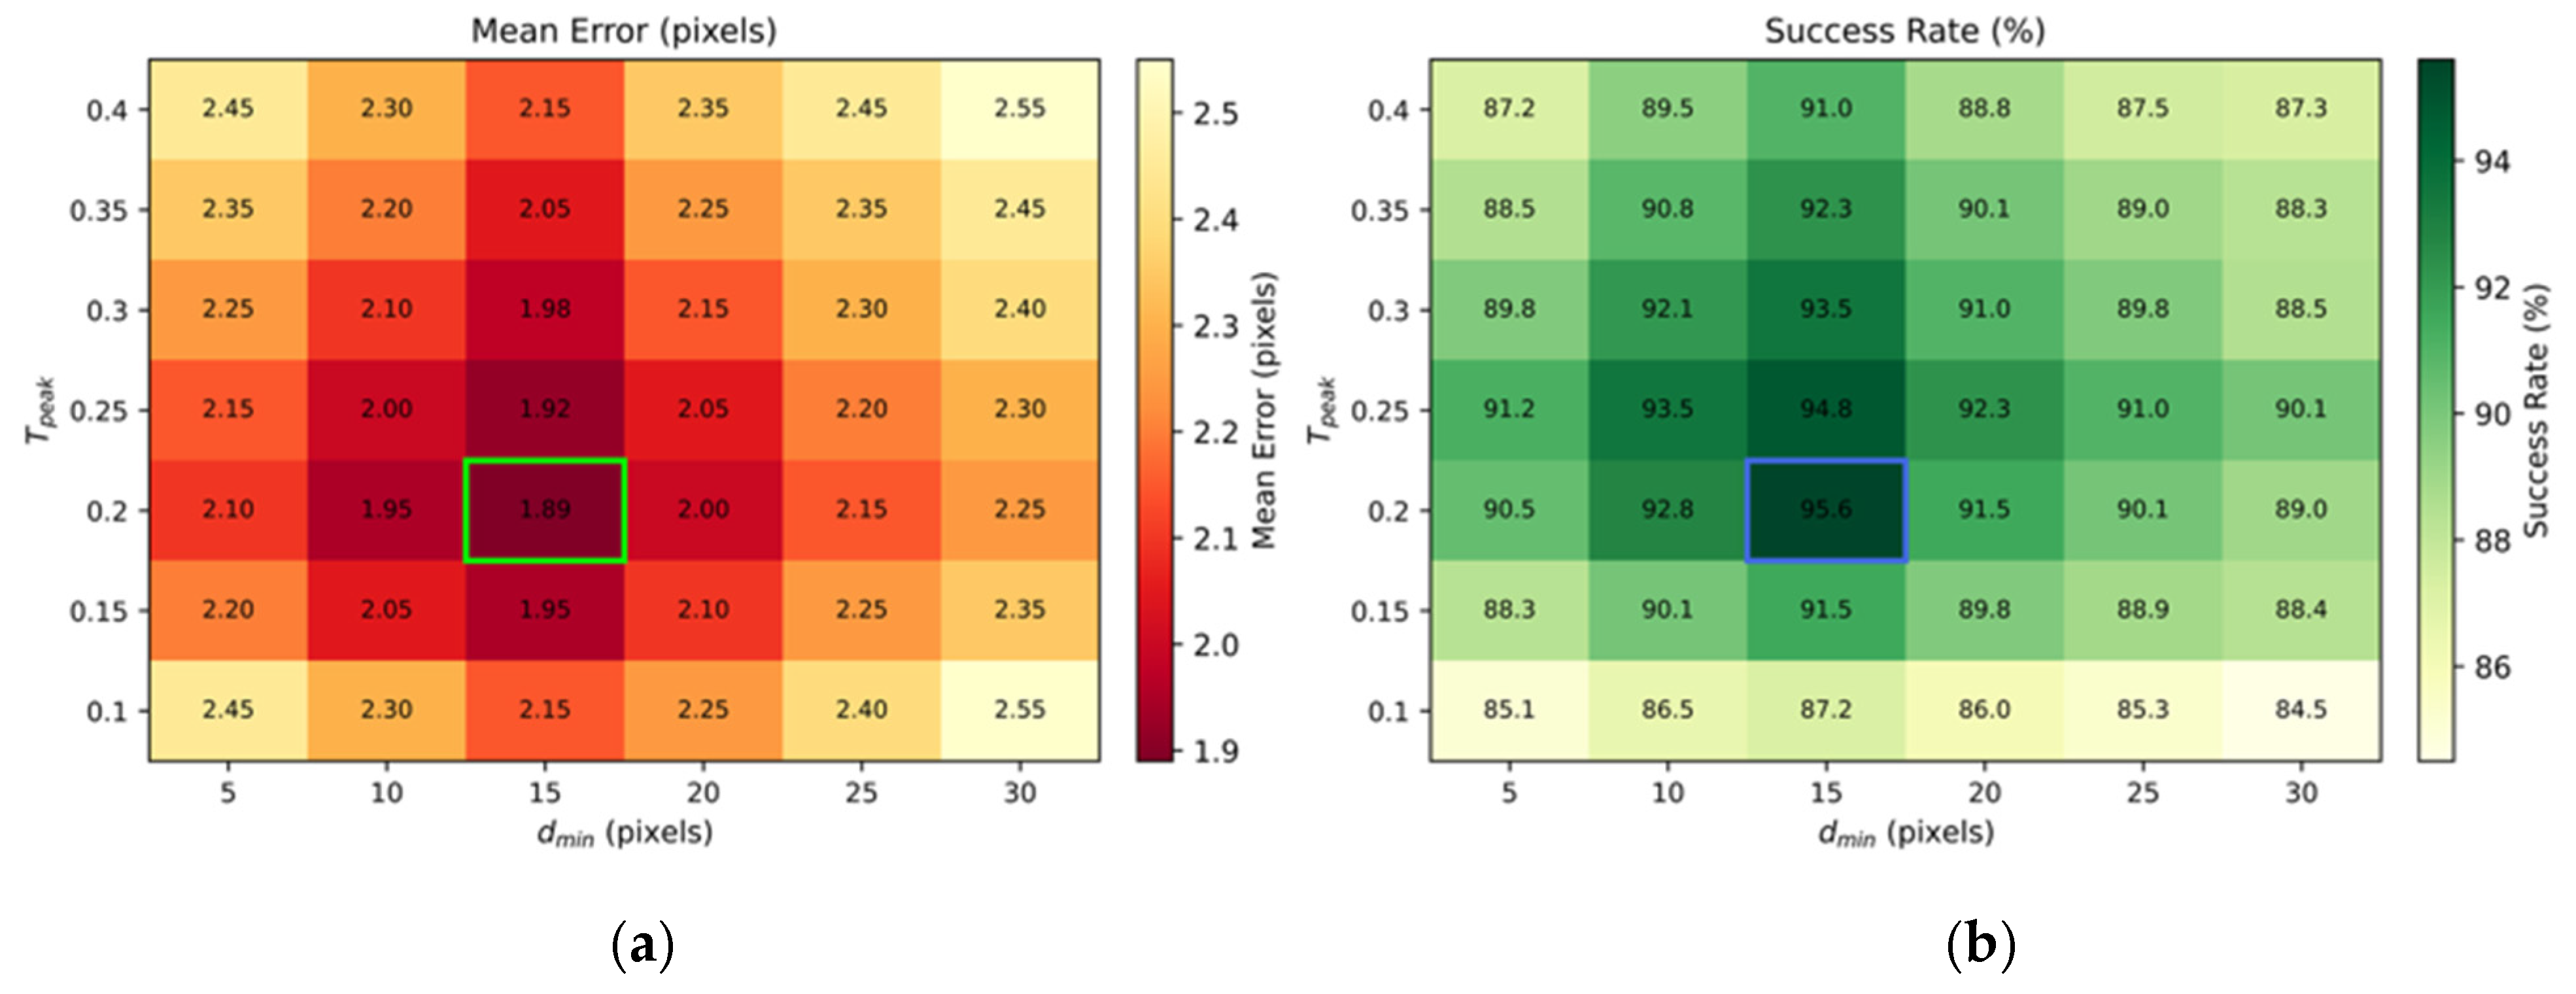
PCW’s performance largely depends on the settings of its key parameters. This paper systematically analyzed the impact of two core PCW parameters: the minimum peak threshold and the minimum peak spacing . As shown in Figure 6, when is set too low (<0.15), excessive noise signals in the distance map are misclassified as valid peaks, leading to severe over-segmentation manifested as increases in ME and false detections. Conversely, when setting with values larger than 0.35, weak scatter points are overwhelmingly suppressed, leading to missed detections, under-segmentation, and reduced recall. Similarly, a smaller than 10 pixels might result in duplicated labeling, while a greater than 25 pixels would merge multiple independent scatter points into a single point with a loss of detailed target information; both scenarios degrade localization accuracy and success rate. Although the Peak-Constrained Watershed (PCW) module involves two key parameters—the peak threshold and the minimum peak spacing —the sensitivity analysis in Figure 6 indicates the existence of a broad and stable operating region. Within the ranges and , the system consistently achieved a low mean error and high success rate. In all experiments reported in this paper, fixed parameter values ( = 0.25, = 15) were adopted without per-scene or per-condition tuning. This demonstrates that the proposed framework does not depend on delicate parameter adjustment and can be readily reproduced across different datasets and acquisition scenarios.
Figure 6.
The impacts of parameters and on the PCW (a) impact on ME and (b) impact on SR (with = 3 pixels).
3.2. Ablation Analysis
This ablation analysis validates the contribution of each module of the matching strategy proposed in Section 2.4 toward the overall performance. Each of the three modules, denoted as Stages 1 to 3, was incrementally incorporated with YOLOv12-pose detection, and the test results on the self-built dataset ISAR_DATASET are shown in Table 2, where metrics SR3 and SR5 are the Success Rates when equals to 3 pixels and 5 pixels, respectively, and “√” indicates that the corresponding module is activated.
Table 2.
Comparison results on the ISAR_DATASET dataset.
The three modules enhanced YOLOv12-pose’s performance to varying extents. Compared to the case without three modules, where ME equaled 4.45, incorporating Stages 1 to 3 reduced the ME to 3.57, 2.47, and 3.96, respectively. Specifically, when adding a single module, Stage 2 demonstrated the greatest improvement, reducing ME by 44.49%, and increasing SR3 and SR5 by 11.07% and 11.68%, respectively. Such an enhancement validates the effectiveness of the intensity-guided local optimization mechanism in enhancing localization accuracy. As a comparison, the experiment achieved fewer mismatches and limited improvement when using Stage 3, because YOLOv12-pose already provides reasonable localization accuracy for highly distinguishable object features, and the scatter points detected by YOLOv12-pose are close to those from the PCW. When all three stages were activated together, the system achieved the best overall performance (ME = 1.89 pixels, SR3 = 95.6%, SR5 = 96.1%) while only increasing the inference time by approximately 12.3% compared to using YOLOv12-pose alone. This demonstrates that the proposed modules work synergistically to maximize recognition accuracy and robustness, with minimal computational overhead.
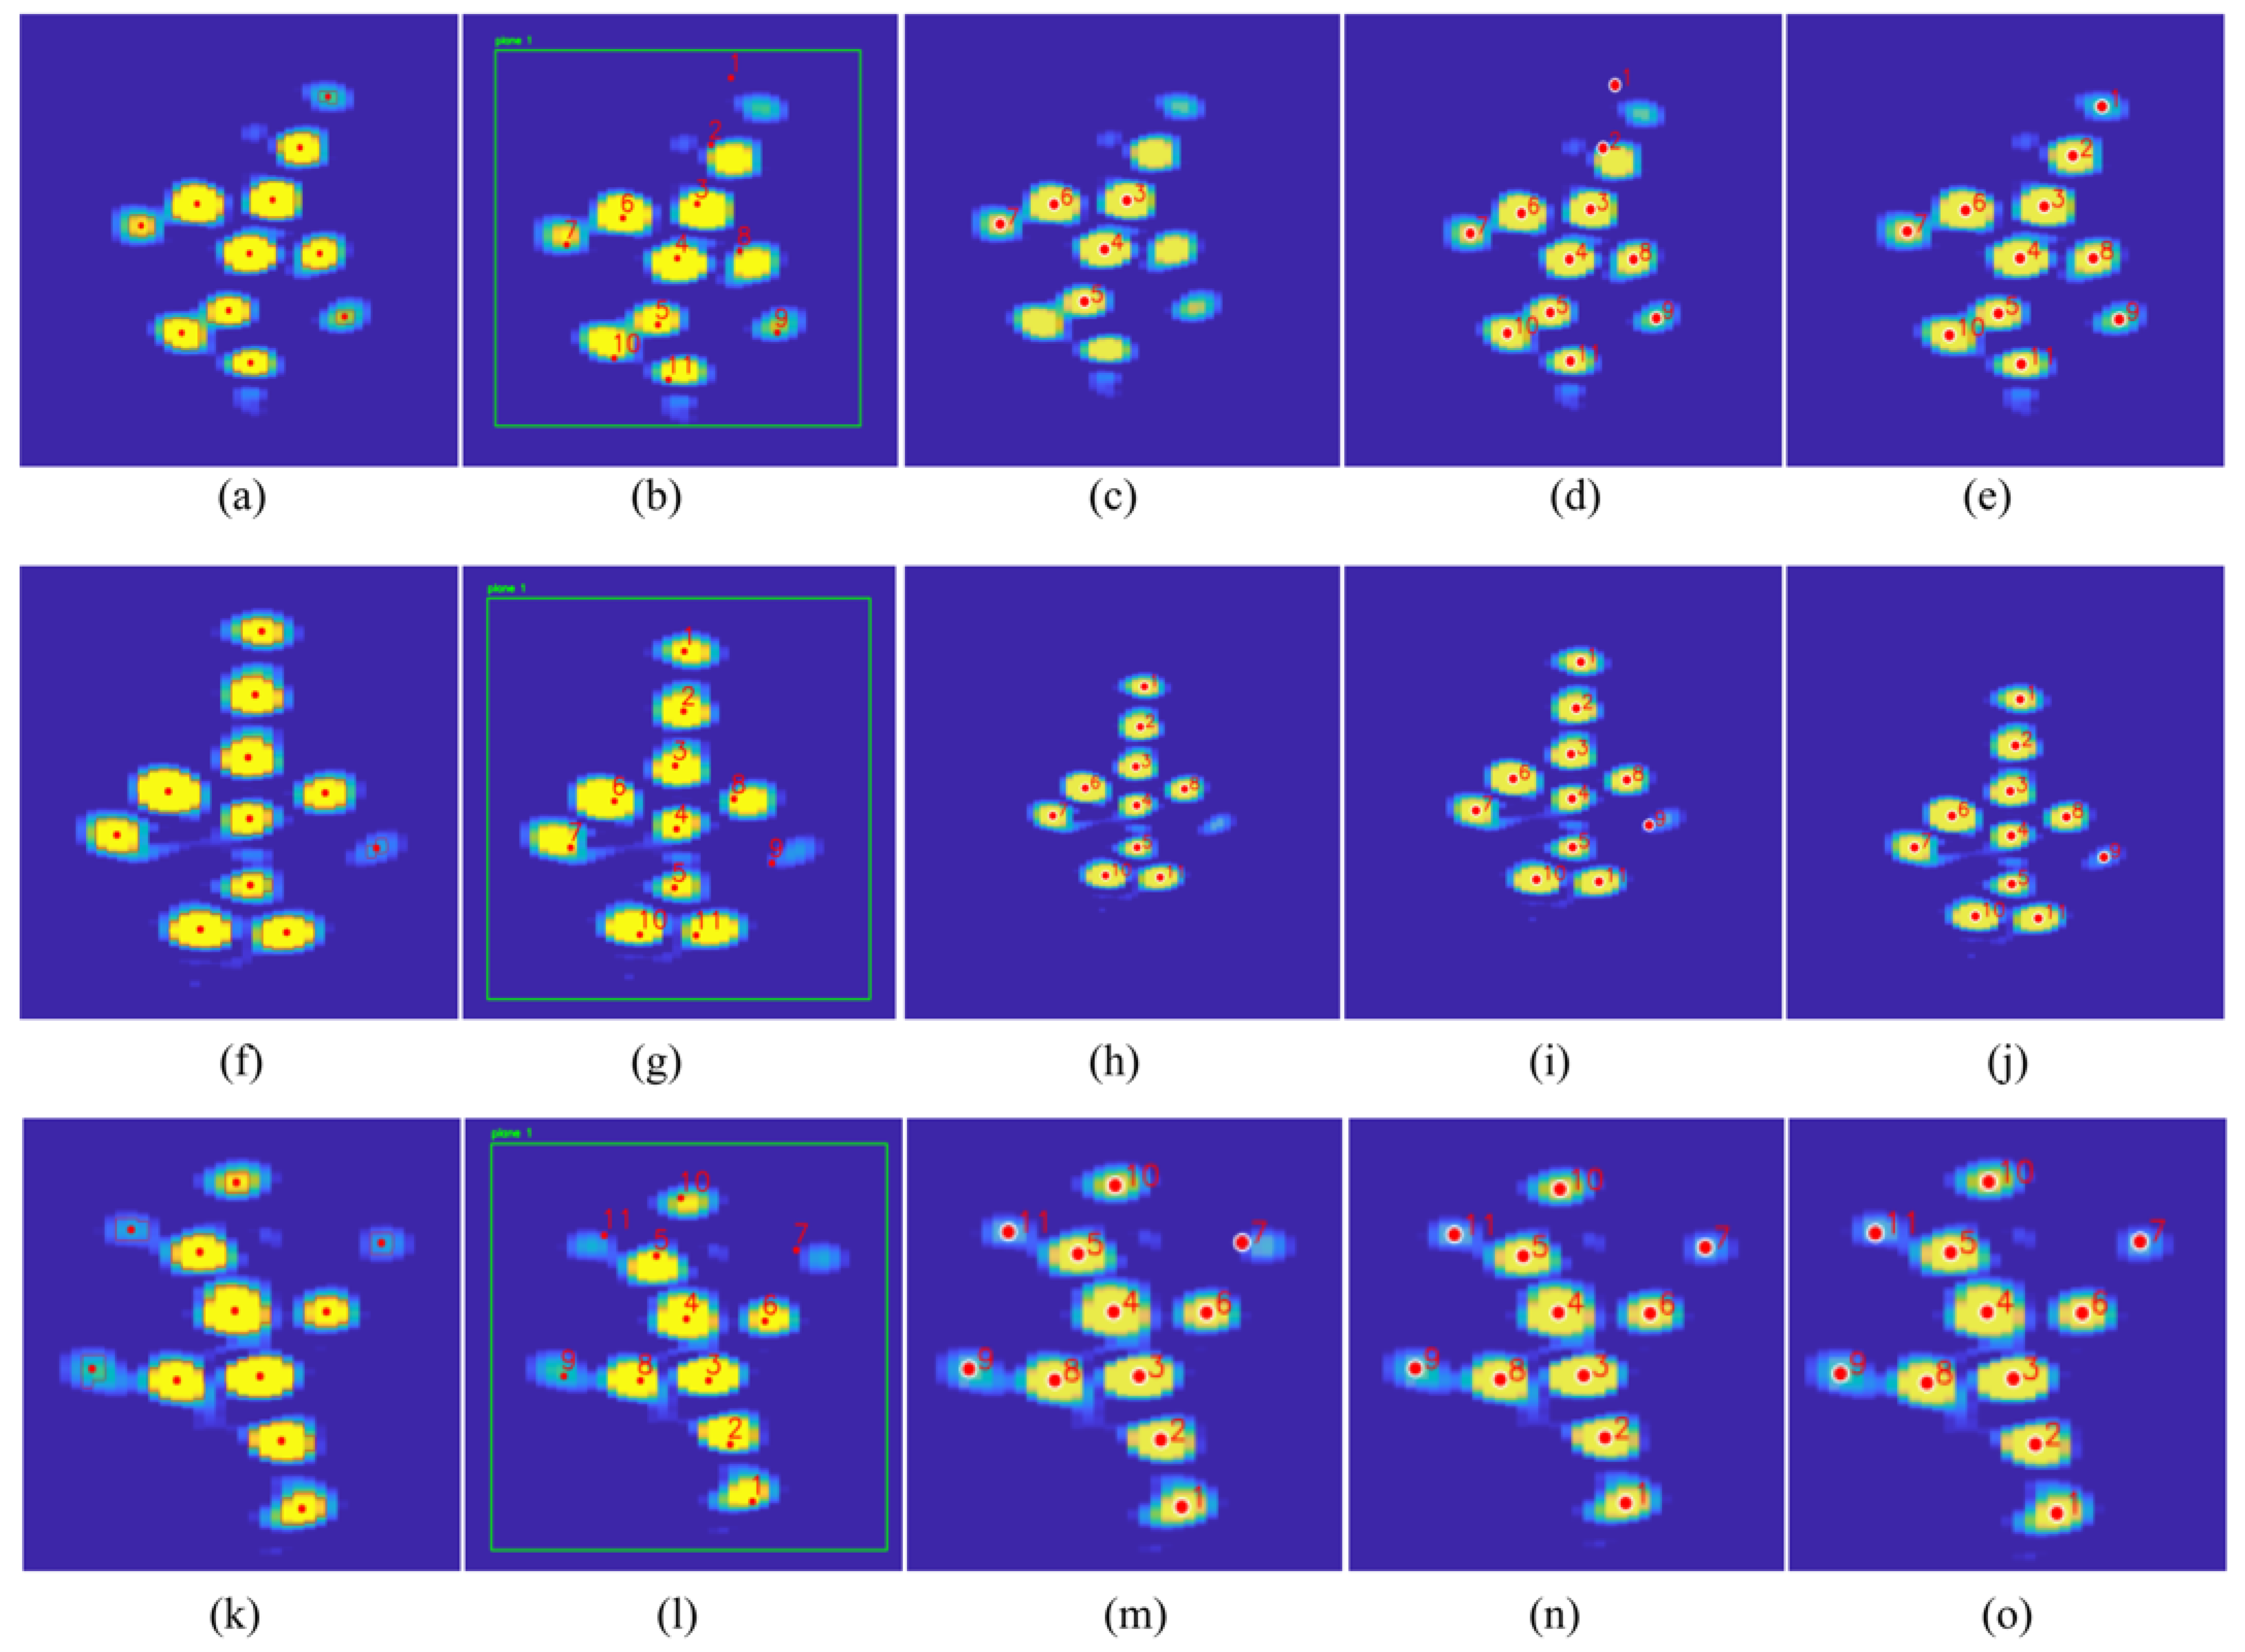
The recognition results under varying configurations of matching modules are illustrated in Figure 7 to demonstrate their contribution. When using only YOLOv12-pose, recognition exhibits significant bias and significant localization drift. Next, Stage 1 corrects the scatter points identified within the PCW segmentation regions to their respective geometric centers. Consequently, Stage 2 reduces error and eliminates interference by identifying weak scatter points and shifting them toward the geometric centers. Finally, Stage 3 handles unmatched points and void regions left by the previous two stages, ensuring that ordered labels are correctly assigned to the corresponding regions, thereby improving the overall recognition success rate. The ablation experiment indicates that this improved method not only enhances accuracy but also maintains good detection time, ensuring the system’s practical applicability.
Figure 7.
Results at each stage of the ablation experiment. The first column shows PCW segmentation, the second column shows YOLOv12-pose prediction, the third column shows PCW + YOLOv12-pose + Stage1, the fourth column shows PCW + YOLOv12-pose + Stage1 + Stage2, and the fifth column shows PCW + YOLOv12-pose + Stage1 + Stage2 + Stage3.
3.3. Comparative Experiment and Analysis
In this section, Watershed YOLO is compared with widely used approaches, including YOLOv8-pose, Mask R-CNN, YOLOv12-pose, the watershed algorithm, and AEPSO-SVM. The results are shown in Table 3.
Table 3.
Comparison results on the ISAR_DATASET dataset.
The results above indicate that traditional image processing methods, such as SVM and AEPSO-SVM, suffer from low recall rates for ISAR images due to the morphological similarity among scatter points. Furthermore, without label guidance, traditional methods fail to associate multiple scatter points belonging to the same target or to output ordered labels. The YOLO-series algorithms, such as YOLOv12-pose and YOLOv8-pose, exhibit MEs ranging from 4.45 to 5.14 pixels, suggesting that a lack of local structural perception could lead to significant localization deviations. Additionally, the recall rates were below 79%, indicating their difficulties in maintaining stable labeling for complex ISAR images. Mask R-CNN generates candidate regions through a region proposal network before performing localization and segmentation. Therefore, it achieved an improved detection consistency (SR3 and SR5 are 88.3% and 89.5%, respectively) with a computational overhead increase of approximately 67.74% compared to Watershed YOLO. Moreover, its recall rate and F1 were about 11–12% lower than those of Watershed YOLO.
The computational complexity of the proposed framework is dominated by the YOLOv12-pose backbone network, whose complexity scales linearly with the number of image pixels. The PCW module mainly involves distance transforms and local peak detection, which also scale linearly with the image size.
The three-stage global optimal matching strategy operates on the set of detected scatter points, whose cardinality is typically small ( number of image pixels). As a result, the computational cost of the matching stages is negligible compared to that of the deep network inference. This analysis is consistent with the experimental results, where the proposed framework achieves high accuracy with only a modest increase in inference time.
The Watershed YOLO demonstrated optimal performance in the comparative experiments on the ISAR_DATASET. YOLOv12-pose provides a more accurate initial localization of scatter points through its A2C2f module and assigns label information to each scatter point. As an effective compensation for deep learning models, PCW achieves precise segmentation by suppressing noise and optimizing local peaks. Furthermore, the three-stage global optimal matching strategy dynamically corrected the label order based on geometric information, gradually aligning key points with the centers of scatter point regions. This approach enhanced localization accuracy while maintaining label consistency—achieving an ME of 1.89 pixels, approximately 52.2% lower than that of the second-best-performing Mask R-CNN and reducing the average processing time to 124 milliseconds per frame. Additionally, the method’s precision, recall, and F1-score were all above 95%, striking an effective balance between accuracy and efficiency.
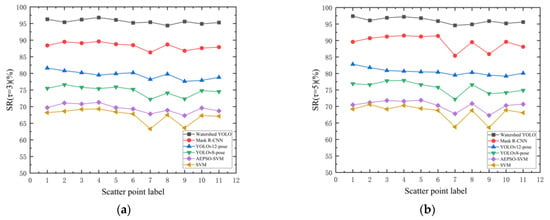
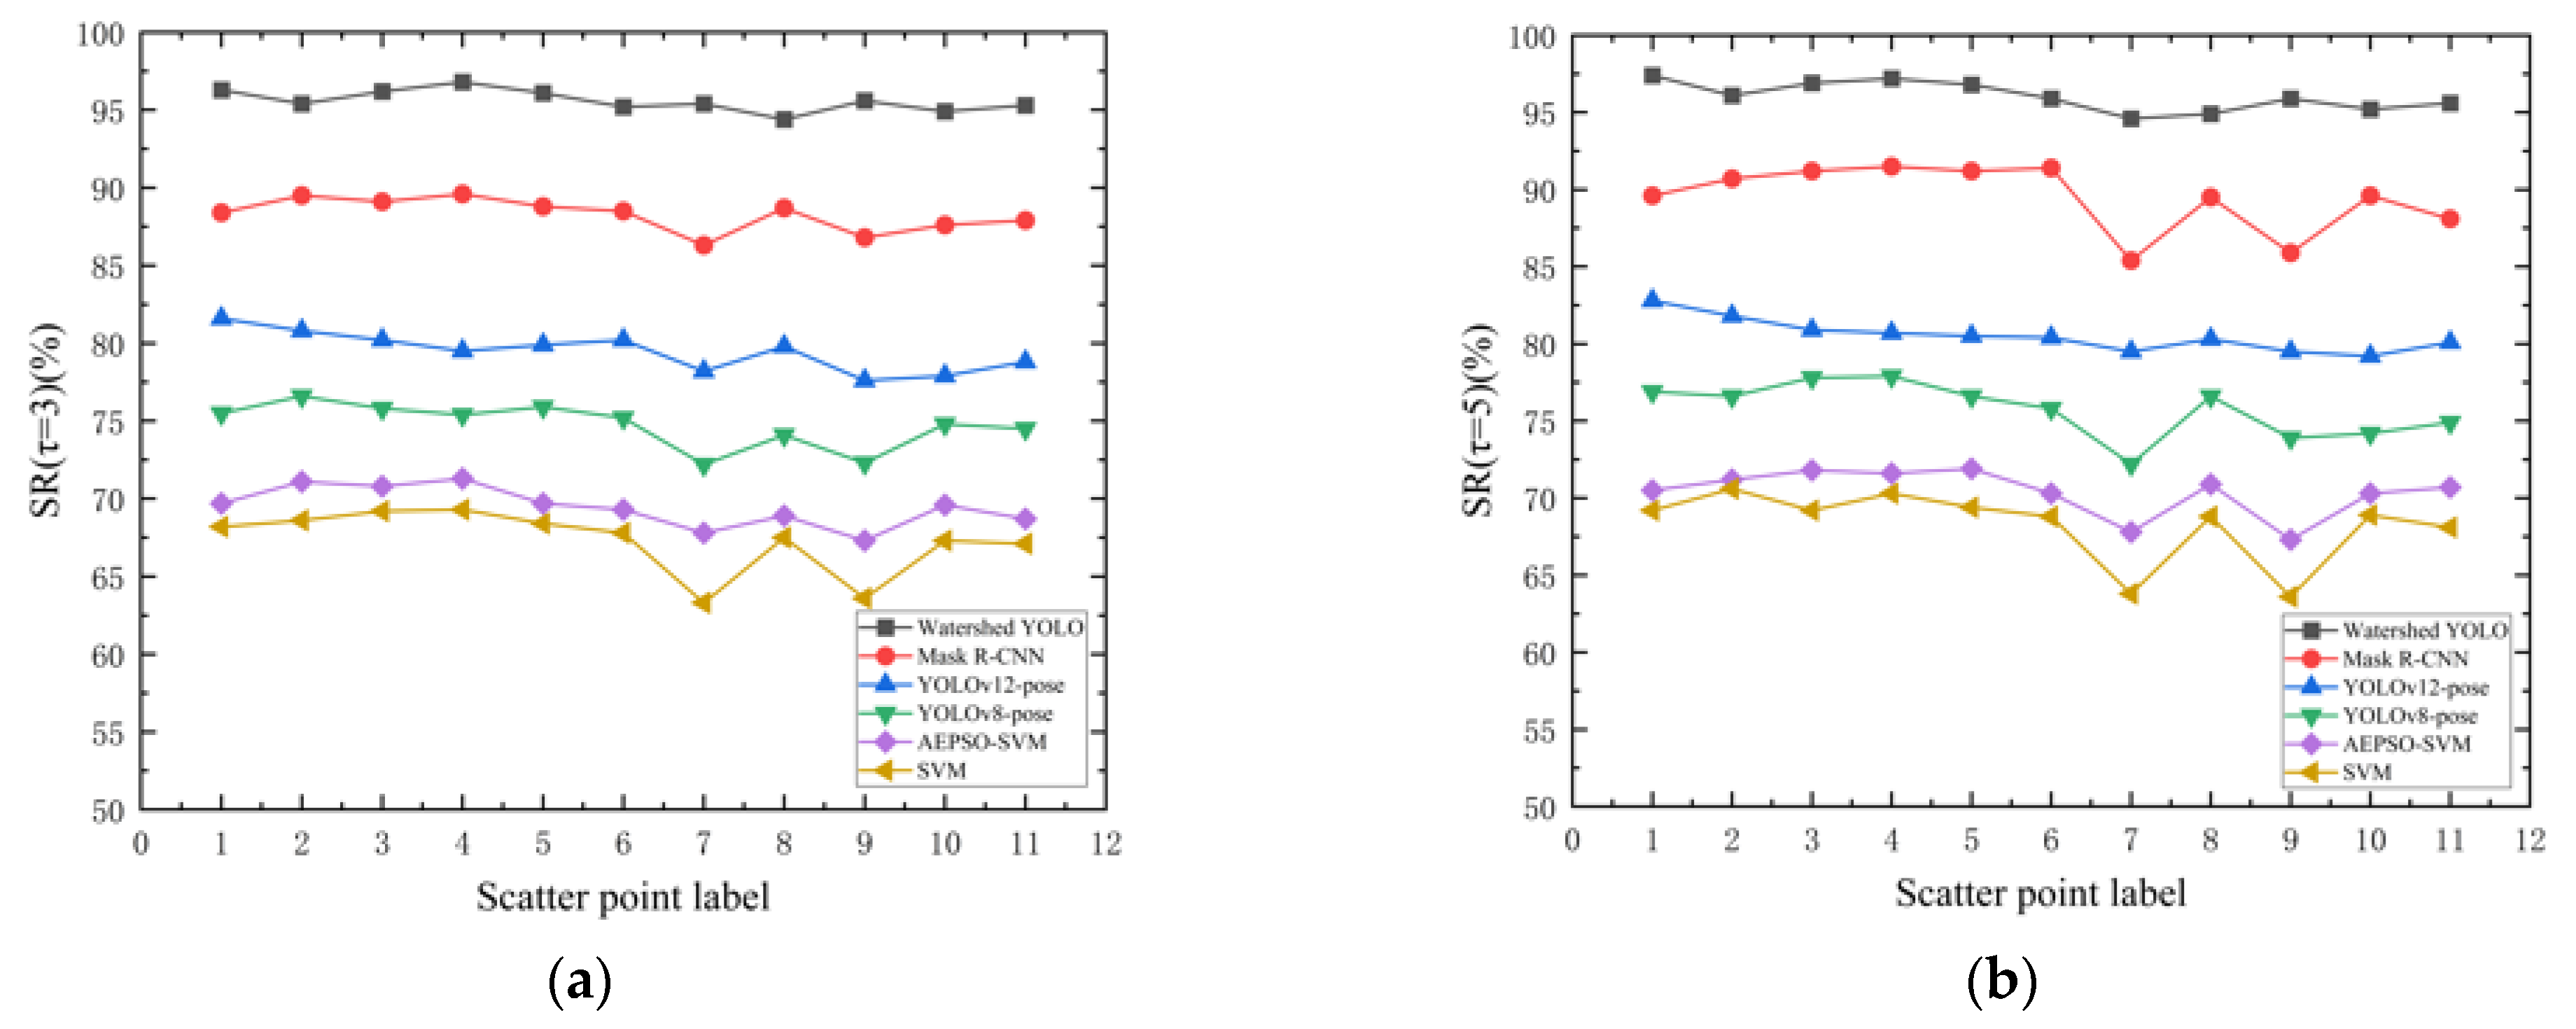
As shown in Figure 7, the scattering intensity of points 7 and 9 was relatively weak at certain moments due to scene interference. To evaluate the recognition stability of each method across scatter points, Figure 8 compares the overall recognition success rates of all algorithms for each scatter point under two distance thresholds, with 3 and 5 pixels. Watershed YOLO maintained a recognition success rate above 95% under both thresholds, with a fluctuation of less than 3%, indicating strong resistance to environmental noise and low sensitivity to the judgment threshold. AEPSO-SVM and SVM both yielded success rates below 72% across all scatter points under both thresholds, with noticeable fluctuations at points 7 and 9, revealing clear deficiencies in recognition accuracy and stability. Among the YOLO series, YOLOv12-pose—by incorporating an attention mechanism (e.g., the region-attention sub-module) in its A2C2f module—enhances the perception of key scattering regions and effectively suppresses background interference, thereby achieving relatively high recognition stability; however, its overall success rate remained below 85%. Although Mask R-CNN achieved suboptimal performance, it exhibited considerable instability in recognition, especially at scatter points 7 and 9. These results further confirm the proposed method’s ability to maintain stable localization performance in complex ISAR imaging environments.
Figure 8.
Scatter point recognition success rate of each algorithm: (a) = 3 pixels, and (b) = 5 pixels.
4. Discussion: Physical Interpretation of Scatter-Point Calibration
From a physical perspective, strong scatter points in ISAR images correspond to stable electromagnetic scattering centers associated with structural features of the target. These scattering centers are characterized by locally concentrated energy and relative spatial stability under small viewpoint variations. The proposed intensity-guided matching strategy implicitly enforces physical consistency by aligning predicted key points with regions of maximal scattering energy, while the geometric-center correction reflects the spatial symmetry of scattering responses. By integrating these physical cues into the deep learning and segmentation pipeline, the proposed framework bridges data-driven recognition and electromagnetic scattering behavior, thereby enhancing both accuracy and interpretability.
5. Conclusions and Limitations
While the proposed method demonstrated strong performance under controlled turntable-based ISAR scenarios, the current study did not explicitly address highly dynamic targets with rapid pose variations or noncooperative motion. Extending the framework to such scenarios, as well as validating it on cross-platform or publicly available ISAR datasets, constitutes an important direction for future research. Nevertheless, the present results confirm that the proposed Watershed YOLO framework provides a robust and physically meaningful solution for high-precision, ordered scatter-point calibration in ISAR imagery.
Author Contributions
Conceptualization, C.L. and T.G.; methodology, Z.H.; software, Z.H. and T.G.; validation, T.G. and K.J.; formal analysis, Z.H.; writing original draft preparation, T.G.; writing review and editing, X.S., Y.T. and Y.H.; supervision, C.L. and N.G. All authors have read and agreed to the published version of the manuscript.
Funding
This research was supported by the National Natural Science Foundation of China (No. 52401045) and the Major Science and Technology Projects of Longmen Laboratory (No. 231100220500). This work was also partly supported by the project of the Major Science and Technology Special Project of Henan Province (Approval No. 241100210300).
Institutional Review Board Statement
Not applicable.
Informed Consent Statement
Not applicable.
Data Availability Statement
The original contributions presented in this study are included in the article. Further inquiries can be directed to the corresponding author.
Conflicts of Interest
The authors declare no conflicts of interest.
References
- Pan, S.; Zhang, Y. Microwave Photonic Radars. J. Light. Technol. 2020, 38, 5450–5484. [Google Scholar] [CrossRef] [Scilit]
- Shi, T.; Zhang, F.; Chen, Y. Microwave Photonic Joint Radar and Secure Communication via Radar Signal Masking. IEEE Microw. Wirel. Technol. Lett. 2025, 35, 1646–1649. [Google Scholar] [CrossRef] [Scilit]
- Yu, H.; Wang, H.; Li, Z.; Wu, J.; Wang, A.; Wang, D.; Huang, Y.; Yang, J. High-Precision ISAR Imaging for Microwave Photonic Radar: Compensating Spatial-Variant RCM and Component Phase Errors. IEEE Trans. Aerosp. Electron. Syst. 2024, 60, 6638–6655. [Google Scholar]
- Podbregar, L.; Batagelj, B.; Blatnik, A.; Lavrič, A. Advances in and Applications of Microwave Photonics in Radar Systems: A Review. Photonics 2025, 12, 529. [Google Scholar] [CrossRef] [Scilit]
- Ma, C.; Cao, F.; Yang, Y.; Wang, X.; Liu, X.; Sun, G.; Zhang, J.; Fu, J.; Pan, S. Distributed Microwave Photonic MIMO Radar With Accurate Target Position Estimation. IEEE Trans. Microw. Theory Tech. 2023, 71, 1711–1719. [Google Scholar] [CrossRef] [Scilit]
- Zhao, H. Target Recognition of SAR Images Based on SVM and KSRC. Comput. Intell. Neurosci. 2021, 2021, 4322678. [Google Scholar] [CrossRef] [Scilit]
- Wang, C.; Huang, P.; Li, X.; Wang, J.; Zhao, H. Radar HRRP Target Recognition Based on AEPSO-SVM Algorithm. Syst. Eng. Electron. 2019, 41, 1984–1989. [Google Scholar]
- Yayla, R.; Sen, B. A New Classification Approach with Deep Mask R-CNN for Synthetic Aperture Radar Image Segmentation. Electron. Electr. Eng. 2020, 26, 52–57. [Google Scholar] [CrossRef] [Scilit]
- Jiang, M.; Gu, L.; Li, X.; Gao, F.; Jiang, T. Ship Contour Extraction from SAR Images Based on Faster R-CNN and Chan-Vese Model. IEEE Trans. Geosci. Remote Sens. 2023, 61, 1–14. [Google Scholar] [CrossRef] [Scilit]
- Ren, S.; He, K.; Girshick, R.; Sun, J. Faster R-CNN: Towards Real-Time Object Detection with Region Proposal Networks. IEEE Trans. Pattern Anal. Mach. Intell. 2017, 39, 1137–1149. [Google Scholar] [CrossRef] [Scilit]
- Chen, X.; Mu, X.; Guan, J.; Liu, N.; Zhou, W. Marine Target Detection Based on Marine-Faster R-CNN for Navigation Radar Plane Position Indicator Images. Front. Inf. Technol. Electron. Eng. 2022, 23, 630–643. [Google Scholar] [CrossRef] [Scilit]
- Zhou, X.; Bai, X.; Wang, L.; Zhou, F. Robust ISAR Target Recognition Based on ADRISAR-Net. IEEE Trans. Aerosp. Electron. Syst. 2022, 58, 5494–5505. [Google Scholar] [CrossRef] [Scilit]
- Liao, L.; Jiang, Y.; Zhang, G.; Liu, Z. MFFN-FCSA: Multi-Modal Feature Fusion Networks with Fully Connected Self-Attention for Radar Space Target Recognition. Appl. Sci. 2025, 15, 11940. [Google Scholar] [CrossRef] [Scilit]
- Zong, H.; Zhang, E.; Li, X.; Zhang, H. Multiscale Self-Supervised SAR Image Change Detection Based on Wavelet Transform. IEEE Geosci. Remote Sens. Lett. 2024, 21, 1–5. [Google Scholar] [CrossRef] [Scilit]
- Lu, P.; Hao, X.; Li, W.; Yi, C.; Kong, R.; Wang, T. ECF-YOLO: An Enhanced YOLOv8 Algorithm for Ship Detection in SAR Images. Electron. Res. Arch. 2025, 33, 3394–3409. [Google Scholar] [CrossRef] [Scilit]
- Pan, H.; Guan, S.; Jia, W. EMO-YOLO: A Lightweight Ship Detection Model for SAR Images Based on YOLOv5s. Signal Image Video Process. 2024, 18, 5609–5617. [Google Scholar] [CrossRef] [Scilit]
- Xu, Y.; Xue, X.; Li, C.; Zhao, S.; Xu, X.; Zeng, C. RLE-YOLO: A Lightweight and Multiscale SAR Ship Detection Based on Improved YOLOv8. IEEE Access 2025, 13, 46584–46600. [Google Scholar] [CrossRef] [Scilit]
- Yao, Y.; Wang, L.; Wang, L. Fast Segmentation of Solar Panels in Satellite ISAR Images Using a Multitask-YOLO Network. Trans. Nanjing Univ. Aeronaut. Astronaut. 2024, 41, 253–262. [Google Scholar]
- Zhang, Y.; Sun, Z.; Chang, S.; Tang, B.; Hou, B. SegS-YOLO: A YOLO-Based Instance Segmentation Approach for Small-Scale Ship Targets in SAR Images. IEEE J. Sel. Top. Appl. Earth Obs. Remote Sens. 2025, 19, 2658–2679. [Google Scholar] [CrossRef] [Scilit]
- Hou, F.; Peng, Y.; Dong, J.; Yin, X. Ground Penetrating Radar Hyperbolic Keypoint Detection and Object Localization Based on Dual YOLOv8-Pose Model. J. Electron. Inf. Technol. 2024, 46, 4305–4316. [Google Scholar]
- Liu, Z.; Wang, L.; Wen, Z.; Li, K.; Pan, Q. Multilevel Scattering Center and Deep Feature Fusion Learning Framework for SAR Target Recognition. IEEE Trans. Geosci. Remote Sens. 2022, 60, 1–14. [Google Scholar] [CrossRef] [Scilit]
- Zhang, J.; Xing, M.; Xie, Y. FEC: A Feature Fusion Framework for SAR Target Recognition Based on Electromagnetic Scattering Features and Deep CNN Features. IEEE Trans. Geosci. Remote Sens. 2021, 59, 2174–2187. [Google Scholar] [CrossRef] [Scilit]
- Gu, M.; Wang, Y.; Liu, H.; Wang, P. PolSAR Ship Detection Based on a SIFT-like PolSAR Keypoint Detector. Remote Sens. 2022, 14, 2900. [Google Scholar] [CrossRef] [Scilit]
- Tian, Y.; Ye, Q.; Doermann, D. YOLOv12: Attention-Centric Real-Time Object Detectors. In Proceedings of the Thirty-Ninth Annual Conference on Neural Information Processing Systems, San Diego, CA, USA, 2–7 December 2025. [Google Scholar]
- Liu, Z.; Lin, Y.; Cao, Y.; Hu, H.; Wei, Y.; Zhang, Z.; Lin, S.; Guo, B. Swin Transformer: Hierarchical Vision Transformer Using Shifted Windows. In Proceedings of the IEEE International Conference on Computer Vision 2021, Montreal, QC, Canada, 11–17 October 2021; pp. 9992–10002. [Google Scholar]



Disclaimer/Publisher’s Note: The statements, opinions and data contained in all publications are solely those of the individual author(s) and contributor(s) and not of MDPI and/or the editor(s). MDPI and/or the editor(s) disclaim responsibility for any injury to people or property resulting from any ideas, methods, instructions or products referred to in the content. |
© 2026 by the authors. Licensee MDPI, Basel, Switzerland. This article is an open access article distributed under the terms and conditions of the Creative Commons Attribution (CC BY) license.