


Abstract
Semiconductor manufacturing relies heavily on automatic test equipment (ATE), and yet thermal aging poses a critical risk to equipment reliability. This study proposes a novel anomaly detection framework for ATE driver boards by integrating cumulative degradation time (CDT)—derived from accelerated life testing (ALT)—with artificial intelligence models. Specifically, the approach quantifies the cumulative effects of thermal stress as CDT and utilizes it as a key input feature to enable the early detection of degradation under prolonged high-temperature conditions. The proposed framework successfully demonstrates the capability to diagnose real-time anomalies before critical CDT thresholds are reached. Consequently, this approach allows for efficient management, significantly contributing to reduced maintenance costs, minimized downtime, and enhanced equipment reliability, serving as a foundational strategy for condition-based maintenance (CBM) strategies in semiconductor manufacturing.
1. Introduction
As semiconductor devices continue to scale down and integrate more functionality, the manufacturing process has become increasingly complex and demanding [1]. Advanced technologies such as FinFET, 3D integration, and extreme ultraviolet lithography require exceptional precision not only during fabrication, but also in the testing phase. At the same time, manufacturers are under constant pressure to deliver high-performance products at lower costs, with minimal energy use and faster turnaround. Complicating matters further is the vast amount of process and equipment data generated throughout production, all of which must be effectively managed. Among the many challenges faced on the production floor, maintaining the reliable operation of critical equipment remains a top priority. In high-volume manufacturing, even brief equipment downtime can significantly disrupt workflow and lead to substantial financial losses [2]. For example, a short interruption in automated test equipment (ATE) functionality can delay wafer-level testing and cause downstream bottlenecks in packaging and shipping. Ensuring the continuous operation of such systems is therefore essential to sustaining both productivity and competitiveness in the semiconductor industry.
To address these concerns, the industry is steadily shifting away from traditional maintenance strategies and toward smarter, data-driven alternatives. Reactive maintenance—fixing equipment after failure—often results in severe damage and long delays. Preventive maintenance, which follows a fixed schedule, can lead to unnecessary part re-placements and inefficiencies. In contrast, predictive maintenance (PdM) uses real-time sensor data and analytics to anticipate failures before they happen [3]. PdM integrates sensor networks, data acquisition systems, and machine learning (ML) algorithms to monitor equipment health and detect early signs of degradation. By enabling smarter scheduling of repairs and component replacements, PdM helps reduce unplanned downtime, extend the lifespan of critical parts, and optimize maintenance re-sources. In semiconductor manufacturing—where even a minor disruption can translate into yield loss—PdM offers substantial operational and economic benefits [4,5].
This study focuses on applying anomaly detection to one of the most crucial components within the ATE system: the test head. This part interfaces directly with the device under test (DUT) and contains high-density driver boards responsible for generating precise electrical signals. These boards are subjected to intense and localized heating during extended operation. Although cooling systems are in place, their effectiveness can deteriorate over time due to fan wear, dust buildup, or coolant degradation. This decline in cooling performance leads to elevated board temperatures, which in turn can compromise electrical, mechanical, and dielectric properties. Over time, these issues may cause increased test errors, reduced accuracy, and eventual board failure. The degradation of ATE components can have significant ripple effects. It raises the likelihood of retesting, disrupts production flow, and drives up maintenance costs. In more severe cases, premature failure of consumable components like driver boards results in costly replacements and extended downtime. To mitigate these risks, there is a growing need for PdM solutions that are specifically designed for these boards, addressing their unique operational and thermal challenges. In response to these challenges, various researchers have proposed data-driven approaches for anomaly detection in various semiconductor applications.
For instance, support vector regression has been applied to model device aging by examining changes in subthreshold leakage and drain current [6]. In the field of equipment monitoring, autoencoders have been utilized to identify anomalies in ATE event logs [7], while various machine learning methods have been employed to predict robotic arm trajectories in wafer transfer systems [8]. Furthermore, predictive maintenance frameworks have been proposed to enhance the reliability of optical components [9], and hybrid approaches combining principal component analysis and multilayer perceptron networks have been implemented to estimate the remaining useful life (RUL) of turbofan engines using NASA datasets [10]. Building on this foundation, our study proposes a PdM framework specifically tailored to ATE driver boards by integrating ML-based anomaly detection with accelerated life testing (ALT). This approach utilizes ML models to identify unusual patterns in voltage–temperature relationships during high-stress operations, while ALT provides a rigorous method for estimating the anomaly detection of driver boards under elevated thermal conditions. The goal is to improve the reliability of ATE systems, reduce unnecessary maintenance costs, and preserve test accuracy over time. The structure of this paper is as follows: Section 2 describes the architecture of the ATE system and the function of its key components. Section 3 outlines our data collection strategy and experimental setup. Section 4 presents the anomaly detection algorithm framework. Section 5 discusses the results and evaluates model performance. Finally, Section 6 concludes the paper and suggests directions for future work.
2. ATE Operation
Testing is one of the most crucial steps in the semiconductor manufacturing process. It ensures that integrated circuits function correctly before they reach customers. Testing generally happens in two phases: wafer-level and package-level. Wafer-level testing is carried out before the chips are cut and packaged. A probe card—equipped with an array of fine needles—makes direct contact with the tiny test pads on the wafer surface. This early-stage check helps catch defective dies before packaging, improving yield and reducing wasted materials later in the process. In contrast, package-level testing happens after the chips have been singulated and packaged. At this stage, a test socket connects to the package’s pins or solder balls to confirm that the final product meets all functional and reliability requirements under real-world conditions.
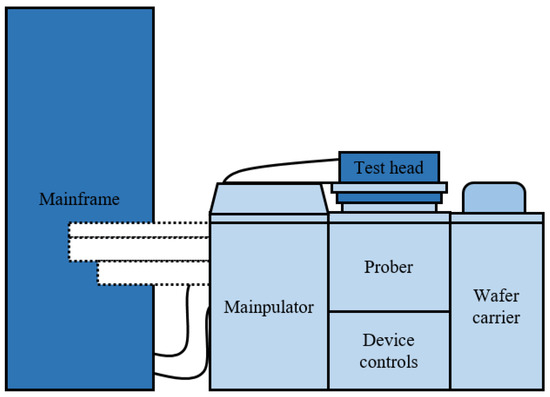
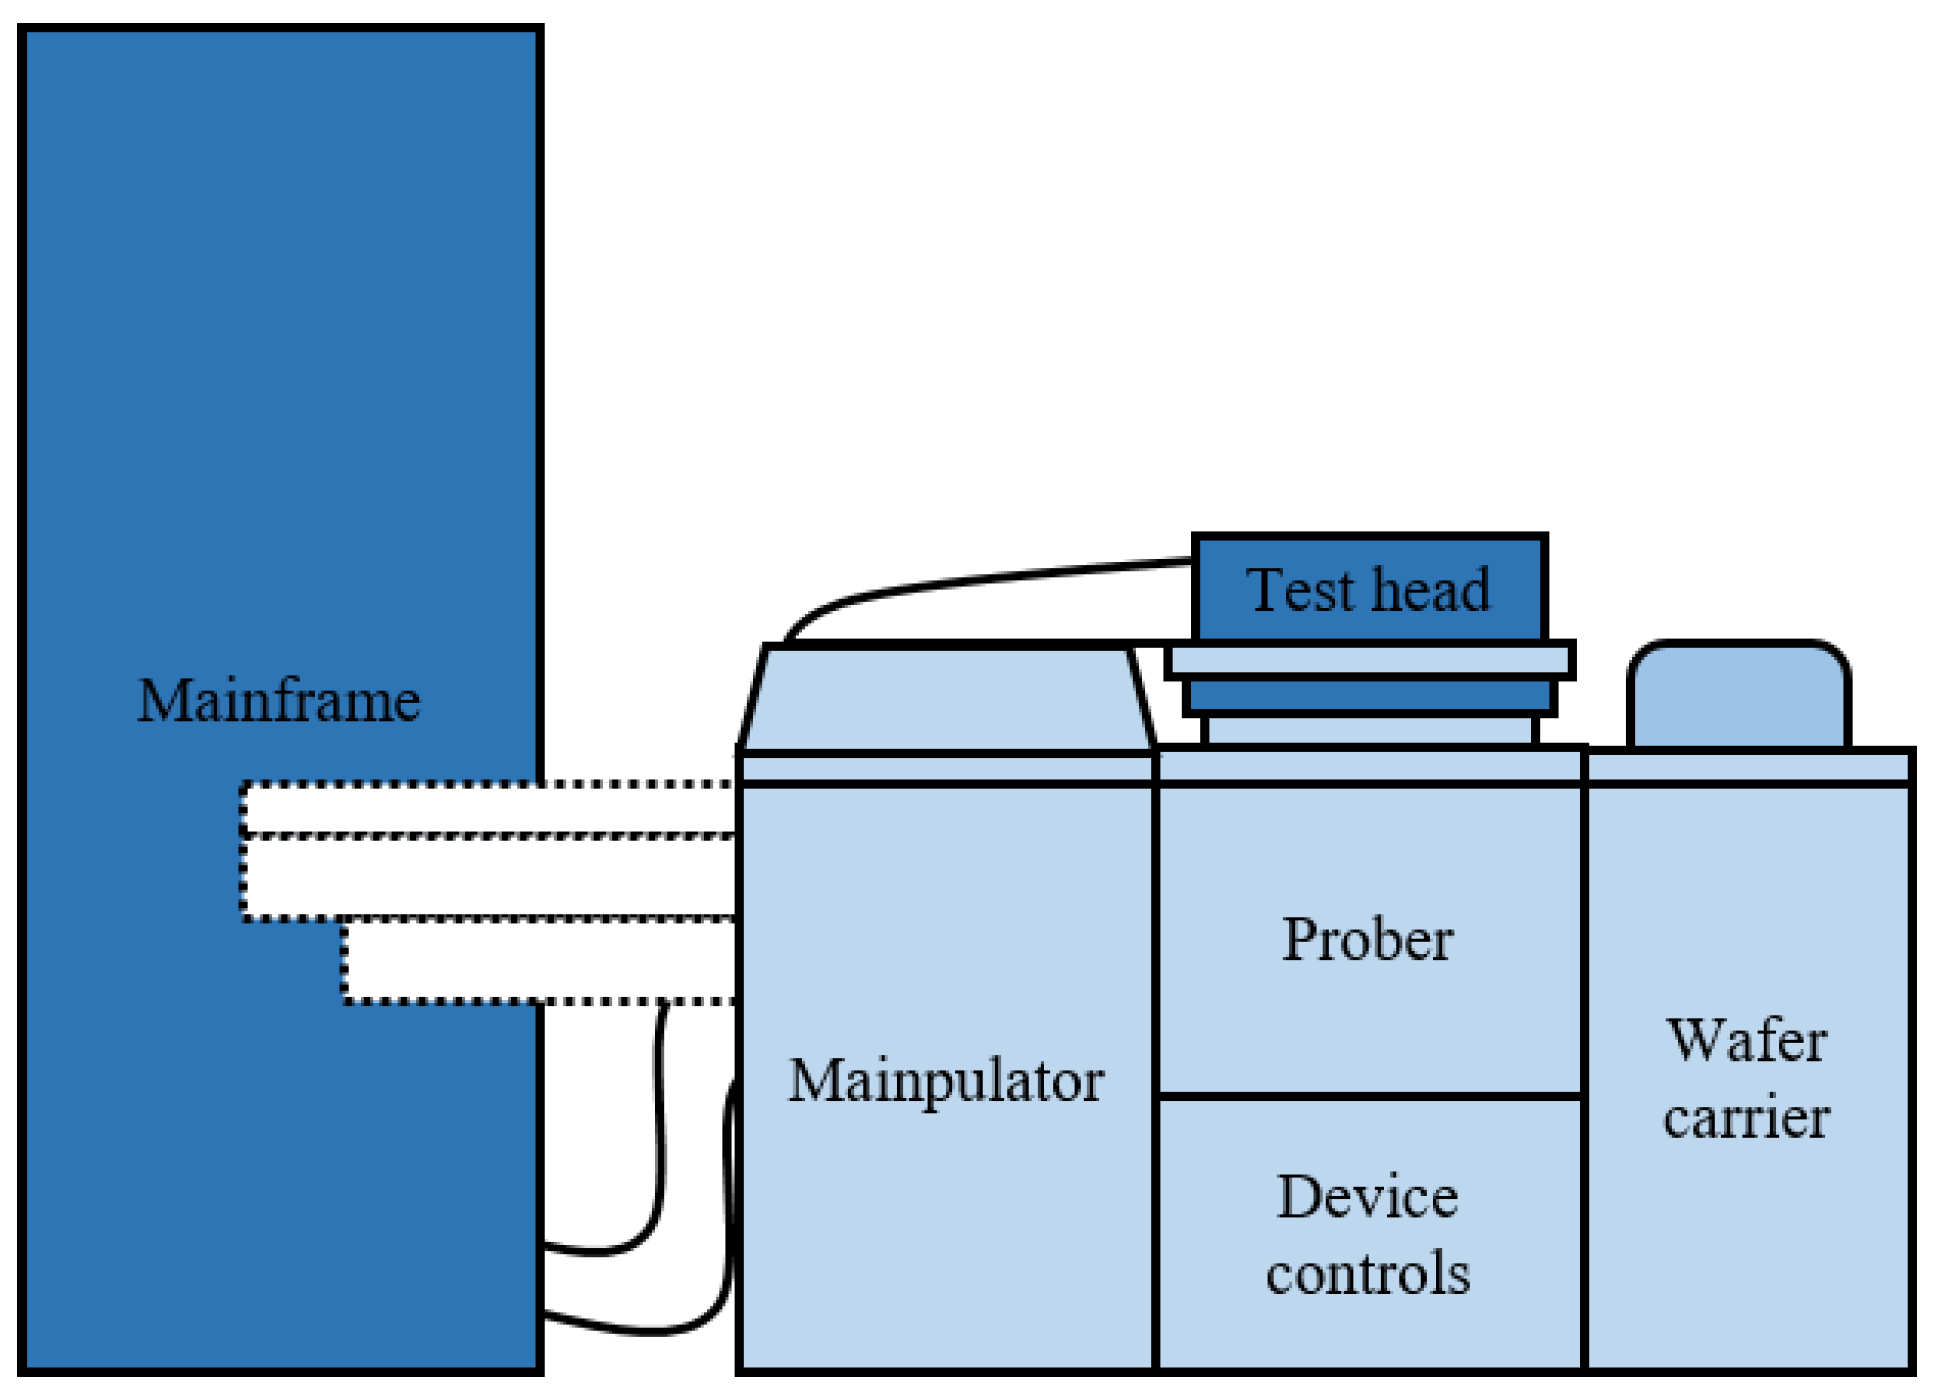
ATE is at the heart of both types of testing. While different ATE systems are designed to support different test types, their internal architecture is often quite similar. As shown in Figure 1, a typical ATE setup includes a main tester frame, a prober or handler, a test head, and various supporting modules. Among these, the test head is especially important. It is the primary interface between the tester and DUT. The test head is positioned between the tester and the DUT, functioning as the conduit for signal transmission and data acquisition. It houses numerous driver boards and comparator modules that perform essential functions such as signal generation, application, and response evaluation. During test execution, the system alternates between two primary operational modes: driver mode and comparator mode. In driver mode, driver boards actively deliver test signals to the DUT’s input terminals. In comparator mode, the DUT’s output responses are compared against expected values using internal comparator circuits. These mode transitions occur at high speed to enable comprehensive testing of both digital and analog pins.
Figure 1.
The architecture of ATE.
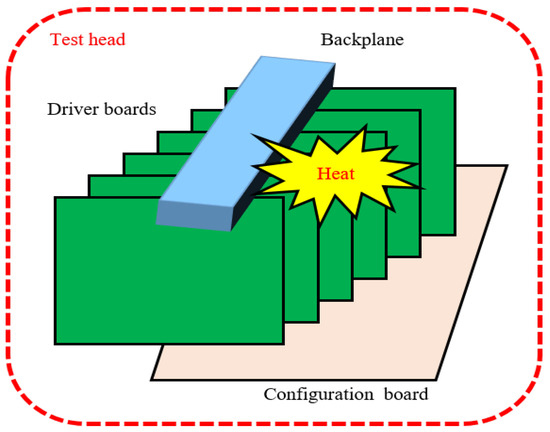
Such simultaneous, multi-channel operation allows for ATE to maintain accuracy and timing integrity while achieving high test throughput. Figure 2 schematically depicts the internal structure of a typical test head. The test head manages the flow of signals between the tester and the DUT. Inside it are driver boards and comparator circuits responsible for sending signals to the device and checking its responses. During operation, the system rapidly switches between two key modes: driver mode, where it sends signals to the DUT, and comparator mode, where it checks the DUT’s output against expected values. These transitions happen quickly and repeatedly across many channels, allowing for the system to test both digital and analog pins with high accuracy and speed. Figure 2 provides a schematic overview of the internal layout of a typical test head.
Figure 2.
Heat applied to the driver board.
This paper focuses on the reliability challenges that arise in the test head during pro-longed use. Driver boards, densely packed within the test head, operate continuously under high electrical load, which causes them to heat up significantly. While cooling systems—such as forced air or liquid cooling—are used to manage this heat, their effective-ness can decrease over time due to factors like dust buildup, fan wear, or coolant degradation. As thermal management performance declines, heat begins to accumulate inside the test head. Prolonged exposure to elevated temperatures can degrade the driver boards in several ways. It can weaken their mechanical structure, alter electrical properties, and reduce insulation resistance.
These changes can compromise signal integrity, introduce test errors, and eventually lead to board failures. Worse still, when boards fail or require maintenance, the resulting downtime can interrupt production—especially problematic in high-throughput manufacturing environments where ATE systems are critical to keeping the line moving. Because of their exposure to repeated thermal cycling and high current loads, driver boards are often treated as consumables. Over time, their performance degrades, requiring regular inspection, calibration, or replacement to maintain the overall reliability and accuracy of the test system.
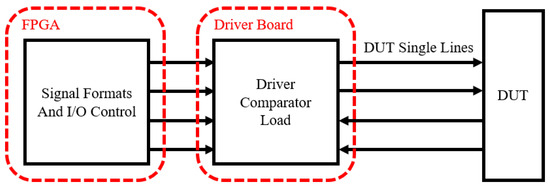
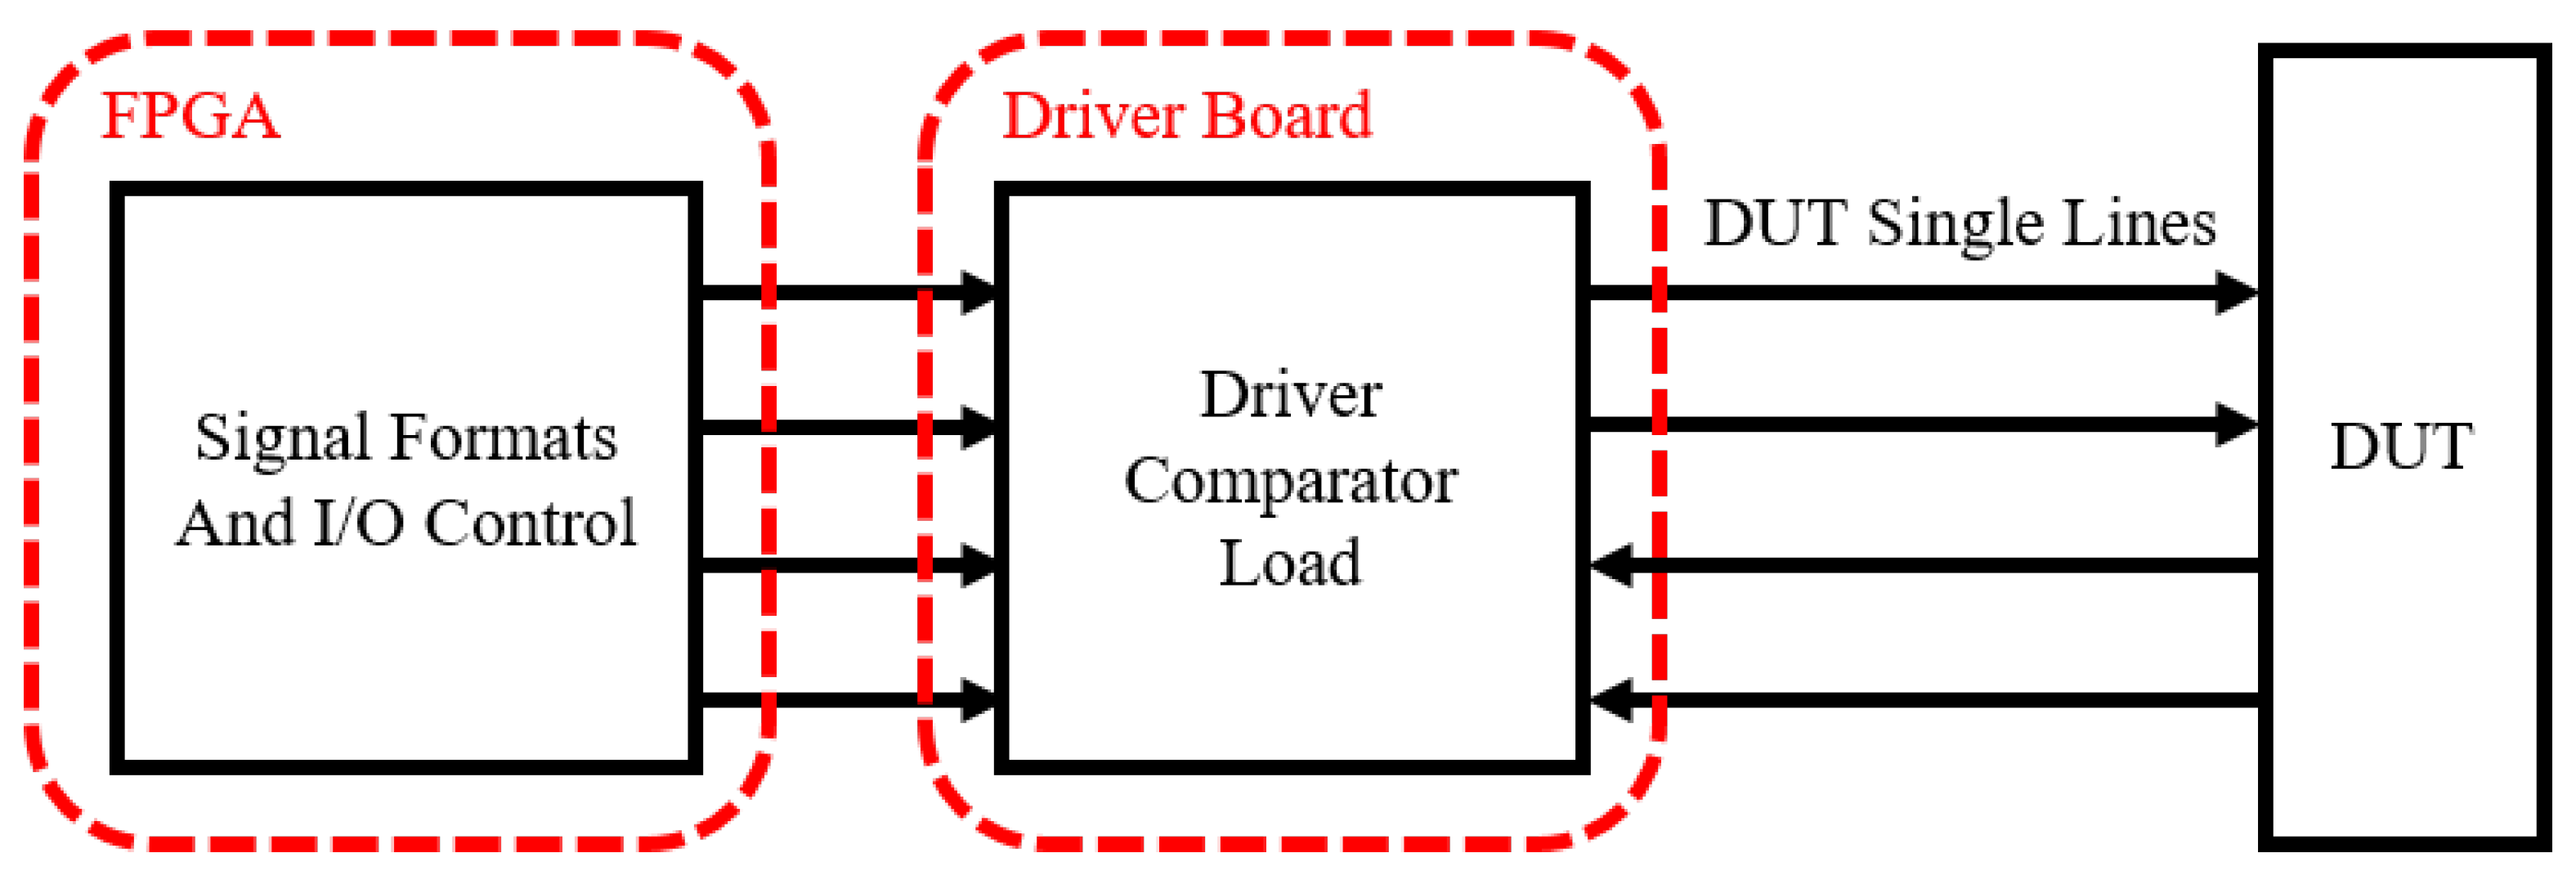
To simulate conditions similar to those in a real ATE test head, we built a custom test setup, as illustrated in Figure 3. This setup included a field programmable gate array (FPGA), a driver board, and a DUT. Each component was configured to emulate the signal flow and operational conditions of a real semiconductor test environment. To verify that the communication of serial peripheral interface between the FPGA and the driver board was functioning correctly, the signal waveform and timing were examined using an oscilloscope. Through this process, it was confirmed that no communication errors occurred due to data transmission delays, signal interference, or voltage-level mismatches.
Figure 3.
ATE test head topology.
3. Data Acquisition
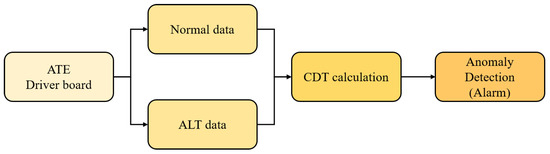
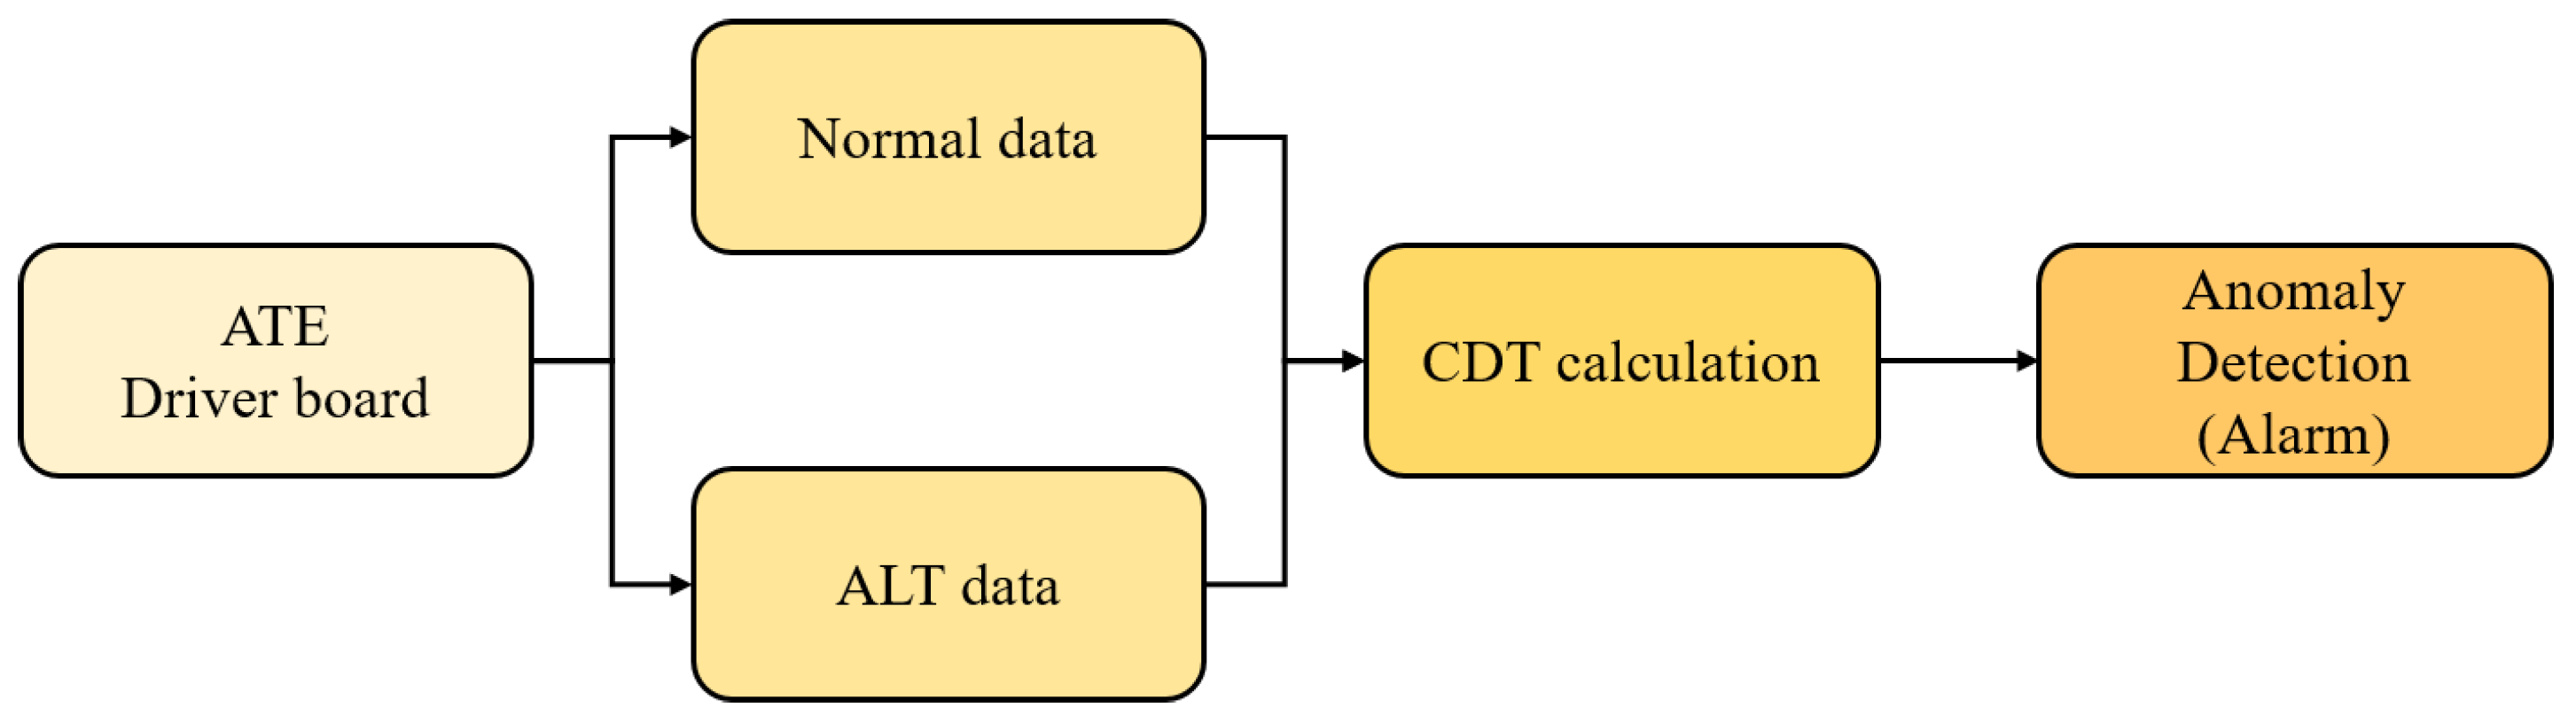
To systematically validate the feasibility of the cumulative degradation time (CDT)-based anomaly detection method, we designed a comprehensive experimental workflow. Figure 4 illustrates the overall architecture of the proposed framework. The process initiates with data acquisition from the ATE driver board, where datasets are categorized into two streams: normal operating data for baseline establishment and ALT data for degradation modeling. These raw inputs are then processed to calculate the CDT, which serves as a quantitative indicator of thermal stress accumulation. Finally, this derived feature is utilized to train AI models for precise anomaly detection and alarm generation.
Figure 4.
Anomaly detection flow chart.
As illustrated in Figure 4, the proposed framework calculates the CDT based on data acquired from accelerated environment experiments, enabling time-based tracking of degradation progression. By applying this same methodology to normal operating conditions, the framework seamlessly extends to real-time degradation assessment and early warning systems for equipment in operation.
For the experimental setup, we utilized a Xilinx Zynq-7000 ZC702 evaluation board (Xilinx, San Jose, CA, USA) equipped with a 7z020clg484 FPGA chip as the main controller. Crucially, the primary subject of this study was the ADATE304, a high-performance pin electronics driver IC manufactured by Analog Devices (Wilmington, MA, USA). To evaluate this component under controlled conditions, we employed the EVAL-ADATE304BBCZ, a dedicated evaluation board pre-assembled with the ADATE304 IC.
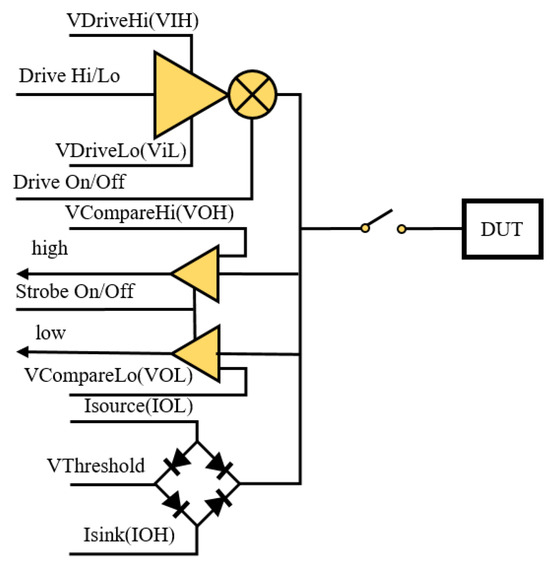
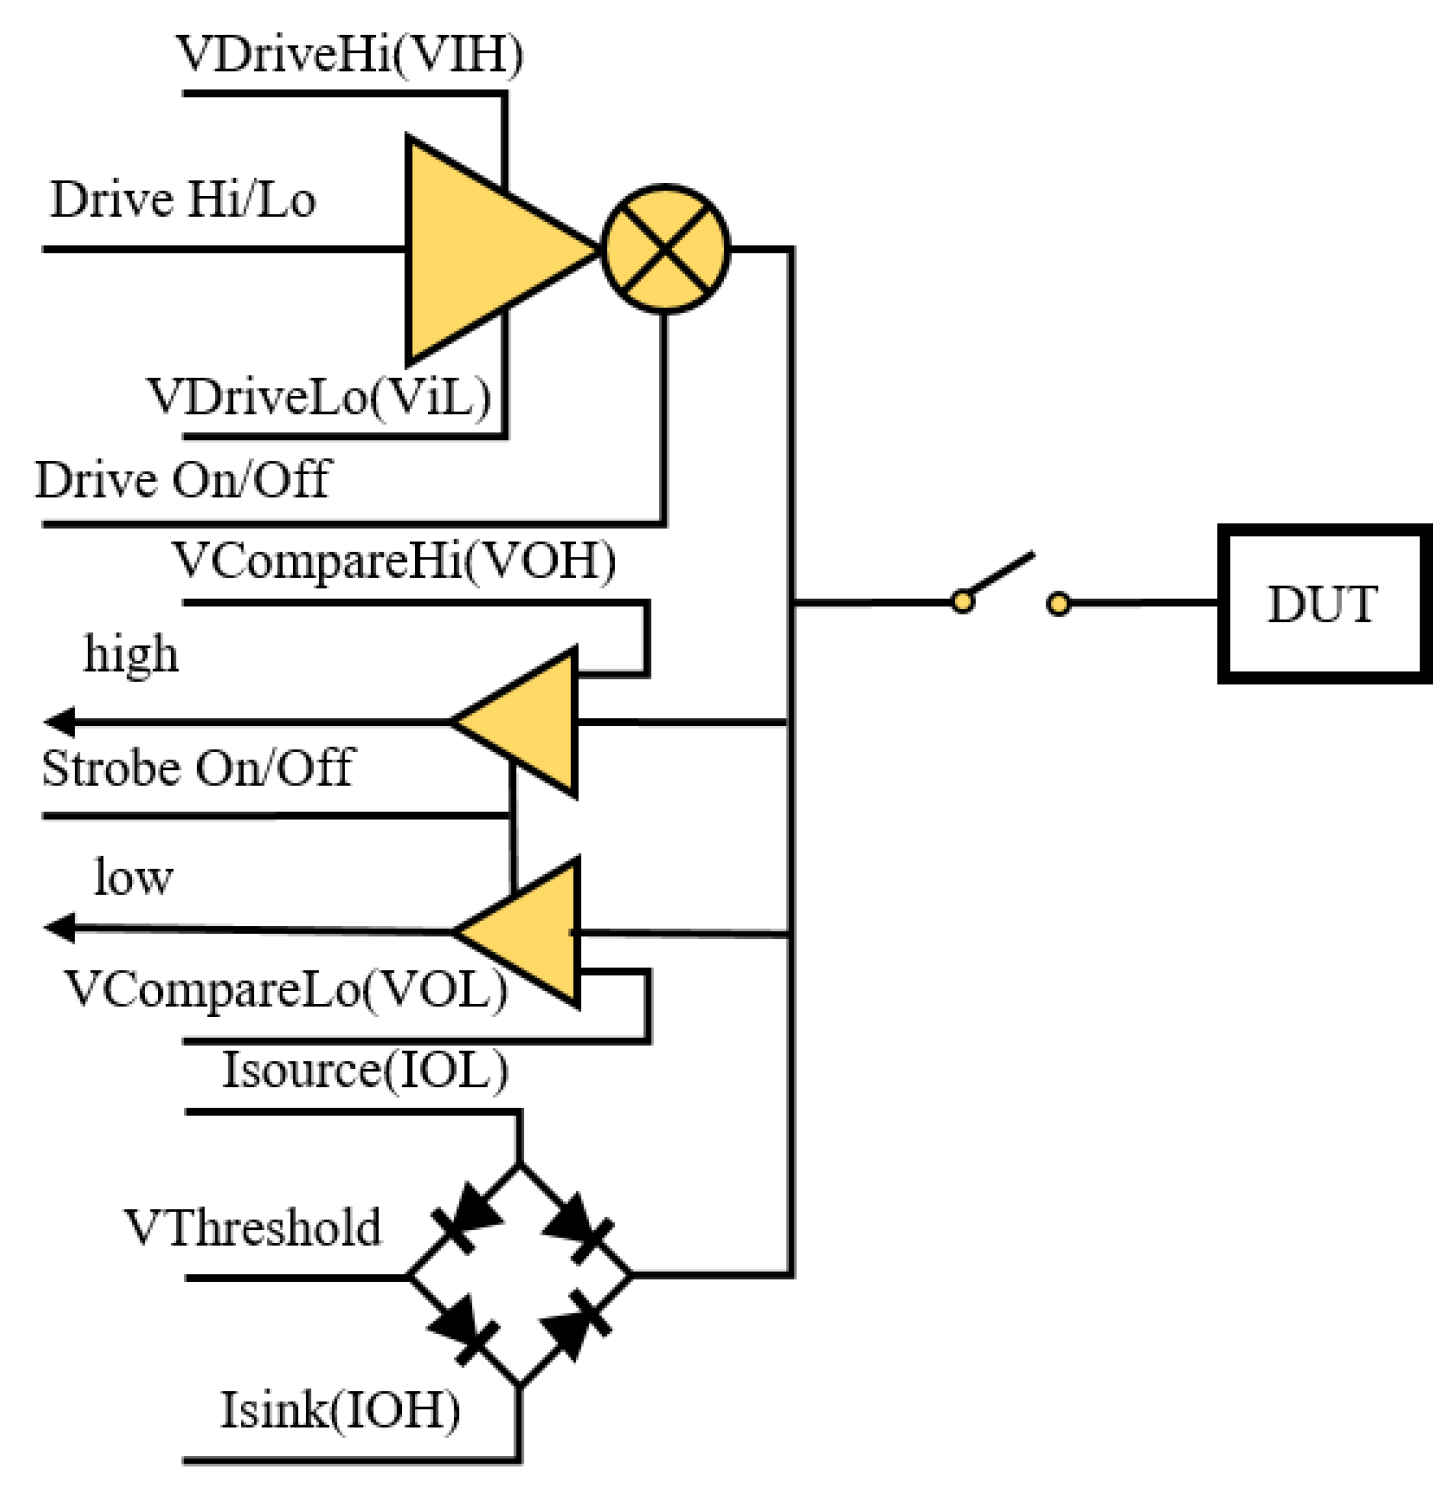
As illustrated in Figure 5, the internal circuitry of the driver board is designed to facilitate precise bidirectional signal interaction. The architecture integrates a driver stage that generates programmable high (VIH) and low (ViL) voltage levels, alongside a window comparator section (VOH/VOL) for signal verification. Additionally, it features a programmable active load capable of sourcing (Isource) and sinking (Isink) current, which allows for the simulation of various load conditions.
Figure 5.
Internal circuitry of the driver board.
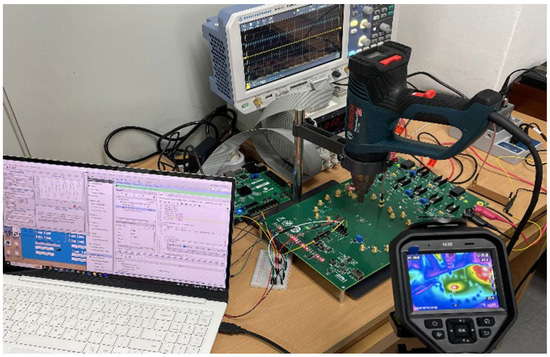
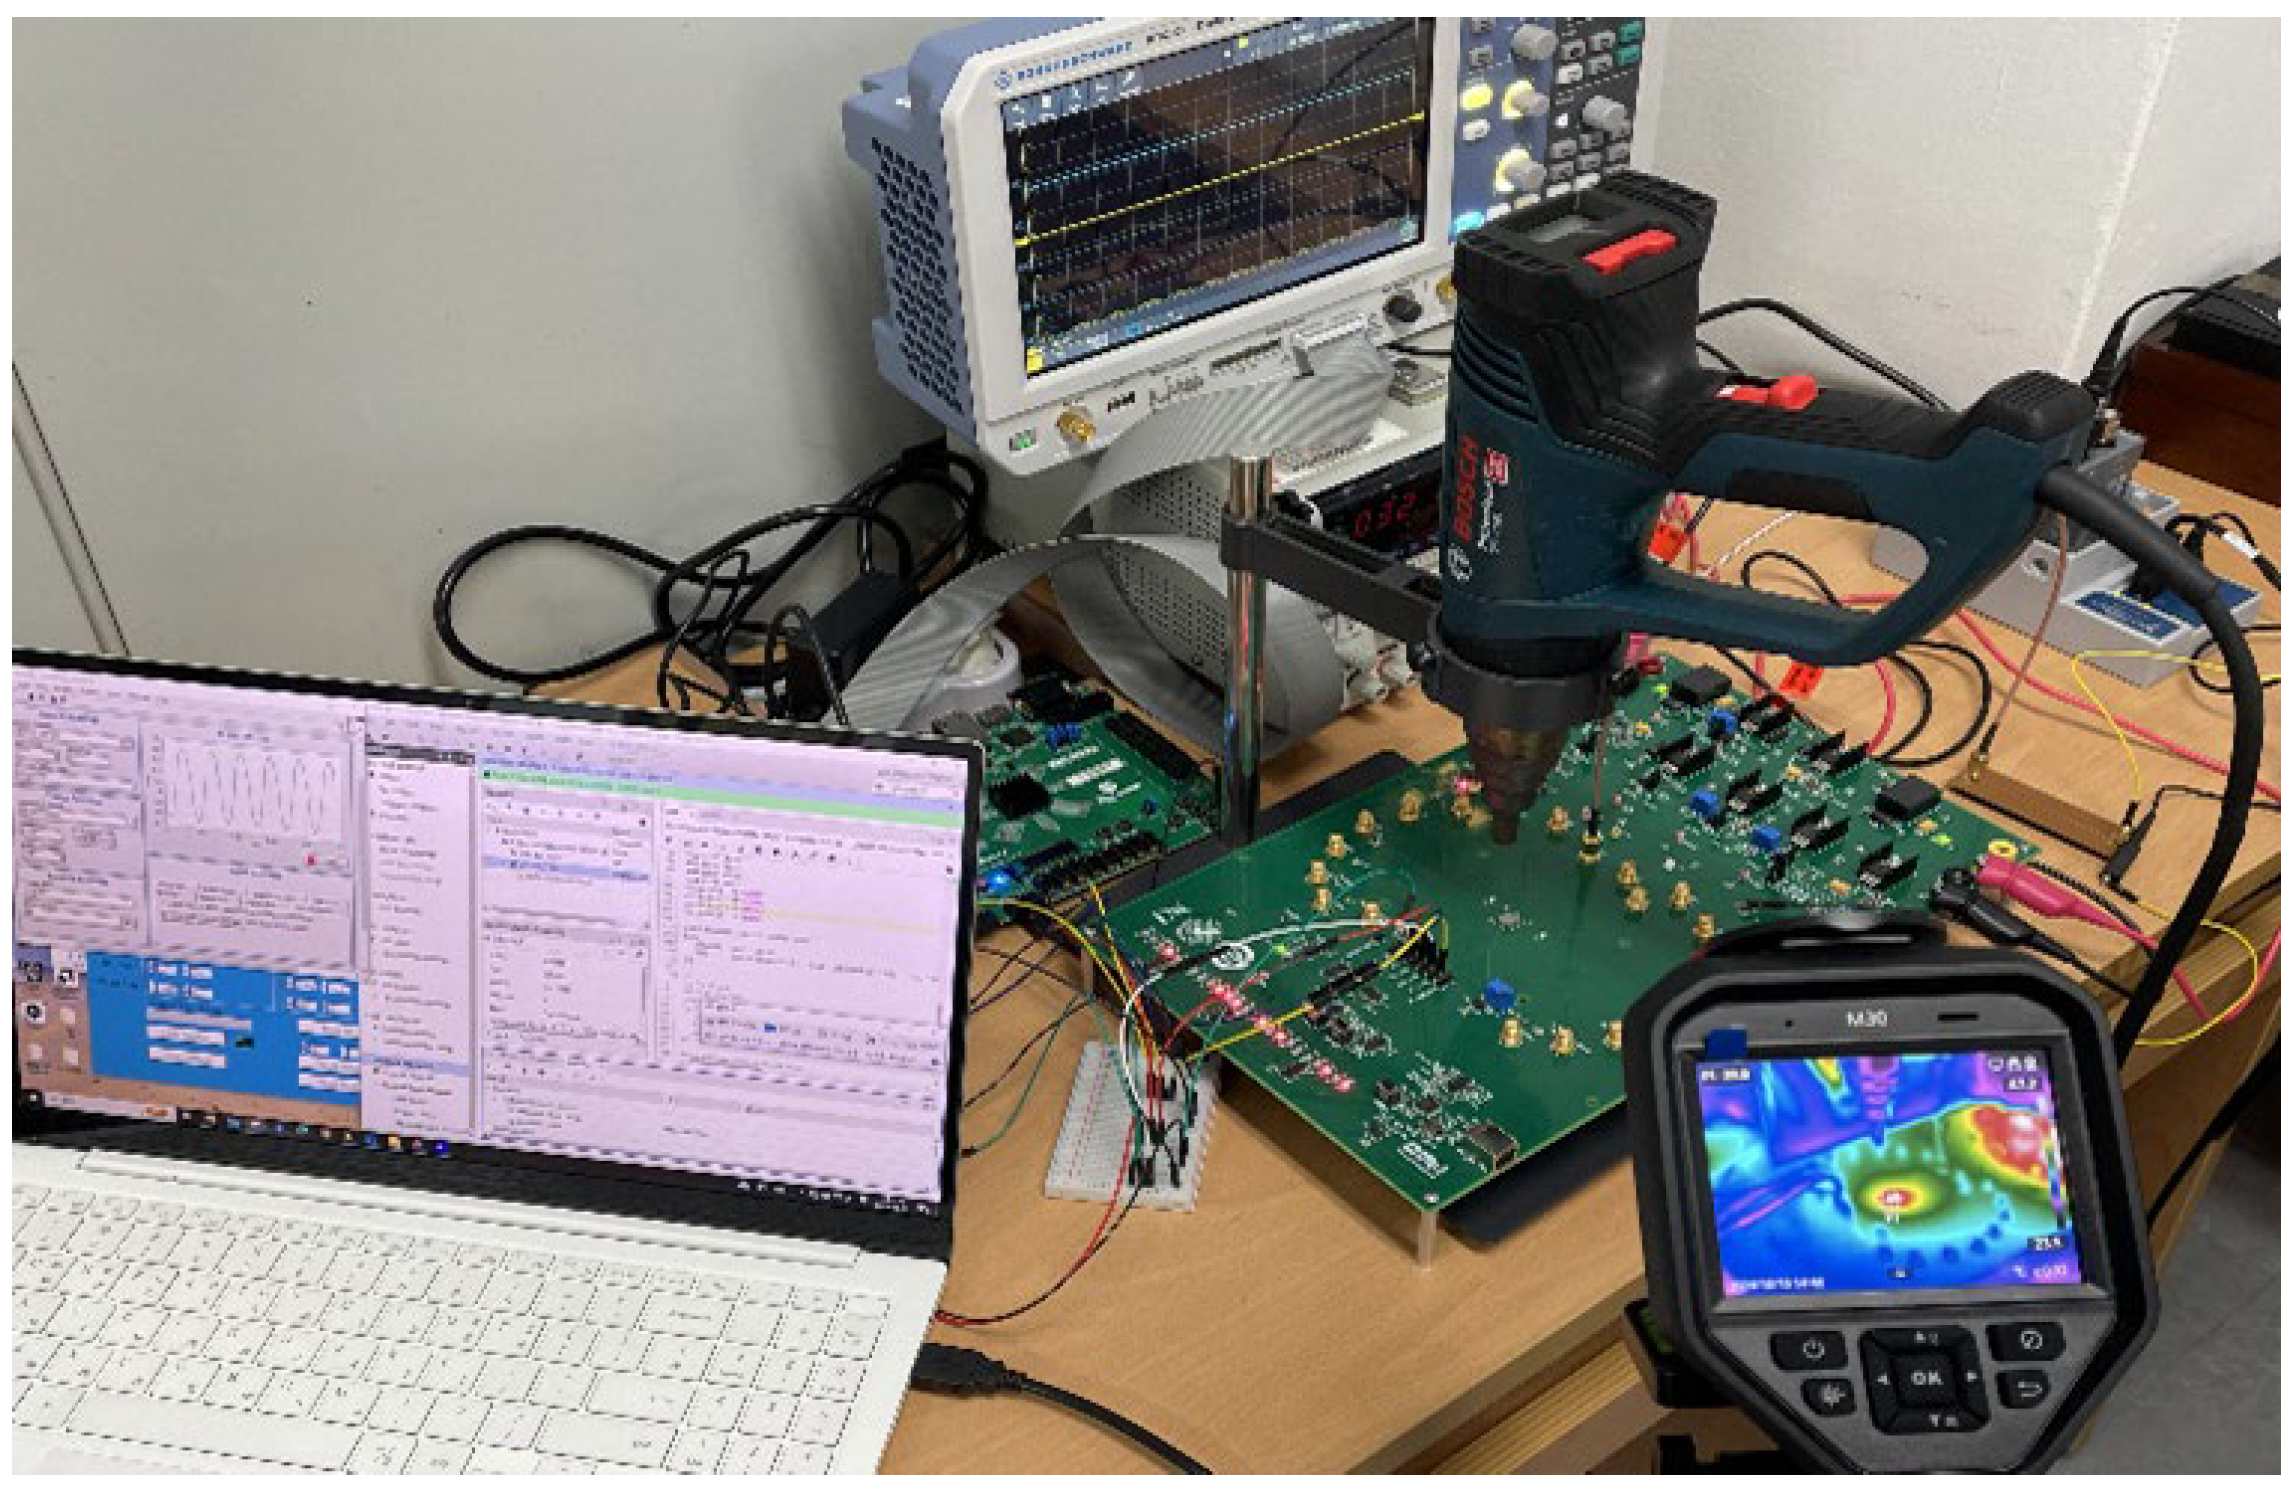
This driver board was powered using a dual-supply configuration of +21 V (VDD) and −10 V (VSS) to simulate realistic operating environments. The DUT consisted of a two-layer PCB, with the circuit traces on both sides electrically connected through vias. It featured a single signal line, which transmitted driving signals from the driver board to the DUT and collected response signals from the DUT back to the driver. The overall length of the DUT was approximately 70 mm, offering a relatively simple structure suitable for precise analysis of signal transmission characteristics. To experimentally reproduce the thermal degradation process, a hot air blower was employed to apply a continuous and constant heat load directly to the driver IC chip. Through this experimental setup, it was possible to control the effect of thermal stress that could occur in an actual test environment. Based on this, the relationship between the comparator’s input voltage and the driver board’s temperature was precisely measured and analyzed. Accurate input voltage to the comparator is essential for reliable test results. Any deviation can introduce errors or even trigger ATE malfunctions. To monitor potential performance degradation due to heat, we collected both the comparator’s input voltage and the driver board’s temperature. The voltage data was acquired through LabVIEW, while temperature measurements were taken using a thermal camera. Figure 6 shows our test setup.
Figure 6.
Experimental environment for ALT.
The voltage–temperature matching experiment was systematically conducted to quantify the thermal sensitivity of the comparator’s input voltage and to identify the critical failure threshold under thermal stress. To simulate a controlled heating environment, a hot air blower was utilized to apply continuous heat to the driver board, while a high-precision monitoring system recorded the comparator’s input voltage in real-time to track its operational state.
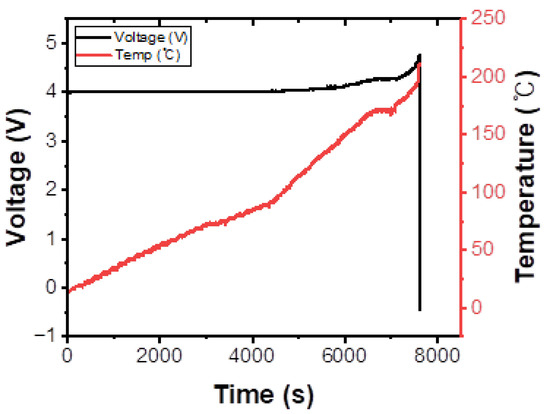
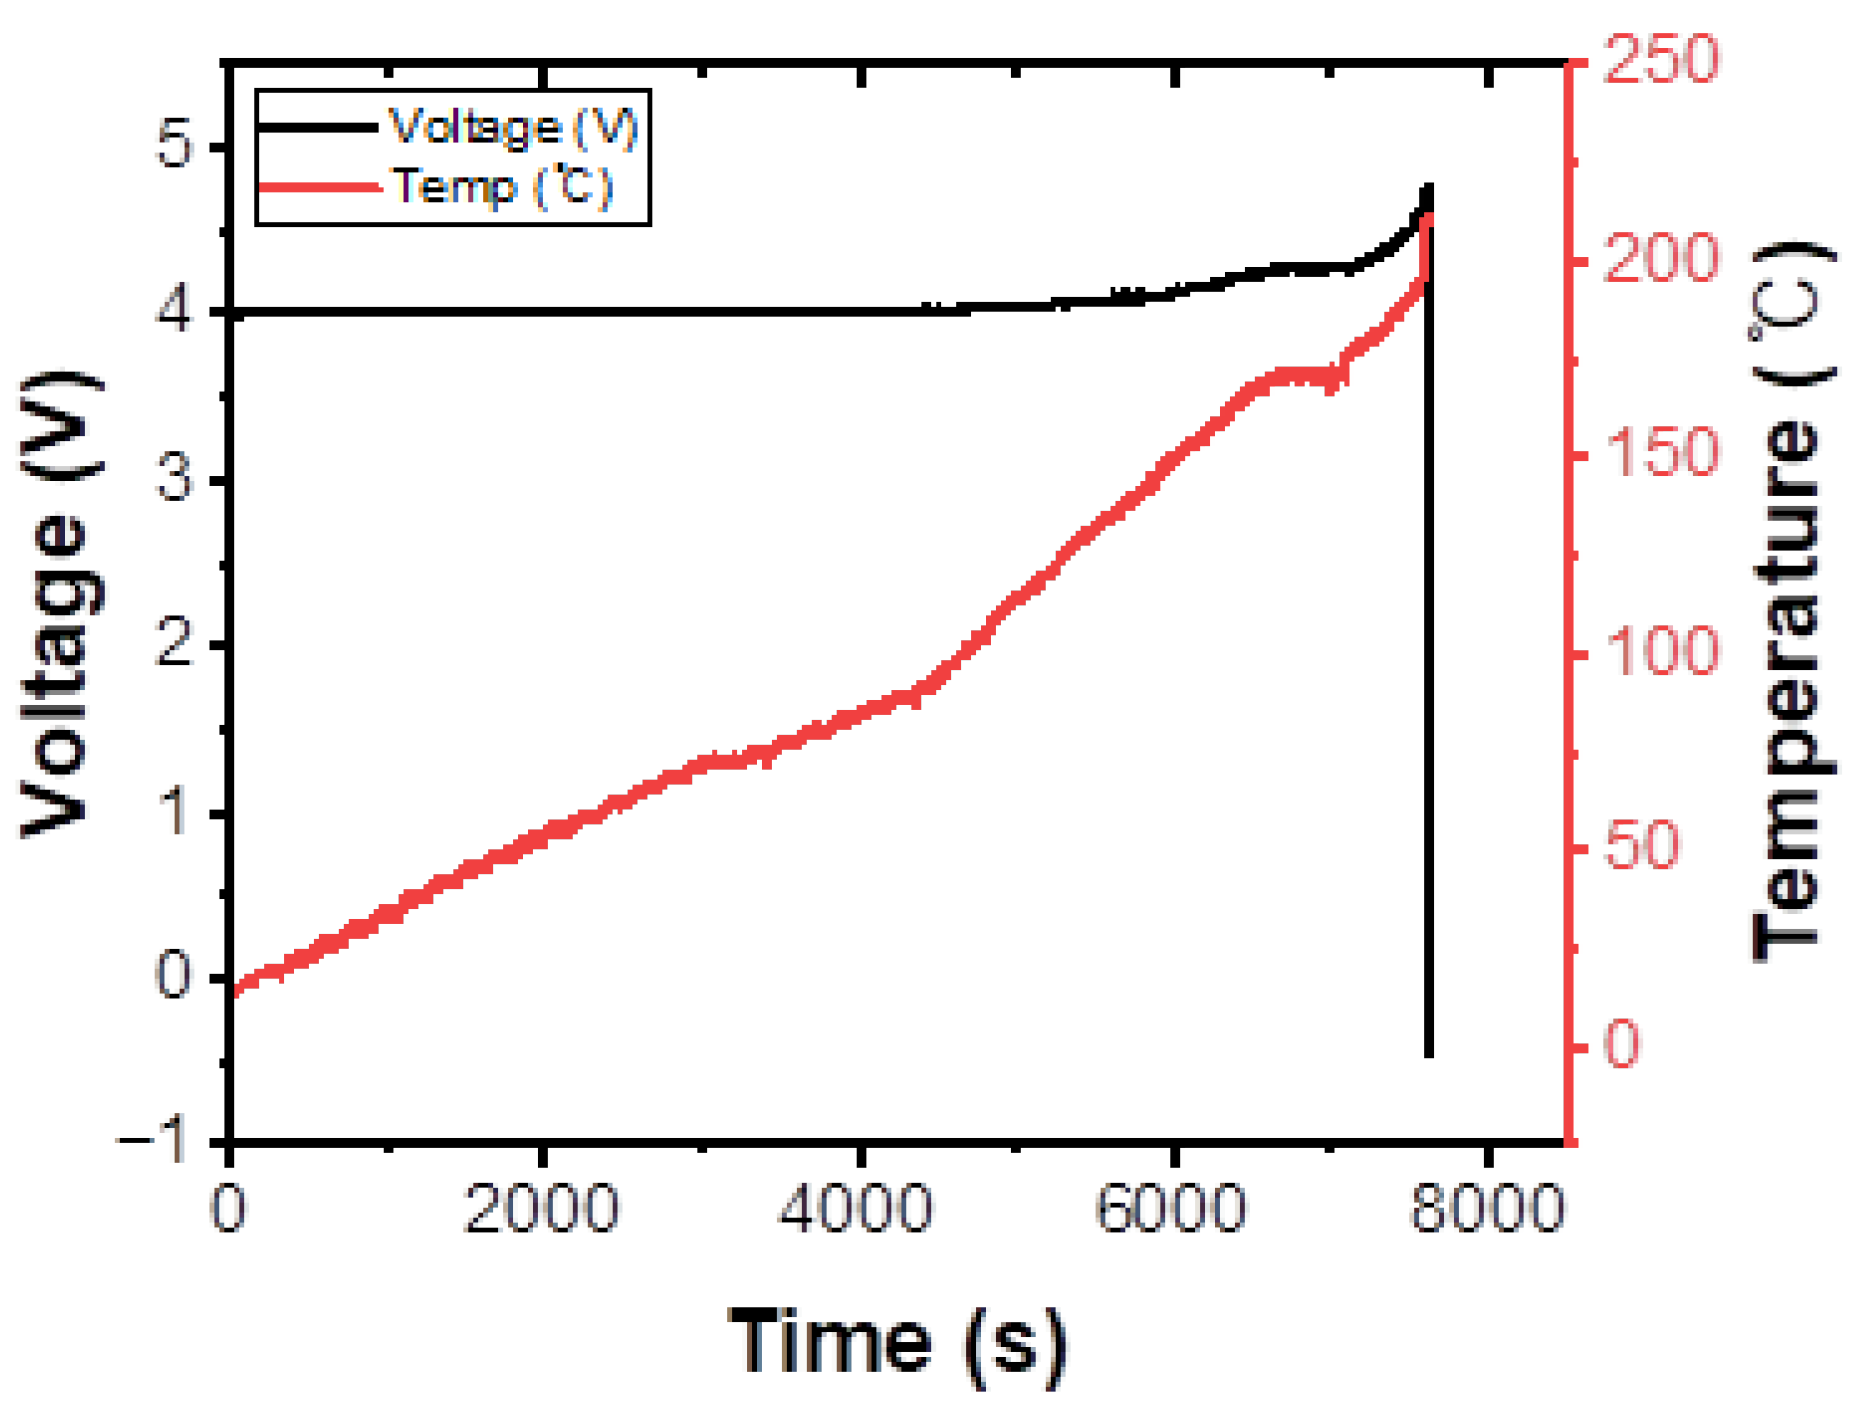
During the experiment, a reference voltage of 4 V was applied to the DUT, and the temperature was increased by 10 °C every three minutes. As the temperature rose, the comparator’s input voltage gradually increased, reaching approximately 4.7 V at around 212 °C. However, when the temperature exceeded 212 °C, the input voltage dropped sharply, indicating that the driver board had reached its thermal limit, resulting in functional failure. Figure 7 illustrates the correlation between input voltage and temperature of the driver board. While a clear trend of voltage increase is observable in the normal operating range, the sudden voltage collapse beyond the critical temperature signifies that the device can no longer maintain normal operation due to severe thermal degradation. This phenomenon suggests that as thermal stress accumulates, the electrical characteristics of internal components undergo irreversible physical changes, such as dielectric breakdown or material fatigue.
Figure 7.
Voltage-temperature matching graph.
Crucially, since the driver board plays a pivotal role in delivering precise signals to DUT, such performance degradation directly compromises the integrity of the semiconductor test process. Unstable voltage levels can distort test signals, leading to erroneous test judgments—such as false failures (yield loss) or the escape of defective products—thereby undermining the overall reliability of the manufacturing line. Consequently, relying solely on static voltage thresholds may be insufficient for safety. Therefore, the implementation of an early anomaly detection system is essential to predict such failures, preventing critical errors in test results and ensuring the long-term reliability and stability of the equipment.
In existing reliability evaluation studies, various empirical and physics-based RUL models have been used to estimate degradation rates and RUL under different stress factors such as voltage, current, vibration, mechanical stress, and temperature. Among these, the inverse power law (IPL) has been one of the most widely applied models across a broad range of components, including electronic devices, insulators, capacitors, bearings, and semiconductor elements. IPL typically treats voltage as the accelerating stress variable, describing the relationship between failure time and the applied stress level [11]. Equation (1) represents the characteristic life in the IPL model. In the context of the Weibull distribution, represents the scale parameter, indicating the time at which 63.2% of the population is expected to fail under a specific voltage stress . In this equation, K denotes the proportional constant determined by the material or device characteristics, and n represents the acceleration exponent that indicates the sensitivity of failure time to changes in stress. A larger value of n implies that the failure time is more sensitive to variations in voltage stress, reflecting a more pronounced non-linear reduction in characteristic life under high-stress conditions.
When the IPL model is expressed on a log–log scale, a linear relationship emerges between characteristic life and voltage stress. This linearity allows for the use of regression analysis to easily estimate the parameters and from ALT data. Consequently, the IPL has been widely and effectively used to analyze degradation mechanisms under high-voltage or high-temperature conditions and to predict derated RUL under actual usage environments. However, in this study, applying the conventional voltage-based IPL model is inherently limited. The measured voltage is not an independent stress factor maintained at a constant level, but rather a dependent variable that continuously responds to changes in temperature. In the case of driver board, degradation is primarily governed by temperature stress, while voltage changes are a secondary effect resulting from thermal conditions. In such a non-stationary thermal environment, the traditional IPL model based on voltage stress is not appropriate for quantifying degradation. In actual operating conditions, degradation progresses according to temperature-dependent mechanisms, and because temperature stress varies over time, a modeling approach that reflects the time-varying cumulative stress exposure is required.
Therefore, the conventional voltage-based IPL framework is extended into a temperature-stress-based degradation model. Specifically, the Arrhenius equation, which captures the temperature dependence of degradation rates, is used to compute the acceleration factor () at each time point . The cumulative degradation is then quantified through the CDT by summing -cumulated time increments . represents the thermal activation energy, which ranges from 0.5 to 0.7eV for failure mechanisms related to assembly defects. It was converted to 48.2–67.5 kJ/mol and used for the arrhenius-based CDT calculation. is Boltzmann’s constant, and denote the normal temperature and life test stress temperature, respectively, in kelvin (K).
In particular, to quantitatively analyze the degree of cumulative degradation, the concept of CDT was introduced, which is calculated based on the Arrhenius equation. The CDT is derived by accumulating the at each time point, taking into account the temperature conditions that vary over time. The represents how much faster the degradation process proceeds under stress conditions compared to normal usage conditions, and is expressed by Equation (2). This approach aligns with the purpose of ALT, which aims to simulate long-term degradation phenomena within a shorter period. To apply experimental results to real-world usage environments, considering the acceleration factor concept is essential. In other words, the CDT calculated using the Arrhenius model converts degradation data obtained under different temperature conditions onto a common time scale, allowing for comparison and analysis. Through this, anomaly detection can be performed more quantitatively and reliably.
The CDT is calculated in an integral form by using the for each temperature at each time point. The CDT over time is defined by the following equation. Given the acceleration factor during the time interval , the CDT is defined by Equation (3). In other words, by accumulating over the actual elapsed time under accelerated conditions, the CDT under normal conditions can be calculated. This allows for data obtained under different temperature conditions to be converted onto a common time scale, providing a unified time-based metric that reflects the relative differences in degradation rates. Because semiconductor devices often require several years or even decades to exhibit noticeable degradation or failure under normal operating conditions, it is impractical to rely solely on long-term field testing to evaluate their reliability.
Therefore, ALT was employed to predict long-term reliability and degradation behavior within a significantly shorter timeframe. ALT is a well-established experimental methodology that deliberately increases the levels of thermal, electrical, or mechanical stress applied to a device in order to expedite the aging process and induce failure mechanisms more rapidly [12].
Based on this ALT methodology, we applied the proposed CDT framework to the experimental data acquired in this study. The Arrhenius parameters were configured based on the physical characteristics of the failure mechanism, with an activation energy () of 48,200 J/mol and a gas constant () of 8.314 J/(mol·K). Specifically, in the calculation of the acceleration factor, the accelerated test condition of 180 °C (453.15 K) was applied as the stress temperature (), while the actual real-time temperature series acquired from the sensors was utilized as the operating temperature variable () to account for instantaneous thermal fluctuations.
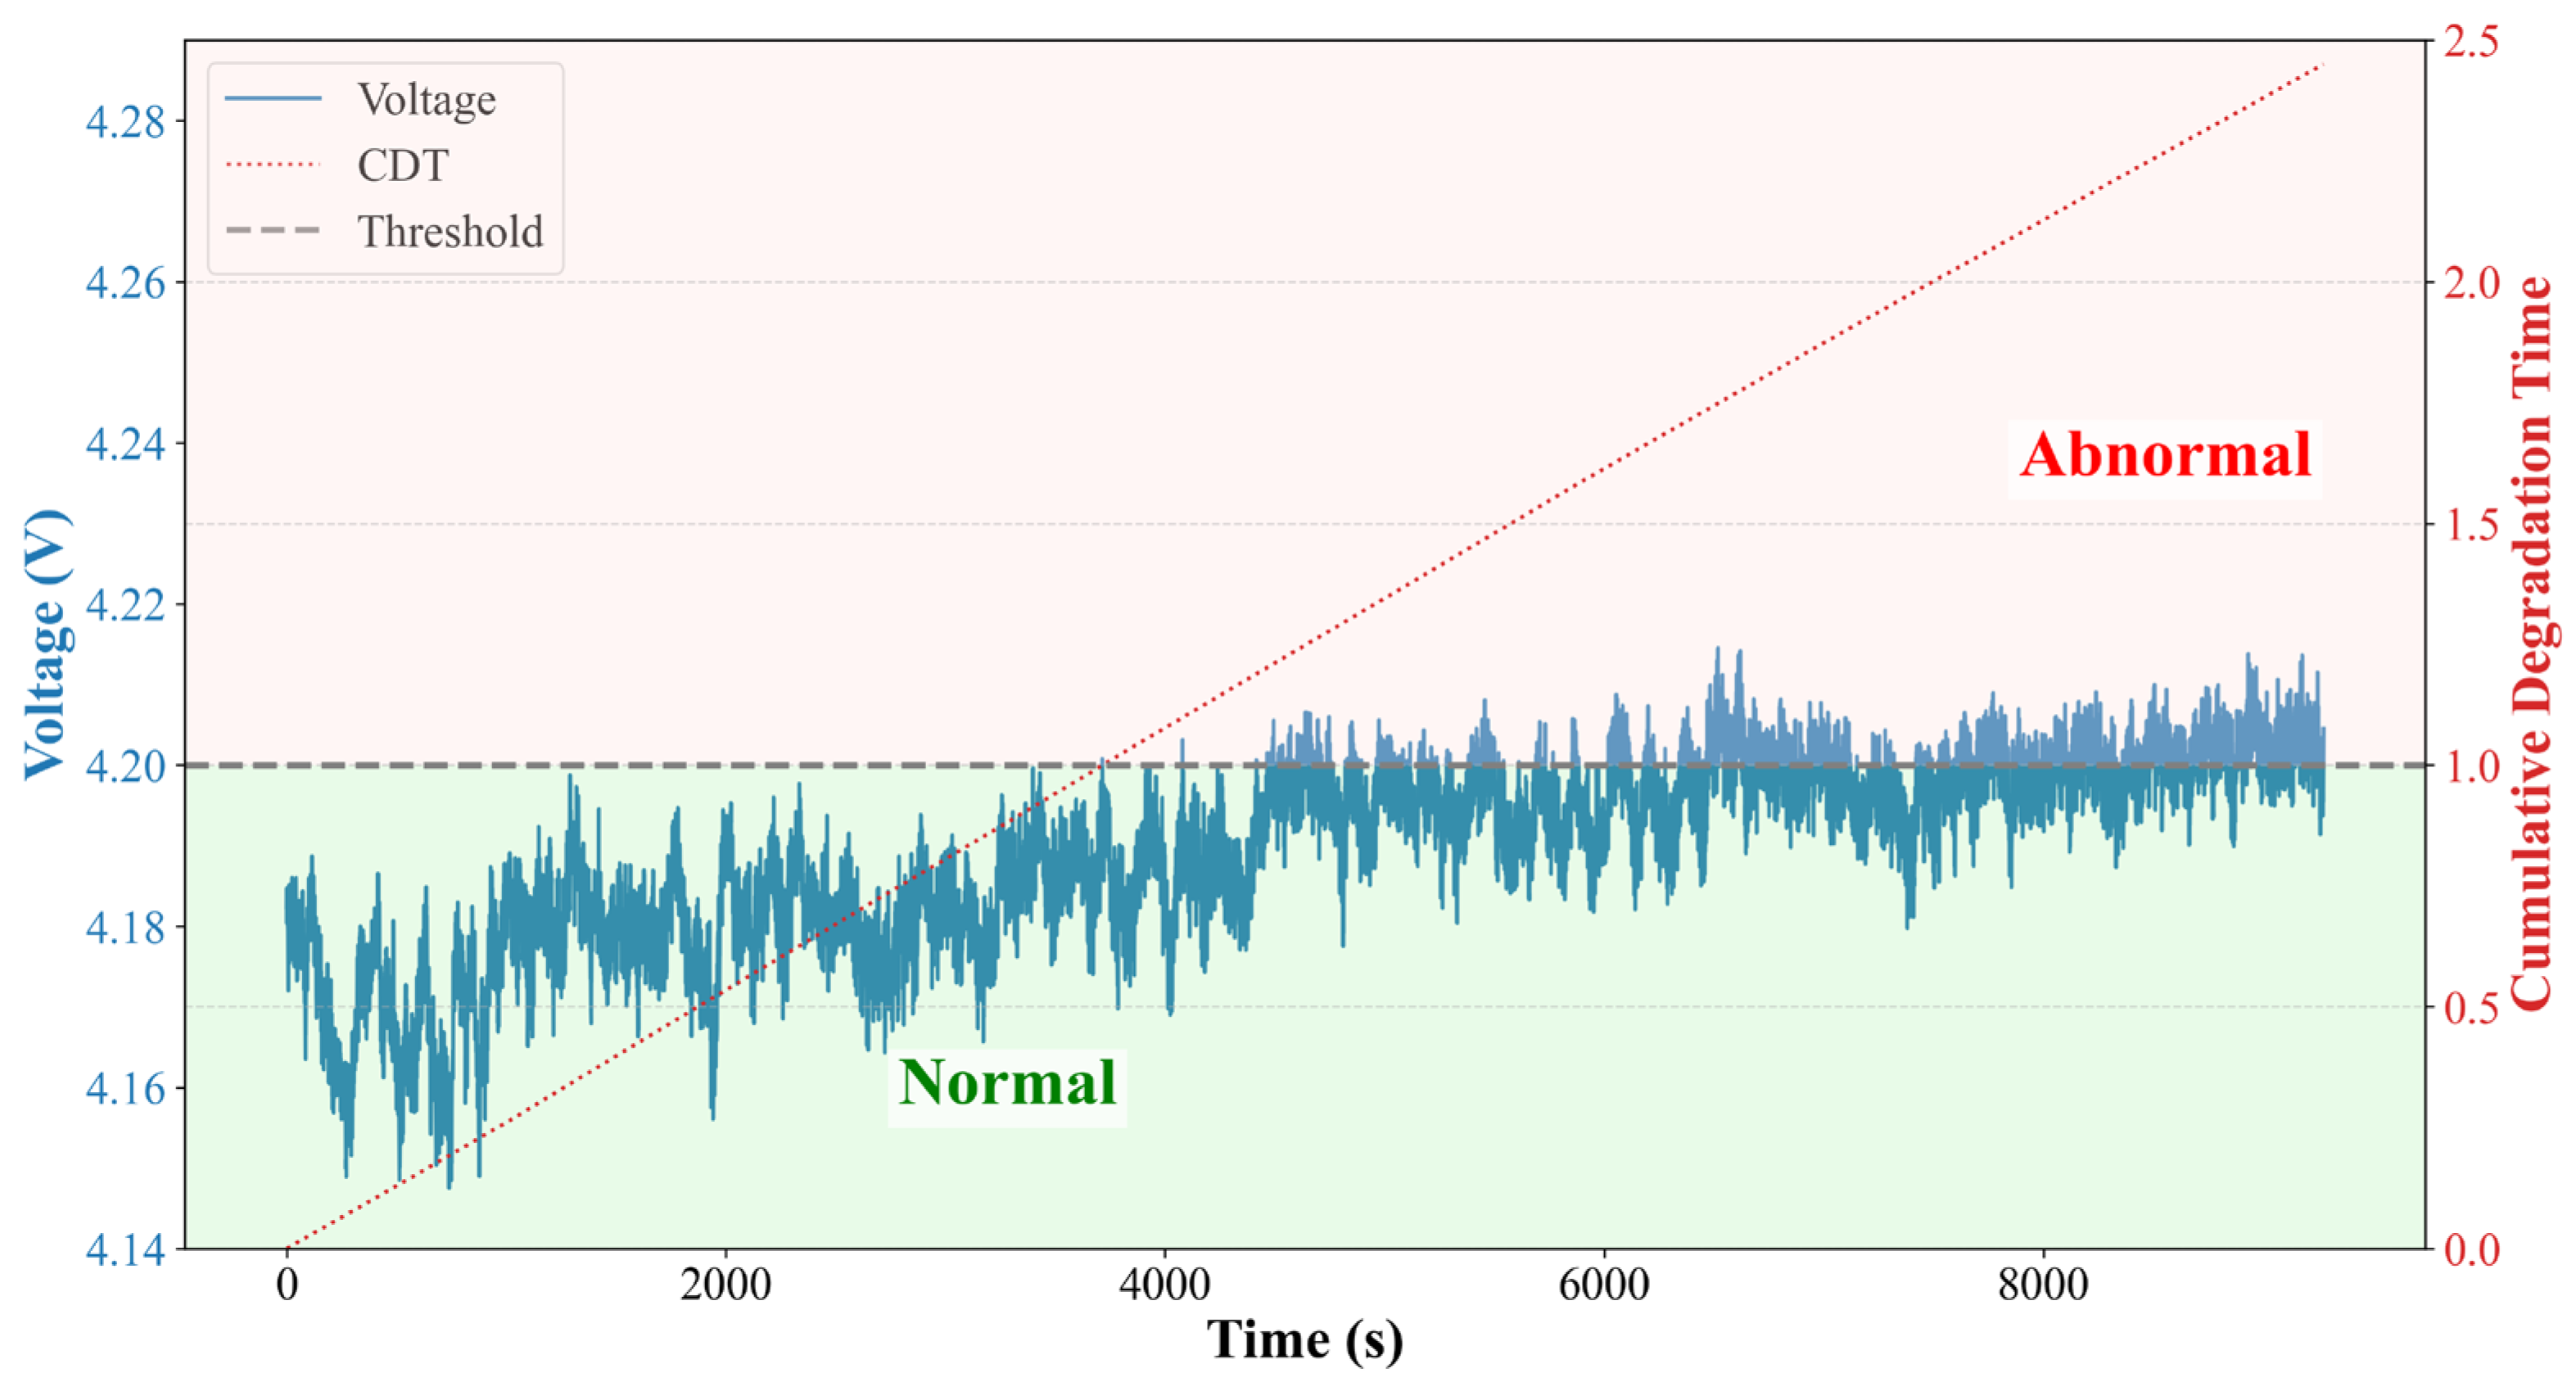
The experiments were conducted under two distinct thermal scenarios to validate the model. First, under the normal operating condition of 60 °C, steady-state data was collected for a duration of 10,355 s to verify baseline stability. Second, under the accelerated stress condition of 180 °C, degradation data was recorded for 9276 s, capturing the complete progression from a healthy state to functional failure. By correlating the electrical characteristics with the calculated CDT, we identified that the critical safety threshold of 4.2 V corresponds to a CDT value of 0.999597. This specific value serves as the definitive boundary for labeling the dataset in our anomaly detection framework.
This approach operates under the assumption that the same fundamental failure mechanisms active under normal conditions are also triggered at elevated stress levels, but occur at an accelerated rate. By carefully controlling the stress factors—such as temperature, voltage, or current—and monitoring the resulting degradation responses, it becomes possible to extrapolate the device’s RUL and reliability characteristics back to standard use conditions.
The accelerated environment test was conducted at a constant temperature of 180 °C, while the normal environment test collected data at 60 °C under normal conditions. The 180 °C experimental data is used as the training dataset to represent the actual cumulative degradation progress. Table 1 contains these 180 °C ALT data along with the CDT values calculated at each time point, including the critical CDT at 4.2 V, which serves as the degradation reference level in this study. Since this data shows a certain rate of voltage change and degradation accumulates over time, the CDT at each time point is calculated using Equation (3). Incorporating CDT as an input variable allows for the artificial intelligence (AI)-based classification model to learn the underlying patterns and dynamics of degradation progression over the time course more accurately. Similarly, the 60 °C normal environment data was processed by converting it into CDT using the same methodology and subsequently used as additional training data. Table 2 presents the CDT-converted normal-condition data at 60 °C, along with the assigned labels. This labeling allows for the CDT-normalized dataset to be used directly for supervised learning in AI-based classification.
Table 1.
Degradation measurement data under accelerated environment condition at 180 °C.
Table 2.
Degradation measurement data under normal operating condition at 60 °C.
Although degradation under normal conditions is generally minimal or slow, the transformation into CDT normalizes these data, making them directly comparable to the accelerated environment data. This normalization enables the CDT values for normal data to increase progressively over time, reflecting subtle degradation effects. The CDT value at the point where the voltage reaches 4.2 V, corresponding to the 5% outlier threshold, is defined as the reference criterion for detecting abnormal behavior. When the CDT value obtained under normal operating conditions exceeds this reference value of 0.999597, as determined from accelerated environment experiments, the device state is classified as abnormal or indicative of advanced degradation.
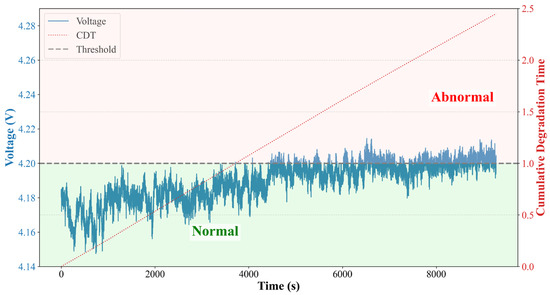
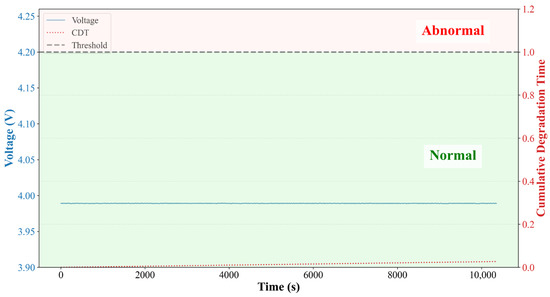
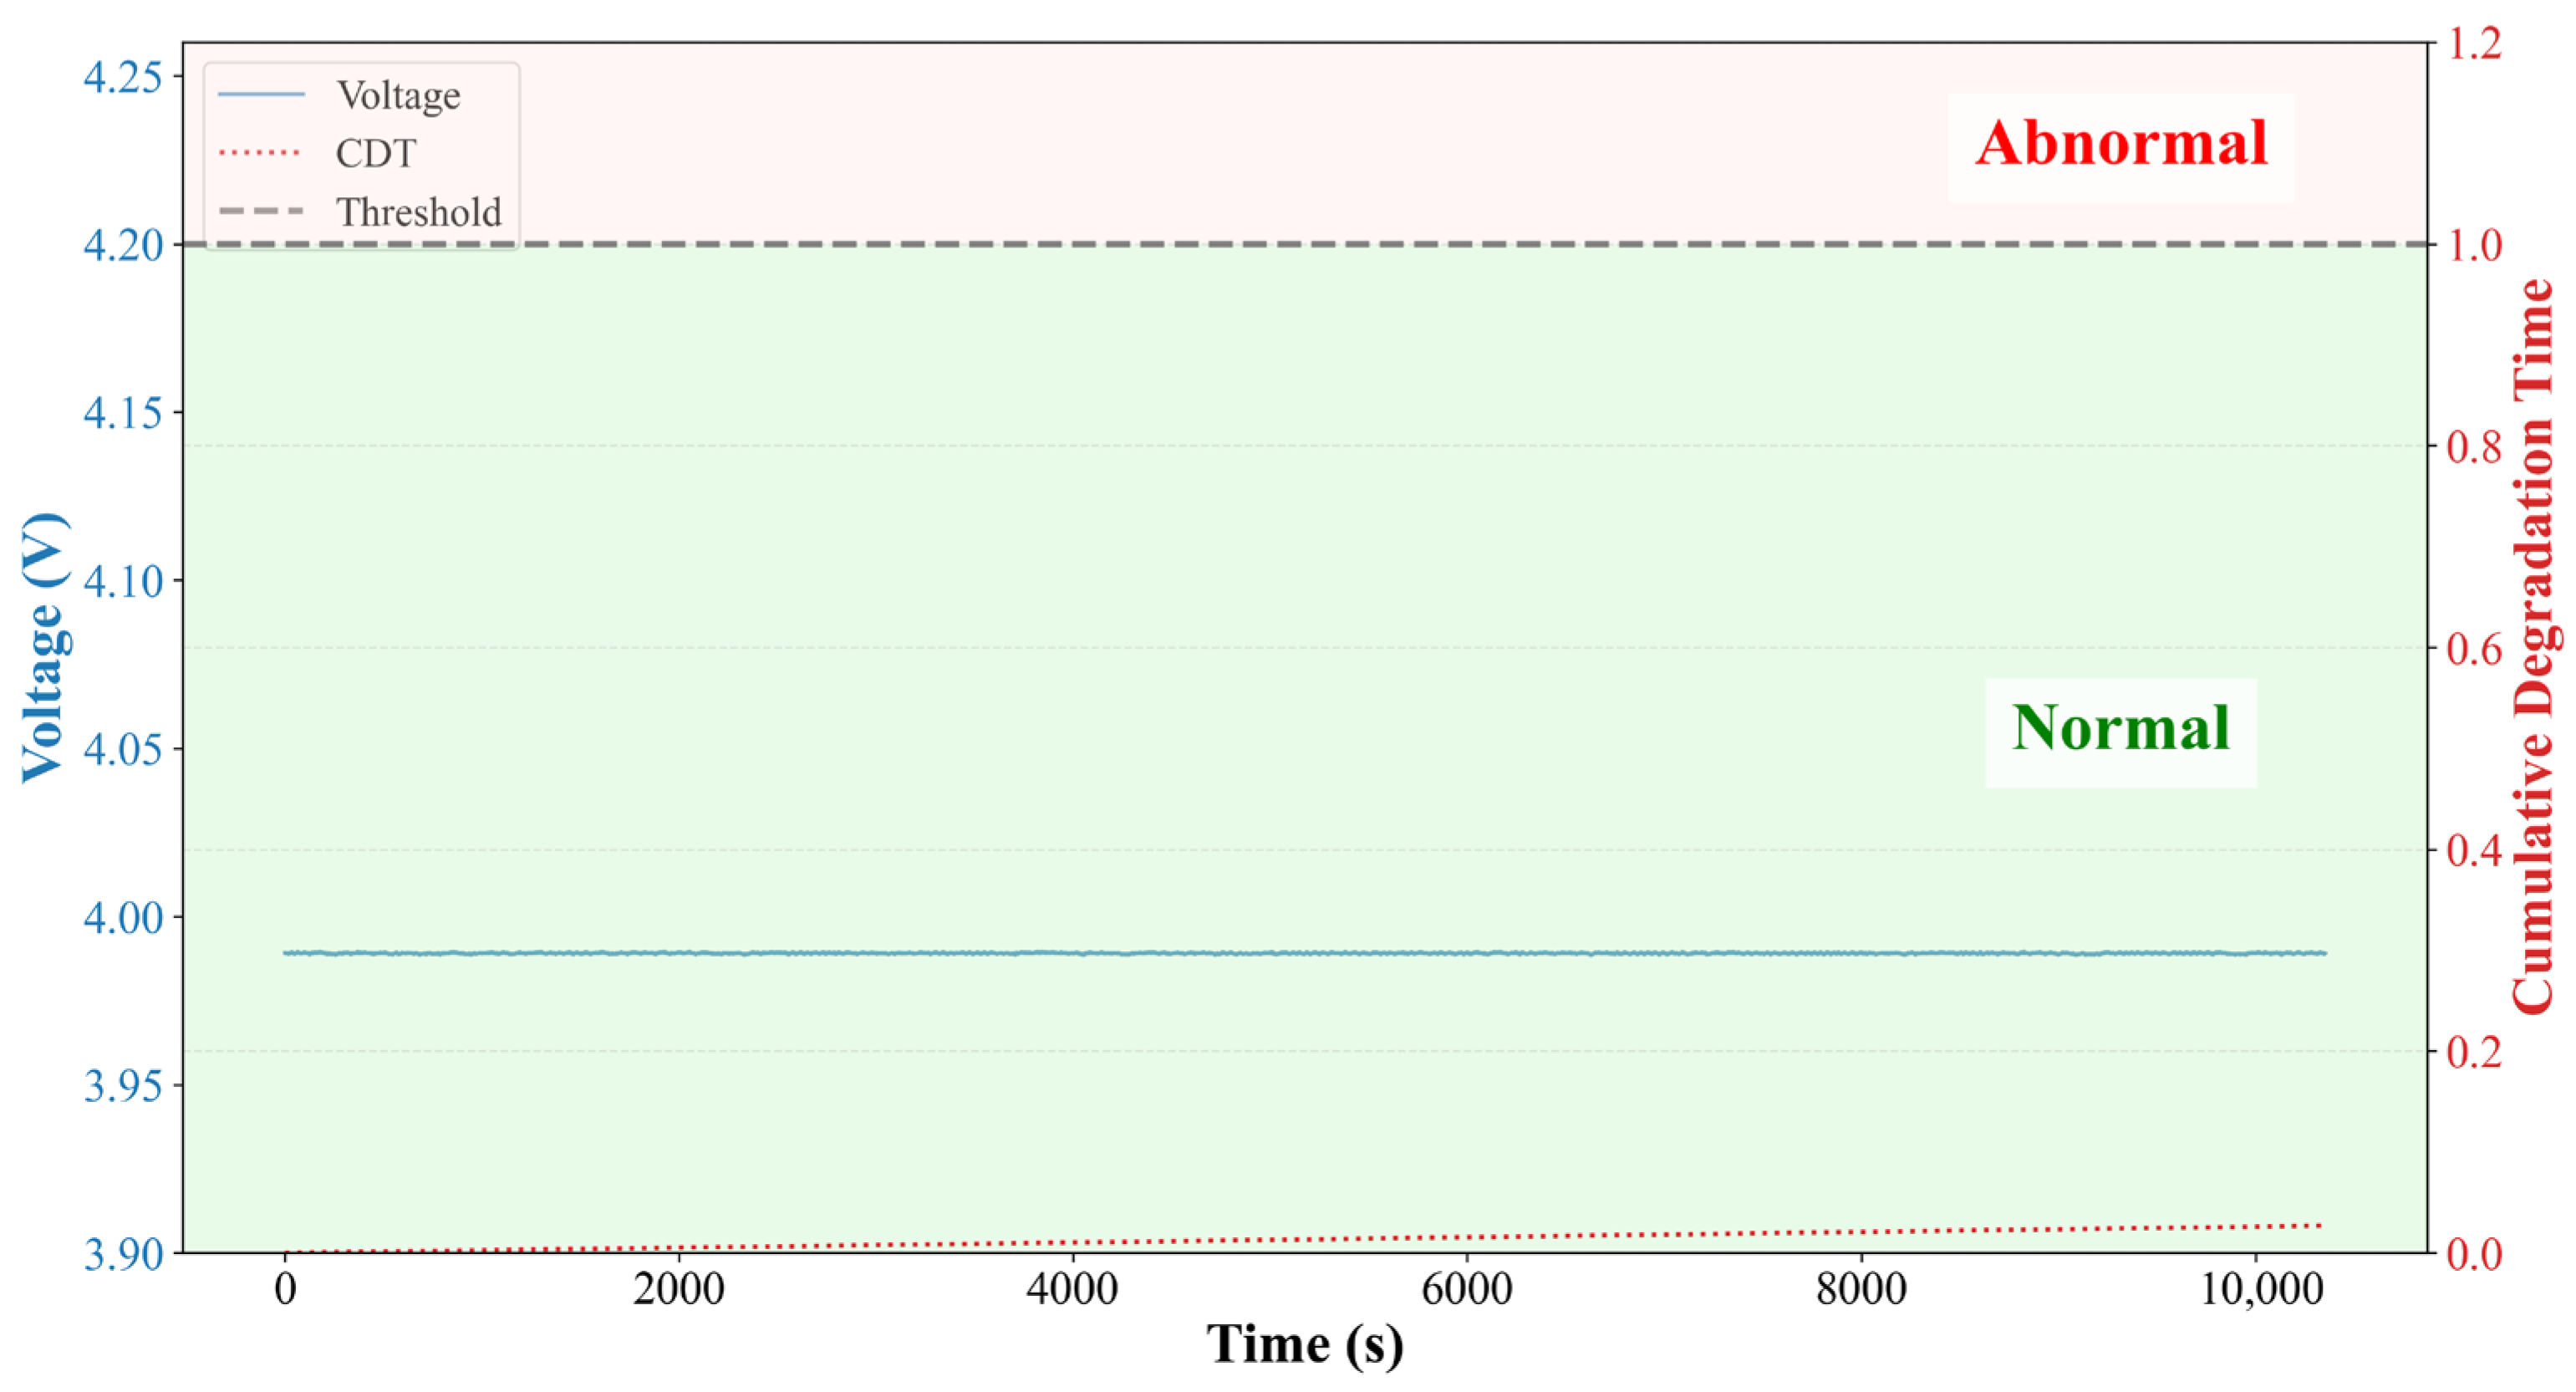
The dataset constructed for this study integrates experimental data acquired from two distinct thermal environments to ensure a comprehensive representation of both healthy and degrading states. Specifically, we combined long-term monitoring data obtained under normal operating conditions at 60 °C with degradation data from ALT performed at 180 °C. This integration resulted in a total dataset size of 19,633 samples. The characteristics of these two data sources are visually distinguished in Figure 8 and Figure 9. Figure 9 illustrates the data collected under the normal operating condition of 60 °C, demonstrating a stable steady-state response with negligible degradation over time. In contrast, Figure 8 depicts the degradation trajectory observed under the 180 °C accelerated stress condition, capturing the critical transition from normal operation to functional failure due to thermal stress accumulation.
Figure 8.
Voltage and CDT data obtained from ALT at 180 °C.
Figure 9.
Voltage and CDT data under normal operating environment at 60 °C.
To construct the input vector for the anomaly detection model, three specific variables were selected: time, voltage, temperature, and CDT. These variables were collectively utilized as input features to enable the model to capture time-dependent degradation patterns alongside physical parameter changes. The target variable was defined as a binary label to facilitate supervised learning. Based on the electrical characteristics of the driver IC, the critical threshold was established at the point where the voltage reaches 4.2 V, which corresponds to a CDT value of 0.999597. Accordingly, data points below this reference value were categorized as the normal class 0, whereas those exceeding it were assigned to the abnormal class 1.
For a rigorous evaluation of the model’s generalization performance, the constructed dataset was partitioned into training and testing sets using a stratified random split method with an 80:20 ratio. To guarantee the reproducibility of the experiment, the random seed was fixed at 42. As a result, 15,706 samples were allocated for training, and 3927 samples were isolated for the final testing phase. Finally, to mitigate numerical instability and bias caused by the differing scales of the input features, all input variables were normalized using a standard scaler, transforming them to have a mean of 0 and a variance of 1 prior to being fed into the model.
Consequently, this study successfully integrated datasets obtained under different temperature conditions by converting all measurements into CDT based on the Arrhenius model. This approach enabled the construction of a unified dataset with consistent and comparable degradation representation along a common time axis. The CDT-based approach not only enhances the interpretability of degradation trends but also serves as a crucial input feature for training and validating AI classification models, empowering these models to effectively discriminate and quantify various degrees of degradation in a reliable manner.
4. Anomaly Detection Models
Based on the voltage–temperature data obtained from the driver board of a semiconductor test system, an AI model was applied to perform anomaly detection of the equipment. Anomaly detection models are highly effective in learning patterns from complex time-series data, enabling the distinction between normal and abnormal states as well as the prediction of future conditions. In particular, since the experimentally acquired voltage–temperature correlation data exhibit gradual changes over time, the degradation trend can be quantitatively predicted using the concept of CDT. By comparing and analyzing various models, the study aims to evaluate anomaly detection performance and prediction accuracy according to voltage–temperature variations and to identify the most suitable model for anomaly detection model applications.
As summarized in Table 3, this study employs a diverse set of machine learning algorithms to ensure a rigorous and comprehensive evaluation of the proposed CDT-based framework. These algorithms range from fundamental linear models such as logistic regression and instance-based learning represented by K-NN, to sophisticated margin-based techniques like SVM and ensemble methods including random forest and XGBoost. By applying these distinct methodologies, which represent different inductive biases, to the same preprocessed voltage–temperature dataset, we aim to verify the versatility and robustness of the CDT feature in capturing cumulative degradation trends regardless of the algorithmic approach.
Table 3.
Summary of anomaly detection models.
In terms of model implementation, the hyperparameters for each algorithm were carefully optimized to prevent overfitting and ensure generalization capability on unseen data. Specifically, tree-based models such as decision tree and random forest were configured with pruning constraints by setting the maximum depth to 7 and the minimum samples per leaf to 20, thereby preventing the memorization of noise. The random forest model further enhanced diversity by utilizing 200 estimators and limiting the maximum features for each split to 50%. In the case of SVM, a radial basis function (RBF) kernel was employed to handle non-linear decision boundaries, with the regularization parameter C set to 0.5 to balance margin maximization and classification error. Logistic regression was configured with a strong regularization parameter C of 0.1 to filter out minor fluctuations. For instance-based learning, the K-NN was set to consider the 5 nearest neighbors, focusing on local data density. Finally, XGBoost was optimized for stability using 200 estimators with a controlled learning rate of 0.05, while employing subsampling ratios of 0.7 for data instances and 0.5 for columns, alongside L1 and L2 regularization terms. The subsequent section presents a detailed quantitative comparison of these models. Their performance is evaluated using key metrics such as accuracy, precision, recall, and F1-score, alongside confusion matrices, to definitively identify the most optimal solution for real-time anomaly detection and practical industrial implementation.
5. Model Results
The performance of the anomaly detection model, which diagnoses the state of the driver board using temperature and voltage data, was evaluated based on four key metrics: Accuracy, Precision, Recall, and F1-score. These metrics were derived from the confusion matrix and calculated according to Equations (4) and (5) [18,19]. In this context, true positive (TP) refers to correctly predicted positive cases, true negative (TN) to correctly predicted negative cases, false positive (FP) to incorrectly predicted positives, and false negative (FN) to incorrectly predicted negatives. Precision (P) represents the ratio of correctly classified samples within a predicted class, while recall (R) indicates the ratio of correctly classified samples within the actual class.
Based on the quantitative evaluation results summarized in Table 4, all evaluated models demonstrated exceptional classification performance, consistently achieving accuracy and F1-scores exceeding 0.9. Despite this overall high baseline, the decision tree and random forest models exhibited the highest performance metrics. Consequently, these two models were selected for further analysis due to their superior accuracy, robustness, and stability compared to the other algorithms.
Table 4.
Evaluation results of anomaly detection models.
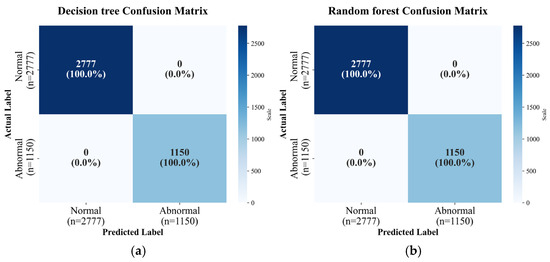
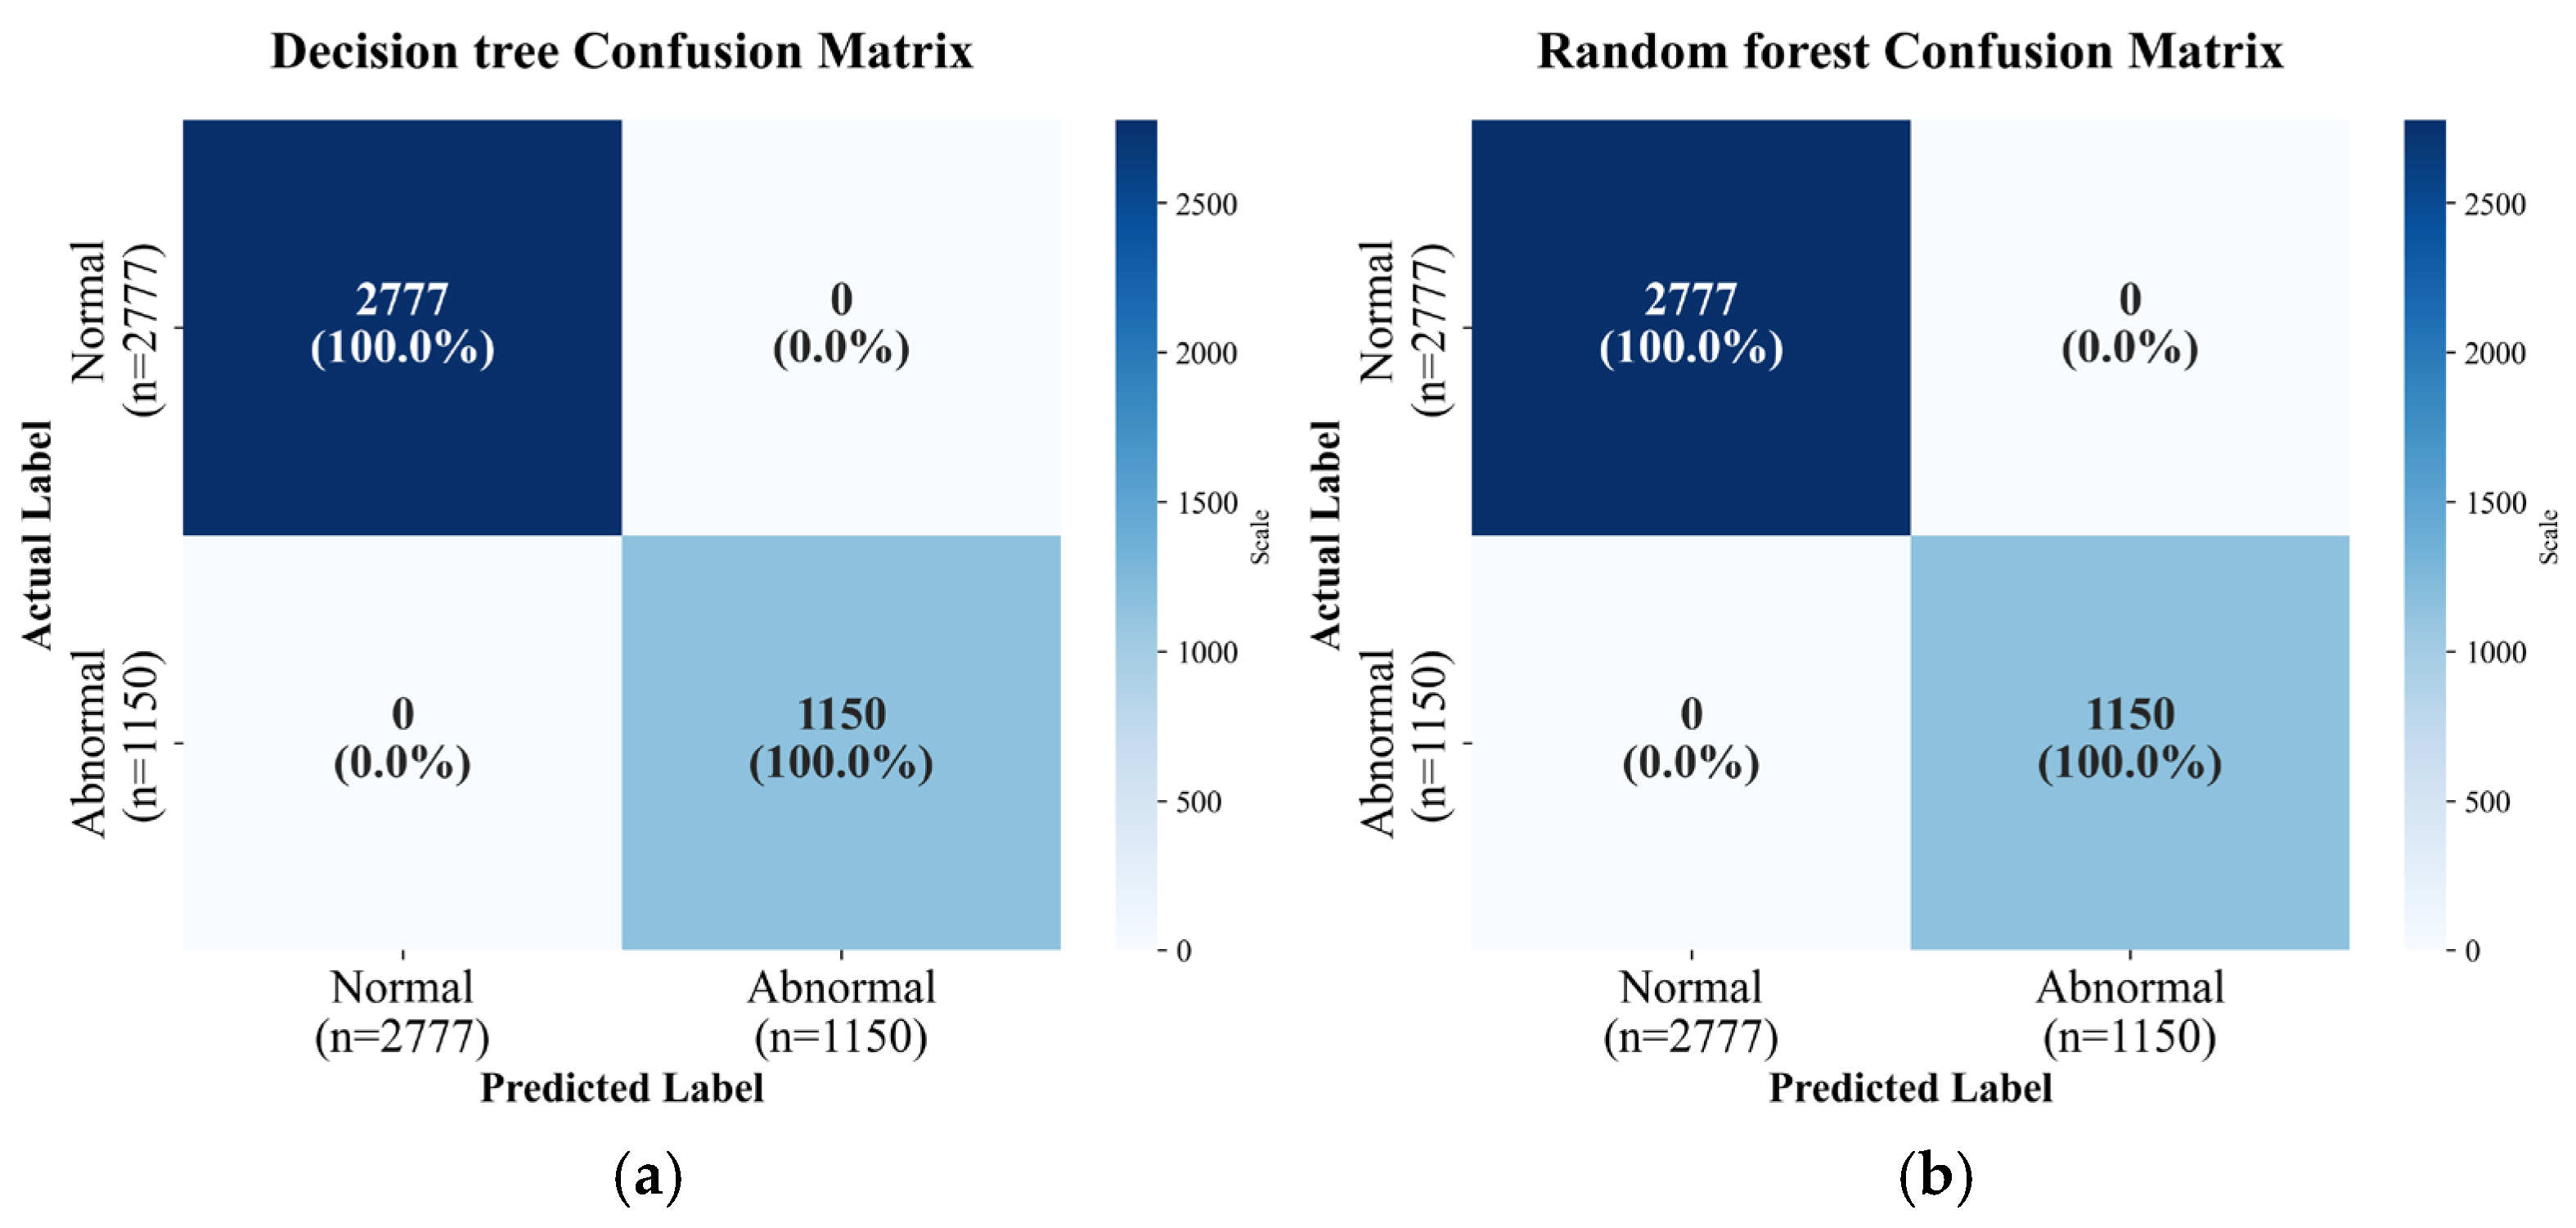
As shown in Figure 10, when the CDT metric was incorporated into the learning process, the model showed a significant improvement in anomaly detection reliability compared to temperature- and voltage-based classification alone. This improvement stems from the model’s ability to utilize long-term degradation trends rather than relying solely on instantaneous data. Consequently, the proposed approach enables early warning of potential failures before anomalies occur, which is particularly beneficial from a CBM perspective. Beyond enhancing detection reliability, the integration of CDT standardizes varying operational stress levels into a unified quantitative index, thereby ensuring robustness against transient sensor noise and environmental fluctuations. Furthermore, this approach offers physically interpretable insights into the equipment’s health status, facilitating more intuitive and data-driven maintenance decision-making.
Figure 10.
Confusion matrices of anomaly detection evaluated on a test set of 3927 samples: (a) Decision tree; (b) Random Forest.
Both the decision tree and random forest models achieved a perfect classification accuracy of 1.000, with no false positives or false negatives observed across all test samples. This flawless separation suggests that the CDT feature serves as a highly discriminative indicator, effectively establishing a clear decision boundary between the normal and degraded states within the controlled experimental environment. The perfect performance of these models should be interpreted as a validation of the proposed feature engineering methodology rather than merely algorithmic superiority. By standardizing varying thermal stress conditions into a unified quantitative index, the CDT minimized the ambiguity often found in raw sensor data. Consequently, these results provide a baseline, demonstrating that if the cumulative stress is accurately quantified, AI models can diagnose equipment health with near-certainty. This establishes a reliable foundation for deploying these models in real-world semiconductor manufacturing, where they can offer physically interpretable insights for precise decision-making.
In this study, we conducted a validation of generalization capability to verify whether the trained models maintain stable performance in unseen environments based on physical degradation characteristics. To this end, a new test dataset was constructed using ALT data at 170 °C, a thermal condition not included in the training phase. The dataset consists of data from the baseline temperature of 60 °C and the unseen condition of 170 °C. The experiments were conducted for 8870 s at 60 °C and 18,231 s at 170 °C, resulting in a total of 27,101 samples used to evaluate model reproducibility.
Table 5 presents the performance evaluation results for each model on the new 170 °C test set. While most models demonstrated a satisfactory level of generalization capability, Logistic Regression and XGBoost distinguished themselves by achieving the highest performance, with an accuracy exceeding 85% and superior F1-scores. This proves that performance degradation was minimized despite the environmental changes. These results indicate that, rather than merely memorizing the data distribution of specific temperatures, these top-performing models effectively learned the physical trend of voltage elevation correlated with accumulated thermal stress. Consequently, they successfully identified degradation patterns even in the unseen domain, confirming their robustness against thermal variations.
Table 5.
Evaluation results of anomaly detection models with the new dataset.
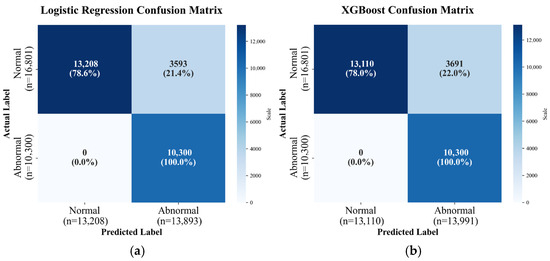
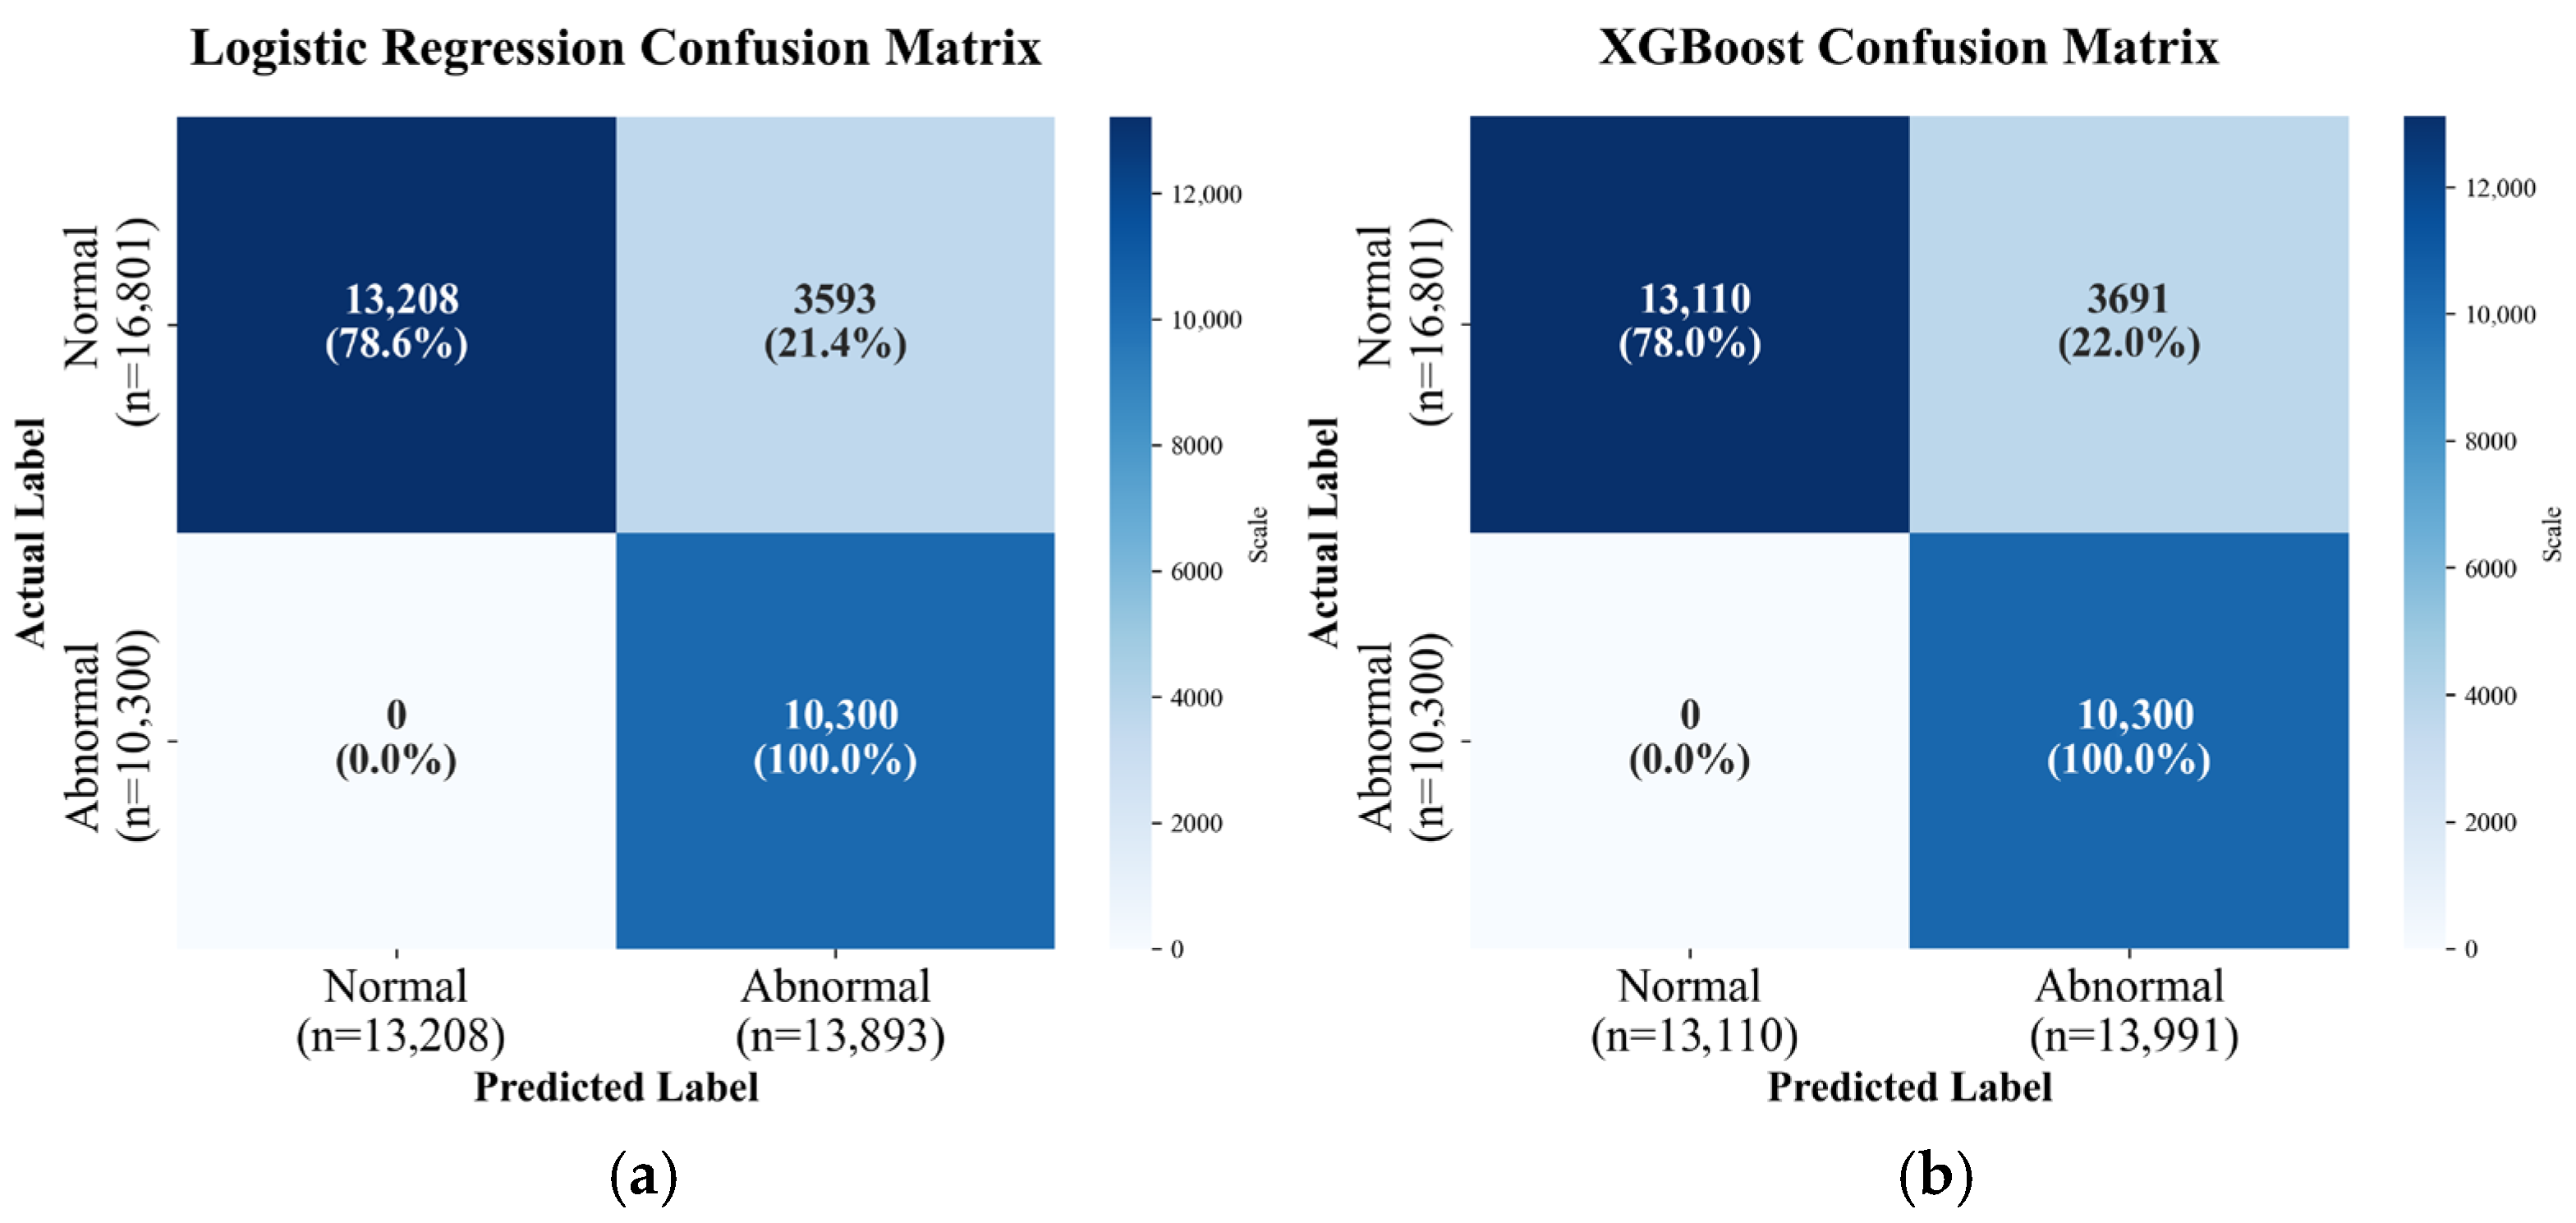
Figure 11 presents the confusion matrices of logistic regression and XGBoost, which demonstrated the most superior performance on the new dataset. In semiconductor manufacturing, although FP causing yield loss are undesirable, FN resulting in the shipment of defective products are considered far more critical due to the potential for severe reliability failures. Therefore, preventing FN is enforced with much stricter standards than minimizing FP in quality control protocols. The evaluation was conducted on the entire dataset comprising 27,101 samples. Both models achieved a detection result with absolutely zero FN across the total samples, prioritizing the elimination of test escapes even though it resulted in the occurrence of FP. This confirms that the models successfully applied strict classification criteria to filter out every defective device, even under the unseen high-temperature condition. Consequently, this implies that the proposed methodology meets the stringent quality assurance standards required for mass production and can serve as a robust safeguard to effectively eliminate quality risks.
Figure 11.
Confusion matrices of anomaly detection evaluated on the new test set of 27,101 samples: (a) Logistic regression; (b) XGBoost.
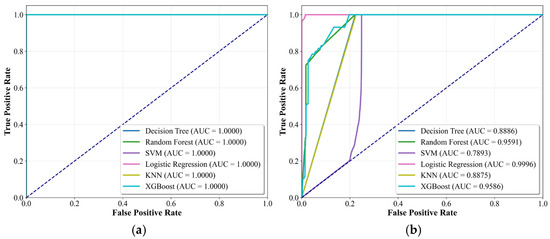
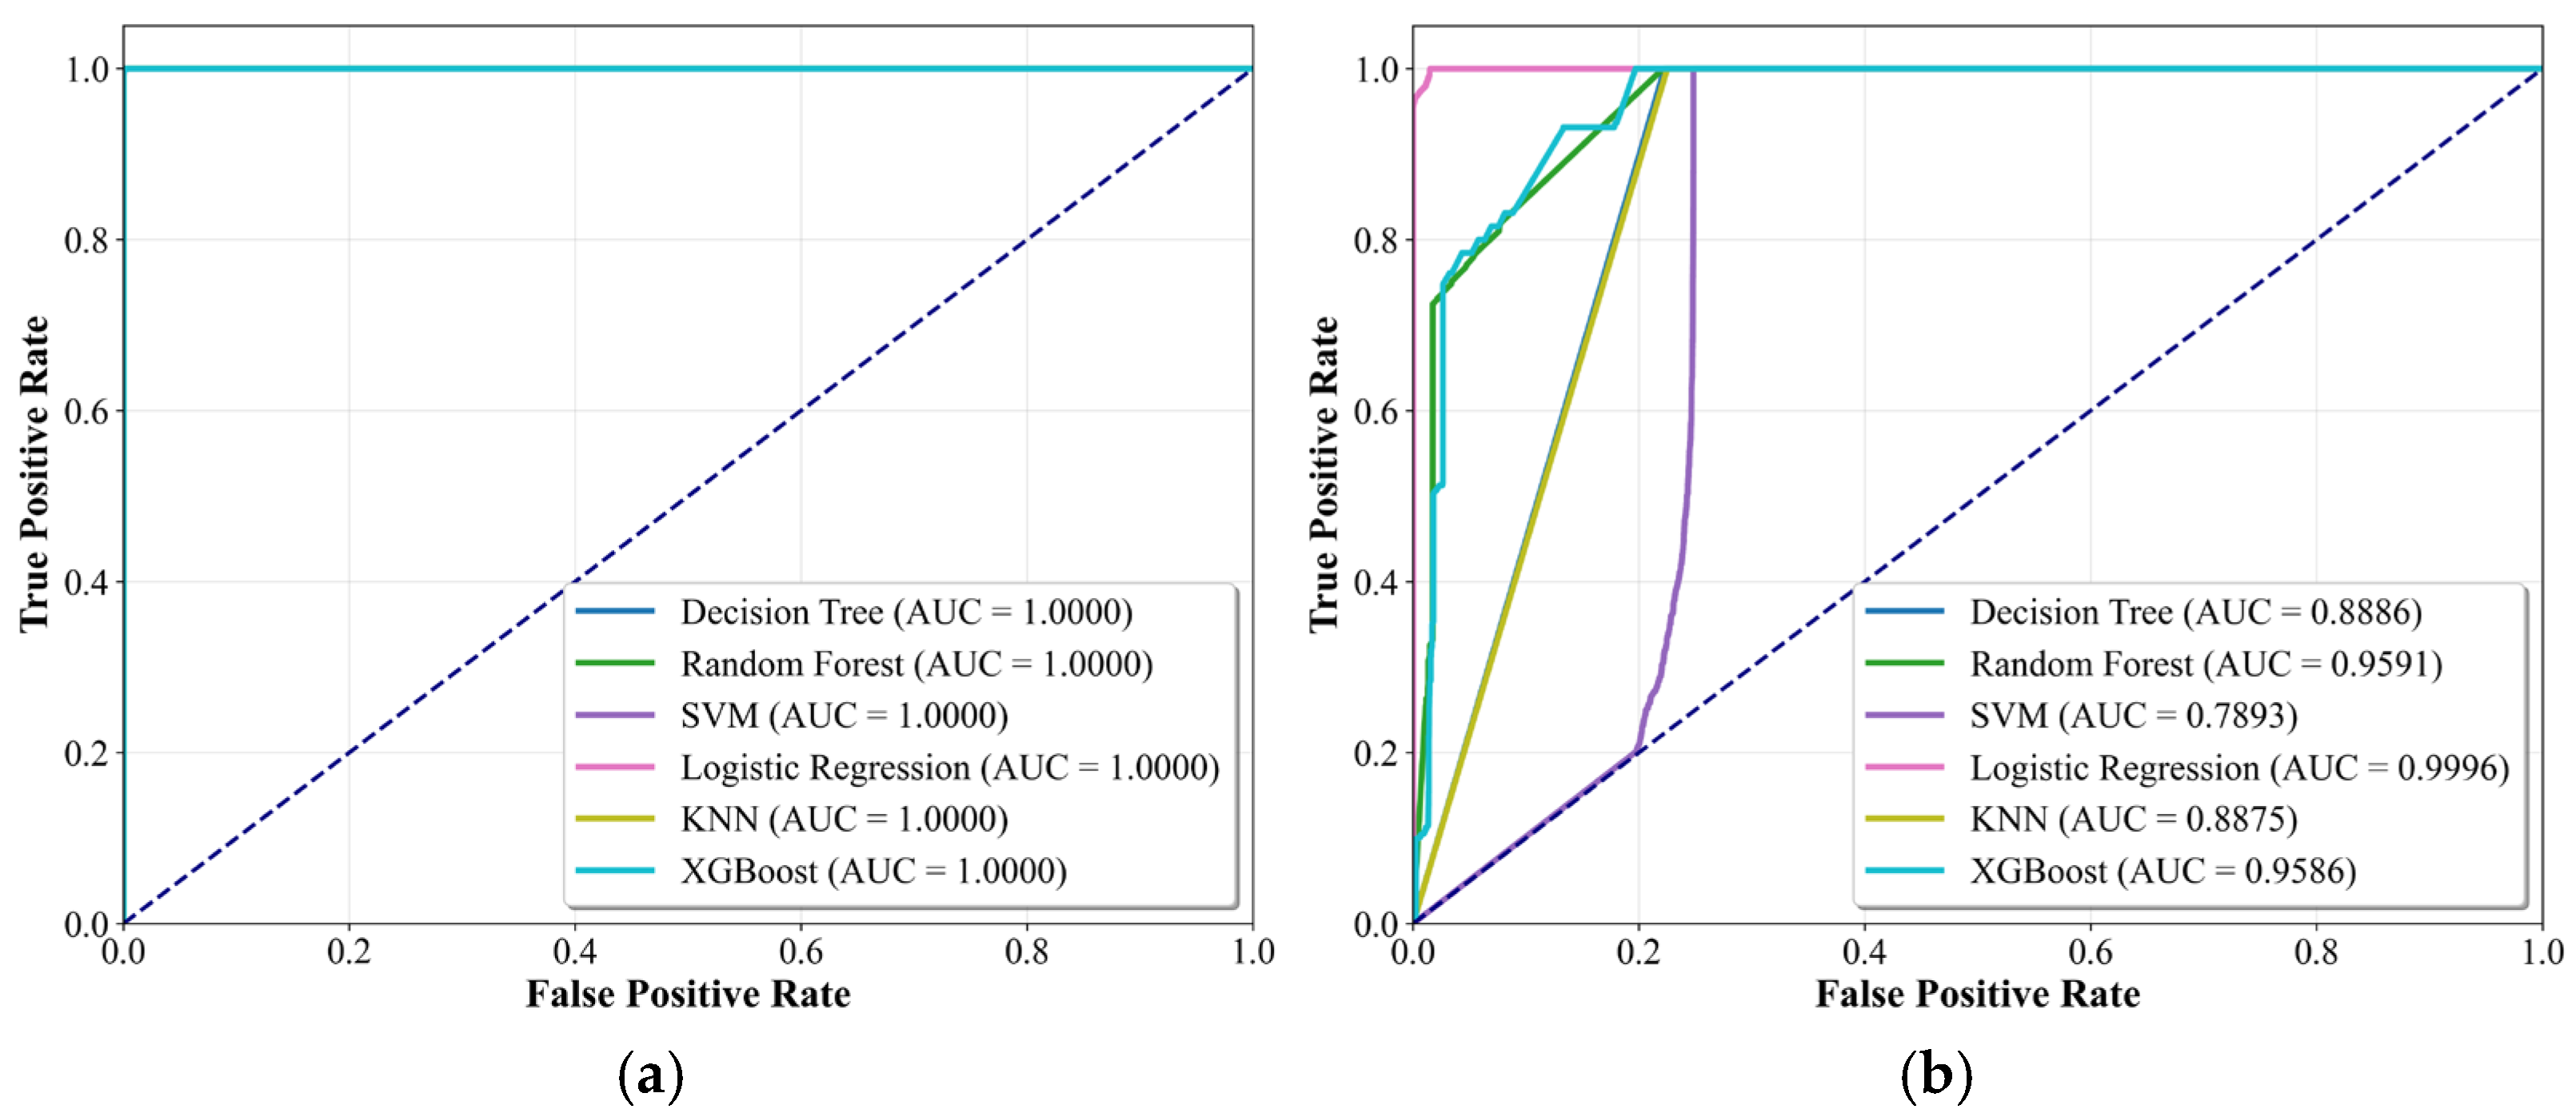
Figure 12 presents a comparative analysis of ROC curves derived from the initial validation within the training domain and the cross-domain validation performed in the unseen new dataset environment. As clearly illustrated, logistic regression and XGBoost maintained exceptional performance with AUC scores exceeding 0.95, exhibiting an ideal ‘top-left’ trajectory comparable to the initial test set (AUC = 1.000). In contrast, distance-based models such as SVM and KNN showed a significant decline in detection capability under the new environmental conditions. This divergence in performance stems from the fundamental differences in learning mechanisms. While distance-based models struggled to adapt to subtle distribution shifts due to their tendency to overfit rigid decision boundaries formed during training, tree-based and regression models successfully generalized to the new dataset environment by capturing the underlying physical trends rather than relying solely on spatial distances.
Figure 12.
Comparison of ROC curves for validating model generalization and robustness: (a) initial dataset; (b) new dataset.
Consequently, the experimental results confirm that the four models (decision tree, random forest, logistic regression and XGBoost) consistently maintained high accuracy and reproducibility across both the existing training domain and the new dataset validation. This validates that the proposed methodology offers a robust anomaly detection solution capable of ensuring reliability across a wide range of operational environments, independent of specific thermal conditions. The integration of CDT enables the model to identify early signs of anomalies as the value approaches a critical threshold. The consistently high accuracy and F1-scores observed across all models, even in the unseen thermal domain, can be attributed to the controlled experimental environment, data consistency, and the efficacy of CDT as a physically meaningful temporal indicator. These results demonstrate that the proposed framework is robust enough to be stably applied to real equipment environments. Furthermore, it possesses the potential to be extended to multi-stress conditions—such as temperature, vibration, humidity, thermal cycling, and current ripple—in future studies.
Ultimately, this study establishes an anomaly detection system that translates complex thermal stress data into an intuitive health index. In practical applications, the system continuously monitors the cumulative degradation status of ATE driver boards in real-time. By triggering alerts before the CDT surpasses the safety margin, it allows for maintenance personnel to preemptively replace components or adjust operational parameters. This capability facilitates a paradigm shift from reactive troubleshooting to proactive management, ensuring uninterrupted semiconductor production and validating the framework as an essential component of smart manufacturing infrastructures.
6. Conclusions
The method proposed in this study was designed to effectively reflect the degradation characteristics of equipment under high-temperature conditions, introducing a new predictive framework based on the concept of CDT. This approach aims to evaluate the long-term reliability of ATE driver boards and to detect performance degradation caused by thermal stress at an early stage. In particular, the proposed method extends beyond simple temperature–time correlation analysis, enabling quantitative evaluation of degradation progression using data obtained from ALT. The anomaly detection method using CDT accumulates equivalent degradation time for each temperature condition by considering the over each time interval . This process allows for the experimental data obtained under different temperature conditions to be converted into a unified time-based scale, quantitatively representing the cumulative degradation level relative to real elapsed time. Rather than determining anomalies solely from instantaneous changes in temperature or voltage, this approach evaluates the equipment condition by incorporating the cumulative effect of thermal stress over time.
Therefore, the proposed framework can be applied to actual operating equipment by continuously collecting sensor data (e.g., temperature and voltage) in real time and calculating the CDT to monitor the ongoing degradation state. When the cumulative value reaches a predefined threshold, the system can detect potential anomalies early and issue a warning, making it a practical decision-making indicator for PdM. For instance, if the CDT of a specific device approaches its critical threshold, the system can automatically trigger an alert, allowing for maintenance schedules or component replacements to be adjusted proactively. This approach minimizes unexpected equipment failures and costly downtime, thereby enhancing both the stability and efficiency of production systems. The methodology proposed in this study is expected to significantly contribute to establishing an effective maintenance strategy for ATE driver boards, which play a critical role in semiconductor testing and are highly sensitive to thermal variations. The CDT-based prediction model developed here can be effectively applied to early anomaly detection and replacement time prediction for these components.
In conclusion, this approach establishes a robust technical foundation for condition-based maintenance decisions, transcending simple anomaly detection. By quantifying thermal degradation characteristics under high-temperature conditions and integrating them with AI-based models, the framework offers strong scalability for deployment not only in semiconductor manufacturing environments, but also across various industrial systems where high reliability is mandated. Ultimately, the anomaly detection methodology proposed in this study is positioned to extend beyond the scope of laboratory-level validation, serving as a core engine for a comprehensive PdM system in industrial fields. Future research will focus on integrating this mechanism into actual semiconductor mass production lines to demonstrate its practical efficacy. Specifically, to accurately reflect the complexity of actual ATE operating environments, we aim to utilize diag data derived directly from field equipment. This approach will allow us to advance the model to encompass multi-stress factors, such as vibration and humidity, thereby validating the flexibility and scalability of the proposed algorithm under variable operational conditions. Furthermore, to maximize diagnostic precision, we will refine the thresholding strategy by incorporating domain knowledge regarding the unique physical characteristics and durability of specific components. By dynamically calibrating the anomaly detection threshold—industrially referred to as the Upper Specification Limit—for each component, the system can minimize false alarms and ensure high reliability. In conclusion, by establishing a robust anomaly detection framework for thermally sensitive ATE components, this research drives a paradigm shift from reactive troubleshooting to proactive management, thereby making a significant contribution to the advancement of high-reliability smart manufacturing infrastructures.
Author Contributions
Conceptualization, H.L. and Y.K.; methodology, H.L. and J.J.; software, H.L.; validation, H.L., S.H. and J.J.; formal analysis, H.L.; investigation, H.L.; data curation, S.H.; writing—original draft preparation, H.L.; writing—review and editing, H.L., J.J. and Y.K.; supervision, Y.K.; project administration, Y.K.; funding acquisition, Y.K. All authors have read and agreed to the published version of the manuscript.
Funding
This work was supported by the K-CHIPS (Korea Collaborative & High-tech Initiative for Prospective Semiconductor Research) (1415188224, RS-2023-00301703, 23045-15TC), the Technology Innovation Program (RS-2024-00469370, Development of AI-Based Predictive Maintenance Technology for High Reliability Test) funded by the Ministry of Trade, Industry & Energy (MOTIE, Republic of Korea), and the Korea Institute for Advancement of Technology (KIAT) grant funded by the Korea Government (MOTIE) (RS-2024-00409639, HRD Program for Industrial Innovation).
Data Availability Statement
The original contributions presented in this study are included in the article. Further inquiries can be directed to the corresponding author.
Conflicts of Interest
The authors declare no conflicts of interest.
References
- Park, H.; Choi, J.E.; Hong, S.J. Artificial immune system for fault detection and classification of semiconductor equipment. Electronics 2021, 10, 944. [Google Scholar] [CrossRef] [Scilit]
- Azari, M.S.; Flammini, F.; Santini, S.; Caporuscio, M. A systematic literature review on transfer learning for predictive maintenance in industry 4.0. IEEE Access 2023, 11, 12887–12910. [Google Scholar] [CrossRef] [Scilit]
- Chung, E.; Park, K.; Kang, P. Fault classification and timing prediction based on shipment inspection data and maintenance reports for semiconductor manufacturing equipment. Comput. Ind. Eng. 2023, 176, 108972. [Google Scholar] [CrossRef] [Scilit]
- Poór, P.; Ženíšek, D.; Basl, J. Historical overview of maintenance management strategies: Development from breakdown maintenance to predictive maintenance in accordance with four industrial revolutions. In Proceedings of the International Conference on Industrial Engineering and Operations Management, Pilsen, Czech Republic, 23–26 July 2019; pp. 23–26. [Google Scholar]
- Carvalho, T.P.; Soares, F.A.; Vita, R.; Francisco, R.D.P.; Basto, J.P.; Alcalá, S.G. A systematic literature review of machine learning methods applied to predictive maintenance. Comput. Ind. Eng. 2019, 137, 106024. [Google Scholar] [CrossRef] [Scilit]
- Alnuayri, T.; Martínez, A.L.H.; Khursheed, S.; Rossi, D. A support vector regression based machine learning method for on-chip aging estimation. In Proceedings of the 2021 4th International Conference on Computing & Information Sciences (ICCIS), Karachi, Pakistan, 29–30 November 2021. [Google Scholar]
- Bae, Y.M.; Kim, Y.G.; Seo, J.W.; Kim, H.A.; Shin, C.H.; Son, J.H.; Lee, G.H.; Kim, K.J. Detecting abnormal behavior of automatic test equipment using autoencoder with event log data. Comput. Ind. Eng. 2023, 183, 109547. [Google Scholar] [CrossRef] [Scilit]
- Huang, P.W.; Chung, K.J. Task failure prediction for wafer-handling robotic arms by using various machine learning algorithms. Meas. Control 2021, 54, 701–710. [Google Scholar] [CrossRef] [Scilit]
- Abdelli, K.; Grießer, H.; Pachnicke, S. A machine learning-based framework for predictive maintenance of semiconductor laser for optical communication. J. Light. Technol. 2022, 40, 4698–4708. [Google Scholar] [CrossRef] [Scilit]
- Kang, Z.; Cagatay, C.; Bedir, T. Remaining useful life (RUL) prediction of equipment in production lines using artificial neural networks. Sensors 2021, 21, 932. [Google Scholar] [CrossRef] [Scilit] [PubMed]
- Nelson, W. Graphical analysis of accelerated life test data with the inverse power law model. IEEE Trans. Reliab. 1972, 21, 2–11. [Google Scholar] [CrossRef] [Scilit]
- Pu, S.; Yang, F.; Vankayalapati, B.T.; Akin, B. Aging mechanisms and accelerated lifetime tests for SiC MOSFETs: An overview. IEEE J. Emerg. Sel. Top. Power Electron. 2021, 10, 1232–1254. [Google Scholar] [CrossRef] [Scilit]
- Kotsiantis, S.B.; Zaharakis, I.D.; Pintelas, P.E. Machine learning: A review of classification and combining techniques. Artif. Intell. Rev. 2006, 26, 159–190. [Google Scholar] [CrossRef] [Scilit]
- Ali, Z.A.; Abduljabbar, Z.H.; Tahir, H.A.; Sallow, A.B.; Almufti, S.M. eXtreme gradient boosting algorithm with machine learning: A review. Acad. J. Nawroz Univ. 2023, 12, 320–334. [Google Scholar] [CrossRef] [Scilit]
- Ahmadi, S.H.; Mohammad, J.K. Fault detection Automation in Distributed Control Systems using Data-driven methods: SVM and KNN. TechRxiv 2023. [Google Scholar] [CrossRef] [Scilit]
- Liu, J.; Hu, Y.; Yang, S. A SVM-based framework for fault detection in high-speed trains. Measurement 2021, 172, 108779. [Google Scholar] [CrossRef] [Scilit]
- Zou, X.; Hu, Y.; Tian, Z.; Shen, K. Logistic regression model optimization and case analysis. In Proceedings of the 2019 IEEE 7th International Conference on Computer Science and Network Technology (ICCSNT), Dalian, China, 19–20 October 2019. [Google Scholar]
- Lu, J.; Tan, L.; Jiang, H. Review on convolutional neural network (CNN) applied to plant leaf disease classification. Agriculture 2021, 11, 707. [Google Scholar] [CrossRef] [Scilit]
- Vujović, Ž. Classification model evaluation metrics. Int. J. Adv. Comput. Sci. Appl. 2021, 12, 599–606. [Google Scholar] [CrossRef] [Scilit]

Disclaimer/Publisher’s Note: The statements, opinions and data contained in all publications are solely those of the individual author(s) and contributor(s) and not of MDPI and/or the editor(s). MDPI and/or the editor(s) disclaim responsibility for any injury to people or property resulting from any ideas, methods, instructions or products referred to in the content. |
© 2026 by the authors. Licensee MDPI, Basel, Switzerland. This article is an open access article distributed under the terms and conditions of the Creative Commons Attribution (CC BY) license.