


Abstract
This study evaluates the impact of the integration of non-synchronous distributed generation on the frequency stability, rotor-angle response and dynamic performance of the electrical system associated with Substation 50 La Troncal (Ecuador). The network was modeled in DIgSILENT PowerFactory 2024 with six busbars, and eight renewable-penetration scenarios (15–50% of the 32.8 MW demand) were assessed under N-1 (loss of the COAZUCAR TG3 generator) and N-2 (TG3 plus the Ocaña 2 line) contingencies applied at t = 1 s over a 20 s horizon. Steady-state results showed voltage profiles within acceptable ranges and no overloads, whereas the dynamic analysis revealed non-compliances, with average ROCOF of 0.772 Hz/s, frequency nadir of 59.192 Hz and angular deviation of 8.75°. A battery energy storage system (BESS) with virtual inertia was then implemented, improving the nadir to 59.672 Hz, the ROCOF to 0.220 Hz/s and the angular deviation to 6.10°. An ANSI 51 overcurrent scheme (Siemens SIPROTEC 7SJ6001) installed on the 69 kV line at B3 was verified with operating times compatible with the protection requirements. The combination of energy storage, virtual inertia and conventional protection constitutes a technically viable alternative to increase non-synchronous distributed generation while preserving stability and operational security.
1. Introduction
The growing dependence on electrical energy in human life makes it necessary to transition from fossil energy sources to a sustainable paradigm based on renewable energy sources (RESs), which is one of the most significant challenges of the 21st century. This transition, fundamentally motivated by the need to reduce greenhouse gas emissions and the global commitment embodied in the Paris agreement, represents one of the fundamental pillars of the fight against climate change. However, this fundamental migration is not without complexities for distribution systems [1]. The large-scale incorporation of variable renewable energy, particularly non-conventional and variable ones such as photovoltaic and wind, is redefining the control, operation and stability of power electricity systems around the world. These commitments are creating significant pressure to adopt renewable sources to reduce CO2 emissions and their polluting effects on humans and the ecosystem [2]. However, this benefit to the environment leads to a technical restructuring, which must be analyzed and studied in all scenarios to avoid compromising the safety and reliability of electric systems (EPS).
In particular, among the diversity of so-called green technologies, photovoltaic solar energy, due to its scalability, implementation cost, and incentives generated through policies in several countries, has positioned itself as the most widely implemented. Followed by wind energy, these sources of greatest use are called variable renewable energy sources (VRESs), with an estimated 95% growth in renewable generation by the end of 2028 in the projections of the International Energy Agency [3]; however, this positive growth for environmentalists incorporates critical challenges for distribution systems, such as the gradual replacement of synchronous generators of conventional generation, especially hydroelectric and thermal, with power electronic components, known as inverters. These components lack rotational inertia and, from this perspective, the incorporation of modern technologies stands out, which creates an emerging phenomenon, with serious implications for frequency stability in electrical systems due to the incorporation of low-rotational-inertia electrical systems. These implications give way to new simulation analyses of electrical systems, proposing mitigation strategies [4].
In this context, the rotational inertia of a system has traditionally been provided by the heavy rotors of synchronous generators; this acts as a first natural reaction mechanism to disturbances in an electric system, compensating when imbalances between generation and load occur, and this large rotating mass contains kinetic energy that releases or absorbs, by slowing down the rate of change of frequency (RoCoF). This phenomenon gives valuable time for both secondary and tertiary control systems to act to stabilize the system [5]. With the addition of inverter-based generation systems, those that are not coupled to the system frequency due to power electronics components do not naturally contribute to inertia. As a greater number of generators are coupled without inertia to a modern system, the general inertia of the same decreases, and this leads to modern networks with low inertia, according to [6]. The consequences of these conditions can include frequency instability, increased risk of collapse, and reduced network resilience [7].
This condition can be analyzed using degraded frequency stability quantifiers. In low-inertia electrical systems, the loss of a high-capacity generator, or the output of a critical transmission line, results in an increase in the rate of frequency change, and a loss of frequency to the deepest point in the system, as cited in the research impact of variable renewable energy sources on the frequency stability of the electrical system and the inertia by Njoka et al. [3]. In this system, it is evidenced through simulations that exceeding penetration limits can result in the frequency dropping to critical levels and longer times for the recovery of the system after disturbances, in addition to a greater probability of action in protections, as well as oscillatory states in remaining synchronous generators [4]. In addition, there is evidence of the unscheduled action of protection schemes by underfrequency or low frequency, which can trigger cascading events, and this condition could potentially lead to widespread disconnections, even though such events should normally be limited to local contingencies [8,9].
Faced with this diverse and complex problem, the scientific community has focused its efforts on developing methodologies to quantify, evaluate and mitigate these impacts. Time simulations in engineering tools such as PowerFactory, MATLAB have positioned themselves in a referential method to analyze transient stability. There are several studies that use these simulation tools to study with high precision the detail of the system’s behavior in the face of contingencies under multiple scenarios of penetration of renewable energies [10]. These computer programs allow simulating and quantifying sensitive metrics, such as the rate of change of frequency (RoCoF), the frequency nadir, rotor angles of synchronous generators, generating a rigorous report of the residence of the systems under various real scenarios.
Once the limits and vulnerabilities have been identified, the research advances to propose applicable mitigation strategies that make the operation effective. Previous studies show that the solution to this problem is not to limit the integration of renewable energies but to enable their application through advanced control technologies and strategies. As electricity systems become more widely used in renewable energy and power electronics, they reduce stability due to a lack of synthetic inertia [11]. Consequently, new concepts such as virtual or synthetic inertia emerge as crucial mitigation strategies; in addition, accumulator energy storage systems (BESSs), equipped with suitable controllers, are capable of emulating the response of synchronous generators, absorbing or injecting large amounts of active energy in milliseconds, in frequency deviation events [12,13].
Other complementary mitigation strategies are based on the analysis and adjustments of existing protection schemes, such as frequency change rate relays and low-frequency relays. The objective of these configurations is to adapt them to the new dynamics of the system, avoiding untimely trips that lead to destabilizing the system on a larger scale during intermittencies and uncertainties. The principle that stands out and applies is that the integration of VRES must be counterbalanced with contingencies in order to obtain a stable system [14]; this principle should guide us in the energy transition, in each context of application, from large electricity systems, as well as in smaller and more vulnerable systems such as the one in our study, La Troncal. Consequently, this study proposes to apply this conceptual framework and these methodologies, studied and validated by the scientific community, to the case of Substation 50 due to its criticality. The objective is to analyze the impact of distributed generation, specifically non-synchronous, on frequency stability and rotational inertia in the La Troncal electrical system, through simulations in MATLAB. For this, the existing scientific knowledge is systematized, especially in high-impact articles, in addition to simulating progressive scenarios of renewable penetration to quantify the impact on the RoCoF and rotor angles. With these inputs, we evaluate and propose mitigation strategies based on BESS and virtual inertia, as well as reviewing protection schemes [15].
Alongside physical time-domain simulation, data-driven and learning-based approaches are emerging as complementary tools for dynamic security assessment and intelligent operation of low-inertia systems; the present work complements these developments with a physically detailed case study of a medium-sized hybrid system [16].
To make the methodological logic explicit, this study follows a sequential four-stage framework: (i) definition of eight renewable penetration scenarios (15–50% of demand) to statically stress the system; (ii) steady-state validation to confirm the operational feasibility of each scenario; (iii) dynamic RMS evaluation under N-1 and N-2 contingencies to quantify frequency- and rotor-angle stability limits through the frequency nadir, ROCOF and maximum angular deviation; and (iv) mitigation and validation, in which a BESS (4 MW) with virtual inertia (gain Kd = 2 MW s/Hz) corrects the identified non-compliances and the protection scheme is re-assessed. Thus, the steady-state stage filters feasible operating points, the dynamic stage reveals inertia-related limitations that the steady-state analysis cannot detect, and the mitigation stage directly targets those limitations.
2. Materials and Methods
2.1. Study System Description
However, the challenge associated with the reduction in inertia acquires greater presence in medium-sized electricity systems, isolated grids and hybrid configurations, because its effects can increase when the participation of non-synchronous renewable generation exceeds the contribution of conventional synchronous units. For this reason, the electricity grid linked to Substation 50 La Troncal was selected as a case study, because it has adequate characteristics for the analysis of frequency stability, inertial support and dynamic response to disturbances in systems with greater incorporation of variable renewable energies.
The canton of La Troncal, located in the province of Cañar and supplied by the Central South Regional Electric Company, is a system of interest due to its industrial and commercial activity. In addition, the network receives energy supply from the Ocaña Hydroelectric Power Plant (26.1 MW) and maintains a connection with the COAZUCAR Biomass Power Plant (20 MW), whose operation through synchronous turbines depends on seasonal periods associated with the processing of sugarcane. Operating mainly during the harvest season between June and December, the system also supplies significant industrial loads, including the Petroecuador pumping station with an approximate demand of 5 MW, in addition to two sub distribution lines for network expansion, corresponding to La Troncal-Puerto Inca and La Troncal-Triunfo.
The coexistence of conventional synchronous generation, biomass and possible incorporation of photovoltaic generation makes the system an appropriate scenario to evaluate safe operating limits in the face of a greater penetration of non-synchronous generation. In addition, the variable nature of renewable resources incorporates operational uncertainty associated with changes in solar irradiance and energy availability, a situation that can increase power imbalances and alter the dynamic behavior of the system after disturbances.
The simulations were developed using the MATLAB R2024a and DIgSILENT PowerFactory 2024 software. In this case, DIgSILENT PowerFactory was selected due to its ability to integrate power flow studies, RMS dynamic simulation, transient stability, detailed modeling of synchronous machines and contingency analysis within the same simulation environment [17]; therefore, this feature allows for representing medium-sized hybrid systems such as the Substation 50 The Trunk in an appropriate way.
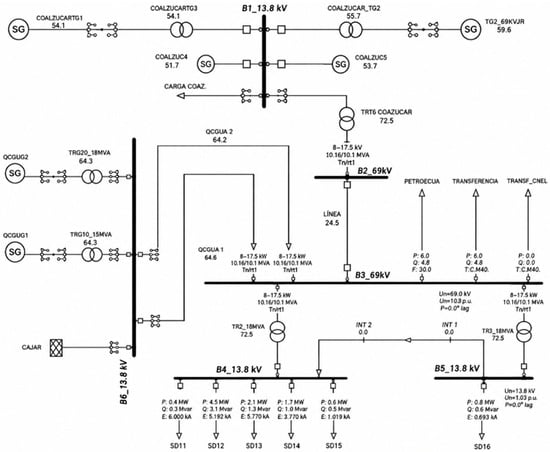
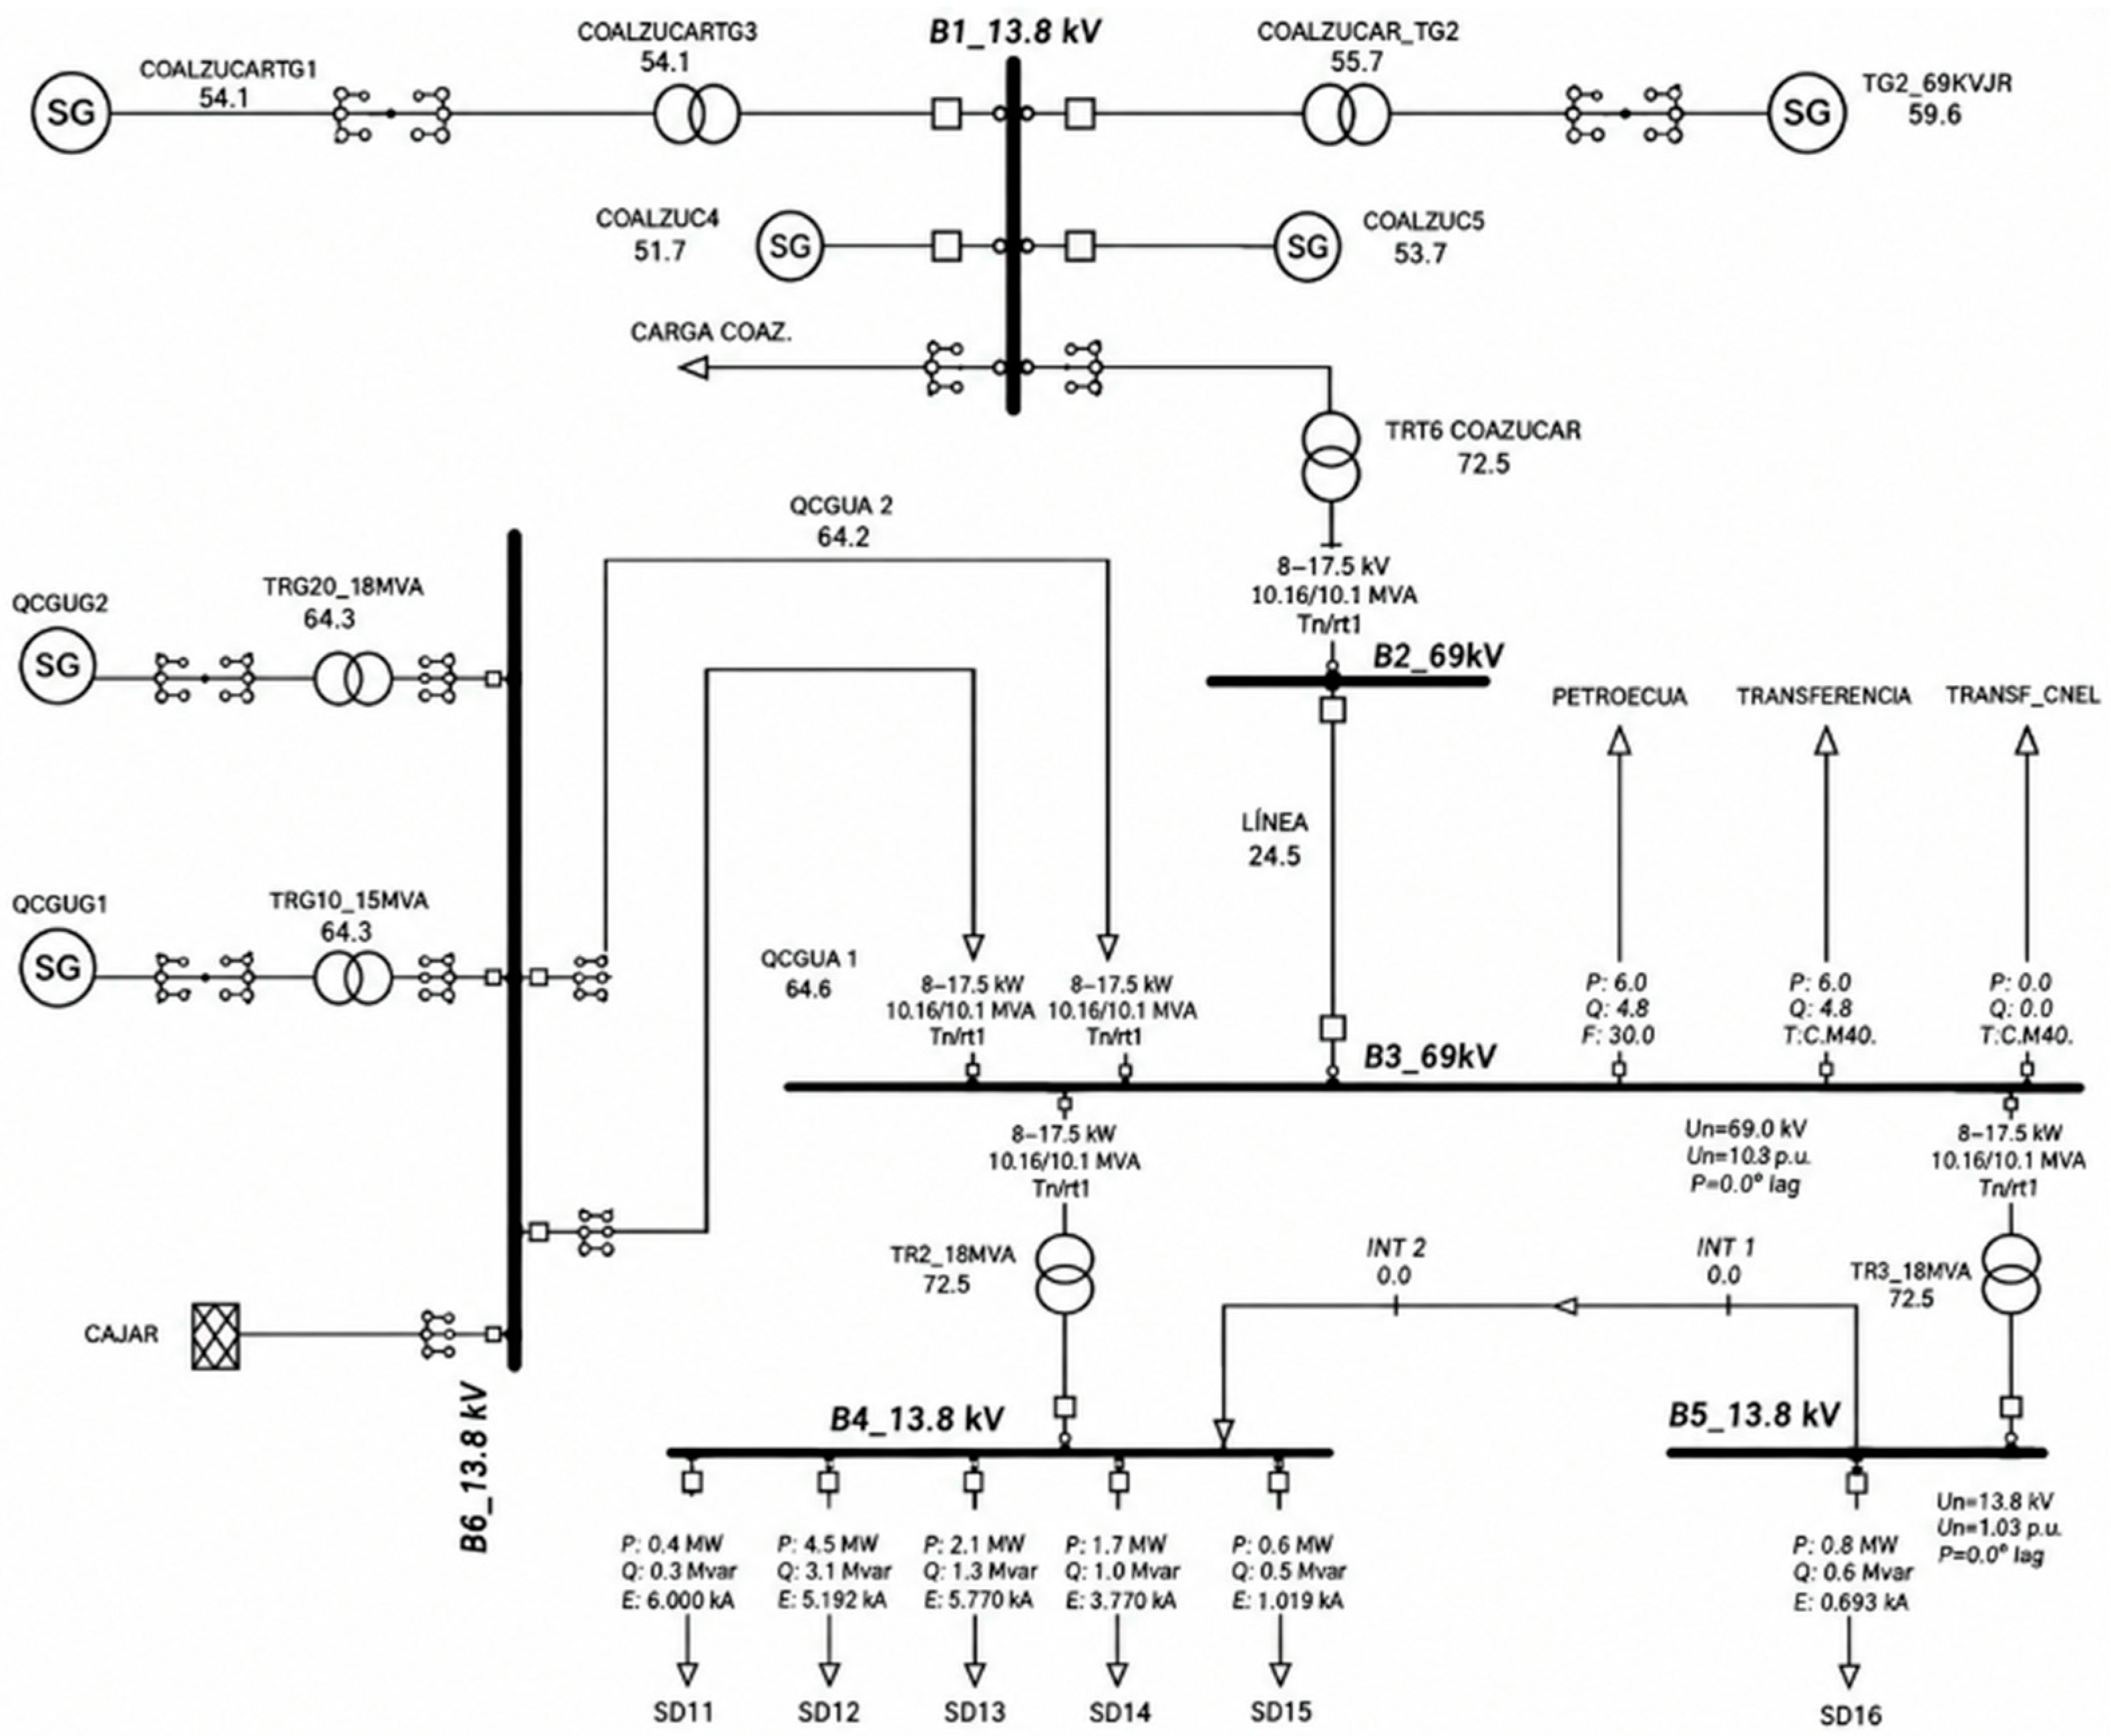
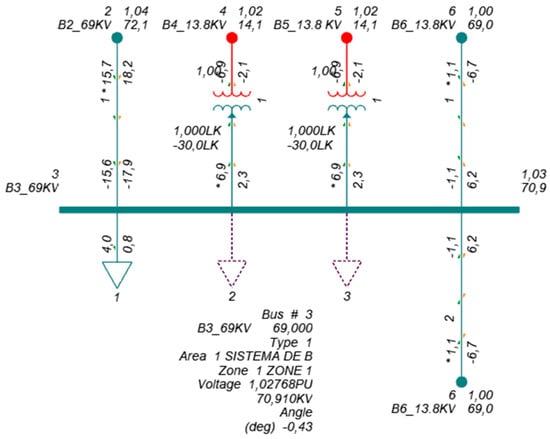
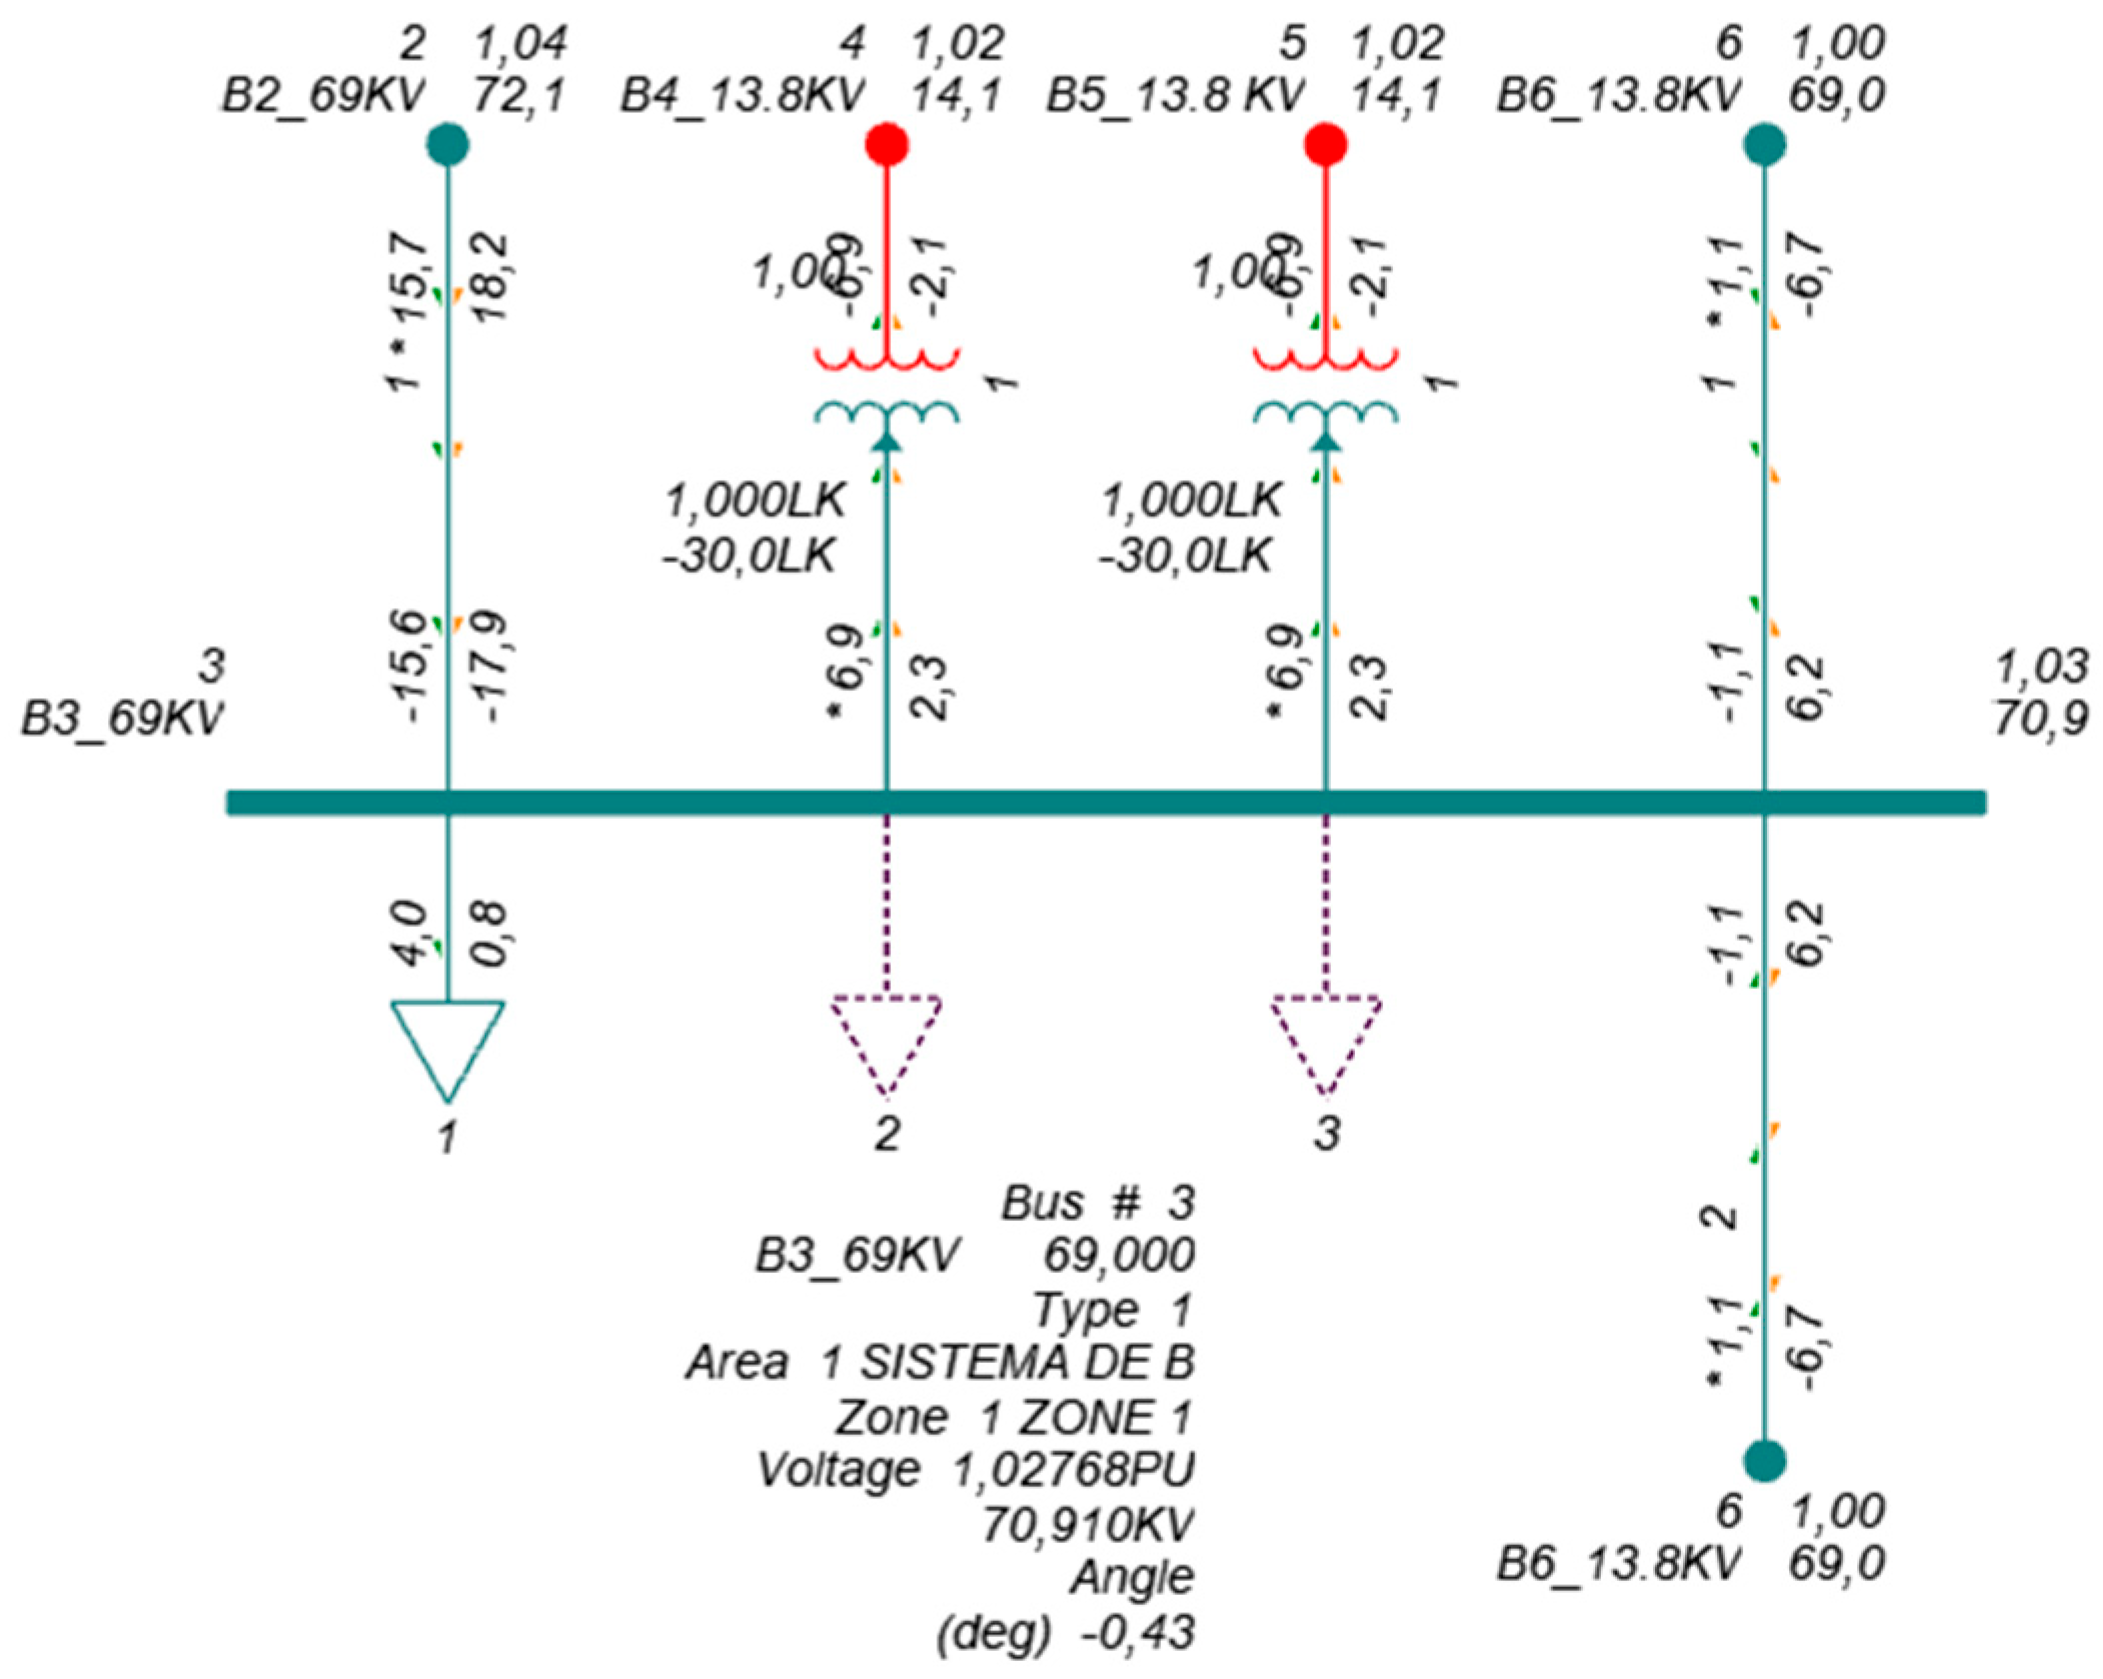
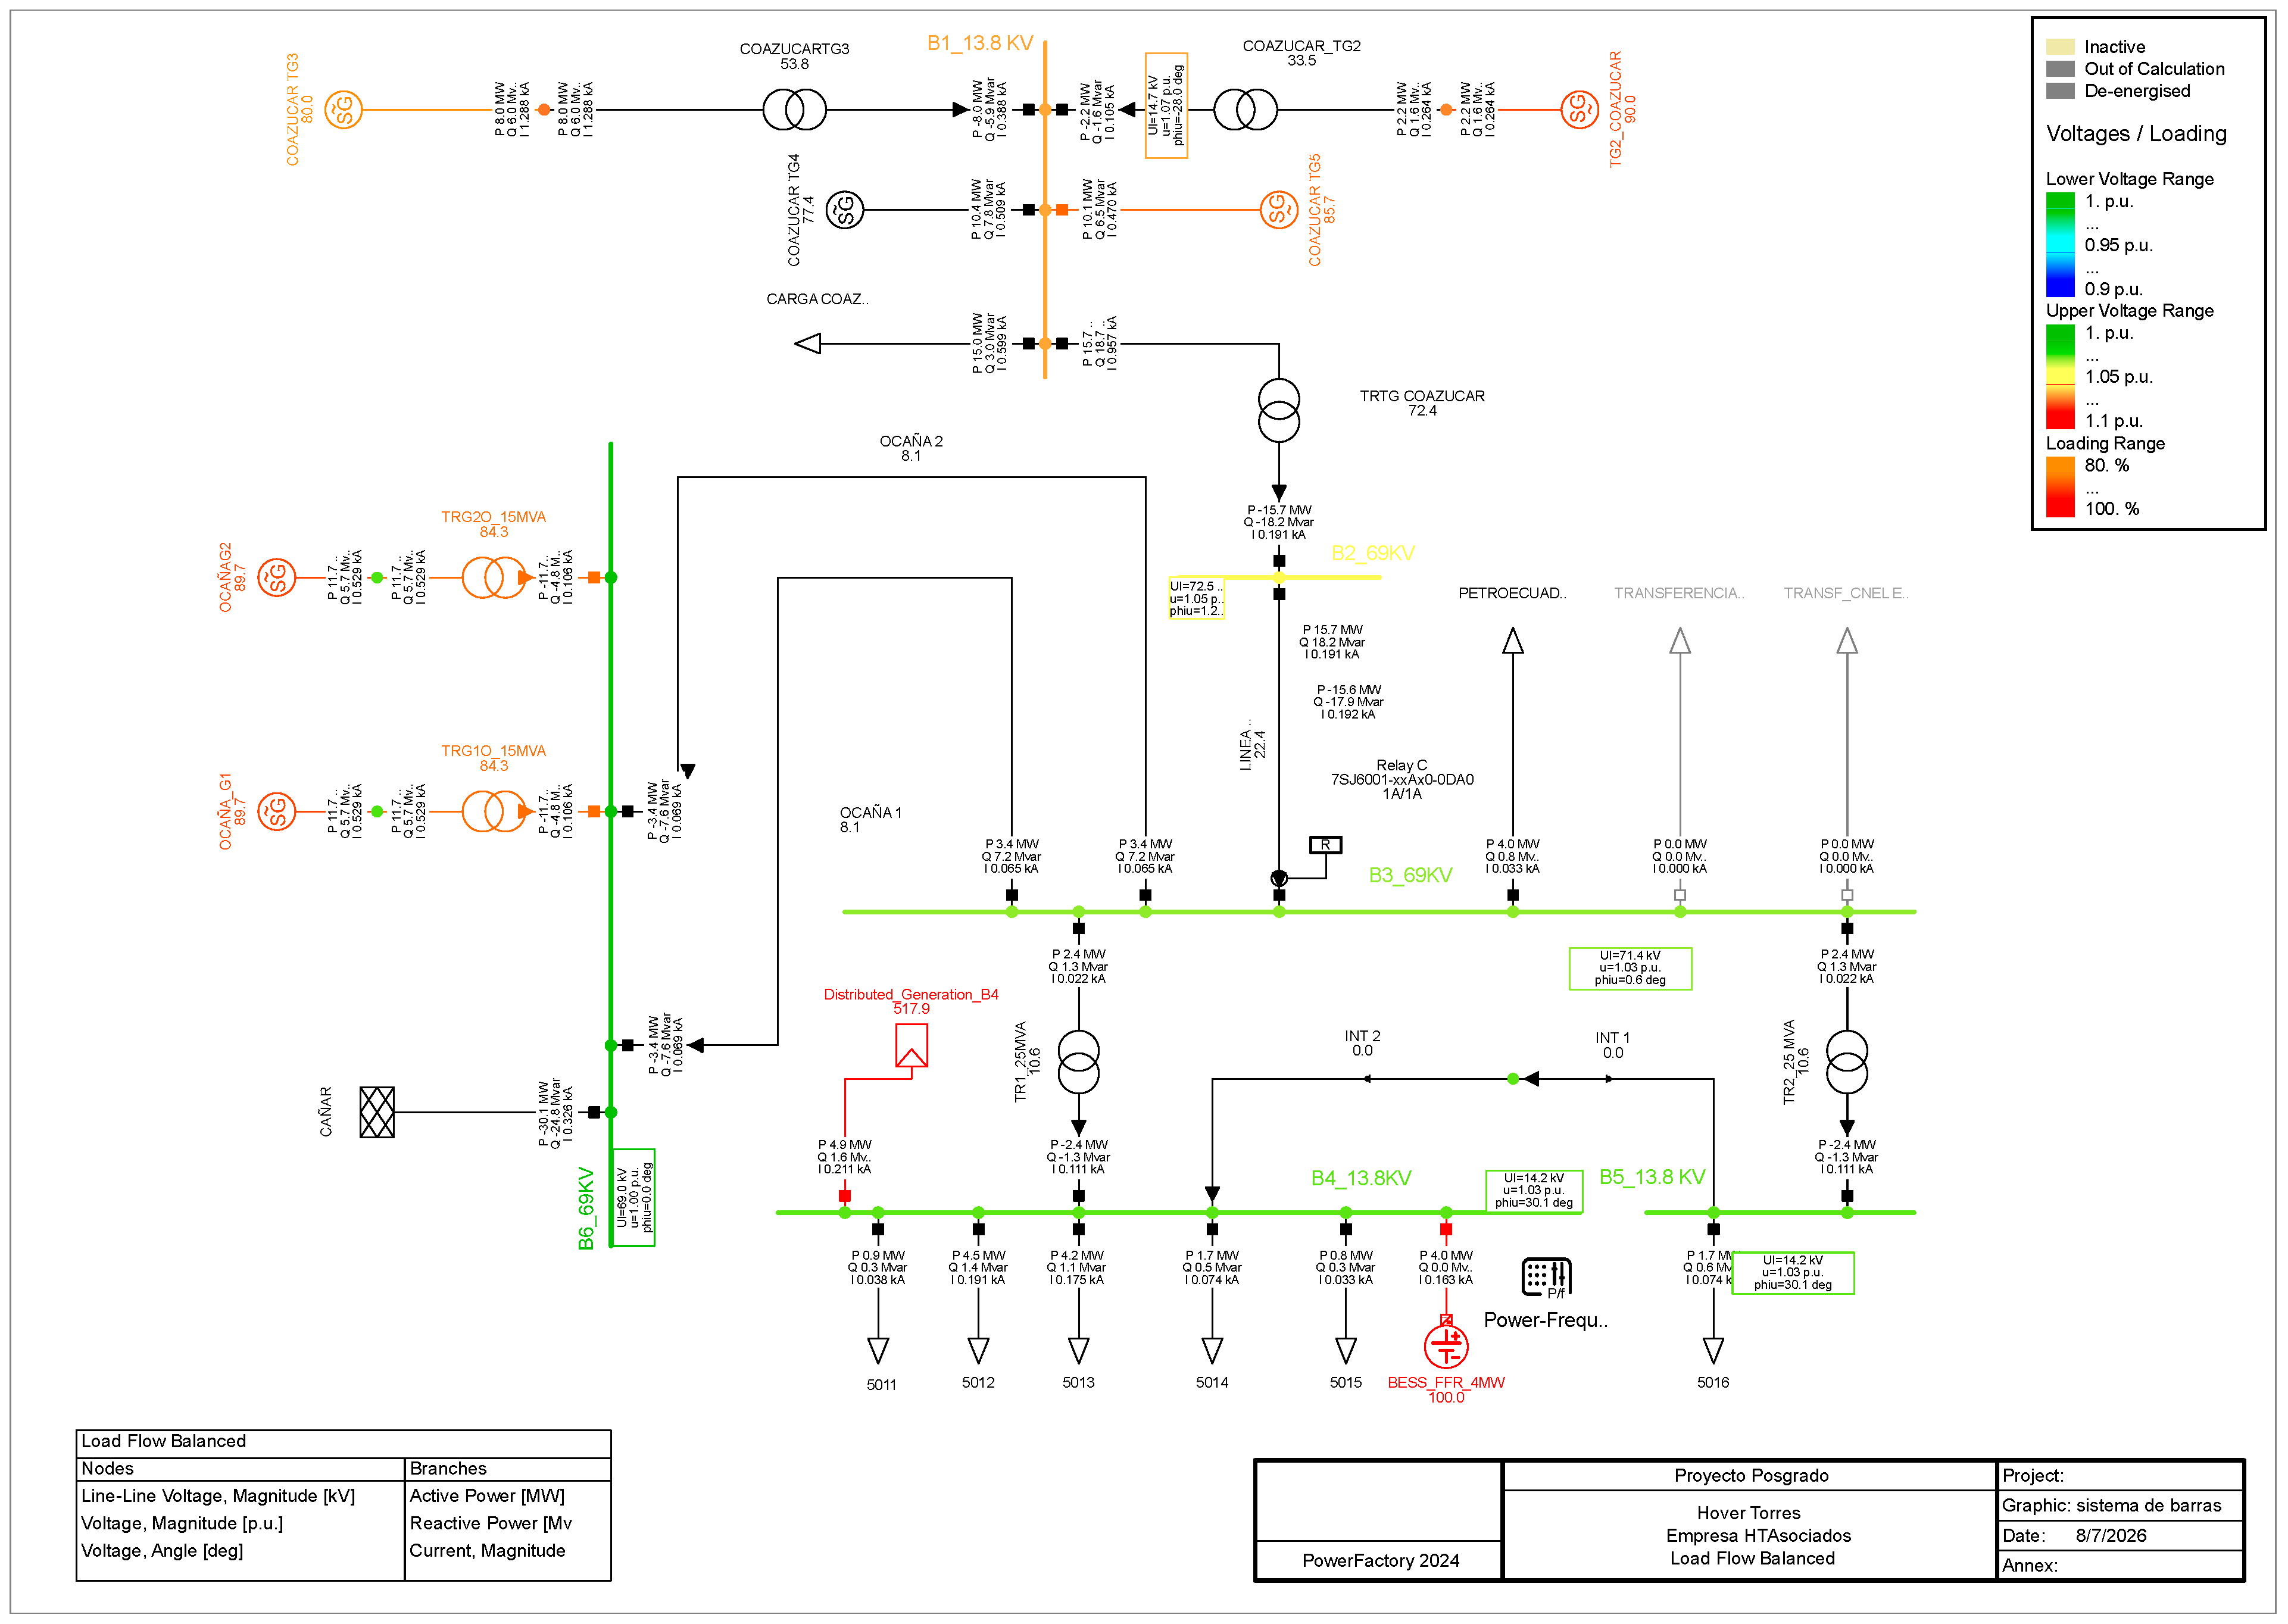
The implemented topology considered the real configuration of six bars of the electrical system, allowing us to represent the current operating conditions in an adequate way. In addition, we did not unnecessarily increase the computational complexity of the model. The modeled structure used for the simulation is shown in Figure 1.
Figure 1.
Electrical system substation 50 composed of 6 busbars.
In order to adequately represent the operating conditions of the system, Table 1 presents the synchronous generation units connected to Substation 50 La Troncal, including active power, reactive power and operating voltage magnitude.
Table 1.
Synchronous Generation coupled to substation 50 La Troncal.
Likewise, the electrical characteristics of the busbars considered within the implemented model are shown in Table 2, including voltage magnitude and phase angle, corresponding to the base operating state of the system.
Table 2.
Bus data of the La Troncal system.
On the other hand, Table 3 details the loads connected to the modelled electrical system, considering active power, reactive power and voltage levels associated with each load bar.
Table 3.
Loads connected to the La Troncal electrical system.
2.2. Dynamic Modeling and Frequency Stability Formulation
2.2.1. Rotor Angle Stability
Within the modeling, it is necessary to understand that the stability of the rotary angle is a fundamental parameter for the monitoring of synchronous generators, classified as small signal and transient. A deviation that exceeds the established limits of the rotor angle can cause the disconnection of the generation unit or in turn produce effects that destabilize nearby generation units. For this study, Newton’s second law applied to rotational motion is considered [18]. The equations and/or expressions are listed below:
Oscillation Equations
The oscillation of a synchronous machine is described by Equation (1):
where represents the accelerating inertia term; H corresponds to the inertia constant of the generator, expressed in seconds [s]; ωs is the synchronous velocity, expressed in radians per second [rad/s]; it corresponds to the second derivative of the rotor angle, associated with angular acceleration; Pm is the mechanical input power from the turbine, expressed in per unit [pu], and Pe is the output electrical power of the generator, also expressed in per unit [pu].
Angle Stability
The power transferred from the generator to the system depends on the angle of the rotor, as expressed in Equation (2).
where it represents the power supplied by the generator to the system; Ef it is the internal electromotive force of the generator; V corresponds to the busbar voltage of the system; Xd it is the reactance of the generator; ẟ and represents the angle of the rotor.
If the generator is connected to a infinite bus, the power delivered to the system can be considered as the product of the maximum transmissible power and the sine of the rotor angle, as shown in Equation (3):
where is the power delivered by the generator to the system which is defined by Equation (4): and represents the maximum transferable power. The latter depends on the internal electromotive force of the generator, the busbar voltage of the system and the reactance of the generator.
Transient Stability
The stability of a system is the ability it has to withstand and maintain synchronism during large-scale disturbances, such as sudden departures of generation systems, sudden load variations, these variations are evaluated with simulations of frequency variation over time, for the analysis the criterion of equal areas expressed in Equation (5) is used.
where represents the electrical power developed by the generator, while it corresponds to the mechanical input power. Using the power-angle ratio and the modeling equation for oscillation are the basis for stability model analysis Pe, Pm, dynamic stability studies focus on the conditions and behavior of the rotor angle during load variations and the magnitude of the frequency during these events, highlighting the priority of understanding and maintaining stability in systems [19].
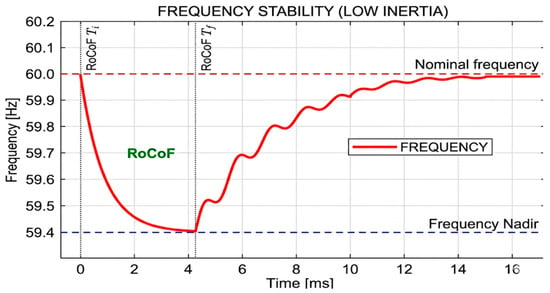
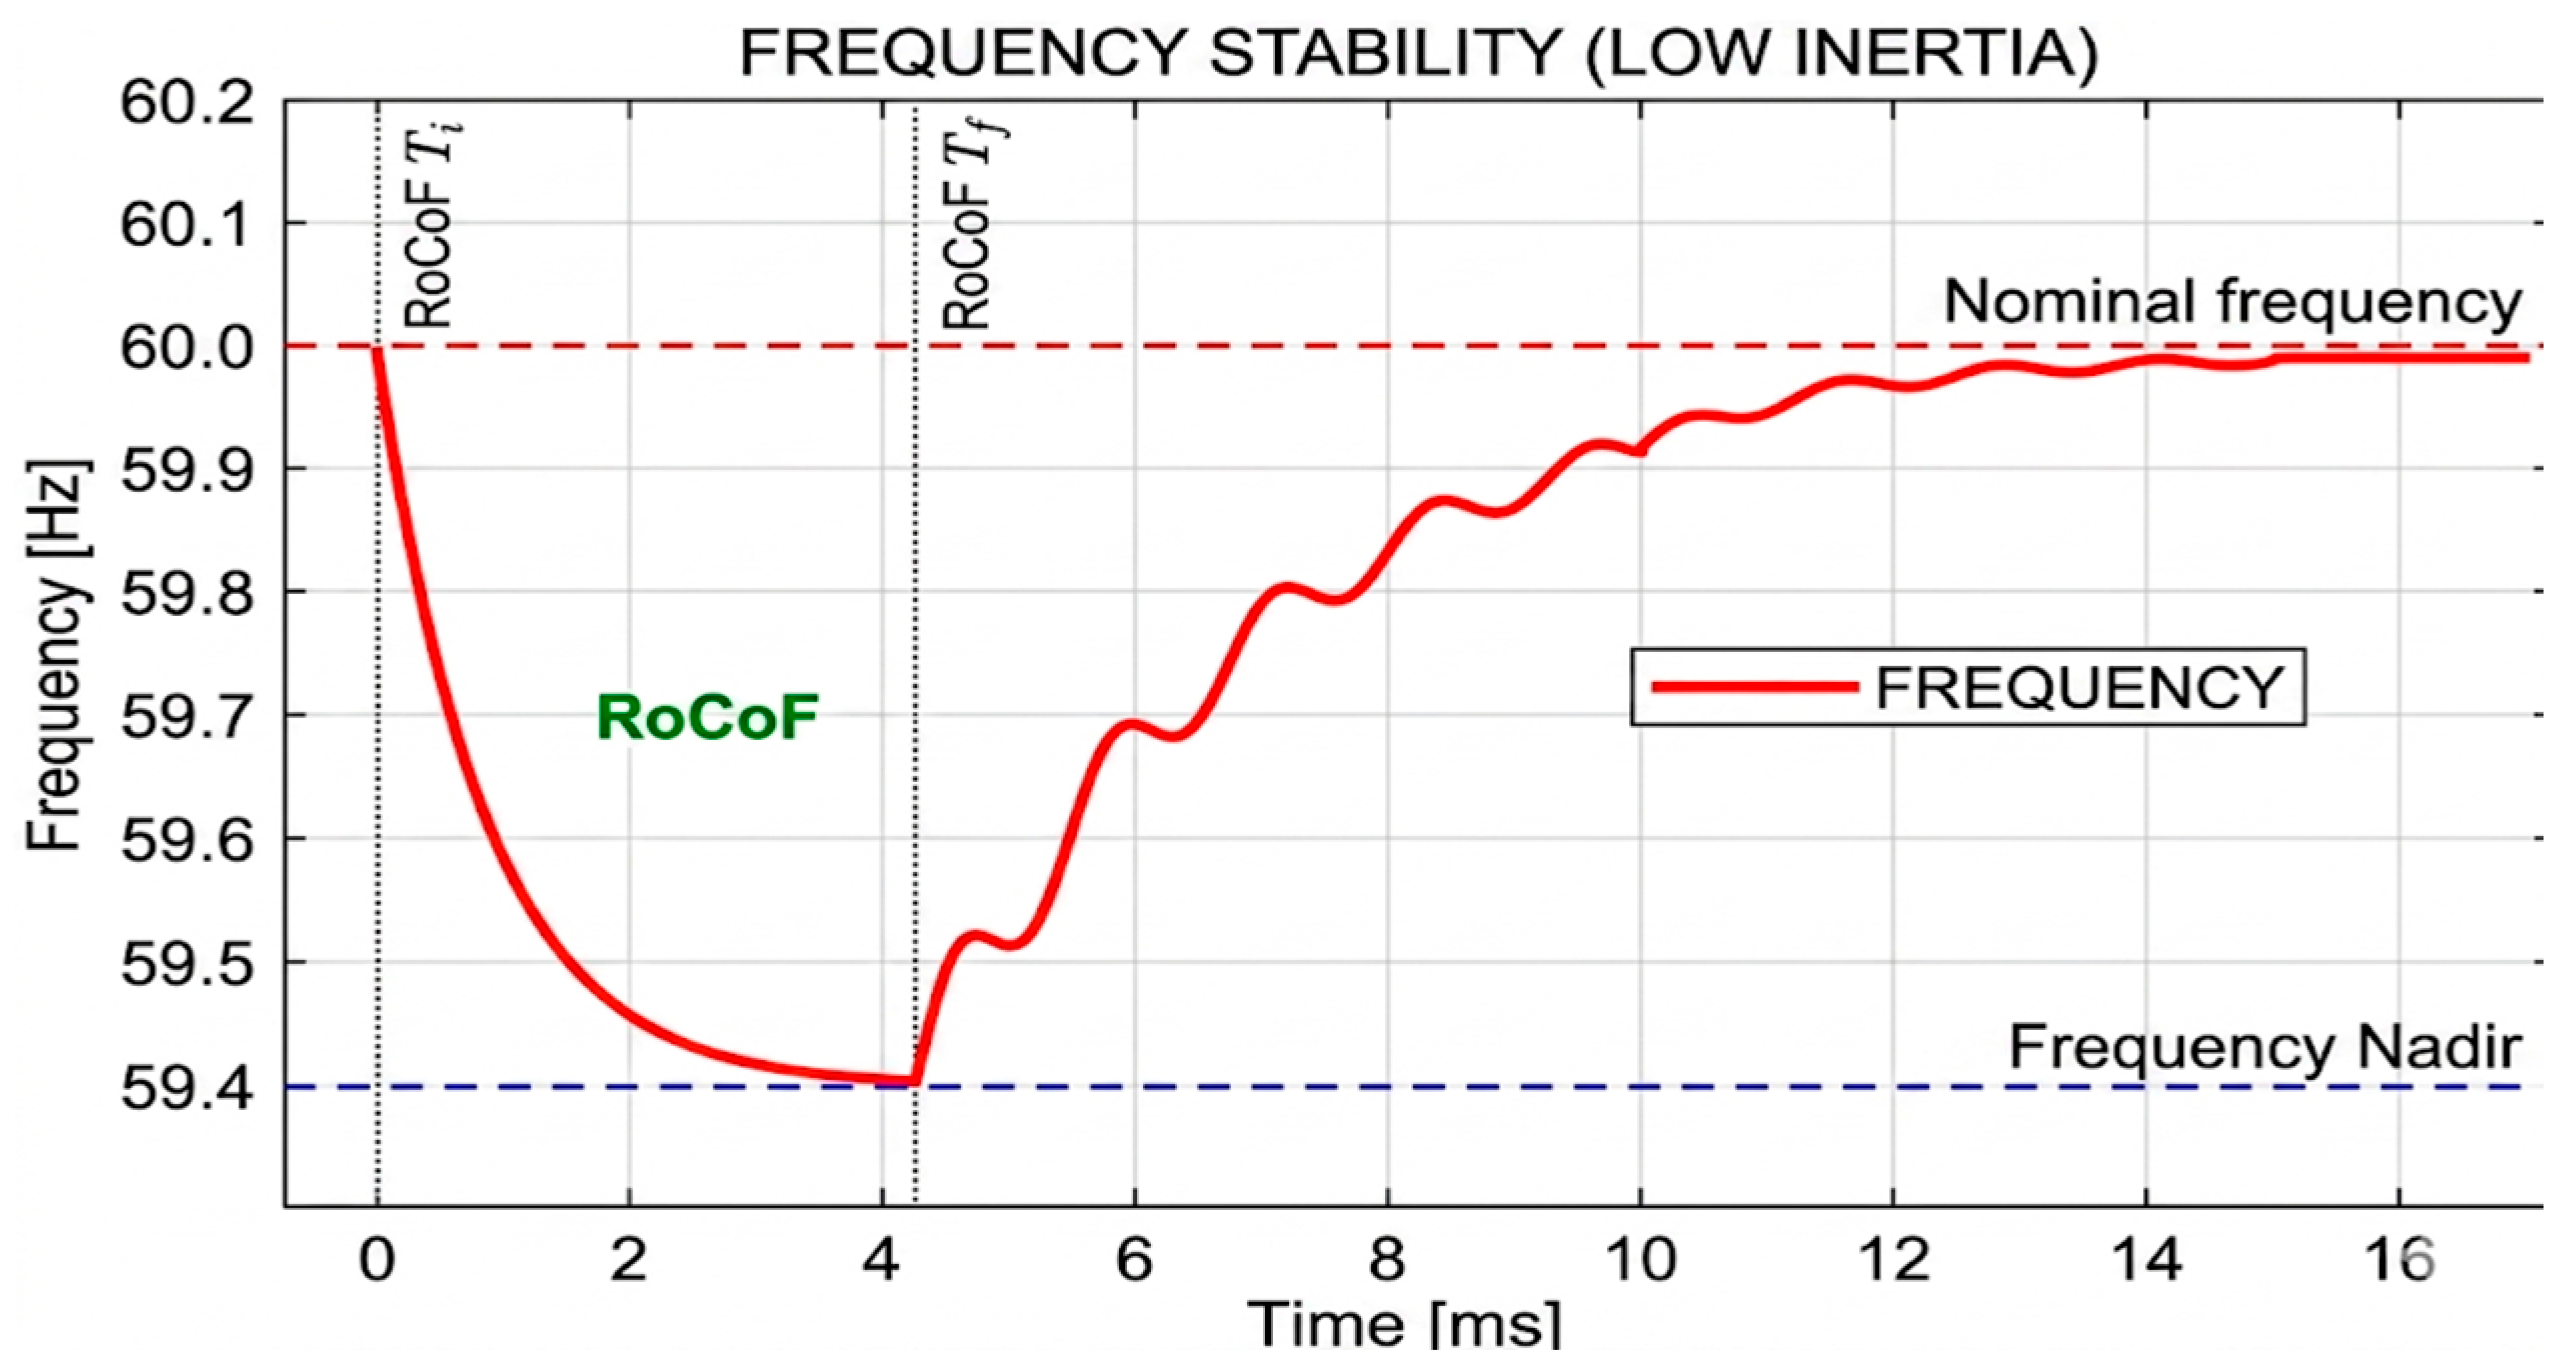
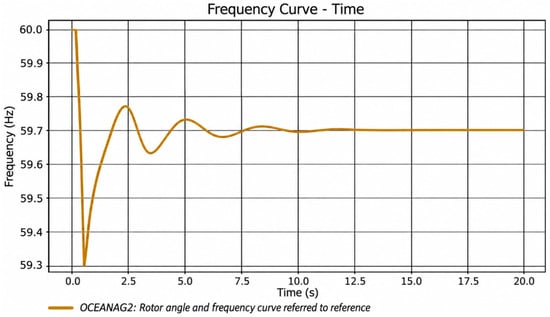
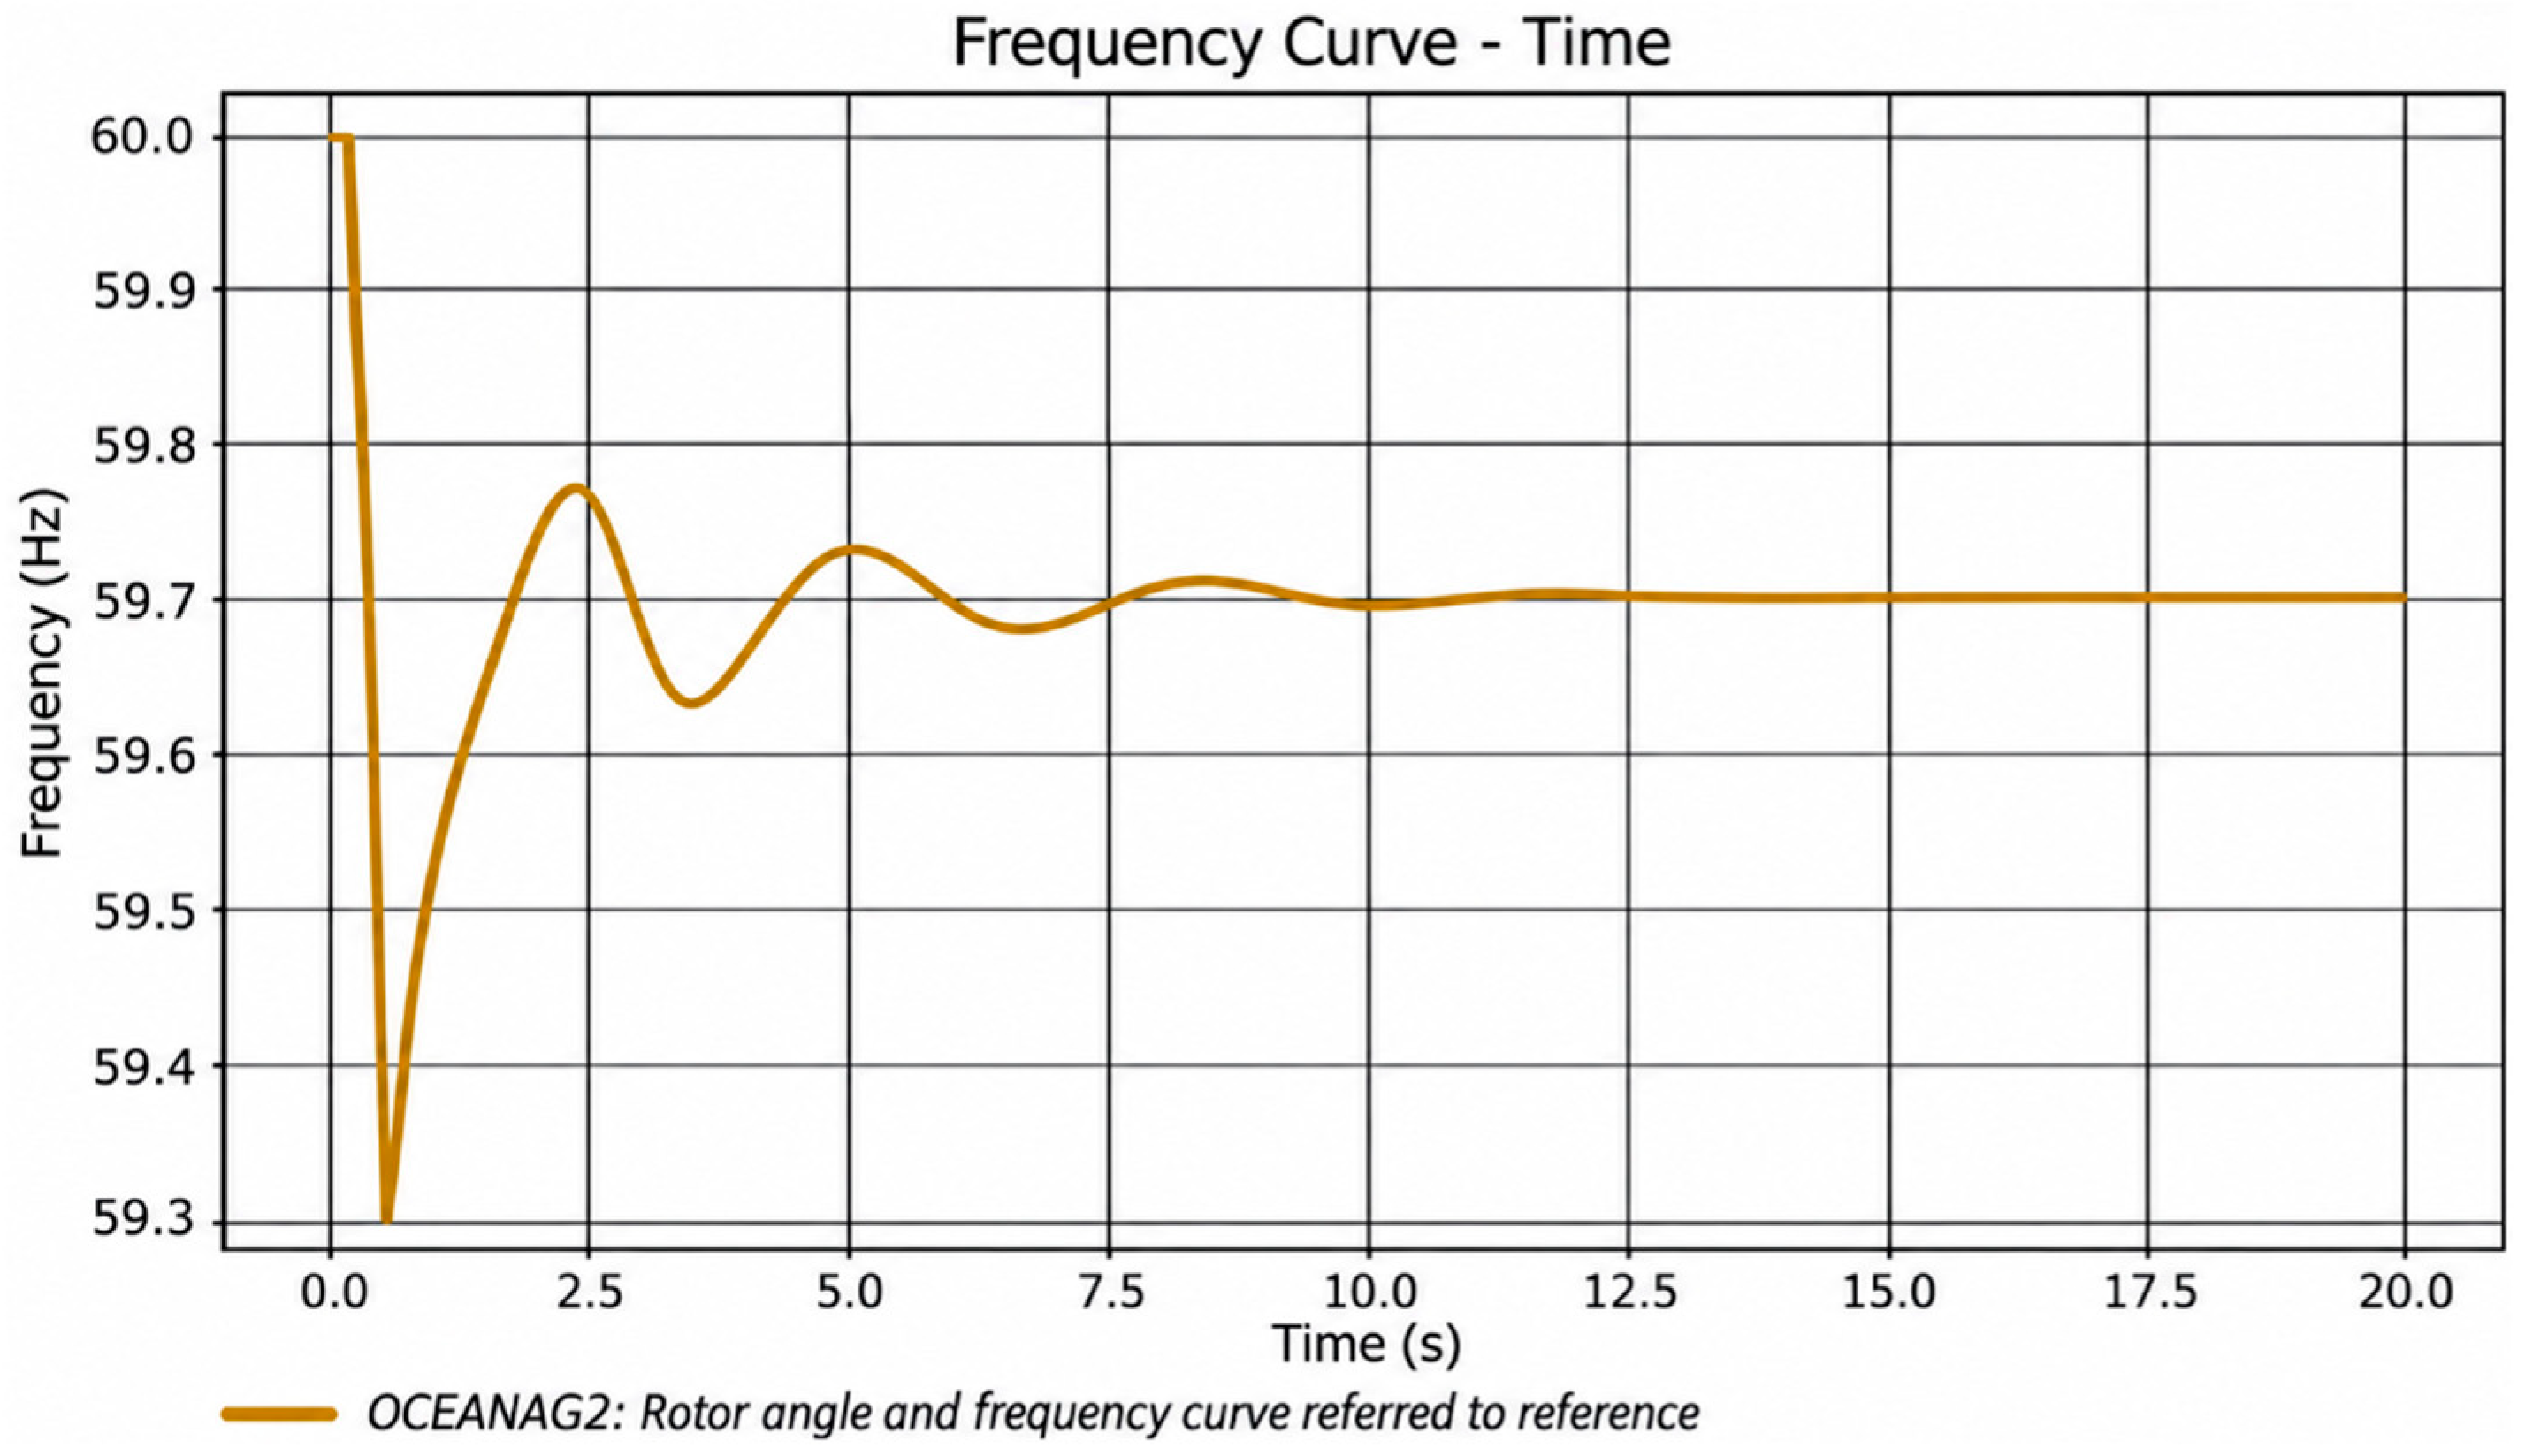
Figure 2 shows the temporal response of the frequency of the system to a severe disturbance, evidencing the characteristic dynamic behavior associated with the loss of stability.
Figure 2.
Frequency response to instability.
2.2.2. Frequency Stability Metrics
For frequency stability modeling we start from frequency stability, it is the ability of an electrical system to maintain a stable frequency after a disturbance occurs, which can be reflected as a sudden loss of a load or unscheduled disconnection of generation due to an event of any kind. It is essential to maintain stability in the electrical systems so that the correct service is guaranteed for the operation of the electrical equipment and the entire system in general [20].
Metrics to Measure Frequency Response
- Frequency deviation
The frequency deviation is obtained from the ratio between the variation in mechanical power and electrical power of the generator with respect to twice the inertia of the machine, as shown in Equation (6) [3].
- Rate of frequency change
On the other hand, the frequency change rate (ROCOF) is one of the most sensitive indicators within dynamic stability studies, because it allows quantifying the speed of variation of the frequency after severe disturbances, in addition its analysis facilitates the evaluation of the initial behavior of the electricity system in the face of imbalances between generation and demand.
In this study, ROCOF was obtained from the electrical-frequency signal FEHZ monitored at bus B3_69 kV, because this busbar is the common 69 kV coupling point used in the dynamic assessment and protection verification. The reported ROCOF corresponds to the maximum absolute slope after the contingency, calculated with a 0.5 s sliding window. The reported frequency nadir corresponds to the minimum individual bus frequency observed among the monitored busbars during the 20 s simulation horizon, not to a spatial average of the system; therefore, the value represents the most critical local frequency response, then this parameter is expressed by Equation (7):
Accordingly, when the active-power imbalance is expressed in per unit on the system power base, the initial ROCOF in Hz/s is expressed as: ROCOF = df/dt = (f0·ΔPpu)/(2Hsys), where f0 is the nominal system frequency (60 Hz for the Ecuadorian system), ΔPpu is the generation-load imbalance in per unit, and Hsys is the equivalent inertia constant of the committed synchronous units.
- Frequency nadir
Likewise, the frequency nadir corresponds to the minimum frequency value reached during the transient event following a disturbance. In this way, keeping the frequency within adequate ranges currently represents a growing challenge in electrical systems with high penetration of renewable generation governed by electronic power devices, because the decrease in synchronous inertia increases the sensitivity of the system to power imbalances and rapid frequency variations [20].
2.3. Renewable Penetration Scenarios
In addition, a progressive integration scheme of variable renewable energy resources (VRES) was implemented, which is presented in Figure 3, through photovoltaic units strategically connected within the electricity system, allowing the evaluation of different levels of renewable penetration under operating scenarios corresponding to harvest and interharvest, in this way, it was possible to analyze the behavior of the system in the face of variations in the share of non-harvesting generation. synchronous.
Figure 3.
Implementation of VRES to the La Troncal electrical system.
Eight renewable penetration scenarios were defined, considering increasing percentages of photovoltaic participation with respect to the total demand of the system as shown in Table 4, allowing to represent a gradual transition from a configuration with a predominance of synchronous generation to scenarios with greater integration of non-synchronous generation.
Table 4.
Renewable energy penetration in different scenarios.
2.4. Simulation Workflow
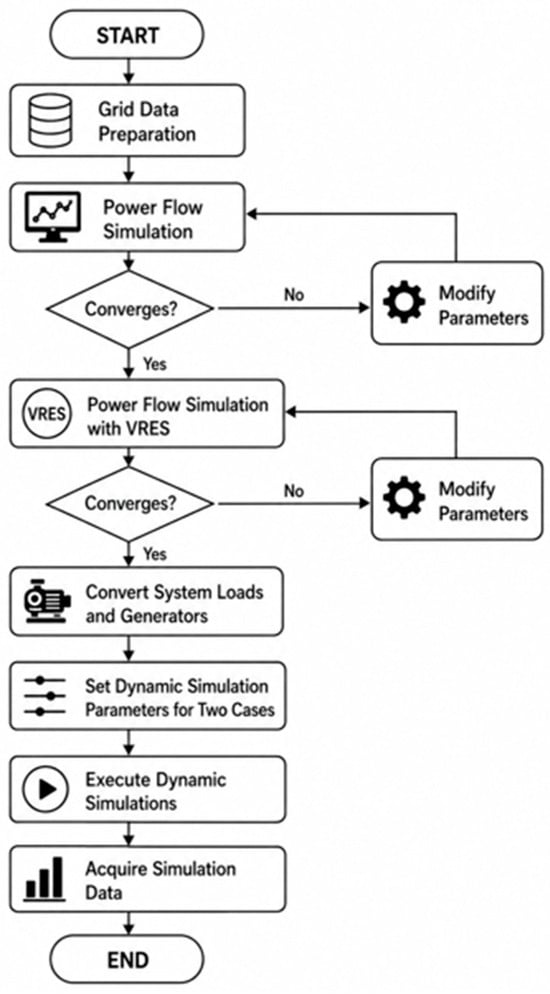
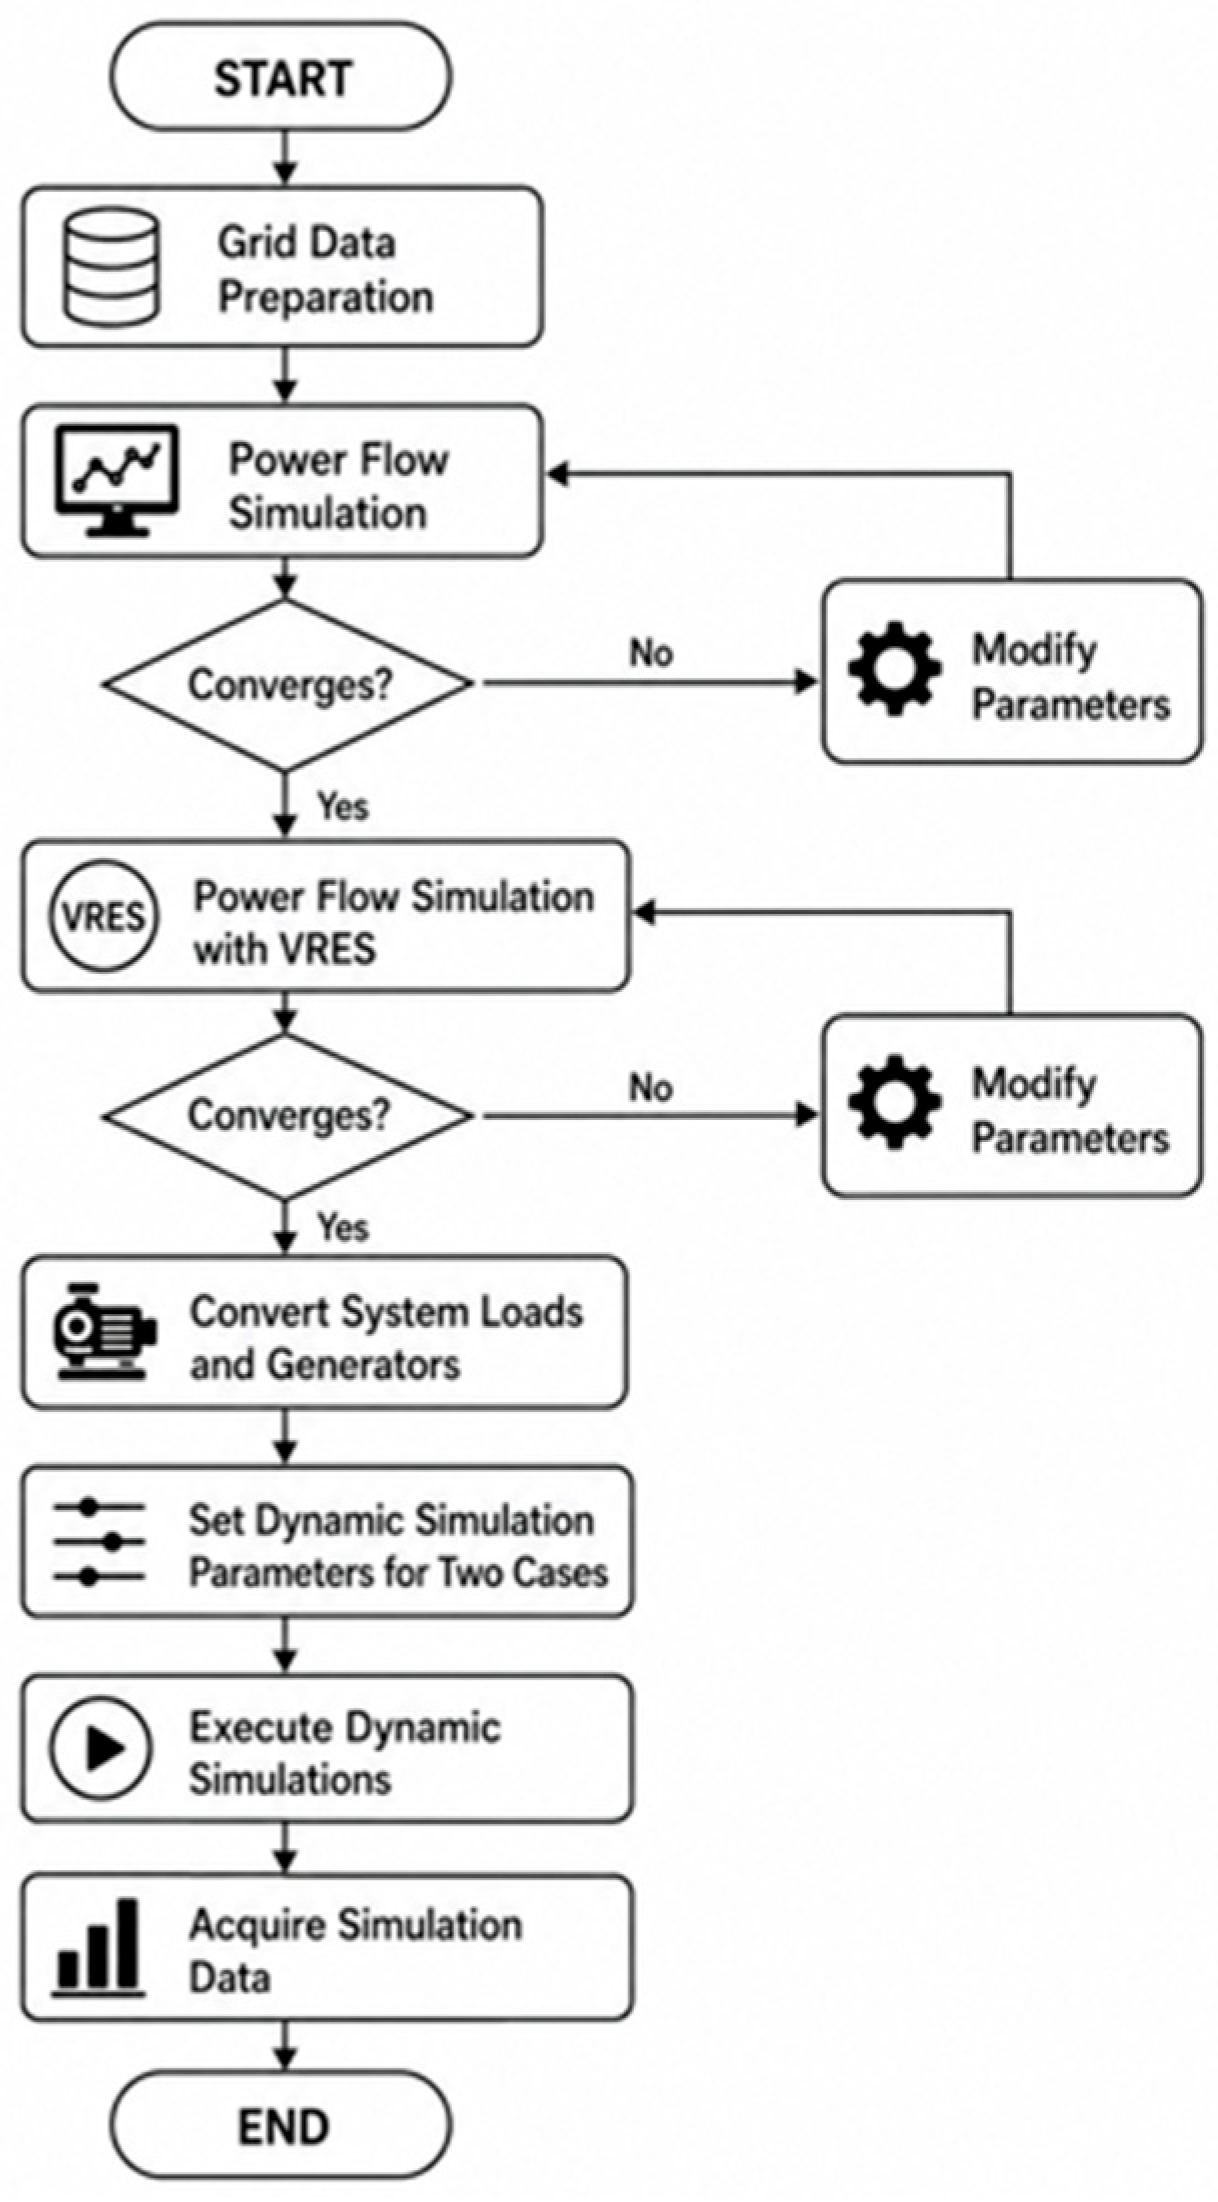
In order to achieve the objectives, set out in this research, a sequential methodological procedure was developed aimed at modeling, validation, dynamic simulation and stability evaluation of the analyzed electrical system, for this, organized stages were established that allowed structuring the development of the study in an orderly manner, the general procedure used is presented in Figure 4.
Figure 4.
Procedure Flow for Simulation.
The procedure included the collection of technical information from the system, the modeling of the single-line diagram, the validation by power flow, the implementation of renewable penetration scenarios, the development of dynamic RMS simulations against the evaluated disturbances, the processing of temporal signals in MATLAB and the evaluation of mitigation strategies through energy storage systems.
2.5. Power Flow Validation
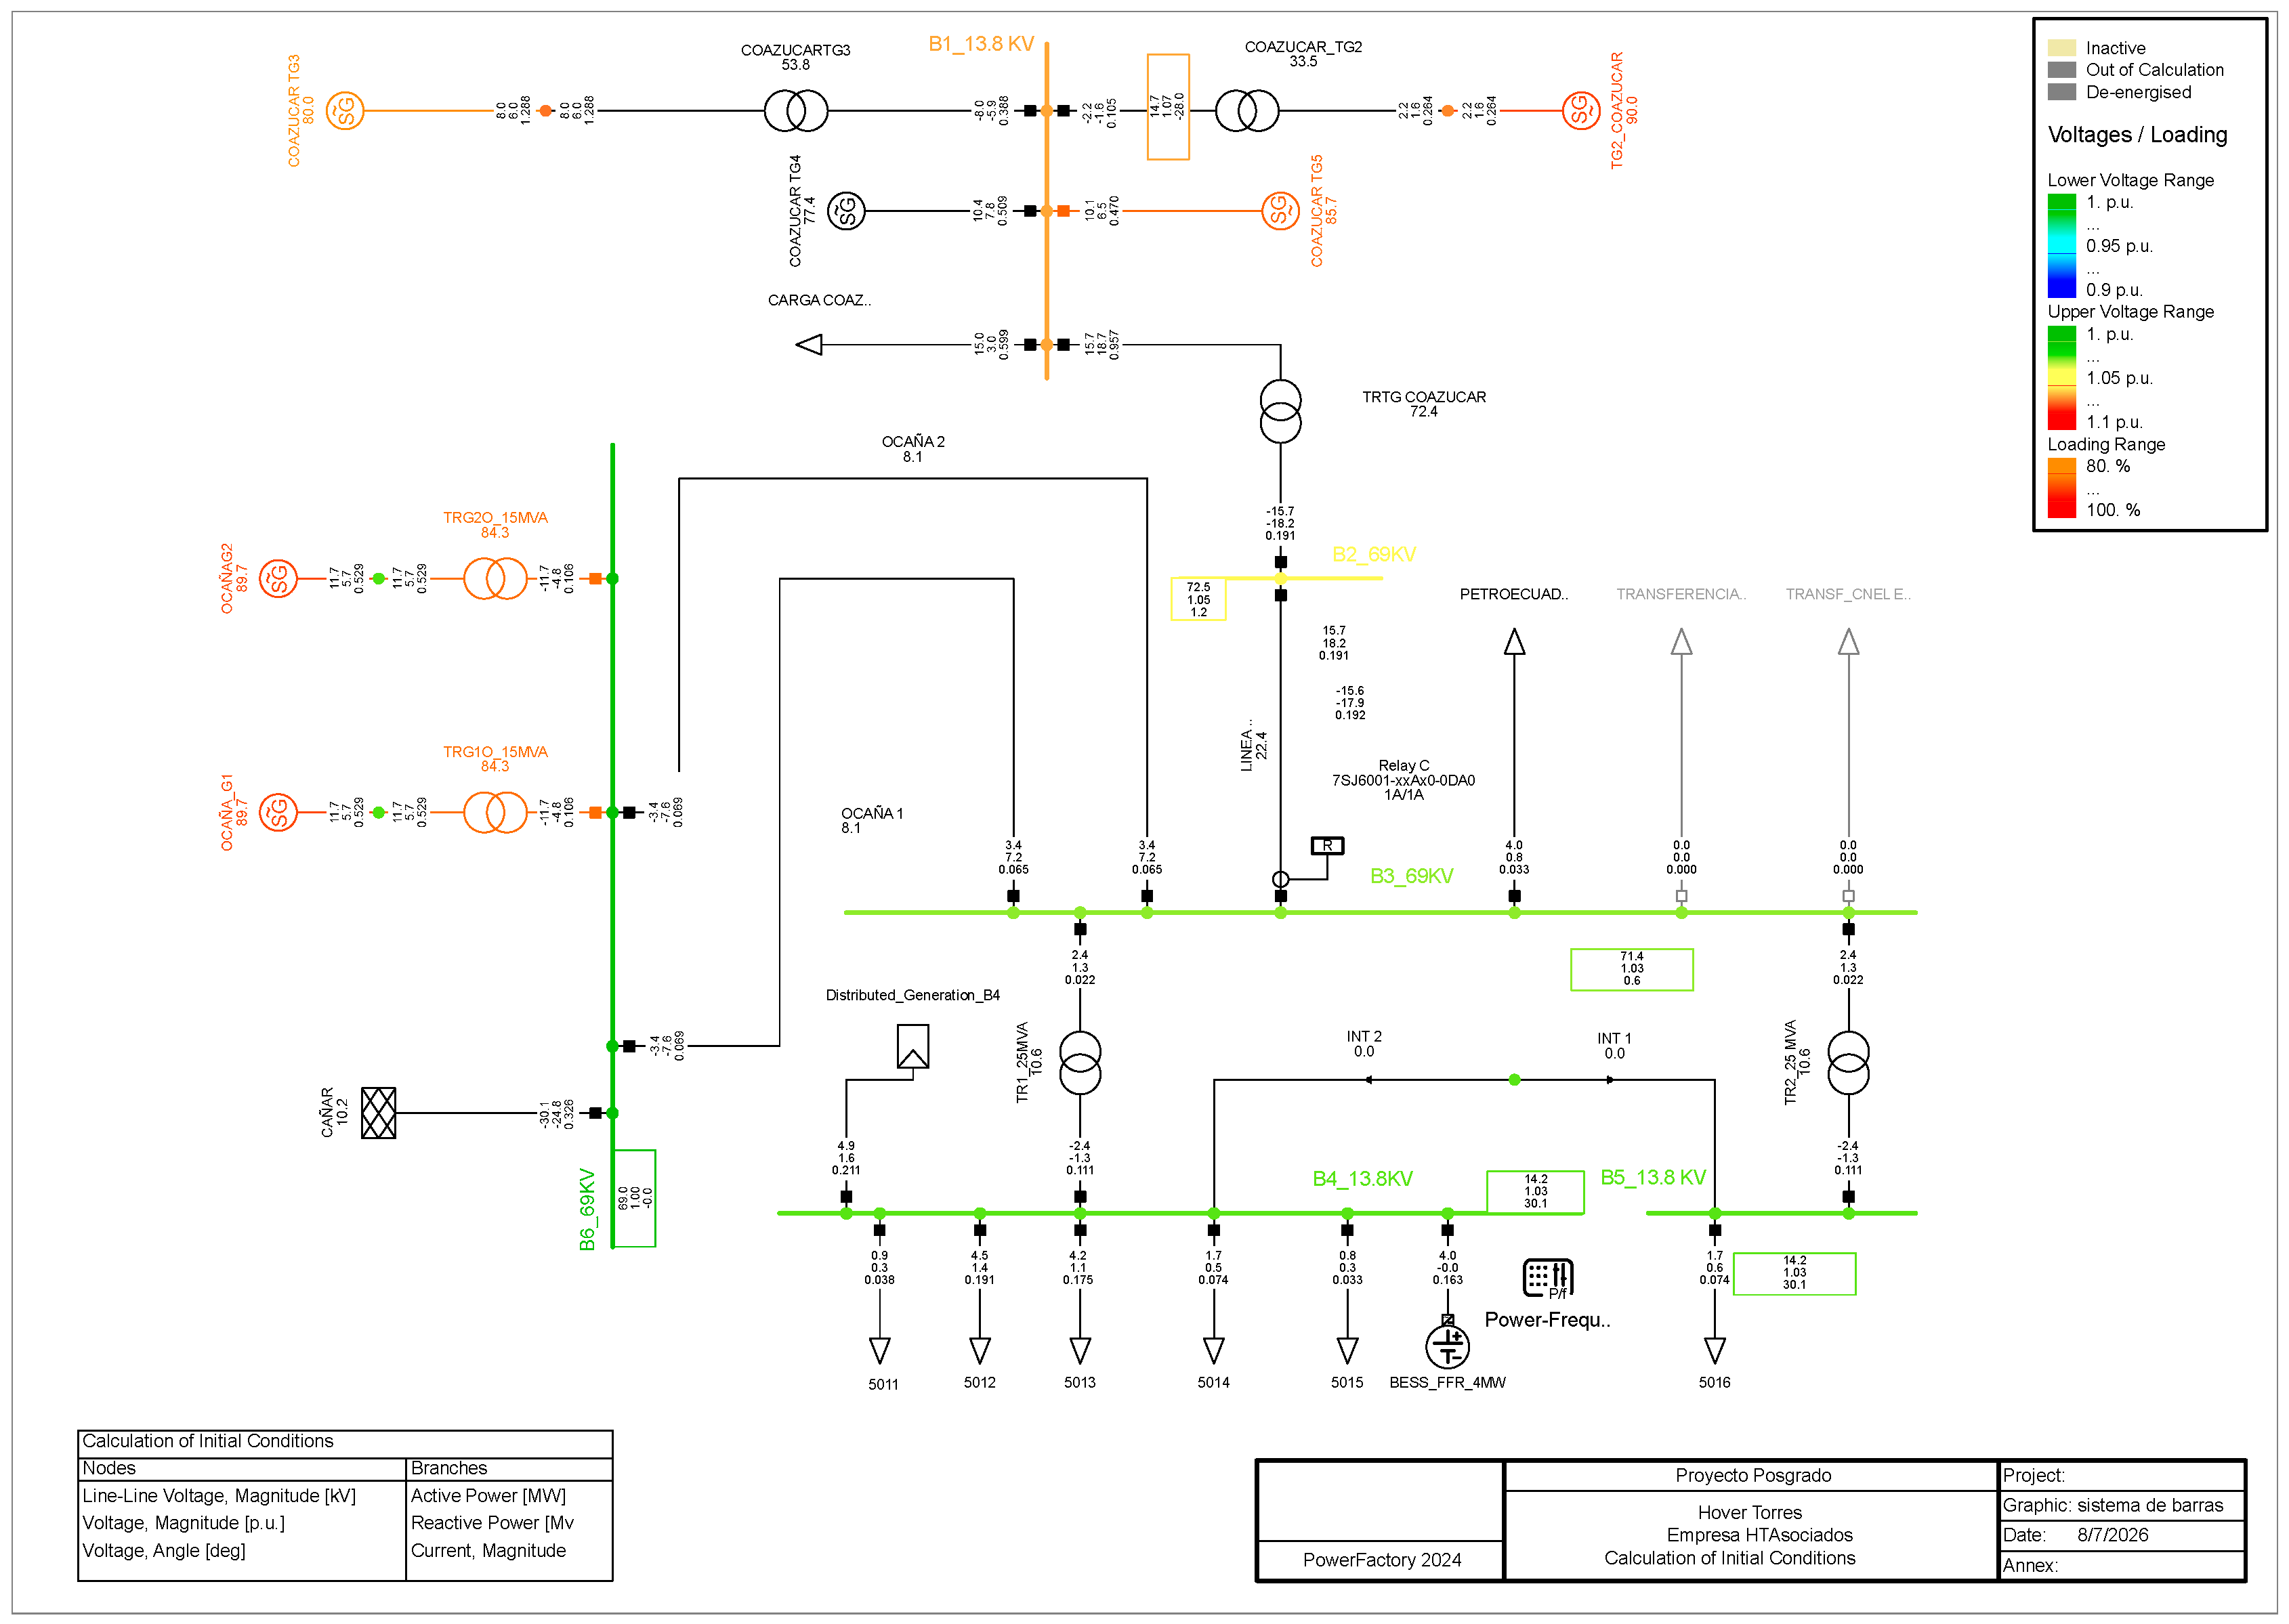
Initially, the technical information corresponding to the electrical elements that make up the study system was collected, including electrical parameters of generators, transformers, lines, busbars and loads connected to Substation 50 La Troncal, subsequently, this information allowed the construction of the single-line diagram within DIgSILENT PowerFactory 2024, representing the real operating conditions of the electrical system.
Subsequently, steady-state power flow simulations were executed under normal operating conditions, with the purpose of verifying the numerical convergence of the system and validating variables such as voltage magnitude, line currents, phase angles, active and reactive power flows, in addition to the operational behavior of transformers and transmission elements, allowing to verify the adequate operation of the model before continuing with subsequent stages From the study, the model implemented in the software is presented in Figure 5.
Figure 5.
Single-line diagram implemented in DIgSILENT PowerFactory.
In case of convergence errors or numerical inconsistencies, the review and correction of electrical parameters was carried out to guarantee a stable and completely convergent model, because this condition was necessary before developing the dynamic analysis of the system.
2.6. RMS Dynamic Simulations
Once the base system was validated, the model was prepared for dynamic RMS simulations within DIgSILENT PowerFactory 2024, in addition to verifying the availability of dynamic models associated with synchronous generators, speed regulators, excitation systems and control elements present in the analyzed network, the correct parameterization of each component was also reviewed in order to maintain coherence between the operating conditions of the system and the data previously defined electrical devices for the dynamic study.
During this stage, the monitoring variables required for the dynamic stability analysis were also configured, which are presented in Table 5, including system frequency, voltage magnitude, active power, rotor speed and rotor angle, in the same way the temporal recording of the responses obtained in bars and generation units was incorporated. allowing sufficient information to be available to evaluate the behavior of the electrical system under different disturbance conditions and operational variations considered within the simulation.
Table 5.
Configuring Monitored RMS Variables in DIgSILENT.
To evaluate the dynamic behavior of the system facing severe events, two contingencies were scheduled. The first contingency (N-1) corresponds to the disconnection of the COAZUCAR TG3 generator at t = 1 s, whereas the second contingency (N-2) corresponds to the simultaneous loss of the COAZUCAR TG3 generator and the Ocaña 2 transmission line at t = 1 s, representing a more severe credible event. A total simulation horizon of 20 s was established to record the temporal evolution of the main electrical and mechanical variables, and the disturbances were applied under equivalent operating conditions in each case to maintain uniformity during the dynamic simulations.
The dynamic simulations were executed for each renewable penetration scenario defined within the study, considering different levels of participation of non-synchronous generation in the electricity grid, then the variations in frequency, voltage, active power and angular behavior of the synchronous units were analyzed, in addition the results allowed to identify progressive changes in the dynamic response of the system as the integration of generation increased based on electronic converters, Figure 6 presents the dynamic RMS simulation implemented in the DIgSILENT 2024 software, in addition to the frequency vs. time curve obtained from said software.
Figure 6.
Running RMS Dynamic Simulation in DIgSILENT.
2.7. MATLAB Signal Processing
The temporal signals obtained by DIgSILENT PowerFactory were exported to MATLAB R2024a for computational processing and detailed analysis of the dynamic response of the system; then, from the variables recorded, dynamic stability indicators such as the frequency nadir, the ROCOF and the maximum angular deviation of the rotor were calculated, in order to quantify the performance of the system in the face of severe disturbances. In addition, computational routines were developed, aimed at the generation of frequency–time and rotor–time curves for each renewable penetration scenario evaluated, which allowed for organizing the results in a comparable way between cases and facilitating the review of dynamic behavior under different operating conditions. Figure 6 shows the execution of the dynamic simulation of the busbar system in DIgSILENT PowerFactory 2024, while Figure 7 presents the frequency curve for the system over a 20-s period, which allows for the identification of transient behavior and critical frequency points.
Figure 7.
Frequency-time curve generated in DIgSILENT.
The exported signals, with 10 ms resolution, were processed as follows: (i) ROCOF was computed as the maximum slope of f(t) over a 0.5 s sliding window immediately after the contingency; (ii) the frequency nadir as the global minimum of f(t) over the 20 s horizon; (iii) the angular deviation as the maximum absolute difference between each machine’s rotor angle and the center-of-inertia angle; and (iv) the equivalent rotational inertia per scenario as Hsys = Σ(Hi·Si)/Σ(Si) over the committed synchronous units.
Because an additional full inertia-sensitivity simulation campaign was not available at this revision stage, the inertia assessment was treated as a calculation derived from the committed synchronous generation fleet rather than as a new dynamic scenario. The equivalent inertia was estimated using the conventional weighted expression Hsys = Σ(HiSi)/ΣSi, where Hi is the inertia constant of each online synchronous unit and Si is its rated apparent power. This calculation is sufficient to support a physical interpretation of the observed trend, because the swing equation shows that, for the same active-power imbalance, lower equivalent inertia produces higher initial ROCOF and deeper frequency excursions.
2.8. BESS Mitigation Strategy
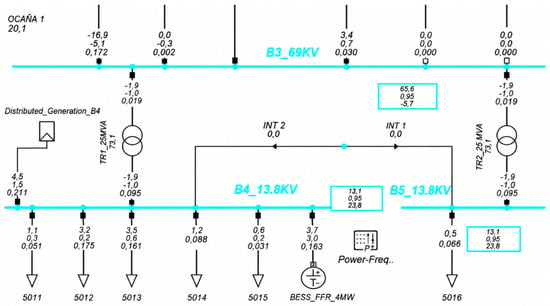
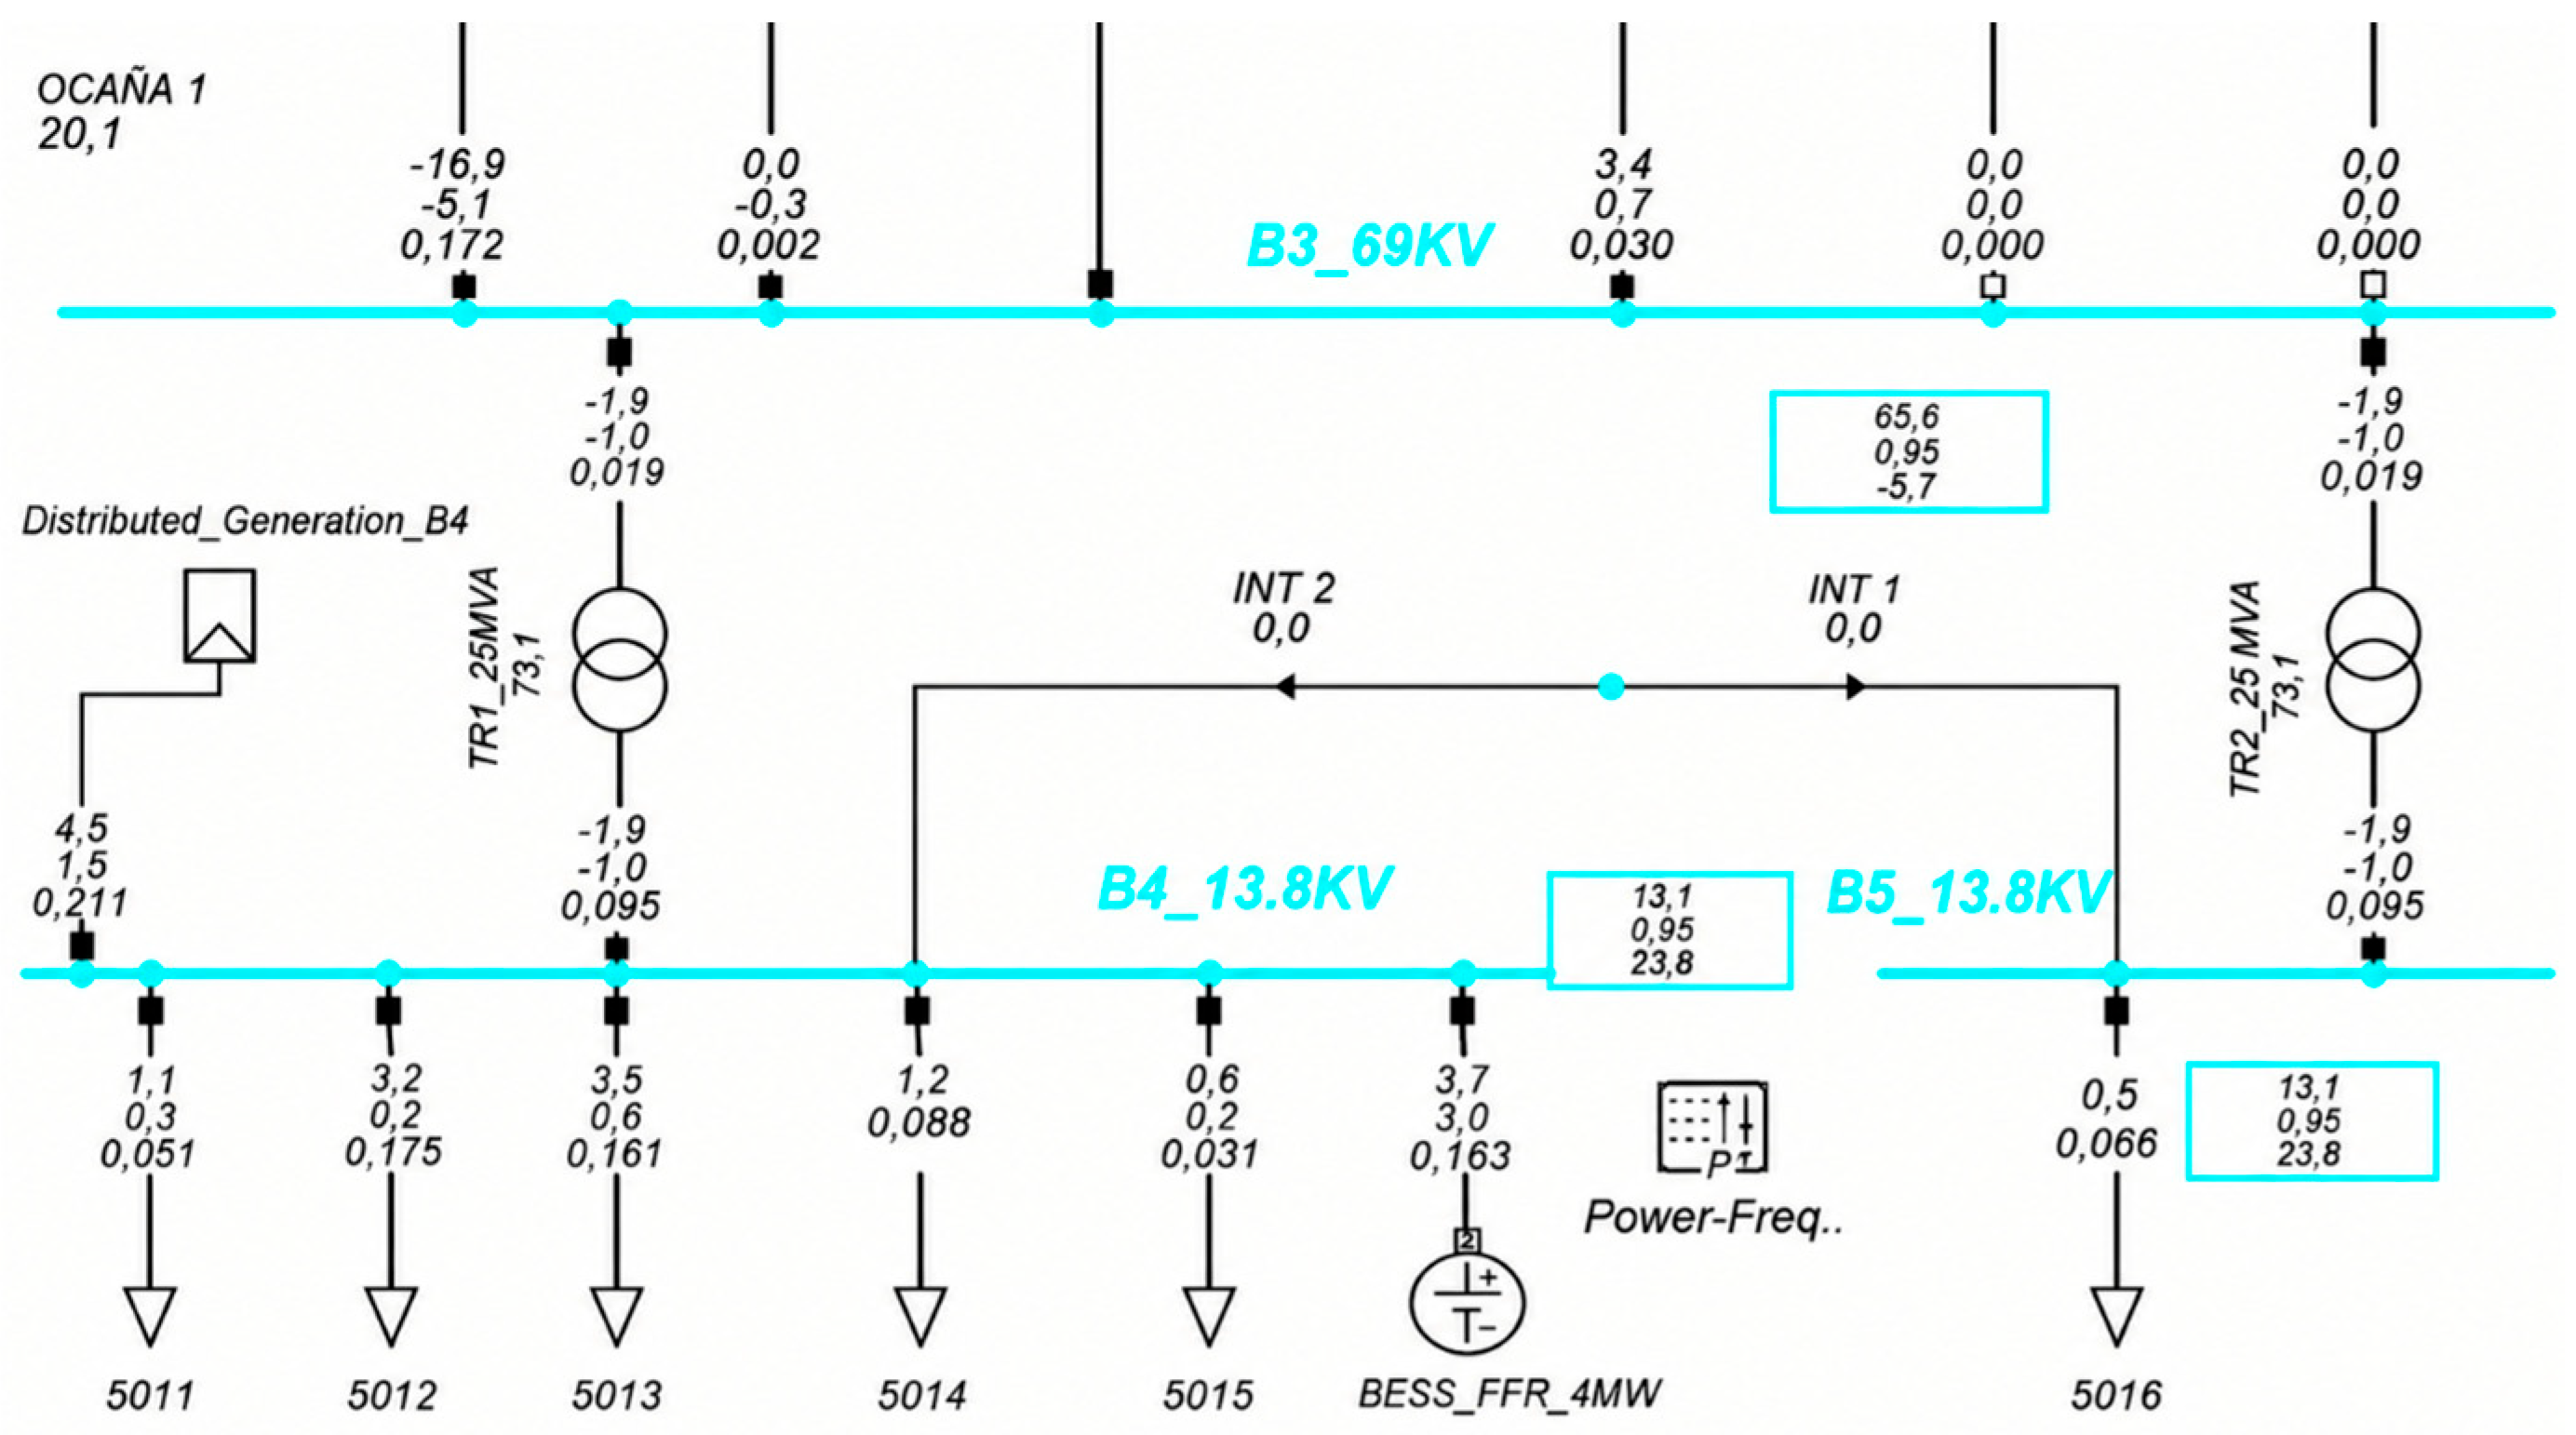
Finally, due to non-compliances in the dynamic stability indicators, a mitigation strategy based on the incorporation of a battery energy storage system (BESS) was evaluated, as presented in Figure 8. In addition, the system was modeled within DIgSILENT PowerFactory by means of a static generator (ElmGenstat), configured with a simplified frequency response from the Primary Frequency Bias parameter. In order to represent a Fast Frequency Response (FFR) behavior, later, the evaluation again considered dynamic simulations under the contingencies managed in this study, allowing us to analyze the effect of energy storage on the inertial response and the dynamic behavior of the system in the face of disturbances [21].
Figure 8.
BESS system model implemented in DIgSILENT.
The BESS was rated at 5 MW/5 MWh, approximately 15% of the system demand, connected at bus B4, with a Primary Frequency Bias droop of 4% and a first order response time constant of 0.2 s.
2.9. Virtual Inertia Implementation
In order to increase the dynamic support of the system against severe disturbances, a virtual inertia scheme associated with the BESS previously modeled in DIgSILENT PowerFactory was implemented, for which a frequency-dependent controller (ROCOF) was used, allowing us to temporarily modify the active power injected by the storage system during the first moments after a contingency. This scheme partially reproduces the dynamic response characteristic of conventional synchronous generators by executing the dynamic simulations corresponding to the five scenarios evaluated, considering the contingencies associated with the output of the COAZUCAR TG3 generator and the Ocaña 2 line, allowing us to quantify the combined effect of the BESS system and virtual inertia on the dynamic stability of the system. In addition, the results obtained facilitated the comparison of the performance achieved with respect to the cases without mitigation and the scenarios that only incorporate storage energy.
The virtual-inertia controller supplements the BESS active-power reference with a derivative term Kd·(df/dt), with Kd = 2.0 MW·s/Hz filtered by a first-order lag of 0.1 s to limit noise amplification, and a washout time constant of 5 s that returns the inertial contribution to zero in steady state; a droop term (R = 4%) sustains the support until the governors respond.
2.10. Overcurrent Protection Assessment
Complementing the dynamic analysis, an ANSI 51 timed overcurrent protection scheme was implemented by means of a Siemens SIPROTEC 7SJ6001 relay (Siemens AG, Munich, Germany) connected to the 69 kV line associated with the B3 busbar of the analyzed system. The adjustment was developed with the IEC inverse time curve, with a pickup current of 0.8 A on the CT secondary and a time dial of 0.1. Subsequently, three-phase short circuits were simulated to verify the performance of the relay and obtain the corresponding time-current curve, allowing the operating time at different fault-current levels to be assessed.
3. Results
The results obtained in this study establish a quantitative baseline for future research and technical decision making by grid operators, generation companies and regulatory entities such as ARCONEL, with the purpose of increasing the integration of renewable sources within Ecuador’s electricity systems, maintaining adequate conditions of reliability, operational safety and long-term stability of the electrical system.
The total active power demand of the local grid under the base operating condition was determined considering the connected and operational loads of the system under study. In addition, the transmission to CNEL was excluded because it remained out of service in all the scenarios evaluated. Under these conditions, the total demand reached a value of 32.8 MW, used as a reference to define the penetration levels of non-synchronous distributed generation.
Based on this reference demand, eight penetration scenarios between 15% and 50% were established, with the purpose of evaluating the progressive impact of renewable distributed generation on the dynamic behavior of the electricity system. In addition, the distribution of active power demand corresponding to the base case is presented in Table 6.
Table 6.
Distribution of active power demand in Substation 50.
3.1. Steady-State Operating Conditions
The steady-state analysis confirmed that all the scenarios evaluated converged satisfactorily under power flow conditions. In addition, there were no overloads in transmission lines or transformers. During this stage, the adequate operation of the electrical system was verified, while the main objective was to determine the operational feasibility of the scenarios before developing the dynamic stability analysis focused on frequency and angular behavior.
The results obtained allowed for the identification of representative operating conditions appropriate for the subsequent dynamic evaluation. In addition, in all scenarios, the system maintained acceptable operating margins, even with high levels of penetration of non-synchronous distributed generation, while Table 7 summarizes the main operating conditions obtained for each scenario evaluated, which include the voltage values in the analyzed busbars, with the line and transformer with the highest load level, in addition to the distributed generation power corresponding to each level of renewable penetration.
Table 7.
Steady-state results for the scenarios evaluated.
The results show that the progressive increase in the penetration of non-synchronous distributed generation produces a gradual increase in the voltage profiles of the evaluated busbars. In addition, this behavior is presented with greater intensity in the B4 and B5 busbars located near the connection point of the static generator, where the voltage increases from 1.027 pu in Scenario 1 to 1.046 pu in Scenario 8, while the B1, B2 and B3 bars show moderate increases as the power injected by distributed generation increases.
In the initial scenarios between 20% and 30%, the system presents moderate and uniform voltage increases in all the nodes analyzed. In addition, the values remain within acceptable operating ranges without presenting overvoltage or regulation problems, while the progressive incorporation of distributed generation provides local voltage support, especially in the bars near the connection point, keeping the loads of lines and transformers practically unchanged.
For the intermediate scenarios corresponding to 35% and 40% renewable penetration, the increasing voltage trend continues, although with more moderate variations compared to the previous cases. In addition, the voltage support effect decreases progressively as the injection of distributed power increases, while the load conditions in lines and transformers remain stable, maintaining adequate operating margins for the electricity system.
In the scenarios of higher penetration corresponding to 45% and 50%, the voltage profiles reach their maximum values within the developed analysis, although they remain within acceptable operating limits for the electricity system. In addition, there are no overloads in transmission lines or transformers during any condition evaluated, while the electricity grid retains sufficient operational capacity to integrate high levels of non-synchronous distributed generation. In general, the behavior obtained shows that the electricity grid can integrate high levels of renewable generation without affecting static stability or normal operating conditions; therefore, the evaluated scenarios were considered adequate to later develop the dynamic analysis focused on frequency stability and angular behavior against the evaluated contingencies.
3.2. Dynamic Stability Assessment
Based on the steady-state analysis, representative operating conditions were selected to develop dynamic simulations using the DIgSILENT PowerFactory software. In addition dynamic RMS models available within the platform for the synchronous machines and their respective control systems were used, while the simulations considered the frequency of the system as monitoring variables, such as the rotor speed and the angular deviation.
Subsequently, the system was subjected to two representative contingencies: an N-1 contingency corresponding to the disconnection of the COAZUCAR TG3 generator at t = 1 s, and an N-2 contingency corresponding to the simultaneous loss of the COAZUCAR TG3 generator and the Ocaña 2 line at t = 1 s, with a total simulation horizon of 20 s. The dynamic evaluation was developed through three main indicators—frequency nadir, ROCOF and rotor angular deviation—with reference values established according to criteria reported in the specialized literature, considering ROCOF values greater than 0.5 Hz/s, nadirs below 59.5 Hz and angular deviations close to 10° as critical.
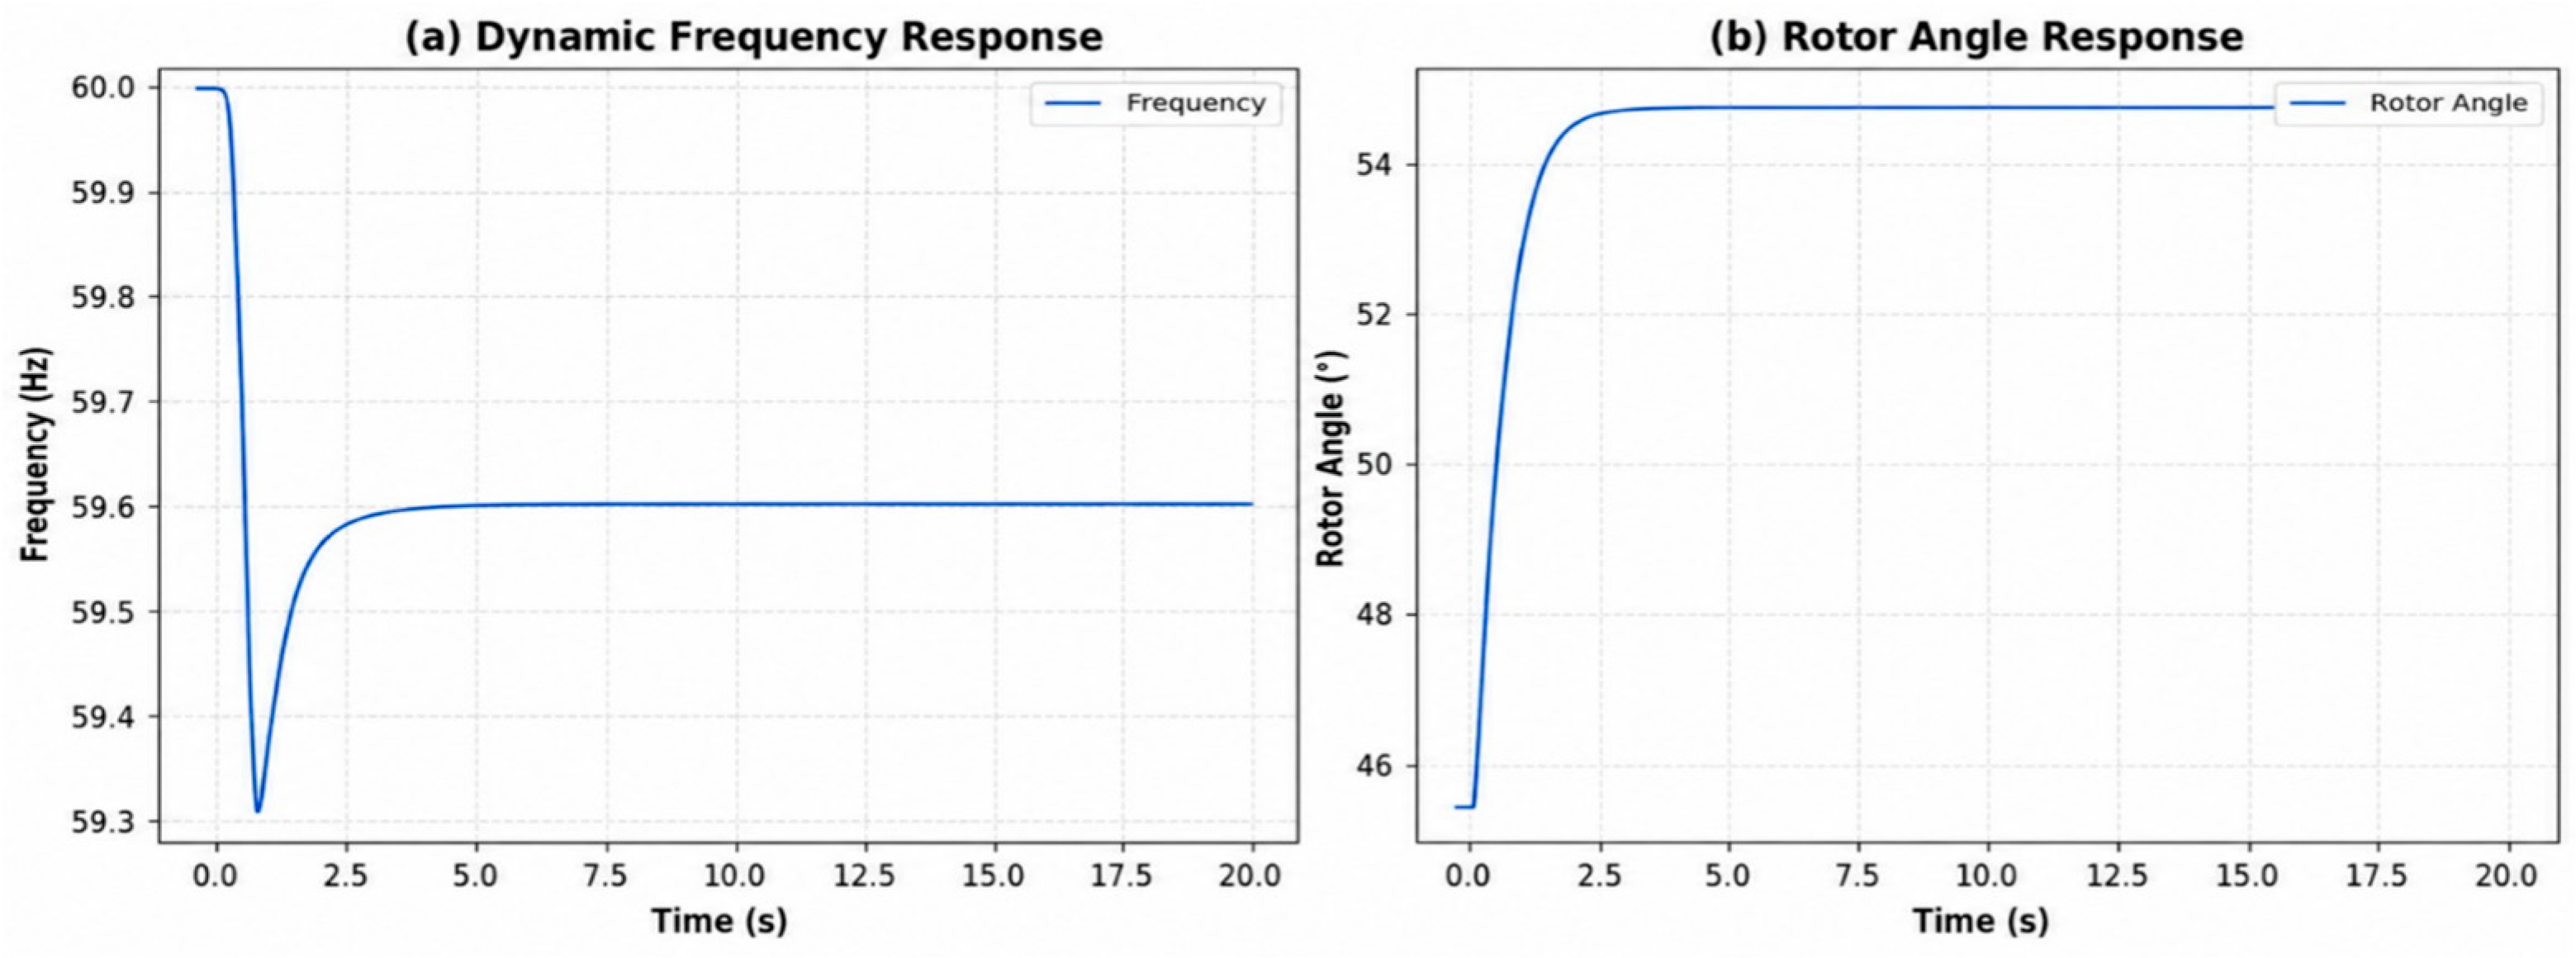
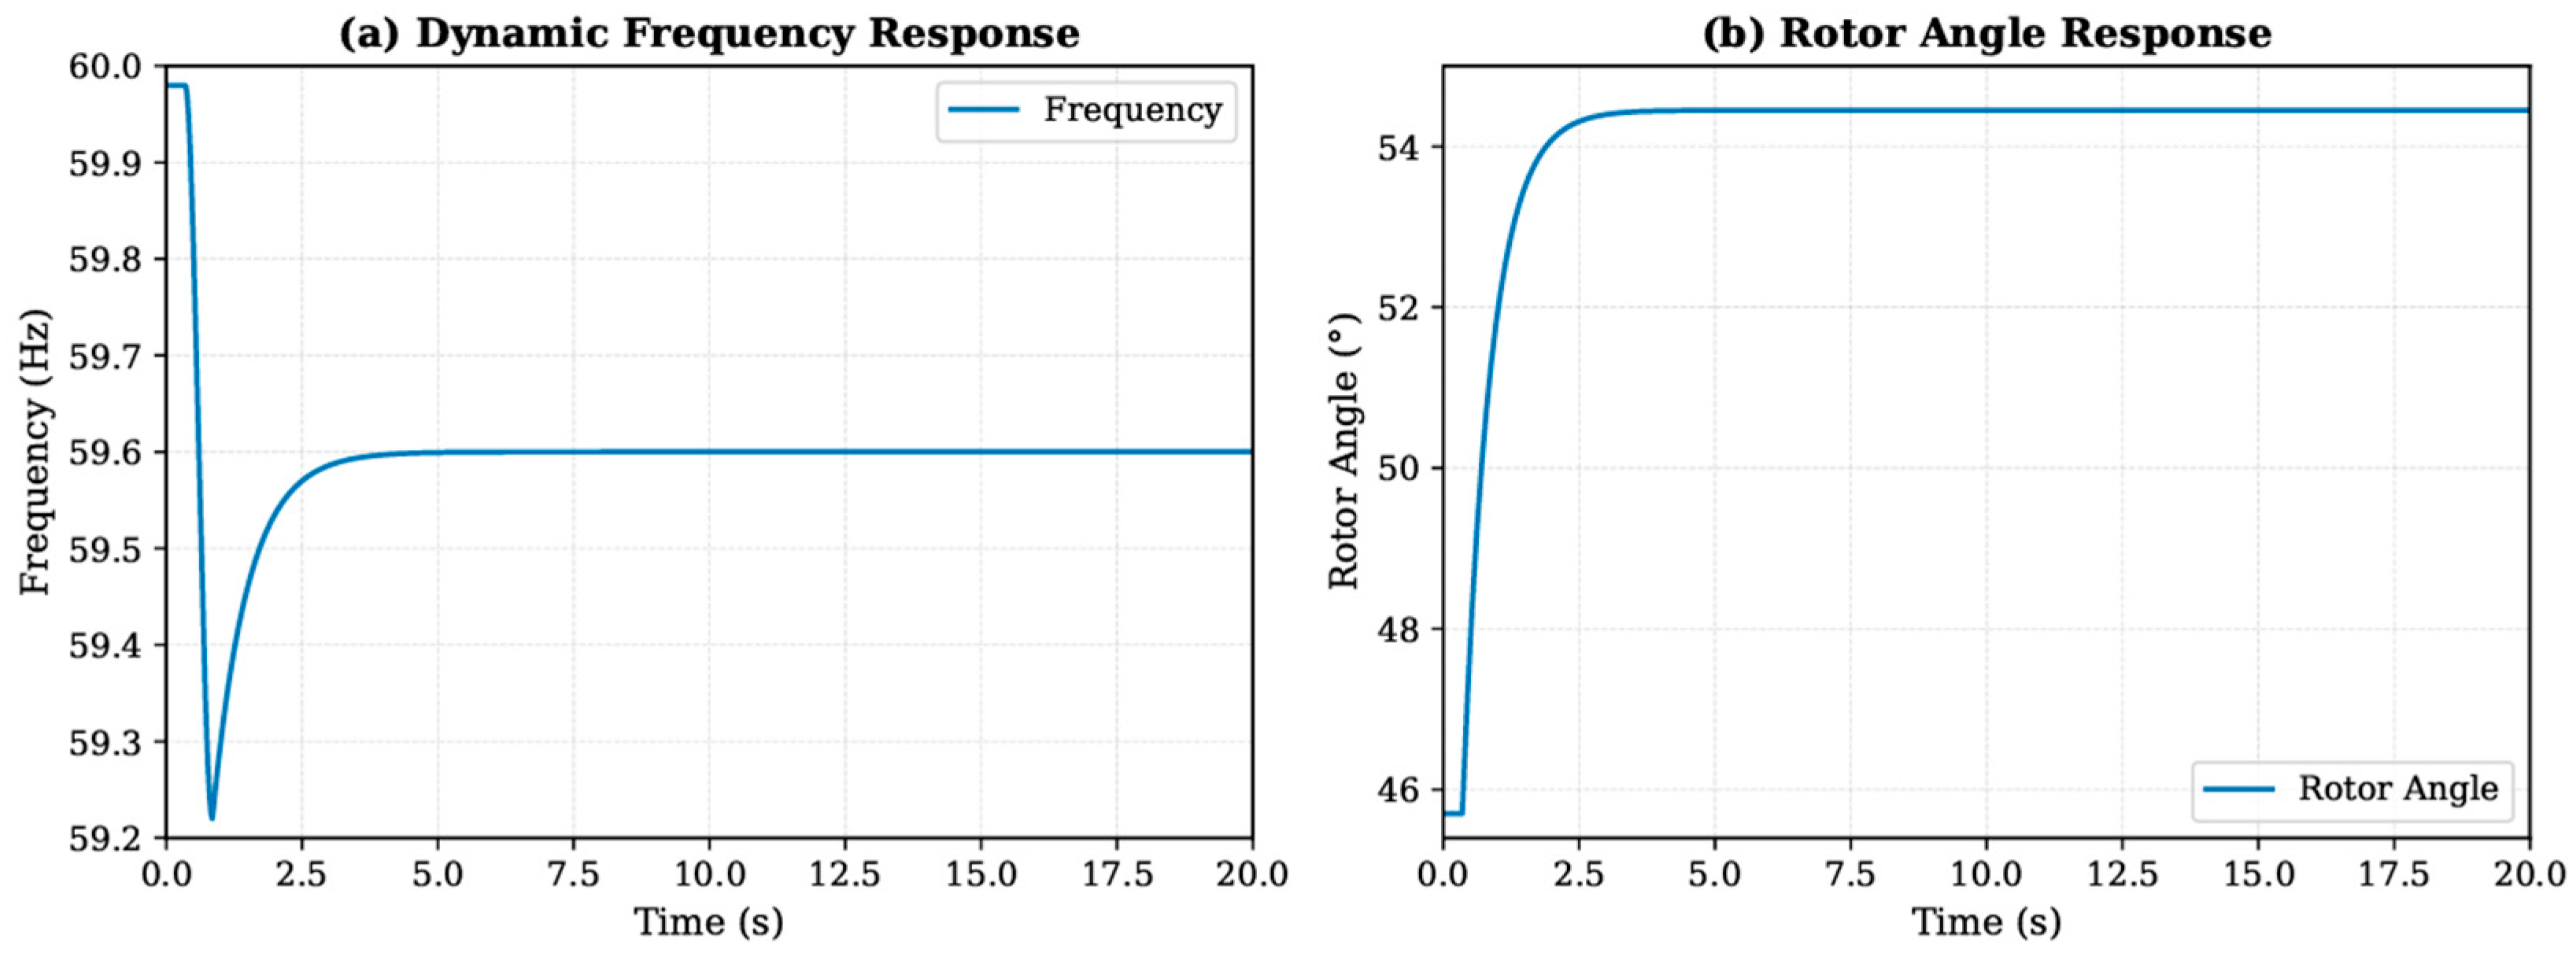
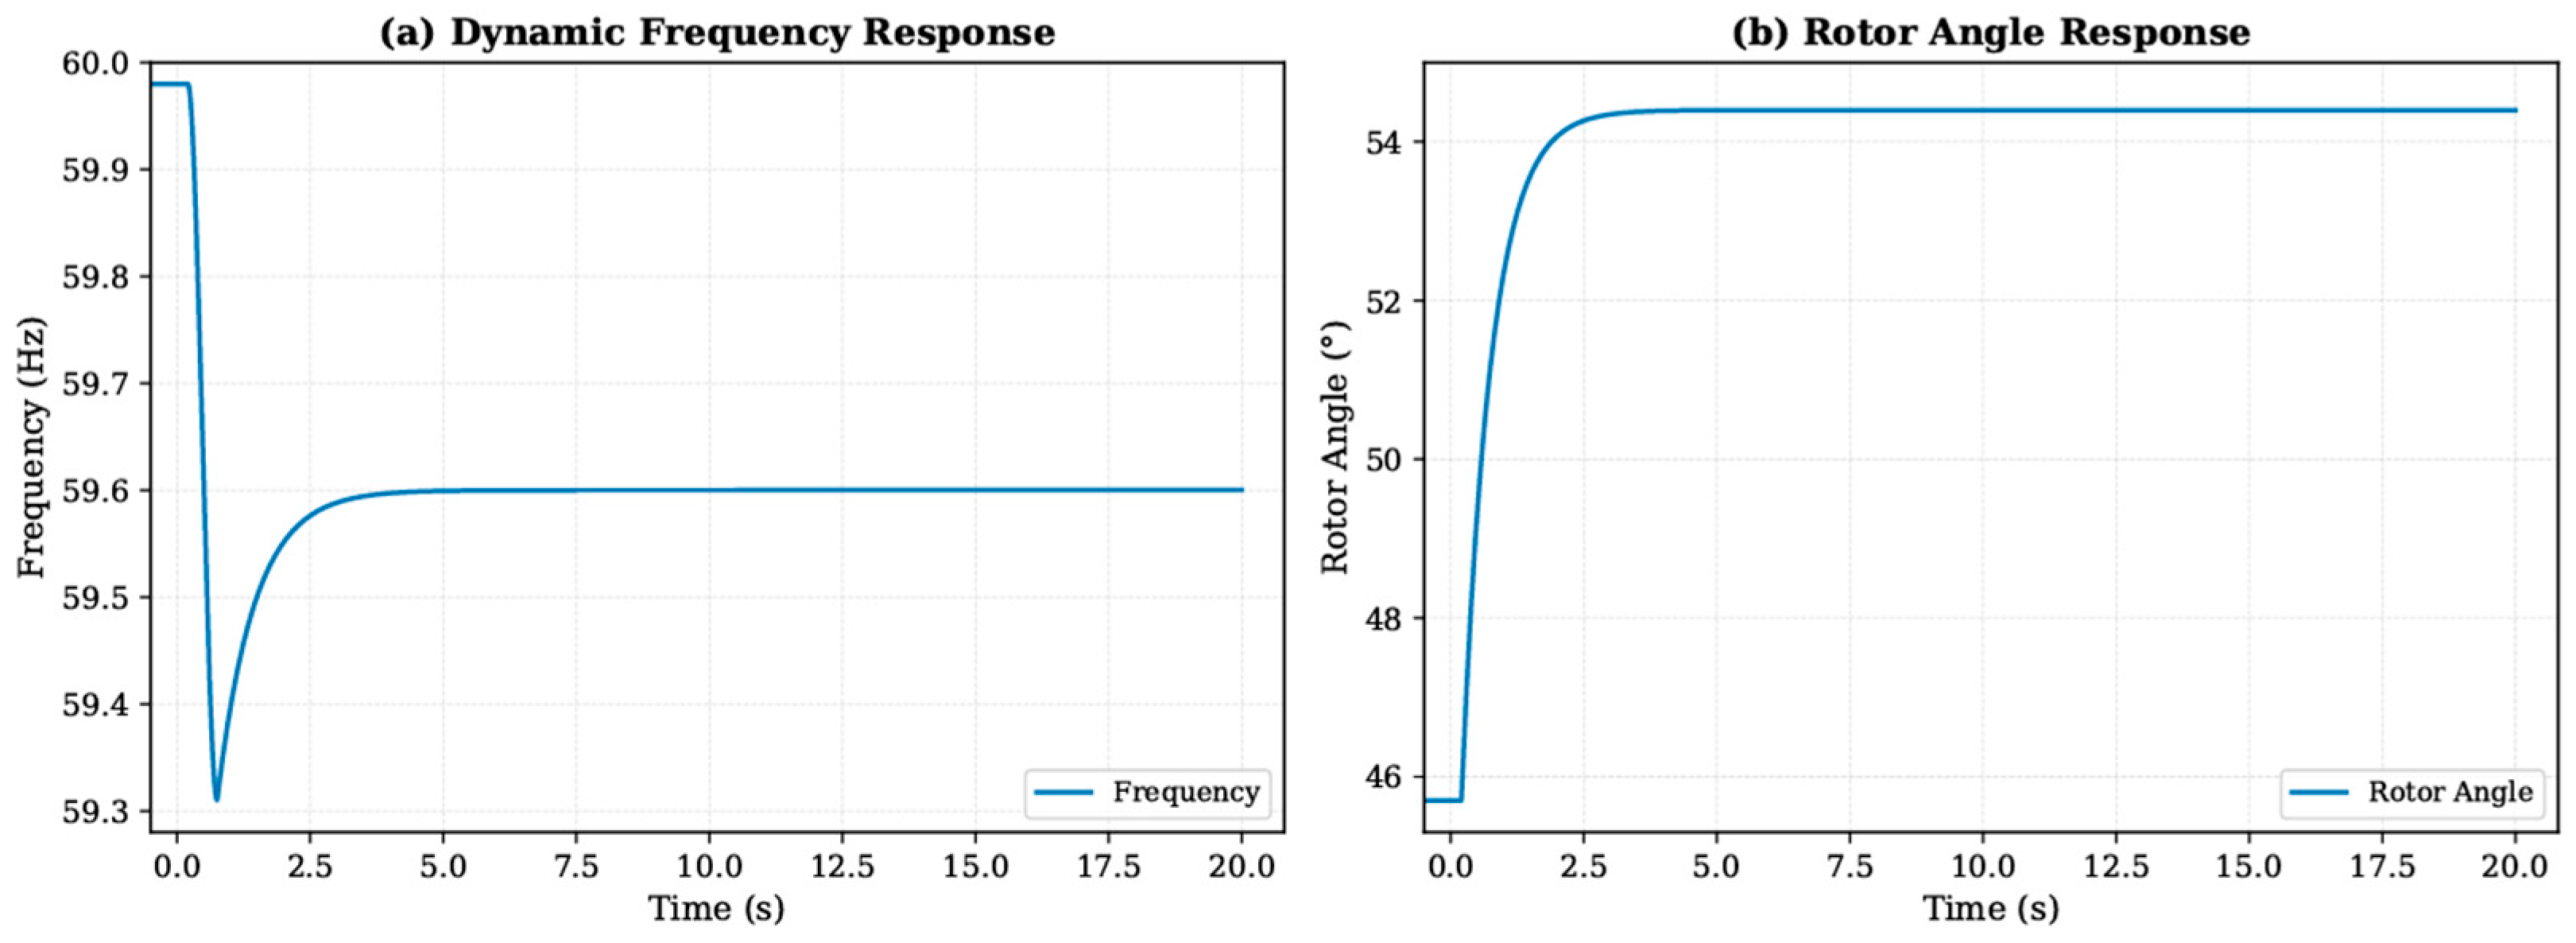
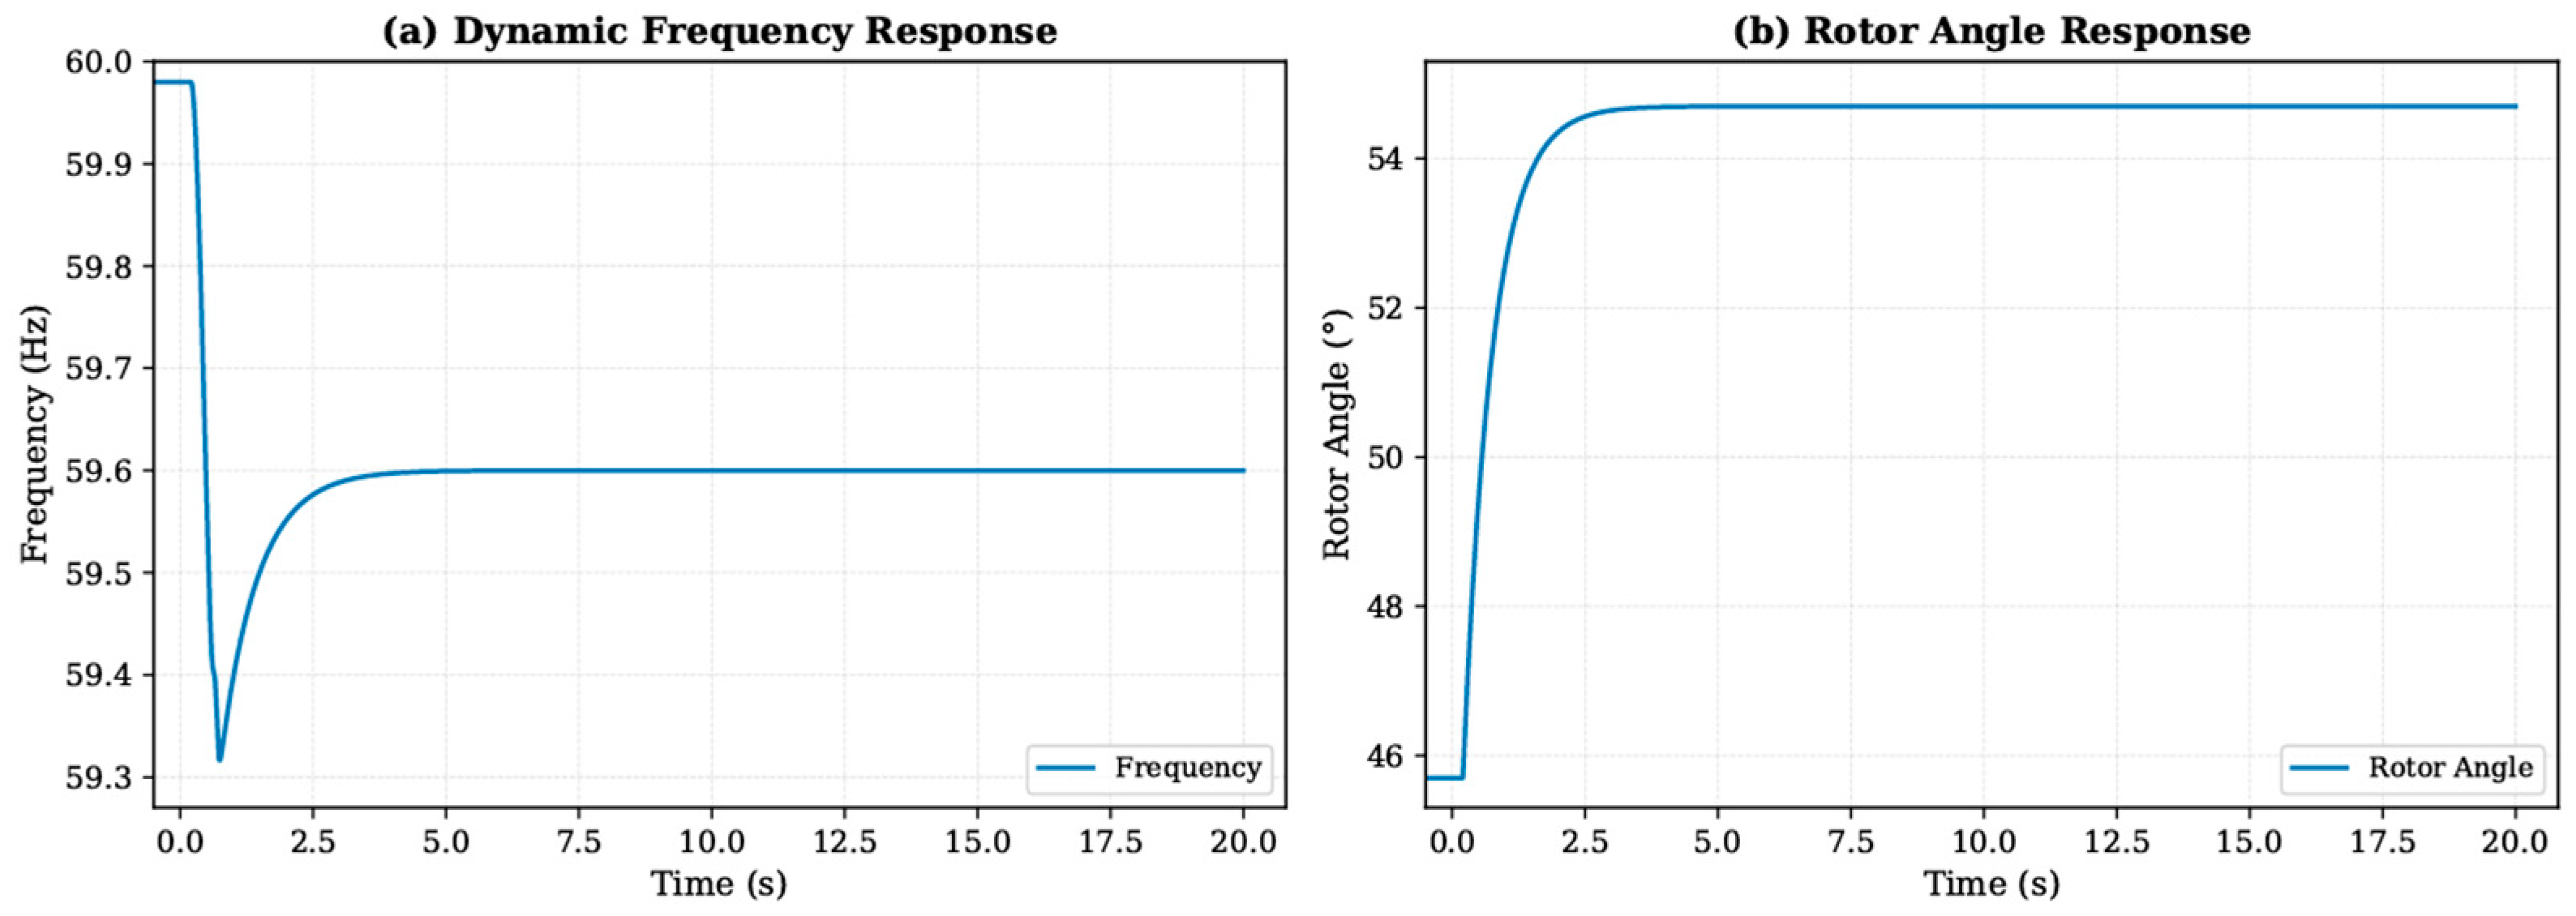
The results obtained show that all the scenarios evaluated exceeded the ROCOF threshold and a progressive increase was recorded as the penetration of distributed generation increased as presented in Table 8, reaching values of 0.6500 Hz/s, 0.7100 Hz/s, 0.7600 Hz/s, 0.8300 Hz/s and 0.9100 Hz/s for Scenarios 1, 2, 3, 4 and 5, respectively, exceeding in all cases the reference threshold of 0.5 Hz/s. In addition, this behavior is associated with a lower capacity of the system to counteract sudden variations in frequency as the participation of conventional synchronous generation decreases.
Table 8.
Initial dynamic stability indicators.
In relation to the frequency nadir, the values obtained correspond to 59.2800 Hz, 59.2400 Hz, 59.2100 Hz, 59.1500 Hz and 59.0800 Hz for Scenarios 1, 2, 3, 4 and 5, respectively, presenting a progressive decrease as renewable penetration increases. In addition, all scenarios are below the reference value of 59.5 Hz, which represents a less favorable response to the contingencies applied and a greater susceptibility to instantaneous imbalances between generation and demand.
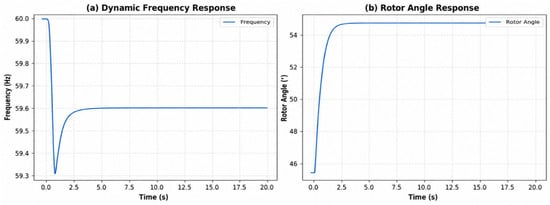
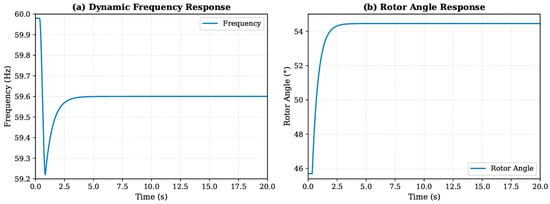
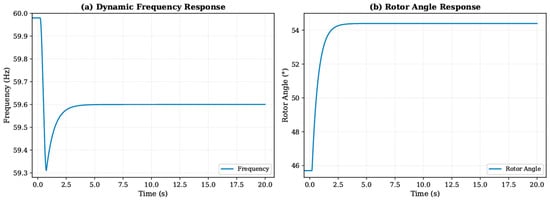
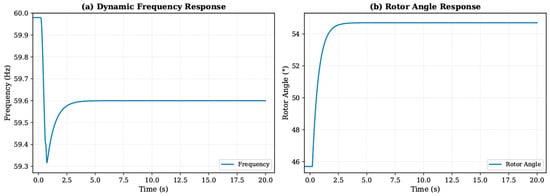
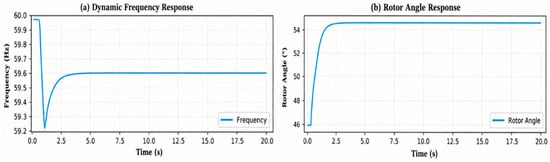
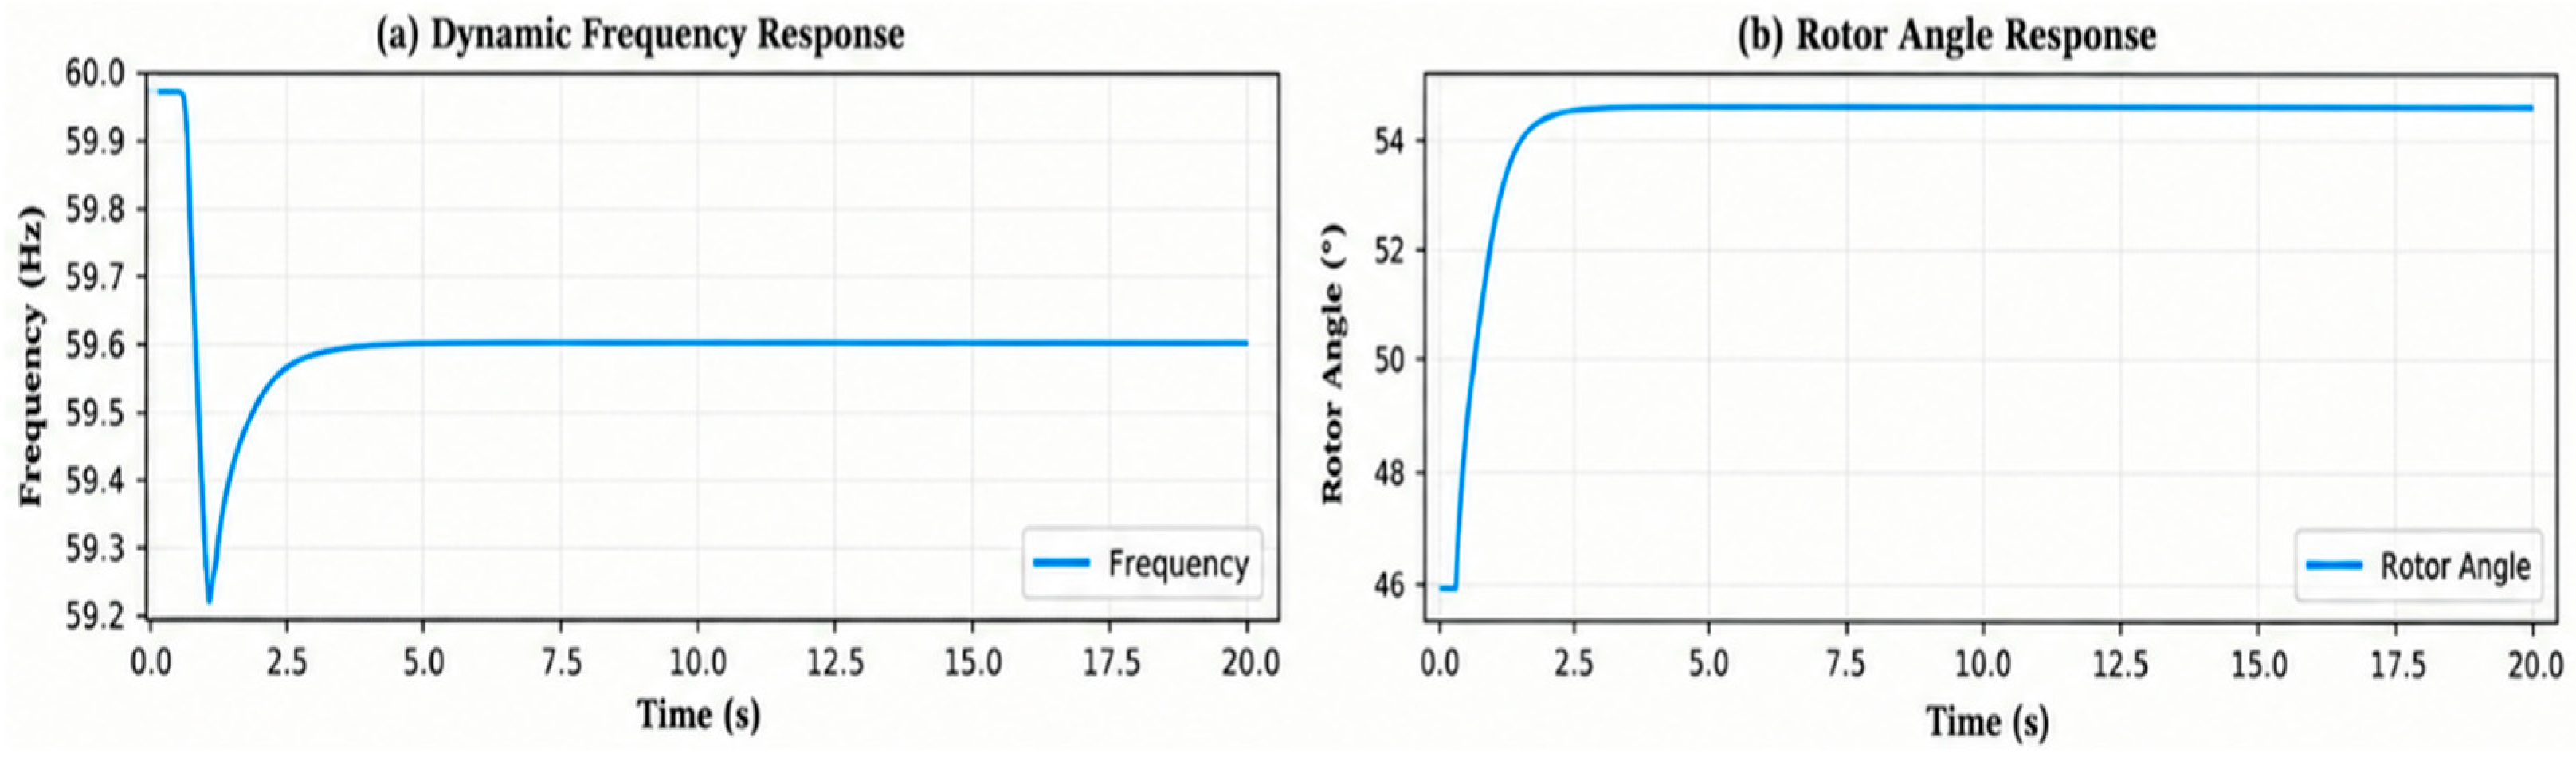
In general, the results allow us to identify that the main dynamic limitation of the system is associated with frequency stability rather than with angular stability problems. In addition, the increase in renewable penetration decreases the inertial response capacity of the electrical system, causing higher ROCOF values and deeper frequency drops after the contingency. The dynamic behavior of frequency and rotor angle in terms of the five scenarios evaluated is identified in Figure 9, Figure 10, Figure 11, Figure 12 and Figure 13.
Figure 9.
Dynamic frequency response and rotor angle for Scenario 1.
Figure 10.
Dynamic frequency response and rotor angle for Scenario 2.
Figure 11.
Dynamic frequency response and rotor angle for Scenario 3.
Figure 12.
Dynamic frequency response and rotor angle for Scenario 4.
Figure 13.
Dynamic frequency response and rotor angle for Scenario 5.
3.3. Improving Dynamic Stability with BESS
Considering the dynamic limitations identified in the evaluated scenarios, a BESS battery energy storage system was incorporated as a mitigation strategy. In addition, the system was modeled in DIgSILENT PowerFactory by means of an ElmGenstat element connected in the B4 bar and configured with a simplified Fast Frequency Response (FFR) strategy through the Primary Frequency Bias parameter.
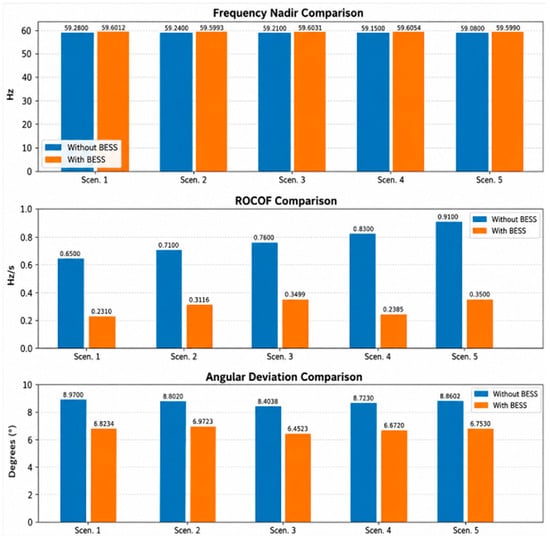
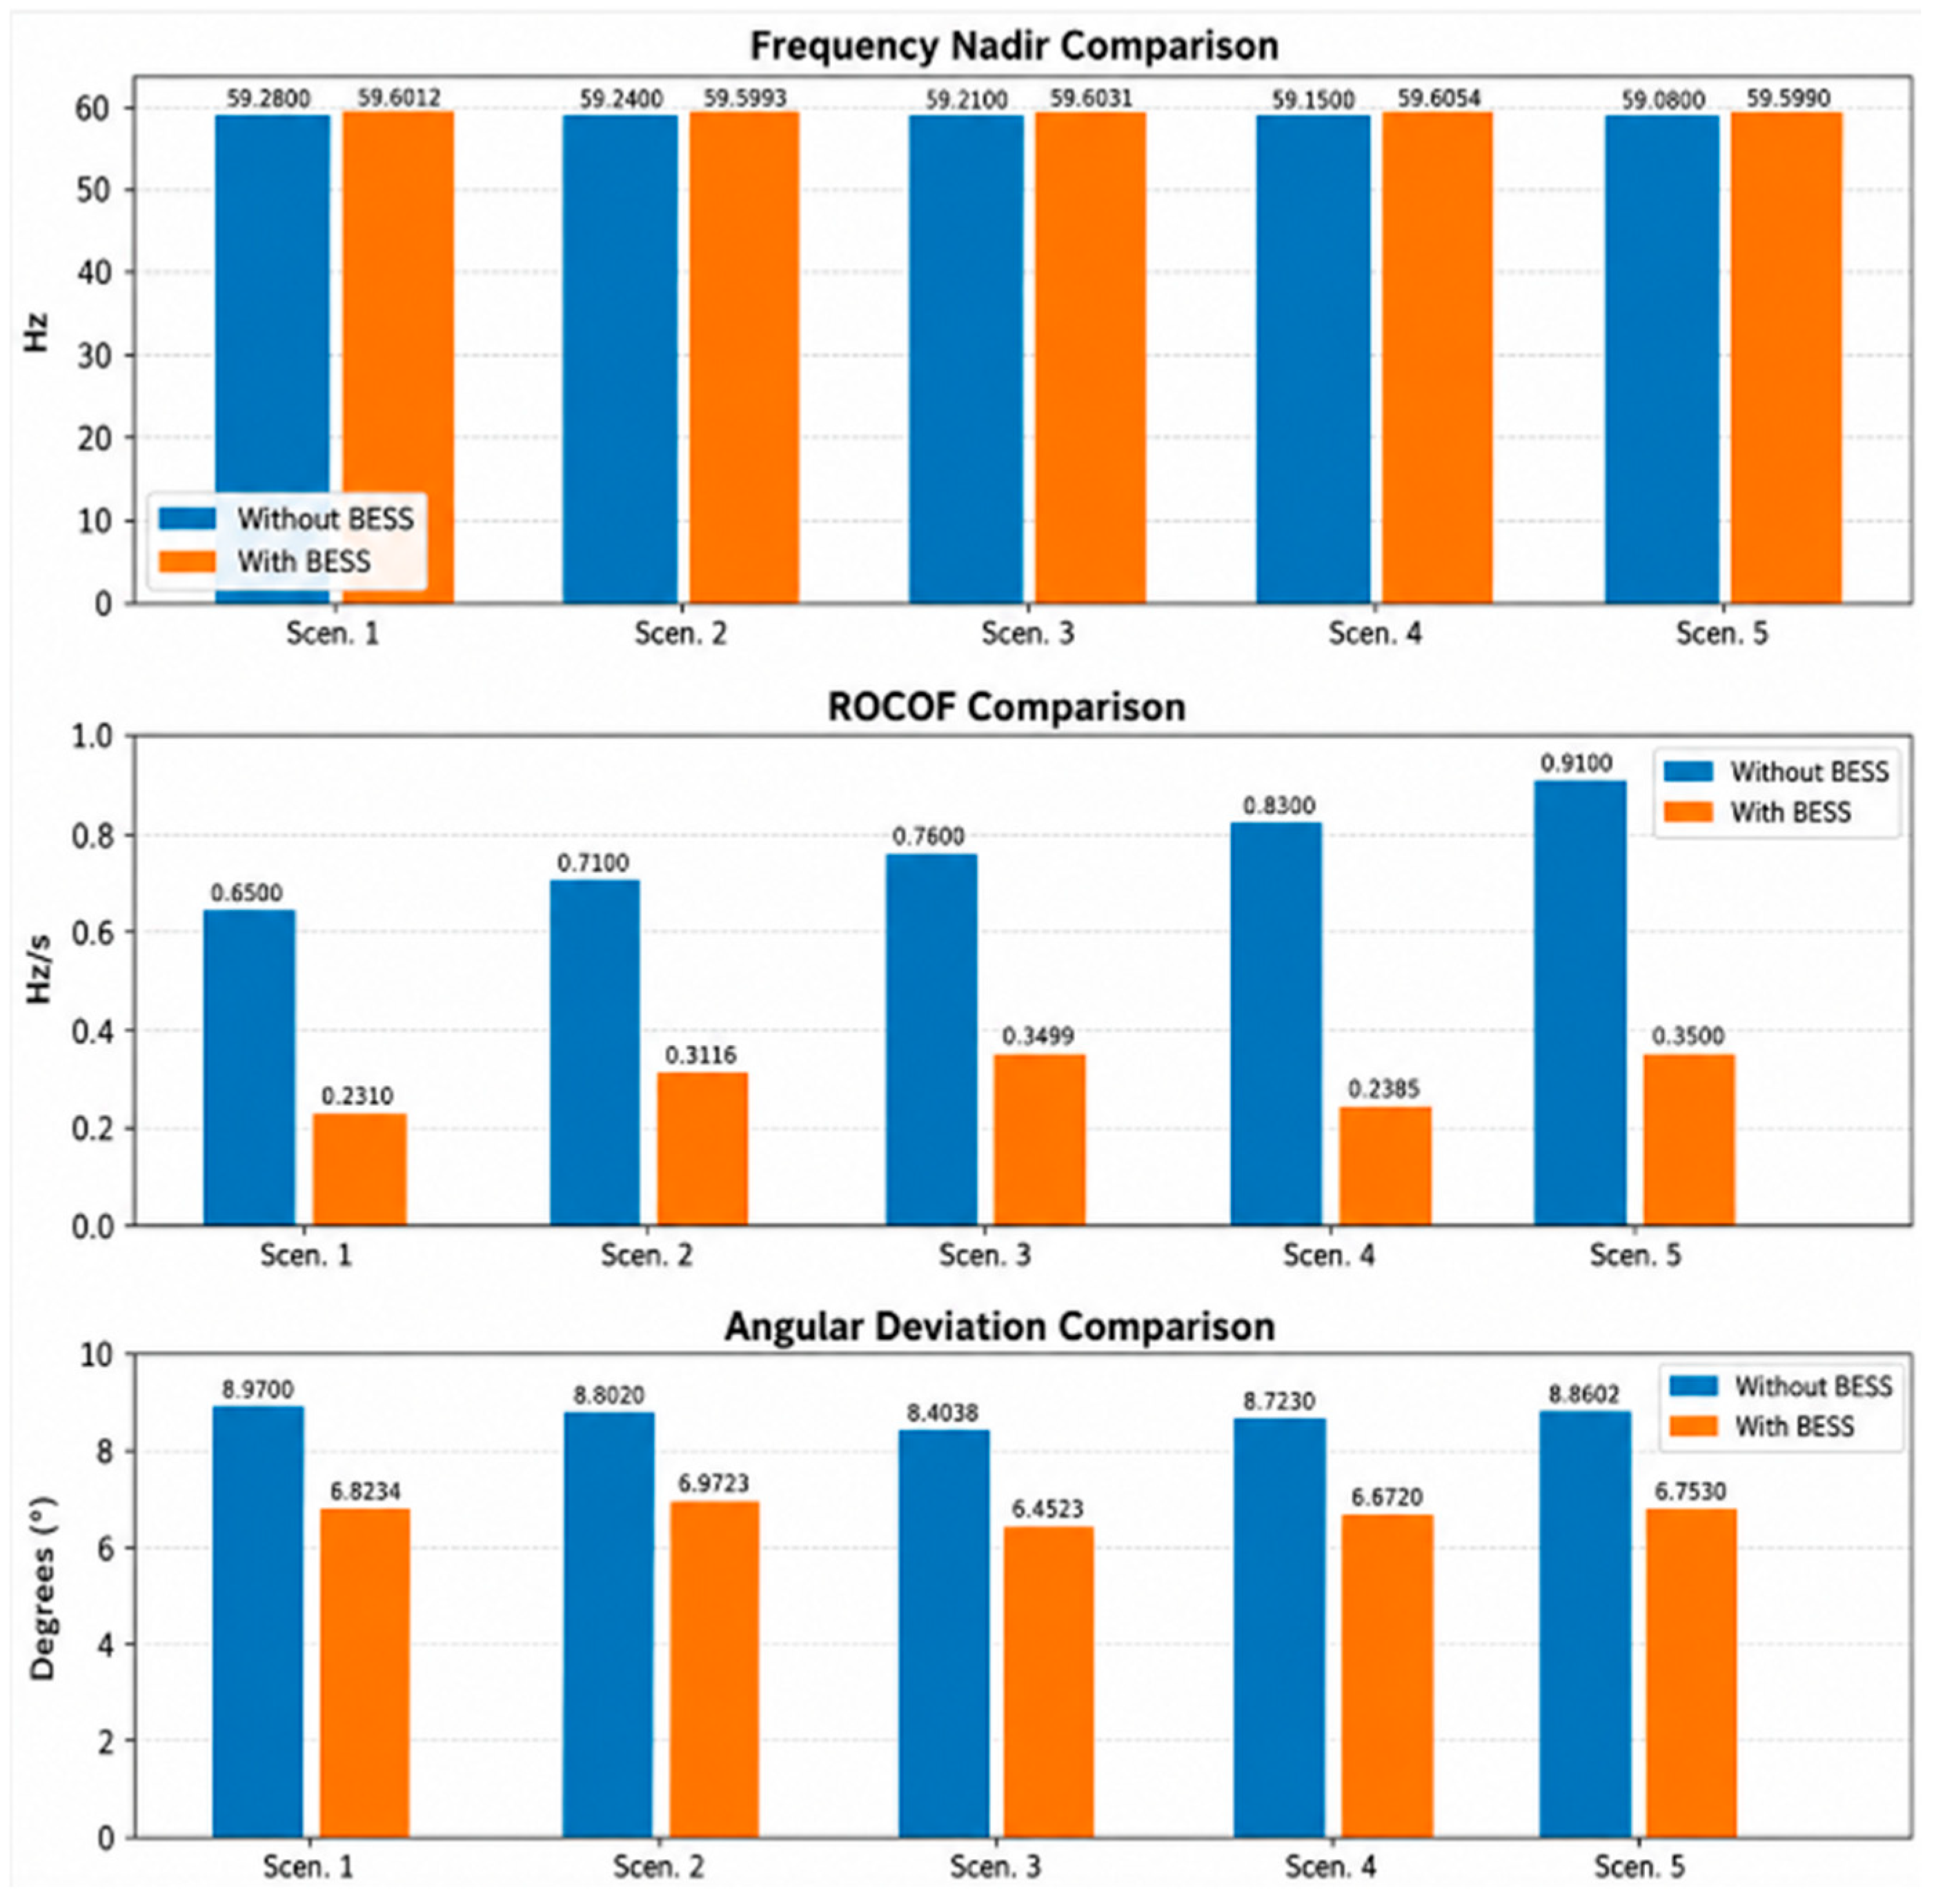
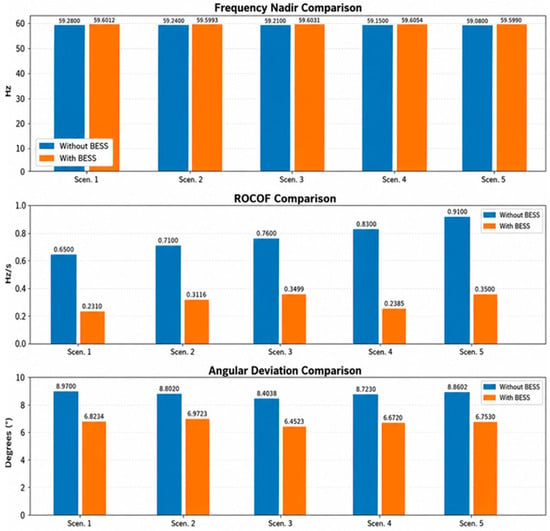
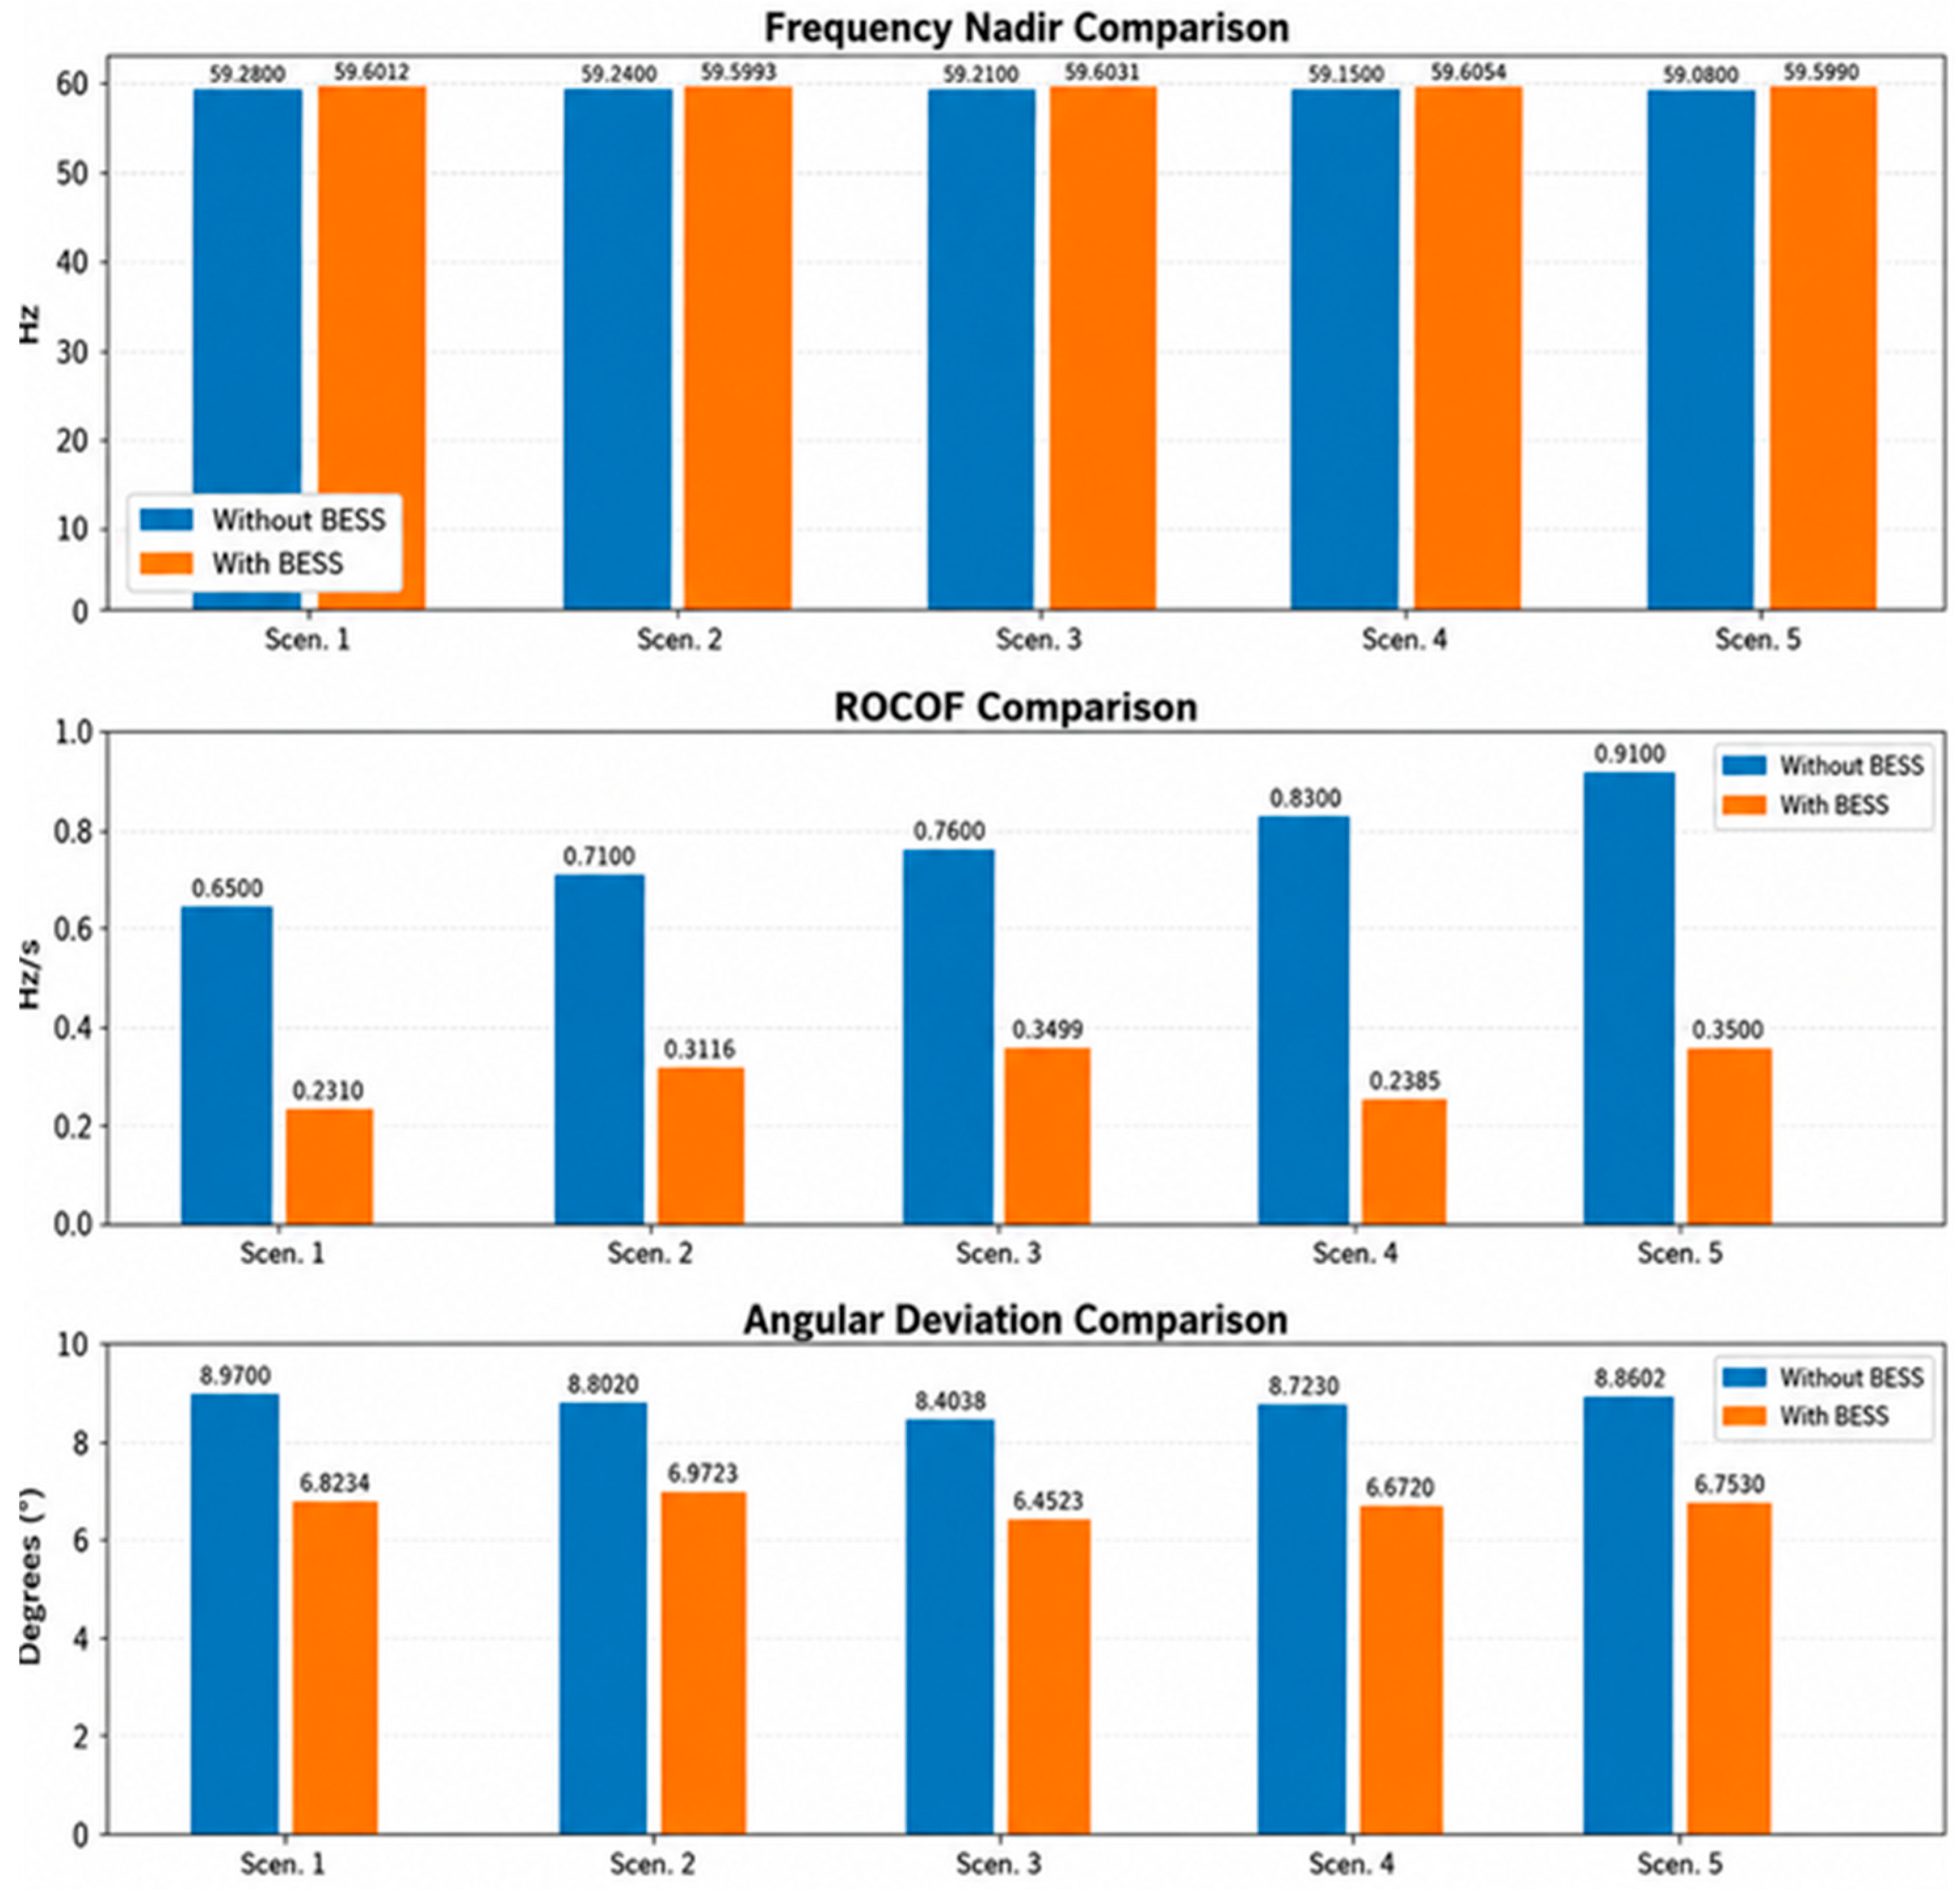
The implemented control remained inactive during normal operating conditions, while automatically injecting active power when negative frequency deviations occurred after contingencies, allowing us to improve the dynamic response of the electrical system to disturbances associated with loss of generation. Figure 14 shows a comparison of the system’s dynamic performance with and without a BESS across five scenarios, demonstrating that the BESS raises the frequency nadir.
Figure 14.
Dynamic indicators before and after the integration of the BESS.
The incorporation of the BESS system improved the dynamic performance of the electrical system after the contingency associated with the generator output. The results are presented in Table 9; the frequency nadir increased from 59.2800 Hz to 59.6012 Hz, exceeding the minimum acceptable threshold of 59.5 Hz, while the ROCOF value decreased from 0.6500 Hz/s to 0.2310 Hz/s, remaining below the critical limit established in the technical literature.
Table 9.
Summary of indicators with the incorporation of BESS.
3.4. Dynamic Stability Enhancement Using BESS + Virtual Inertia
The incorporation of the combined energy storage and virtual inertia scheme allows the simultaneous effect of fast frequency support and inertial emulation on the dynamic behavior of the electrical system to be analyzed, because this strategy allows us to decrease the initial frequency variation rate (ROCOF), improve the frequency nadir after the disturbance and attenuate the angular oscillations associated with the contingencies evaluated. While the BESS system supplies active power immediately to compensate for the generation deficit, virtual inertia partially reproduces the dynamic response of synchronous machines by temporarily injecting power proportional to frequency variations, reducing the initial effect. As shown in Table 10 for each of the scenarios.
Table 10.
Summary of indicators with the incorporation of BESS + virtual inertia.
In general, the results obtained show that the joint implementation of the BESS system and the virtual inertia scheme made it possible to correct the non-compliances registered in the five scenarios evaluated, even under the simultaneous application of the contingencies corresponding to the output of the COAZUCAR TG3 generator and the Ocaña 2 line, maintaining the indicators associated with the frequency nadir, to the ROCOF and the angular deviation within the limits recommended by the specialized literature. In addition, the average reduction in the ROCOF was greater than 70% compared to the case without mitigation, while the frequency nadir increased by approximately 0.48 Hz, and the angular deviation decreased by about 30%, results that show a better performance of the dynamic stability of the system.
To quantify the individual contribution of each mechanism, the BESS alone raises the average nadir by 0.410 Hz and reduces the ROCOF by 61.6% and the angular deviation by 23.1%, showing that fast active-power injection mainly compensates for the power imbalance. The virtual-inertia derivative action adds a further 0.070 Hz nadir improvement and an additional 25.7% ROCOF reduction, equivalent to a 71.5% total reduction, confirming that the derivative term specifically targets the initial rate of change, whereas the droop and energy capacity govern the nadir.
Therefore, the combination of energy storage and virtual inertia constitutes a technically adequate alternative to increase the integration capacity of non-synchronous distributed generation in Substation 50 La Troncal, because it allows to partially compensate for the decrease in inertia associated with the progressive replacement of conventional synchronous generation and improve the response capacity of the system in the face of severe disturbances. For the evaluated contingencies, the improvement in terms of indicators is presented in Figure 15.
Figure 15.
Dynamic indicators before and after the integration of BESS + virtual inertia.
3.5. Operation of the Overcurrent Protection System
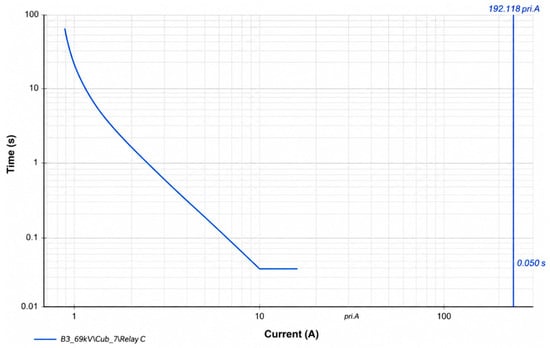
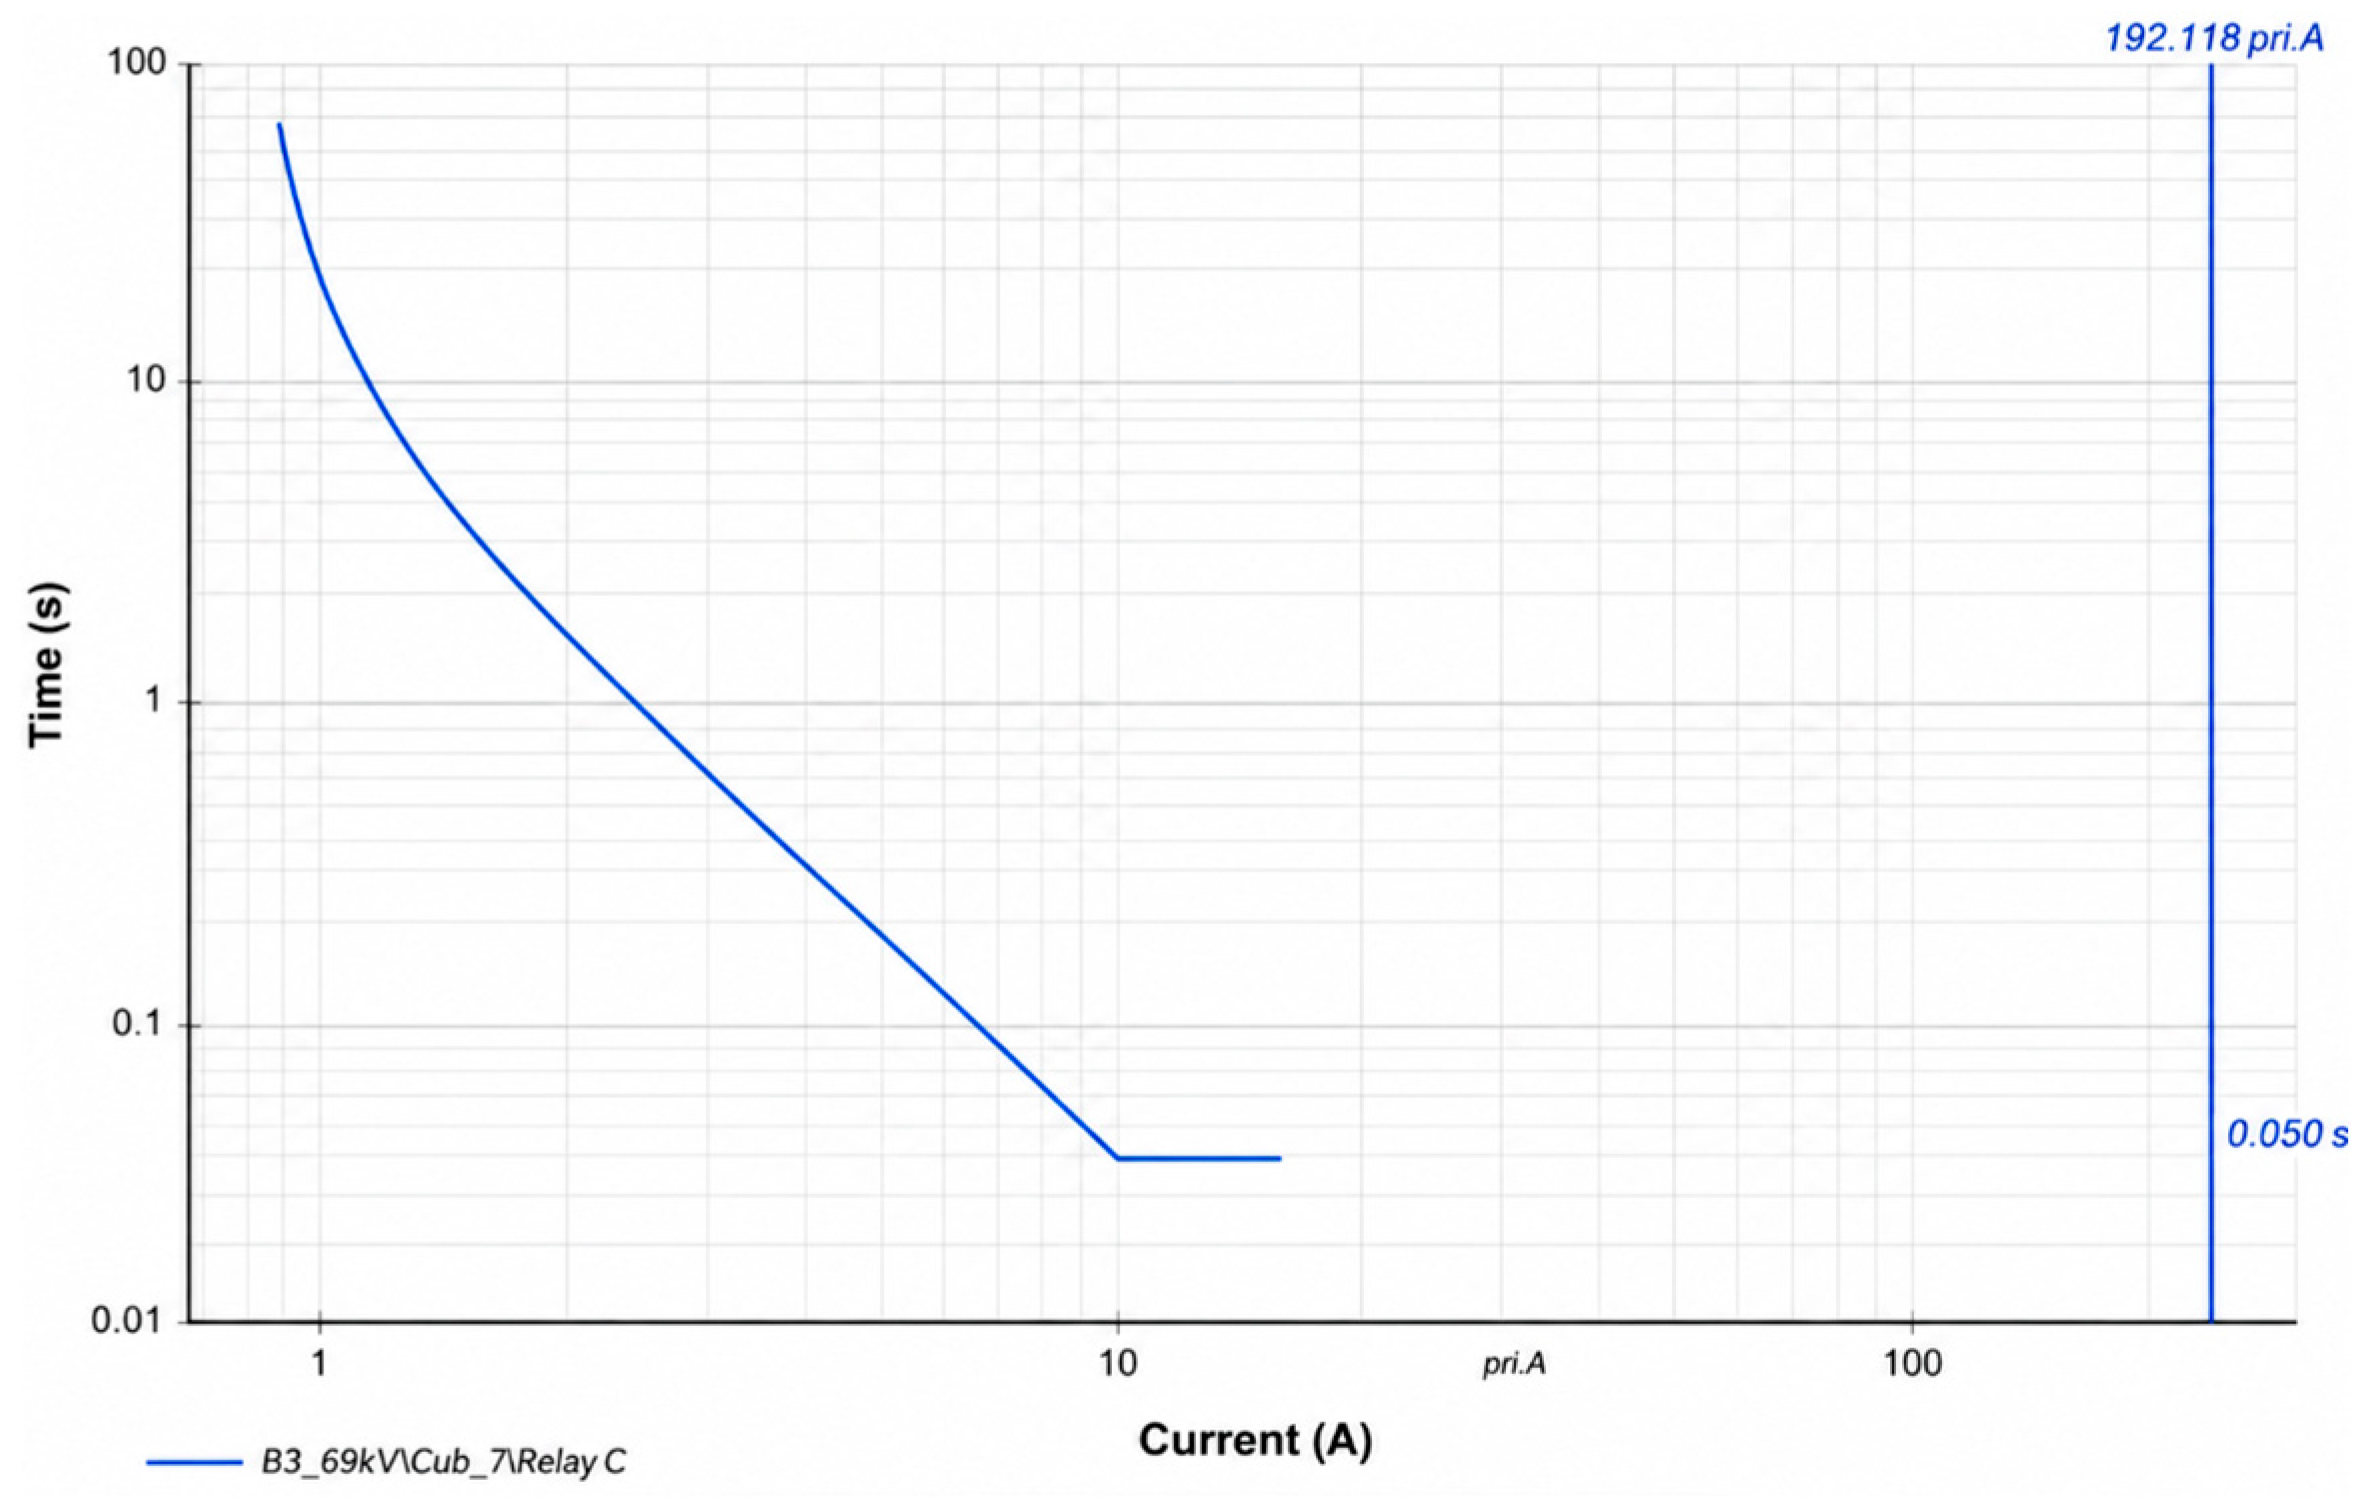
Figure 16 presents the time–current curve obtained in DIgSILENT PowerFactory for the implemented configuration, allowing us to analyze the relationship between the magnitude of the fault current and the operation time of the relay. In addition, this representation allows us to verify the characteristic behavior of a reverse time protection, where the clearance time decreases as the severity of the fault increases.
Figure 16.
Time–current characteristic curve (IEC inverse curve) of the ANSI 51 relay implemented in DIgSILENT PowerFactory; the discrete operating times reported in Table 11 lie on this continuous characteristic.
In order to evaluate the performance of the protection, different levels of three-phase fault current expressed in secondary values of the current transformer were considered, obtaining the actuation times shown in Table 11. In addition, this evaluation allowed us to analyze the variation in the relay operating time against different current magnitudes and verify compliance with the operating characteristics established for the IEC inverse curve configured.
Table 11.
Relay performance results for simulated three-phase faults.
The incorporation of this protection scheme complements the dynamic stability analysis developed in this study, because it allows for verifying the response capacity of the system to overcurrent events and jointly evaluating the performance of dynamic support strategies based on energy storage, virtual inertia and conventional protection systems.
4. Discussion
The purpose of this study was to evaluate the impact of the progressive penetration of non-synchronous distributed generation on the dynamic stability of a representative industrial electricity system, considering the frequency response and angular behavior under contingencies associated with the loss of the COAZUCAR TG3 generator and the Ocaña 2 line, and to identify the limitations associated with the decrease in equivalent inertia and transient response capacity of the grid.
From the stationary perspective, all scenarios maintained acceptable operating conditions even under high renewable penetration, and the loads on transmission lines and transformers remained practically constant without overloading, validating the technical feasibility of the selected scenarios for the dynamic analysis.
Although the system presented adequate steady-state behavior, the dynamic results showed limitations related mainly to frequency stability: all scenarios exceeded the 0.5 Hz/s ROCOF threshold, reaching 0.910 Hz/s in S5, and presented nadirs below 59.5 Hz, with the most critical value of 59.080 Hz in S5. The recorded angular deviations remained below the critical instability threshold of 10°, and the system maintained synchronism throughout the simulation period; therefore, angular stability was not the main dynamic limitation, since the network preserved adequate electromechanical coupling between the remaining synchronous machines.
A key finding is that steady-state security does not guarantee dynamic security. The power-flow solution verifies only algebraic constraints, including voltage magnitudes and thermal loading, at a specific operating point and contains no information about the kinetic energy stored in rotating masses or the control dynamics of generators. The same high-penetration scenarios that keep voltages within limits progressively displace synchronous machines and reduce the equivalent inertia constant; consequently, for an identical contingency, lower inertia yields higher ROCOF and deeper frequency nadirs. This decoupling between static and dynamic security explains why the system remains statically feasible while exhibiting frequency-stability non-compliances, and justifies the two-stage assessment adopted.
The BESS configured with the FFR strategy rapidly compensated for the active-power imbalance: the nadir increased from 59.2800 Hz to 59.6012 Hz and the ROCOF decreased from 0.6500 Hz/s to 0.2310 Hz/s in S1, while the angular deviation decreased from 8.9700° to 6.8234°, indirectly improving angular stability by reducing the instantaneous power imbalance. The addition of virtual inertia further improved the three criteria, confirming that the derivative action damps the initial ROCOF and electromechanical oscillations.
Although a full comparative simulation campaign is beyond the scope of this work, the proposed scheme can be benchmarked qualitatively against alternative frequency-support options reported in the literature. Storage with virtual inertia is the only option among the evaluated alternatives that acts within the first hundreds of milliseconds while also supporting the frequency nadir, which justifies its selection for the La Troncal system; a complete comparative assessment with synchronous condensers, governor re-tuning and under-frequency load shedding is acknowledged as future work.
A qualitative sensitivity interpretation supports the tuning adopted: the BESS power rating bounds the corrective power and dominates the ROCOF reduction, whereas the energy capacity governs the support duration and therefore the nadir. The virtual-inertia gain Kd reduces ROCOF until the derivative signal saturates the converter or amplifies measurement noise, which motivates the use of filtering. Likewise, the washout filter returns the inertial contribution to zero in steady state, so the virtual-inertia loop does not alter the steady-state droop characteristic and does not adversely interact with the existing primary frequency regulation.
Regarding PV variability, cloud-induced ramps generally develop over tens of seconds to minutes, which is slower than the 0–10 s inertial and primary-frequency-response window analyzed in this study. Therefore, assuming constant PV output during the 20 s contingency is a standard and representative worst-case practice for evaluating inertial response. A quantitative sensitivity sweep, a detailed control-interaction assessment and stochastic-irradiance simulations are proposed as the next research stage.
Two limitations are acknowledged. First, the simplified RMS representation of the PV and BESS converters is appropriate for the bulk frequency dynamics studied here, but EMT modeling of the converters is recommended for future work to capture fast converter-level interactions. Second, the conclusions derive from a single but representative case study: La Troncal combines hydro, seasonal biomass, prospective photovoltaic generation and industrial loading, a configuration typical of many medium-size and isolated systems in Latin America. The observed penetration–inertia–stability relationships are therefore qualitatively transferable, although quantitative generalization, including the Ecuadorian national system, requires further study.
In general terms, the incorporation of BESS + virtual inertia represents a technically viable alternative to mitigate the dynamic limitations associated with high renewable penetration, increasing the operational resilience of the electrical system and facilitating an energy transition with higher renewable shares without affecting dynamic stability.
5. Conclusions
Substation 50 La Troncal presented adequate steady-state behavior for the eight renewable penetration scenarios evaluated. The voltage profiles remained within the permitted operating limits, and no overloads were identified in lines or transformers; therefore, the system maintained the capacity to integrate non-synchronous distributed generation from the power-flow perspective.
The dynamic evaluation under the contingencies associated with the loss of the COAZUCAR TG3 generator and the Ocaña 2 line showed a progressive deterioration of stability as the penetration of distributed generation increased, with ROCOF values between 0.6500 and 0.9100 Hz/s, nadirs between 59.2800 and 59.0800 Hz and angular deviations greater than 8°, exceeding the reference criteria; the equivalent rotational inertia of the committed synchronous fleet was shown to be the governing variable of this degradation.
The joint incorporation of the BESS and the virtual-inertia scheme improved the dynamic response, reaching nadirs between 59.6600 and 59.6850 Hz, ROCOF values between 0.1800 and 0.2600 Hz/s and angular deviations below 6.3°, meeting the stability criteria and partially compensating for the inertia decrease associated with converter-based distributed generation.
The ANSI 51 overcurrent relay (Siemens SIPROTEC 7SJ6001) implemented on the 69 kV line at B3 verified decreasing action times as the short-circuit severity increased, confirming the capacity of the protection to contribute to the operational safety of the system and to complement the dynamic support strategies evaluated.
Author Contributions
Conceptualization, J.L.-G.; methodology, J.L.-G.; formal analysis, L.A.; investigation, J.L.-G., L.A. and H.T.; data curation, L.A. and H.T.; writing—original draft preparation, H.T.; writing—review and editing, J.L.-G., L.A. and H.T.; supervision, H.T. All authors have read and agreed to the published version of the manuscript.
Funding
This research received no external funding.
Data Availability Statement
Derived data supporting the findings of this study are available from the corresponding author on request.
Conflicts of Interest
The authors declare no conflicts of interest.
Abbreviations
| BESS | Battery Energy Storage System |
| FFR | Fast Frequency Response |
| FER | Renewable Energy Sources |
| VRES | Variable Renewable Energy Sources |
| GD | Distributed Generation |
References
- Shen, F.; Liu, S.; Ouyang, G.; Shan, J.; Cao, Y.; Wang, Z.; Zhai, S. Inertia estimation of power system with new energy considering with high renewable penetrations. Energy Rep. 2023, 9, 1066–1076. [Google Scholar] [CrossRef] [Scilit]
- Berrich, O.; Mafakheri, F.; Dabbou, H. Renewable Energy Transition and the Paris Agreement: How Governance Quality Makes a Difference? Energies 2024, 17, 4238. [Google Scholar] [CrossRef] [Scilit]
- Njoka, G.M.; Mogaka, L.; Wangai, A. Impact of variable renewable energy sources on the power system frequency stability and system inertia. Energy Rep. 2024, 12, 4983–4997. [Google Scholar] [CrossRef] [Scilit]
- Wu, L.; Ren, Z.; Wu, J.; Yu, L. Frequency security region of high penetration renewable energy integrated power systems: Theoretical, assessment, and application. Appl. Energy 2026, 423, 128408. [Google Scholar] [CrossRef] [Scilit]
- Deng, X.; Mo, R.; Wang, P.; Chen, J.; Nan, D.; Liu, M. Review of RoCoF Estimation Techniques for Low-Inertia Power Systems. Energies 2023, 16, 3708. [Google Scholar] [CrossRef] [Scilit]
- Tan, B.; Zhao, J.; Netto, M.; Krishnan, V.; Terzija, V.; Zhang, Y. Power system inertia estimation: Review of methods and the impacts of converter-interfaced generations. Int. J. Electr. Power Energy Syst. 2022, 134, 107362. [Google Scholar] [CrossRef] [Scilit]
- Al Kez, D.; Foley, A.M.; Ahmed, F.; Morrow, D.J. Overview of frequency control techniques in power systems with high inverter-based resources: Challenges and mitigation measures. IET Smart Grid 2023, 6, 447–469. [Google Scholar] [CrossRef] [Scilit]
- Rather, Z.H.; Flynn, D. Voltage Dip Induced Frequency Events in Wind Integrated Power Systems. IFAC-PapersOnLine 2015, 48, 572–577. [Google Scholar] [CrossRef] [Scilit]
- Gao, Z.; Morales-España, G.; Gibescu, M.; Gazzani, M. The impact of electricity network and generator models on the accuracy and computational efficiency of multi-energy system investment and operation planning. Int. J. Electr. Power Energy Syst. 2025, 171, 111020. [Google Scholar] [CrossRef] [Scilit]
- Paredes, E.; Chilig, E.; Lata-García, J. Optimal Electrical Dispatch by Time Blocks in Systems with Conventional Generation, Renewable, and Storage Systems Using DC Flows. Appl. Sci. 2026, 16, 1372. [Google Scholar] [CrossRef] [Scilit]
- Zheng, K.; Wang, L.; Tu, Z.; Xu, Y. Optimization Configuration Method for Grid-Forming and Grid-Following Energy Storage Based on Node Frequency Deviation Coefficient. Appl. Sci. 2025, 15, 5544. [Google Scholar] [CrossRef] [Scilit]
- Fang, J.; Li, H.; Tang, Y.; Blaabjerg, F. On the Inertia of Future More-Electronics Power Systems. IEEE J. Emerg. Sel. Top. Power Electron. 2019, 7, 2130–2146. [Google Scholar] [CrossRef] [Scilit]
- Othman, M.H.; Mokhlis, H.; Mubin, M.; Talpur, S.; Ab Aziz, N.F.; Dradi, M.; Mohamad, H. Progress in control and coordination of energy storage system-based VSG: A review. IET Renew. Power Gener. 2020, 14, 177–187. [Google Scholar] [CrossRef] [Scilit]
- Paiva, P.; Castro, R. Effects of Battery Energy Storage Systems on the Frequency Stability of Weak Grids with a High-Share of Grid-Connected Converters. Electronics 2024, 13, 1083. [Google Scholar] [CrossRef] [Scilit]
- Shrestha, A.; Gonzalez-Longatt, F. Parametric Sensitivity Analysis of Rotor Angle Stability Indicators. Energies 2021, 14, 5023. [Google Scholar] [CrossRef] [Scilit]
- Noroña, R.; Cajas, E.; Lozada, C.; Chamba, M. Análisis de Estabilidad Transitoria Utilizando el Concepto de Inercia y Minería de Datos. Rev. Téc. Energ. 2025, 22, 1–11. [Google Scholar] [CrossRef] [Scilit]
- Vásquez-Cardona, D.; Saldarriaga-Zuluaga, S.D.; Bustamante-Mesa, S.; López-Lezama, J.M.; Muñoz-Galeano, N. Impacts of Electric Vehicle Penetration on the Frequency Stability of Curaçao’s Power Network. World Electr. Veh. J. 2025, 16, 264. [Google Scholar] [CrossRef] [Scilit]
- Gonzalez-Longatt, F.; Roldan-Fernandez, J.M.; Chamorro, H.R.; Arnaltes, S.; Rodriguez-Amenedo, J.L. Investigation of Inertia Response and Rate of Change of Frequency in Low Rotational Inertial Scenario of Synchronous Dominated System. Electronics 2021, 10, 2288. [Google Scholar] [CrossRef] [Scilit]
- Chen, B.; Du, Z.; Zhou, W.; Zhao, L.; Zhen, H.; Zhou, T.; Huang, G. A transient stability analysis method for wind power system with thyristor controlled phase shifting transformer based on branch potential energy index. Energy Rep. 2023, 9, 542–553. [Google Scholar] [CrossRef] [Scilit]
- Lozada, C.; Vargas, W.; Granda, N.; Chamba, M. Optimal Load Shedding Scheme Considering the Dynamic Frequency Response. Eng. Proc. 2024, 77, 25. [Google Scholar] [CrossRef] [Scilit]
- Saha, S.; Elliott, M.; Roy, T.K.; Oo, A.M.T. Quantifying hourly virtual inertia and battery energy storage system requirements for frequency stability in low-inertia power systems. J. Energy Storage 2026, 153, 120853. [Google Scholar] [CrossRef] [Scilit]

Disclaimer/Publisher’s Note: The statements, opinions and data contained in all publications are solely those of the individual author(s) and contributor(s) and not of MDPI and/or the editor(s). MDPI and/or the editor(s) disclaim responsibility for any injury to people or property resulting from any ideas, methods, instructions or products referred to in the content. |
© 2026 by the authors. Licensee MDPI, Basel, Switzerland. This article is an open access article distributed under the terms and conditions of the Creative Commons Attribution (CC BY) license.