


Abstract
Aiming at the challenges of complex spatial-temporal correlation and strong nonlinearity in the power prediction of large-scale wind farm clusters, this study proposes a short-term wind power prediction method that combines a dynamic graph structure and a Kolmogorov–Arnold Network (KAN) enhanced neural network. Firstly, a spectral embedding fuzzy C-means (FCM) cluster partition method combining geographic location and numerical weather prediction (NWP) is proposed to solve the problem of insufficient spatio-temporal representation ability of traditional methods. Secondly, a dynamic directed graph construction mechanism based on a stacked wind direction matrix and wind speed mutual information is designed to describe the directional correlation between stations with the evolution of meteorological conditions. Finally, a prediction model of dynamic graph convolution and Transformer based on KAN enhancement (DGTK-Net) is constructed to improve the fitting ability of complex nonlinear relationships. Based on the cluster data of 31 wind farms in Gansu Province of China and the cluster data of 70 wind farms in Inner Mongolia, a case study is carried out. The results show that the proposed model is significantly better than the comparison methods in terms of key evaluation indicators, and the root mean square error is reduced by about 1.16% on average. This method provides a prediction tool that can adapt to time and space changes for engineering practice, which is helpful to improve the wind power consumption capacity and operation economy of the power grid.
1. Introduction
With the acceleration of the global energy structure to a clean and low-carbon transition, wind power, as one of the main renewable energy sources, and its installed capacity and grid-connected scale continue to grow [1]. According to the Renewables 2025 report released by the International Energy Agency, the installed capacity of renewable energy is expected to increase by nearly 4600 gigawatts from 2025 to 2030, which is twice that of the previous five years (2019–2024) [2]. Among them, it is predicted that the cumulative new capacity of onshore wind power will increase by 45% from 2025 to 2030, reaching 732 GW. However, the inherent intermittency and volatility of wind power have brought severe challenges to the safe and stable operation and power balance of power systems [3]. In this context, high-precision short-term wind power forecasting has become a key technology to ensure grid consumption, optimize scheduling decisions, and enhance market competitiveness [4]. Compared with a single wind farm, the power prediction of a regional wind farm cluster can grasp the output trend from the macro level [5]. However, due to its complex spatial–temporal correlation and dynamic physical interaction [6], how to accurately model such relationships has become a core problem to be solved urgently to improve the prediction accuracy of large-scale wind farm clusters.
In wind farm cluster modeling, reasonable cluster division is the basis for reducing the complexity of the model and revealing the local spatio-temporal correlation [7]. Many existing studies are confined to the statistical model of the whole cluster or the linear superposition of multi-station output [8], which fails to reflect the spatial and temporal correlation characteristics of large-scale wind farm cluster operation [9]. That is to say, the dynamic nonlinear interaction between stations determined by geographical distribution differences and complex meteorological conditions has not been effectively considered, so there is a certain upper limit on the model characterization ability and prediction accuracy. Traditional classification methods mainly rely on geographical proximity or simple statistical correlation [10]. For example, some studies use K-means and its variants (such as binary K-means) for hard partitioning based on wind farm location or historical power data [11]. However, such methods often ignore the potential physical correlations dominated by the dynamic evolution of meteorological fields. In addition, the hard partition K-means in reference [12] artificially separates the fuzzy attribution relationship between wind farms and fails to fully describe the transition characteristics of the cluster boundary. Recent studies have begun to focus on dynamic partitioning to improve adaptability. For example, Li et al. [13] proposed a dynamic cluster partitioning method based on real-time operating characteristics. However, the adaptive adjustment of such methods will trigger frequent retraining of the prediction model, which brings high computational costs. Therefore, how to effectively integrate static geographic information and spatio-temporal meteorological features in the division is a problem to be solved.
After dividing and defining the wind farm cluster, quantifying its internal dynamic spatial dependence is the key to model performance. The existing methods are difficult to balance the dynamic, directional, and nonlinear edge weight characterization [14]. Most methods use a static adjacency matrix based on fixed geographical distance or use a Pearson correlation coefficient to construct a correlation graph [15]. However, as pointed out in Reference [16], this kind of traditional graph structure is difficult to capture its dynamic evolution with the movement of the weather system. More fundamentally, most of these maps are undirected, which, to some extent, ignores the mutual dependence of meteorological characteristics and the direction of information dissemination between stations under wind direction. Although the graph construction method based on dynamic correlation has recently emerged [17], its characterization of edge weights mostly depends on linear correlation, and its characterization of the complex nonlinear dependence strength between wind farms is insufficient. In Reference [18], the directed graph structure of the wind farm group is constructed by introducing the Granger causality test, which improves the performance in a statistical sense. However, statistical causality may be different from the actual physical information transmission process, and its computational complexity is high. Reference [19] used the maximum information coefficient (MI) to capture the dynamic spatial correlation between wind turbines. This method shows advantages in characterizing nonlinear relationships, but its application is currently limited to a single wind farm, and its applicability in larger wind power clusters remains to be verified. Therefore, constructing a graph structure that can simultaneously characterize dynamic, directed, and non-linear spatial dependencies is the key to improving the physical consistency and prediction accuracy of the model.
In terms of prediction model architecture, in the face of large-scale wind farm clusters, the essence of power prediction is a complex spatio-temporal sequence prediction problem. This requires that the model can simultaneously capture the complex spatial dependencies between wind farms and the temporal dynamics of each wind farm itself. Early research and some current methods still focus on independent modeling of a single wind farm. The models used include the time series method [20], recurrent neural network [21], and time convolution network (TCN) [22]. The core defect of such models is that the spatial correlation within the wind farm cluster is completely ignored. In order to introduce spatial information, some recent studies have begun to explore spatio-temporal alternation models or spatio-temporal attention mechanisms [23], aiming to integrate spatio-temporal information more closely [24]. Reference [25] proposed a heterogeneous spatio-temporal graph convolutional network, which combines a multi-scale convolutional neural network (CNN) and a multi-order graph convolutional network (GCN) to enhance the capture of spatio-temporal interactions. However, the graph structure accepted by its graph neural network is essentially static. Reference [26] proposed an adaptive spatio-temporal graph neural network (ASTGNN) model that has advantages in capturing spatio-temporal features, but its dynamic process is integrated into the “black box” of the model and lacks a reasonable explanation based on the actual process. And it performs poorly in the case of large-scale graph data and time series with large variation characteristics. Reference [27] combined geographical location and station NWP information, and used GCN and Bi-LSTM to analyze the spatio-temporal correlation between nodes. However, its timing capture is only due to the use of a timing model, and the graph structure is static and does not reflect the co-evolution of time and space. In addition, there is a common problem in the core components of these advanced models, such as the activation function in graph convolution and the feedforward network in the attention mechanism, most of which are still based on a multi-layer perceptron (MLP). Studies have shown that such MLPs have inherent upper limits in flexibility and efficiency when approaching highly complex and non-stationary nonlinear functions in wind power dynamics [28], which constitutes a common bottleneck that limits the further improvement of prediction accuracy.
In summary, as systematically revealed in Table 1, although existing studies have attempted to combine clustering, dynamic graphs, and spatio-temporal learning frameworks, there are still three core gaps that have not been properly resolved in wind power cluster prediction [23,29,30]. First, the existing division methods do not fully integrate meteorological and geographical features; secondly, it is difficult for the existing graph models to simultaneously and efficiently characterize the dynamics of spatial correlations, the physical-oriented directionality, and the nonlinear dependence strength. Third, the nonlinear fitting ability of the prediction model needs to be further improved, and the ability of spatio-temporal information mining needs to be strengthened. To this end, this study proposes a framework for wind power cluster power prediction. Firstly, by mapping the geographical attributes and meteorological characteristics of wind farms to the spectral space, the cluster division based on the internal structure of the data is realized. Then, according to the physical process and statistical dependence of the wind farm cluster, a directed graph structure that can reflect the dynamic information transmission is constructed. Finally, an end-to-end power prediction is completed using a neural network architecture optimized for nonlinear spatio-temporal relationships. The power prediction framework aims to comprehensively improve the accuracy and reliability of wind power cluster power prediction through a layer-by-layer progressive modeling strategy.
Table 1.
Summary and limitation analysis of related work.
The main contributions and innovations of this paper can be summarized as follows.
- (1)
- A spectral embedding fuzzy C-means clustering method combining geographic location and NWP is proposed, which can effectively identify wind farm sub-clusters with a clearer definition of clustering boundary and higher correlation of internal characteristics.
- (2)
- A dynamic directed graph construction mechanism based on a stacked wind direction matrix and wind speed mutual information is designed to realize dynamic, directed, and nonlinear spatial correlation quantification and modeling simultaneously. Enhance the interpretability of the graph construction process and improve the prediction accuracy of dynamic modeling.
- (3)
- A DGTK-Net prediction model based on KAN enhancement is constructed. By enhancing the nonlinear fitting ability of the model, the prediction accuracy of the power of a large-scale wind farm cluster is effectively improved on the basis of ensuring the generalization performance of the model.
The following chapters of this paper are arranged as follows: the second part discusses the overall process and introduces the relevant theoretical basis of the proposed method in detail, the third part analyzes and discusses the examples, and the fourth part summarizes the full text and looks forward to future work.
2. The Relevant Theoretical Basis of the Proposed Method
2.1. Modeling and Predicting the Overall Process
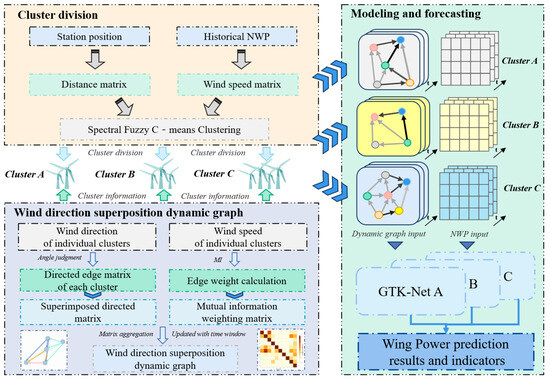
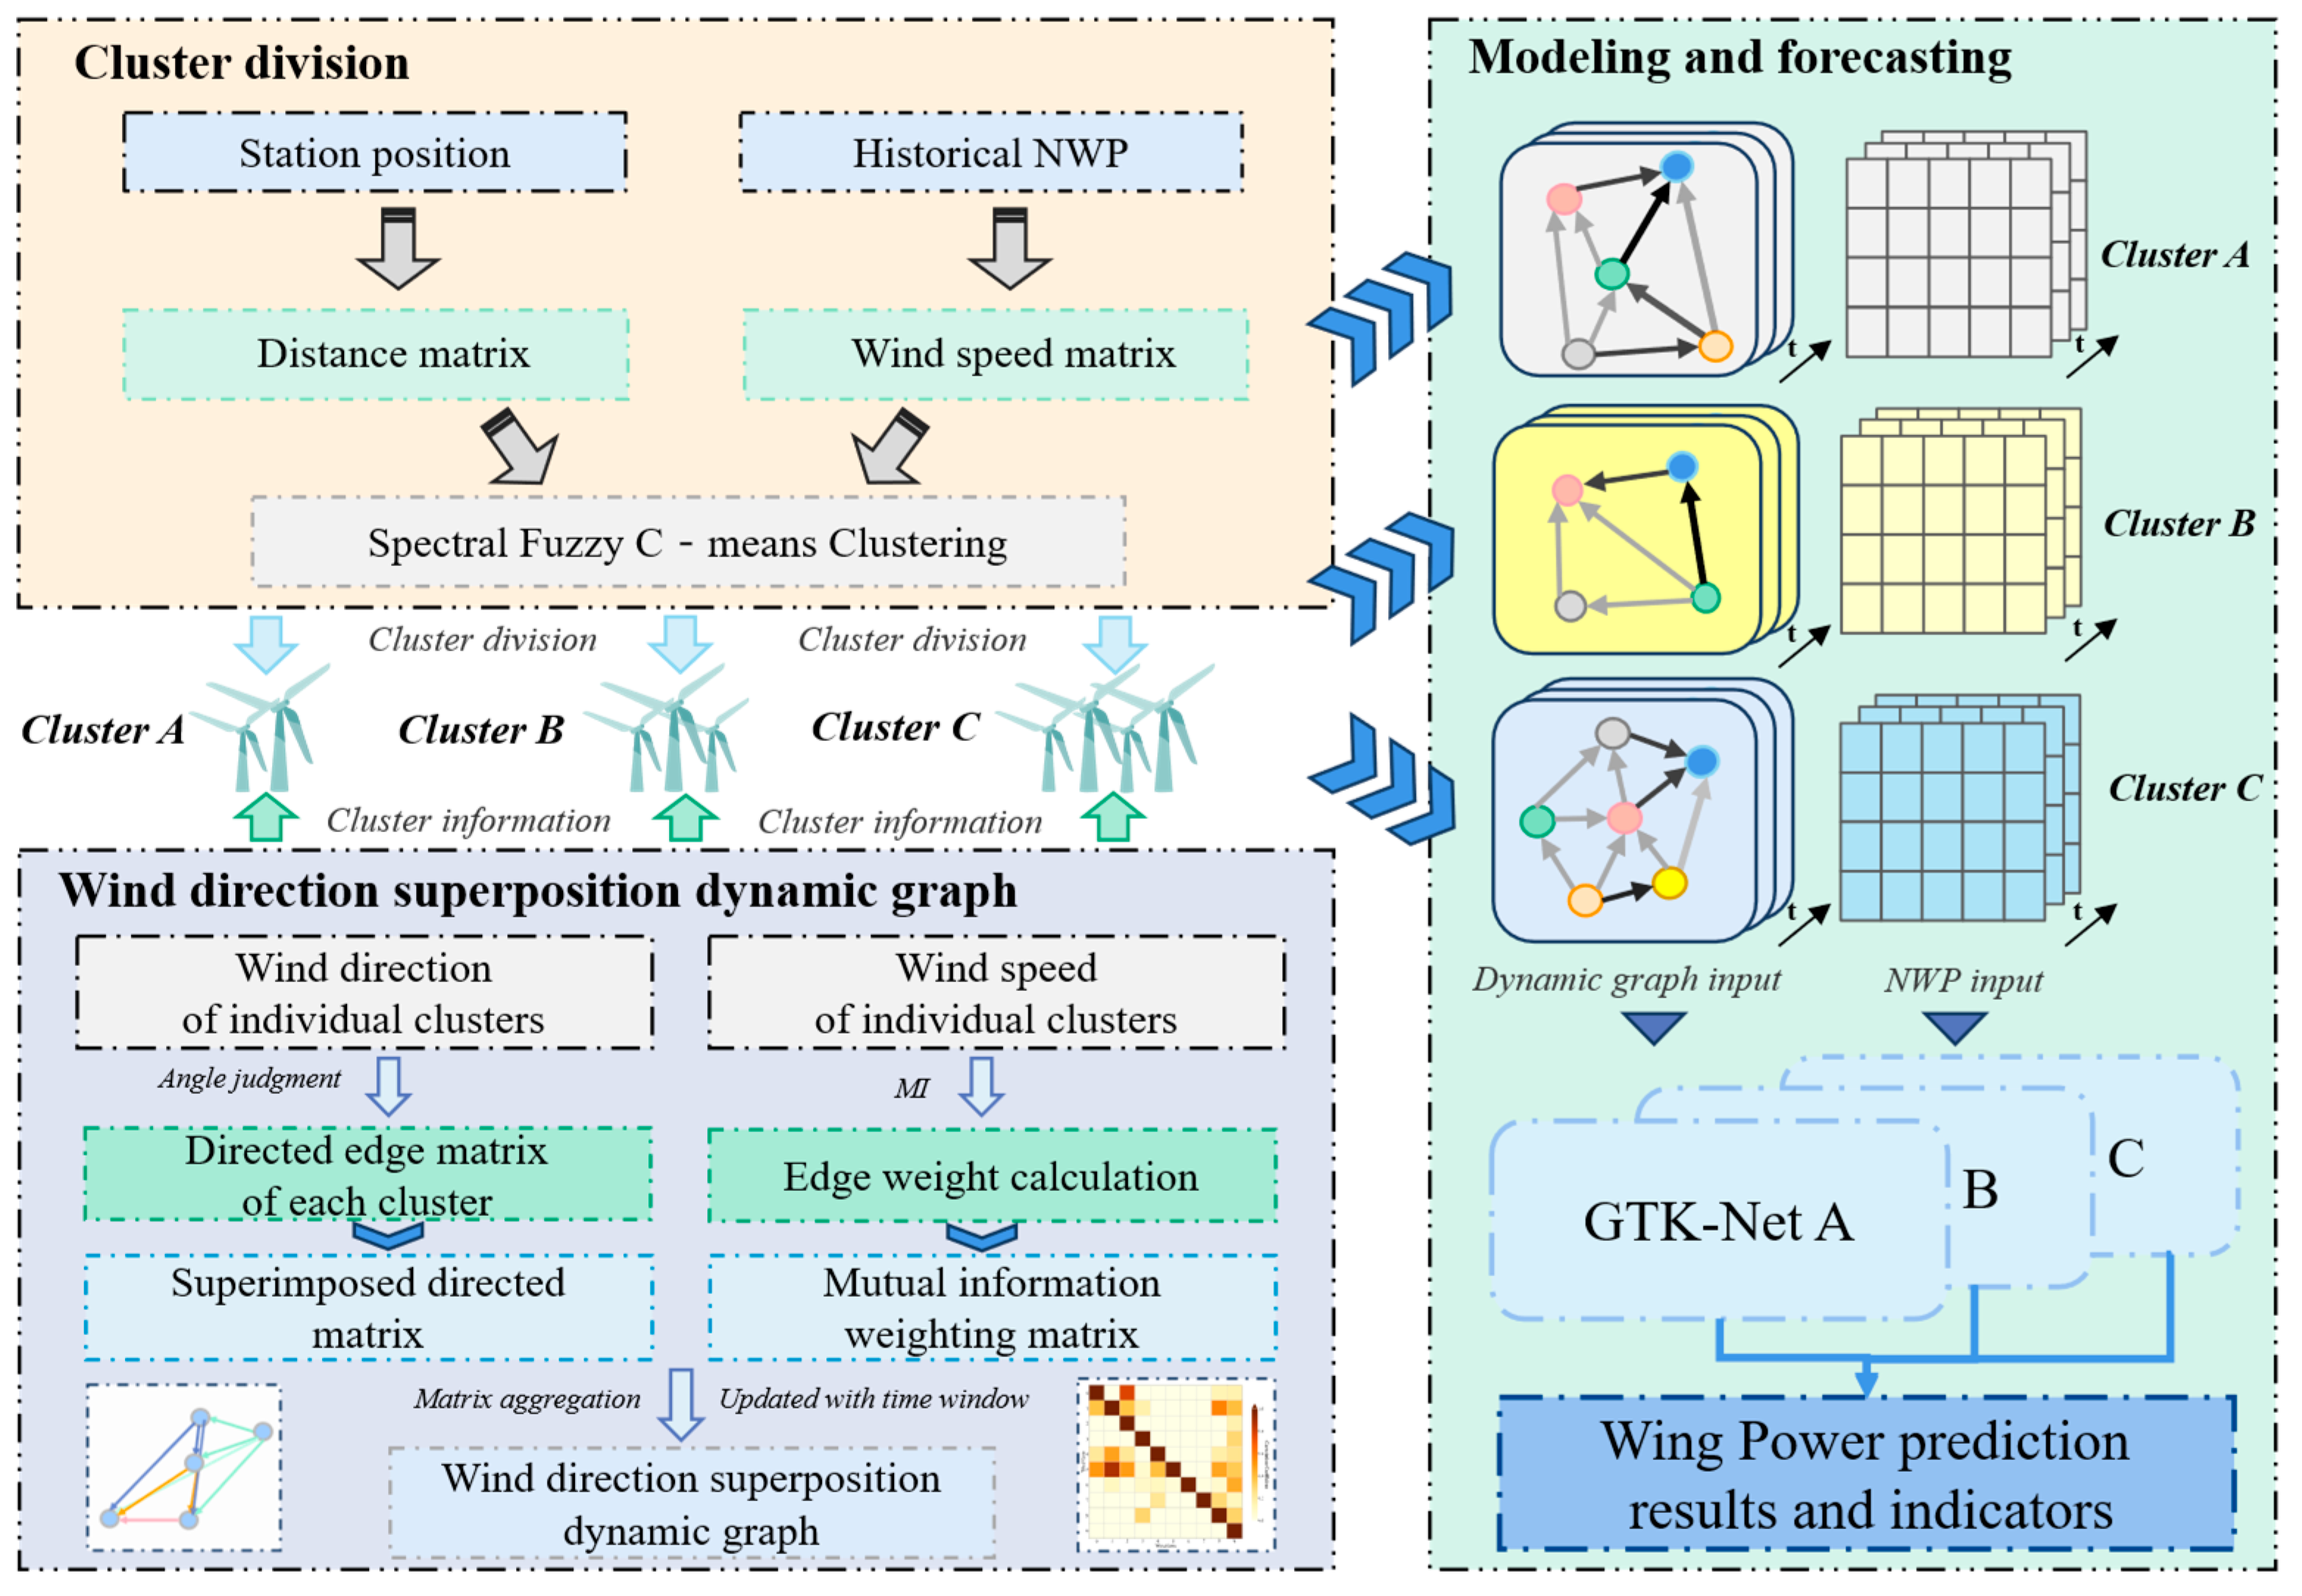
In order to systematically cope with the three core challenges of “cluster division, dynamic graph construction and spatio-temporal nonlinear modeling” in the power prediction of large-scale wind power clusters, this study proposes a dynamic graph convolutional network method based on spatio-temporal information and KAN enhancement. The overall process is shown in Figure 1. The process of this method and its logical relationship are as follows.
Figure 1.
Overall prediction process.
Step 1: The original numerical weather forecast and power data are standardized; missing values and outliers are processed to provide high-quality input for subsequent modeling.
Step 2: Solve the problem that the traditional clustering method is based on a single information. In this stage, the geographical location of the wind farm is coupled with the dynamic NWP features to construct an affinity matrix, which is mapped to a high-dimensional feature space through spectral embedding, and fuzzy C-means clustering is performed. This method aims to generate a sub-cluster division with clear physical meaning and close internal connection, which lays a structural foundation for subsequent modeling.
Step 3: Depict the nonlinear spatial dependence of dynamic evolution with meteorological conditions in the cluster. In this stage, a stacked directed adjacency matrix is first constructed based on the physical constraints of wind direction, and the direction of information propagation is defined. Then, the wind speed mutual information is used to calculate the edge weight and quantify the nonlinear dependence intensity. Finally, a sliding time window is introduced to dynamically update the graph structure to capture the evolution characteristics of spatio-temporal correlation.
Step 4: Break through the bottleneck of traditional models in complex nonlinear fitting. This study proposes the DGTK-Net model. The mapping of wind speed sequence to target power is established through the time series window to capture the dynamic trend of the cluster, so as to effectively fit the complex non-stationary spatial and temporal characteristics of wind power. By training the model independently for each sub-cluster and integrating its output, the short-term, accurate prediction of the total power of the cluster is realized.
2.2. Fuzzy C-Means Cluster Partition Method Based on Spectral Embedding
For wind power cluster power prediction, cluster division can not only effectively distinguish the spatial and temporal characteristics of each wind farm, but also improve the prediction accuracy through special modeling. Based on graph theory and fuzzy membership, this paper proposes a fuzzy C-means clustering method based on spectral embedding (SFCM). The core is to use spectral clustering to solve the problem of “finding structure” and FCM to solve the problem of “how to soft partition”. Spectral clustering maps the original data into a new feature space (spectral space), in which the complex cluster structure becomes simple, compact, and has a more detailed feature representation [31]. Then, FCM is applied in this “optimized” space.
In this process, it is very important to construct an affinity matrix that can accurately reflect the overall correlation characteristics between wind farms, which directly determines the quality and reliability of clustering results. In addition, the appropriate matrix construction method can also reveal the spatio-temporal coupling relationship between wind farms and provide an important basis for subsequent cluster control and power prediction. In this paper, the SFCM clustering method based on spectral embedding is as follows.
(1) Firstly, considering the geographical location factor, the Gaussian radial basis function is used to calculate the similarity between the two wind farm locations i and j. That is, the farther the wind farms are apart, the smaller the similarity is determined. The core calculation is shown in (1):
where is the Euclidean distance between two different wind farms. is the bandwidth parameter of the Gaussian kernel function, which controls the speed of similarity decay with distance. In this study, takes the average distance between all wind farm locations, as in Reference [32]. is the similarity of the calculated geographical location. Finally, the distance weight matrix is constructed from these similarities. The core feature is that the closer the wind farm is, the larger the corresponding weight coefficient is. The formula is shown in (2):
In the formula, H is the distance weight matrix. is the information filtering threshold. Considering the faraway wind farms, the reference of information is weakened, so the information filtering threshold is set. The larger the value, the less the edge connection between the stations. Its value is determined according to whether the isolated field station appears or not. In order to avoid the existence of isolated wind farms, this study has been tested to determine the value, which is 0.5.
In order to couple the numerical weather prediction (NWP) information into the basis of cluster division, the similarity matrix of NWP needs to be constructed synchronously. In the early stage of cluster division, we use the Pearson correlation coefficient as one of the composite features, aiming to quickly capture the long-term linear synergistic trend of wind speed changes between wind farms and provide a stable global perspective for division. The coefficient, geographical location, and multi-dimensional NWP features together constitute the input information, forming a multi-feature fusion matrix. The final classification result is determined by the joint distribution of all features. The calculation formula of the wind speed correlation matrix is as follows.
where and represent the i-th element in the characteristic sequence of different wind farms, respectively, and n represents the length of the sequence. The wind speed characteristics of each wind farm and the Formula (3) are calculated, and the wind speed correlation matrix is obtained. Further, it is calculated by , where is the point multiplication. The distance weight matrix and the wind speed correlation matrix are fused into an affinity matrix A for spectral embedding.
(2) Further, based on the affinity matrix, the corresponding degree matrix is constructed. The calculation process is as follows:
where is the element of the adjacency matrix S, and represents the sum of the weights of the edges of other points connected to a point in the graph. It can be seen that D is a diagonal matrix. Subsequently, the normalized Laplacian matrix is calculated:
where is the unit matrix. Compared with the unnormalized Laplacian matrix, is not sensitive to the change in node degree and can usually produce a more stable clustering effect.
Further, the normalized Laplacian matrix is decomposed, and the eigenvector corresponding to the first k minimum eigenvalues is selected to construct the spectral embedding matrix, as shown in (6).
Each row of matrix U represents the new coordinate representation of the original data points in the k dimensional spectral space. In this new feature space, the complex manifold relationship between data points is transformed into a simple Euclidean relationship, which makes the nonlinearly separable data clusters in the original space become linearly separable.
(3) The spectral embedding matrix U is used as the input data of the fuzzy C-means (FCM) algorithm, and soft partition is performed in the spectral space. FCM solves the optimal membership degree and clustering center by minimizing the following objective function [33], and finally completes the cluster division work, as shown in (7).
where m is the number of clusters; i represents the i sample; j is the class label; and u represents the membership degree of sample i belonging to class j. x is a sample with d dimensional features. is the center of the j cluster, which also has d dimensions. can be any metric representing distance.
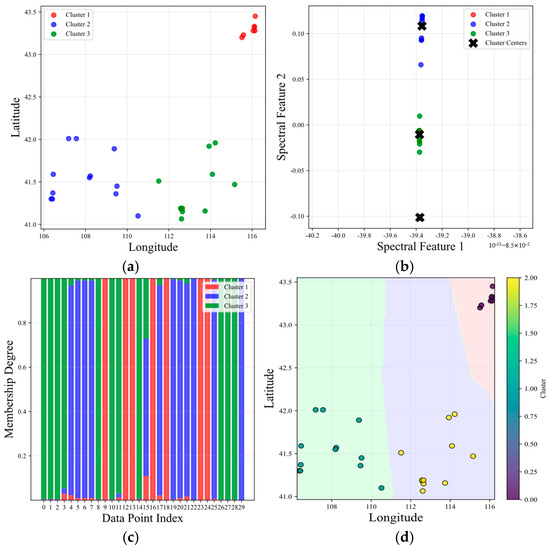
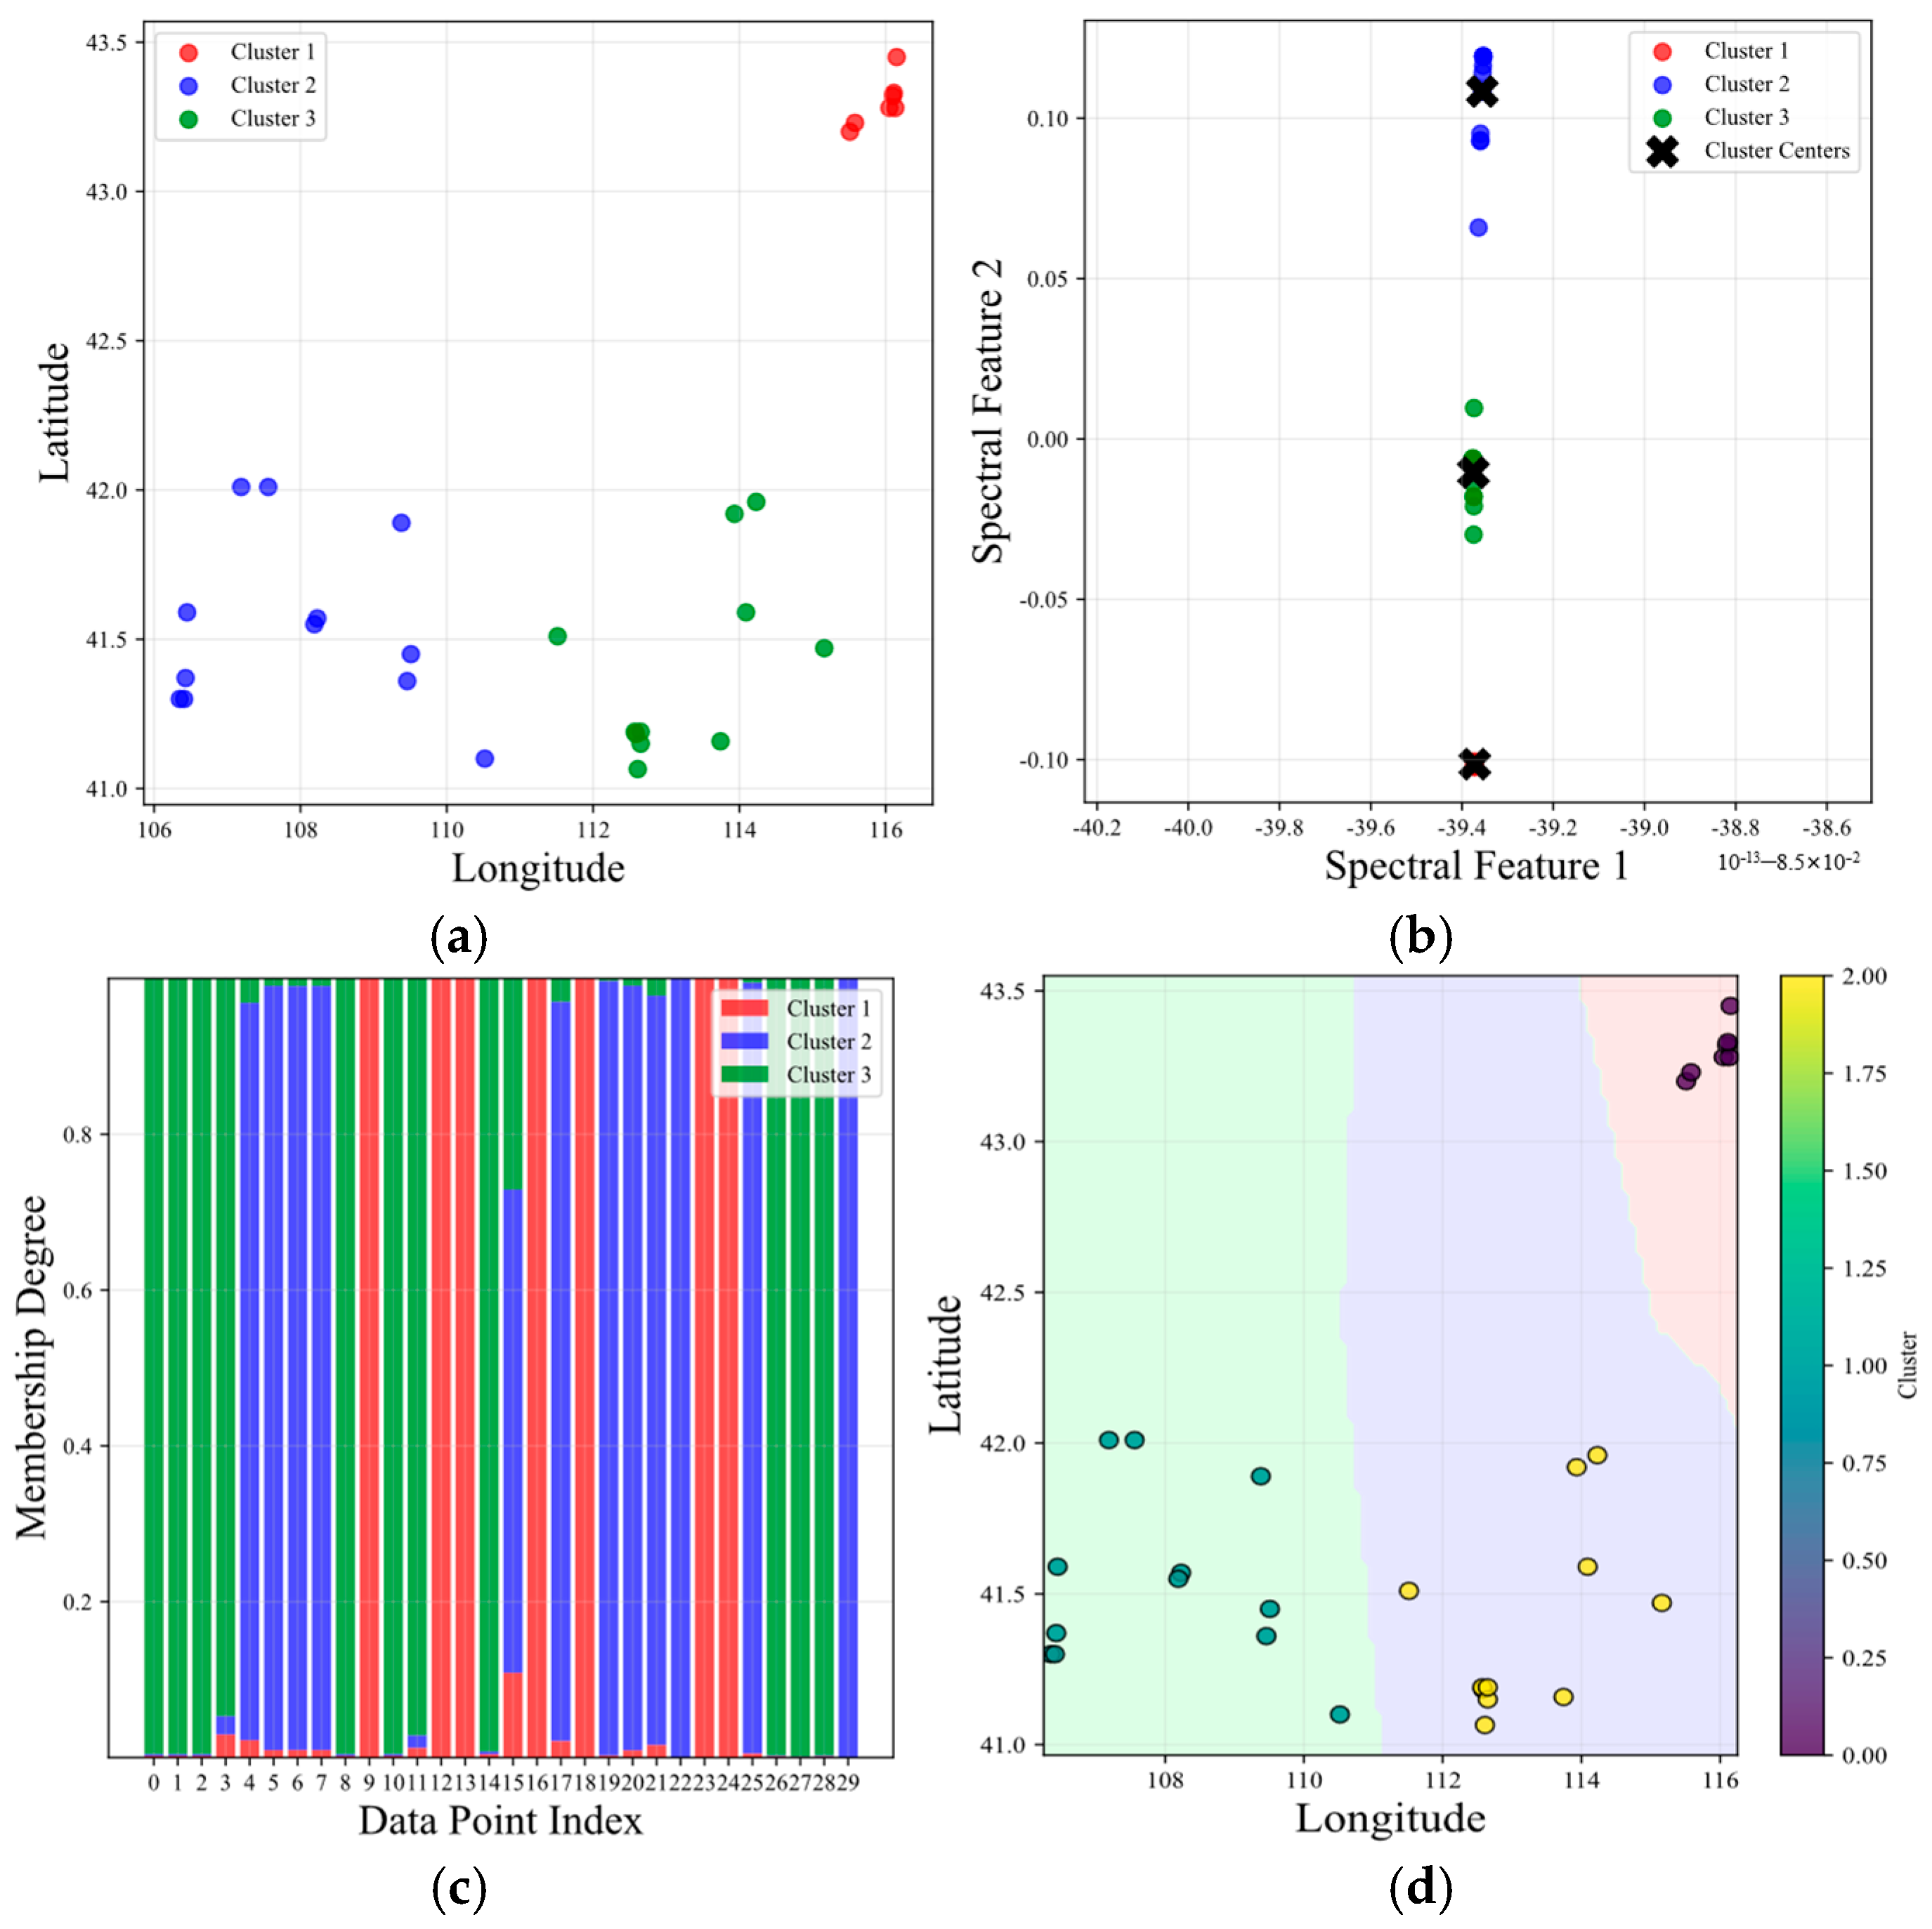
The cluster partition information after using SFCM is shown in Figure 2. Through the spectral clustering step, this method can accurately capture the complex spatial correlation between wind farms composed of geographical location and NWP information connection, and map it to the spectral space with clear features. Furthermore, FCM is used for soft division, and the output membership matrix can quantify the degree of belonging of each wind farm to multiple clusters, and reasonably locate the wind farms in the “transition” role. Thus, SFCM provides a richer and more practical information basis for the modeling prediction after cluster division.
Figure 2.
Wind farm cluster-related information. (a) clustering results in the original data space; (b) clustering results in the spectral embedding space; (c) fuzzy membership degree; and (d) fuzzy clustering boundary.
2.3. Structure Construction of Stacked Dynamic Graph Based on Wind Direction
The input of the model is the multivariate time series NWP data of the wind power cluster in the past time steps, where N is the number of wind farms, and F is the feature dimension (this study mainly selects wind speed and wind direction).
In order to construct the spatial graph structure, each wind farm is regarded as a node in this study. In order to construct a directed graph structure that can reflect the physical process of spatial propagation of wind resources, this study regards each wind farm as a node , where V is the set of wind farm nodes and i is the wind farm number. One of the core innovations of this model is to abandon the traditional undirected graph based on geographical distance, and instead construct a dynamic directed graph based on wind direction to more accurately characterize the “upstream and downstream” relationship between wind farms. The adjacency matrix of the graph is established based on the wind direction of the wind farm.
2.3.1. Wind Direction Superposition Matrix
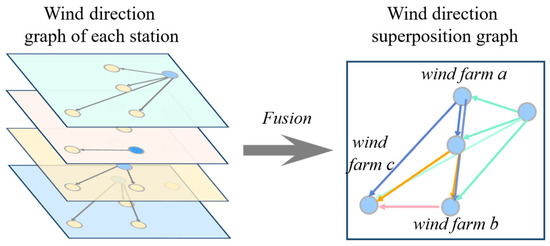
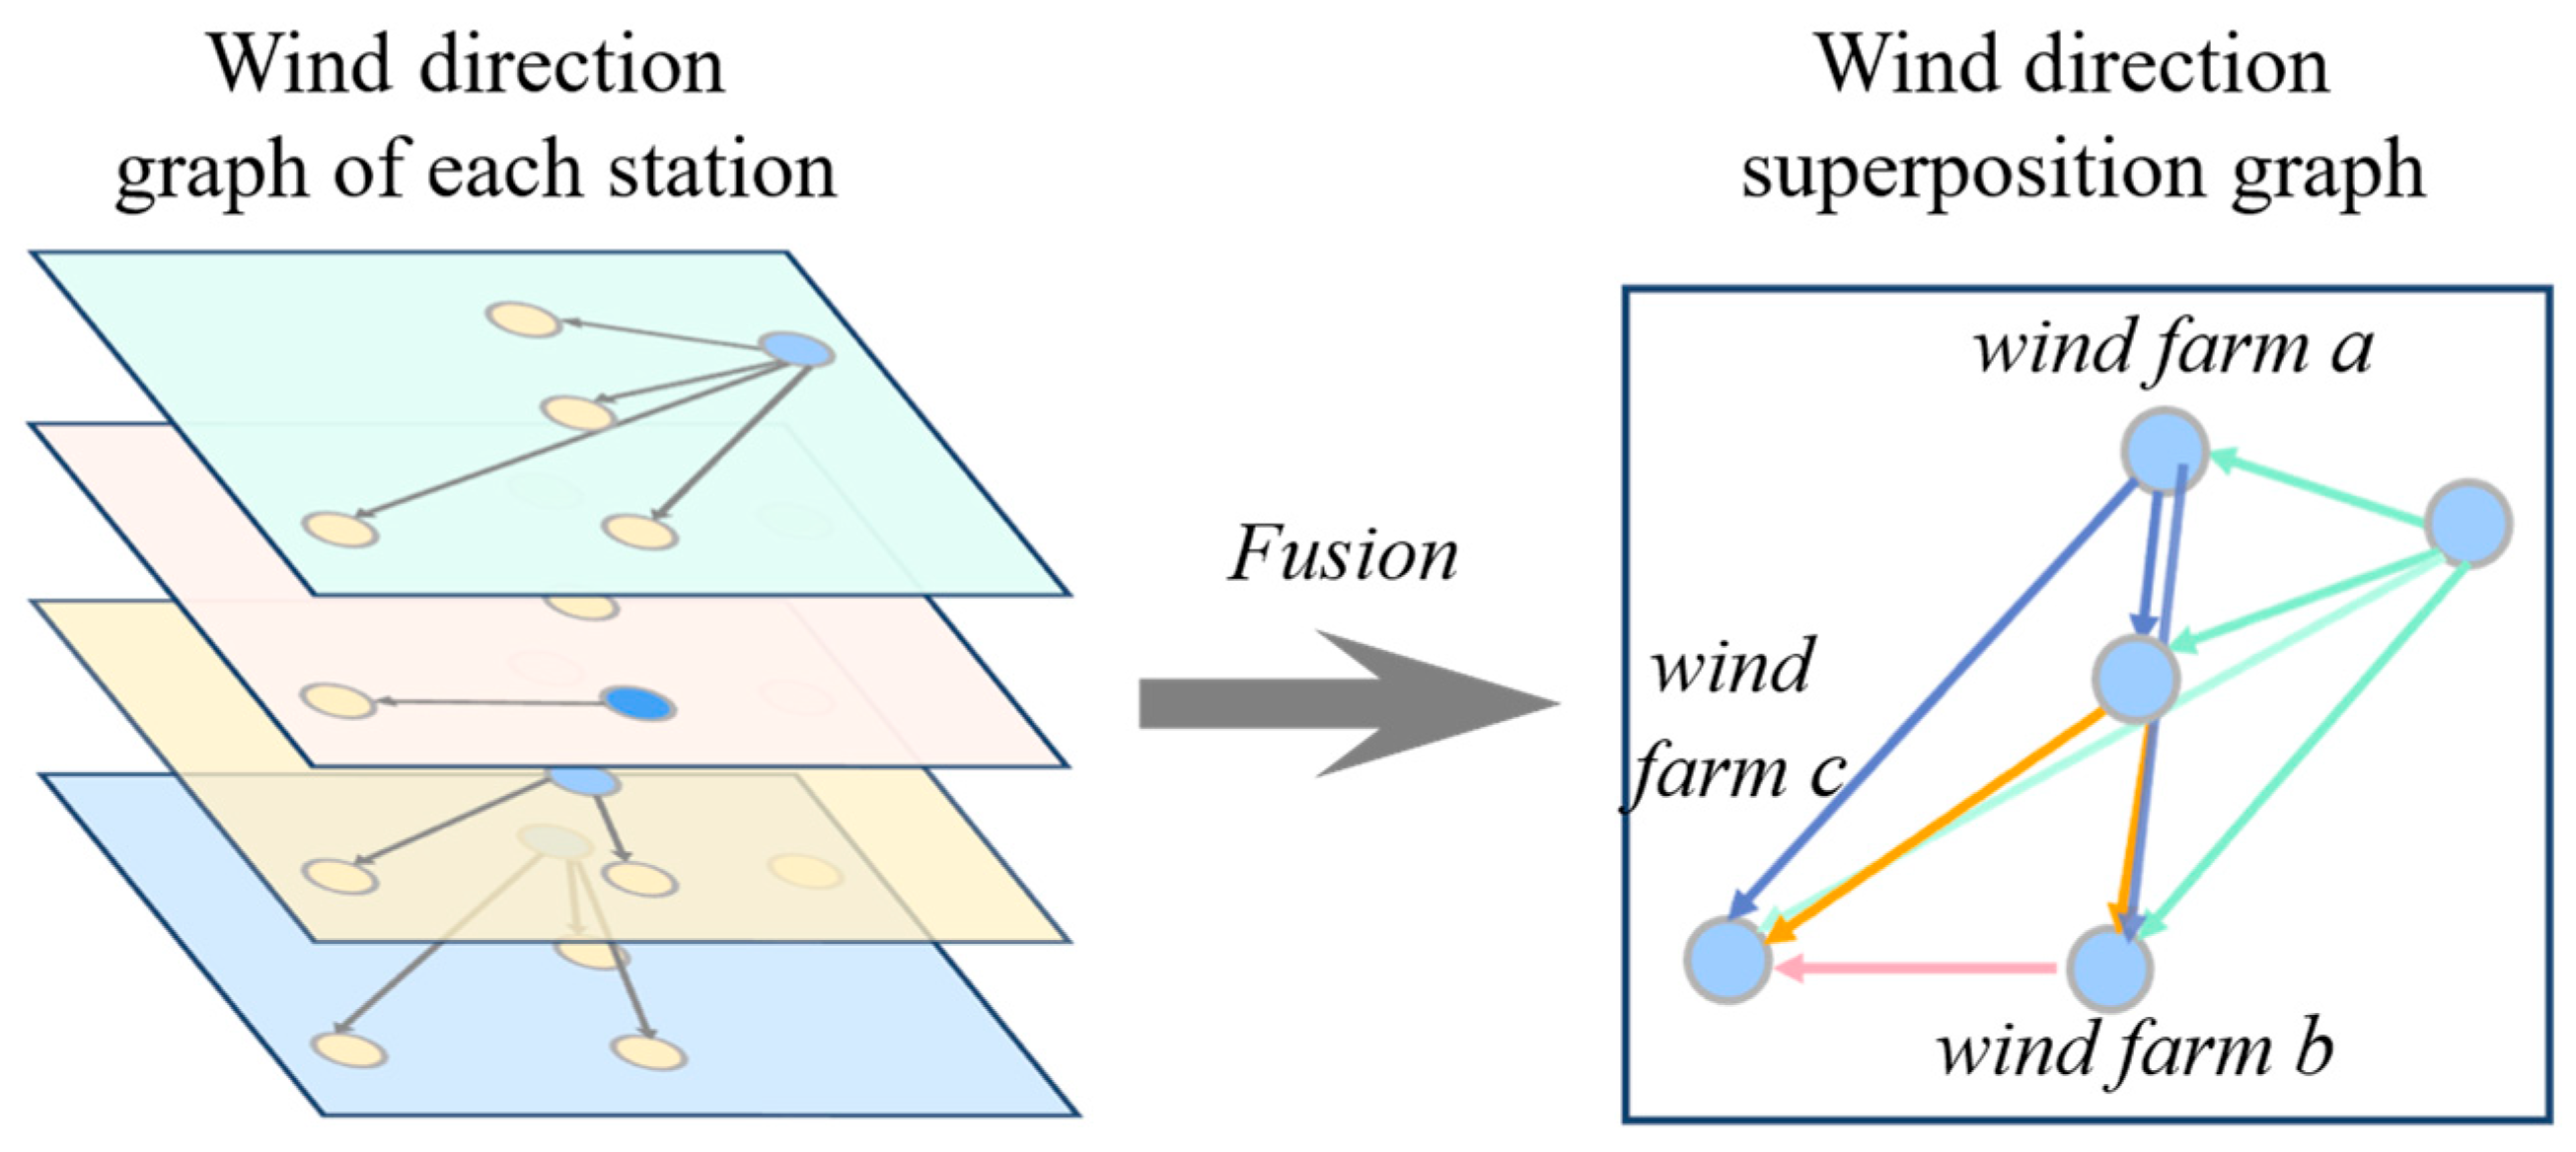
For any specific wind farm i, we define its potential “downstream” wind farm based on its average wind direction in the time window as the dominant wind direction. Specifically, inspired by the literature [34], this study takes the position of wind farm i as the origin, takes its wind direction as the main axis, and defines a fan-shaped area with an angle of (in order to ensure the true embodiment of the upstream and downstream relationship as much as possible, and reasonably plan the calculation cost, through experimental statistics, this study is determined to be 90°) The other wind farm j located in this sector is considered to be the “downstream” of wind farm i, that is, there is a directed edge from i to j. In the wind direction matrix, the element that indicates the influence relationship between the upstream and downstream is set to 1. The elements in the wind direction matrix are calculated by Formula (8).
where is the wind direction matrix of wind farm i. satisfies . The unit vector with wind farm i as the starting point and wind farm j as the end point is recorded as , and is the vector of the average wind direction in the window of wind farm i. represents the modulus value of the vector, which is further used to calculate the angle.
The above process generates a local adjacency graph based on its own perspective for each wind farm. In order to form a global directed graph of the entire cluster, we superimpose the local directed relationships of all wind farms. Specifically, we aggregate the directed edges of all nodes through the matrix addition operation to generate a global, asymmetric binary adjacency matrix. The definition of the matrix can be as follows:
This is the wind direction superposition matrix. The non-zero element of indicates which wind farms have the wind direction satisfying the condition “wind farm i is located upstream of wind farm j” in all wind farms. It synthesizes the wind direction information of all wind farms and clearly depicts the possible propagation path of wind energy throughout the cluster. For example, if the wind farm j is located downstream of both wind farm i and wind farm k, the matrix elements and are both 1, indicating that j may be affected by both i and k wind farms. The local directed graph of the wind farm and the cluster wind direction superposition matrix are shown in Figure 3.
Figure 3.
Construction process of the cluster wind direction superposition matrix.
This method characterizes the potential upstream and downstream relationship between each wind farm and the remaining wind farms by constructing a directed graph based on its dominant wind direction, and then superimposes the wind direction directed graphs of all wind farms to generate a comprehensive wind direction stacking matrix as part of the graph structure. Input the model to capture the wind direction propagation mode in the regional meteorological field.
2.3.2. Directed Edge Weight Calculation Based on Dynamic NWP Mutual Information
In order to accurately quantify the dynamic meteorological dependence between wind farm i and j within a specific prediction time window T based on the information transmission path defined by the wind direction, this study introduces a mutual information (MI) calculation framework based on a sliding time window. The core of the framework is that the weight of the graph changes dynamically with time t, which can reflect the temporal and spatial evolution of meteorological dependence.
In the construction of a dynamic directed graph, the edge weights need to accurately reflect the complex nonlinearity and time delay dependence between wind farms. The linear correlation coefficient has limited ability to describe this. The mutual information based on information theory is sensitive to nonlinear information, and its sliding window calculation can naturally capture the time delay availability between stations, which is more suitable for the physical process of wind energy propagation. Therefore, this study uses normalized mutual information to calculate dynamic edge weights.
For the prediction at time point t, we use a historical sliding time window with t as the end point and length L to estimate the NWP dependence between wind farms. For each directed edge defined by the wind direction stacking matrix at time t, we dynamically calculate its weight .
Let be the sliding time window for estimation. For each time point in the window, there is wind speed information of wind farm i and j in the corresponding period. Then, the wind speed sequence under the time window is composed, which is recorded as and . These sequences from a different starting time t, but with the same structure, are regarded as samples from a specific dynamic meteorological model. Then, the mutual information weight of time point t is estimated by the samples in the sliding window. The calculation process is shown in (10).
where , , and are the joint probability distribution and the marginal probability distribution estimated based on all samples in the sliding window T, respectively. In order to obtain smooth and non-parametric density estimation, for two wind speed series, we use Kernel Density Estimation (KDE) to estimate the joint probability density and edge probability density, and then calculate the mutual information [35].
The calculation results of the original mutual information are not naturally located in the [0, 1] interval. In order to normalize the weights and enhance the numerical stability, we use normalized mutual information :
where and are also entropy calculated based on the samples in the sliding window T. Finally, we generate a dynamic NWP mutual information weighted wind direction stacking matrix , whose element definition is shown in (12).
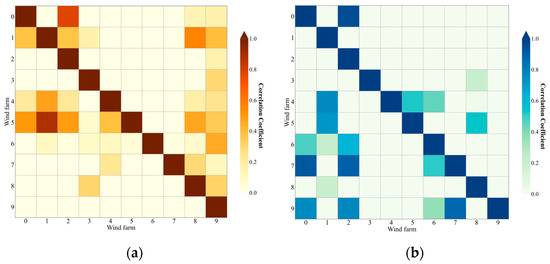
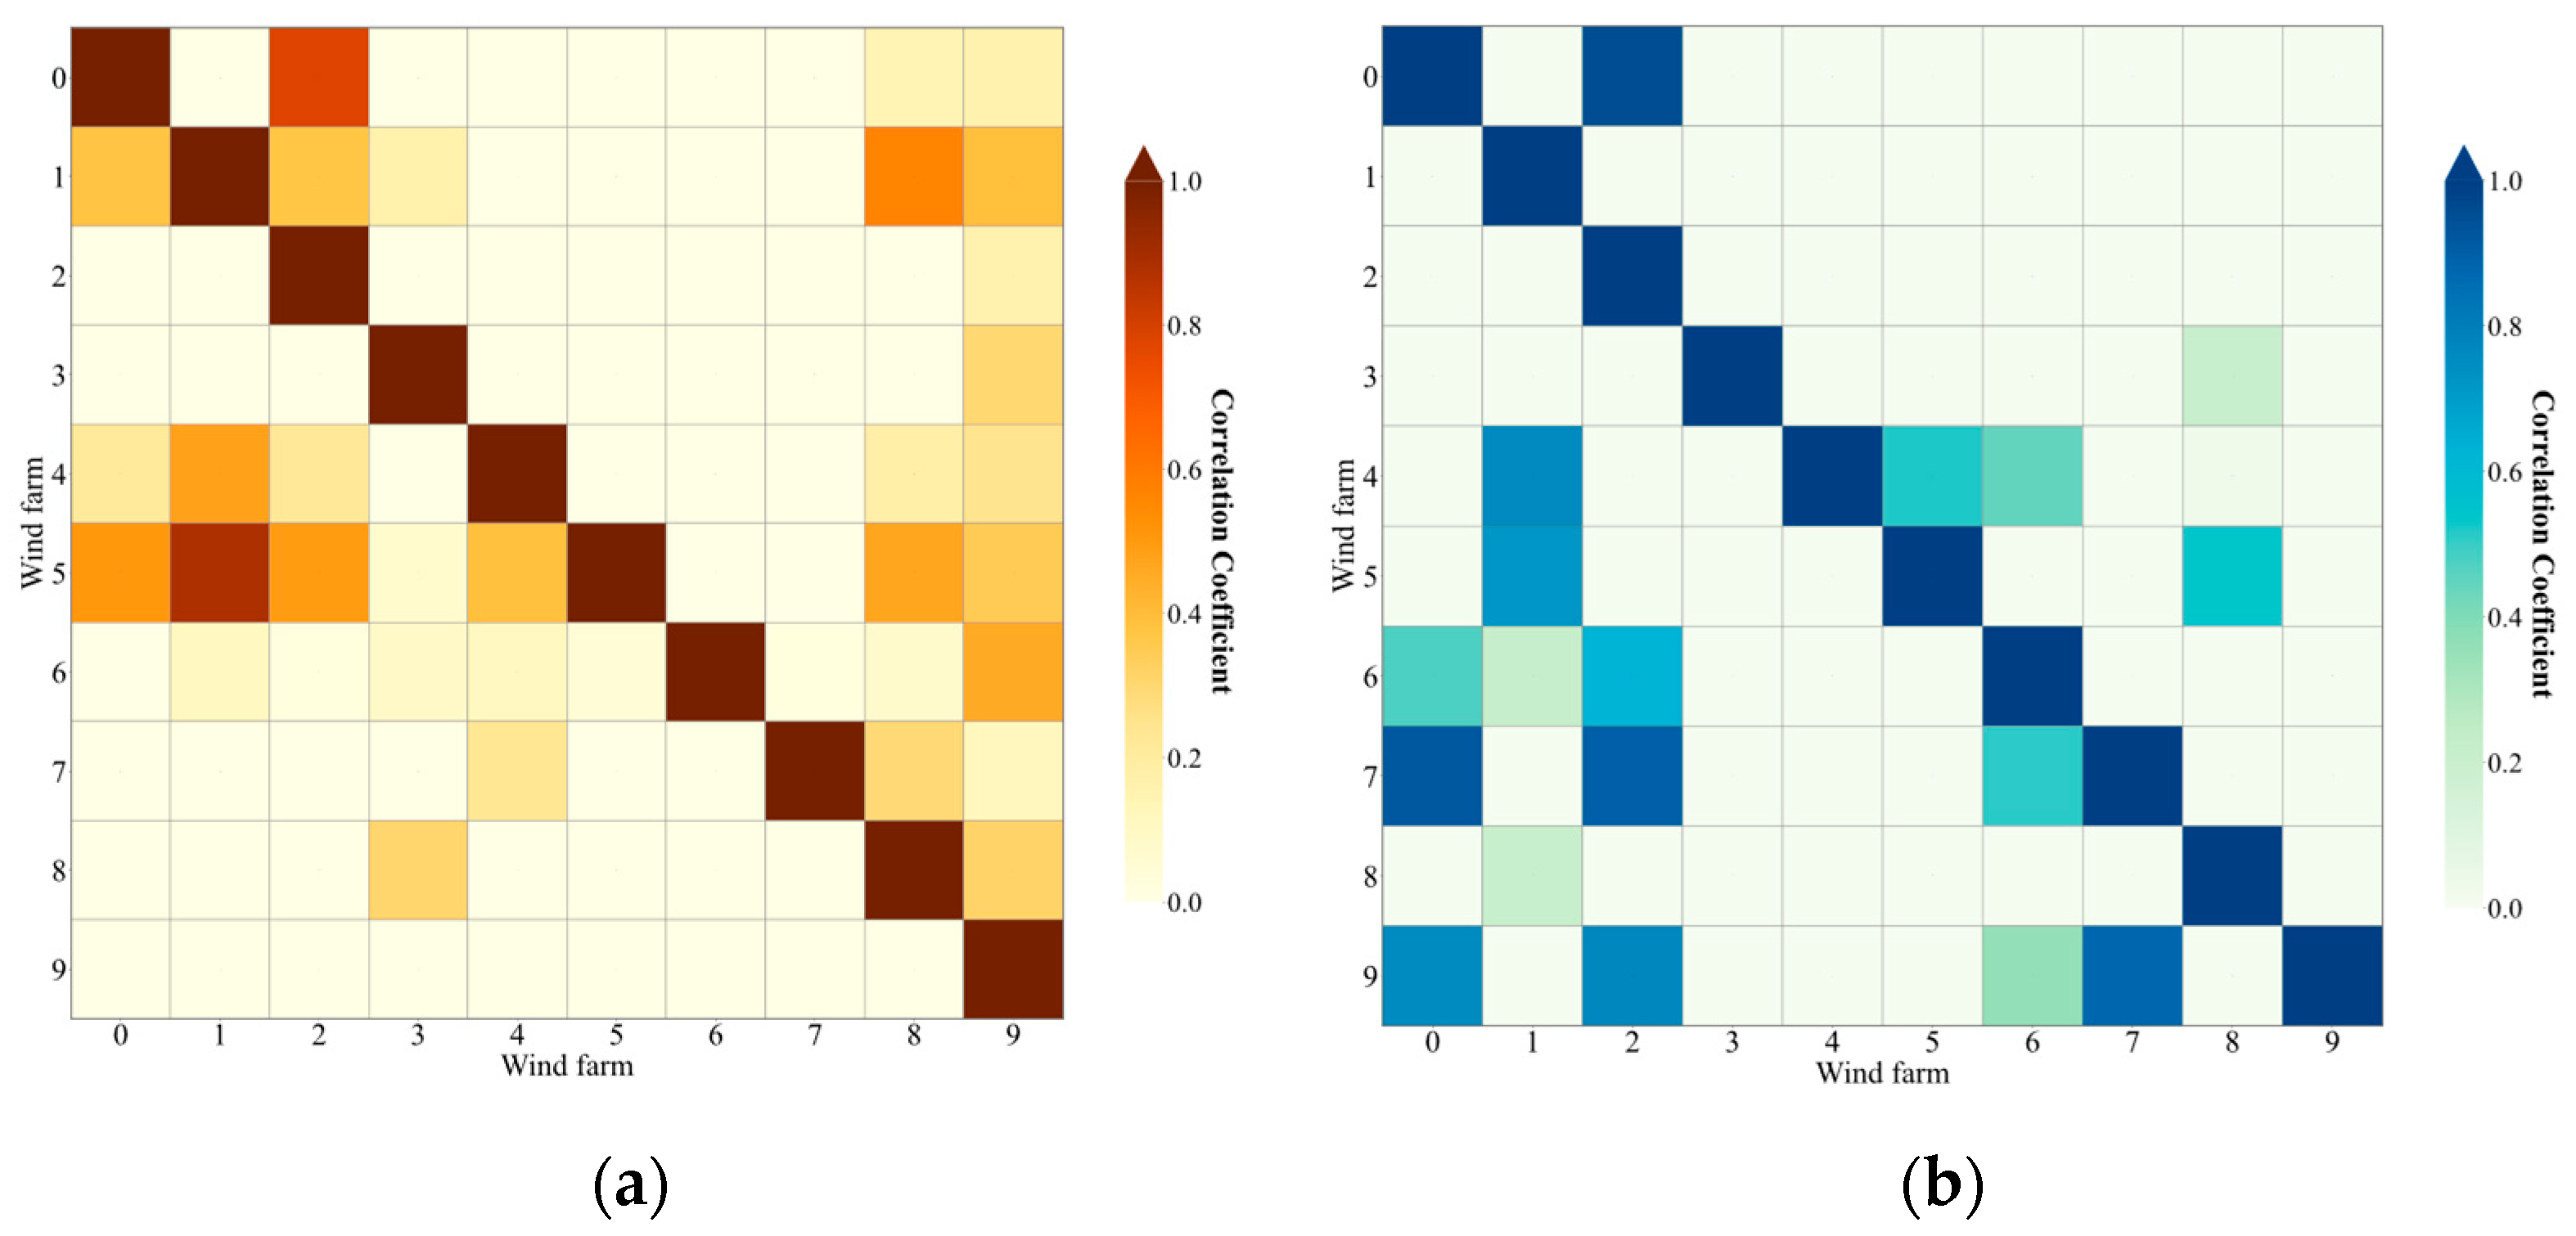
On the whole, this design is based on a phased modeling strategy: first, using the physical certainty of wind direction to establish a directed adjacency relationship, and secondly, the nonlinear dependence strength on the directed connection is quantified by MI. The wind direction weight stacking matrix aims to integrate the local perspectives of all stations to form a global and stable directed connection skeleton. The superposition weight matrix under different wind directions is shown in Figure 4. This modeling method makes the constructed graph structure have stronger adaptive ability. When the weather process changes, the samples used to estimate the probability distribution are also updated, so that the mutual information weight reflects the latest dependency pattern. While fully reflecting the actual wind process, it is conducive to improving the prediction accuracy of subsequent modeling.
Figure 4.
The superposition weight matrix under different wind directions. (a) Wind direction superposition weight matrix of the southwest wind. (b) Wind direction superposition weight matrix of the northwest wind.
2.4. DGTK-Net Model Architecture
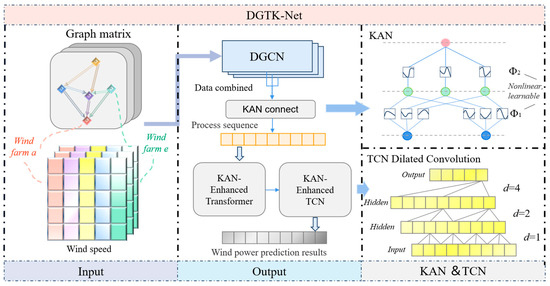
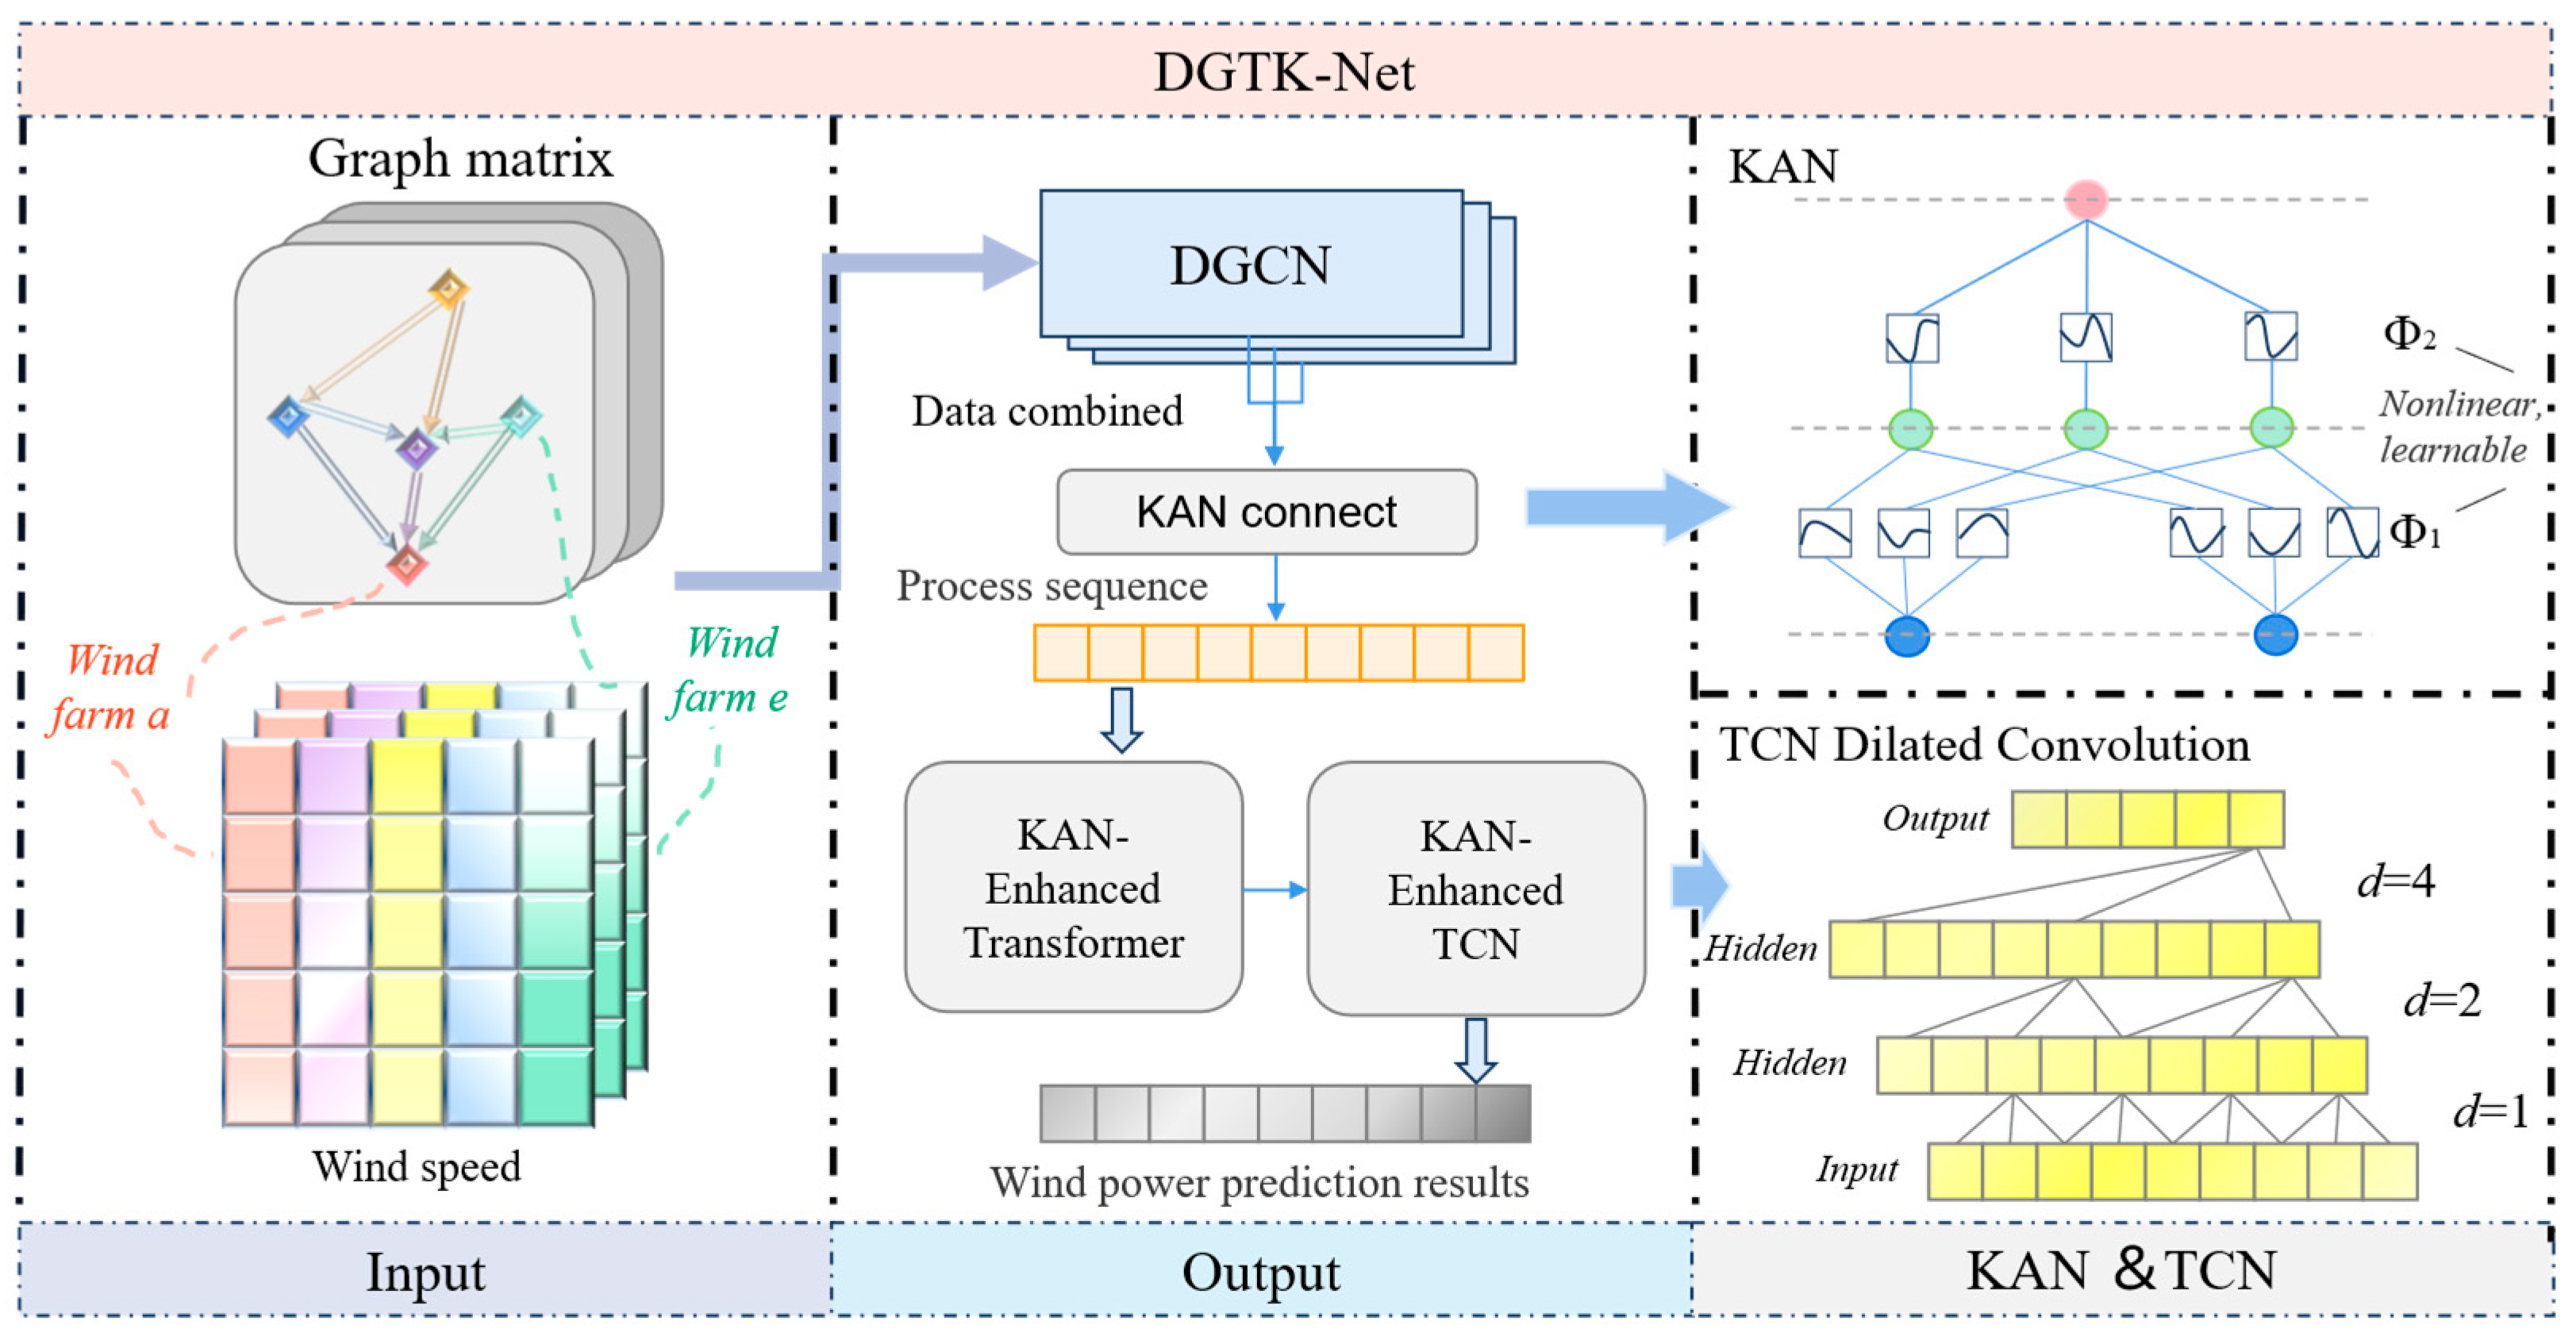
The overall architecture of DGTK-Net is shown in Figure 5, which is mainly composed of three parts: the input and graph structure construction module, the spatial feature extraction module, and the time feature extraction module.
Figure 5.
DGTK-Net model architecture diagram.
DGTK-Net inherits the inherent advantages of a dynamic graph convolution network (DGCN) and Transformer in collaborative modeling of spatio-temporal dependencies under a unified framework. It can not only understand the spatial graph structure of wind farms, but also grasp the global information in the time window. By introducing KAN, the model is not limited by the traditional MLP fixed activation function, which is conducive to learning the nonlinear mapping relationship in the wind power prediction task.
2.4.1. Spatial Dependency Modeling: DGCN Module
In this study, a multi-layer graph convolutional network is used to aggregate the information of neighbor nodes to extract high-order spatial features. For the l-th layer GCN, its operation can be expressed as
where is the self-connected adjacency matrix, is its degree matrix, is the trainable weight matrix, and is the activation function. After the pre-aggregation information passes through the l-th layer GCN, we obtain the node feature rich in spatial near-field wind farm information. By dynamically updating the input , the dynamic graph processing mode of DGCN can be constructed. DGCN can not only give full play to the inherent advantages of collaborative modeling of spatio-temporal dependencies under a unified framework, but also understand the spatial graph structure of wind farms, understand the temporal change process of meteorological information, and more closely fit the actual operating conditions of wind farms.
2.4.2. Time Dependence Modeling: KAN-Enhanced Transformer–TCN Module
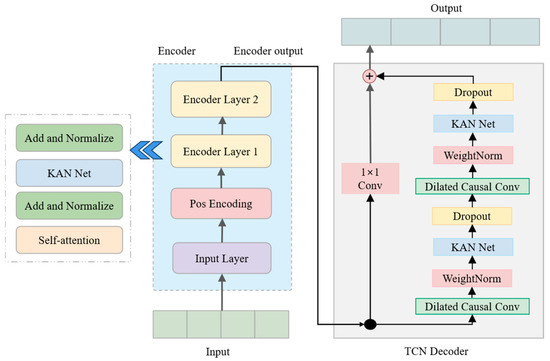
The feature sequence of the aggregated spatial information is sent to a stack composed of a Transformer encoder–decoder. A Transformer is a deep learning model for processing sequence data. The main structure of the original Transformer is an encoder–decoder architecture, followed by position coding, a dimension-up embedding layer, and a fully connected output layer. The self-attention mechanism of a Transformer can capture the global dependencies between any two time steps in the sequence. Combined with the short-term prediction task of wind power, this paper proposes the KAN-Enhanced Transformer–TCN module. The related improvements mainly include the following aspects.
- (1)
- The normalization process in the encoder of the original model is placed before the embedding layer to adapt to the normal wind power prediction process.
- (2)
- Improve the original encoder–decoder structure. After the encoder block extracts the global features of the time series data, the TCN layer is connected to further local processing of the data to replace the original decoder block.
- (3)
- The KAN is effectively introduced into the overall architecture of the model to replace the original feedforward network layer and the output full connection layer. Adaptively learn the most suitable nonlinear transformation for the complex dynamics of wind power series.
The Transformer’s multi-head attention mechanism processes the input time series data into Q (query vector), K (keyword vector), and V (value vector) through the initial randomly set and weight matrix. Each attention can obtain an output matrix, as shown in (14).
where softmax (·) realizes normalized calculation, and is the dimension of the keyword vector K. Inspired by [36], we place normalization before the embedding layer. This structure has been proved theoretically and practically to bring more stable gradient flow, faster convergence speed, and lower sensitivity to learning rate hyperparameters, and we will further verify it from the case analysis. Each attention is calculated in parallel, and different output matrices are obtained. After splicing and multiplying the corresponding weight matrix, the output result of the multi-head attention mechanism can be obtained, as shown in (15).
where (·) is the output matrix splicing function and is the weight matrix corresponding to the output matrix.
The self-attention mechanism of the original Transformer decoder has high computational complexity on long sequences and insufficient capture of local fine-grained temporal patterns. We introduce the temporal convolutional network into the model. Because of its causal dilated convolution characteristics, it can efficiently capture the temporal dependence of local information with low complexity, and has been proven to perform well in wind power prediction tasks [37]. On the basis of causal convolution, the model introduces the expansion factor d, which can effectively reduce the number of layers of the model for long historical information data. Taking TCN with a convolution kernel of 2 and a dilation factor of d = [1, 2, 4] as an example, the architecture of dilation causal convolution is shown in Figure 4. The corresponding convolution output is shown in (16).
where F(s) is the convolution output at the time step s, f(i) is the i-th element of the input sequence, and x is the coefficient of the convolution kernel. d is the size of the convolution kernel, that is, the length of the convolution kernel. k is the length of the output sequence, ∗ represents the convolution operation, and defines the sliding window of the convolution kernel on the sequence.
The TCN model introduces residual blocks to solve the adverse effects, such as gradient disappearance, caused by deep network layers. The residual block structure is shown in Figure 6, which is placed between TCN layers instead of a simple linear connection. Through the above two structures, TCN can effectively extract local features in data, and also has the ability to perform parallel processing. A reasonable application can effectively deal with time series problems.
Figure 6.
KAN-enhanced Transformer–TCN model architecture schematic diagram.
In order to break through the flexibility bottleneck of the fixed activation function in the traditional MLP in approximating complex nonlinear functions, this study introduces KAN into the model instead of MLP to improve the nonlinear expression ability of the model. The core of KAN lies in its learnable, data-dependent activation function [38]. This property enables it to approximate complex functions more efficiently in theory. Recent studies have confirmed that in the wind power prediction task, the KAN-based model is superior to the traditional MLP architecture in prediction accuracy [39].
In a standard Transformer, the location-aware feedforward network is a two-layer MLP. In DGTK-Net, we replace it with a layer, and the specific form of its operation is shown in (17).
where x is the input data, each is a learnable function parameterized as a B-spline. is the B-spline basis function, and is the basis function.
As shown in Figure 5, KAN is no longer limited to a fixed activation function, and its activation shape can be dynamically learned based on data, which enables the model to adaptively learn nonlinear transformations suitable for the complex dynamics of wind power sequences. The KAN is used in the output layer to learn the mapping from high-dimensional spatio-temporal features to the final power value with higher parameter efficiency, which is expected to further improve the overall expression ability and prediction accuracy of the model.
3. Case Study
3.1. Data Description and Evaluation Index
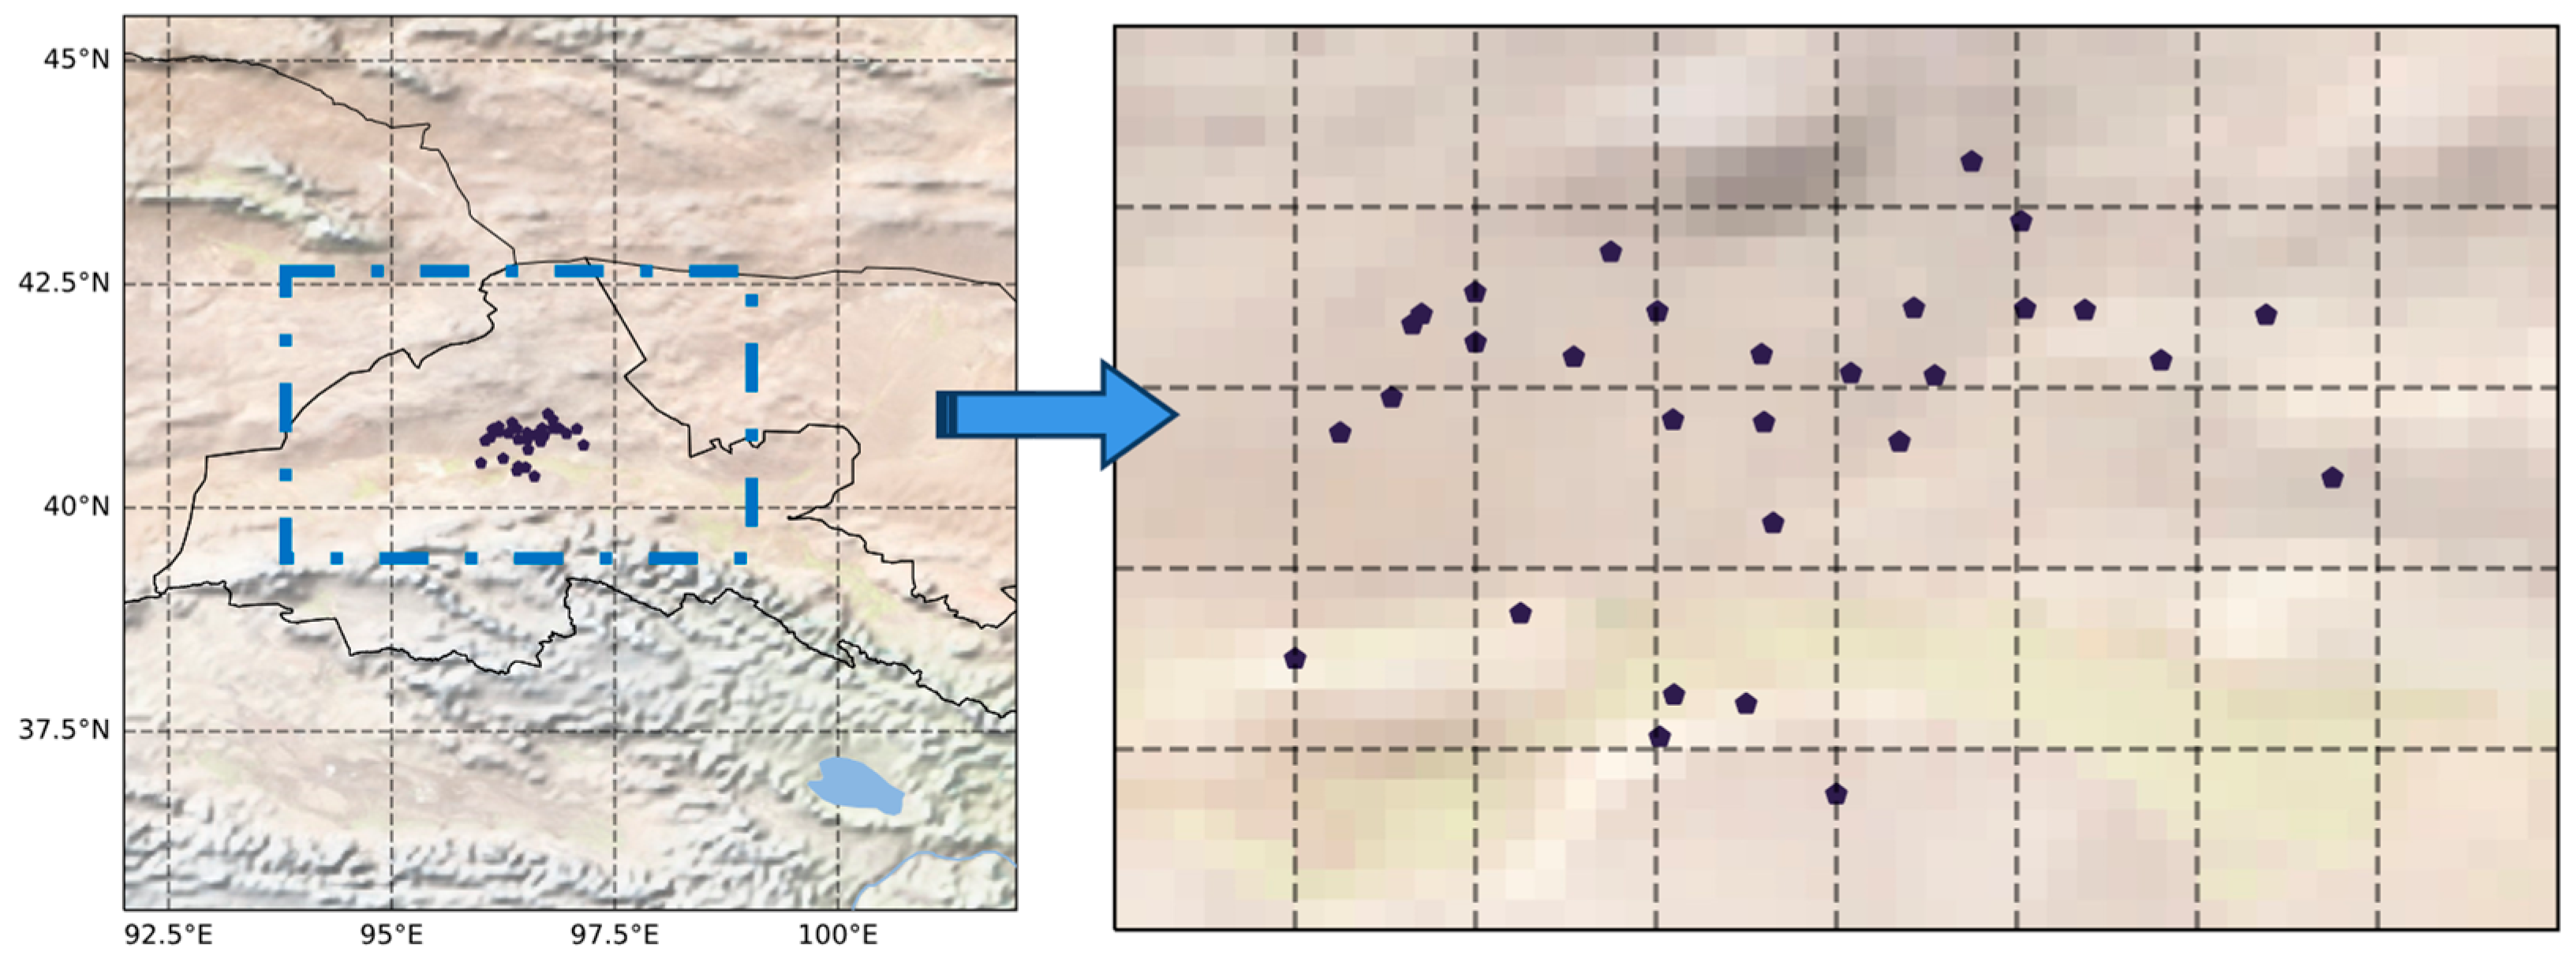
In this paper, a wind farm cluster in a certain area of Gansu Province, China, is selected for the main example analysis. The number of wind farms in the cluster is 31, the total installed capacity is 5281 MW, and the data length is from 1 June 2020 to 31 December 2020. The specific distribution of the wind farm is shown in Figure 7. The data set contains historical measured power data and NWP data. The time resolution is 15 min, and the data in December 2020, with typical high volatility, is taken as the test set. In order to verify the generalization performance of the model in different seasons and regions, a wind power cluster in Inner Mongolia, China, is selected as the case study object. The cluster contains 70 wind farms with a total installed capacity of 9094 MW. The data from 1 June 2020 to 1 June 2021 is used as the training set, and the data from 2 June 2021 to 31 June 2022 is used as the test set.
Figure 7.
Geographical location distribution of wind farms.
The example of this study is based on the Windows system. The CPU and GPU configurations are Intel core i7-14700HX and NVIDIA RTX4070, respectively. At the same time, the data processing of the model in this paper is all based on the Python3.9 version, and the PyTorch2.2.2 framework is used to complete the model construction. The main libraries of this method are torch-geometric and torch-geometric-temporal.
The related network hyperparameters also affect the prediction performance. The optimal parameters are adjusted by the control variable method. The main hyperparameters with high sensitivity determined in this study are as follows: Chebyshev filter size K = 3, the number of output channels of DGTK-Net C = 31, and the number of network layers N = 2. In order to reduce the over-fitting phenomenon, it is verified by experiments that the embedded layer dimension in the Transformer model is six, the number of stacked encoder layers is two, and the number of heads of the multi-head attention mechanism is three. The kernel size = 2, the expansion coefficient = 2. The learning rate lr of the Adam optimizer is set to 0.01, and the weight decay is set to 0.0001. The batch size of model training is 64, and the number of iterations is epoch = 80. Other comparison models are also optimized according to the above method. These adjusted hyperparameters are already the most favorable results for the prediction results at present. The experimental results show that the difference between the RMSE of the training set and the test set of the proposed method is only 10−4, so the prediction performance of the training set and the test set is not much different, and the model does not have the risk of overfitting.
The sector definition θ of the directed edge and the selection of the time window L will affect the modeling process and the final prediction results, and the two have a certain coupling relationship with the degree of influence on the prediction results. Therefore, the statistical results obtained by different combinations are used to determine the parameters of the two. The statistical results are shown in Table 2. The evaluation index NRMSE is the average of multiple experimental results. A too-wide θ will lead to the introduction of redundant information and increase the computational cost. A too-narrow θ can not fully reflect the actual directed connection relationship. When L is too short, the graph structure noise increases significantly, and the performance decreases. When L is too long, the dynamic response ability of the graph is weakened, and the calculation cost is increased. Considering the prediction accuracy and calculation cost, the final choice is θ = 90° and L= 16 (4 h).
Table 2.
Wind direction sector and time window statistical selection.
In this study, Root Mean Squared Error (RMSE), Mean Absolute Error (MAE), and correlation coefficient (r) were selected as evaluation indices. The relevant calculations are shown in (18), (19), and (20).
where n represents the number of samples in the test set, represents the actual power of wind power, represents the predicted power, and represents the installed capacity. is the mean of the actual value; is the mean of the predicted value.
3.2. Effectiveness Analysis of Cluster Partition Method
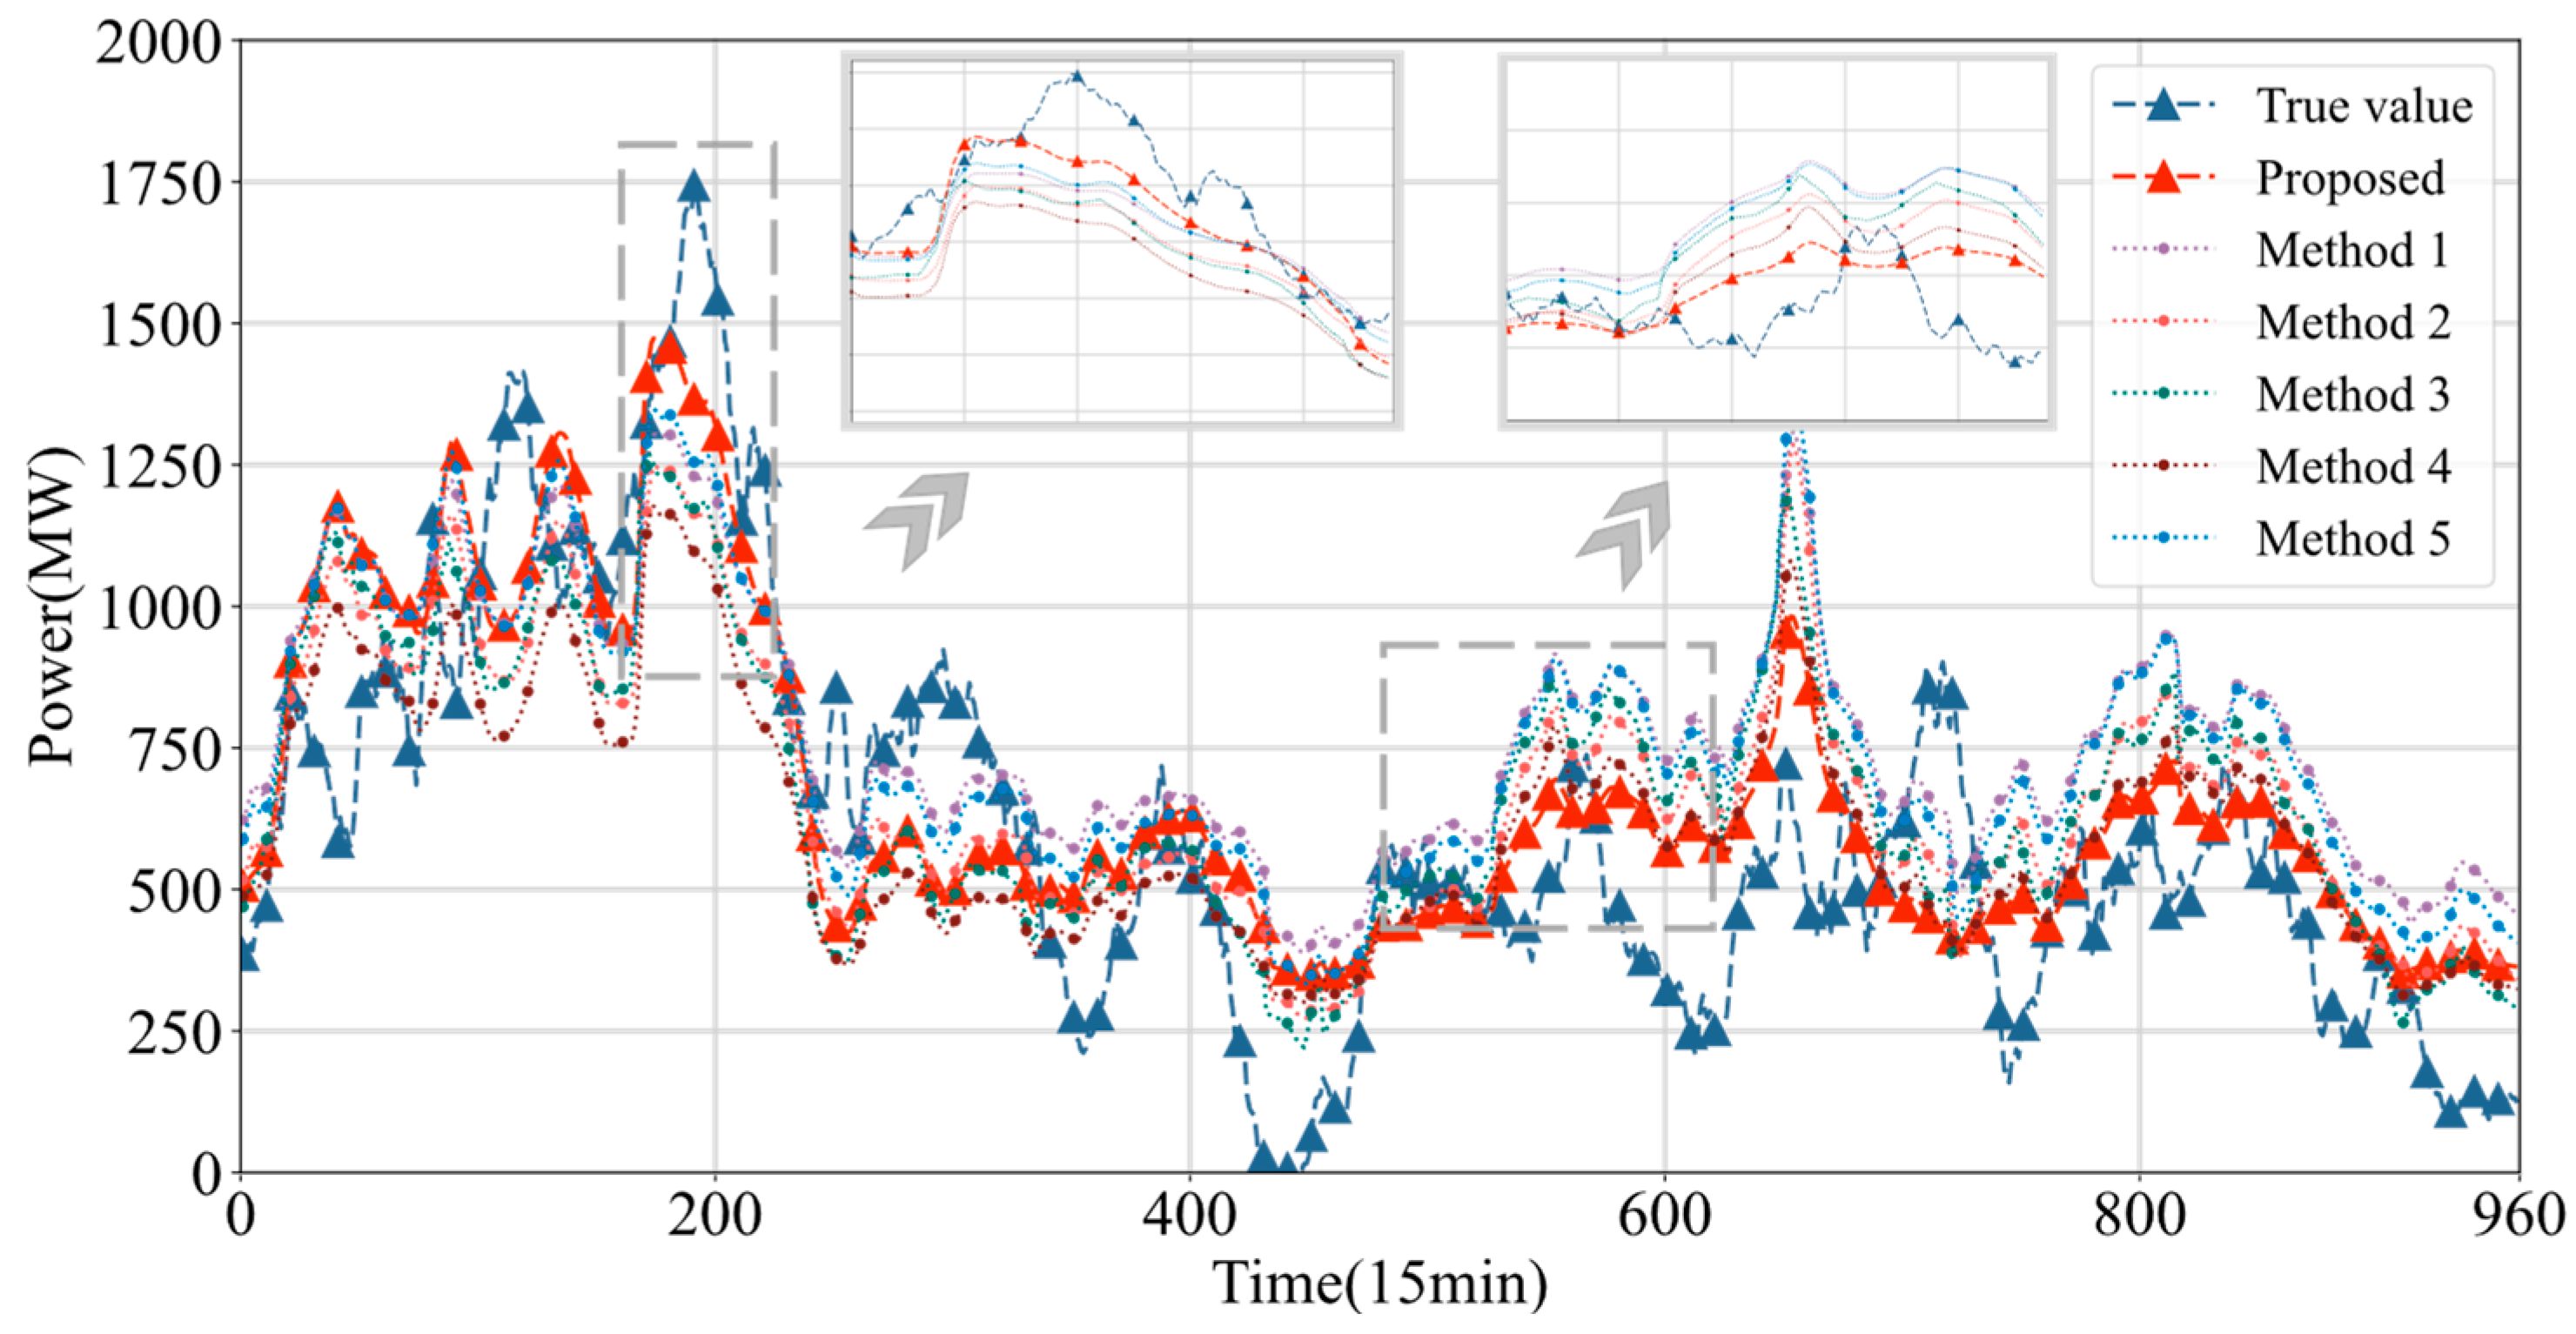
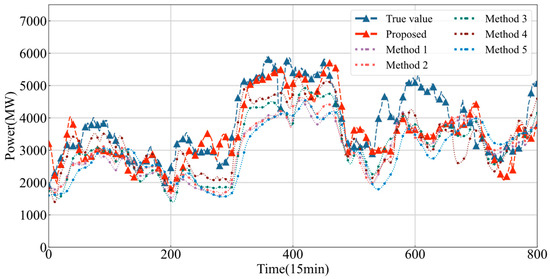
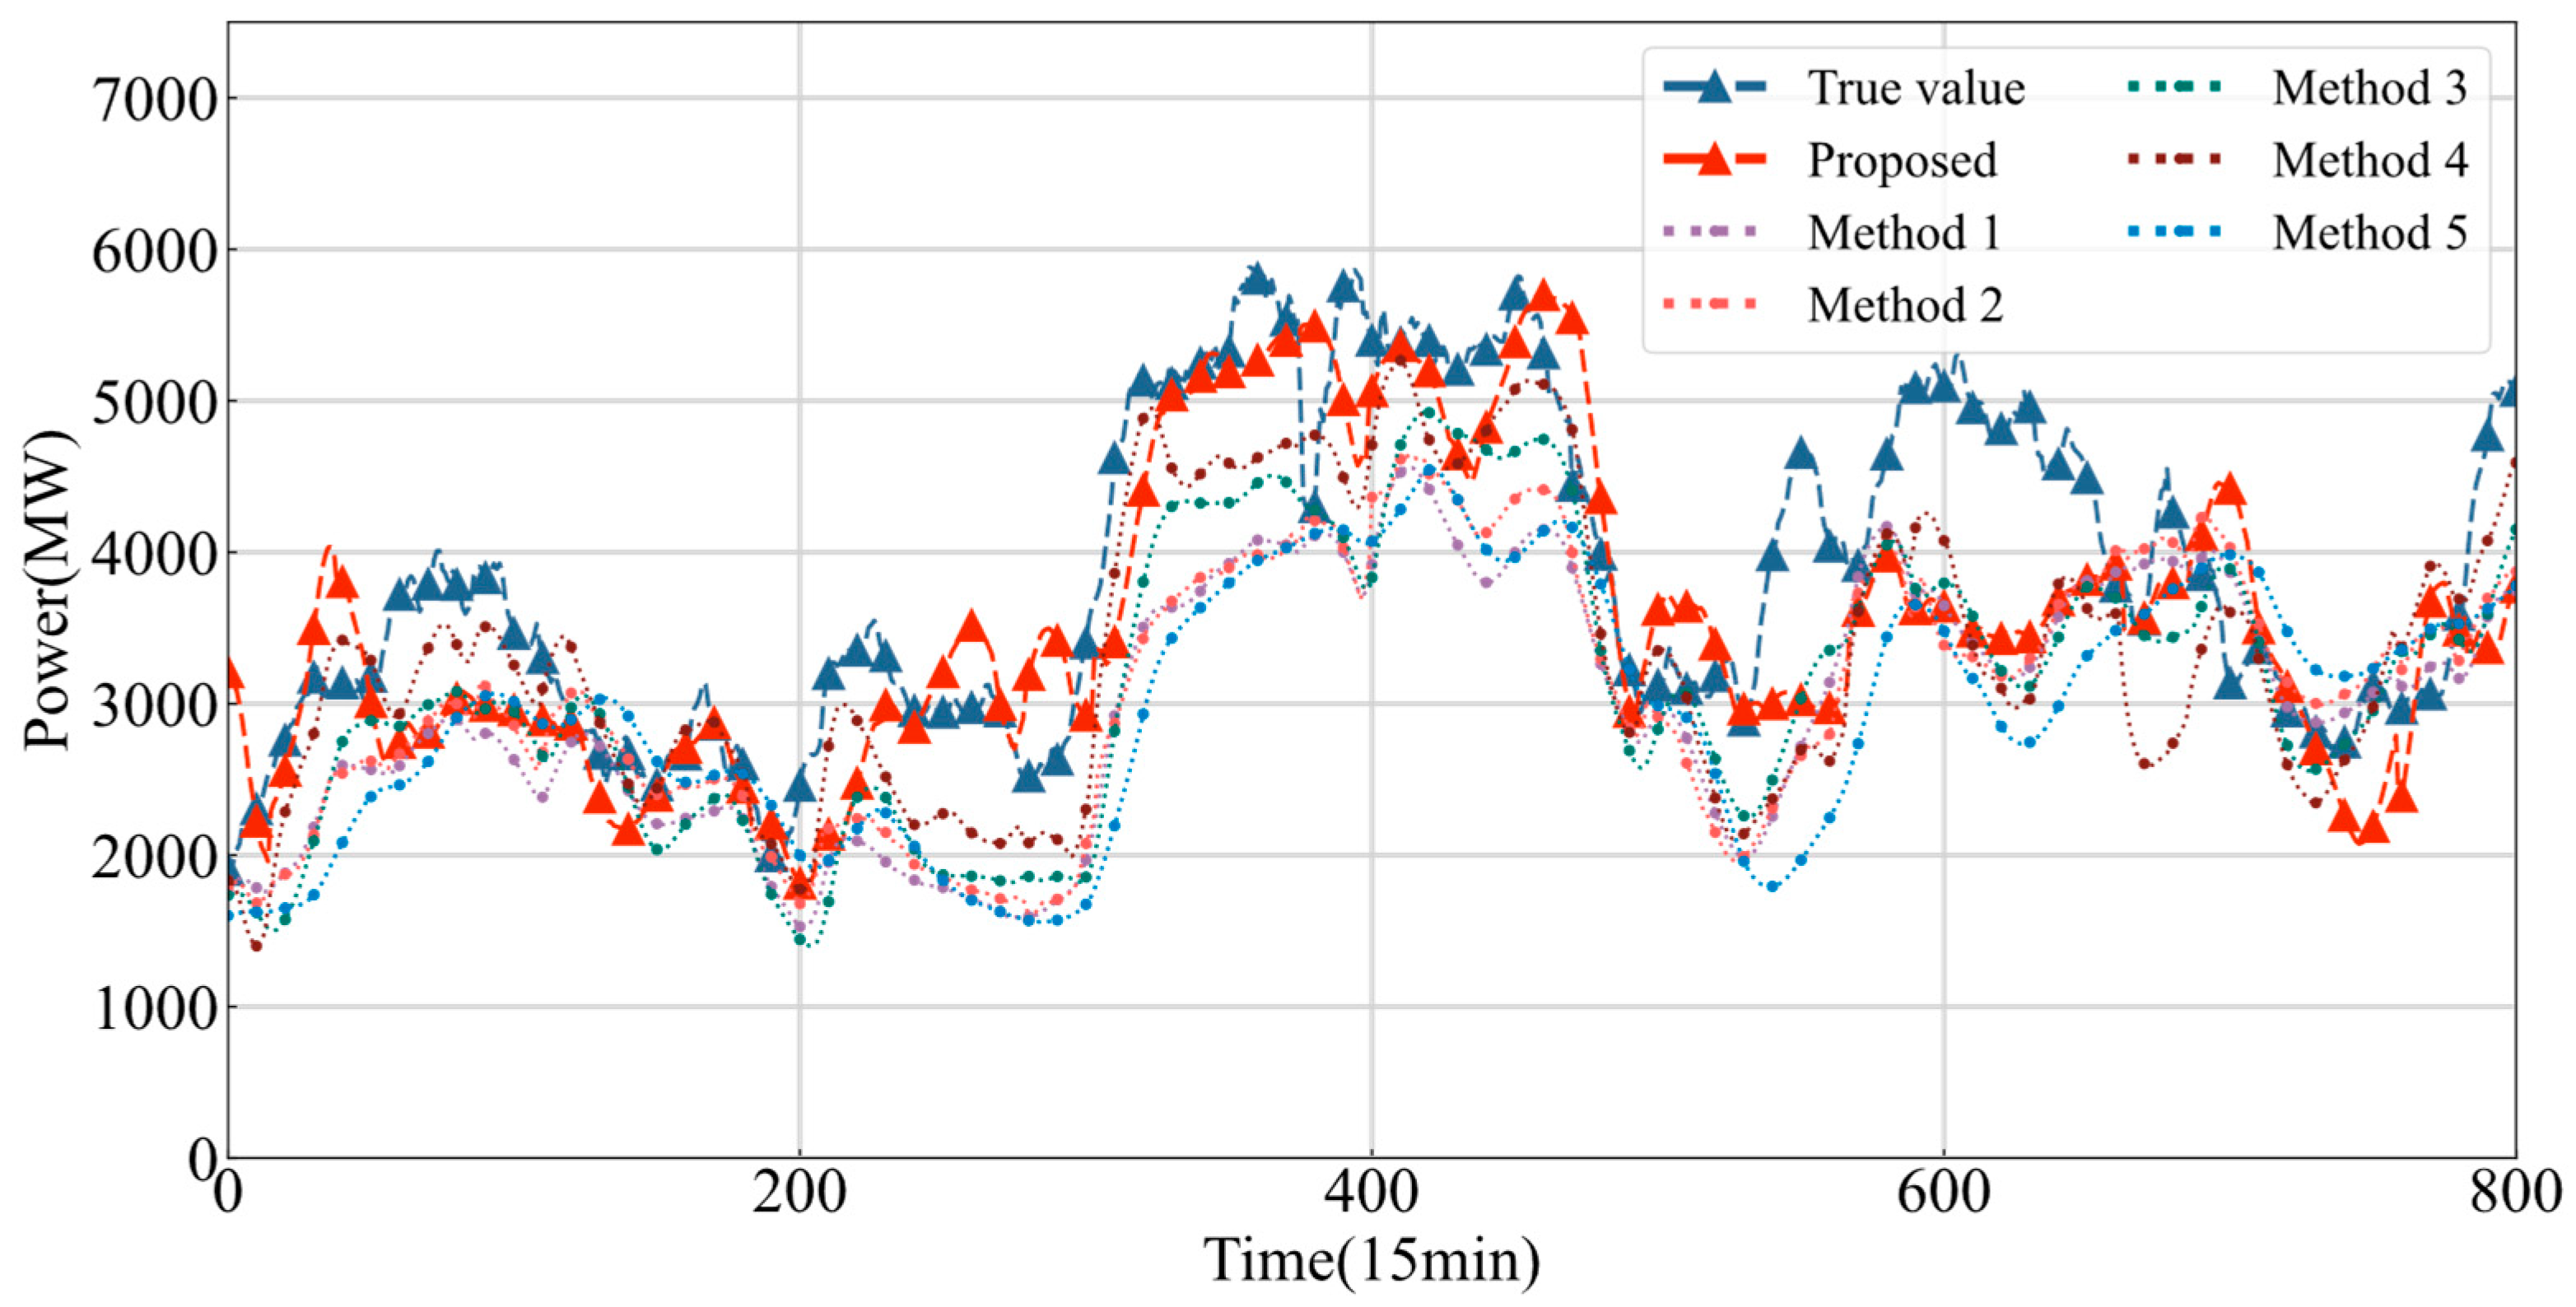
For the cluster prediction method proposed in this study, a comparative analysis of the cluster division methods is first performed. Through the fixed prediction model, the method of replacing the clustering method is verified. The comparison of clustering methods is shown in Table 3, and the prediction results are shown in Figure 8 and Table 4. The proposed method is as follows: SFCM cluster partition method (based on geographical location and NWP) + overlay dynamic graph structure based on wind direction + DGTK-Net. Compared with the proposed method, methods 1–5 only change the input characteristics and clustering algorithm of cluster partition, and the remaining graph construction, model architecture, training strategy, and hyperparameters are exactly the same.
Table 3.
Description of different cluster partition methods.
Figure 8.
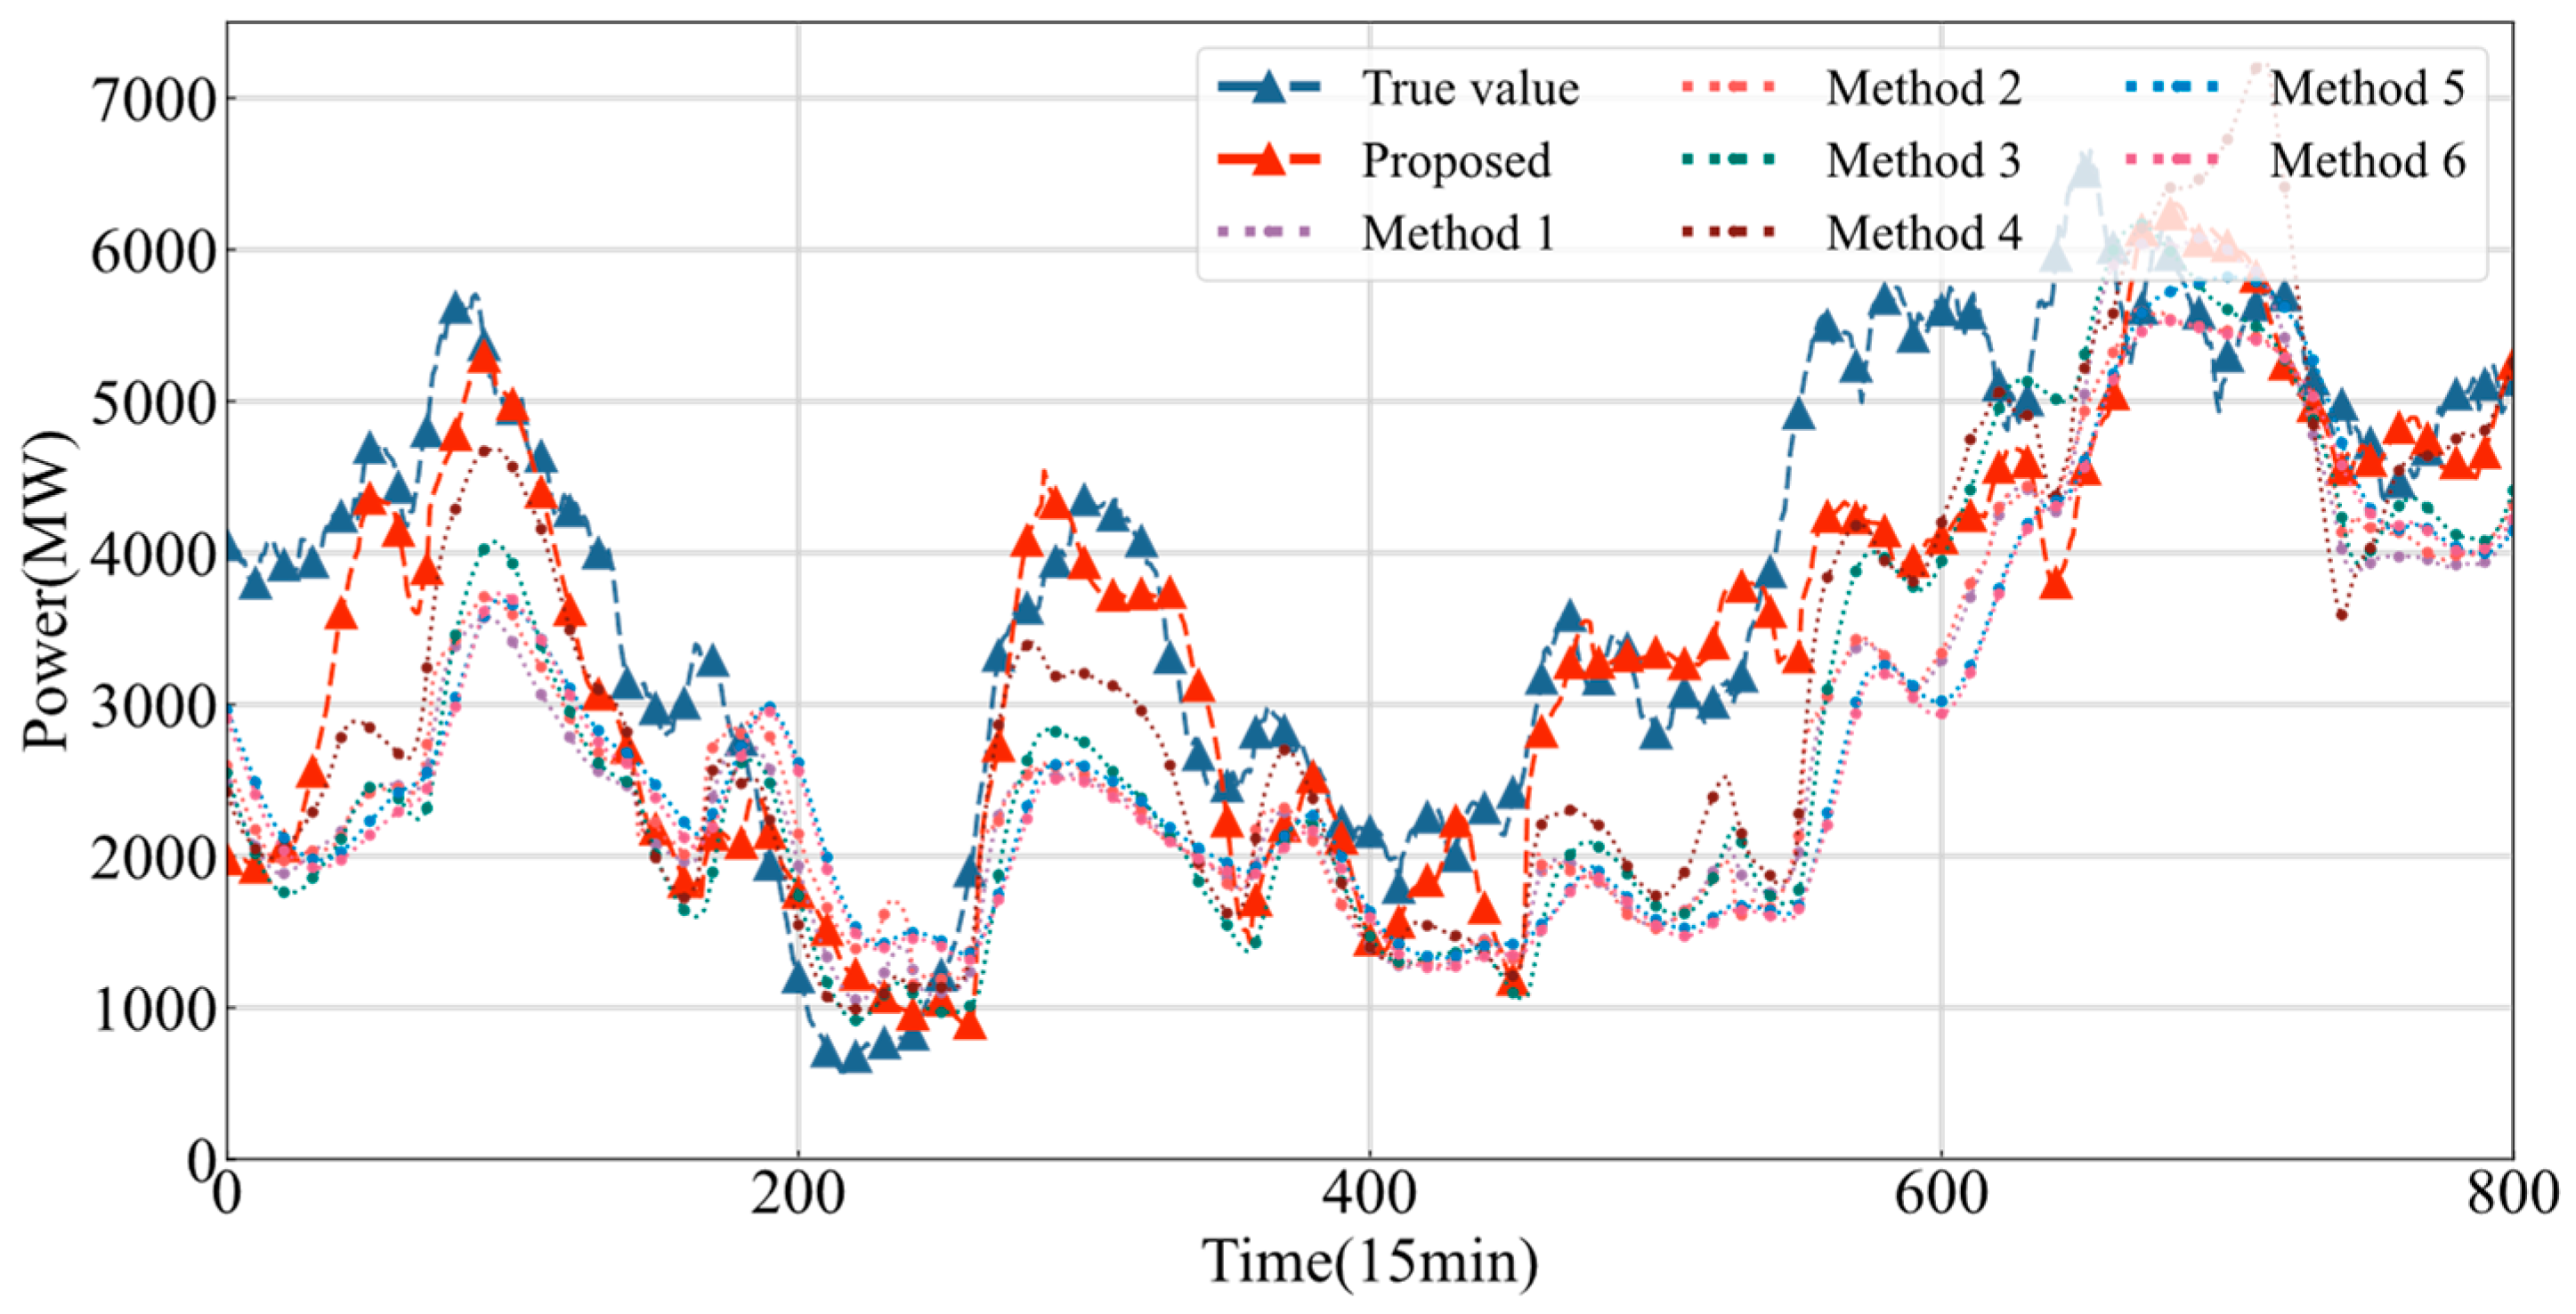
Comparison of power prediction of different cluster division methods in Gansu cluster.
Table 4.
Index comparison of prediction results of different cluster partition methods.
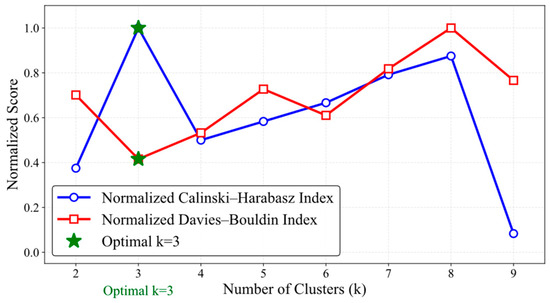
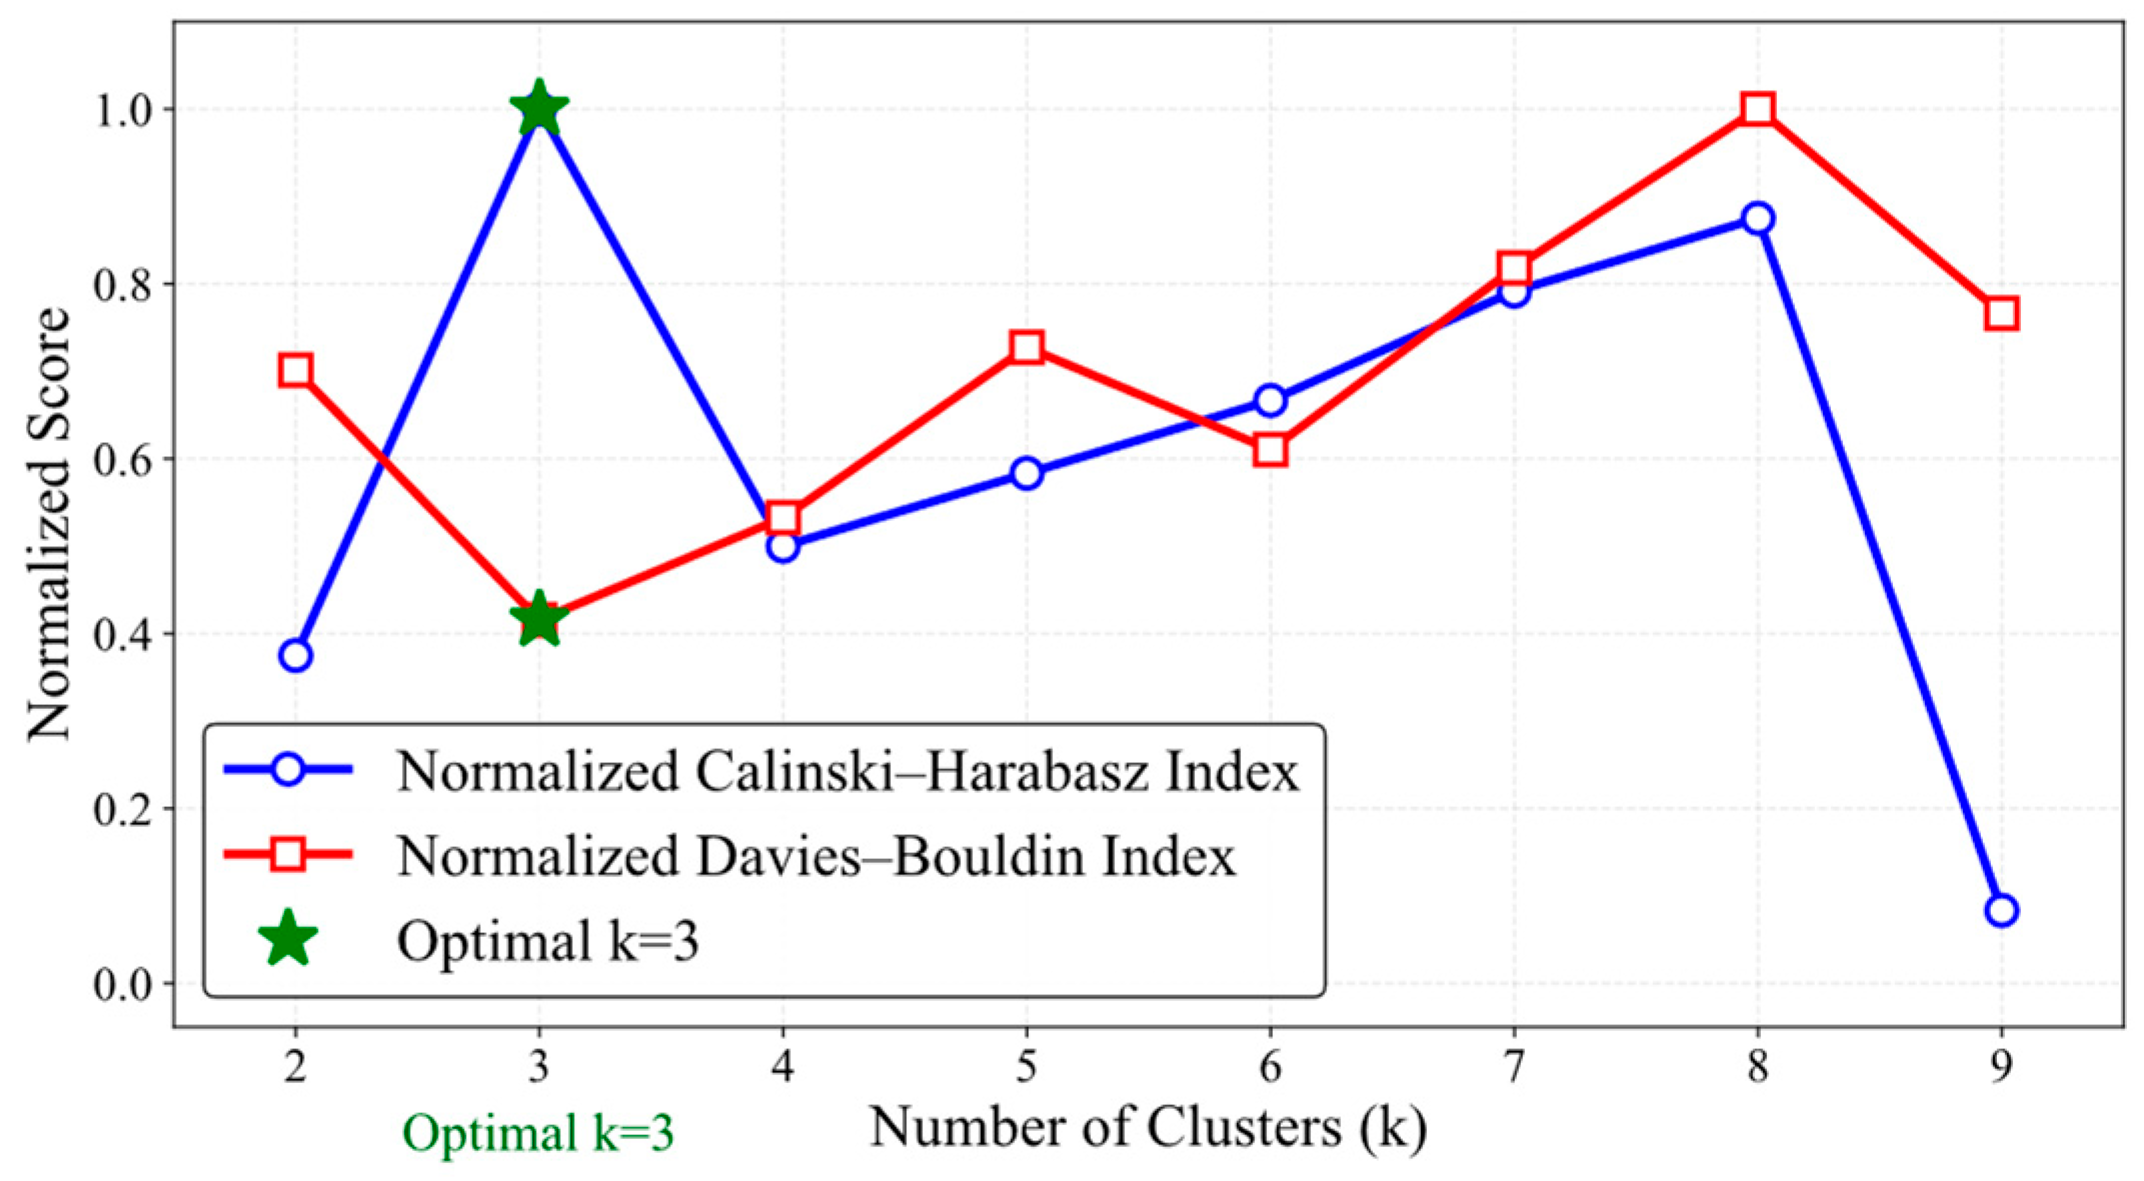
Considering the rationality of the number of clusters, this paper uses the Calinski–Harabasz Index and the Davies–Bouldin Index to evaluate the clustering results. The above two indicators are visualized as shown in Figure 9. The larger the Calinski–Harabasz Index, the better, and the smaller the Davies–Bouldin Index, the better. According to the comprehensive evaluation, considering the distance and fusion information, when the number of clusters is 3, the relevant indicators are the most excellent.
Figure 9.
Evaluation index of clustering number.
Firstly, the necessity of multi-source information fusion in cluster partition is analyzed. The proposed method achieves the lowest NRMSE and NMAE, which is significantly better than method 1 and method 2. This shows that it is not sufficient to rely solely on NWP correlation or geographical location information for cluster division. Geographical location defines the static and basic spatial proximity between wind farms, while NWP information (especially wind speed and wind direction) reveals the dynamic and physical interaction between stations under the influence of specific weather systems. The average mutual information values of the internal wind speed series of sub-clusters divided only by NWP or geographical location are about 12% and 19% lower than those of the proposed method, respectively. Method 1 ignores the geographical constraints, which may cause the cluster to be too scattered in space, and it is difficult to construct a local graph relationship with physical meaning. Method 2 ignores the dynamic evolution of the meteorological field and cannot adapt to the correlation transfer caused by NWP changes. The distinction between wind farms at the internal edge is poor. Therefore, the spectral embedding clustering that combines the two can more accurately identify the wind farm groups that are highly correlated in space-time and physical attributes, which lays a solid foundation for the subsequent learning of graph neural networks.
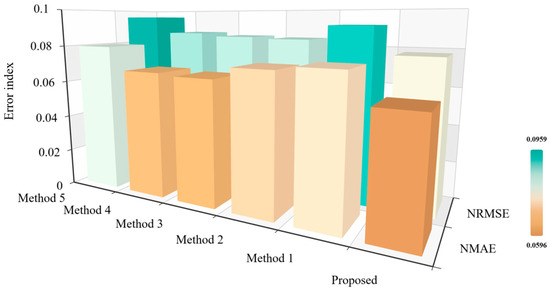
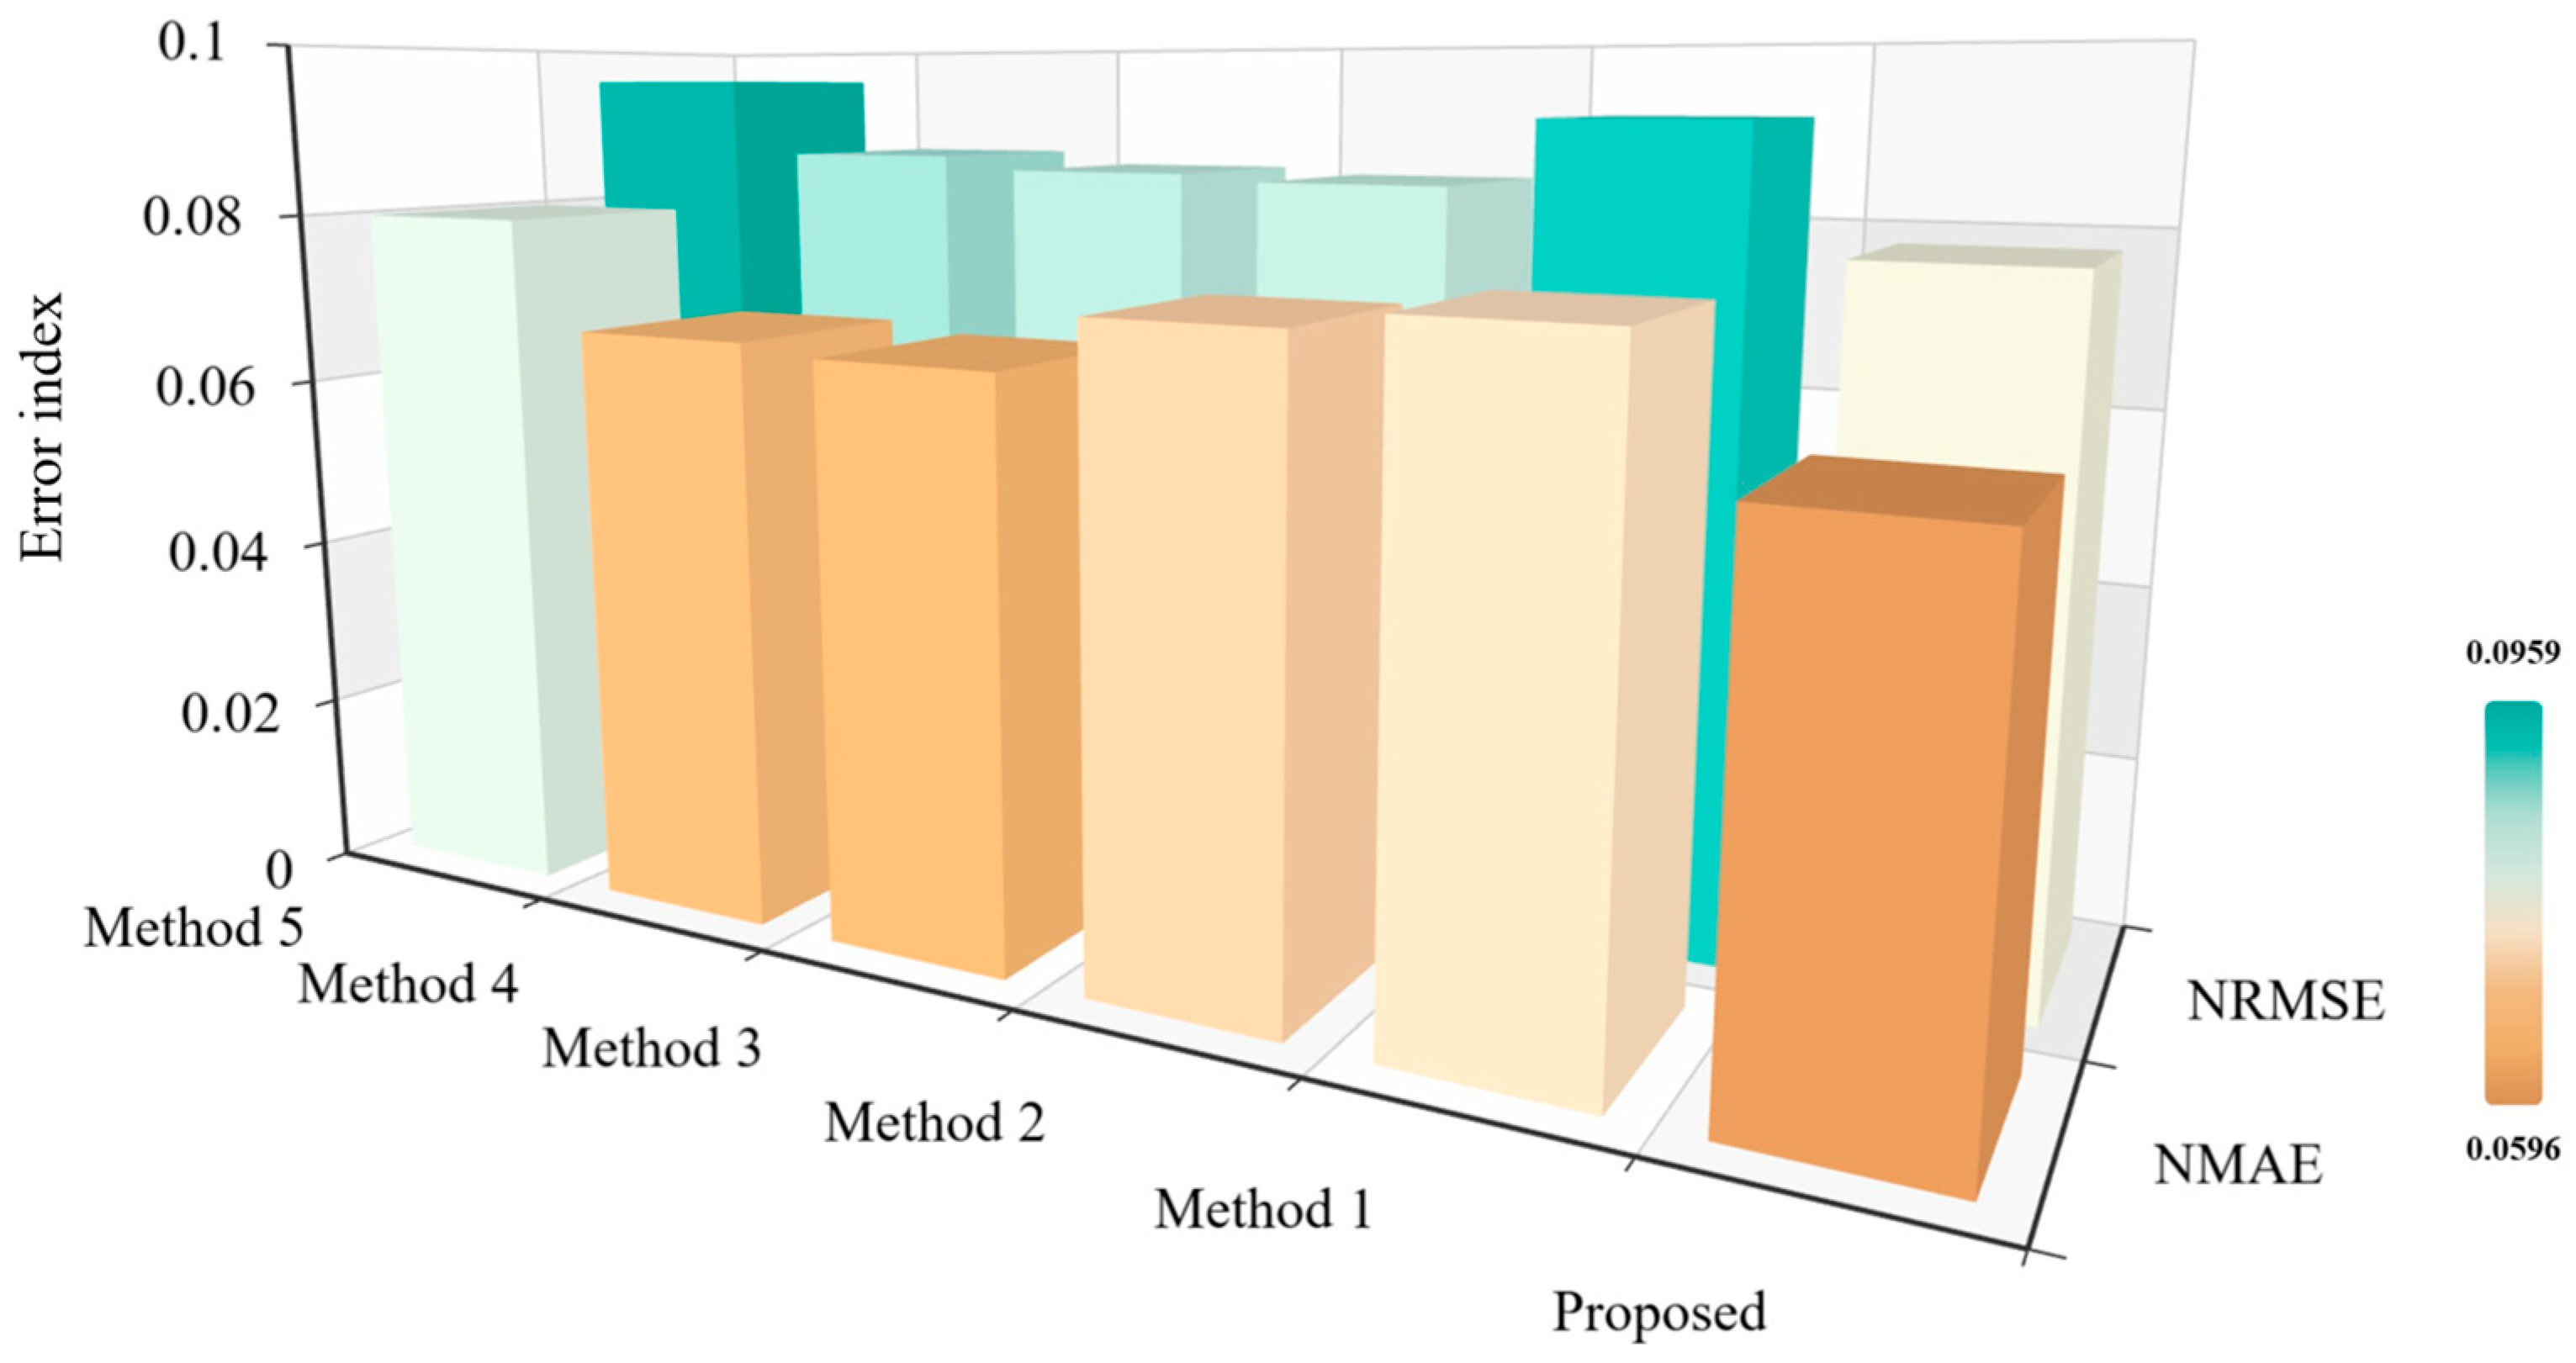
Through the comparison of the visual indicators in Figure 10, the NRMSE of the proposed method is reduced by 0.87% on average compared with the methods 3 and 4. The Calinski–Harabasz index of this method is 0.21 higher than that of methods 3 and 4. This further verifies the effectiveness of spectral embedding technology in wind farm cluster division. Standard FCM and K-means are directly divided in the original high-dimensional feature space, which has strong assumptions on data distribution and is susceptible to noise and dimensions. Spectral embedding maps data to a low-dimensional essential space by constructing a similarity matrix and decomposing its features, which can better capture the intrinsic manifold structure of the data. For complex heterogeneous data such as “geographic location + NWP”, spectral embedding can more effectively discover its nonlinear cluster structure, resulting in higher quality and clearer physical meaning of cluster division. Combined with the local curve in Figure 8, the NRMSE of the proposed method can be reduced by 1.81% on average during the high-output climbing period. In the period of low output fluctuation, the performance gap of each method is reduced, but the correlation coefficient of this method is still improved by about 1.47%. In addition, method 1 (fuzzy partition) is superior to method 4 (hard partition), indicating that fuzzy clustering can more reasonably describe its membership degree between different clusters and provide more abundant modeling information.
Figure 10.
Visual comparison of prediction results indicators.
The performance of method 5 (non-clustering) is far inferior to all other methods, which fully proves the necessity of fine-grained cluster partitioning. Considering the entire wind farm group as a huge and homogeneous graph, a large number of unrelated or weakly related node connections will be introduced, which not only greatly increases the complexity of the model but also dilutes the key spatial dependence signals, making it difficult for the model to capture the close spatial-temporal correlation in the local area.
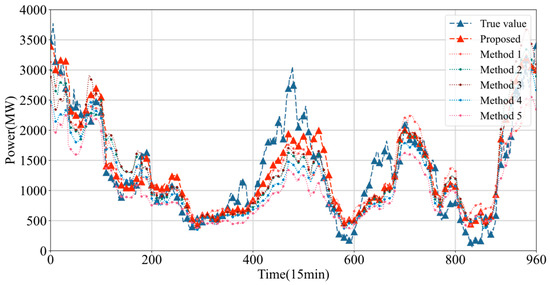
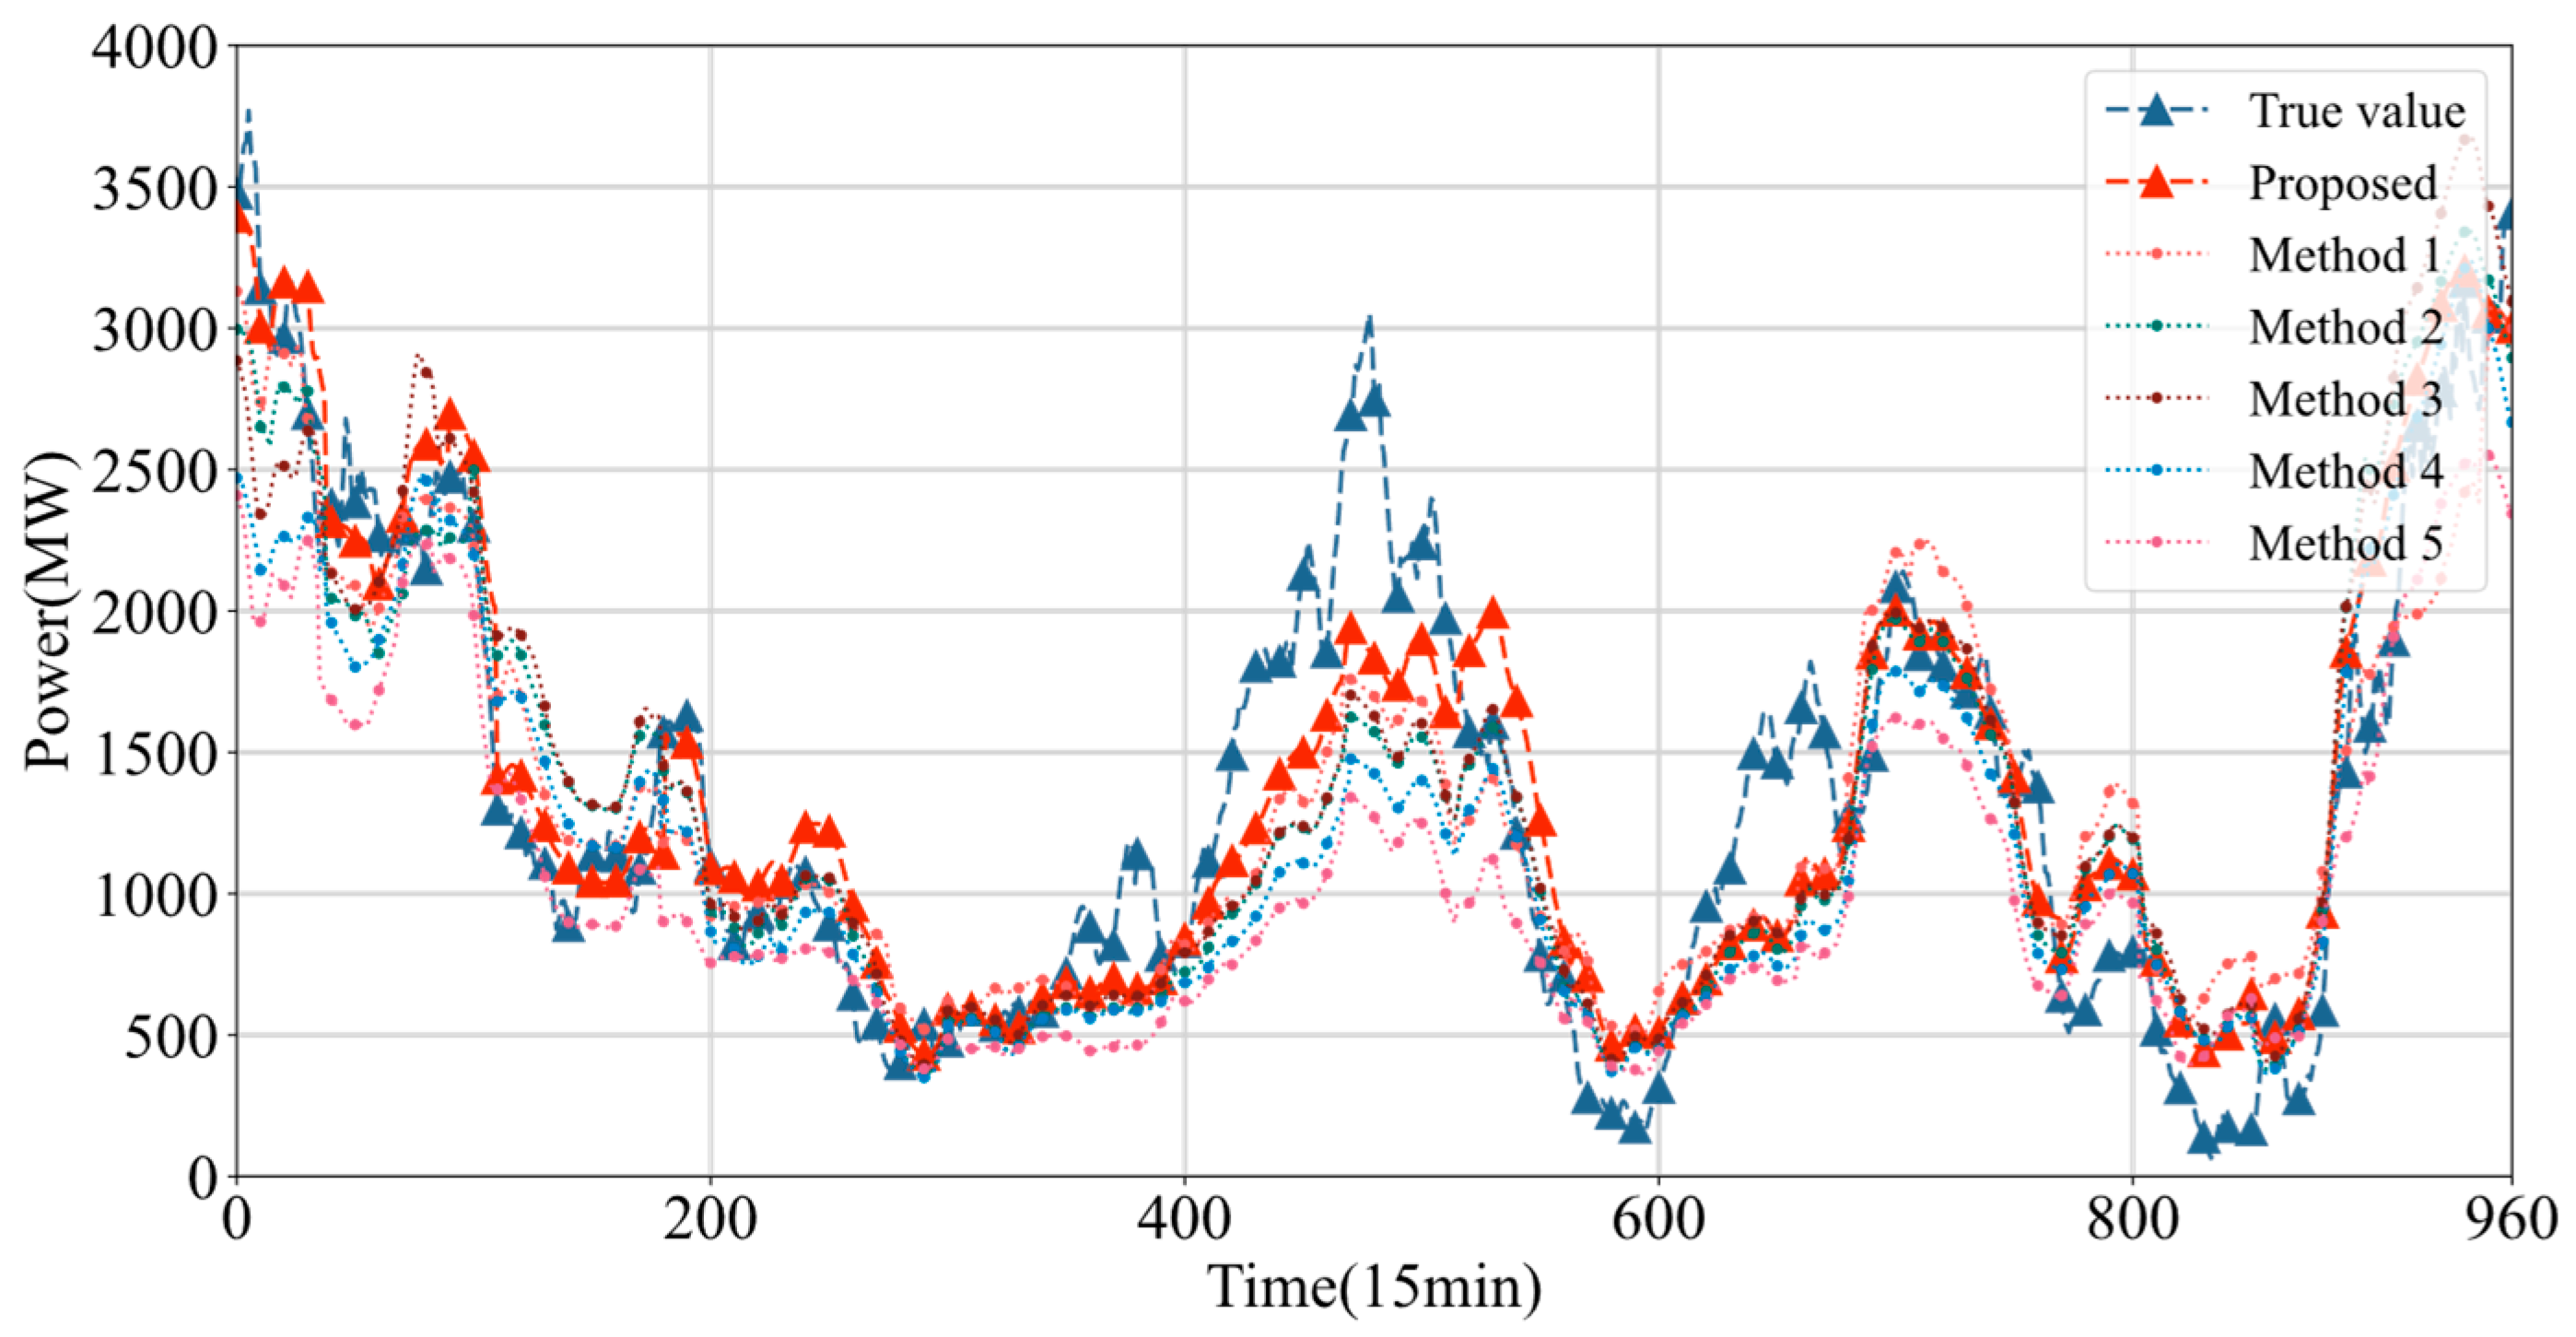
The generalization performance of this method is further verified by a wind power cluster in Inner Mongolia. As shown in Figure 11, taking the summer period as an example, it can be seen that when the number of wind farm nodes increases from 31 nodes to 70 nodes, the cluster division method proposed in this paper can still ensure good fitting ability. The NRMSE and NMAE of the prediction error can still reach 7.94% and 6.25%, respectively. Therefore, the fuzzy C-means algorithm based on spectral embedding can find the internal correlation structure between wind farms more effectively than the traditional clustering algorithm. The first fine-grained cluster division is conducive to the subsequent hierarchical modeling strategy of constructing a dynamic graph structure in the sub-cluster. Compared with global modeling, it can significantly improve the prediction performance.
Figure 11.
Comparison of power prediction curves of different cluster division methods in Inner Mongolia cluster.
3.3. Structural Validity Analysis of Superimposed Dynamic Graph Based on Wind Direction
This section aims to evaluate the effectiveness of the proposed dynamic weighted directed graph structure based on the wind farm superimposed wind direction matrix. In order to ensure the purity of the comparison, all the comparison methods use the same SFCM cluster division results and carry the same DGTK-Net prediction model. The only variable is the construction method of the graph structure input to DGTK-Net. The comparative description of the methods is shown in Table 5.
Table 5.
Description of graph construction method.
The dynamic update of the graph structure is the basis of capturing the evolution of the meteorological system. As shown in Table 6, the t-test shows that the proposed graph construction method is significantly better than all baseline models in terms of statistical significance (all p < 1 × 10⁻¹⁴). Combined with Figure 12 and Table 6, it can be seen that the dynamic and directionality of the graph structure together constitute the core of the performance gain. The proposed method achieves the best prediction performance. Compared with method 5 (static graph), the errors of all dynamic graph methods (methods 1–5) are significantly reduced, and the p = 2.84 × 10⁻²⁹ of the paired t-test between the proposed method and method 5. This proves that the dynamic update of the graph structure is crucial to capture the spatio-temporal correlation that changes with wind power conditions. The static diagram cannot characterize the evolution of the correlation structure caused by the movement of the weather system, resulting in its poor performance in complex meteorological scenarios.
Table 6.
Index comparison of prediction results of different graph construction methods.
Figure 12.
Comparison of power prediction curves of different graph construction methods.
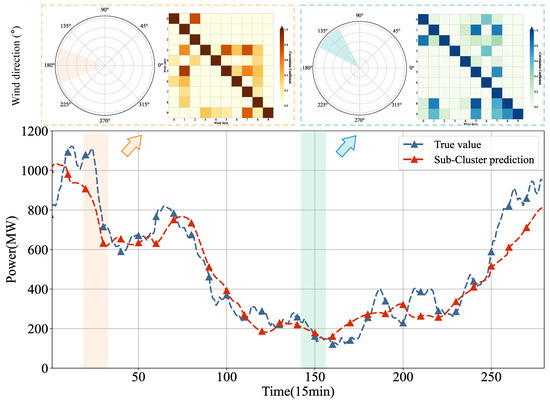
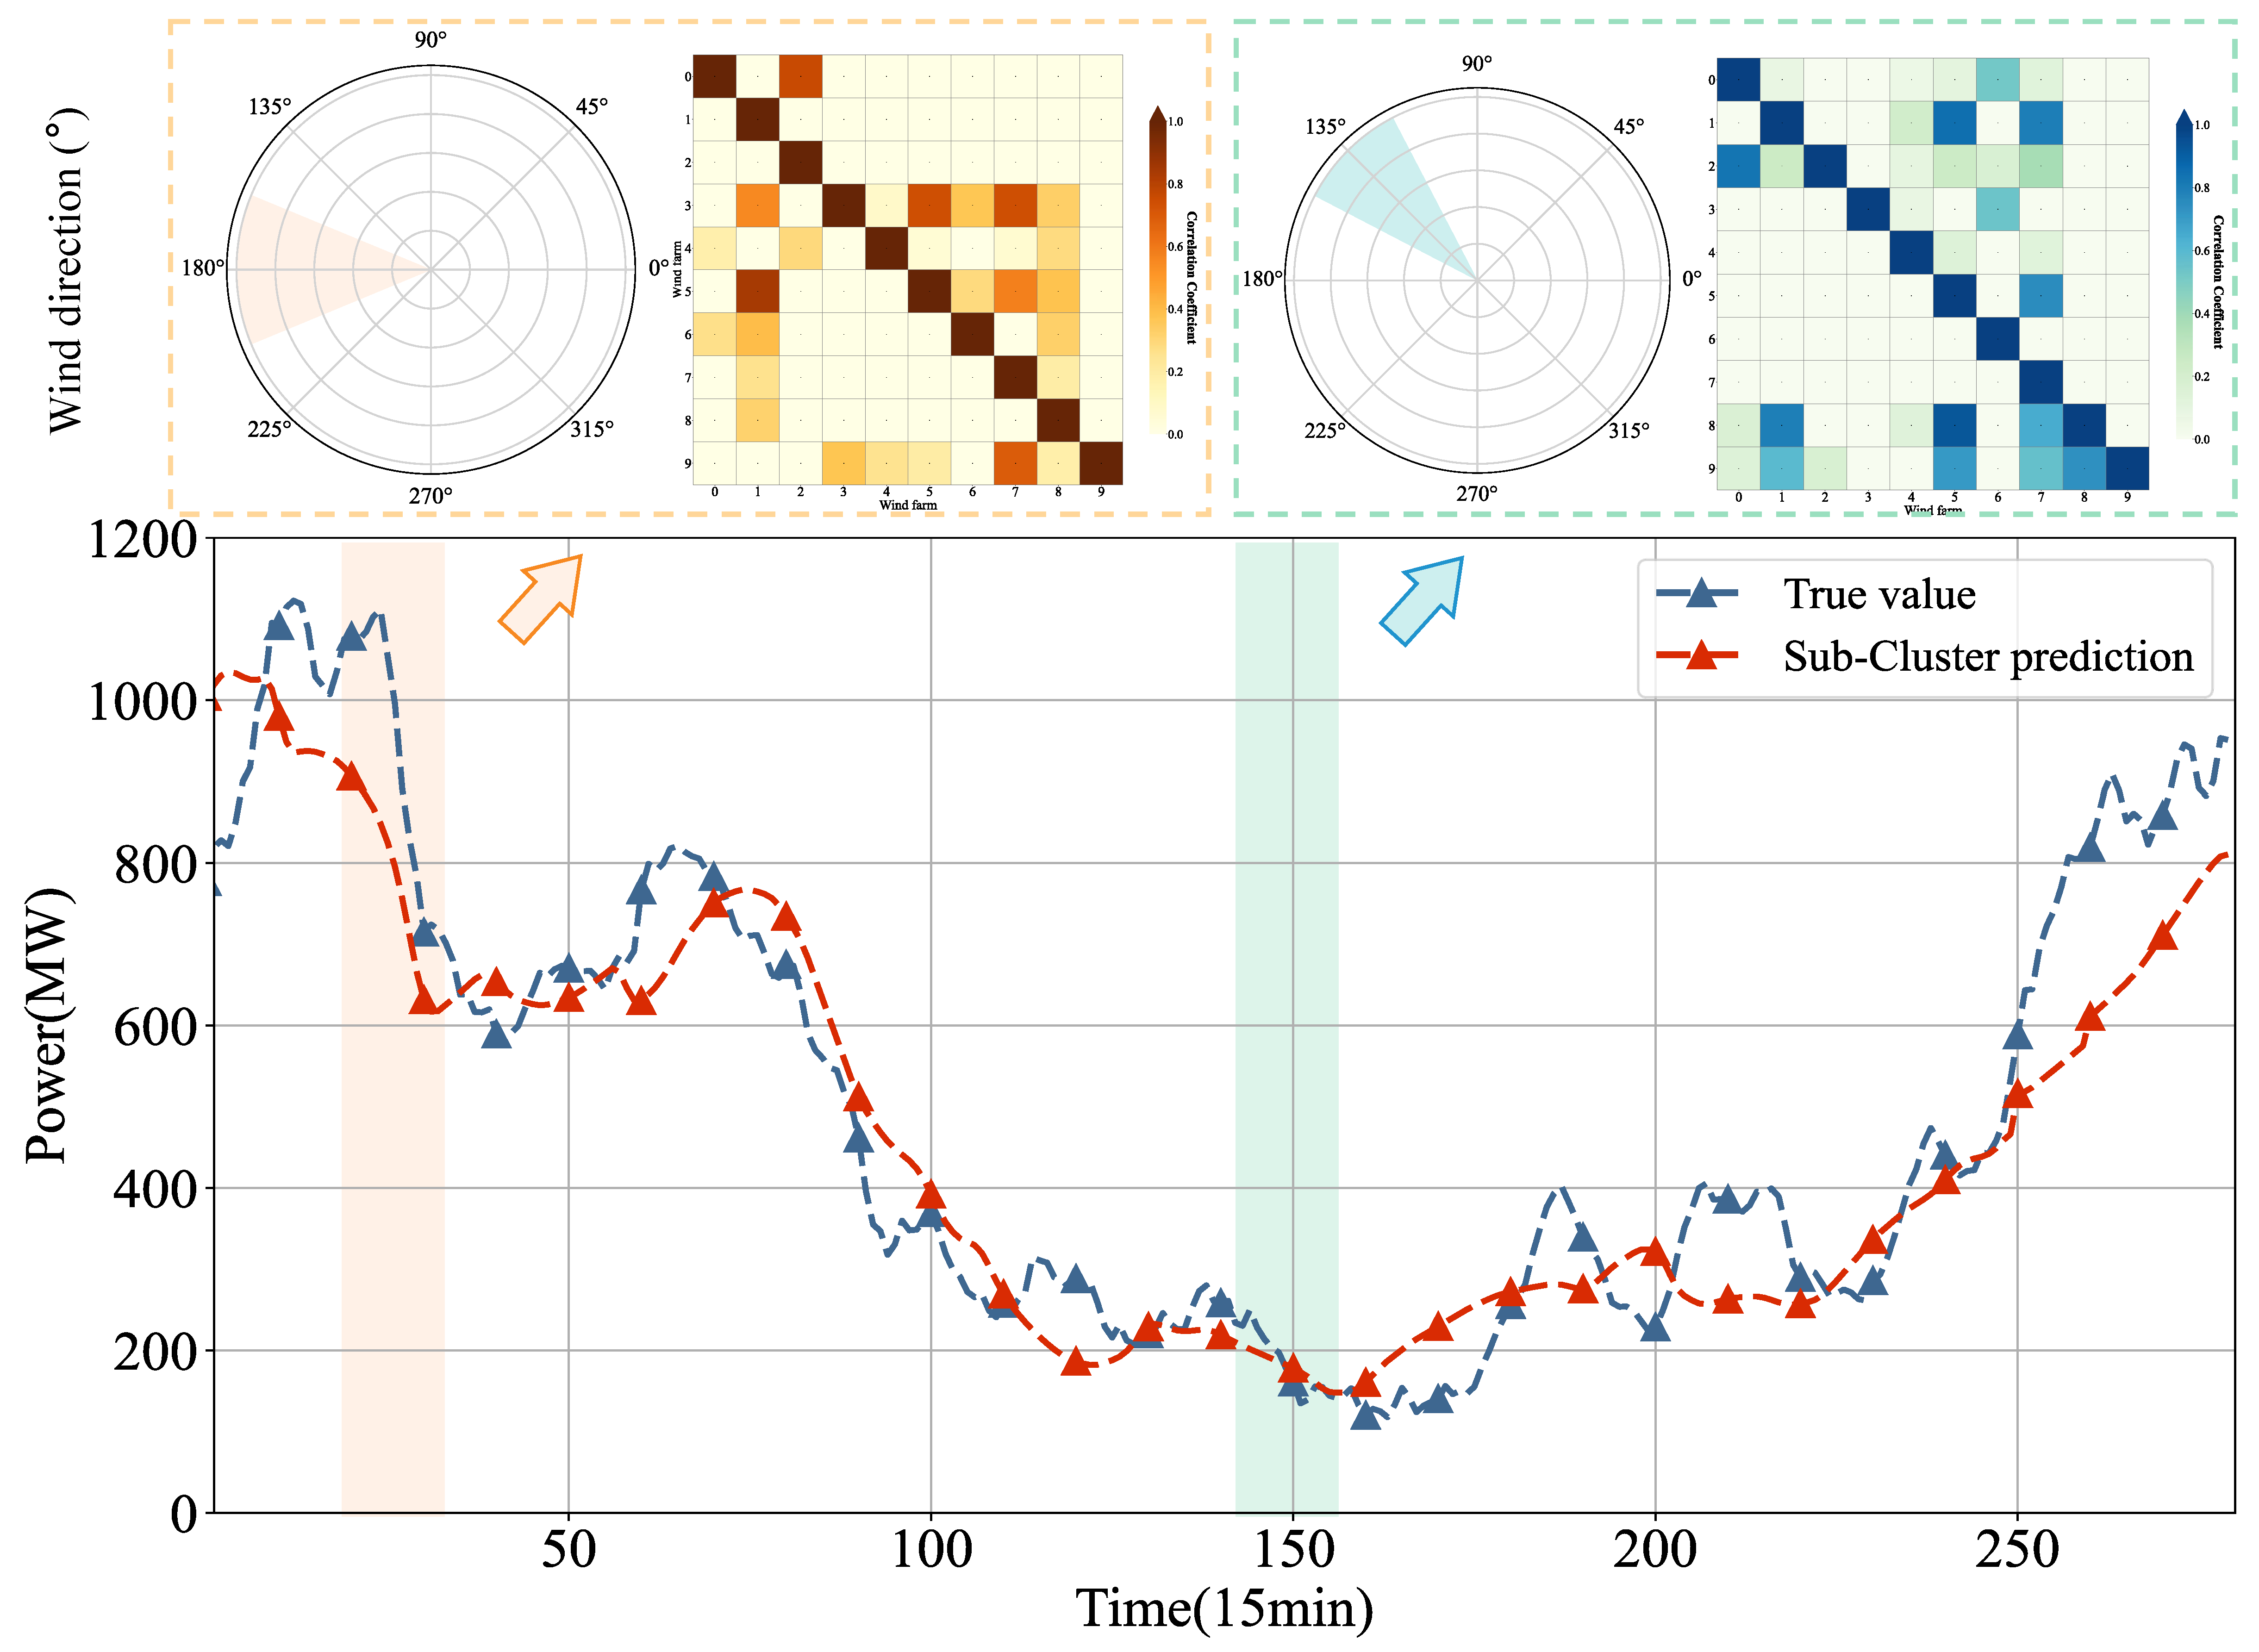
Furthermore, the directional modeling of the graph structure conforms to the physical law of atmospheric motion, and its superiority is particularly prominent in key scenarios. The performance of all directed graph methods (Methods 1–3) is significantly better than that of the method 4 undirected graph. Wind direction determines the physical path of energy and information propagation. The relationship between the sub-cluster prediction results, the composition method, and the change in the wind direction process is shown in Figure 13. The meteorological information of the upstream station affects the downstream station through the delay characteristics, and the reverse effect can be ignored. The undirected graph (method 4) cannot describe this asymmetry, resulting in a significantly higher prediction error than the directed graph method. The performance of method 1 and method 3 using the wind direction superposition matrix is better than that of method 2, which reflects the superiority of the stacked wind direction matrix. By distinguishing the “source” and “destination” of information, the wind direction superposition matrix more accurately models the information flow and spatial-temporal dependence in the wind farm cluster, so that the information propagation in the graph neural network is more in line with the physical law.
Figure 13.
The correlation between power prediction and the directed graph evolution process.
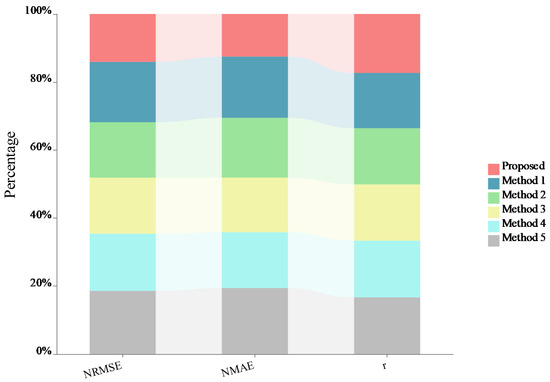
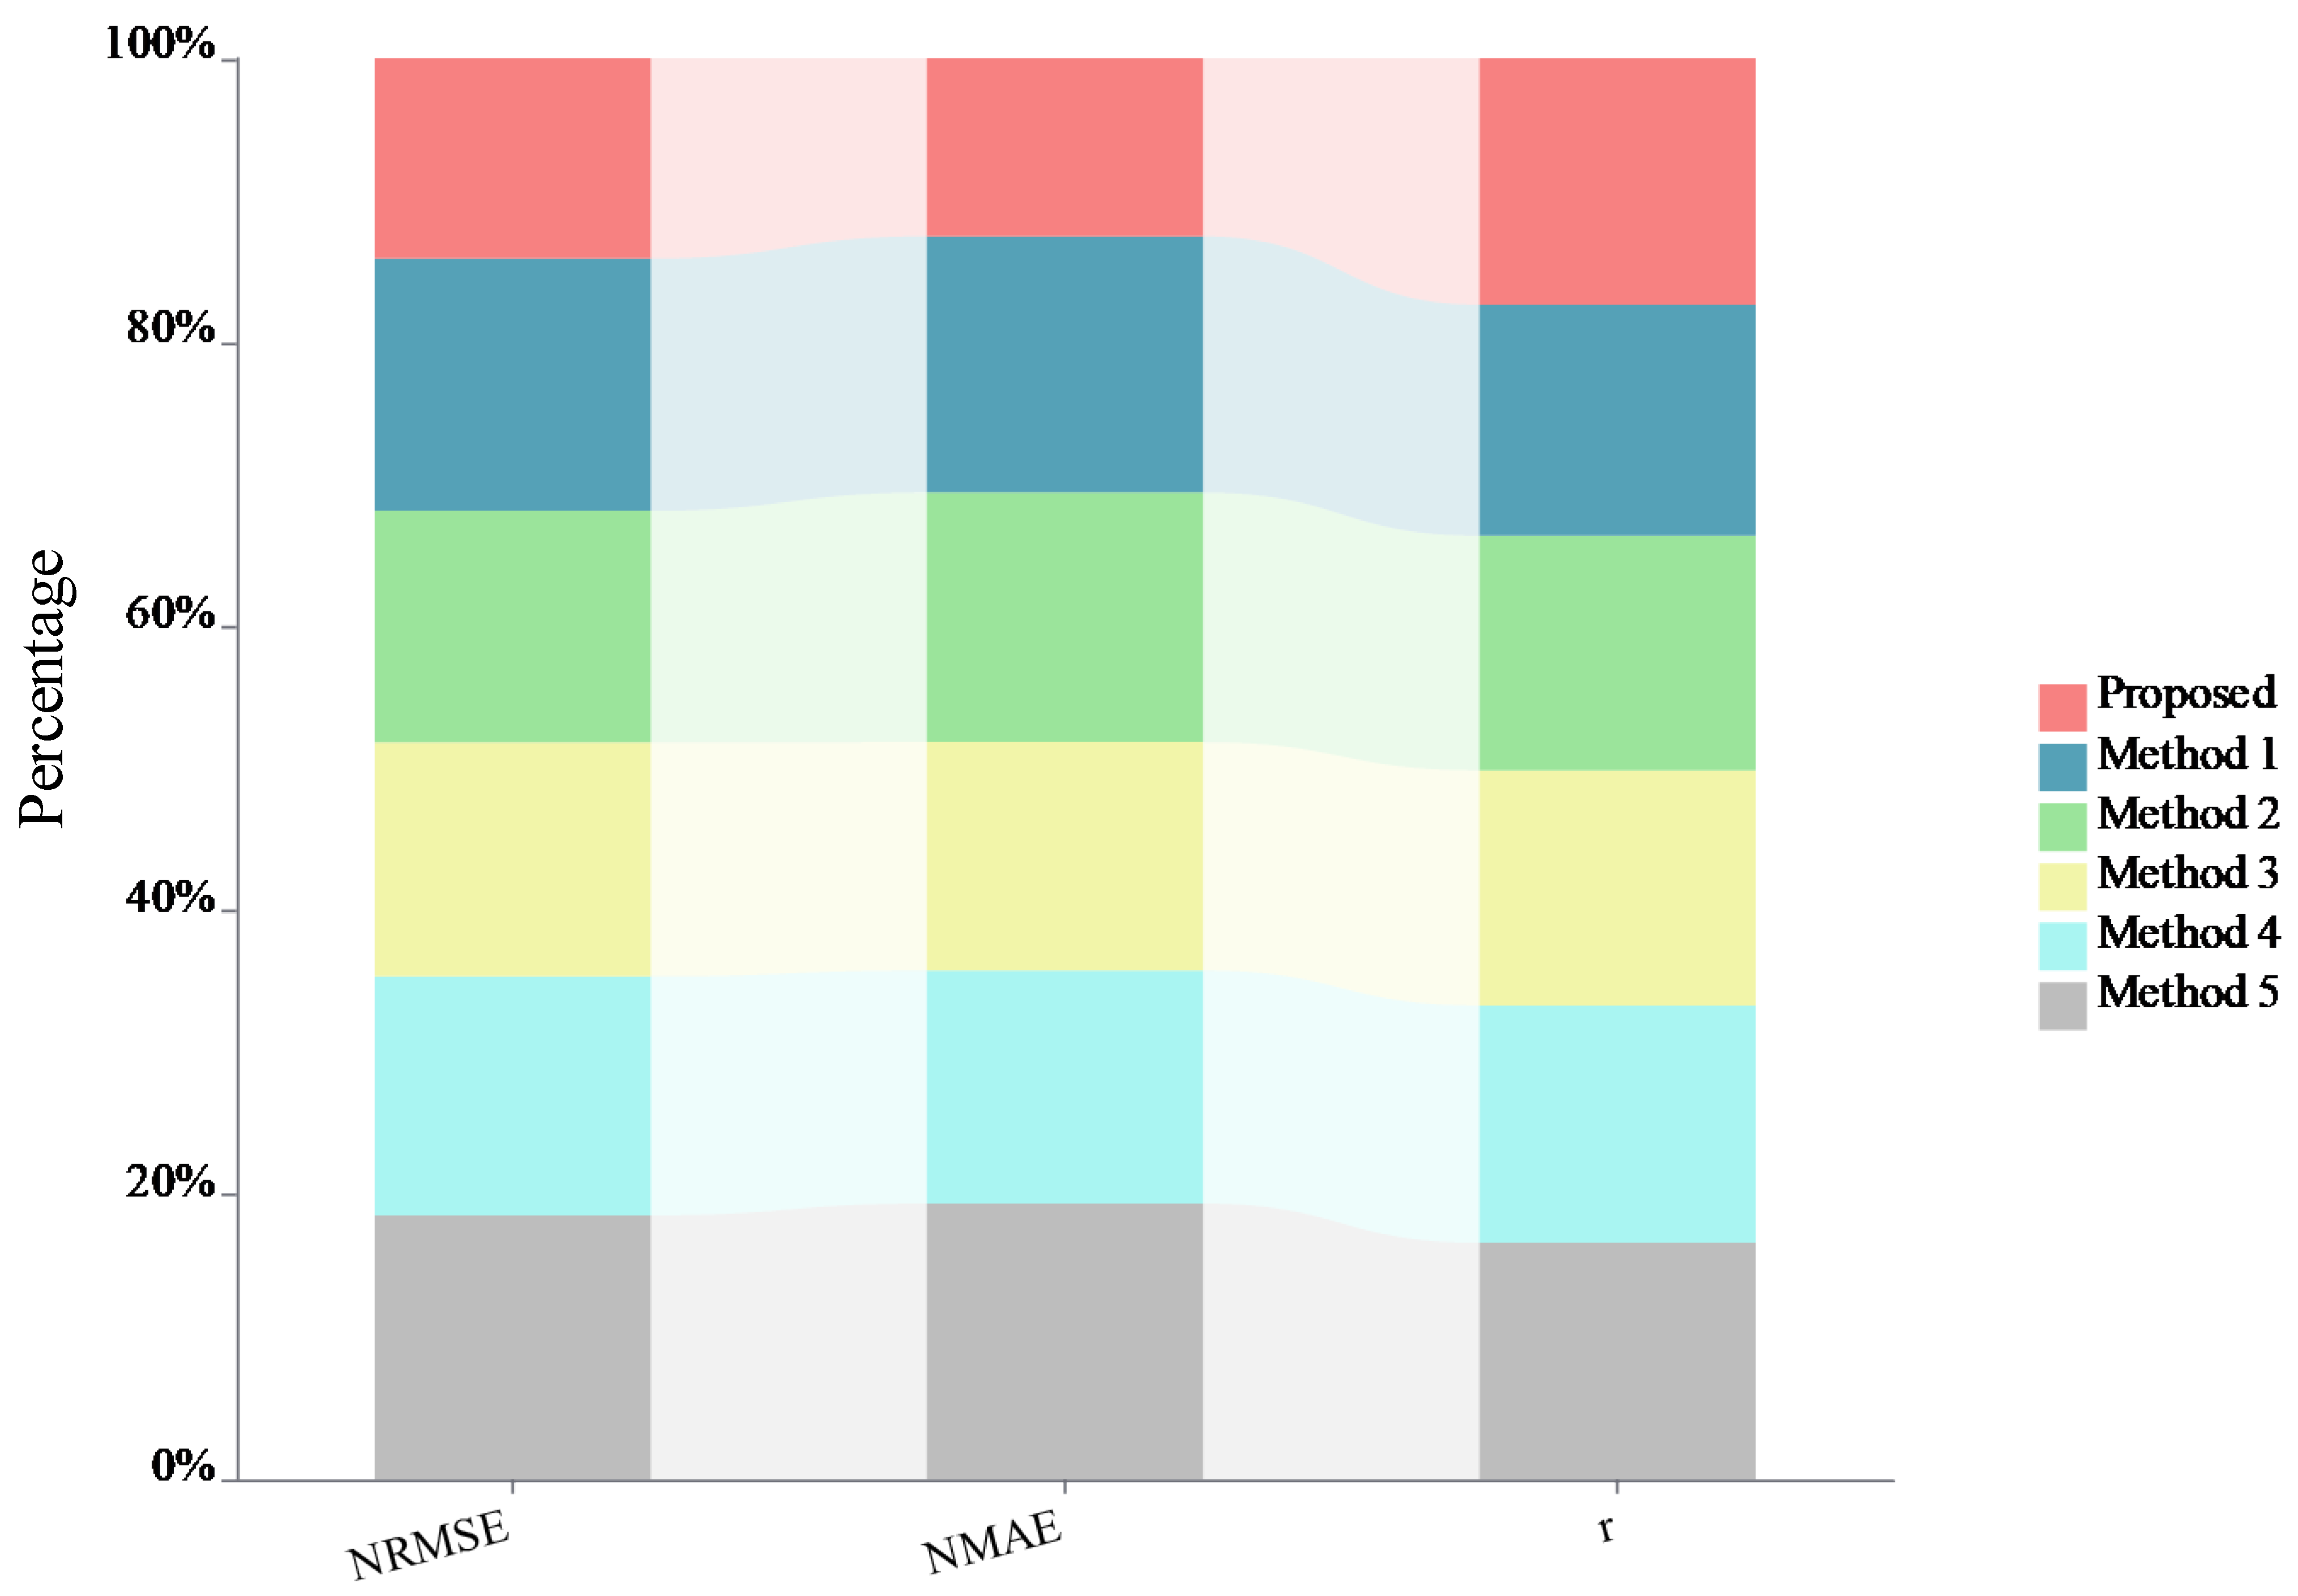
Finally, the nonlinear quantization of edge weights is the key to achieving accurate modeling, and its effectiveness is statistically supported. As shown in Figure 14 and Table 6, the comprehensive indices of the proposed method are better than those of method 1, which indicates that the nonlinear mutual information can better reflect the complex correlation between stations than the linear Pearson correlation analysis in the selection of edge weights. In contrast, binarization (method 2) or the unquantified weight method (method 3) will lose intensity information, resulting in performance degradation. As a nonlinear measure, wind speed mutual information can effectively capture the dynamic coupling strength between wind farms under complex atmospheric boundary layer conditions. Taking it as the edge weight, DGTK-Net can distinguish the strong and weak neighbor nodes, so as to carry out more focused information aggregation, which is an important reason for the further improvement of prediction accuracy.
Figure 14.
The percentage accumulation histogram of the graph prediction result index.
3.4. Effectiveness Analysis of DGTK-Net Wind Power Cluster Prediction Model
This section aims to evaluate the effectiveness of the proposed DGTK-Net prediction model. Based on the proposed method, method 1, and method 2, a set of ablation experiments was designed in this section. The above methods all use the same input data, cluster partitioning results, and dynamic diagrams, and the only variable is the model architecture. Compared with the proposed method, method 1 (DGT-Net) replaces MLP with KAN under the same spatio-temporal skeleton to compare and quantify the independent contributions of KAN modules. Compared with the proposed method, method 2 (GCN) removes the temporal attention module [40] to verify the overall effectiveness of the spatio-temporal fusion architecture.
Methods 3, 4, 5, and 6 are the current mainstream research models and more advanced independent research programs. In the experiment, the SFCM cluster partition results consistent with the method in this paper are used. Transformer [41] and TCN [37] complete the capture of cluster information in time series. ENDCC-AGCN constructs four static graphs and completes spatio-temporal modeling through a switching mechanism [26]. TRFE achieves feature enhancement through two-stage power prediction [42]. The advantages of this method in the same type of research are verified by comparison. The description of the prediction model is shown in Table 7.
Table 7.
Prediction model-related description.
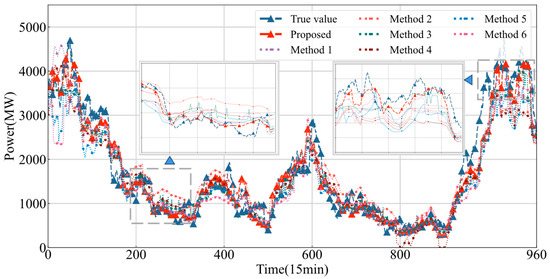
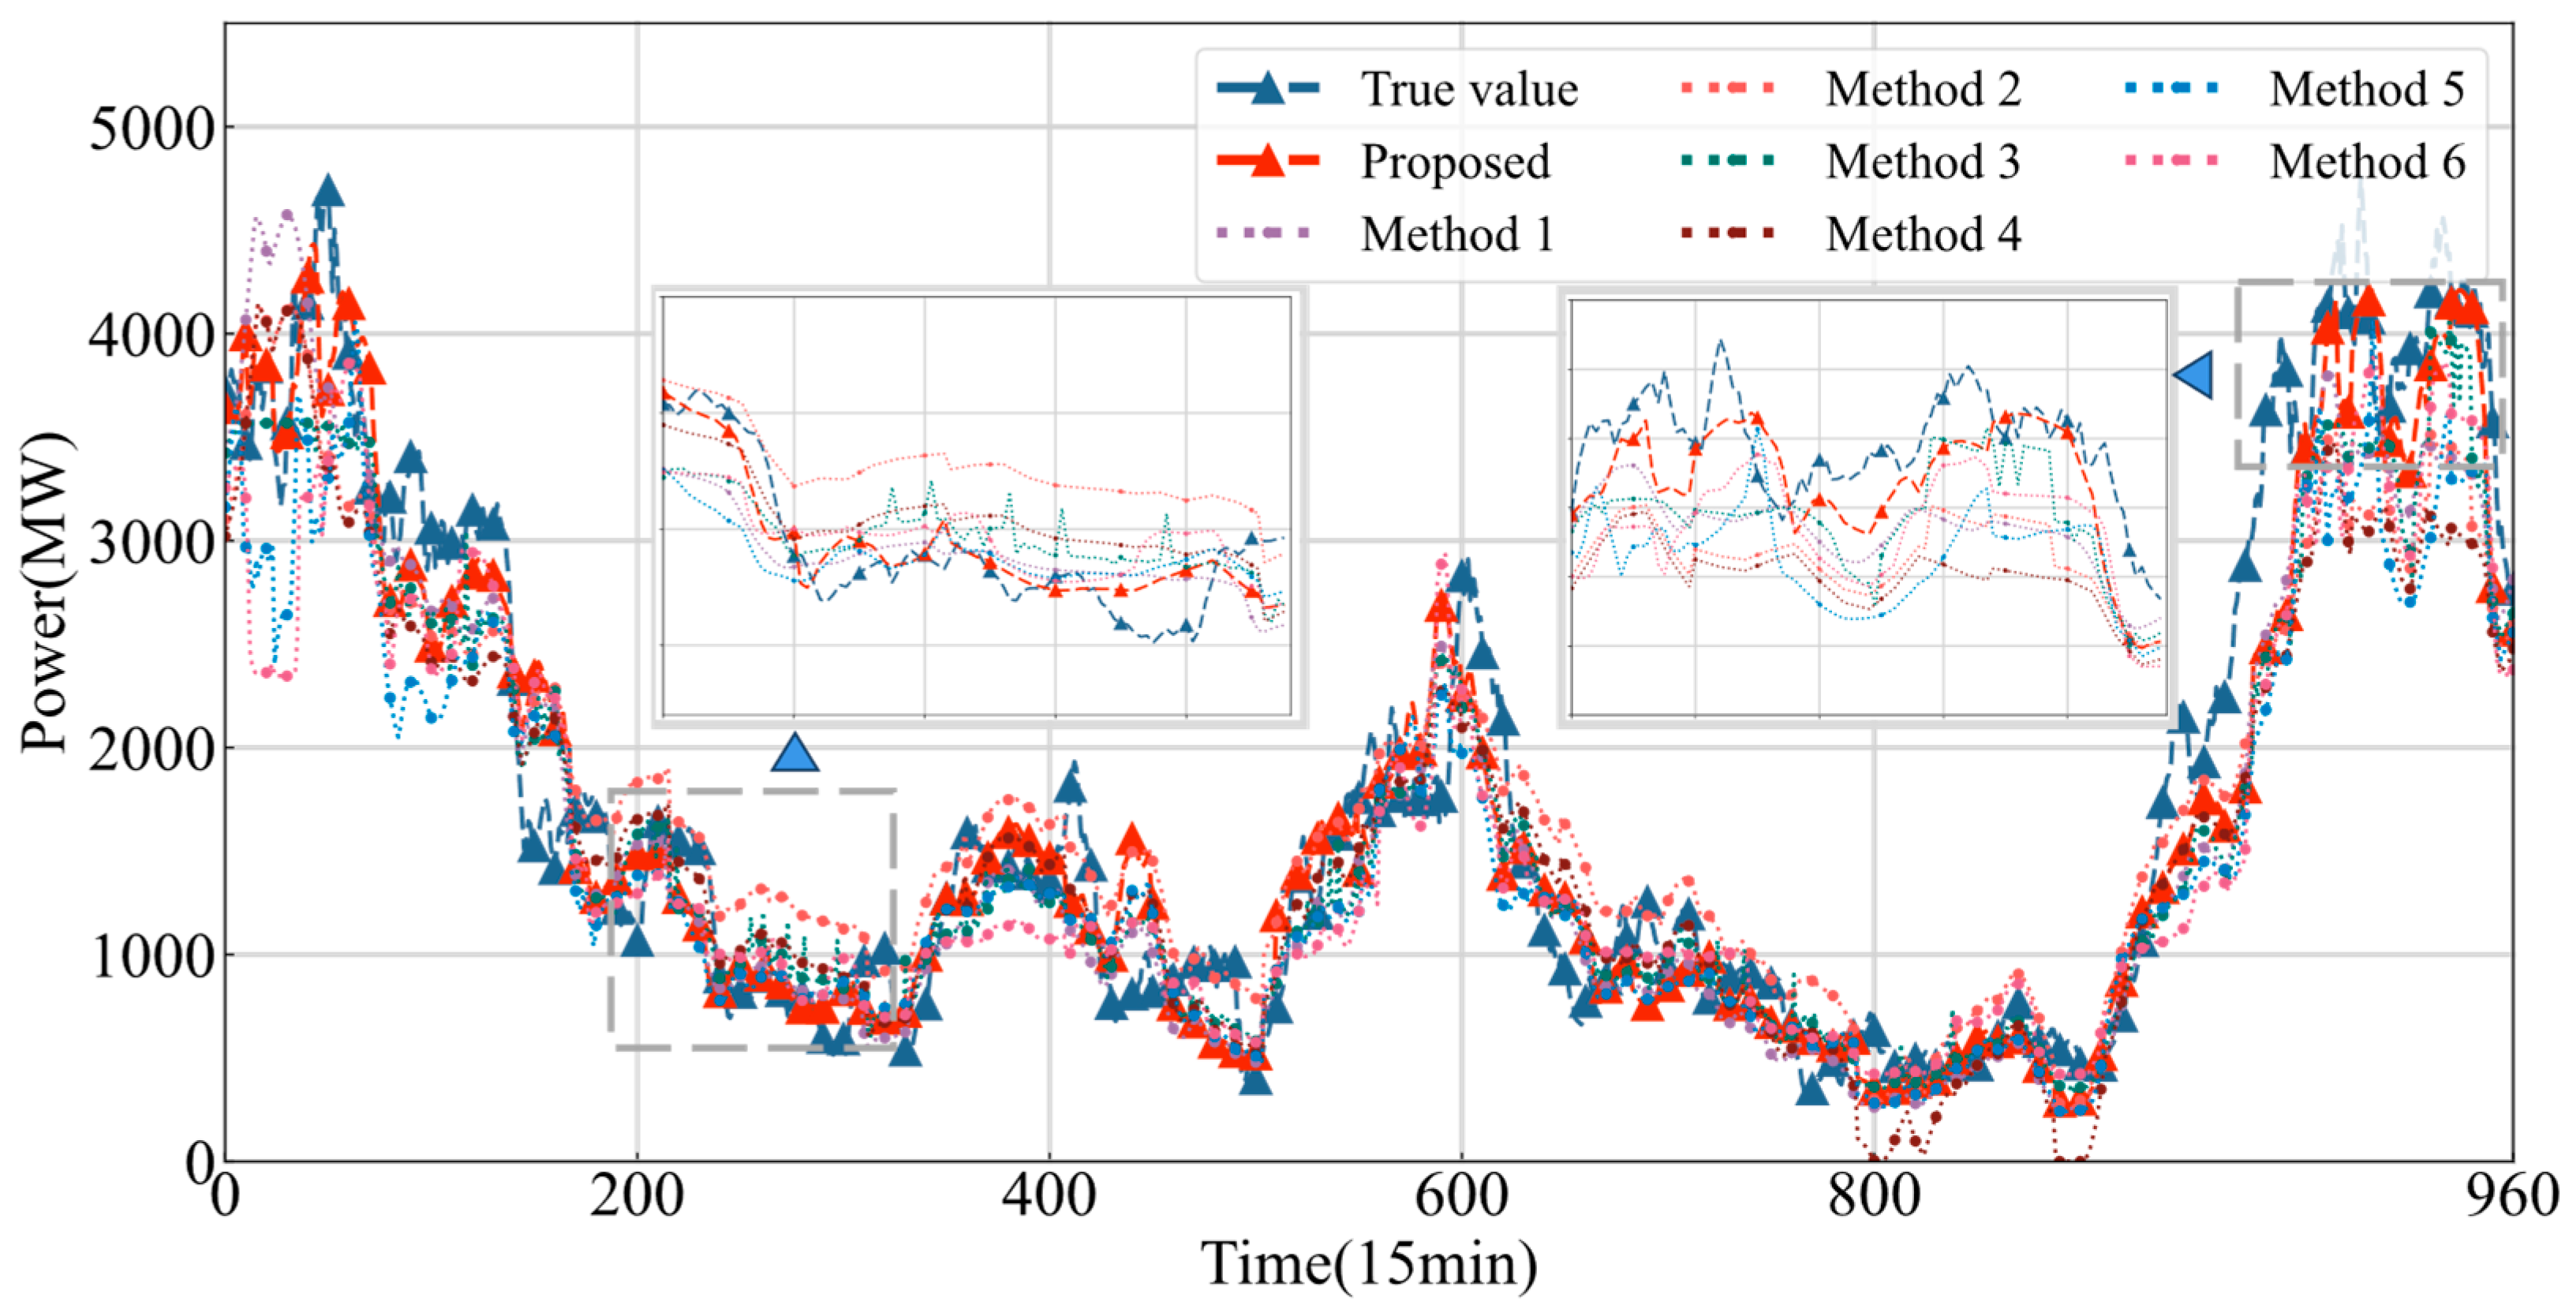
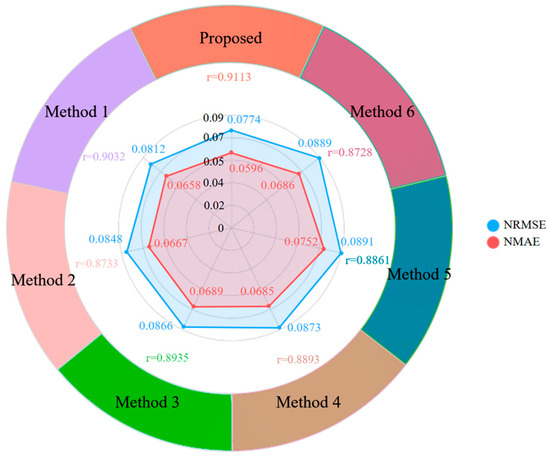
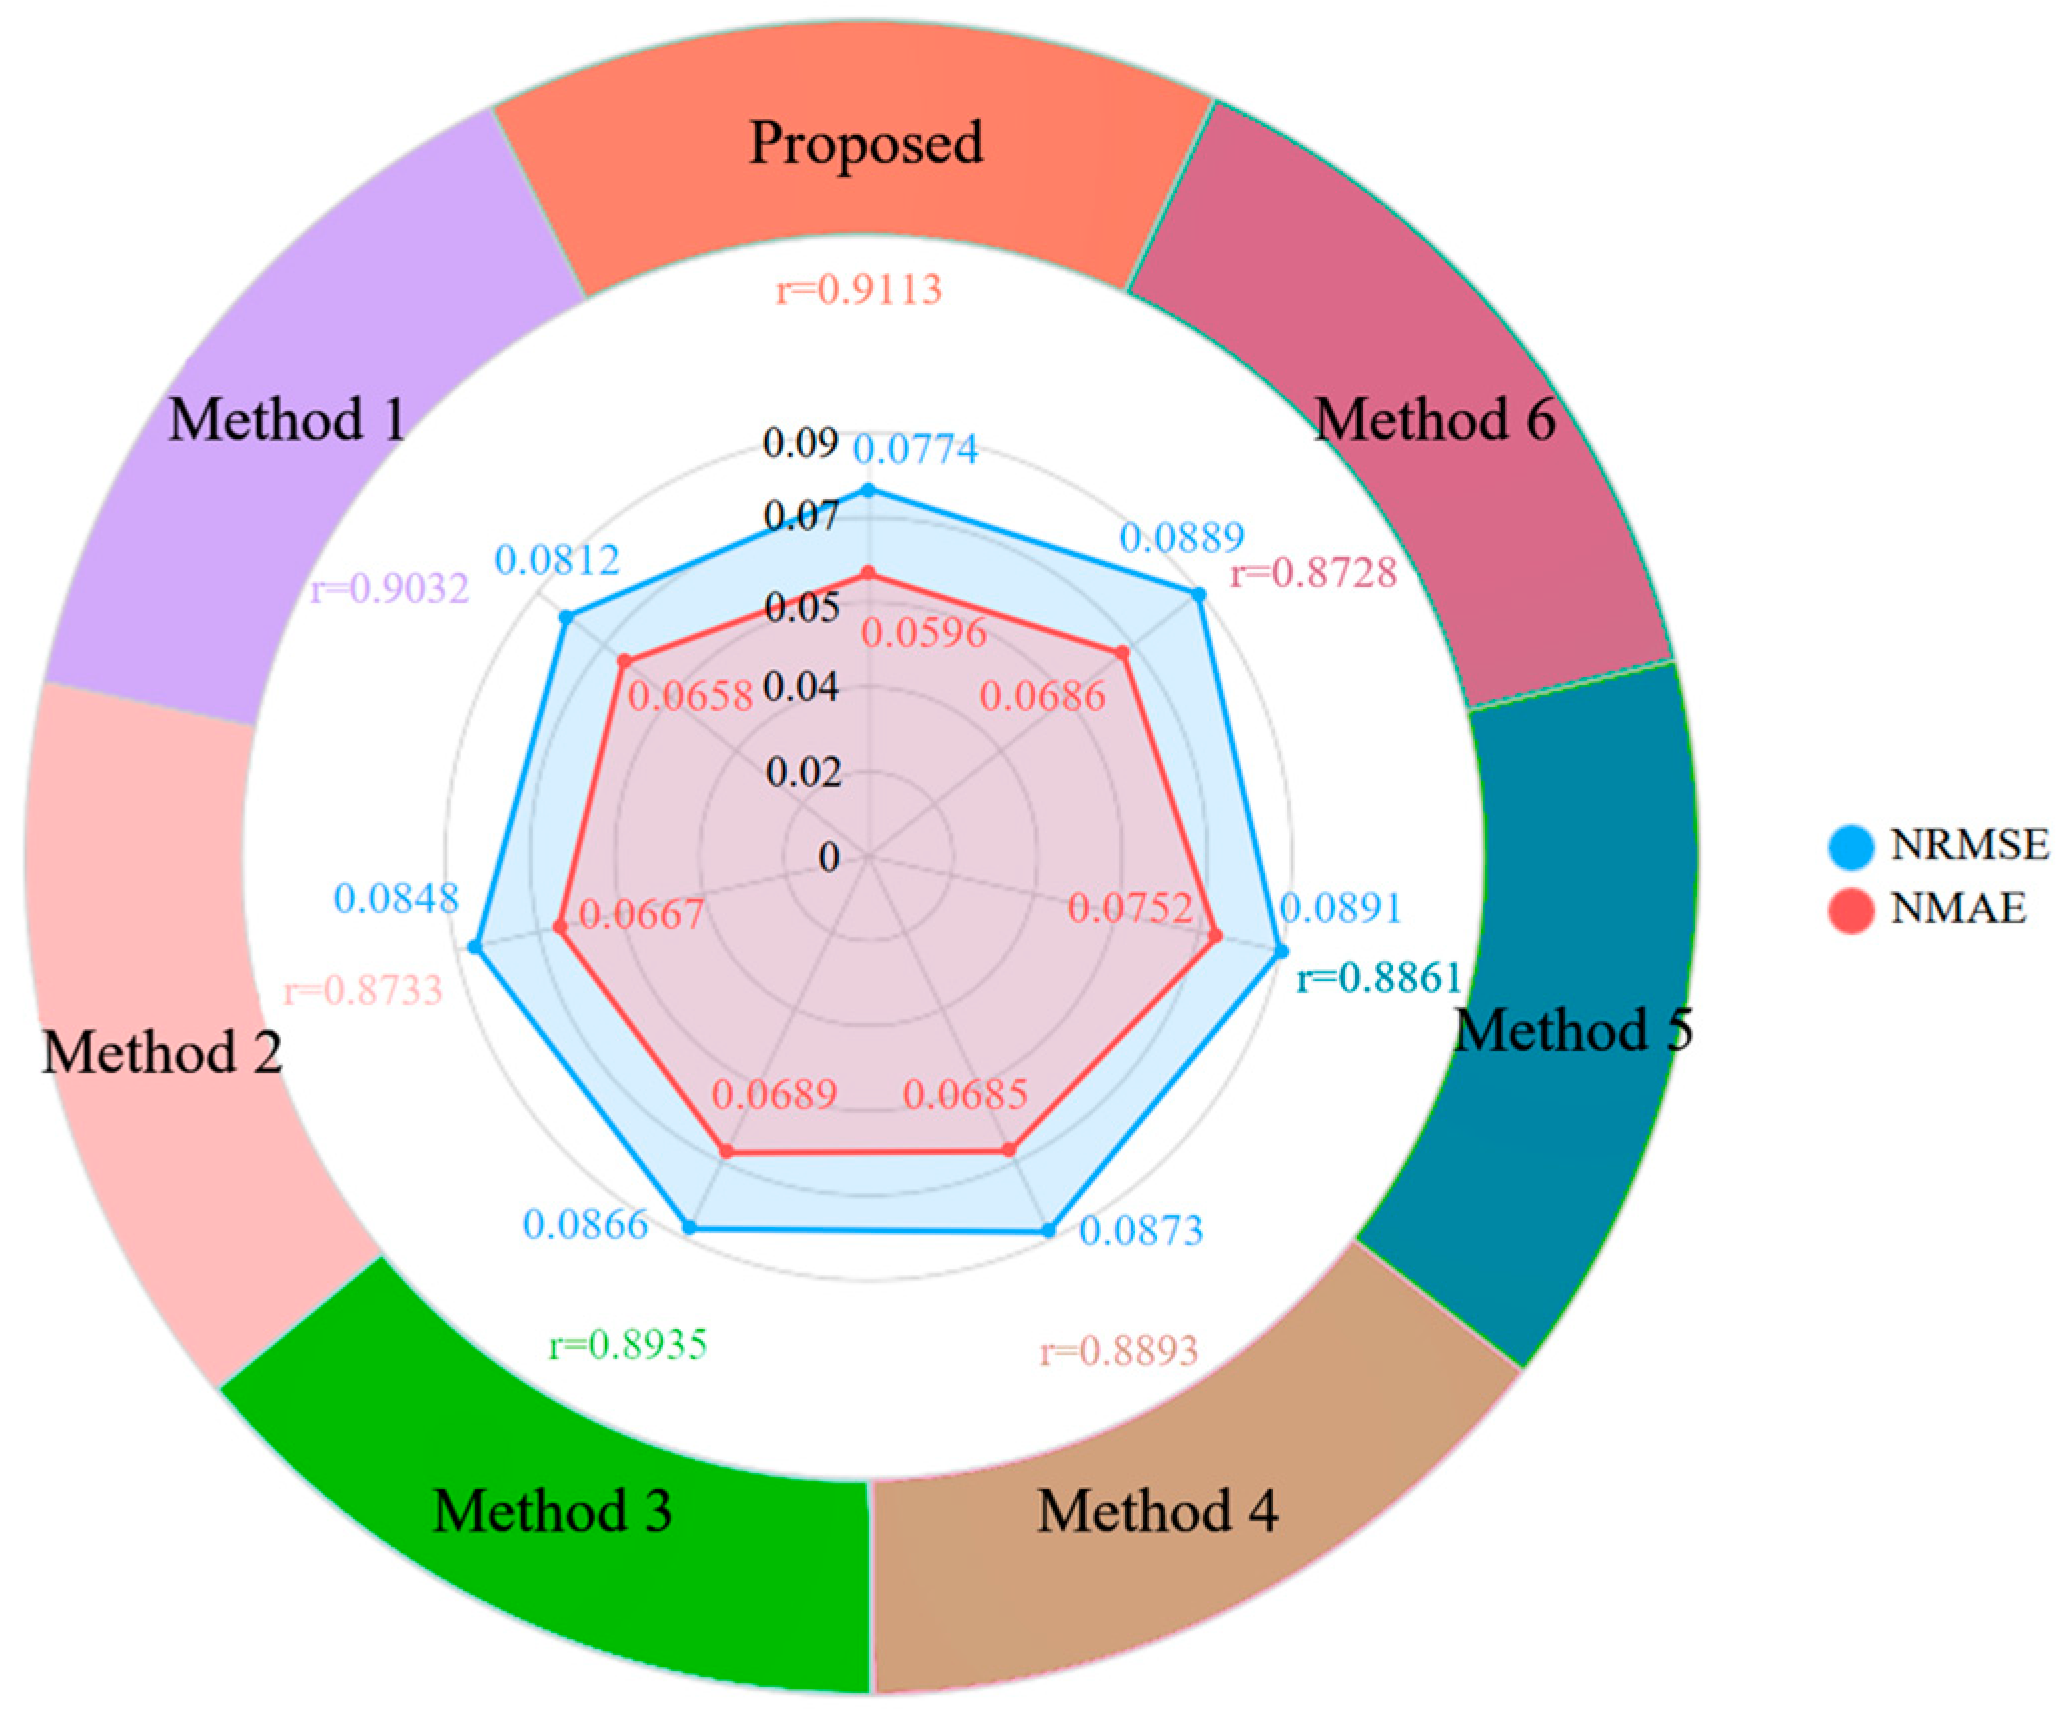
Combined with the prediction results of Figure 15 and Figure 16, as well as Table 8, the proposed DGTK-Net is stable and better than method 1 in NRMSE, NMAE, and correlation coefficient. This performance improvement, combined with the ablation experiment design, provides direct evidence of KAN’s contribution: replacing the MLP components in the model with KAN brings quantifiable precision gains without changing other architectures. The results show that compared with the traditional MLP using a fixed activation function, KAN may approximate the complex nonlinear mapping relationship in wind power prediction with higher parameter efficiency through its edge-learnable activation function, thus achieving better prediction accuracy on the same task.
Figure 15.
Comparison of prediction result curves of each model.
Figure 16.
Prediction index ring radar chart.
Table 8.
Comparison of prediction indices of each model in Gansu cluster.
The performance of the proposed DGTK-Net is significantly better than that of the space-only model (method 2) or the time-only model (methods 3, 4). This verifies the necessity of joint modeling when dealing with the space–time problem of wind farm group power prediction. Although methods 3 and 4 can effectively capture the temporal dependence of information, they lack the modeling of spatial topology. Method 2 is the opposite. DGTK-Net achieves a unified learning of spatio-temporal dependence by integrating spatial convolution, temporal attention, and temporal convolution in an end-to-end framework, which is considered to be the key reason for its performance beyond a single-dimensional model.
Compared with the latest research methods, DGTK-Net also shows certain competitiveness. In the climbing period of high output, the correlation coefficient of the proposed method can be improved by 2.31% on average. In the period of low output fluctuation, the performance gap of each method is reduced, but the NRMSE of this method can still be reduced by 1.17% on average. Compared with method 5 (AGCN framework based on static graph switching), the dynamic graph construction mechanism adopted by DGTK-Net can continuously describe the evolution of spatial correlation, and the KAN-enhanced architecture may provide more flexible nonlinear transformation capabilities. Method 6 is essentially a temporal feature extraction. Compared with it, the end-to-end learning paradigm of DGTK-Net avoids the information loss or error accumulation that may be caused by complex feature engineering. Through the powerful representation learning ability of KAN, the essential features are directly extracted from the data, which shows the great potential of the new neural network architecture in automatic feature learning.
The method is applied to a larger and more widely distributed wind power cluster in Inner Mongolia (including 70 wind farms). The proposed method is applied to different seasons, and the prediction results are shown in Table 9. In the comparable data time range, the proposed method achieves a prediction accuracy comparable to that of the Gansu cluster on the Inner Mongolia cluster, and the average prediction error reaches 7.79%. This result shows that the modeling strategy of “spectral embedding clustering, dynamic graph construction, KAN enhanced spatio-temporal prediction” proposed in this paper can adapt to wind power clusters of different scales and geographical distributions, rather than overfitting specific cluster structures. Taking the summer period shown in Figure 17 as an example, this method combines static geographical location and dynamic NWP characteristics, and the model also shows good fitting performance under different seasonal climatic conditions, showing its cross-seasonal stability.
Table 9.
Comparison of prediction indices of each model in Inner Mongolia cluster.
Figure 17.
Comparison of power prediction curves of different models in Inner Mongolia cluster.
3.5. Model Performance Analysis
In order to fully reflect the effectiveness of the proposed model, the computational cost of the comparison model in Section 3.3 is further studied. The results are shown in Table 10. Thanks to the optimized graph construction method and model structure, DGTK-Net reduces some computational complexity on large-scale sequences and nodes. The reasonable choice of time window and sector limits also helps to reduce costs. Although the prediction method of dynamically updating the weight-directed graph increases the computational cost to a certain extent, for the short-term wind power prediction task, whether it is training time or prediction time, it fully meets the needs of engineering tasks.
Table 10.
Comparison of model calculation time cost.
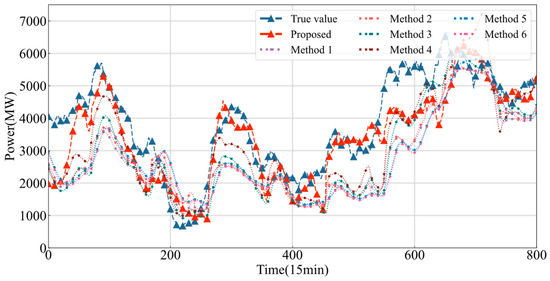
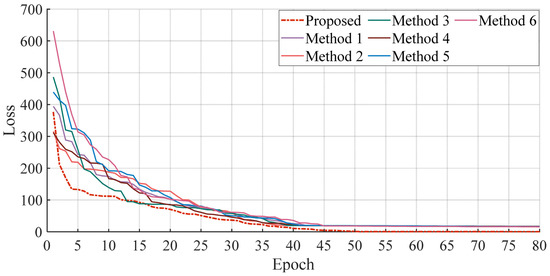
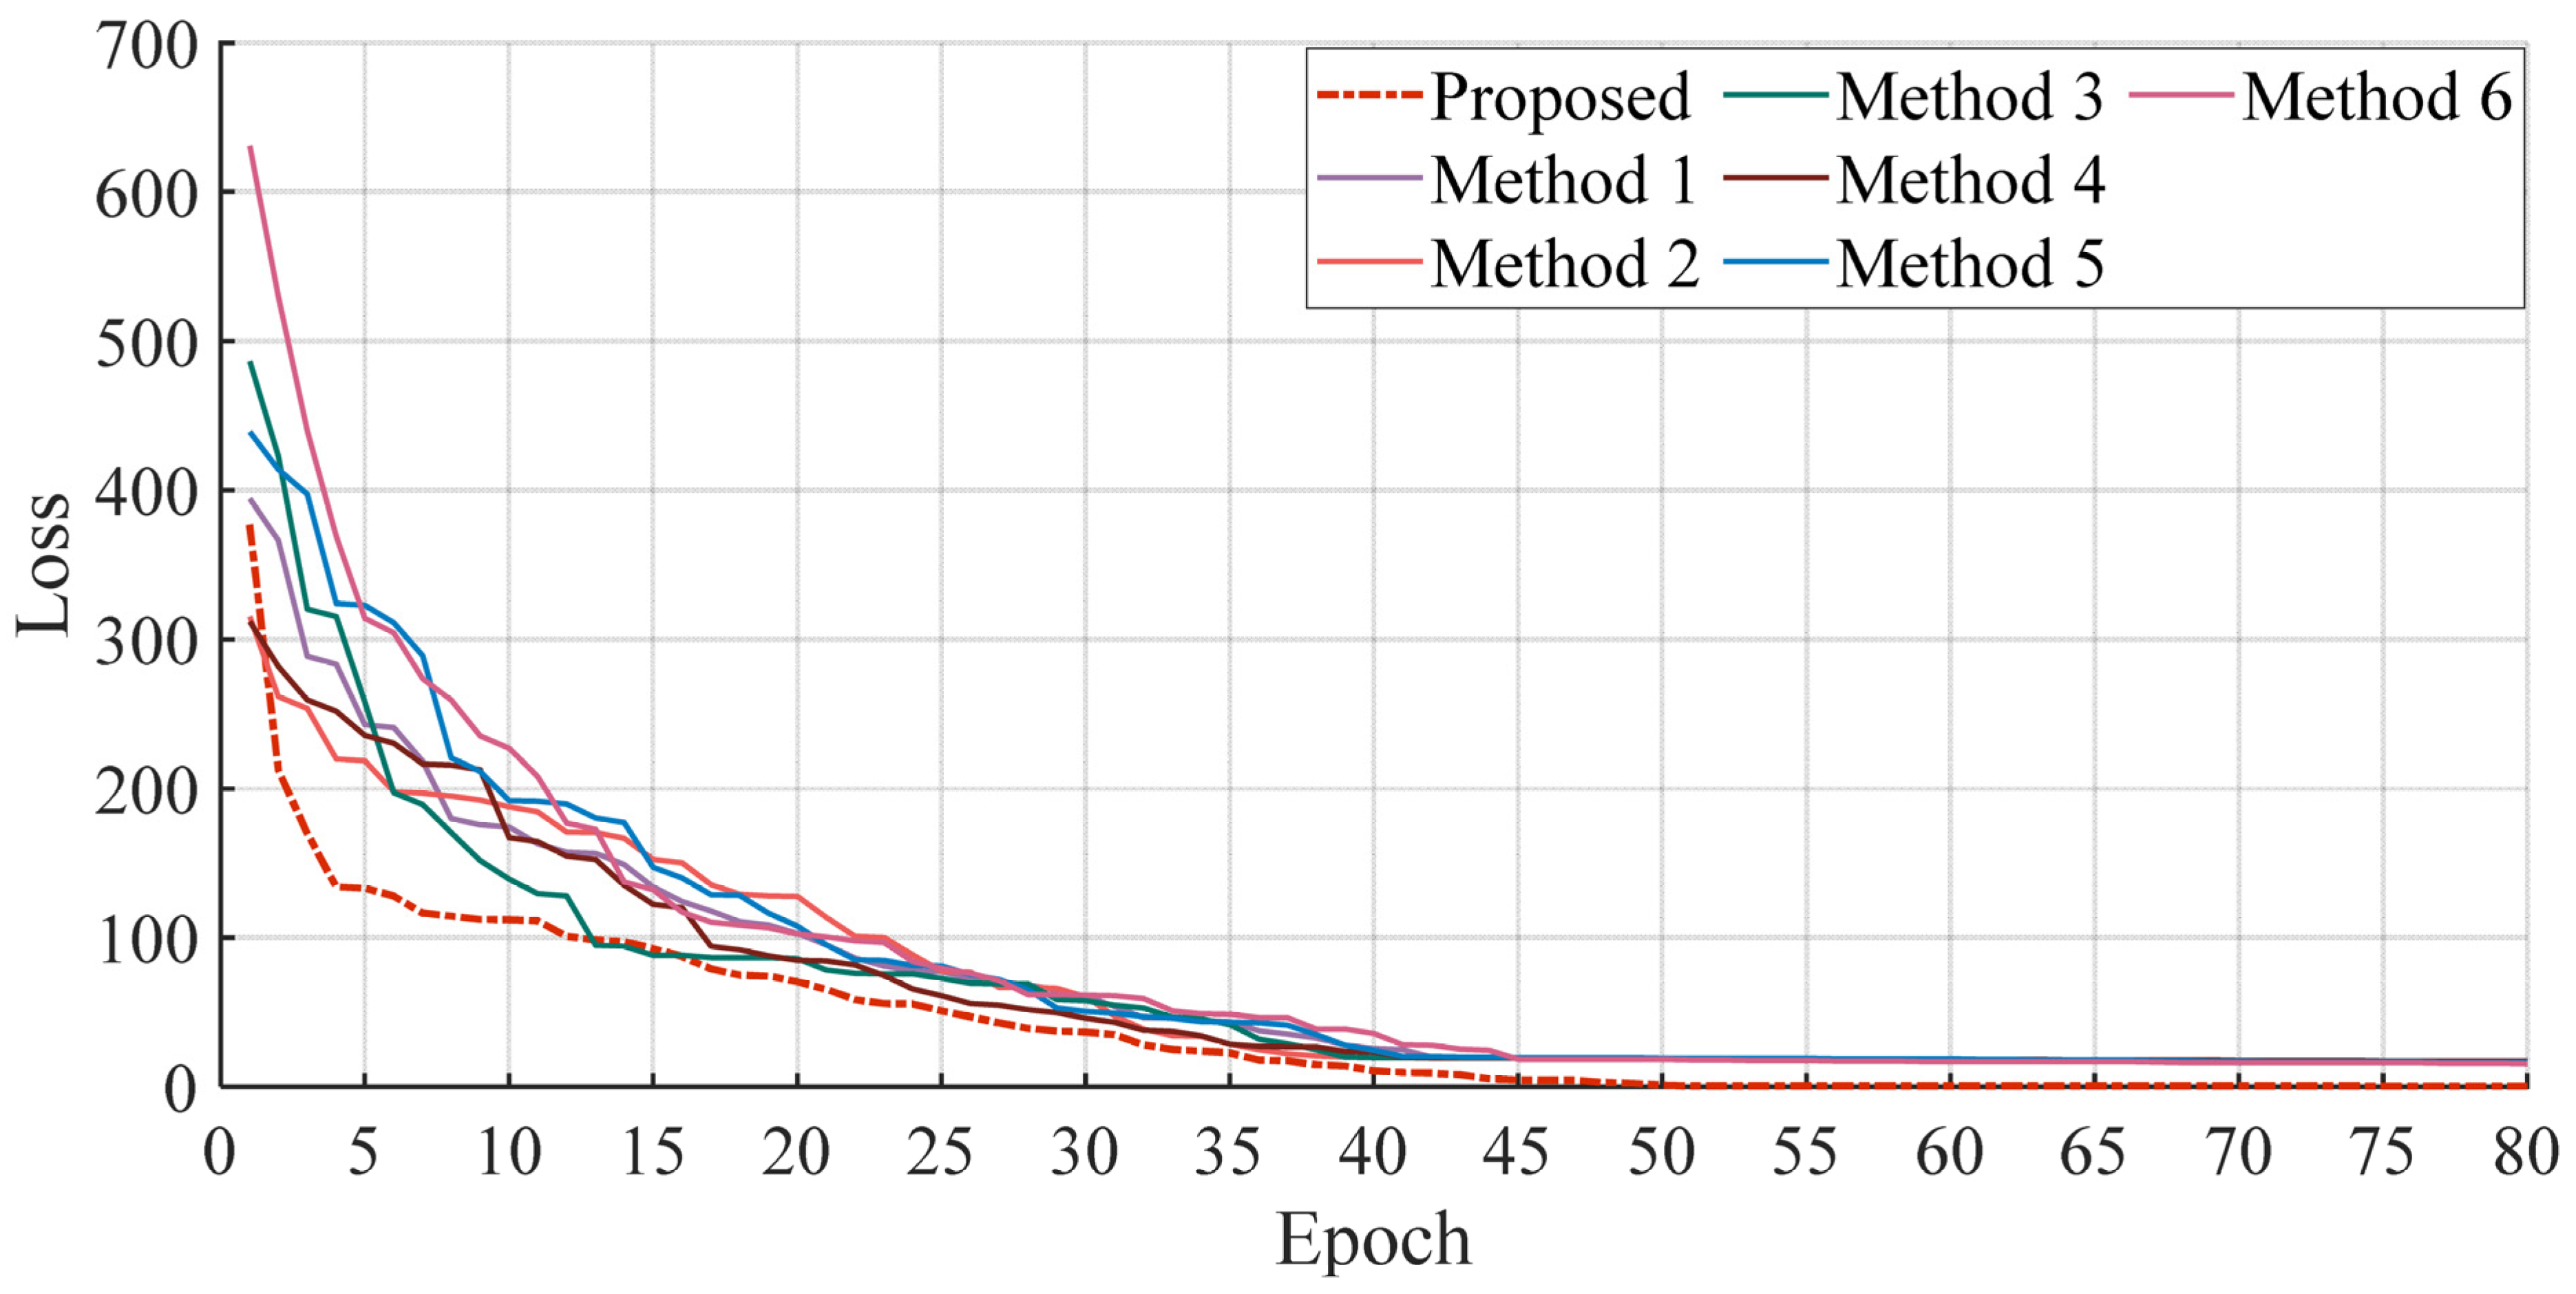
While ensuring that the calculation cost is within a reasonable range, the convergence performance of the model is also one of the important indicators for evaluating the model. Figure 18 shows the convergence curves of different models. It can be seen that the loss curve of DGTK-Net is stable and effective compared with the comparison model, and the verification loss does not exhibit violent shocks, indicating that the training process is stable. The training results showed no obvious over-fitting risk.
Figure 18.
Comparison of loss convergence curves of different models.
For very large-scale clusters (such as N > 100), directly calculating the MI of all node pairs may become a bottleneck. To this end, we discuss two potential optimization directions in the future: (1) a reasonable sub-cluster size division to reduce the computational complexity within the sub-cluster, and (2) an approximate MI estimation algorithm. In this study, the cluster size is 31 and 70 wind farms, respectively, and the model application is completely feasible and efficient.
Despite the superior performance demonstrated above, two limitations warrant further discussion. The first is regarding hyperparameter sensitivity: although the DGTK-Net benefits from a rational structural design and exhibits a degree of robustness to parameter variations, achieving optimal precision still relies on empirical hyperparameter tuning to determine stable configurations for specific clusters. This dependence on manual tuning constitutes a practical limitation when deploying the model to entirely new geographical regions, making the development of adaptive parameter tuning methods a significant direction for future research. The second is regarding robustness under rare extreme events: while the model shows strong generalization across different seasons and typical operating scenarios—producing prediction curves that closely fit real power outputs during both high and low generation periods (as shown in Figure 15 and Figure 17)—it must be acknowledged that performance may fluctuate during rare extreme weather events (e.g., typhoons or extreme turbulence) due to their scarcity in the training data. Since the prediction reliability in these edge scenarios has not been specifically verified, testing and enhancing robustness for such extreme conditions remains a key task for ensuring grid operational safety.
4. Conclusions
In this study, a short-term wind power cluster power prediction model based on SFCM and DGTK-Net is proposed for the three major challenges of “cluster division, dynamic directed graph construction, and spatio-temporal nonlinear modeling” in short-term power prediction of large-scale wind power clusters, and the effectiveness of the proposed method is verified in comparative experiments. The main conclusions are as follows.
- Firstly, at the cluster partition level, the Calinski–Harabasz index of the clustering results of the sub-clusters generated by the spectral embedding fuzzy clustering method is 0.21 higher than that of the traditional FCM and K-means. By deeply integrating the geographical location of the wind farm and the numerical weather forecast information, the complex nonlinear coupling relationship between the stations is effectively revealed. Compared with the clustering method with a single feature, the average mutual information value of the internal wind speed sequence of the proposed method is improved by about 12% and 19%. The sub-clusters with clear physical meaning generated by this method lay a solid foundation for the subsequent construction of high-quality local graph structures and significantly improve the representation ability of the model.
- Secondly, at the level of graph structure construction, the proposed graph construction method combining stacked wind direction matrix and wind speed mutual information not only accurately captures the directional characteristics of information propagation between wind farms through the continuous evolution of wind direction, but also uses mutual information to dynamically quantify the nonlinear dependence intensity between wind farms, which provides a more accurate spatial relationship prior for the prediction model. After ablation experiments and a statistical t-test, the prediction accuracy of this dynamic directed graph strategy is effectively improved by 1.95% compared with the traditional static undirected graph.
- Finally, at the prediction model level, the DGTK-Net developed in this paper realizes the nonlinear feature mining of the complex spatio-temporal evolution law of wind power through spatio-temporal joint modeling. The experimental results show that the correlation coefficient of the model improves by 2.31% on average during the high-output climbing period, and the NRMSE is still reduced by 1.16% on average compared with the advanced scheme. The generalization tests in larger clusters and different seasons further verify the robust performance. This method provides a high-precision end-to-end solution for wind power prediction. Its output can serve the power grid dispatching, which is helpful to reduce the reserve cost caused by power uncertainty, and has clear engineering value for improving the economy and operation safety of a high-proportion new energy power grid.
Although this study has achieved certain results, it has a generalization performance in different periods and regions. However, the performance of the model is still limited to a certain extent by the accuracy of numerical weather forecast data, and the computational cost may become a bottleneck restricting its application in larger cluster prediction scenarios. Furthermore, the current dependence on empirical hyperparameter tuning and the potential performance fluctuations under rare, data-scarce extreme weather events are also key challenges that need to be addressed. Future research will focus on developing a more robust and lightweight model architecture and exploring the migration application of this framework in other renewable energy prediction scenarios to further improve the practicability and universality of the method.
Author Contributions
Conceptualization, B.W. and Z.W. (Zhao Wang); methodology, X.C. and J.N.; software, M.G.; validation, B.W. and Z.W. (Zhao Wang); formal analysis, M.G. and J.N.; investigation, B.W.; resources, Z.W. (Zheng Wang); data curation, J.N. and X.C.; writing—original draft preparation, X.C. and J.N.; writing—review and editing, M.G.; visualization, B.W. and X.C.; supervision, B.W.; project administration, Z.W. (Zhao Wang); funding acquisition, B.W. All authors have read and agreed to the published version of the manuscript.
Funding
This research work is supported by Smart Grid-National Science and Technology Major Project (2025ZD0805500).
Institutional Review Board Statement
Not applicable.
Informed Consent Statement
Not applicable.
Data Availability Statement
The datasets presented in this article are unavailable due to privacy restrictions.
Conflicts of Interest
Authors Bo Wang, Zhao Wang, Zheng Wang, and Miao Guo were employed by State Grid Corporation of China. The remaining authors declare that the research was conducted in the absence of any commercial or financial relationships that could be construed as a potential conflict of interest.
Abbreviations
The following abbreviations are used in this manuscript:
| NWP | Numerical Weather Prediction |
| KAN | Kolmogorov–Arnold Network |
| DGTK-Net | Dynamic Graph Convolution and Transformer based on KAN enhancement |
| TCN | Time Convolution Network |
| GCN | Graphical Convolutional Network |
| CNN | Convolutional Neural Network |
| SFCM | Fuzzy C-Means Clustering Method Based on Spectral Embedding |
| FCM | Fuzzy C-Means |
| MI | Mutual Information |
| MLP | Multilayer Perceptron |
| DGCN | Dynamic Graph Convolution Network |
| RMSE | Root Mean Square Error |
| MAE | Mean Absolute Error |
| r | Correlation Coefficient |
References
- IEA. Electricity Mid-Year Update: July 2024; IEA: Paris, France, 2024. Available online: https://www.iea.org/reports/electricity-mid-year-update-july-2024 (accessed on 1 July 2025).
- IEA. Renewables 2025; IEA: Paris, France, 2025. Available online: https://www.iea.org/reports/renewables-2025 (accessed on 11 October 2025).
- Ning, C.; You, F. Deep Learning Based Distributionally Robust Joint Chance Constrained Economic Dispatch Under Wind Power Uncertainty. IEEE Trans. Power Syst. 2022, 37, 191–203. [Google Scholar]
- Peng, X.; Chen, Y.; Cheng, K.; Wang, H.; Zhao, Y.; Wang, B.; Che, J.; Liu, C.; Wen, J.; Lu, C.; et al. Wind power prediction for wind farm clusters based on the multi-feature similarity matching method. IEEE Trans. Ind. Appl. 2020, 56, 4679–4688. [Google Scholar] [CrossRef] [Scilit]
- Yang, M.; Jiang, Y.; Xu, C.; Wang, B.; Wang, Z.; Su, X. Day-Ahead Wind Farm Cluster Power Prediction Based on Trend Categorization and Spatial Information Integration Model. Appl. Energy 2025, 388, 125580. [Google Scholar] [CrossRef] [Scilit]
- Yang, M.; Shen, X.; Huang, D.; Su, X. Fluctuation Classification and Feature Factor Extraction to Forecast Very Short-Term Photovoltaic Output Powers. CSEE J. Power Energy Syst. 2025, 11, 661–670. [Google Scholar]
- Peng, D.; Liu, Y.; Wang, D.; Luo, L.; Zhao, H.; Qu, B. Short-Term PV–Wind Forecasting of Large-Scale Regional Site Clusters Based on FCM Clustering and Hybrid Inception-ResNet Embedded with Informer. Energy Convers. Manag. 2024, 320, 118992. [Google Scholar]
- Tawn, R.; Browell, J. A Review of Very Short-Term Wind and Solar Power Prediction. Renew. Sustain. Energy Rev. 2020, 153, 111758. [Google Scholar]
- Chen, X.; Liu, L.; Peng, X.; Cai, Y. Wind Power Cluster Probability Prediction Based on Statistical Up-Scaling Method and Neural Network. In Proceedings of the 12th ICPES, Guangzhou, China, 23–25 December 2022. [Google Scholar]
- Yang, M.; Peng, T.; Zhang, W.; Su, X.; Han, C.; Fan, F. Abnormal Data Identification and Reconstruction Based on Wind Speed Characteristics. CSEE J. Power Energy Syst. 2025, 11, 612–622. [Google Scholar]
- Chen, S.; Tan, X.; Hu, M.; Chen, J.; Zhong, J. Cluster Dynamic Partitioning Strategy Based on Distributed Photovoltaic Output Prediction and Improved Clustering Algorithm. In Proceedings of the I&CPS Asia, Chongqing, China, 11–13 July 2023. [Google Scholar]
- Ma, S.; Geng, H.; Yang, G.; Pal, B.C. Clustering-Based Coordinated Control of Large-Scale Wind Farm for Power System Frequency Support. IEEE Trans. Sustain. Energy 2018, 10, 1349–1359. [Google Scholar]
- Li, F.; Ma, T.; Ma, J.; Ma, H.; Li, Y. Dynamic Wind Farm Power Prediction Method Based on Cluster Analysis. In Proceedings of the ICEDCS, Marseille, France, 15–17 March 2023; pp. 574–578. [Google Scholar]
- Song, Y.; Tang, D.; Yu, J.; Yu, Z.; Li, X. Short-Term Forecasting Based on Graph Convolution Networks and Multiresolution Convolution Neural Networks for Wind Power. IEEE Trans. Ind. Inform. 2023, 19, 1691–1702. [Google Scholar] [CrossRef] [Scilit]
- Liu, X.; Zhang, Y.; Zhen, Z.; Xu, F.; Wang, F.; Mi, Z. Spatiotemporal Graph Neural Network and Pattern Prediction Based Ultra-Short-Term Power Forecasting of Wind Farm Cluster. IEEE Trans. Ind. Appl. 2024, 60, 1794–1803. [Google Scholar]
- Zhao, Y.; Liao, H.; Pan, S.; Zhao, Y. Interpretable Multi-Graph Convolution Network Integrating Spatio-Temporal Attention and Dynamic Combination for Wind Power Forecasting. Expert Syst. Appl. 2024, 255, 124766. [Google Scholar] [CrossRef] [Scilit]
- Xiao, F.; Ping, X.; Li, Y.; Xu, Y.; Kang, Y.; Liu, D.; Zhang, N. The Short-Term Prediction of Wind Power Based on the Convolutional Graph Attention Deep Neural Network. Energy Eng. 2024, 121, 359–376. [Google Scholar] [CrossRef] [Scilit]
- Li, Z.; Ye, L.; Zhao, Y.; Pei, M.; Lu, P.; Li, Y.; Dai, B. A Spatiotemporal Directed Graph Convolution Network for Ultra-Short-Term Wind Power Prediction. IEEE Trans. Sustain. Energy 2023, 14, 39–54. [Google Scholar] [CrossRef] [Scilit]
- Yang, M.; Guo, Y.; Fan, F. Ultra-Short-Term Prediction of Wind Farm Cluster Power Based on Embedded Graph Structure Learning with Spatiotemporal Information Gain. IEEE Trans. Sustain. Energy 2025, 16, 308–322. [Google Scholar] [CrossRef] [Scilit]
- Liu, L.; Liu, J.; Ye, Y.; Liu, H.; Chen, K.; Li, D.; Dong, X.; Sun, M. Ultra-Short-Term Wind Power Forecasting Based on Deep Bayesian Model with Uncertainty. Renew. Energy 2023, 205, 598–607. [Google Scholar]
- Lu, X.; Dong, C.; Wang, Z.; Jiang, J.; Wang, B.; Li, B. Research on Short-Term Wind Power Forecasting Technology Under Low Temperature and Cold Wave Weather. Power Syst. Technol. 2024, 48, 4833–4843. [Google Scholar]
- Bai, S.; Kolter, J.Z.; Koltun, V. An Empirical Evaluation of Generic Convolutional and Recurrent Networks for Sequence Modeling. arXiv 2018, arXiv:1803.01271. [Google Scholar] [CrossRef] [Scilit]
- Zhang, J.; Liu, D.; Li, Z.; Han, X.; Liu, H.; Dong, C.; Wang, J.; Liu, C.; Xia, Y. Power Prediction of a Wind Farm Cluster Based on Spatiotemporal Correlations. Appl. Energy 2021, 302, 117568. [Google Scholar] [CrossRef] [Scilit]
- Yu, C.; Yan, G.; Yu, C.; Zhang, Y.; Mi, X. A Multi-Factor Driven Spatiotemporal Wind Power Prediction Model Based on Ensemble Deep Graph Attention Reinforcement Learning Networks. Energy 2023, 263, 126034. [Google Scholar]
- Li, Z.; Ye, L.; Song, X.; Luo, Y.; Pei, M.; Wang, K.; Yu, Y.; Tang, Y. Heterogeneous Spatiotemporal Graph Convolution Network for Multi-Modal Wind–PV Power Collaborative Prediction. IEEE Trans. Power Syst. 2024, 39, 5591–5608. [Google Scholar]
- Yang, M.; Ju, C.; Huang, Y.; Guo, Y.; Jia, M. Short-Term Power Forecasting of Wind Farm Cluster Based on Global Information Adaptive Perceptual Graph Convolution Network. IEEE Trans. Sustain. Energy 2024, 15, 2063–2076. [Google Scholar] [CrossRef] [Scilit]
- Wang, L.; He, Y. M2STAN: Multi-Modal Multi-Task Spatiotemporal Attention Network for Multi-Location Ultra-Short-Term Wind Power Multistep Predictions. Appl. Energy 2022, 324, 119672. [Google Scholar] [CrossRef] [Scilit]
- Zhu, Q.; Li, J.; Qiao, J.; Shi, M.; Wang, C. Application and Prospect of Artificial Intelligence Technology in Renewable Energy Forecasting. Proc. CSEE 2023, 43, 3027–3048. [Google Scholar]
- Wang, F.; Chen, P.; Zhen, Z.; Yin, R.; Cao, C.; Zhang, Y.; Duić, N. Dynamic Spatio-Temporal Correlation and Hierarchical Directed Graph Structure Based Ultra-Short-Term Wind Farm Cluster Power Forecasting Method. Appl. Energy 2022, 323, 119579. [Google Scholar] [CrossRef] [Scilit]
- Meng, Q.; He, Y.; Hussain, S.; Lu, J.; Guerrero, J.M. Day-Ahead Economic Dispatch of Wind-Integrated Microgrids Using Coordinated Energy Storage and Hybrid Demand Response Strategies. Sci. Rep. 2025, 15, 26579. [Google Scholar]
- Zhang, F.; Zhao, J.; Ye, X.; Chen, H. One-Step Adaptive Spectral Clustering Networks. IEEE Signal Process. Lett. 2022, 29, 2263–2267. [Google Scholar] [CrossRef] [Scilit]
- Zhang, M.; Zhen, Z.; Liu, N.; Zhao, H.; Sun, Y.; Feng, C.; Wang, F. Optimal Graph Structure Based Short-Term Solar PV Power Forecasting Method Considering Surrounding Spatio-Temporal Correlations. IEEE Trans. Ind. Appl. 2023, 59, 345–357. [Google Scholar]
- Bezdek, J.C.; Ehrlich, R.; Full, W. FCM: The Fuzzy C-Means Clustering Algorithm. Comput. Geosci. 1984, 10, 191–203. [Google Scholar] [CrossRef] [Scilit]
- Park, J.; Park, J. Physics-Induced Graph Neural Network: An Application to Wind-Farm Power Estimation. Energy 2019, 187, 115883. [Google Scholar]
- Xiao, H.; He, X.; Li, C. Probability Density Forecasting of Wind Power Based on Transformer Network With Expectile Regression and Kernel Density Estimation. Electronics 2023, 12, 1187. [Google Scholar] [CrossRef] [Scilit]
- Xiong, R.; Yang, Y.; He, D.; Zheng, K.; Zheng, S.; Xing, C.; Zhang, H.; Lan, Y.; Wang, L.; Liu, T.-Y. On Layer Normalization in the Transformer Architecture. In Proceedings of the 37th International Conference on Machine Learning (ICML 2020), Online, 13–18 July 2020. [Google Scholar]
- Sun, Y.; Yang, J.; Zhang, X.; Hou, K.; Hu, J.; Yao, G. An Ultra-Short-Term Wind Power Forecasting Model Based on EMD-Encoder Forest-TCN. IEEE Access 2024, 12, 60058–60069. [Google Scholar]
- Li, M. Wind Power Prediction of BiTCN-BiGRU-KAN Model Based on Attention Mechanism. In Proceedings of the IEEE 2nd International Conference on Sensors, Electronics and Computer Engineering (ICSECE), Jinzhou, China, 29–31 August 2024; pp. 1640–1645. [Google Scholar]
- Liu, Z.; Wang, Y.; Vaidya, S.; Ruehle, F.; Halverson, J.; Soljačić, M.; Hou, T.Y.; Tegmark, M. Kan: Kolmogorov–Arnold Networks. arXiv 2024, arXiv:2404.19756. [Google Scholar]
- Xu, H.; Zhao, Z.; Wang, F. NWP Feature Selection and GCN-Based Ultra-Short-Term Wind Farm Cluster Power Forecasting Method. In Proceedings of the IEEE Industry Applications Society Annual Meeting (IAS), Detroit, MI, USA, 9–14 October 2022. [Google Scholar]
- Qu, Z.; Peng, X.; Song, J.; Yang, Z. Short-Term Wind Power Prediction Based on DTW Error Diagnosis and Transformer Optimization Model. In Proceedings of the IEEE 7th Conference on Energy Internet and Energy System Integration (EI2), Hangzhou, China, 15–18 December 2023. [Google Scholar]
- Yang, M.; Li, X.; Fan, F.; Wang, B.; Su, X.; Ma, C. Two-Stage Day-Ahead Multi-Step Prediction of Wind Power Considering Time-Series Information Interaction. Energy 2024, 312, 133580. [Google Scholar]

Disclaimer/Publisher’s Note: The statements, opinions and data contained in all publications are solely those of the individual author(s) and contributor(s) and not of MDPI and/or the editor(s). MDPI and/or the editor(s) disclaim responsibility for any injury to people or property resulting from any ideas, methods, instructions or products referred to in the content. |
© 2026 by the authors. Licensee MDPI, Basel, Switzerland. This article is an open access article distributed under the terms and conditions of the Creative Commons Attribution (CC BY) license.