


Abstract
Disaster response often requires evidence from several sources, including satellite imagery, social media, news reports, audio and video recordings, and event metadata. Existing disaster datasets, however, usually focus on one source, a limited set of modalities or a single task. This separation makes it difficult to evaluate models that must combine regional observations with ground-level evidence for the same disaster context. We introduce DisasterScope, an event-centric multimodal dataset and benchmark for disaster-type recognition, severity assessment and evidence retrieval. DisasterScope organizes satellite observations, social images, synchronized audio–video segments, observation text, report passages, and provenance metadata around canonical events. Its primary benchmark contains 12,159 fixed event-context bundles from 24 events and nine disaster classes. The dynamic-media inventory includes 273 source videos, 628 curated audio–video segments, 9.02 h of material and 5473 temporal windows. Labels are harmonized through source-label inheritance, taxonomy mapping, teacher assistance and partition-specific human review. Validation and test annotations were reviewed in full, while training annotations were sampled for review and accepted through a threshold gate. The benchmark evaluates full-input and unavailable-view conditions on the same bundle identities, allowing direct measurement of how each view affects a model without changing the evaluated sample population. DisasterScope therefore provides a traceable setting for studying multimodal disaster assessment across different disasters, evidence sources and input-availability conditions.
1. Introduction
Disaster assessment rarely depends on one observation alone. Satellite images can show the regional extent of flooding, fire or structural change, but they may not reveal conditions inside streets, buildings and shelters. Ground-level images can show local damage and access conditions, yet their field of view is narrow and their location or capture time may be incomplete. Audio can record alarms, explosions, wind, machinery or spoken reports. Video adds motion and temporal context that are absent from still images. Text from social posts, transcripts and official reports can describe impacts that are difficult to infer from pixels. These sources are complementary, but they also differ in spatial scale, temporal resolution, reliability and availability. A useful multimodal benchmark must preserve these differences instead of treating every source as an interchangeable feature.
Existing disaster datasets provide valuable resources within particular parts of this evidence space. Remote sensing datasets such as xBD [1], BRIGHT [2], SpaceNet 8 [3], and Sen1Floods11 [4] support tasks such as building damage assessment, flood mapping and road analysis from optical or radar imagery. Social media datasets such as CrisisMMD [5], CrisisBench [6], and MEDIC [7] provide image–text posts for informativeness, humanitarian category, damage and severity classification. Video and retrieval benchmarks address other parts of the problem. TRECVID DSDI [8] evaluates disaster-scene concepts in airborne video, MultiVENT 2.0 [9] studies event-centric video retrieval and DisastIR [10] evaluates retrieval of disaster-related passages. These datasets are valuable, but their native sample units, label spaces and evaluation tasks remain different.
This separation leaves four practical gaps. First, a model trained on one source cannot be assumed to use evidence from another source without an explicit common sample unit. Second, a dataset that contains several media types does not necessarily evaluate each type as a distinct model input. Audio, for example, may be embedded in a video file but never represented or tested separately. Third, classification, ordinal severity, and evidence retrieval answer different questions and are often studied with unrelated samples. Fourth, real inputs are not always available. Cloud cover, sensor schedules, deleted social posts, unavailable audio tracks, and incomplete video reporting can remove one view while the event and prediction target remain unchanged. If an evaluation changes both the available input and the sample population, the performance difference cannot be attributed to input availability alone.
We introduce DisasterScope, an event-centric dataset and benchmark designed around a fixed event-context bundle. Each bundle combines a satellite observation group, a social or ground-level image and a synchronized audio–video segment under one canonical disaster event. The satellite and ground observations are associated through shared event context and recorded metadata. Audio and video are synchronized within their curated segment. Observation text, audio–video transcripts, official report passages, and provenance metadata retain separate roles because they provide different forms of evidence. This design gives every benchmark sample a stable identity while preserving the boundaries of what the source records establish.
The primary benchmark contains 12,159 bundles from 24 events and nine disaster classes. The events include earthquakes, tropical cyclones, floods, wildfires, volcanoes, tsunamis, tornadoes or windstorms, explosions and armed conflict. The dynamic-media inventory contains 273 source videos and 628 curated audio–video segments with a total duration of 9.02 h. Segment processing produces 5473 temporal windows for time-sensitive analysis. The fixed bundles use 1254 satellite groups, 12,083 social observations, 550 audio–video segments and 268 source videos. We report these quantities in their native units because bundles, images, videos, segments and temporal windows do not represent the same object. The dataset also records partitions, source groups, modality availability, label provenance and asset reuse so that results can be traced to the evidence used by each sample.
DisasterScope supports three task families. Disaster-type recognition predicts one of the nine disaster classes. Severity assessment uses a shared three-level target. Evidence retrieval uses satellite evidence as the query and ranks candidates through three routes: social-image evidence, audio–video evidence and a combined ground-evidence bundle. All three routes use binary same-event relevance. The routes differ in their candidate units and modality composition, so their results are reported separately. The primary classification input consists of satellite imagery, a social image, audio and video.
Labels from different sources cannot be merged by name alone. DisasterScope therefore records how each label was obtained and harmonized. Satellite labels are inherited from multiple source datasets and mapped through documented taxonomy-mapping rules. Social-image and observation-text labels combine source-label inheritance and mapping with teacher assistance where required. Video and audio labels use teacher assistance at their declared temporal units. Validation and test annotations received complete human review. Training annotations received sampled human review and were accepted through a predefined threshold gate.
The classification benchmark evaluates full-input and unavailable-view conditions on the same bundle identities and targets. The resulting difference measures the effect of removing an available view rather than the effect of selecting easier or harder examples. Results are reported for each unavailable view instead of being reduced to one average. This exposes cases in which a model performs well with all inputs but fails when a particular source is absent. The retrieval benchmark instead fixes the satellite queries and the route-specific candidate identities across the compared methods. These evaluation rules make strong unimodal and simple-fusion systems necessary reference points. The evaluation does not assume that a more complex fusion method will be best for every task or availability condition. This paper makes the following contributions:
- DisasterScope brings satellite, social-image, audio, and video evidence into 12,159 fixed bundles spanning 24 events, while retaining observation-text and document evidence in clearly defined roles.
- It provides deterministic and traceable event-context samples with source identifiers, modality masks, label provenance and reuse records.
- It defines a unified benchmark for disaster-type recognition, three-level severity assessment and satellite-grounded same-event evidence retrieval across three candidate routes.
- It provides paired full-input and unavailable-view evaluation.
The benchmark is intended to test how models use complementary disaster evidence under these definitions. Bundle construction follows a same-event principle: cross-view observations are grouped because they refer to the same canonical event, while their recorded spatial and temporal scopes are preserved.
The remainder of this paper is organized as follows. Section 2 reviews related work. Section 3 describes dataset construction and annotation, and Section 4 defines the benchmark tasks and evaluation protocol. Section 5 presents the benchmark methods. Section 6 reports the experimental setup, results, analysis and limitations. The following Section 7 concludes this paper.
2. Related Work
2.1. Remote Sensing Disaster Datasets
Remote sensing benchmarks usually define supervision at the building, pixel, tile, or geographic-area level. xBD [1] provides pre-event and post-event optical imagery with building localization and damage labels. BRIGHT [2] extends building damage assessment to high-resolution optical and synthetic-aperture radar observations. SpaceNet 8 [3] combines building, road, and flood targets, while Sen1Floods11 [4] provides flood and permanent-water supervision from Sentinel-1 imagery with optical support. FloodNet [11] and RescueNet [12] use post-disaster aerial or unmanned-aerial-vehicle images for classification, segmentation, and visual question answering.
These datasets provide detailed regional supervision, but their native labels describe different objects. A building damage category is not equivalent to a flood pixel label or a bundle-level severity target. Optical and radar observations also differ in resolution, geometry, and sensitivity to weather. A cross-source benchmark must therefore preserve source semantics and record each taxonomy mapping. DisasterScope uses satellite data as one view in an event-context bundle. It does not replace the native building or pixel tasks of the source datasets.
Recent remote sensing vision-language resources broaden the task space. DisasterM3 [13] supports perception, reasoning, and reporting over satellite observations. DisasterInsight [14] studies grounded and function-aware disaster assessment. Their language components are tied to remote sensing scenes or derived annotations. This is different from a social observation, a synchronized audio–video transcript, or an official report passage. DisasterScope retains these distinctions because the text sources have different origins and evidence scopes.
2.2. Crisis Social Media, Video, and Cross-Source Resources
Operational platforms provide another form of support for disaster response. The Global Disaster Awareness and Coordination System (GDACS) [15] is a cooperation framework between the United Nations and the European Commission that provides multi-hazard notifications, rapid impact estimates, and online coordination tools during the early stage of major disasters. Its impact assessment combines hazard magnitude or intensity with population exposure and regional vulnerability to estimate the possible need for international assistance. GDACS has also studied social media as an additional source for rapid impact awareness [16]. GDACS is designed for operational alerting and coordination, whereas DisasterScope provides event-aligned multimodal samples, harmonized labels, benchmark splits, and evaluation tasks for model training and comparison.
Crisis social media datasets study information at the post level. CrisisMMD [5] provides paired text and images for informativeness, humanitarian category, and damage tasks. CrisisBench [6] harmonizes text labels across crisis datasets and addresses duplicate and label-alignment issues. MEDIC [7] consolidates social images for disaster type, informativeness, humanitarian category, and severity assessment. Incidents1M [17] expands incident and place recognition to web-image scale. These resources represent local or public observations, but they do not define a common satellite, social-image, audio, and video input for each benchmark sample.
Other datasets extend the available evidence. CrisisTS [18] combines social posts and meteorological time series. MASH [19] contains multiplatform posts with text, images, and video, and DisasterVQA [20] provides expert-curated questions over disaster imagery. The presence of video does not necessarily mean that audio is modeled as a separate stream. It also does not establish a shared sample identity with regional satellite evidence. Video and retrieval benchmarks define further units and goals. TRECVID DSDI [8] evaluates disaster-scene concepts and ranked retrieval over video shots. MultiVENT 2.0 [9] evaluates event-centric video retrieval using visual, speech, text, and metadata evidence. DisastIR [10] retrieves report passages for disaster-information needs. Their query, shot, and passage units do not directly provide a relation to satellite and social observations.
Satellite–social integration is established prior work. The MediaEval Multimedia Satellite tasks [21] coordinated social flood-evidence retrieval with satellite analysis, and JORD [22] linked satellite imagery with online images, posts, and videos through event and geolocation information. These studies motivate cross-source analysis, but they also show why relation scope must be stated carefully. Event association, geolocation, temporal correspondence, and exact local matching are different claims. DisasterScope evaluates same-event retrieval and distinguishes three candidate units rather than treating them as exact local matches.
2.3. Multimodal Fusion and Unavailable-Input Learning
Fusion methods differ in where evidence is combined. Feature concatenation projects modality features into a common vector before classification. Cross-attention allows one view to condition the representation of another. MultiBench [23] shows that the relative value of these choices depends on the task, data scale, feature quality, and agreement between modalities. Strong unimodal encoders and low-capacity fusion methods are therefore necessary controls.
Unavailable inputs introduce distinct learning and evaluation challenges. In the existing literature, two different paradigms can be distinguished. ModDrop [24] and EmbraceNet [25] operate by randomly dropping or sampling modality streams during training across all instances to learn robust joint representations that endure input loss. ActionMAE [26] reconstructs missing modality features, while ShaSpec [27] and SimMLM [28] utilize shared–specific feature disentanglement or masked multimodal pretraining.
In contrast, DisasterScope evaluates models under deterministic missing-view masks at inference time without altering sample identities or evaluation targets, isolating the precise performance impact of each missing source. Furthermore, our proposed 4T-MCT method differs from random dropout by employing fixed single-input-unavailable training conditions alongside full-input supervision, utilizing teacher-guided knowledge distillation to maintain modality-specific discriminative power while learning an availability-aware student representation.
2.4. Evidence Retrieval, Severity Evaluation and Dataset Positioning
Evidence retrieval in disaster analysis covers different definitions of relevance. A social media task may rank posts that provide flood evidence, as in MediaEval [21]. A video task may match a query to a visible phenomenon, as in TRECVID DSDI [8] and MultiVENT 2.0 [9]. A report task may retrieve passages that support an information need, as in DisastIR [10]. Their scores are not directly comparable because the query units, candidate pools, and positive relations differ. DisasterScope uses one explicit criterion, binary same-event relevance, and evaluates it through social-image, audio–video, and combined ground-evidence candidate routes.
Table 1 compares modality coverage, scale, and primary tasks. Large single-source datasets remain larger in their native units. DisasterScope is positioned by the combination of fixed SIAV (Satellite, Social Image, Audio, Video) and SIAVT (Satellite, Social Image, Audio, Video, Observation Text) bundles, separate synchronized audio and video inputs, classification and relation-scoped retrieval, and evaluation under unavailable inputs.
Table 1.
Comparison with representative disaster datasets. Counts are reported in each dataset’s native units. Partial means that audio may be present in a video asset but is not evaluated as an independent input stream.
3. Dataset Construction and Annotation
3.1. Sources and Canonical Event Registry
DisasterScope is organized around canonical disaster events rather than a single source dataset. The event registry resolves source-specific names and aliases to one event identity and records the date, geographic context, disaster class, and source provenance. Satellite observations, social media records, dynamic media, observation text, and supporting metadata are then associated with that identity. Original asset identifiers remain available for audit.
The dataset contains 24 events from nine disaster classes. The primary benchmark has 12,159 event-context bundles, divided into 8162 training, 2156 validation and 1841 test bundles. These bundles use 1254 satellite groups, 12,083 social observations, 550 audio–video segments and 268 source videos. The larger dynamic-media inventory contains 273 source videos and 628 curated segments, with a total duration of 9.02 h and 5473 temporal windows. Counts are reported in their native units because an event, asset, video, segment, window, and bundle refer to different objects.
Satellite data provide regional pre-disaster and post-disaster observations. Social images provide ground-level evidence, and their associated posts supply observation text when available. Dynamic media are segmented into synchronized audio and video inputs. Transcripts and official report passages are stored as separate evidence types. They are not silently concatenated with observation text.
3.2. Asset Processing and Bundle Construction
Each source passes source-specific checks before entering the benchmark. Satellite groups retain sensor and pre/post identifiers. Social records retain event association, source identity, timestamp when available, media references, and observation text. Dynamic-media processing retrieves captions where available, creates sliding temporal windows, scores the windows against event-specific evidence queries, removes duplicates, and selects segments under source and duration constraints. Audio and video are materialized from the same temporal interval.
Let + denote the modality set containing satellite , social image , audio 𝒜, video , and observation text . Bundle n is:
where en denotes the canonical event, denotes the input of modality m, and is the binary availability indicator. The target for task t is , and indicates whether that target is eligible. SIAV uses modalities , , 𝒜, and , while SIAVT adds . This equation defines event-context membership. It does not imply that satellite and ground observations depict the same street, structure, or moment. Audio and video are synchronized within a curated segment. Source grouping prevents related assets from being separated in a way that would invalidate evaluation. Reuse records identify when an asset contributes to more than one bundle. To prevent data leakage across dataset partitions, raw asset units (satellite groups, social observations, and curated audio–video segments) are strictly isolated across the training, validation, and test splits. An asset unit assigned to the training split never appears in the validation or test split. Asset reuse (combining an asset with different complementary views to construct multiple bundles) occurs exclusively within a fixed partition split. Table 2 details the distribution of unique asset units across splits.
Table 2.
Partition of dataset. Native asset units are strictly isolated across splits to prevent data leakage. Resources are reused only within fixed splits to compose additional bundles.
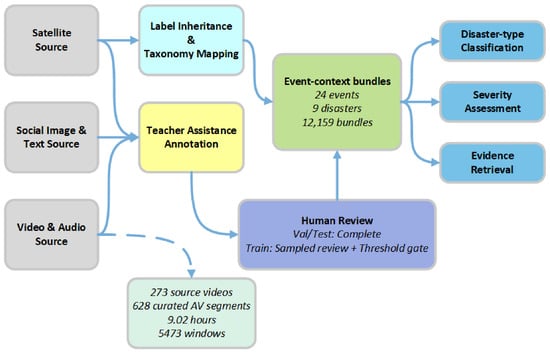
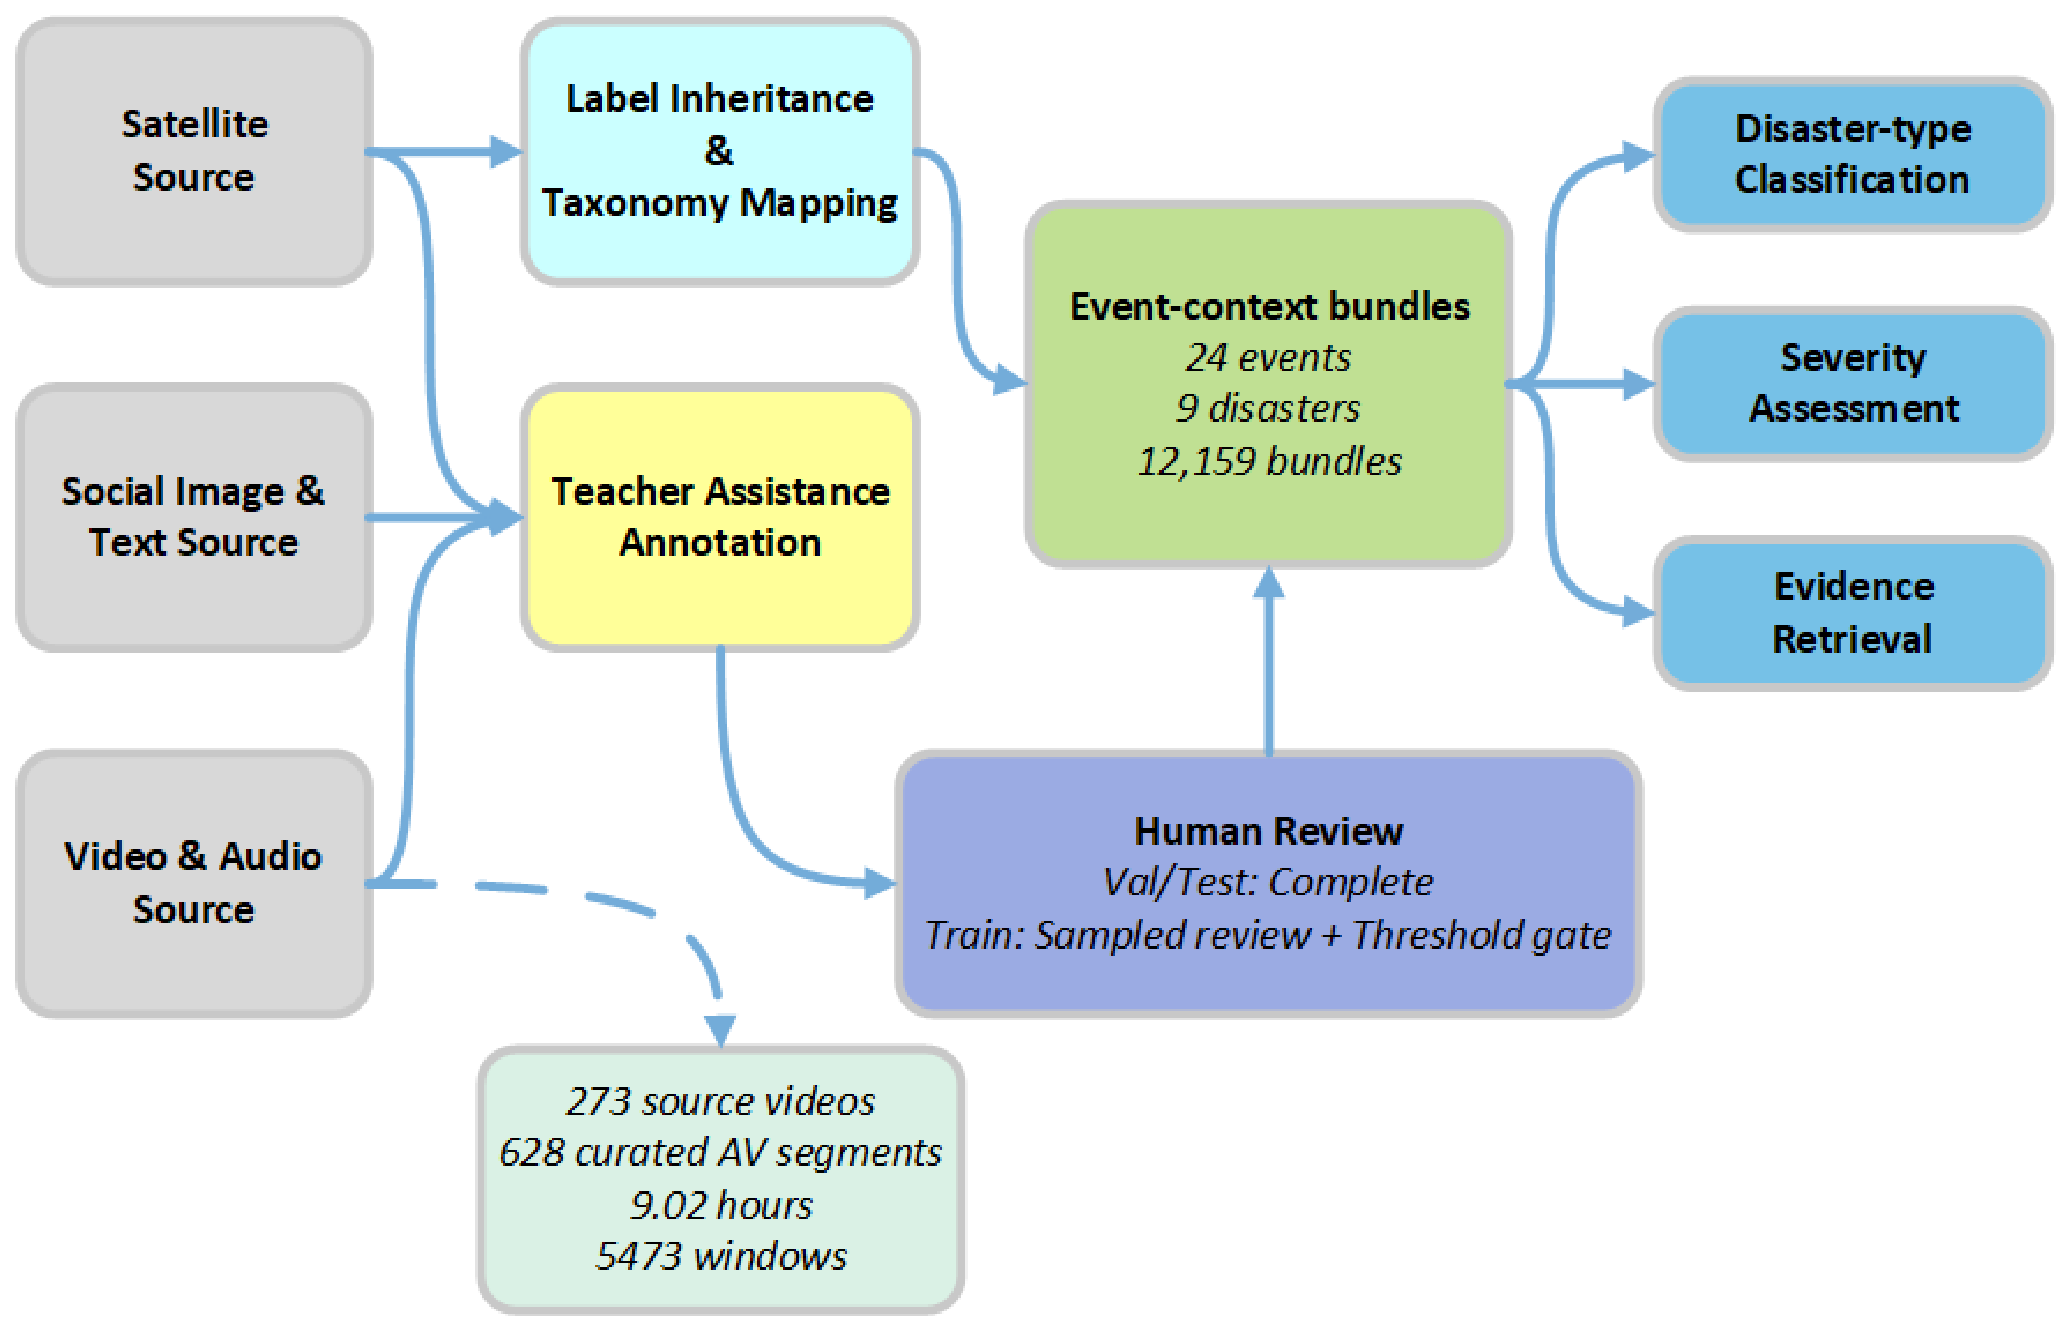
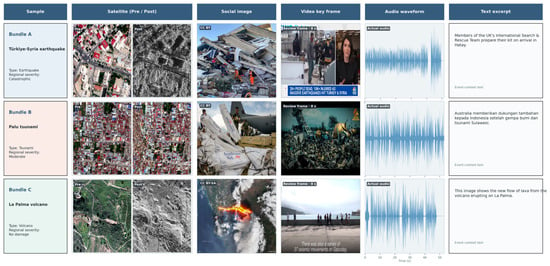
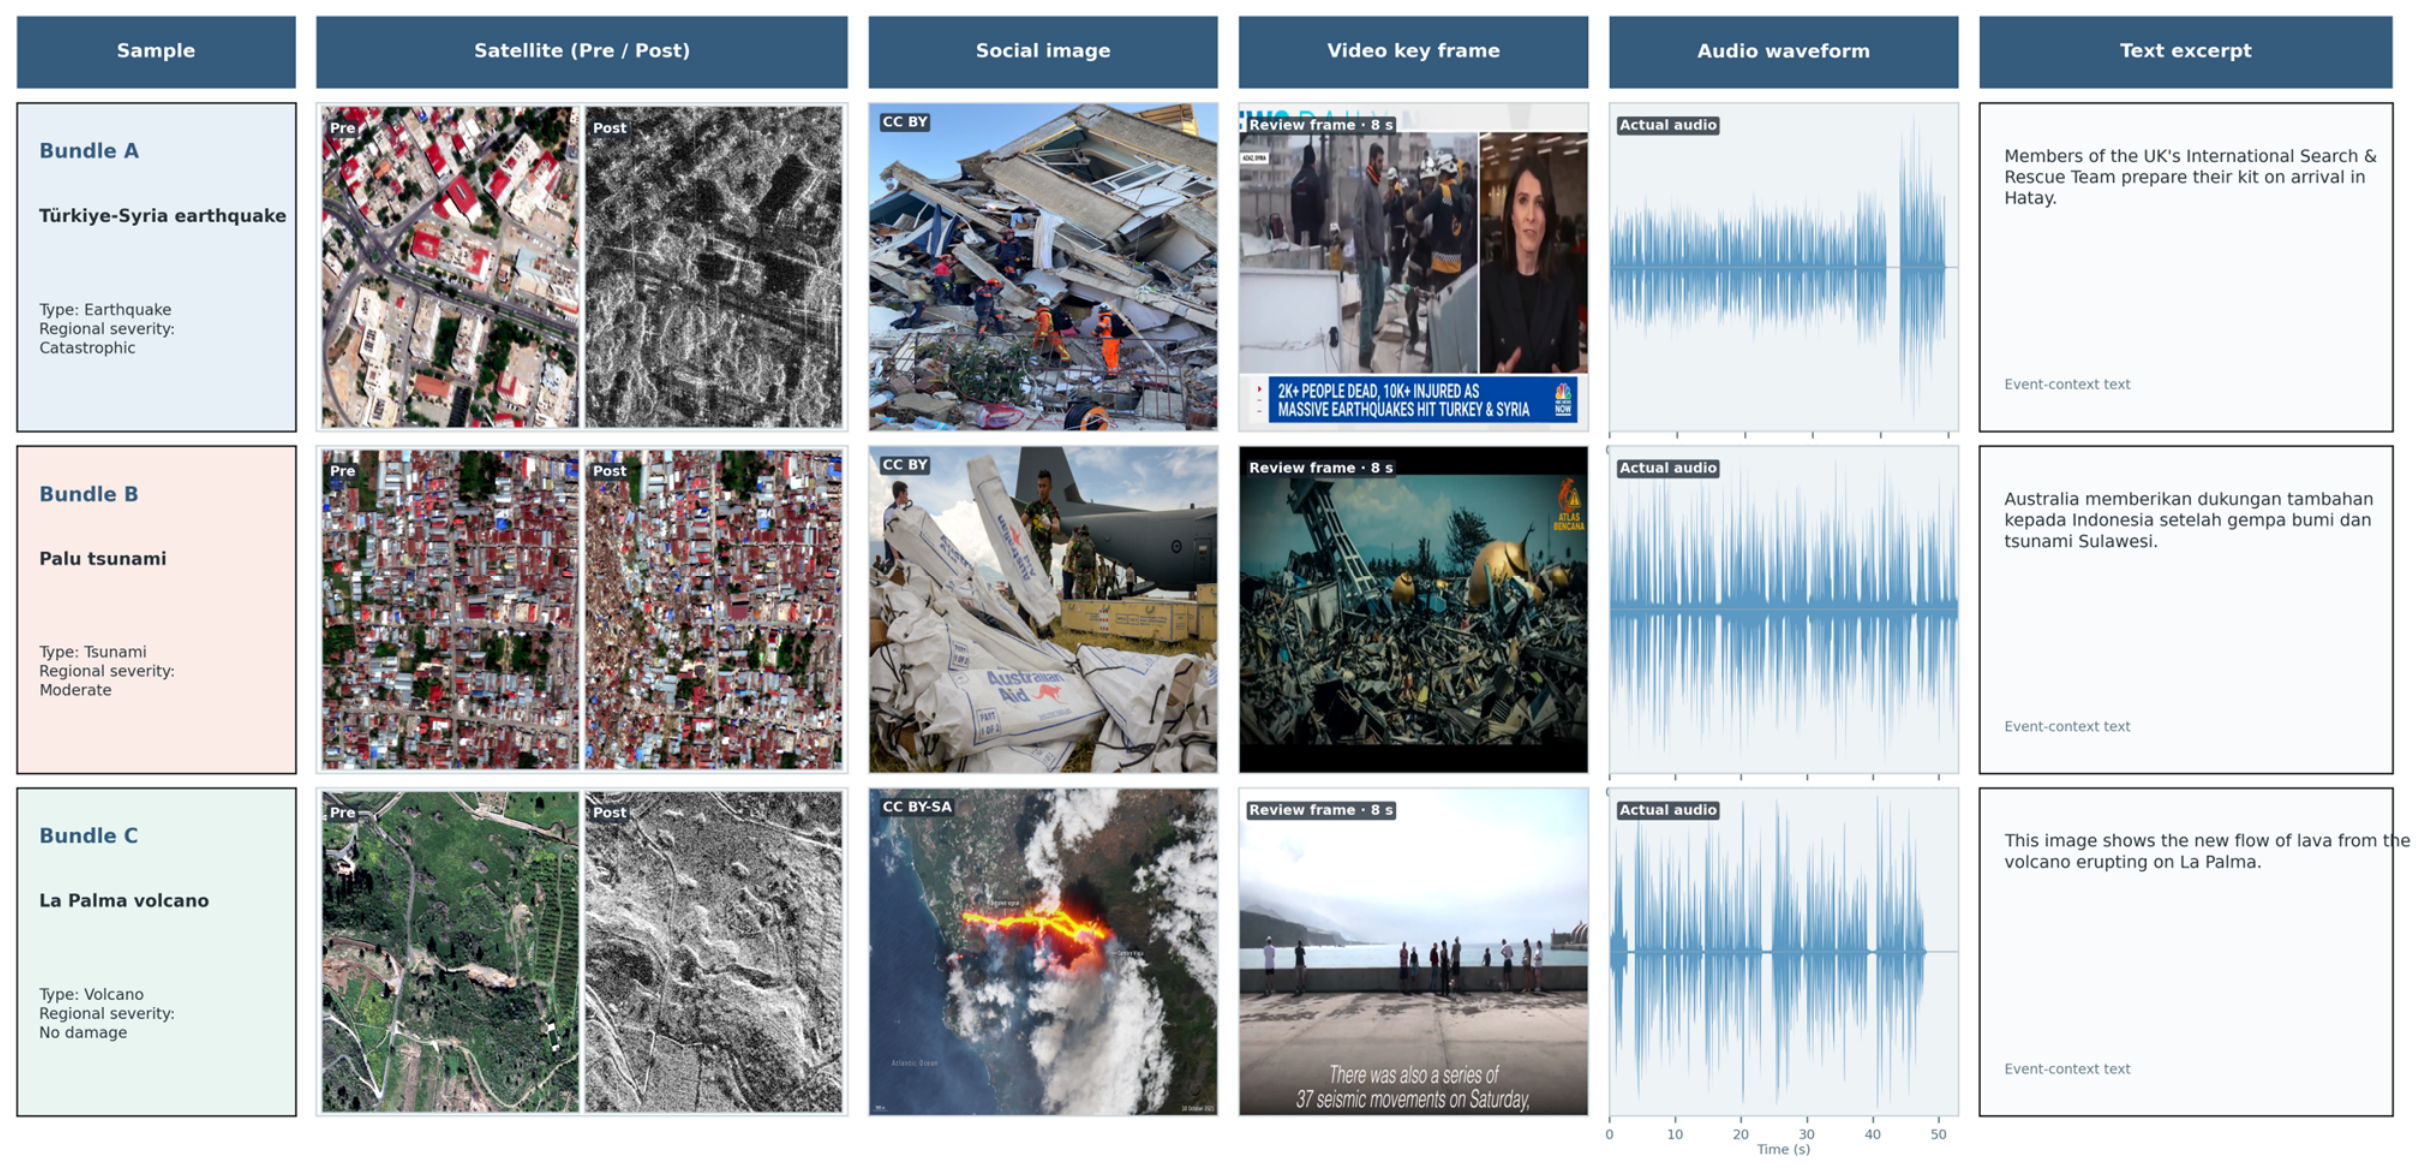
Figure 1 summarizes the pipeline, and Figure 2 shows three real bundles from different events. Each row contains the satellite pre/post pair, social image, video frame, audio waveform, and observation text. The display is intended to show the different evidence roles, not exact local correspondence across every column. The video key frames in the current figure are review assets. Their source terms must be confirmed, or the frames must be replaced, before publication.
Figure 1.
Dataset construction overview. Solid arrows show data flow through the pipeline; the dashed arrow indicates the data breakdown.
Figure 2.
Representative real bundles. Video key frames are shown for author review and require source-term confirmation before publication.
3.3. Modality-Specific Annotation
Labels are harmonized through documented mappings. Let item ι come from source dataset δι, with source label yι,src. For modality m(ι) and task t(ι),
where φ denotes the documented mapping rule. If a source annotation cannot produce an eligible benchmark target, the corresponding bundle-level indicator in Equation (1) is set to zero. The unavailable target is not treated as another semantic class. The source label, mapped label, source dataset, and mapping rule are retained separately.
The annotation route depends on the modality. Satellite annotations inherit original labels from multiple satellite datasets and map them into the shared taxonomy through Equation (2). Social-image and observation-text annotations use source-label inheritance and mapping, together with teacher assistance when further harmonization is needed.
Video and audio annotations use teacher assistance at the curated segment or temporal-window unit. Teacher assistance utilizes a structured multi-round annotation workflow powered by Qwen3.6 and Qwen3-VL. In practice, the prompting strategy is indicated as follows:
- Social Observation Annotation: The input comprises the visual post image (when available) and a sanitized post text stripped of URLs, user handles, explicit dates, and event/location identifiers. Prompts explicitly restrict the model from relying on geographic location, event identity, hashtags, or exaggerated language. Outputs are constrained to a rigid JSON schema specifying ‘severity level’ (0: none/minor, 1: localized moderate, 2: widespread severe), ‘severity available’ (Boolean), ‘damage observable’ (Boolean), confidence score, ‘evidence modalities’, and ‘evidence summary’. Insufficient evidence forces an explicit ‘null + false’ output rather than a default zero rating.
- Curated Audio–Video (AV) Segment Annotation: Video frames are sampled at a fixed 5 s cadence following the initial keyframe. The primary visual pass evaluates scene assessability, performs cross-frame object deduplication, and maps affected spatial extents to 0/1/2 severity levels. When transcripts are available, a secondary pass evaluates textual context without overriding visual evidence. Inferences run at temperature = 0 with strict JSON schema compliance.
Qwen3-VL was selected for its capability to process synchronized visual frames and text while strictly adhering to complex JSON output contracts. Qwen3.6 was chosen as a higher-capacity reasoning engine to perform secondary verification and assess annotation sensitivity across model scales. Both models operate under identical taxonomy schemas and temperature = 0, enabling deterministic, version-controlled cross-auditing.
Teacher assistance uses multiple rounds from Qwen 3.6 and Qwen3-VL. Let θιgr be the class probability vector for item ι, teacher g, and round r. With Rg rounds for teacher g:
where teacher index g identifies Qwen 3.6 or Qwen3-VL. Rounds are first averaged within each model. The two model-level means are then averaged with equal weight. The proposed class is obtained from the resulting vector under the task taxonomy.
3.4. Human Review and Quality Gates
All validation and test annotations were manually reviewed and confirmed. Training annotations were reviewed by sampling and accepted only after the predefined threshold gate passed. A human correction overrides the automatic proposal. Review records retain the final target, annotation route, and decision status.
For a teacher-assisted training item, the item-level gate is
where I[·] denotes the indicator function, τconf is the fixed confidence threshold, qil is the outcome of required check l, and Nchk is the number of item-level checks. The threshold τconf was empirically determined to be 0.70, aiming to optimize annotation yield while guaranteeing high precision during human verification, filtering out ambiguous model proposals while retaining sufficient high-quality training instances. Equation (4) is the item-level gate. A separate sampled-audit gate is applied to the training partition after item gating. The sampled audit is evaluated by declared strata, including modality, task, class, event, and disaster coverage. It passes only when each required stratum is represented and its quality statistic reaches the predefined threshold. Both gates have passed for the released training annotations. This review procedure keeps source inheritance, taxonomy mapping, model assistance, and human verification as distinct operations.
Validation and test sets undergo 100% manual human review. For the training partition, candidate items passing the item-level gate (τconf ≥ 0.7) were subjected to a 5% stratified random sample audit across modalities, disaster classes, and events. Table 3 summarizes the human review and audit statistics across partitions.
Table 3.
Human review and audit statistics for teacher-assisted candidate annotations across dataset partitions.
3.5. Dataset Statistics
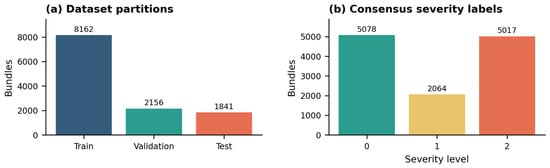
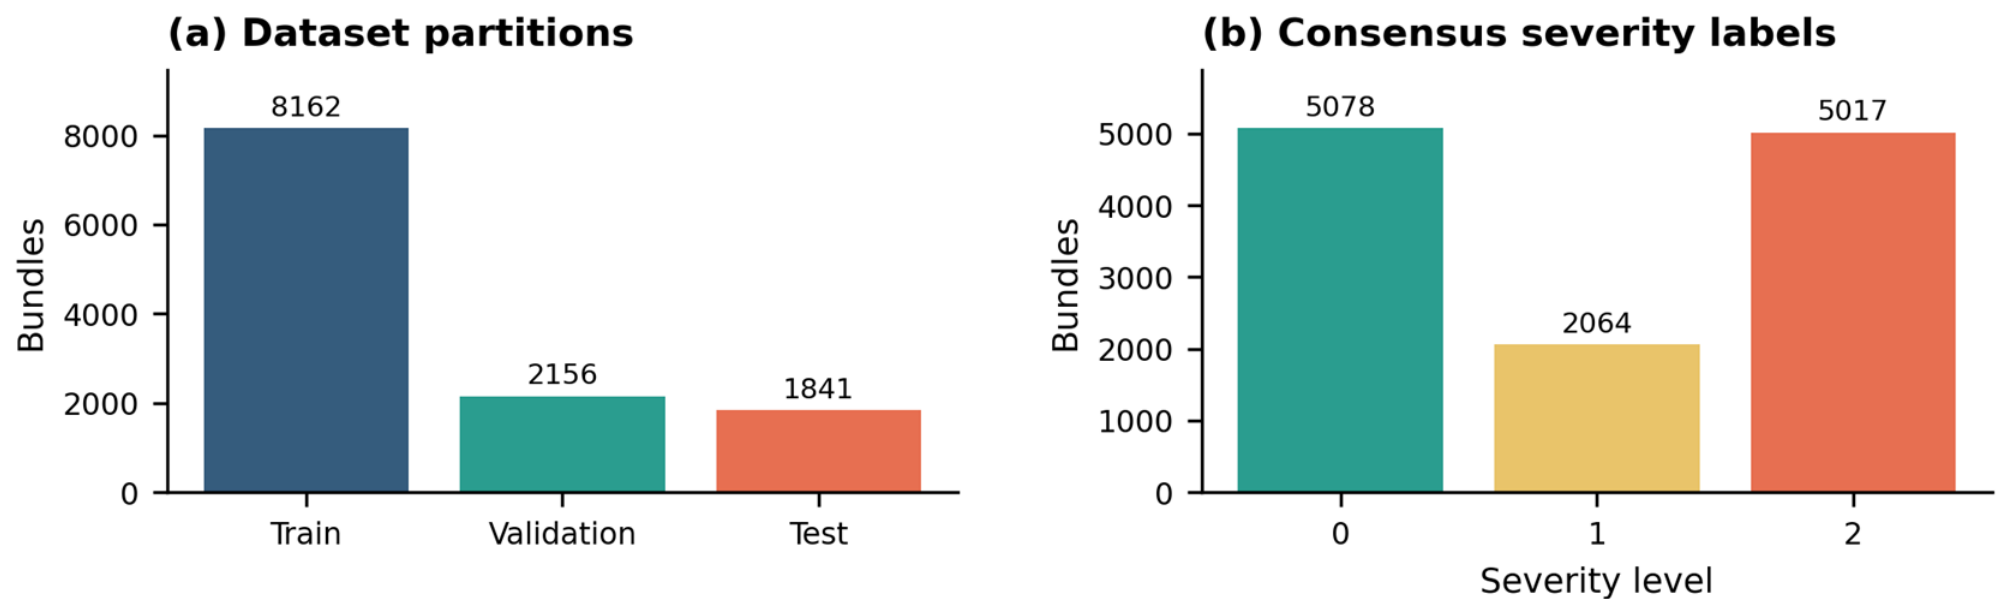
Table 4 summarizes the main inventory of DisasterScope. The dataset contains 12,159 bundles across 24 canonical events. Figure 3 details the dataset sample partition and severity label breakdown. Figure 3a illustrates the bundle distribution across the fixed train (8162 bundles, 67.1%), validation (2156 bundles, 17.7%), and test (1841 bundles, 15.1%) splits, maintaining a balanced ratio that guarantees sufficient evaluation data while preserving robust training volume. Figure 3b shows the distribution across the three ordered severity levels: un-affected/minor damage Level 0 (5078 bundles, 41.8%), localized moderate damage Level 1 (2064 bundles, 17.0%), and severe widespread damage Level 2 (5017 bundles, 41.3%), providing a balanced spread across low and high severity states for ordered classification.
Table 4.
DisasterScope inventory.
Figure 3.
Dataset distribution breakdown: (a) sample counts across train, validation, and test splits, and (b) severity label distribution across 3 levels.
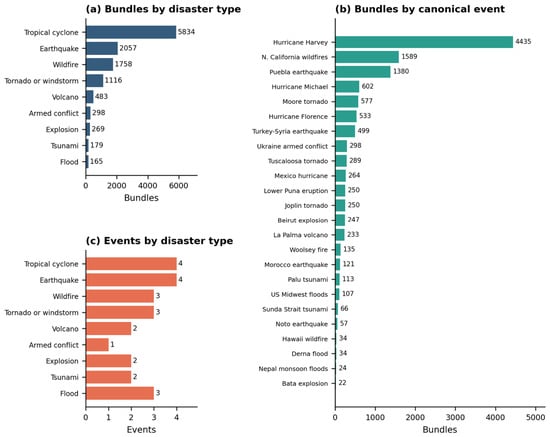
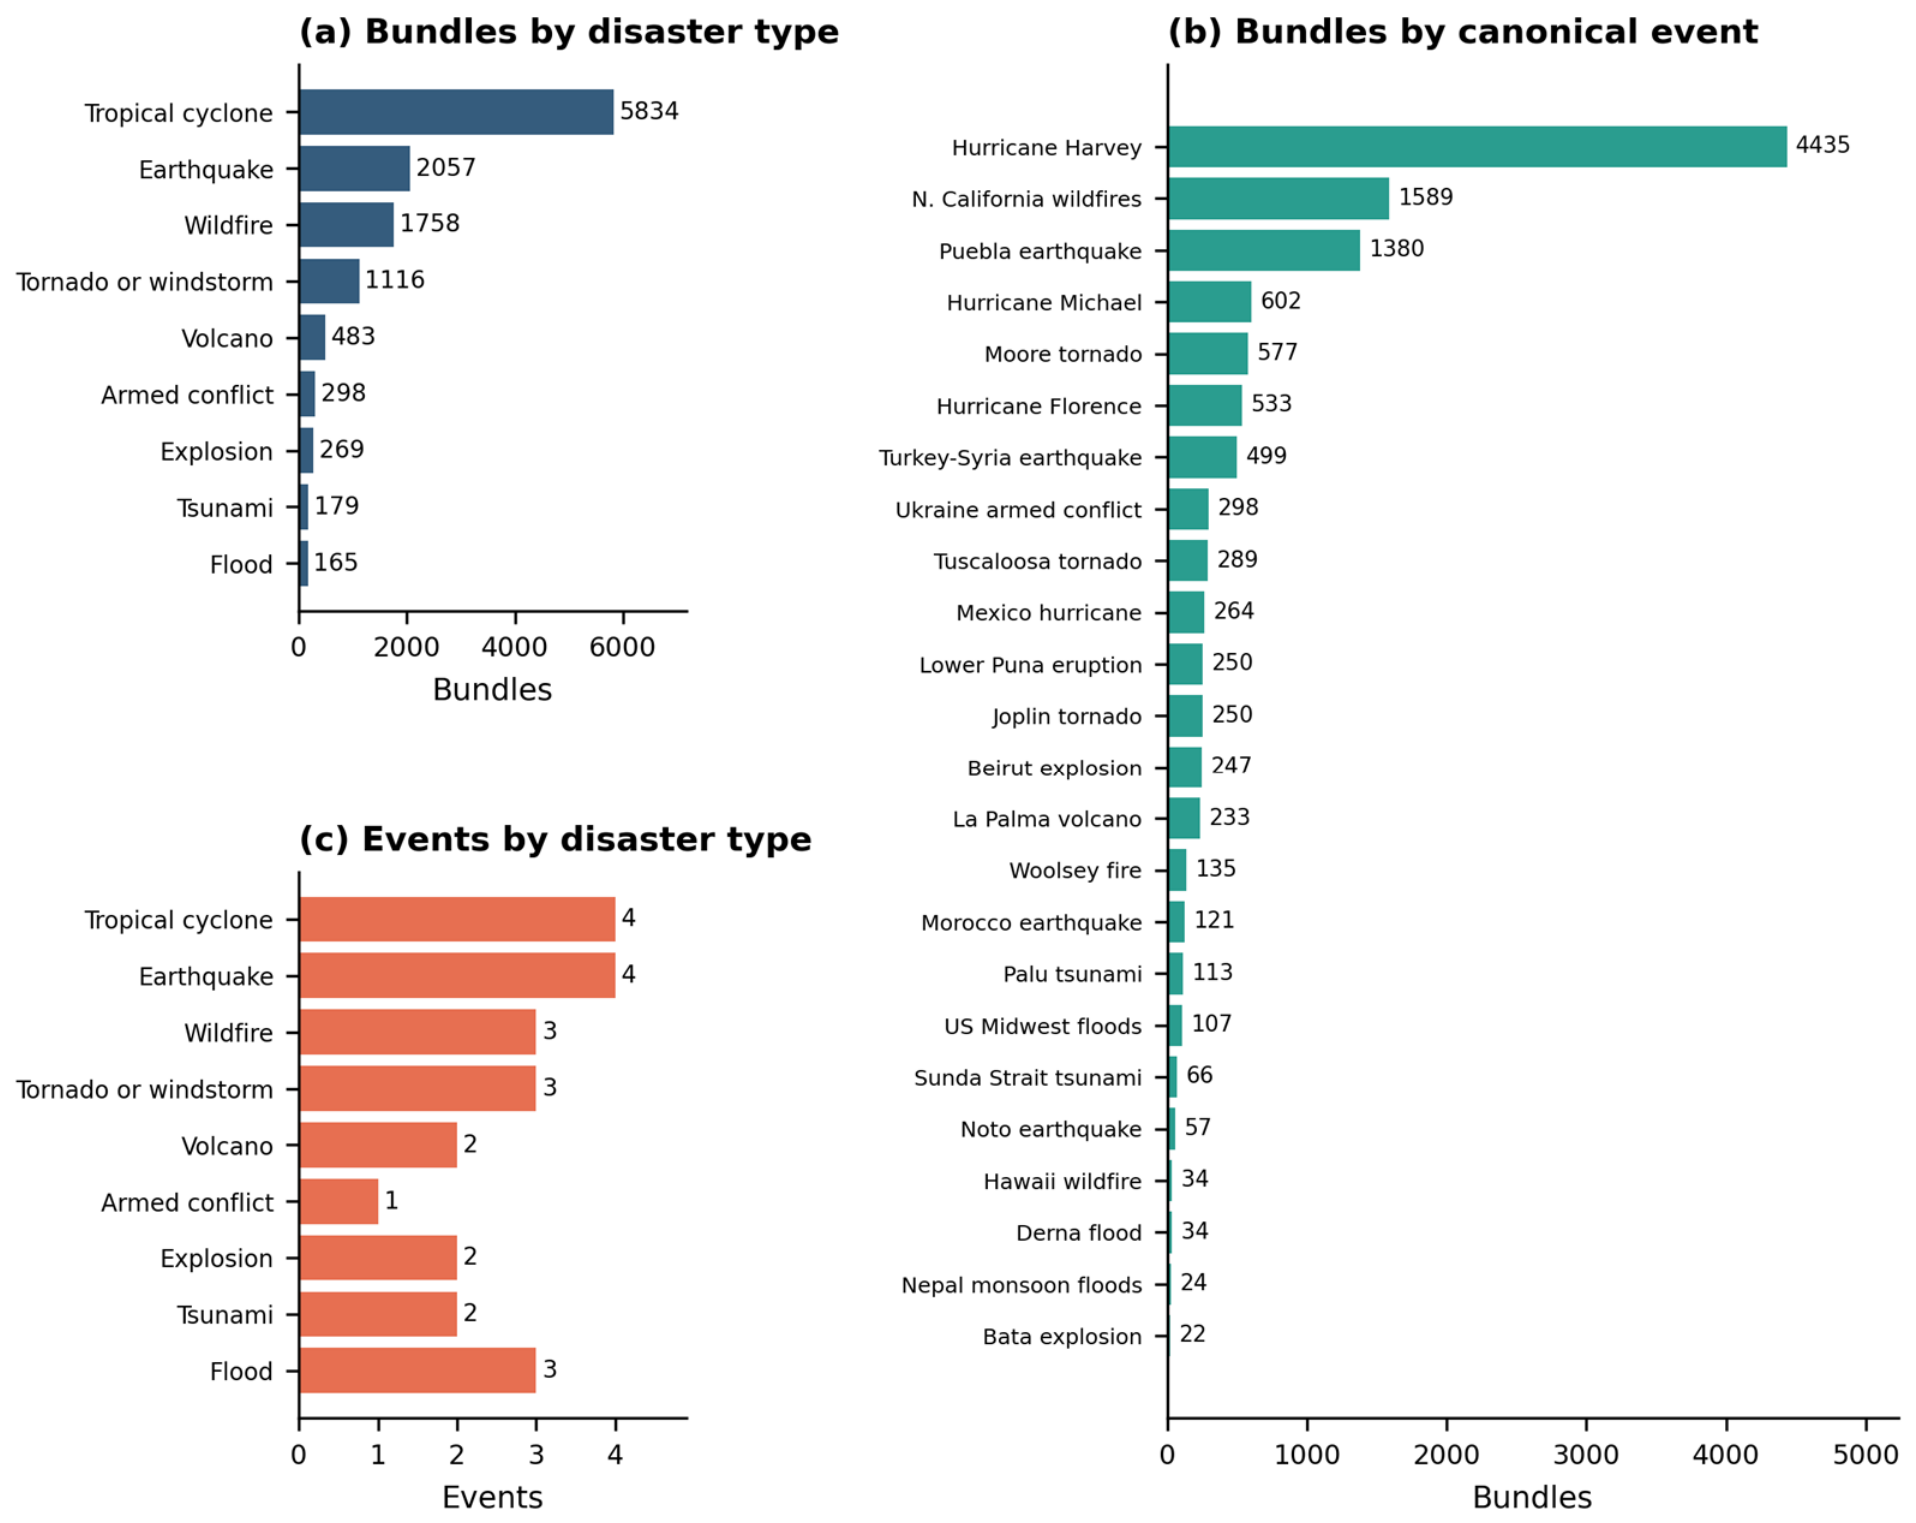
As shown in Figure 4, the dataset exhibits natural category-level and event-level sample imbalances reflecting real-world disaster occurrence and reporting frequencies. Figure 4a shows bundle counts per disaster category, where tropical cyclones (5834 bundles), earthquakes (2057 bundles), and wildfires (1758 bundles) constitute the largest hazard classes, while floods (1048 bundles), tornadoes (922 bundles), and landslides (540 bundles) form medium-to-small classes. Figure 4b details the canonical event breakdown per disaster type (e.g., six cyclone events, four earthquake events, four wildfire events, four flood events, four tornado events, and two landslide events). Figure 4c highlights individual event bundle volumes, ranging from large-scale hurricane deployments (e.g., Hurricane Ian: 1642 bundles) to localized events (e.g., Ellicott City Flood: 142 bundles).
Figure 4.
Disaster category and event distributions: (a) bundle counts per disaster type, (b) event counts per disaster type, and (c) bundle distribution across the 24 canonical events.
4. Tasks and Evaluation
4.1. Inputs, Targets, and Availability Masks
Disaster evidence rarely arrives in a uniform form. Satellite observations provide broad spatial coverage, social images capture local conditions, audio and video record dynamic developments, and observation text can state entities or impacts that are difficult to infer from pixels alone. These sources are complementary, but they also differ in coverage and availability. If different input configurations are evaluated on different samples, an apparent performance gain may reflect a change in the evaluated population rather than better multimodal reasoning. We therefore define fixed input configurations and retain an explicit availability mask for every bundle.
The benchmark uses the bundle in Equation (1) under two declared input settings. SIAV contains satellite imagery , social image , audio 𝒜, and video . SIAVT adds observation text . A model receives the input together with its availability vector an, whose elements are . Unavailable targets have set to zero and are excluded from the corresponding loss and metric.
SIAV measures reasoning from satellite imagery, social imagery, audio, and video, whereas SIAVT measures the additional contribution of observation text while preserving the same sample identities and targets. This design follows the need for standardized multimodal evaluation identified by MultiBench [23] and extends the paired image–text setting of CrisisMMD [5] to a wider set of disaster evidence. The mask tells a fusion module which sources are present, so an absent source is not interpreted as a valid zero-valued observation.
The benchmark contains three task families. Disaster-type classification uses an event-context bundle and nine hazard classes. Severity assessment uses eligible bundles and three ordered levels. Both classification tasks are evaluated under SIAV and SIAVT, including full-input, single-input-unavailable, and single-modality-remaining conditions. Evidence retrieval always uses satellite evidence as the query and evaluates three candidate routes under binary same-event relevance. SIAV and SIAVT define the candidate-side modality composition for these routes. The primary metrics are Macro-F1 for disaster type, Macro-F1, mean absolute error (MAE), and quadratic weighted kappa (QWK) for severity, and Normalized Discounted Cumulative Gain at rank 10 (nDCG@10), mean average precision (mAP), and Hit@K for evidence retrieval.
4.2. Disaster Type and Severity
Disaster type and severity answer two different questions: what kind of event is represented, and how serious is its observed impact? Type prediction can support hazard-specific routing, search, and downstream analysis. Severity assessment can help prioritize events or regions for closer review, although it is not a substitute for an operational field assessment. CrisisMMD [5] demonstrated the value of multimodal crisis categorization, while Crisis-DIAS [29] combined visual and linguistic evidence for damage identification and severity detection. Our tasks extend this line of work from individual social media posts to event-context bundles that combine regional- and ground-level evidence.
Disaster-type classification predicts over nine disaster classes. Macro-F1 is used for comparison because each disaster class contributes equally regardless of its number of bundles. Severity uses target with three values: 0, 1, and 2. They represent no or little damage, moderate damage, and severe or catastrophic damage after taxonomy mapping. The levels are ordered, but their numerical indices are not interpreted as physical measurements. We report Macro-F1, mean absolute error (MAE), and quadratic weighted kappa (QWK). For the eligible set :
Class frequencies differ across disasters and severity levels, so a sample-weighted aggregate can be dominated by common classes. Macro-F1 gives equal importance to each class. MAE records how many severity levels separate the prediction from the reference, and QWK measures agreement while assigning larger penalties to more distant errors. Reporting these measures together distinguishes class confusion from the magnitude of an error.
4.3. Evidence Retrieval
Classification produces a compact decision, but disaster analysts also need to locate evidence that supports further review. Ranked retrieval is useful when a collection contains many plausible observations and only a small subset can be inspected promptly. The MediaEval Multimedia Satellite task [21] studied satellite-to-social flood evidence, while MultiVENT 2.0 [9] evaluated event-centered retrieval over visual, speech, text, and metadata evidence. Their query units and relevance definitions differ, which motivates explicit route definitions in DisasterScope.
Every route uses satellite evidence as query u. Route A1 ranks a social image under SIAV and + under SIAVT. Route A2 ranks an audio–video segment 𝒜 + or + + . Route A3 ranks a combined ground-evidence bundle + 𝒜 + or + 𝒜 + + . The two input settings therefore change the candidate representation, not the satellite query.
Let eu and ej be the canonical event identities of query u and candidate j. Relevance is binary:
The query identities and each route-specific candidate pool remain fixed across the compared methods. A1 candidates are identified by social observation, A2 candidates by curated audio–video segment, and A3 candidates by event-context bundle.
The model assigns score suj and ranks the fixed candidate pool. The primary metric is nDCG@10:
where ranku(k) denotes the candidate at rank k, and IDCG@10(u) is the score under the ideal ranking. nDCG@10(u) rewards same-event candidates near the top and discounts lower ranks. Mean average precision summarizes the ranking of all same-event candidates. Hit@K equals 1 when at least one same-event candidate appears within the first K positions and 0 otherwise. We report Hit@1, Hit@5, and Hit@10. Metrics are computed separately for A1, A2, and A3 before any route-level average is formed.
4.4. Missing-Modality Evaluation
In practical use, evidence sources can disappear for different reasons. Satellite imagery may be delayed or obscured, a social post may be removed, and audio, video, or text may be unavailable at collection time. Full-input evaluation can therefore overstate practical reliability and conceal dependence on one source. ModDrop and ShaSpec treat unavailable modalities as a central multimodal learning problem rather than a minor preprocessing issue.
The full-input and unavailable-input conditions use the same bundle identity and target. For a removed modality m*,
All other fields in n remain fixed. The change in a metric Q is reported as
Retaining the same bundle identity, target, and remaining inputs makes the performance change attributable to the removed source rather than to a different test population. Results are shown separately for every removed view. SIAV includes No-, No-, No-𝒜, and No-. SIAVT adds No-. A single average could hide a large failure caused by one critical source, so the benchmark reports every removed input independently.
The benchmark also includes a more severe single-modality-remaining evaluation. Only-m retains input m and suppresses every other input declared by the current setting. SIAV therefore includes Only-, Only-, Only-𝒜, and Only-, while SIAVT additionally includes Only-. These conditions use the same bundle identities and targets as the corresponding full-input evaluation. They measure the sufficiency of one remaining evidence source rather than the effect of removing one source.
An important notice is that the single-modality-remaining setting (Only-, Only-, Only-𝒜, and Only-, Only-) represents an out-of-distribution (OOD) extrapolation scenario under extreme input loss, evaluated without model retraining. These tests measure the residual sufficiency of a single remaining input stream in a model trained for multimodal input. Performance in these extreme conditions must not be misinterpreted as the performance of a model explicitly trained on a single unimodal stream.
5. Benchmark Methods
5.1. SpixViT
Conventional Vision Transformer (ViT) [30] divides an image into a fixed grid of square patches. This makes tokenization simple, but a patch can cut across a roof, road, flood boundary, smoke plume, or foreground object. Such boundaries are common in both overhead disaster imagery and ground-level photographs. We therefore use a pretrained SpixViT visual encoder, which replaces fixed patches with tokens formed from perceptually coherent image regions. SpixViT is an evaluated encoder in this benchmark rather than a new backbone proposed by this work.
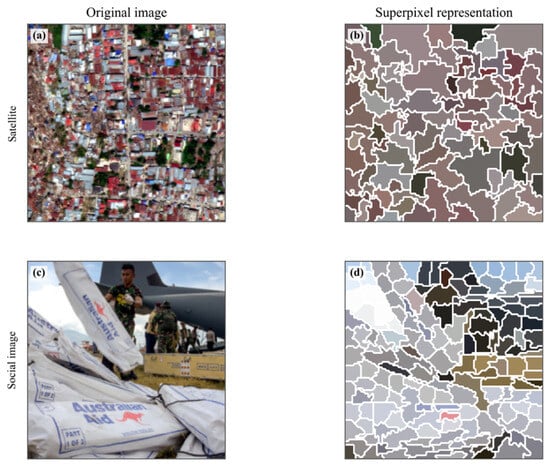
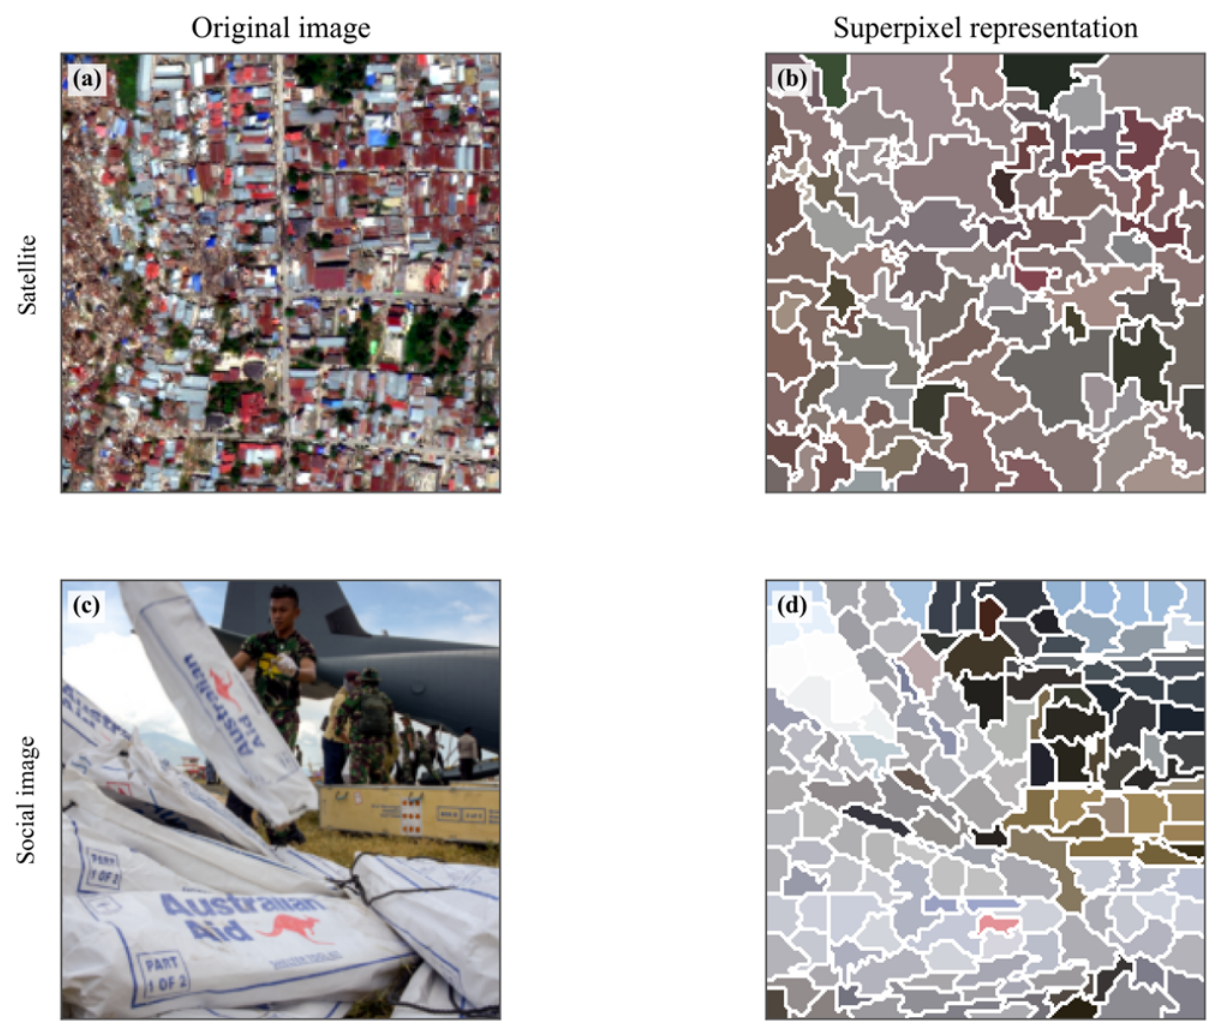
Each image crop is first divided by SLIC [31] into locally coherent regions (Figure 5). The resulting partition is supplied to the encoder as a hard label map and is not learned jointly with the downstream task. The backbone extracts a local feature at each spatial coordinate and combines it with a learnable Fourier position representation. For normalized coordinate .
where ζ denotes the position feature, Ω∈ℝ2×96 is the spatial frequency matrix, F,loc is the local convolutional feature, and Wsp and bsp are projection parameters. The matrix Ω maps 2D normalized spatial coordinates (x, y) into a 96-dimensional Fourier space, yielding a 192-dimensional positional feature ζχ after sine and cosine concatenation. This construction follows learnable Fourier spatial encoding [32] and retains location information without imposing a square token boundary.
Figure 5.
SpixViT’s superpixel preprocessing examples. (a) original satellite image; (b) corresponding superpixel representation of the satellite image; (c) original social image; (d) corresponding superpixel representation of the social image.
Let κ be the set of feature locations assigned to superpixel κ. Average pooling represents the overall texture and appearance of a region, while maximum pooling retains strong localized responses such as a fire boundary, debris edge, or concentrated damage cue. These two summaries are complementary for regions whose size and shape vary across an image. The implementation applies maximum and average pooling within each region and concatenates them in that order:
The pooled token hκ has a fixed dimension even though the corresponding region can have an irregular shape and area. This makes the regional sequence compatible with a Transformer while preserving the SLIC partition as the token boundary. A class token is prepended, empty regions are excluded by Msp, and the Transformer models the relations among distant regions to produce a crop representation:
where Nsp denotes the number of valid regions, is the initial class token, Esp(X) is the normalized crop representation, and positive constant ϵ prevents division by zero. The pretrained visual backbone remains frozen during the benchmark experiments. Static-image crop representations are aggregated before fusion. Satellite pre-event and post-event vectors are retained separately and concatenated before the common projection. Video frames use the same visual encoder before temporal aggregation.
5.2. Four-Teacher Multi-Condition Transformer
4T-MCT is designed to use strong unimodal predictions while learning to operate with different available inputs. Four predictive teachers are trained independently for satellite, social image, audio, and video. Their parameters are then frozen and excluded from the student optimizer. This separation prevents the teacher targets from changing while the student learns full-input and single-input-unavailable conditions.
Let be the validation reliability of teacher m for task t, and let be its logits. The availability-aware weight and routed teacher output are represented as:
where ρmin denotes a small positive lower bound that ensures every active teacher retains a positive weight. At least one SIAV teacher is active in every evaluated condition, which keeps the denominator defined. In SIAVT, observation text is an additional student input, while the predictive teachers remain the four SIAV teachers.
The student is an availability-masked Transformer. During training, it receives the full-input condition and every declared single-input-unavailable condition. Let − be that condition set. Let be class-weighted cross-entropy, and let be teacher-to-student Kullback–Leibler divergence with distillation temperature τKD. The objective is
The nonnegative loss coefficients λ balance full-input supervision, multi-condition distillation, and availability stability. Specifically, we hypothesize that full-modality observation provides the primary ground-truth anchor for joint multimodal representation learning, setting the full-input supervision weight to λfull = 1.0. To preserve unimodal discriminative capability and mitigate reliance on any single stream, we assume the critical importance of teacher-guided knowledge distillation and auxiliary supervision, setting λKD = 0.50 and λ_aux = 0.25 following practices [33]. Furthermore, assuming the equal importance of regularizing diverse unavailable-input scenarios, we hypothesize that penalizing modality dominance maintains balanced gradient contributions under partial observations; hence, the missing-condition supervision weight λmissKD, missing-condition consistency weight λcon, and dominance margin penalty weight λdom are all set to 0.25.
For classification, a validation-selected coefficient γt,ξ between zero and one can combine the student and routed teacher logits:
Equation (15) is used when at least one teacher-supported input remains. A zero value gives student-only inference. For Only-, γ(t,ξ) is fixed to zero and the routed-teacher term is not computed. Retrieval uses the type-trained student representation and does not use the logit combination in (15) or a retrieval-specific head.
5.3. Encoders and Common Interface
The benchmark separates feature extraction from multimodal fusion so that an encoder comparison does not silently change the fusion model. Each modality has an encoder Em and a projection Pm. The projected representation is:
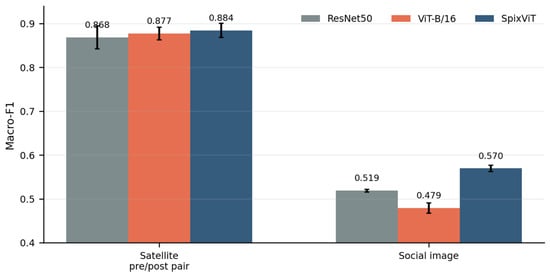
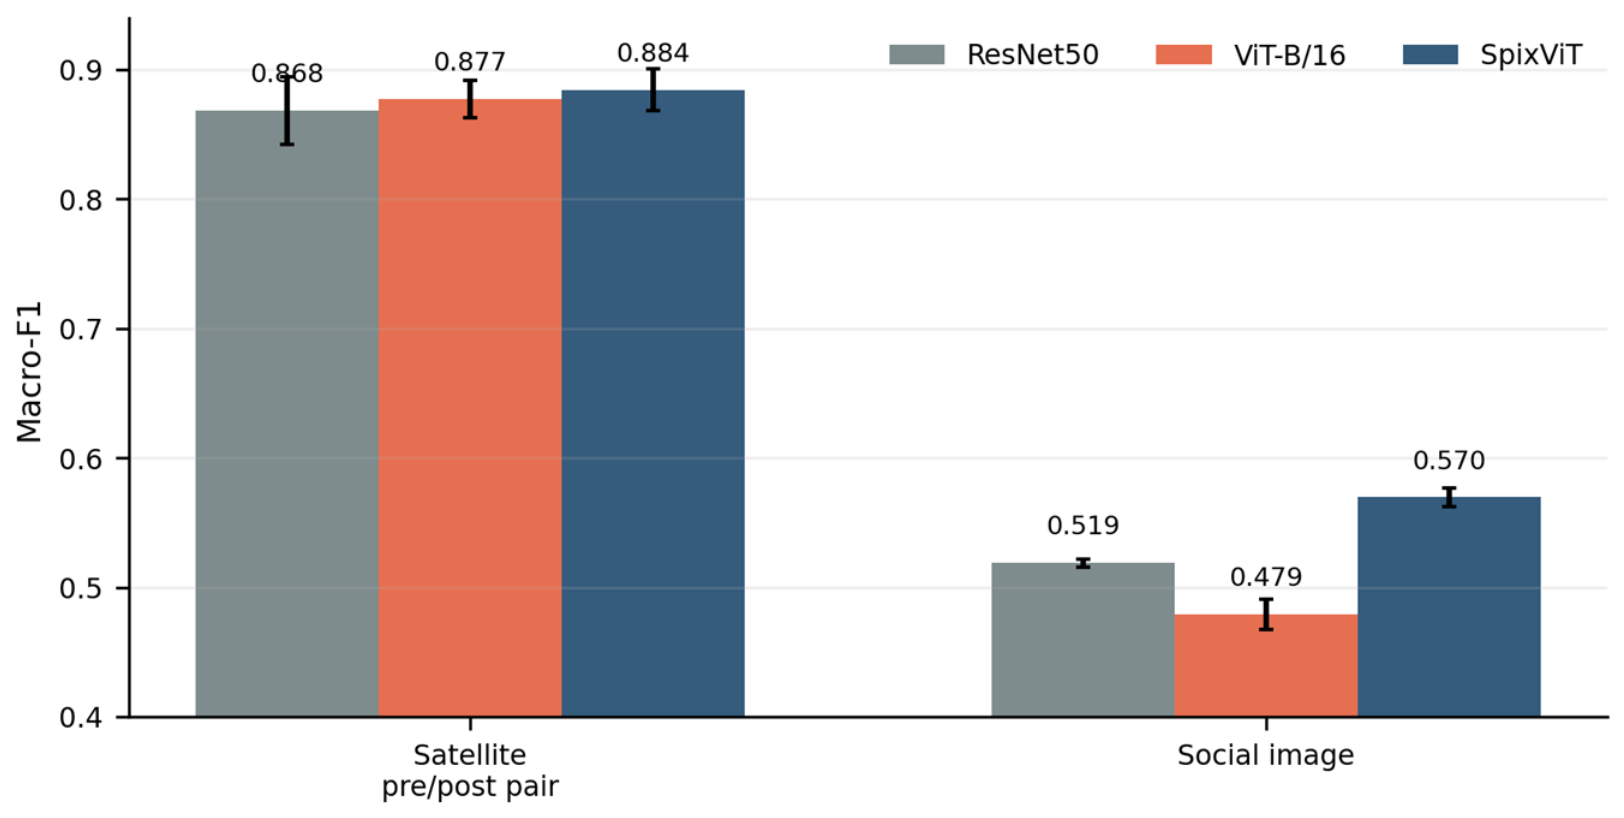
where n indexes a bundle, m indexes a member of +, and d is the common feature dimension. Satellite and social-image experiments compare ResNet50 [34], ViT-B/16 [30], and SpixViT. Satellite input uses the pre-event and post-event pair. Audio uses a fixed Audio Spectrogram Transformer encoder [35]. Observation text uses a fixed language encoder. The nonvisual feature sources are held fixed in the visual-encoder comparison, so Figure 6 displays only the visual encoders.
Figure 6.
Unimodal visual encoder comparison.
For static modality projection, each input modality feature is projected via a dedicated MLP, represented as:
where denotes the unprojected feature vector of modality m for bundle n, h = 192 is the student hidden dimension, and the dropout probability δ is set to 0.1. Task classification heads map the fused student representation zn to target logits via a linear layer Linearh→C.
5.4. Multimodal Fusion Controls
Fusion controls are needed because a more complex model should be compared with simpler ways of combining the same encoded evidence. Feature concatenation tests whether a shallow joint representation is useful. Cross-attention tests whether the model benefits from interactions among modality tokens. The teacher-guided model tests whether frozen unimodal predictors and multi-condition training provide an additional benefit. These methods use the same input identities and encoder features within each reported result block.
Table 5 defines the three fusion methods evaluated in this paper. F-Concat provides a feature-level baseline, F-XAttn models interactions among modality tokens, and 4T-MCT adds frozen unimodal teachers and multi-condition training.
Table 5.
Multimodal fusion methods used in the benchmark.
In Equation (18), denotes the input set declared by the current experiment, and indicates whether modality m is available for bundle n under condition ξ. F-Concat concatenates the masked projected features and availability indicators:
where Hcat denotes a multilayer perceptron, N is the number of declared modalities, and is the fixed modality order. The appended mask distinguishes an unavailable input from a valid zero-valued feature.
F-XAttn treats each projected view as a token. A Transformer encoder models cross-view interactions, and an attention mask excludes unavailable tokens. The output is pooled across active tokens before the task head. F-Concat and F-XAttn use the same input identities and encoders within each reported result block.
5.5. Task Heads and Retrieval Representation
Disaster type uses a nine-class head. Severity uses three ordered labels. Bundles without an eligible severity target are removed through . The classification loss is normalized over eligible samples with inverse-square-root class weights.
Retrieval reuses the representation learned for disaster-type classification. Let hθ(x;a) denote the fused representation produced by a compared method for input x under availability mask a. The satellite query uses mask a(S), while candidate route r uses its SIAV or SIAVT candidate mask a(r). The representations are L2-normalized:
where xu denotes the query input, xj is the candidate input, r is A1, A2, or A3, and ε is the same positive stability constant used in Equation (11). No separate retrieval projection or retrieval-specific optimization is applied. For each route, candidates are ranked in descending order of cosine similarity .
6. Experiments
6.1. Data and Evaluated Conditions
All experiments use the same 12,159 fixed bundles, with 8162 training, 2156 validation, and 1841 test bundles. Severity experiments use the 8585 bundles with an eligible three-level severity target. Hyperparameters and checkpoints are selected with training and validation data. The classification experiments use complete-input SIAV and SIAVT conditions. Four paired SIAV conditions remove satellite, social image, audio, or video separately. SIAVT adds a fifth condition that removes observation text. Each classification condition retains the bundle identity and target. The single-modality-remaining evaluation uses the same frozen checkpoints. SIAV includes Only-, Only-, Only-𝒜, and Only-, and SIAVT additionally includes Only-. These combinations are not part of the explicitly supervised full and single-input-unavailable condition set. They are evaluated as severe input-availability conditions without retraining. The visual-encoder comparison varies only the visual encoder and reports satellite pre/post input and social-image input. The main fusion comparison reports F-Concat, F-XAttn, and 4T-MCT under SIAV and SIAVT. Retrieval uses the type-trained checkpoints from these three methods. Satellite queries remain fixed, and each route uses the same candidate identities across methods. The DisasterScope project page is publicly available at https://github.com/Jieli22/DisasterScope (accessed on 30 August 2026).
6.2. Experimental Settings
For SpixViT feature extraction, images are resized and evaluated with 224 × 224 center and corner crops. SLIC is computed at half resolution with a target of 196 regions and compactness 10.0. The visual Transformer has 12 layers and produces a 768-dimensional crop representation. Crop vectors are averaged and normalized, and the pretrained visual backbone remains frozen.
The visual-encoder and selected-fusion experiments use three random seeds for fair comparison. The SpixViT configuration uses satellite pre/post input, AST audio features, a 192-dimensional student representation, batch size 384, AdamW with weight decay 2 × 10⁻⁴, at most 30 epochs, patience 8, and gradient clipping. Dropout is 0.10 in the projection and Transformer blocks and is not applied to the final task heads. Early stopping restores the checkpoint with the highest validation score and terminates training after eight consecutive epochs without an improvement greater than 10−6. The selected learning rates are 1.5 × 10⁻⁴ for disaster type and 2 × 10⁻⁴ for severity. For the reported SpixViT pre/post configuration, the trainable parameter counts are 3.50 to 3.88 M for F-Concat, 3.87 to 4.63 M for F-XAttn, and 3.87 to 4.26 M for 4T-MCT, excluding frozen feature encoders and teachers. The parameter size varies depending on the task and the number of modalities. Four unimodal teachers are trained before 4T-MCT and remain frozen during student optimization.
For 4T-MCT, ρmin is set to 10−6. Validation selection fixes the reliability weights, loss coefficients, condition weights, input-removal schedule, and optional inference coefficient before test evaluation. Teacher parameters are excluded from the student optimizer.
6.3. Experimental Metrics
Macro-F1 is computed over the fixed task label set. For severity, MAE and QWK complement Macro-F1. Retrieval reports nDCG@10, mAP, Hit@1, Hit@5, and Hit@10 under binary same-event relevance. Hit@K records whether at least one same-event candidate appears within the first K positions. Queries without a same-event candidate are excluded from the metric denominator; every query in the reported test evaluation has at least one such candidate. Values written as mean ± standard deviation use the sample standard deviation across the three random seeds. Mean differences are not described as statistically significant unless a paired uncertainty interval is available.
6.4. Unimodal Visual Encoders
Table 6 isolates the visual encoder for disaster-type classification. The audio source remains the same AST representation across the encoder profiles and is not part of this figure. SpixViT gives the highest mean Macro-F1 for both evaluated visual inputs. For satellite pre/post pairs, it reaches 0.884 ± 0.016, compared with 0.877 ± 0.014 for ViT-B/16 and 0.868 ± 0.026 for ResNet50. The difference between the highest and lowest mean is 0.016.
Table 6.
Multimodal fusion methods used in the benchmark. Unimodal visual-encoder comparison. Values are Macro-F1, mean ± standard deviation over random seeds.
The social-image comparison has a larger separation. SpixViT reaches 0.570 ± 0.007, which is 0.051 above ResNet50 and 0.091 above ViT-B/16. The following fusion study uses the SpixViT configuration selected on validation data together with the fixed AST audio encoder. Table 6 provides a supporting test comparison, not a test-based selection rule. The results do not establish an encoder ranking for text, audio, or every task.
6.5. SIAV and SIAVT Fusion
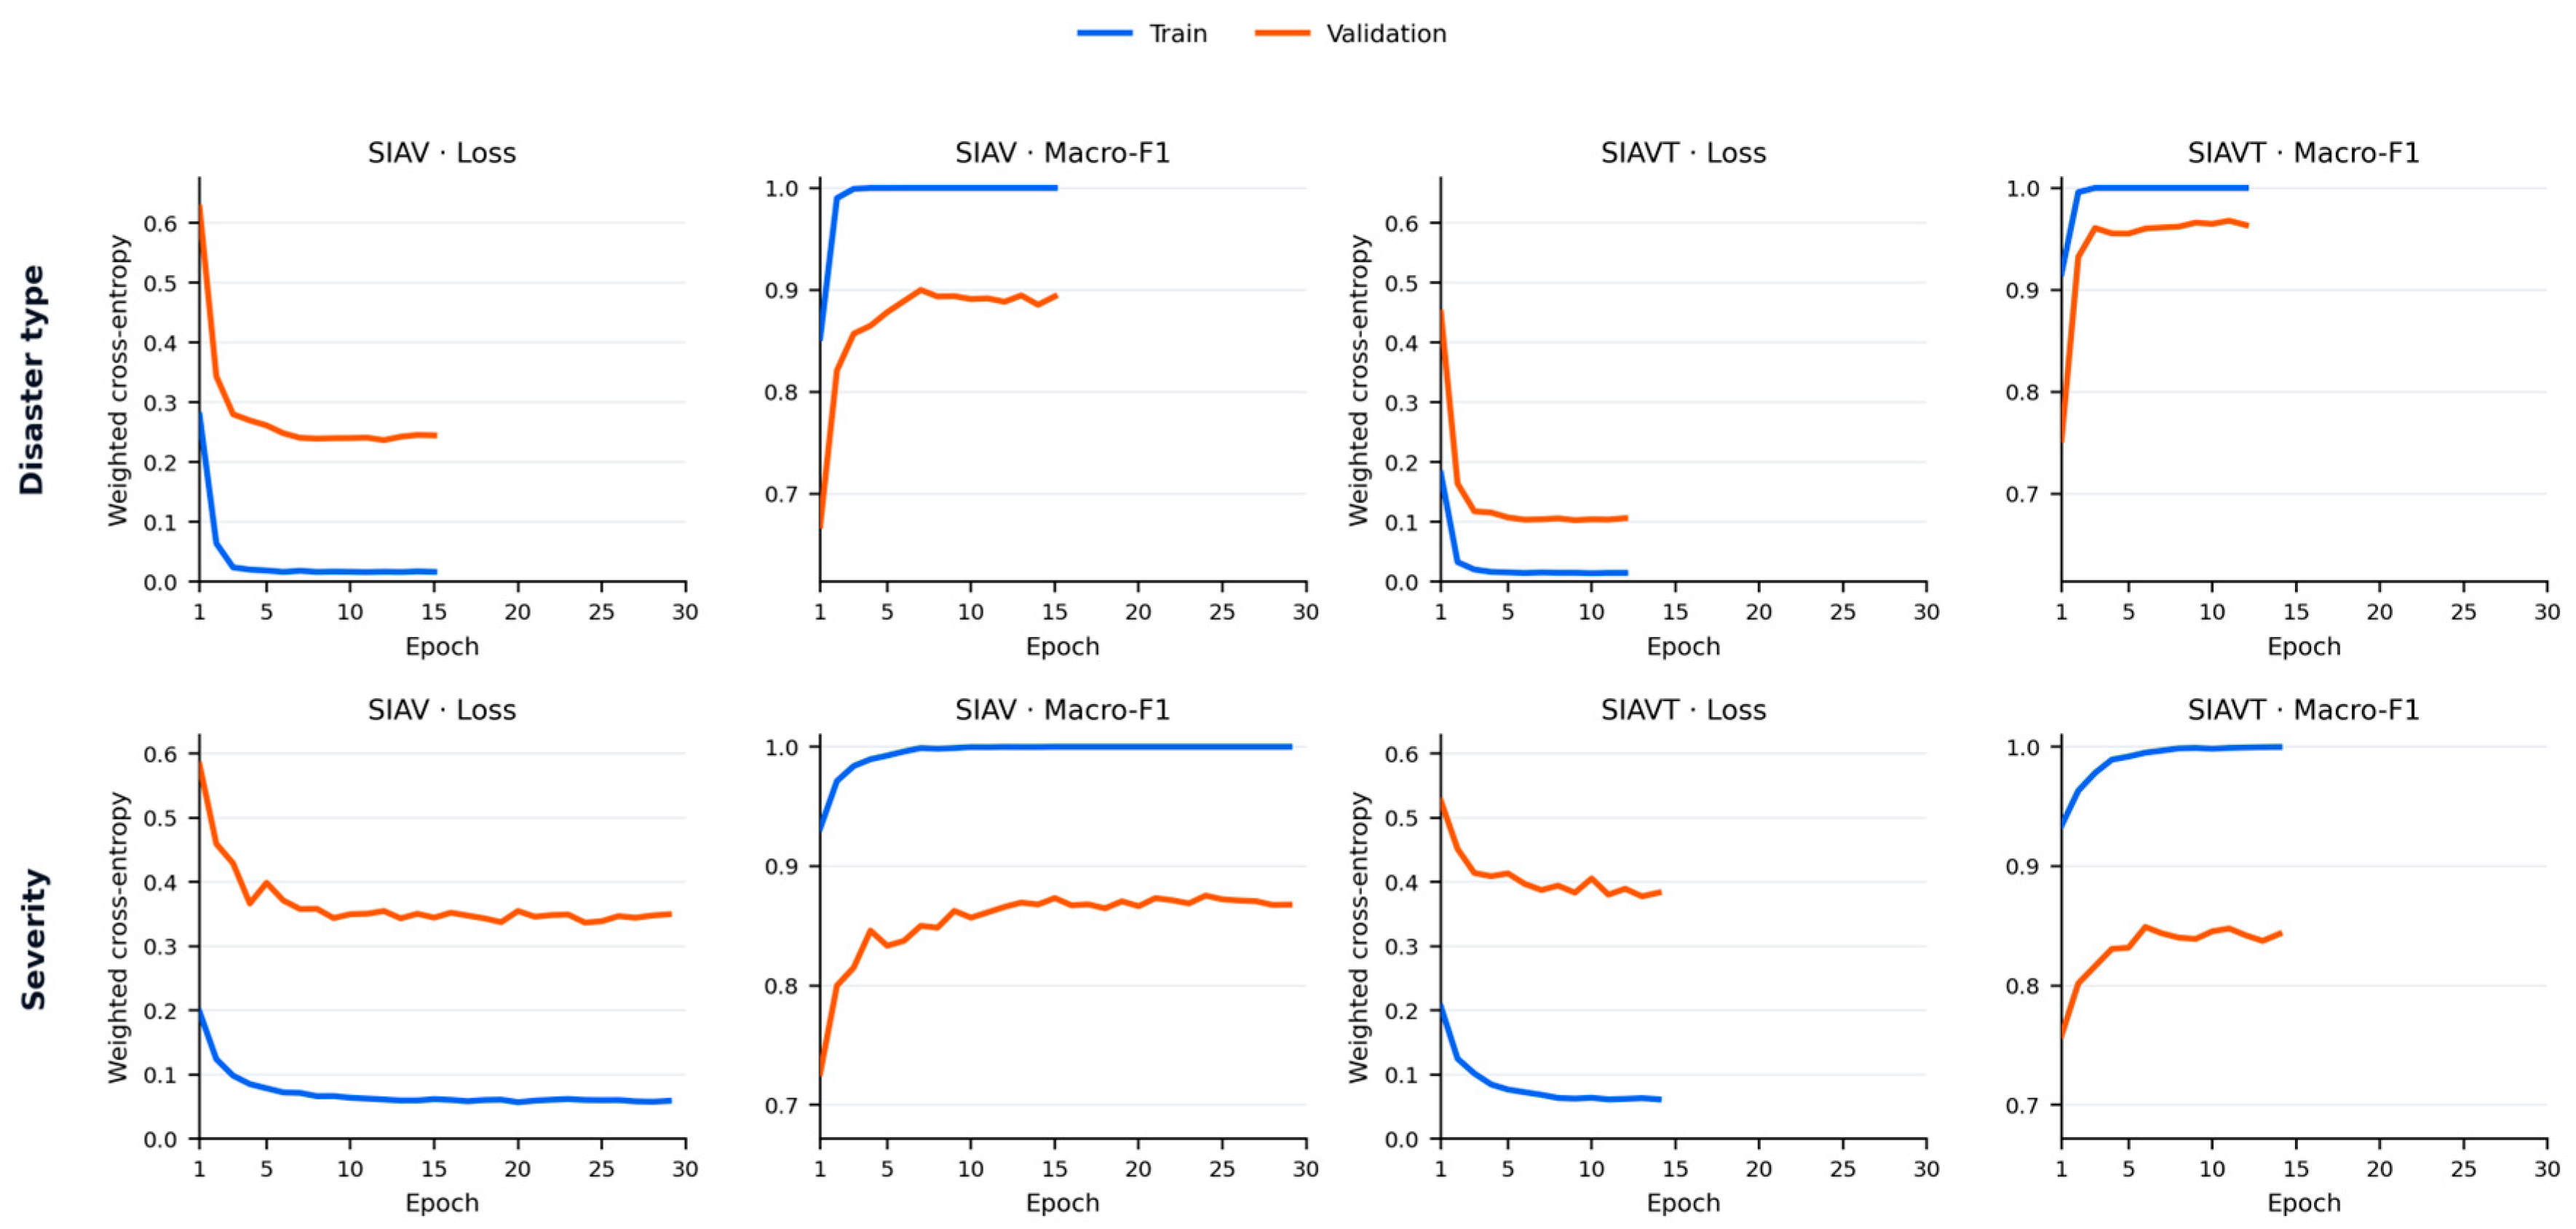
Table 7 compares F-Concat, F-XAttn, and 4T-MCT with SpixViT pre/post satellite features. It reports Macro-F1 for both tasks and adds MAE and QWK for severity. Under SIAV, 4T-MCT gives the highest type Macro-F1, 0.923 ± 0.007, and the highest severity Macro-F1, 0.895 ± 0.005. Under SIAVT, 4T-MCT gives the highest type result, 0.980 ± 0.003, and the highest severity result, 0.897 ± 0.002. Figure 7 illustrates the training cross-entropy and validation Macro-F1 curves of 4T-MCT over 30 epochs across tasks and input regimes. Both tasks achieve smooth convergence and reach a validation plateau within 10–15 epochs.
Table 7.
Full-input fusion results with SpixViT pre/post satellite features. Values are mean ± standard deviation over three random seeds. Lower MAE and higher values for the other metrics are better.
Figure 7.
Training and validation loss and Macro-F1 curves over 30 epochs for the 4T-MCT model across tasks (Disaster Type, Severity) and input regimes (SIAV, SIAVT).
Relative to F-XAttn, 4T-MCT has a higher mean in all four classification settings: SIAV type by 0.011, SIAVT type by 0.022, SIAV severity by 0.008, and SIAVT severity by 0.023. This pattern is consistent with a benefit from teacher guidance and modality-removal training. The comparison is based on three random seeds, so the mean differences should not be interpreted as statistical significance.
Observation text has a strong effect on type classification. SIAVT is higher than SIAV for all three methods. The severity effect is smaller and mixed. It is positive for F-Concat and 4T-MCT and negative for F-XAttn. Because paired intervals are not available for these mean differences, we do not assign statistical significance.
The complementary severity metrics are consistent with the Macro-F1 comparison. Under SIAV, 4T-MCT has the lowest MAE, 0.107 ± 0.008, and the highest QWK, 0.911 ± 0.008. Under SIAVT, it again has the lowest MAE, 0.104 ± 0.002, and the highest QWK, 0.914 ± 0.002. Thus, its severity advantage is present in class-balanced performance, distance between predicted and reference levels, and weighted agreement.
6.6. 4T-MCT Under Unavailable Inputs
Table 8 compares all three fusion methods under the single-input-unavailable conditions and reports the paired change defined in Equation (9). Under SIAV, 4T-MCT has the highest Macro-F1 for both tasks in the full condition and after each individual input is removed. Satellite removal causes the largest type decrease for F-Concat and F-XAttn, and it also gives the largest 4T-MCT decrease. For SIAV type classification, removing audio produces small positive changes for the two controls but a small decrease for 4T-MCT.
Table 8.
Fusion-method Macro-F1 under single-input-unavailable conditions. Values are means over three random seeds. Parentheses report the change defined in Equation (9), computed from the unrounded means.
Under SIAVT type classification, 4T-MCT still has the highest mean in the full condition and after removing , , 𝒜, or . Its result decreases sharply when text is removed, from 0.980 to 0.898. F-XAttn gives the highest No- result, 0.907. The corresponding 4T-MCT decrease after text removal is 0.059.
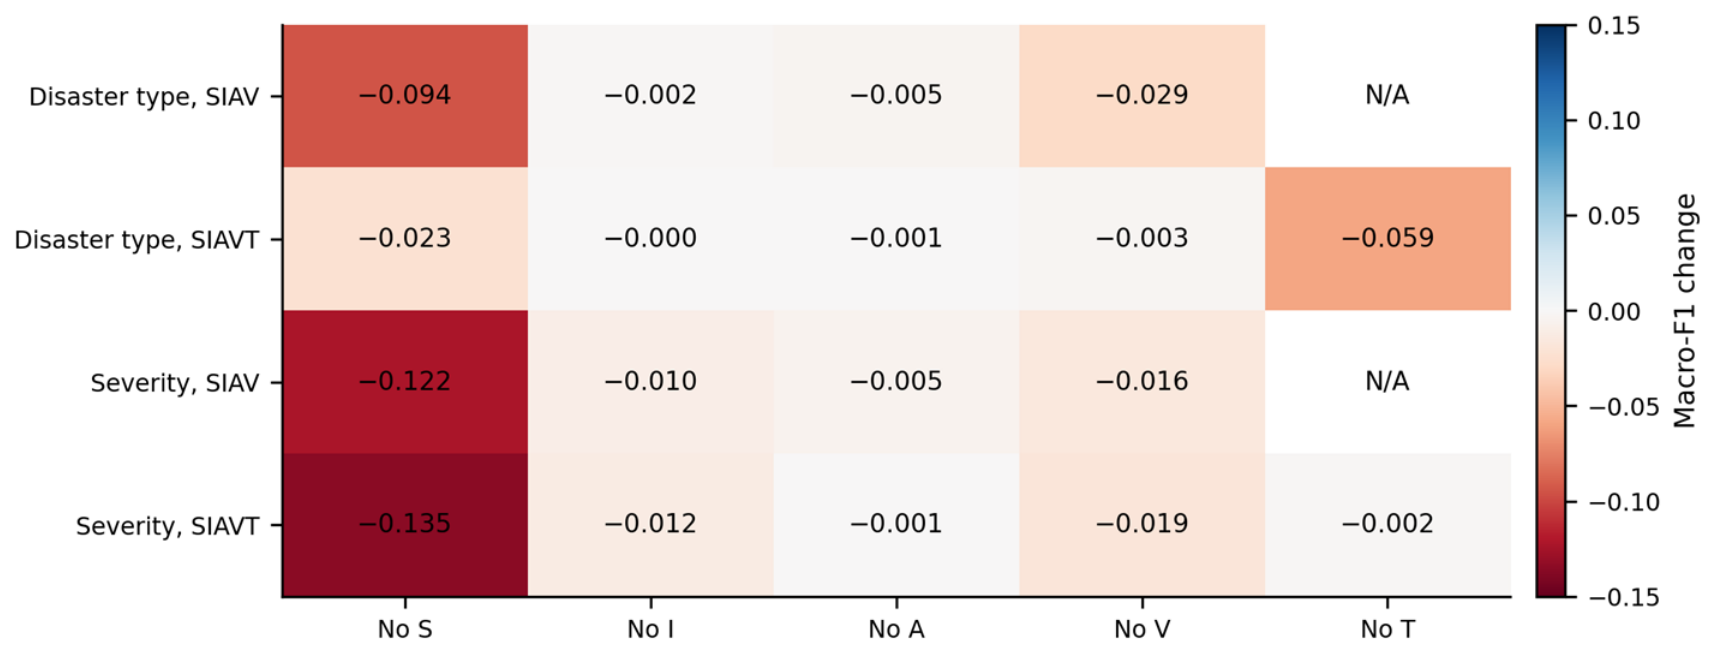
Severity remains more dependent on satellite evidence. Removing S produces the largest decrease for every method under both SIAV and SIAVT. 4T-MCT has the highest severity mean in every reported full and single-input-unavailable condition. Text removal changes SIAVT severity by 0.007 for F-Concat, 0.001 for F-XAttn, and 0.002 for 4T-MCT. Figure 8 summarizes the 4T-MCT changes across tasks and input settings. Removing S causes the largest decrease in three of the four rows. The exception is SIAVT disaster-type classification, for which removing T causes a decrease of 0.059, while removing I, A, or V changes Macro-F1 by less than 0.003.
Figure 8.
Macro-F1 change of 4T-MCT relative to the full-input condition when one input is unavailable.
6.7. Single-Modality-Remaining Evaluation
Table 9 evaluates a more severe availability setting in which only one declared input remains. These conditions are not among the explicitly supervised full and single-input-unavailable conditions. They therefore test how the frozen models extrapolate to a much smaller input set. For 4T-MCT, the teacher-assistance coefficient is selected on validation data for each retained , , 𝒜, or input, as described in Section 6.2.
Table 9.
Fusion-method Macro-F1 when only one input remains. Values are means over three random seeds. Parentheses report the change from the corresponding full-input result, computed from the unrounded means.
Among the compared methods, the teacher-assisted 4T-MCT system gives the highest mean Macro-F1 in all 16 evaluated cells that retain , , 𝒜, or . Within this system, satellite is the strongest remaining input for both tasks. Only- reaches 0.860 and 0.883 for SIAV and SIAVT type classification, and 0.847 and 0.835 for severity. Video is generally the next strongest single input. Audio is more useful than social image for 4T-MCT, particularly for severity.
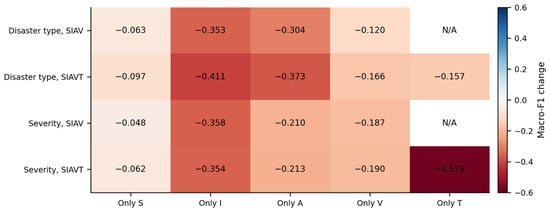
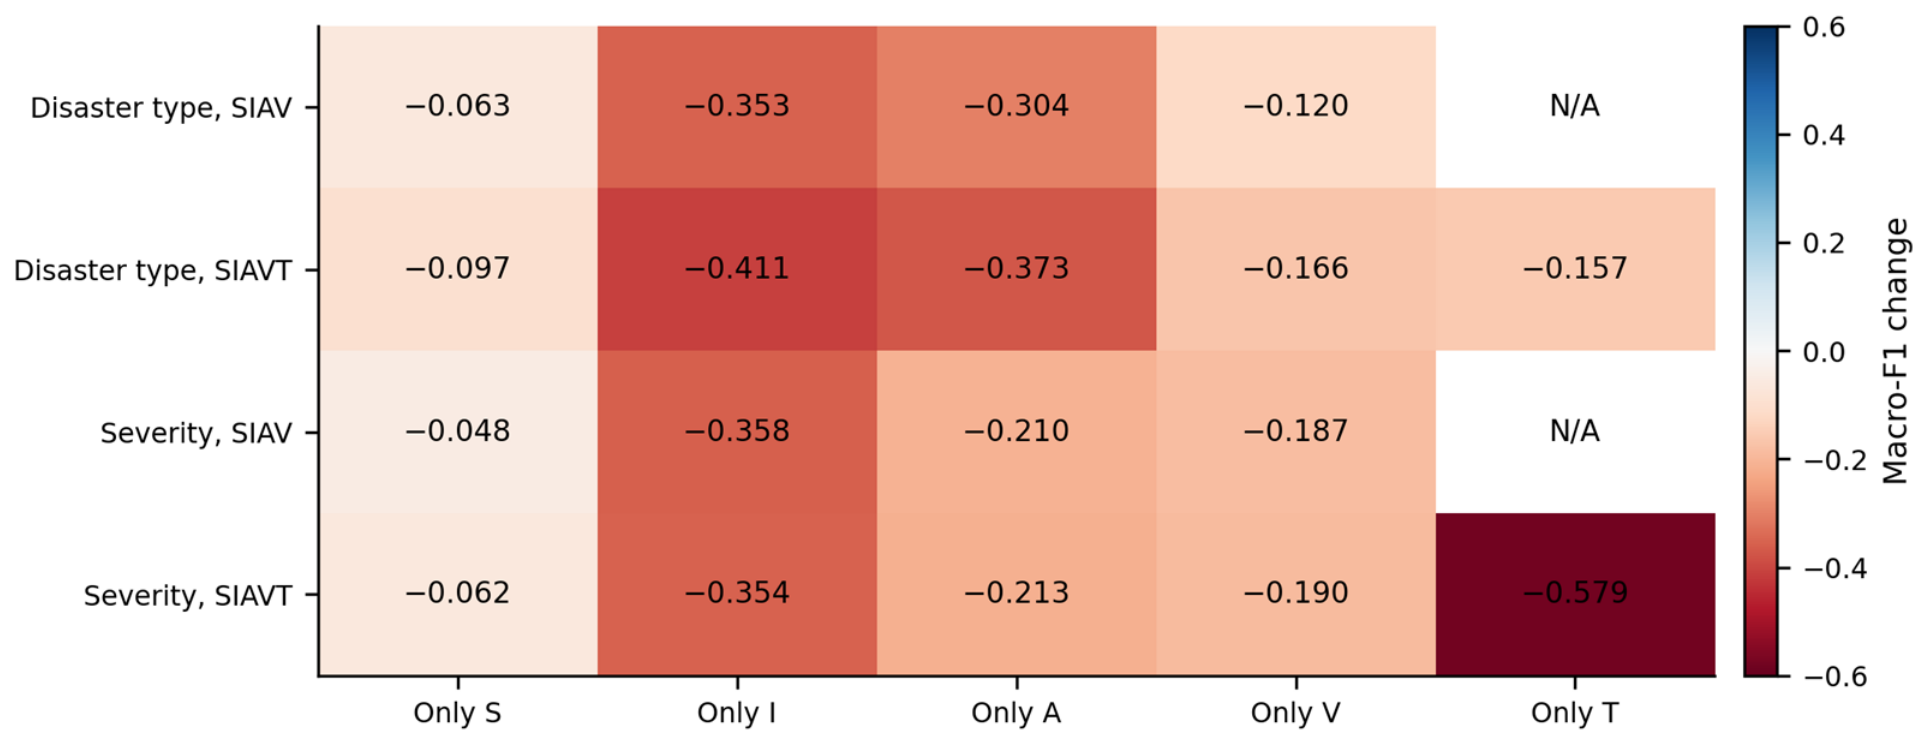
Only- is the exception. The four teachers cover , , 𝒜, and , so Only- uses the 4T-MCT student branch without teacher-assisted inference. F-Concat gives the highest Only- result for both tasks, reaching 0.936 for type classification and 0.421 for severity. In this benchmark, the high Only- type result together with its lower severity result suggests that observation text carries strong hazard-type information but is less sufficient for severity assessment. Figure 9 shows the corresponding 4T-MCT changes from full-input performance. Only- produces the smallest decrease in all four rows. Only- produces the largest decrease for both disaster-type settings and for SIAV severity, whereas Only- produces the largest decrease for SIAVT severity.
Figure 9.
Macro-F1 change of 4T-MCT relative to the full-input condition when only one input remains.
6.8. Evidence Retrieval
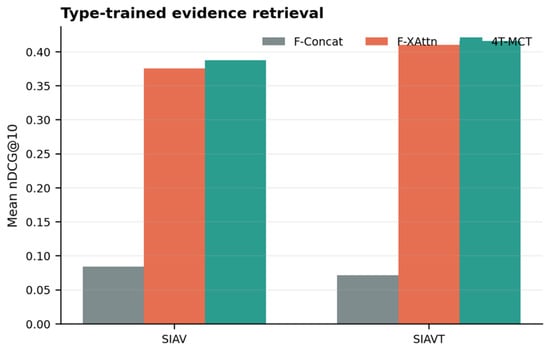
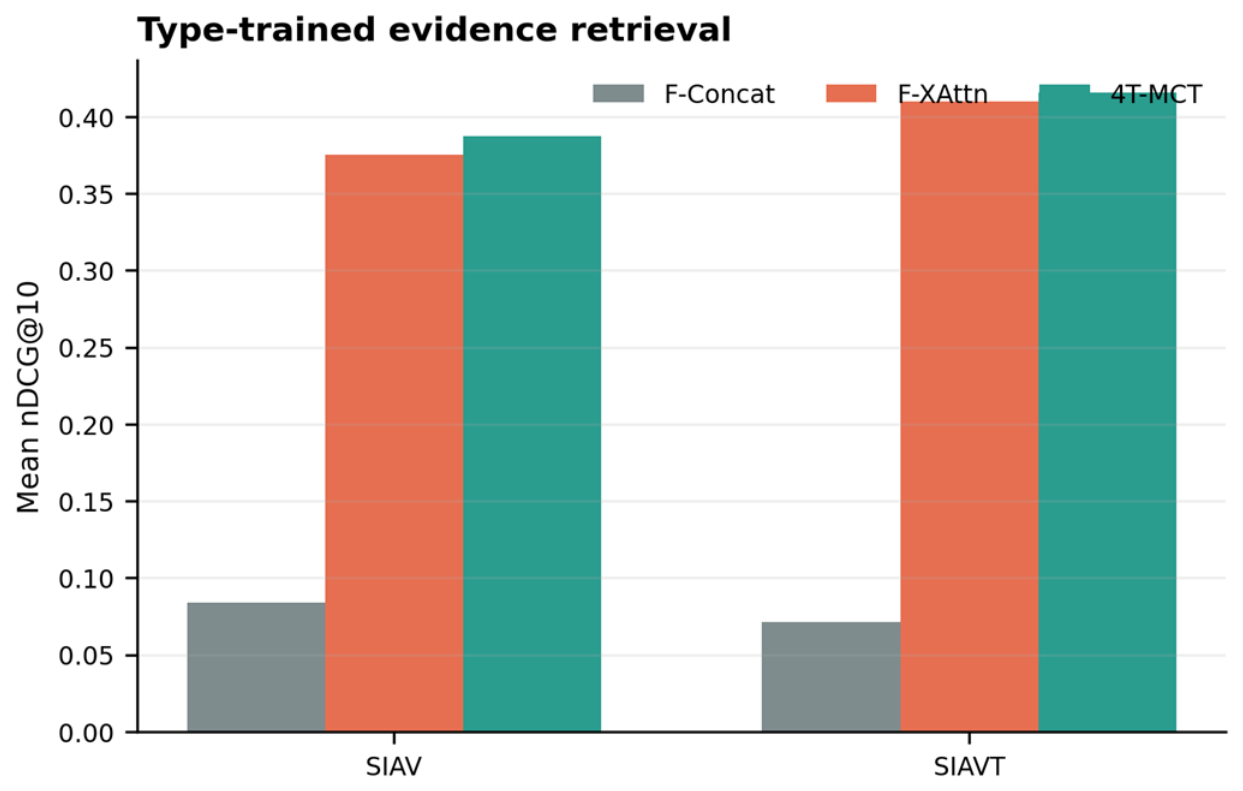
The retrieval experiment evaluates whether representations trained for disaster-type classification can also organize evidence from the same event. Every route uses satellite evidence as the query. Route A1 retrieves a social image under SIAV and a social image with observation text + under SIAVT. Route A2 retrieves an audio–video segment 𝒜 + or its text-augmented form 𝒜 + + . Route A3 retrieves a ground-evidence bundle + 𝒜 + or + 𝒜 + + . All three routes use binary same-event relevance, but they differ in candidate composition and candidate identity. Table 10 reports each route separately, with every value averaged over two seeds. Figure 10 illustrates the comparisons of the averaged results over three routes.
Table 10.
Type-trained same-event retrieval results for three candidate routes. Values are means over two seeds. Higher values are better.
Figure 10.
Type-trained retrieval nDCG@10 averaged over three candidate routes.
The results show different behavior at early and broader ranking cutoffs. Under SIAV, 4T-MCT gives the highest nDCG@10 for A1 and A3, while F-XAttn is slightly higher for A2. 4T-MCT gives the highest Hit@10 on all three SIAV routes and the highest mAP on A2 and A3. F-XAttn gives the highest Hit@1 on all three routes, indicating stronger first-result precision in this setting. The difference is especially clear for A2: F-XAttn reaches the highest nDCG@10 and Hit@1, whereas 4T-MCT reaches the highest mAP, Hit@5, and Hit@10.
Under SIAVT, 4T-MCT gives the highest nDCG@10 and mAP on A1, A2, and A3. It also gives the highest Hit@10 on A2 and A3 and ties F-XAttn on A1. F-XAttn remains higher at Hit@5 on A1 and A2 and at Hit@1 on A2 and A3. These results indicate that 4T-MCT more consistently preserves same-event candidates across a wider part of the ranked list, while F-XAttn can be stronger at the first few positions. For F-XAttn and 4T-MCT, A2 and A3 generally obtain higher nDCG@10 than A1, suggesting that audio–video and combined ground evidence provide more discriminative event representations than a social image alone.
7. Limitations
7.1. Spatial–Temporal Granularity and Causal Correspondence
DisasterScope links multi-source evidence through canonical event identities and recorded metadata. A fixed bundle represents an event-context unit. Satellite imagery, ground-level social posts, and audio–video segments within a bundle refer to the same overarching event, but they do not necessarily depict the exact same street corner, building structure, or minute in time. Binary same-event retrieval evaluates event-level alignment rather than fine-grained spatial co-location.
7.2. Event Overlap and Event-Level Context Shortcut Risks
The dataset construction is not partitioned strictly by event identity; rather, it guarantees that training, validation, and test splits do not share identical asset instances or multimodal bundles. Similar instance-level partitioning strategies under shared event domains have been widely adopted in established disaster multimodal benchmarks [1,2,5,7]. Because canonical events may span multiple splits, models could potentially exploit event-specific contextual shortcuts (e.g., regional terrain, specific broadcasting styles, audio background noise) to assist classification. While asset units are strictly isolated across splits to prevent direct data leakage, future benchmark iterations will explore zero-shot cross-event evaluations.
7.3. Category-Level and Event-Level Distributional Imbalance
DisasterScope exhibits natural sample imbalances across both disaster categories (e.g., higher bundle counts for tropical cyclones and earthquakes relative to landslides and tornadoes) and individual canonical events. This distribution inherently reflects real-world disaster occurrence frequencies, reporting density on social media platforms, and satellite data availability during emergency response deployments. While reporting Macro-F1 ensures equal class weighting during benchmark evaluation to prevent high-frequency hazard classes from dominating aggregate performance metrics, Macro-F1 alone does not eliminate event-level domain-shift risks. Models trained on imbalanced category and event distributions may experience performance variance when deployed in under-represented hazard categories, rare disaster sub-types, or unseen geographic regions with distinct environmental topologies. Future work will investigate class-rebalancing loss formulations and domain-adaptation techniques for long-tailed disaster response.
7.4. Teacher-Assisted Annotation Workflow and Verification Scope
Although employing two complementary models (Qwen3.6-35B-A3B and Qwen3-VL-8B-Instruct) for cross-verification significantly mitigated human annotation workload while ensuring structured schema compliance, certain annotation constraints remain. Because both teacher models belong to the same Qwen model family, potential systematic priors shared across model architectures cannot be entirely eliminated prior to human verification. To ensure label integrity, 100% of validation and test set candidate annotations underwent rigorous manual human review. For the training partition, candidates passing the confidence threshold (τconf ≥ 0.7) were subjected to a 5% stratified sample audit, which verified high annotation precision. Nevertheless, unaudited training instances may retain minor residual labeling noise.
8. Conclusions
DisasterScope provides an event-centric dataset and benchmark that connects regional satellite observations with ground-level social images, synchronized audio and video, observation text, report passages, and provenance metadata. Its 12,159 fixed bundles cover 24 events and nine hazard classes, while the dynamic-media inventory contains 628 curated segments and 9.02 h of material. The benchmark defines disaster-type classification, three-level severity assessment, and satellite-grounded same-event retrieval through social-image, audio–video, and combined ground-evidence candidate routes.
The conducted experiments support two practical conclusions. First, multimodal disaster assessment benefits from a clear sample unit and explicit evidence roles. Second, full-input performance alone is insufficient for evaluating a model that may face unavailable sources. By retaining source provenance, annotation routes, task definitions, and paired availability conditions, DisasterScope offers a traceable basis for studying these questions across several forms of disaster evidence.
Author Contributions
Conceptualization, K.P.S., J.C. and L.-M.A.; Methodology, J.C. and K.P.S.; Software, J.C.; Investigation, J.C. and K.P.S.; Writing—original draft, J.C. and K.P.S.; Writing—review and editing, K.P.S., L.-M.A. and J.S.; Supervision, K.P.S., C.S.L. and J.S.; Project administration, K.P.S. All authors have read and agreed to the published version of the manuscript.
Funding
This research received no external funding.
Data Availability Statement
The data used in this study is publicly available in [1,2,5,16].
Conflicts of Interest
The authors declare no conflicts of interest.
References
- Gupta, R.; Hosfelt, R.; Sajeev, S.; Patel, N.; Goodman, B.; Doshi, J.; Heim, E.; Choset, H.; Gaston, M. xBD: A Dataset for Assessing Building Damage from Satellite Imagery. arXiv 2019, arXiv:1911.09296. [Google Scholar]
- Chen, H.; Song, J.; Dietrich, O.; Broni-Bediako, C.; Xuan, W.; Wang, J.; Shao, X.; Wei, Y.; Xia, J.; Lan, C.; et al. Bright: A Globally Distributed Multimodal Building Damage Assessment Dataset with Very-High-Resolution for All-Weather Disaster Response. Earth Syst. Sci. Data 2025, 17, 6217–6253. [Google Scholar] [CrossRef] [Scilit]
- Hansch, R.; Arndt, J.; Lunga, D.; Gibb, M.; Pedelose, T.; Boedihardjo, A.; Petrie, D.; Bacastow, T.M. SpaceNet 8-The Detection of Flooded Roads and Buildings. In Proceedings of the 2022 IEEE/CVF Conference on Computer Vision and Pattern Recognition Workshops (CVPRW); IEEE: New Orleans, LA, USA, 2022; pp. 1471–1479. [Google Scholar]
- Bonafilia, D.; Tellman, B.; Anderson, T.; Issenberg, E. Sen1Floods11: A Georeferenced Dataset to Train and Test Deep Learning Flood Algorithms for Sentinel-1. In Proceedings of the 2020 IEEE/CVF Conference on Computer Vision and Pattern Recognition Workshops (CVPRW), Seattle, WA, USA, 14–19 June 2020; pp. 835–845. [Google Scholar]
- Alam, F.; Ofli, F.; Imran, M. CrisisMMD: Multimodal Twitter Datasets from Natural Disasters. Proc. Int. AAAI Conf. Web Soc. Media 2018, 12, 465–473. [Google Scholar] [CrossRef] [Scilit]
- Alam, F.; Sajjad, H.; Imran, M.; Ofli, F. CrisisBench: Benchmarking Crisis-Related Social Media Datasets for Humanitarian Information Processing. Proc. Int. AAAI Conf. Web Soc. Media 2021, 15, 923–932. [Google Scholar] [CrossRef] [Scilit]
- Alam, F.; Alam, T.; Hasan, M.A.; Hasnat, A.; Imran, M.; Ofli, F. MEDIC: A Multi-Task Learning Dataset for Disaster Image Classification. Neural Comput. Appl. 2023, 35, 2609–2632. [Google Scholar] [CrossRef] [Scilit]
- Awad, G.; Curtis, K.; Butt, A.; Fiscus, J.; Godil, A.; Lee, Y.; Delgado, A.; Godard, E.; Diduch, L.; Liu, J.; et al. An Overview on the Evaluated Video Retrieval Tasks at TRECVID 2022. arXiv 2023, arXiv:2306.13118. [Google Scholar]
- Kriz, R.; Sanders, K.; Etter, D.; Murray, K.; Carpenter, C.; Ochten, K.V.; Recknor, H.; Guallar-Blasco, J.; Martin, A.; Colaianni, R.; et al. MultiVENT 2.0: A Massive Multilingual Benchmark for Event-Centric Video Retrieval. In Proceedings of the 2025 IEEE/CVF Conference on Computer Vision and Pattern Recognition (CVPR), Nashville, TN, USA, 10–17 June 2025. [Google Scholar]
- Yin, K.; Dong, X.; Liu, C.; Huang, L.; Xiao, Y.; Liu, Z.; Mostafavi, A.; Caverlee, J. DisastIR: A Comprehensive Information Retrieval Benchmark for Disaster Management. In Proceedings of the Findings of the Association for Computational Linguistics: EMNLP 2025; Christodoulopoulos, C., Chakraborty, T., Rose, C., Peng, V., Eds.; Association for Computational Linguistics: Suzhou, China, 2025; pp. 1836–1867. [Google Scholar]
- Rahnemoonfar, M.; Chowdhury, T.; Sarkar, A.; Varshney, D.; Yari, M.; Murphy, R.R. FloodNet: A High Resolution Aerial Imagery Dataset for Post Flood Scene Understanding. IEEE Access 2021, 9, 89644–89654. [Google Scholar] [CrossRef] [Scilit]
- Rahnemoonfar, M.; Chowdhury, T.; Murphy, R. RescueNet: A High Resolution UAV Semantic Segmentation Dataset for Natural Disaster Damage Assessment. Sci. Data 2023, 10, 913. [Google Scholar] [CrossRef] [Scilit] [PubMed]
- Wang, J.; Xuan, W.; Qi, H.; Liu, Z.; Liu, K.; Wu, Y.; Chen, H.; Song, J.; Xia, J.; Zheng, Z.; et al. DisasterM3: A Remote Sensing Vision-Language Dataset for Disaster Damage Assessment and Response. arXiv 2025, arXiv:2505.21089. [Google Scholar]
- Tehrani, S.; Xu, Y.; Haglund, L.; Berg, A.; Felsberg, M. DisasterInsight: A Multimodal Benchmark for Function-Aware and Grounded Disaster Assessment. arXiv 2026, arXiv:2601.18493. [Google Scholar]
- Masante, D.; Barantiev, D.; Destro, E.; Paris, S.; Proietti, C.; Salvitti, V.; Santini, M.; Mastronunzio, M. Multi-Hazard Early Warning System Global Disaster Alert and Coordination System (GDACS): Methods for Anticipation and Rapid Impact Estimation User Manual (Version 2); Publications Office of the European Union: Luxembourg, 2025. [Google Scholar]
- Stollberg, B.; de Groeve, T. The Use of Social Media within the Global Disaster Alert and Coordination System (GDACS). In Proceedings of the 21st International Conference on World Wide Web; Association for Computing Machinery: New York, NY, USA, 2012; pp. 703–706. [Google Scholar]
- Weber, E.; Papadopoulos, D.P.; Lapedriza, A.; Ofli, F.; Imran, M.; Torralba, A. Incidents1M: A Large-Scale Dataset of Images with Natural Disasters, Damage, and Incidents. arXiv 2022, arXiv:2201.04236. [Google Scholar]
- Meunier, R.; Benamara, F.; Moriceau, V.; Qiao, Z.; Ramasamy, S. CrisisTS: Coupling Social Media Textual Data and Meteorological Time Series for Urgency Classification. In Proceedings of the 63rd Annual Meeting of the Association for Computational Linguistics (Volume 1: Long Papers); Che, W., Nabende, J., Shutova, E., Pilehvar, M.T., Eds.; Association for Computational Linguistics: Vienna, Austria, 2025; pp. 16082–16099. [Google Scholar]
- Yao, R.; Murzakhmetov, A.; Pillai, R.; Maussymbayeva, A.; Li, Z.; Liu, Y.; Liu, Y.; Shang, L.; Zhang, Y.; Wei, N.; et al. MASH: A Multiplatform and Multimodal Annotated Dataset for Societal Impact of Hurricane. Proc. Int. AAAI Conf. Web Soc. Media 2026, 20, 2963–2978. [Google Scholar] [CrossRef] [Scilit]
- Al-Mohannadi, A.; Firoz, A.; Yang, Y.; Imran, M.; Ofli, F. DisasterVQA: A Visual Question Answering Benchmark Dataset for Disaster Scenes. Proc. Int. AAAI Conf. Web Soc. Media 2026, 20, 2711–2722. [Google Scholar] [CrossRef] [Scilit]
- Bischke, B.; Helber, P.; Zhao, Z. The Multimedia Satellite Task at MediaEval 2018. In Proceedings of the MediaEval 2018 Workshop, Sophia Antipolis, France, 29–31 October 2018. [Google Scholar]
- Ahmad, K.; Pogorelov, K.; Riegler, M.; Conci, N.; Halvorsen, P. Social Media and Satellites. Multimed. Tools Appl. 2019, 78, 2837–2875. [Google Scholar] [CrossRef] [Scilit]
- Liang, P.P.; Lyu, Y.; Fan, X.; Wu, Z.; Cheng, Y.; Wu, J.; Chen, L.; Wu, P.; Lee, M.A.; Zhu, Y.; et al. MultiBench: Multiscale Benchmarks for Multimodal Representation Learning. Adv. Neural Inf. Process. Syst. 2021, 2021, 1–20. [Google Scholar] [PubMed]
- Neverova, N.; Wolf, C.; Taylor, G.; Nebout, F. ModDrop: Adaptive Multi-Modal Gesture Recognition. IEEE Trans. Pattern Anal. Mach. Intell. 2016, 38, 1692–1706. [Google Scholar] [CrossRef] [Scilit]
- Choi, J.-H.; Lee, J.-S. EmbraceNet: A Robust Deep Learning Architecture for Multimodal Classification. arXiv 2019, arXiv:1904.09078. [Google Scholar] [CrossRef] [Scilit]
- Woo, S.; Lee, S.; Park, Y.; Nugroho, M.A.; Kim, C. Towards Good Practices for Missing Modality Robust Action Recognition. Proc. Int. AAAI Conf. Web Soc. Media 2022, 37, 2776–2784. [Google Scholar] [CrossRef] [Scilit]
- Wang, H.; Chen, Y.; Ma, C.; Avery, J.; Hull, L.; Carneiro, G. Multi-Modal Learning with Missing Modality via Shared-Specific Feature Modelling. arXiv 2023, arXiv:2307.14126. [Google Scholar] [CrossRef] [Scilit]
- Li, S.; Chen, C.; Han, J. SimMLM: A Simple Framework for Multi-Modal Learning with Missing Modality. In Proceedings of the 2025 IEEE/CVF International Conference on Computer Vision (ICCV), Honolulu, HI, USA, 19–25 October 2025; pp. 24068–24077. [Google Scholar]
- Agarwal, M.; Leekha, M.; Sawhney, R.; Shah, R.R. Crisis-DIAS: Towards Multimodal Damage Analysis-Deployment, Challenges and Assessment. Proc. AAAI Conf. Artif. Intell. 2020, 34, 346–353. [Google Scholar] [CrossRef] [Scilit]
- Dosovitskiy, A.; Beyer, L.; Kolesnikov, A.; Weissenborn, D.; Zhai, X.; Unterthiner, T.; Dehghani, M.; Minderer, M.; Heigold, G.; Gelly, S.; et al. An Image Is Worth 16x16 Words: Transformers for Image Recognition at Scale. arXiv 2021, arXiv:2010.11929. [Google Scholar]
- Achanta, R.; Shaji, A.; Smith, K.; Lucchi, A.; Fua, P.; Süsstrunk, S. SLIC Superpixels Compared to State-of-the-Art Superpixel Methods. IEEE Trans. Pattern Anal. Mach. Intell. 2012, 34, 2274–2282. [Google Scholar] [CrossRef] [Scilit] [PubMed]
- Li, Y.; Si, S.; Li, G.; Hsieh, C.-J.; Bengio, S. Learnable Fourier Features for Multi-Dimensional Spatial Positional Encoding. Adv. Neural Inf. Process. Syst. 2021, 34, 15816–15829. [Google Scholar]
- Chen, J.; Xu, H.; Ang, L.M.; Seng, K.P. Distributed Situation Awareness System Using Vision Transformer with Attention Maps for Natural Disasters. In Proceedings of the 2025 60th International Scientific Conference on Information, Communication and Energy Systems and Technologies (ICEST), Ohrid, North Macedonia, 26–28 June 2025; pp. 1–4. [Google Scholar]
- He, K.; Zhang, X.; Ren, S.; Sun, J. Deep Residual Learning for Image Recognition. In Proceedings of the IEEE Conference on Computer Vision and Pattern Recognition (CVPR), Las Vegas, NV, USA, 27–30 June 2016; pp. 770–778. [Google Scholar]
- Gong, Y.; Chung, Y.-A.; Glass, J. AST: Audio Spectrogram Transformer. arXiv 2021, arXiv:2104.01778. [Google Scholar]

Disclaimer/Publisher’s Note: The statements, opinions and data contained in all publications are solely those of the individual author(s) and contributor(s) and not of MDPI and/or the editor(s). MDPI and/or the editor(s) disclaim responsibility for any injury to people or property resulting from any ideas, methods, instructions or products referred to in the content. |
© 2026 by the authors. Licensee MDPI, Basel, Switzerland. This article is an open access article distributed under the terms and conditions of the Creative Commons Attribution (CC BY) license.