


Abstract
This paper proposes a design-technology co-optimization (DTCO) framework applicable to advanced technology nodes, which accelerates the process optimization exploration for such nodes. Developing automatic parameter extraction algorithms tailored for the BSIM-CMG model, along with predictive neural networks, substantially reduces the DTCO workflow cycle time. Data-driven sensitivity analysis of critical electrical parameters to process variations provides an optimization exploration path, guiding the optimization of process parameters. Taking the optimization of a 13-stage ring oscillator circuit at the 14 nm node as a case, the DTCO framework is employed to formulate Hfin process conditions for the respective requirements of minimum power consumption and maximum performance. The framework features good transferability and can be extended to the design-technology co-development of other advanced nodes and emerging device architectures.
1. Introduction
As technology nodes continue to scale down, device structures have gradually transitioned from two-dimensional planar architectures to three-dimensional device architectures. The complex device architectures and increased number of process steps exacerbate the difficulty of device performance optimization. Adopting design-technology co-optimization has become an important approach to explore device optimization paths for advanced nodes and requirement-driven chip design.
Compact models serve as a crucial bridge connecting process technology and circuit design. The BSIM-CMG model, proposed by Professor Chenming Hu’s group at the University of California, Berkeley, effectively supports device architectures including FinFET and GAA [1]. To accelerate the DTCO workflow, multi-objective optimization algorithms such as Differential Evolution (DE), Particle Swarm Optimization (PSO), and Bayesian Optimization (BO) have been employed for compact-model parameter extraction. However, these approaches still suffer from issues such as excessive iteration counts and insufficient accuracy [2]. Deep learning-based compact-model parameter prediction offers the advantage of high efficiency, yet the scarcity of large-scale training datasets in the early stages of DTCO presents a significant challenge [3]. ResNet is also proposed to achieve accelerated modeling of 12 nm FinFET devices, meeting the fast and efficient requirements of the DTCO process [4].
The methodology of process optimization constitutes the single most important element in DTCO exploration. Asen Asenov uses Monte Carlo simulation to explore the noise margin of 14 nm SRAM circuits in the process space and statistical variability space [5]. Baokang Peng utilizes a multi-objective Bayesian optimization algorithm to achieve PPA optimization for standard cells in 7 nm FinFET technology [6]. Markus Karner further incorporated reliability considerations into the DTCO framework [7]. Variability effects including LER (Line Edge Roughness) and MGG (Metal Gate Granularity) are incorporated into the DTCO analysis to improve the robustness of circuit designs against process variations [8].
The remaining sections will provide detailed descriptions of the proposed method. Section 2 presents the construction of FinFET device process structures using TCAD tools and the simulation-based acquisition of the effects of various process parameters on key device electrical parameters, as well as the acceleration of BSIM-CMG compact-model parameter extraction via the Gauss–Newton iteration algorithm. Section 3 introduces a data-driven DTCO framework based on process-parameter sensitivity analysis, and takes the oxide thickness Hfin as a case-study process parameter to demonstrate optimization analyses of ring oscillator circuits targeting different performance and functionality requirements. Section 4 presents the conclusions of this paper.
2. TCAD Device Simulation
2.1. 14 nm FinFET TCAD Structre
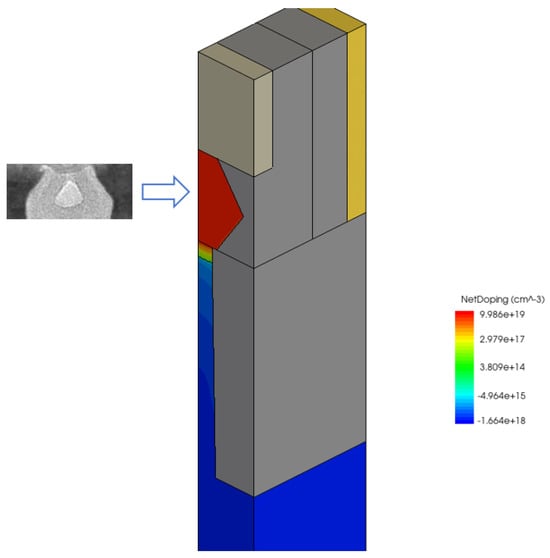
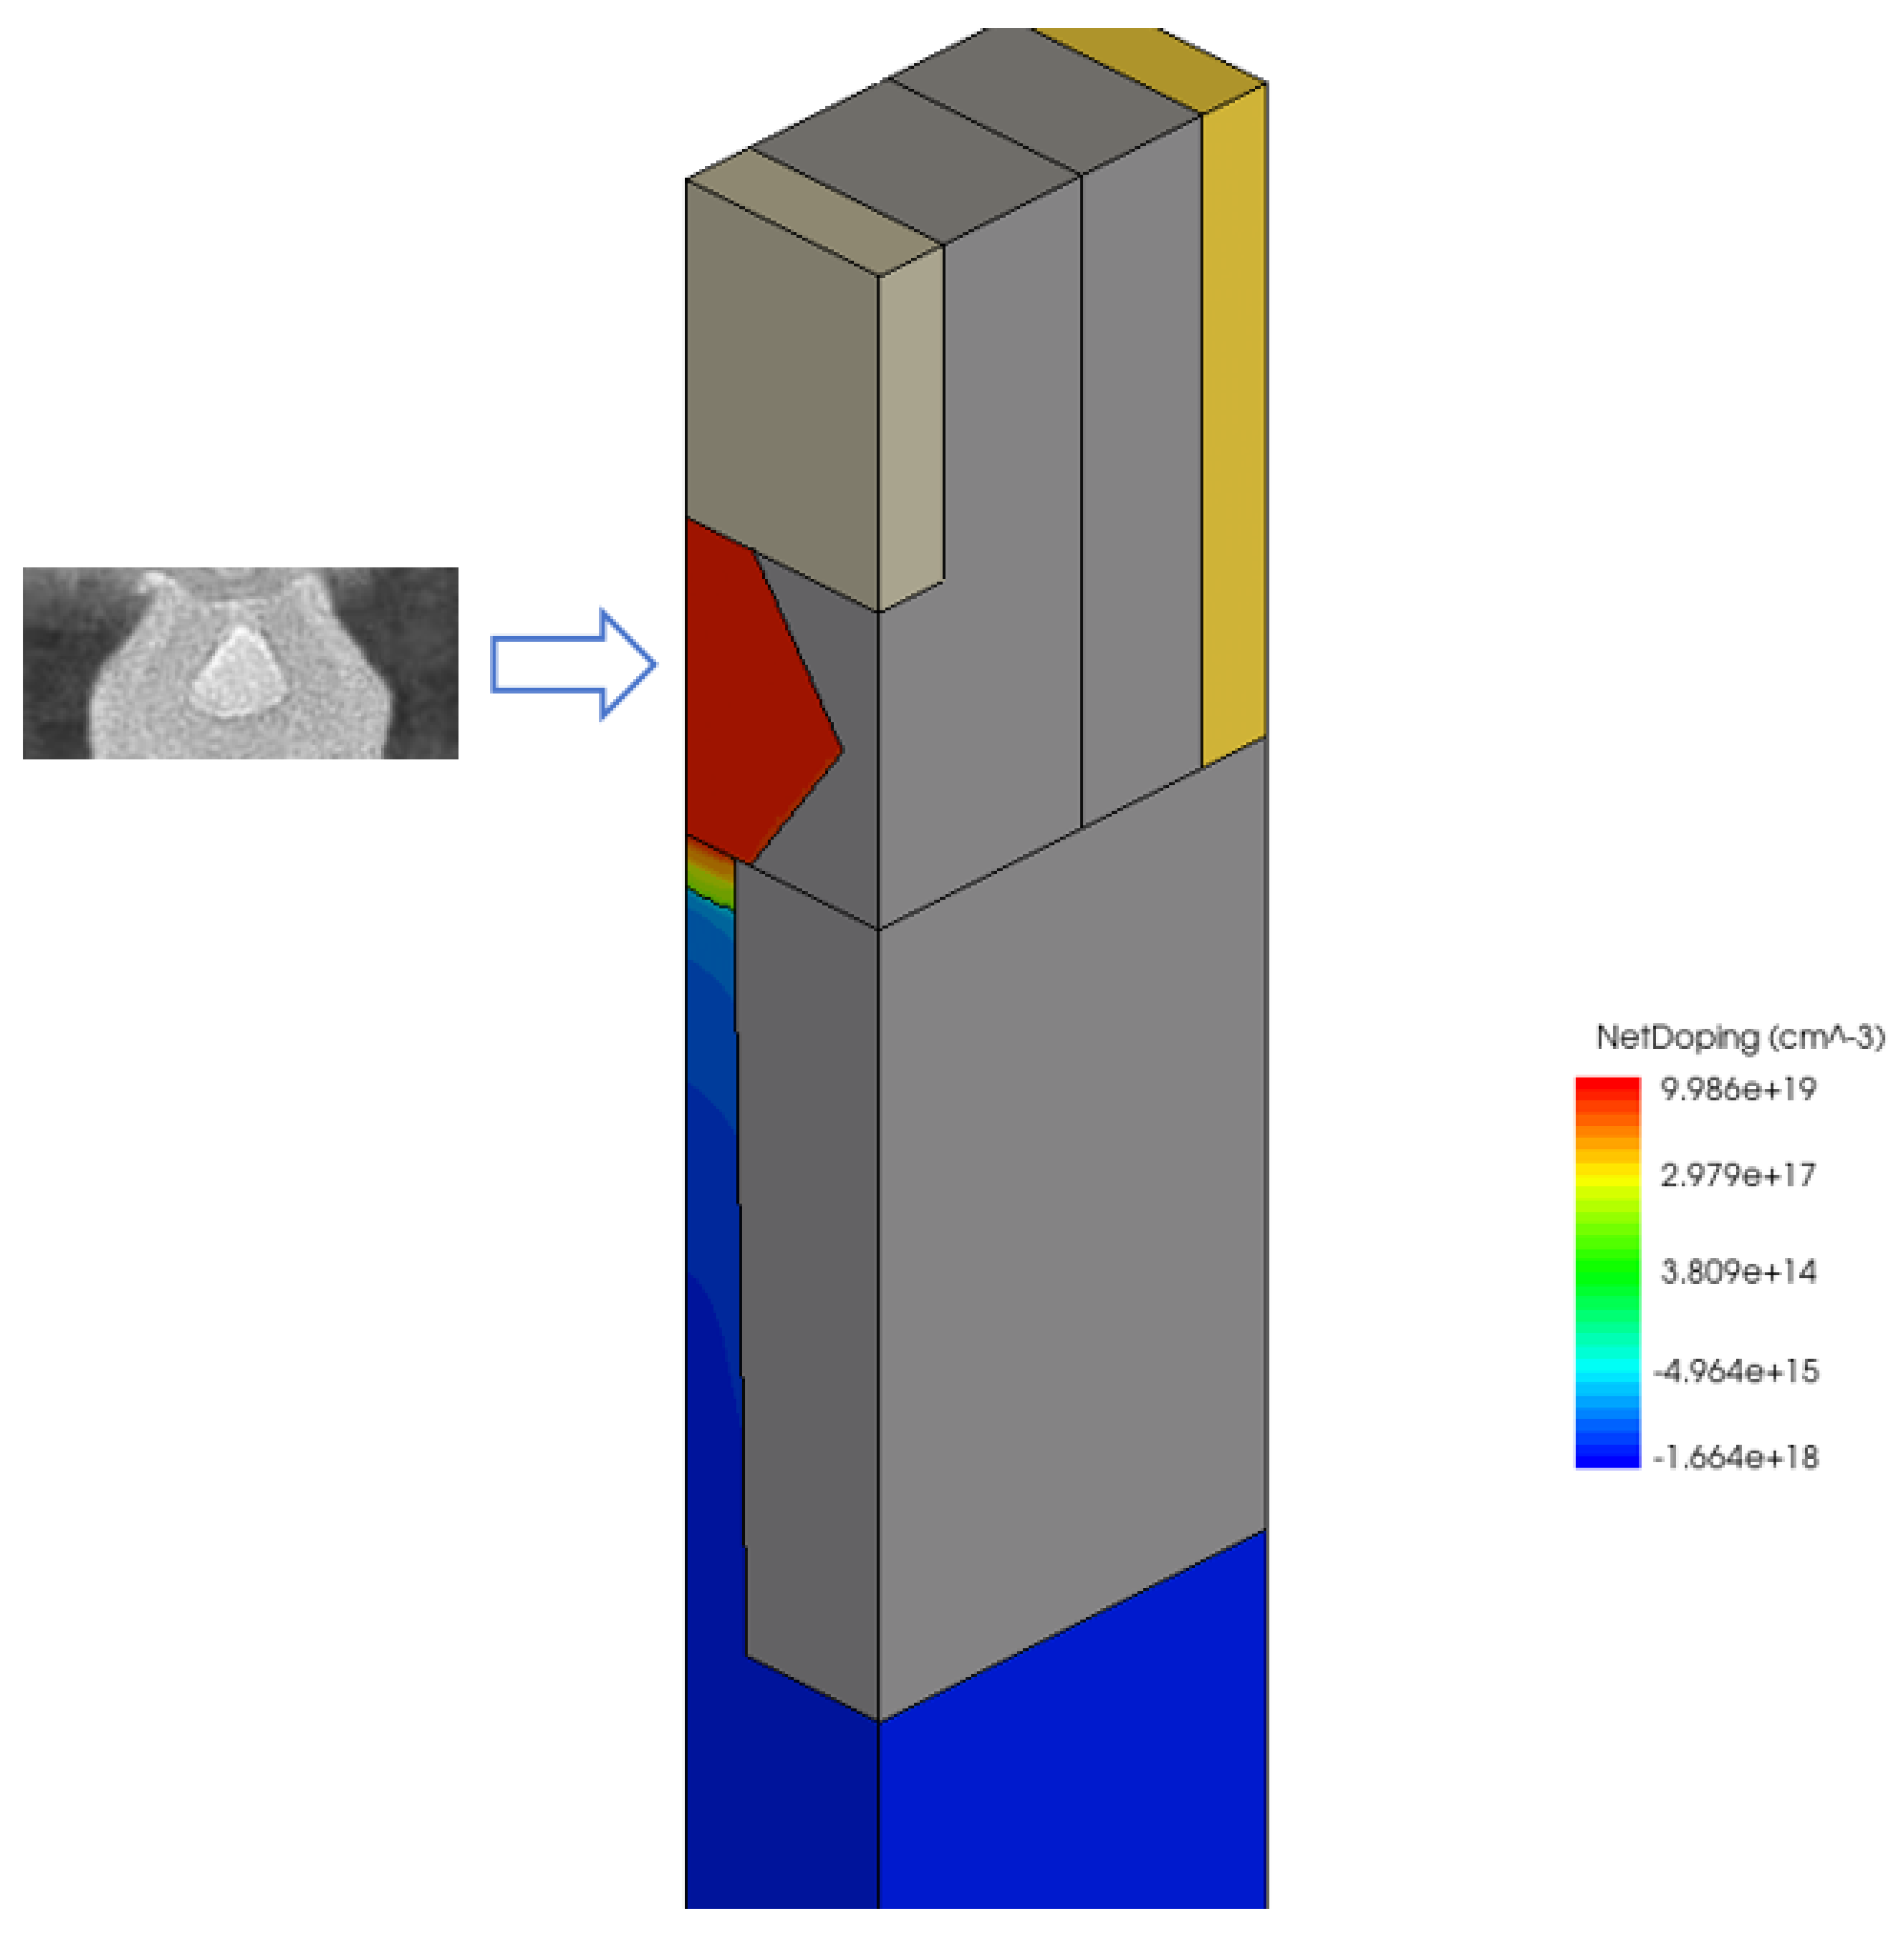
The three-dimensional FinFET device structure is modeled using the TCAD tool from Cogenda Corporation, Suzhou, Jiangsu, China. Device simulations are performed to extract the electrical characteristics for compact model generation, with the device geometry illustrated in Figure 1 [9]. In this TCAD device, the SiGe/SiC source/drain epitaxy with shapes consistent with SEM images is considered.
Figure 1.
3D TCAD simulation structure of the FinFET device.
Table 1 summarizes the key adjustable geometric and process parameters of the FinFET 3D device structure constructed above, which support the investigation of the impact of various process parameter variations—including gate, fin, and oxide layer—on device performance.
Table 1.
FinFET device geometry and process parameter list.
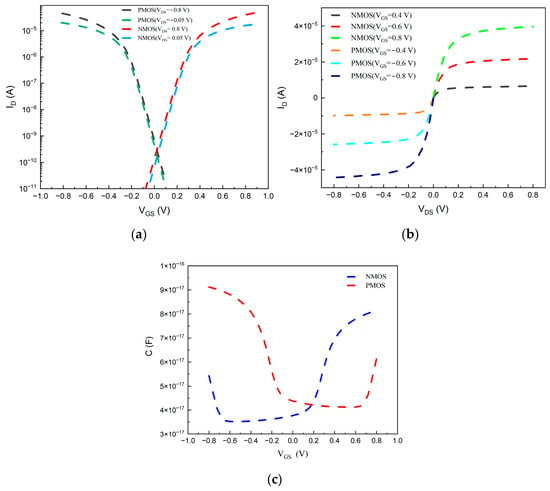
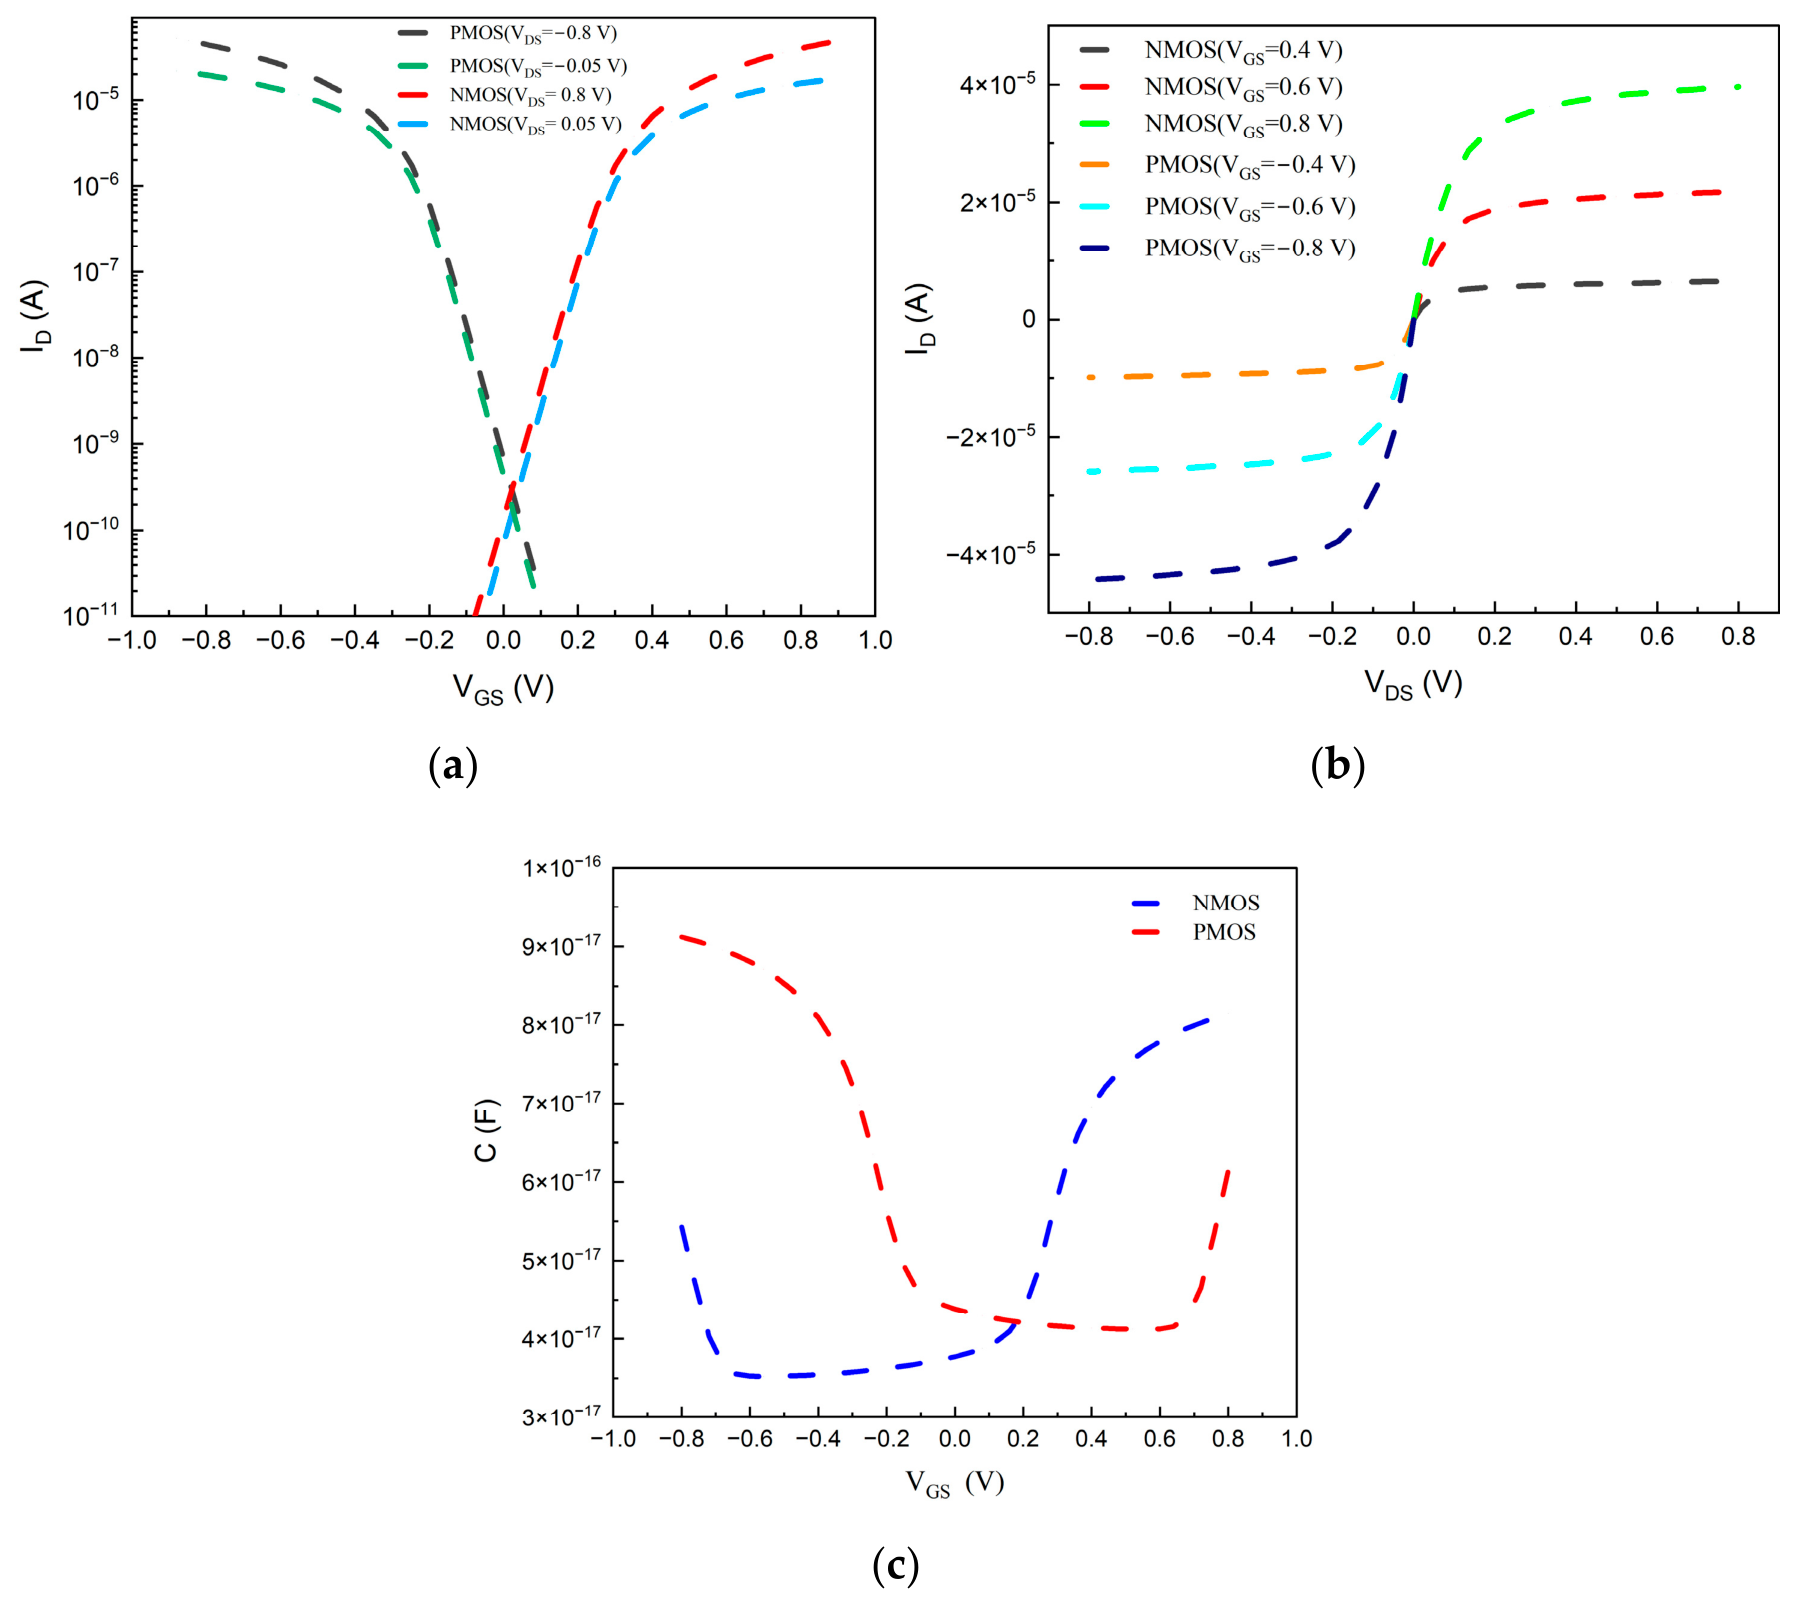
As the FinFET devices under investigation feature short-channel geometries, the TCAD simulations incorporate a comprehensive set of physical models, including quasi-ballistic transport, drift-diffusion carrier transport, quantum confinement, bandgap narrowing, as well as low-field and high-field mobility degradation [10]. Metal gates with work functions of 4.4 eV and 4.9 eV are assigned to the NMOS and PMOS devices, respectively. The core MOS devices are biased at a nominal supply voltage of 0.8 V. The simulated transfer (ID-VGS), output (ID-VDS), and capacitance–voltage (C-VGS) characteristics are presented in Figure 2, from which the key electrical parameters are extracted.
Figure 2.
Device simulation results: (a) transfer characteristics, (b) output characteristics, and (c) capacitance-voltage characteristics.
2.2. Process Parameter Sensitivity Analysis
The effects of various process parameters on the key electrical parameters are simulated to identify the trend of influence, providing guidance for process optimization in the subsequent DTCO framework. Taking the NMOS device simulation as an example, the experimental parameter sets are designed as summarized in Table 2.
Table 2.
Experimental design for NMOS’s various process parameters.
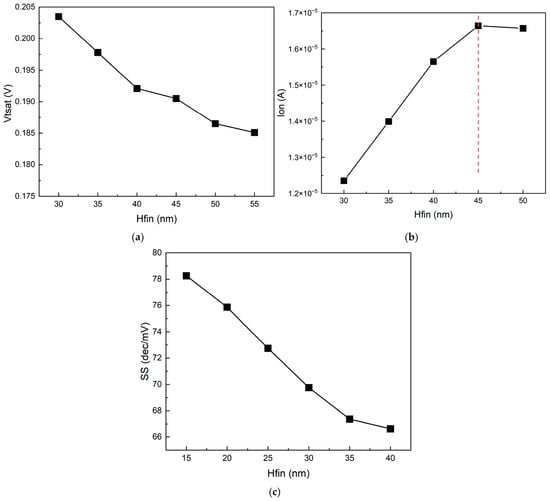
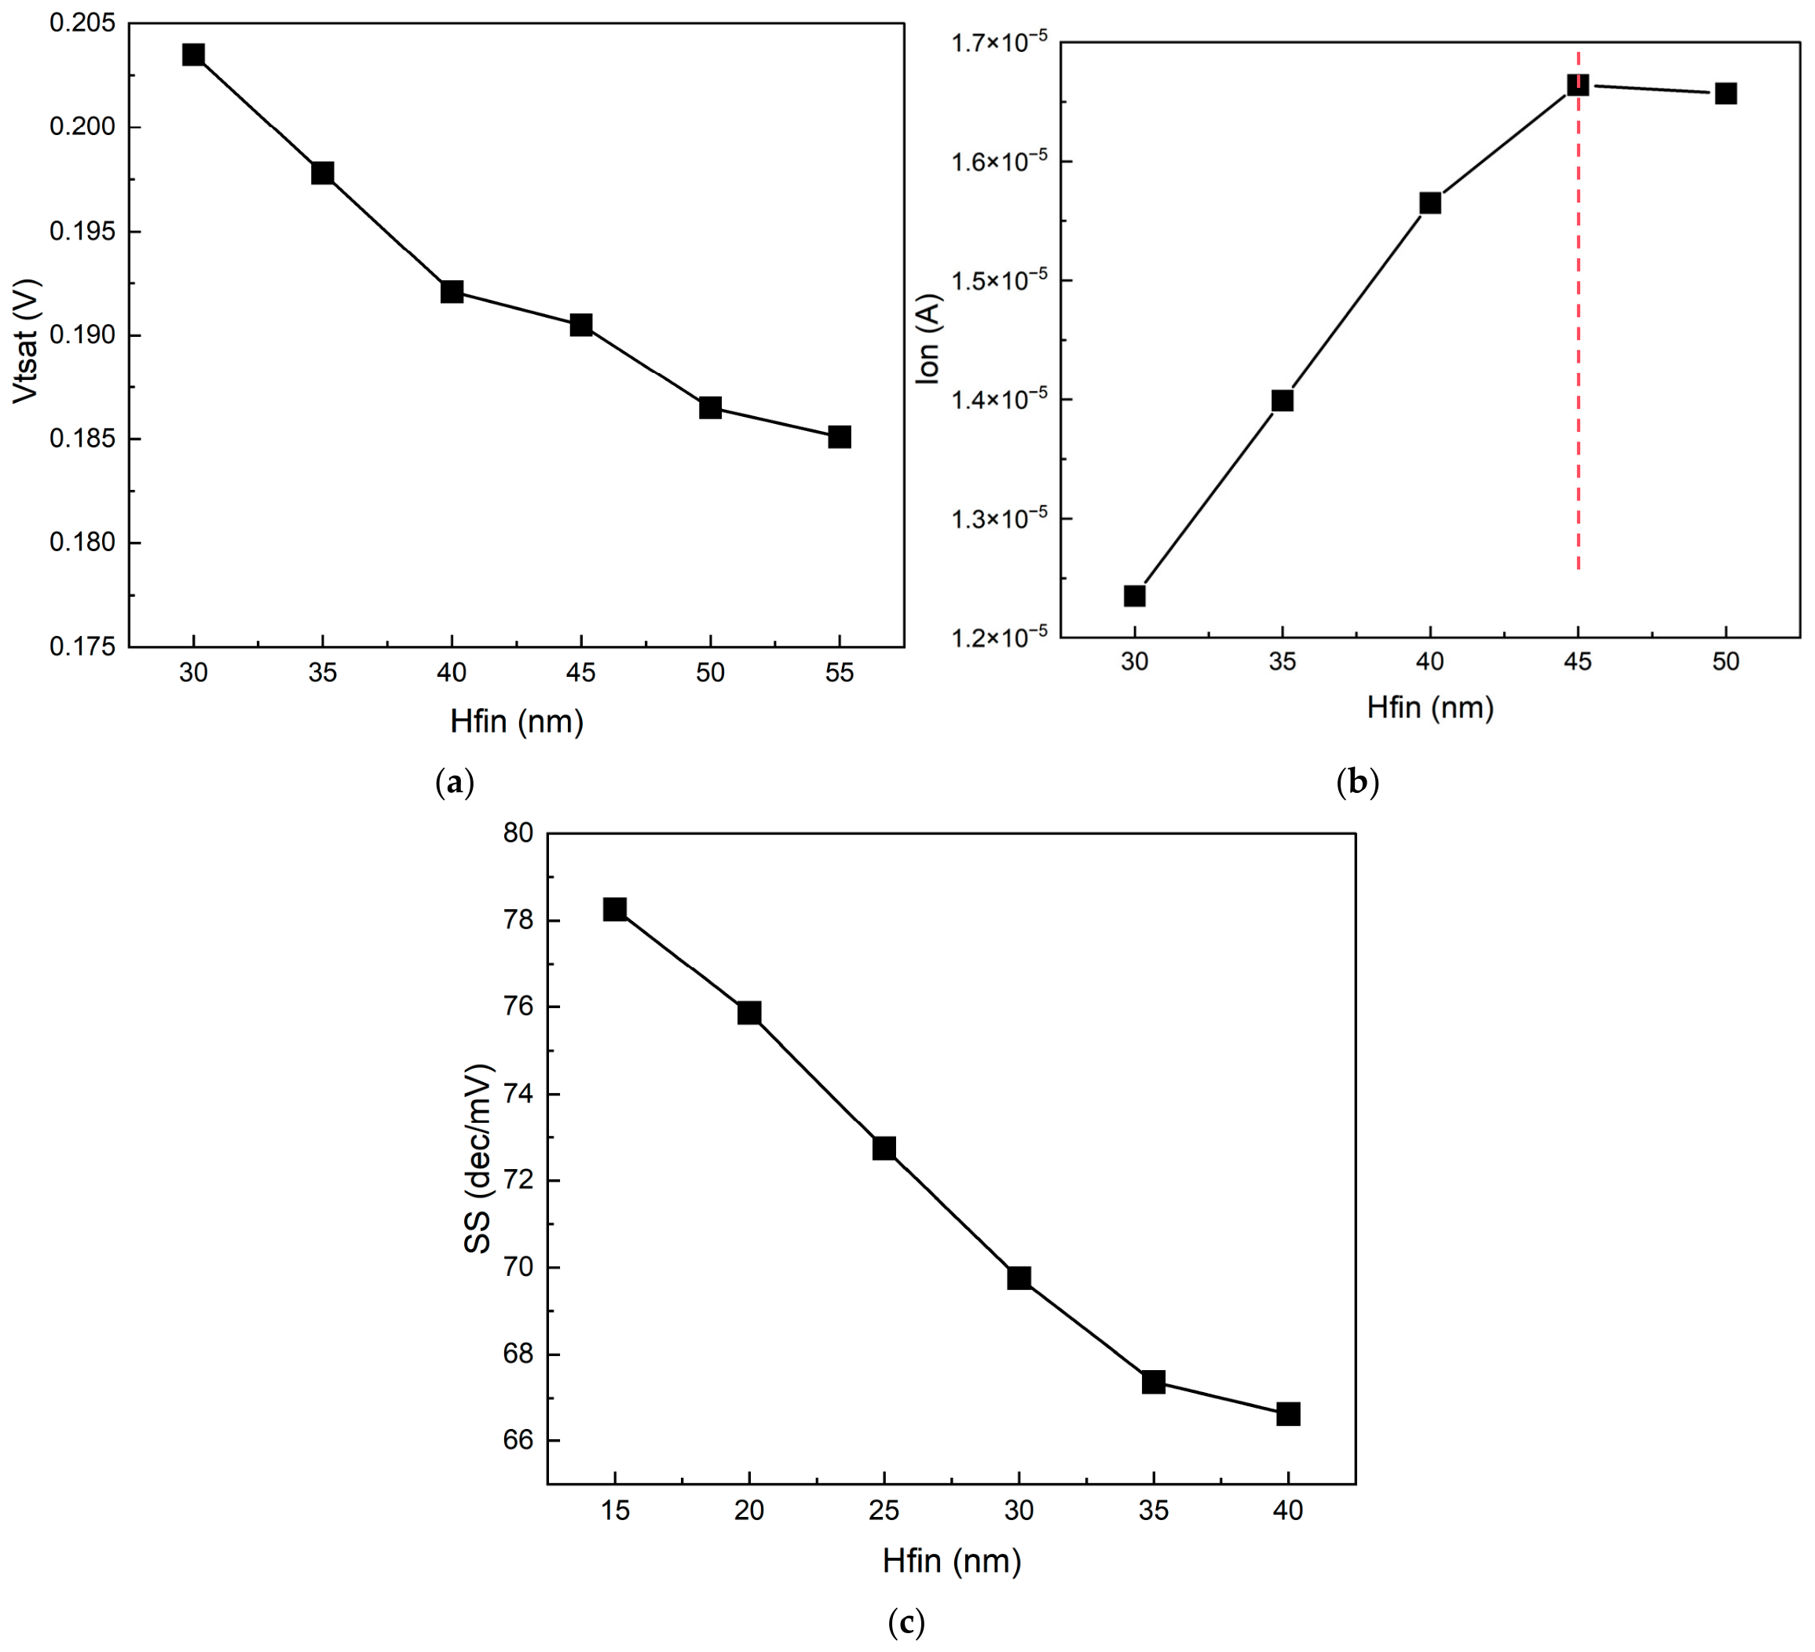
Using the FinFET device simulation model established in Section 2.1, we investigate the impact of various process parameter variations on the key electrical parameters, including threshold voltage (Vth), on-state current (Ion), off-state current (Ioff), and subthreshold swing (SS). Figure 3 presents the simulation results, taking the Hfin as an illustrative example.
Figure 3.
Variation in key electrical parameters with Hfin: (a) Vtsat vs. Hfin; (b) Ion vs. Hfin; (c) SS vs. Hfin.
As shown by the dashed-line decomposition in Figure 3b, the Ion characteristic attains its maximum value at an Hfin of approximately 45, indicating that the parameter selection window must be taken into account.
Based on the simulation results presented above, the variation trends of each key electrical parameter with respect to process parameter variations are evaluated, with “+” and “−” denoting increasing and decreasing trends, respectively. The corresponding sensitivity coefficients are calculated using the first-order linear approximation formula given below [11]:
The calculated sensitivity coefficients of the process parameters serve as quantitative guidance for identifying the optimal direction of process optimization targeting device performance metrics in the subsequent DTCO stage.Based on the Equation (1), the sensitivity of the device under this process is calculated, and the results are shown in Table 3.
Table 3.
Sensitivity of key device electrical characteristics to various process parameters.
Analysis of Key Process Parameters for Threshold Voltage Adjustment: Gate work function is the core parameter affecting Vth. Variations in the work function directly alter the flat-band voltage, thereby causing significant shifts in Vth [12]. The gate oxide layer indirectly adjusts Vth by affecting the gate control capability, which merely serves as a fine-tuning adjustment of the primary voltage of work function difference.
Analysis of Key Process Parameters Affecting Drive Current: In actual manufacturing processes, since the fin width is physically constrained and cannot be further scaled down, the effective width is primarily increased through fin height enhancement, thereby achieving stronger gate control and higher drive current [13].
Analysis of Key Process Parameters Affecting Subthreshold Swing: Reducing the fin width can significantly enhance the gate’s electrostatic control over the channel and reduce parasitic capacitance, thereby bringing the subthreshold swing closer to the ideal value of 60 mV/dec [14]. In addition, the ratio of fin height to fin width (aspect ratio) is also a critical factor. Maintaining an appropriate aspect ratio can effectively suppress the DIBL effect and improve the subthreshold swing. The related literature suggests that the fin height-to-width ratio should be greater than 1.5. However, excessive fin height will exacerbate the device self-heating effect, thereby compromising reliability.
Therefore, in DTCO optimization, Hfin is prioritized as the primary process parameter to be optimized. And the optimization magnitude is determined accordingly through process parameter sensitivity analysis.
2.3. Automatic Compact-Model Parameter Extraction
The initial BSIM-CMG model parameters are configured based on the FinFET device structure described in Section 2.1. The parameter settings are summarized in Table 4.
Table 4.
Initial configuration of BSIM-CMG model parameters for the 14 nm FinFET device.
The BSIM-CMG compact model (version 108) is employed for the FinFET device modeling. The parameter DETYPE is set according to the device type: 0 for NMOS and 1 for PMOS. The FinFET device is a tri-gate structure, where the gate electrode surrounds the conductive channel from the top and both sidewalls. The geometric parameters, including fin height (HFIN) and fin width (TFIN), are consistent with those defined in the TCAD process simulations. Since no isolation oxide layer is present between the fin and the substrate, the device is classified as a bulk FinFET, and BULKMOD is set to 1. The parameters GIDLMOD and RDSMOD are used to account for gate-induced drain leakage (GIDL) and source/drain parasitic resistance, respectively. GIDLMOD is set to 1 to include the GIDL current source (Igidl) in the small-signal model, while RDSMOD is set to 0 to neglect external parasitic effects. The equivalent oxide thickness (EOT) is calculated using the following formula [15]:
Conventional parameter extraction for compact model calibration typically relies on manual tuning of fitting parameters, which is a time-consuming and labor-intensive process. To expedite the model development workflow, we adopt an automatic parameter extraction method for the BSIM-CMG compact model based on the Levenberg–Marquardt algorithm [16]. This algorithm is a nonlinear least-squares optimization technique that combines the Gauss–Newton method (Equation (3)) with gradient descent regularization to ensure robust convergence:
and the gradient descent method, as expressed in Equation (4):
By combining the strengths of the Gauss–Newton method (Equation (3)) and the gradient descent method (Equation (4)), the Levenberg–Marquardt algorithm further introduces a damping factor λ to dynamically balance the two optimization strategies.
where λ is implemented as a diagonal matrix. A larger λ steers the algorithm toward the gradient descent method, ensuring stability when far from the optimum, whereas a smaller λ shifts it toward the Gauss–Newton method, enabling rapid convergence near the optimum.
The automatic parameter extraction of the compact model is thus formulated as an error-function fitting problem:
where W is a diagonal matrix of weighting factors, and ti denotes the independent variables of the model—i.e., the input variables such as gate-source voltage (VGS), drain-source voltage (VDS), and gate length (Lg). The LM algorithm iteratively determines the optimal parameter vector c, which corresponds to the compact model parameters to be extracted, by minimizing the fitting error.
The core update strategy of the LM algorithm requires the user to specify an initial damping factor λ0. If the error metric exceeds the predefined error tolerance, the parameter vector c and the damping factor λ0 are updated according to the following update rules:
If the error metric is less than the defined tolerance, the parameter vector and damping factor are updated according to the following rules:
where Ldown and Lup are empirical parameters, conventionally set to 11 and 9, respectively. The Jacobian matrix is then updated using the following expression (Equation (11)):
The above equations yield the complete form of the linear system to be solved. However, the solution process may encounter numerical difficulties when the coefficient matrix is ill-conditioned. To improve the numerical stability, a small diagonal perturbation matrix D is added to the coefficient matrix at each iteration:
By integrating the regularization of the ill-conditioned matrix with the adaptive adjustment of the damping factor, the linear system is reformulated as follows:
where HessianDiagonal is a parameter related to the step size. In the traditional algorithm, its initial value is set to 1. In the event of an inversion failure, this parameter is automatically increased by a factor of 4 and the inversion is retried iteratively until it succeeds.
For the extraction of the complex BSIM-CMG compact model, the HessianDiagonal is established using the following formula for Equation (14):
where step is the step size of the fitting parameter, used for derivative calculation.
In the curve-fitting process, different ID-VGS and ID-VDS curves are fitted simultaneously. To maintain global fitting accuracy, formulations for point-wise error and global error (Equation (15)) are established, while the error of the I-V curves can be evaluated using the root–mean–square error (RMSE).
Meanwhile, according to the different fitting accuracy requirements for different curves, a weighted error metric is defined as follows:
where KN is the weight parameter for each curve.
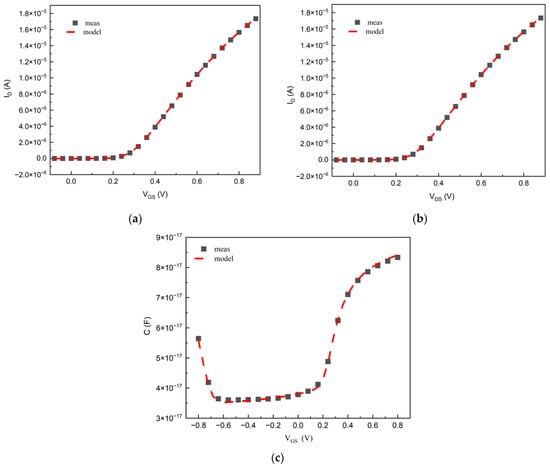
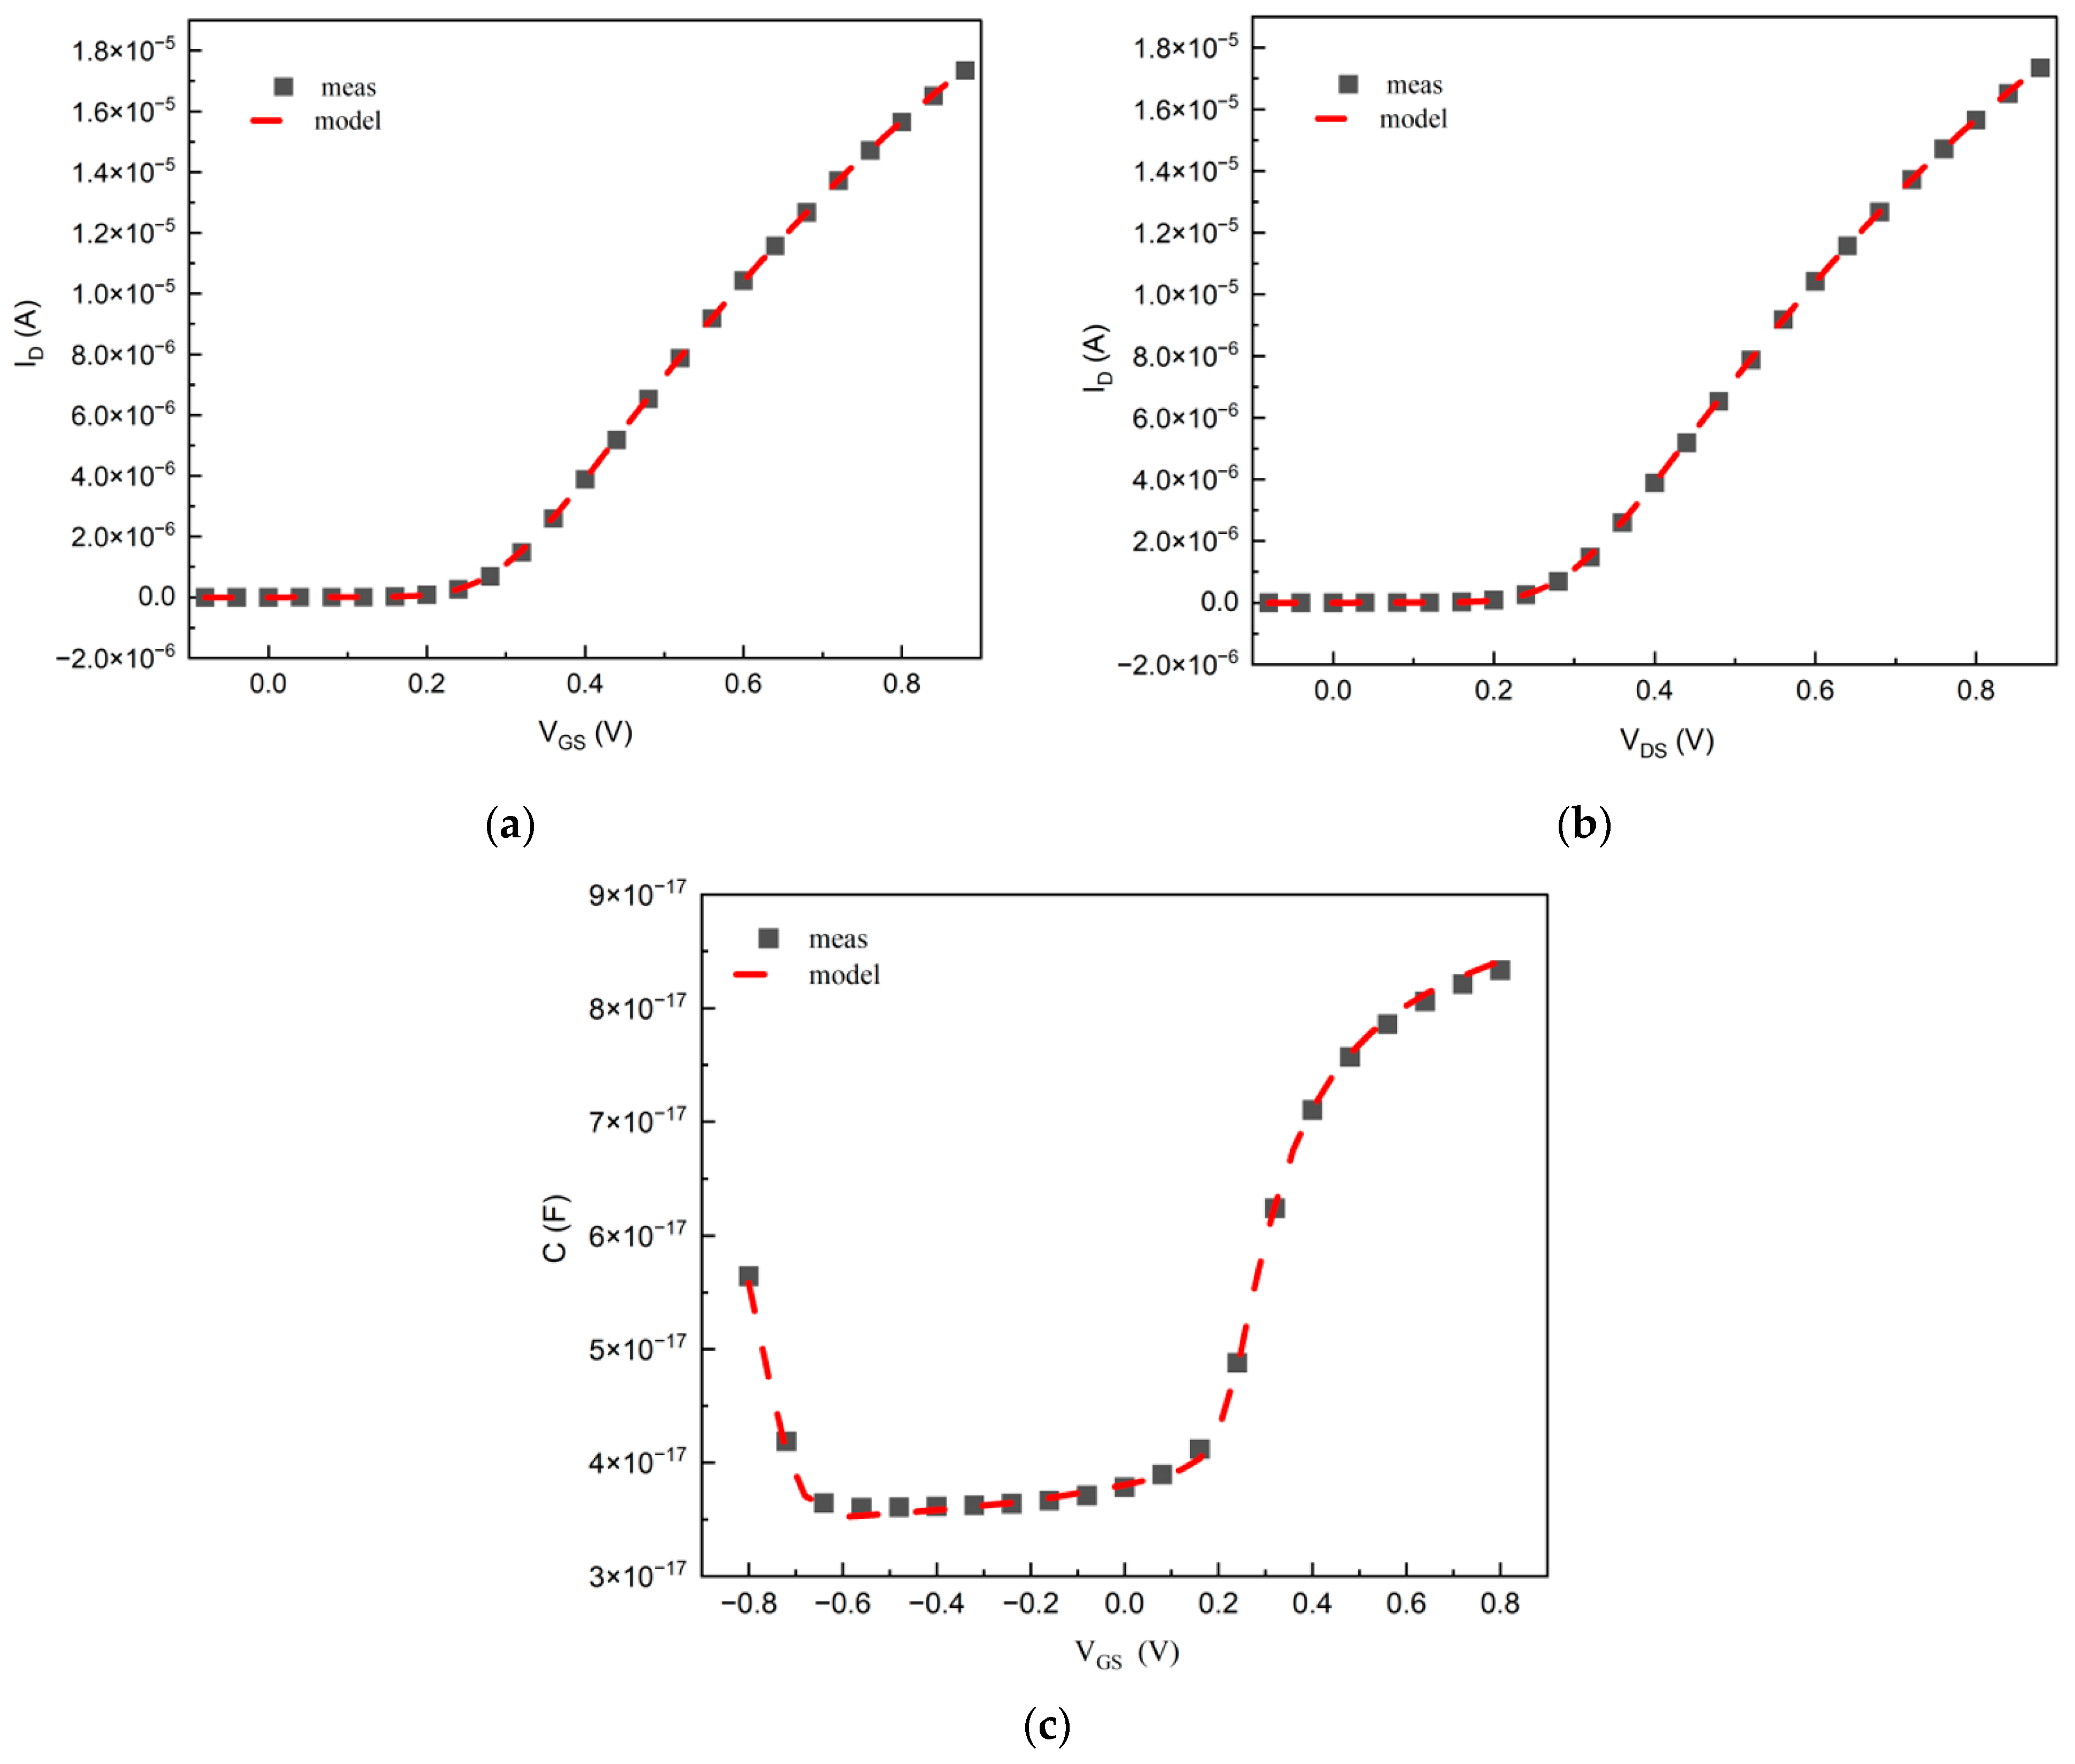
As shown in Figure 4, the simulation results generated by the model with automatically extracted parameters are compared against the TCAD simulation data. The average relative errors for the transfer characteristics (ID-VGS), output characteristics (ID-VDS), and capacitance–voltage (C-VGS) curves are 2.64%, 2.2%, and 3.01%, respectively, confirming the high accuracy of the extracted compact model.
Figure 4.
Model fitting results: (a) ID–VGS, (b) IDS–VDS, and (c) C–VGS.
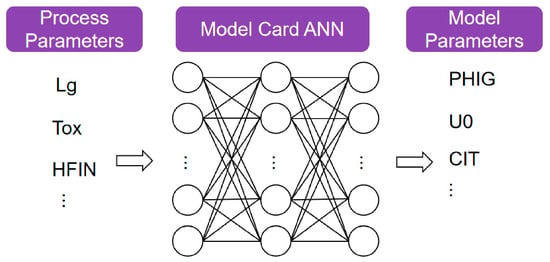
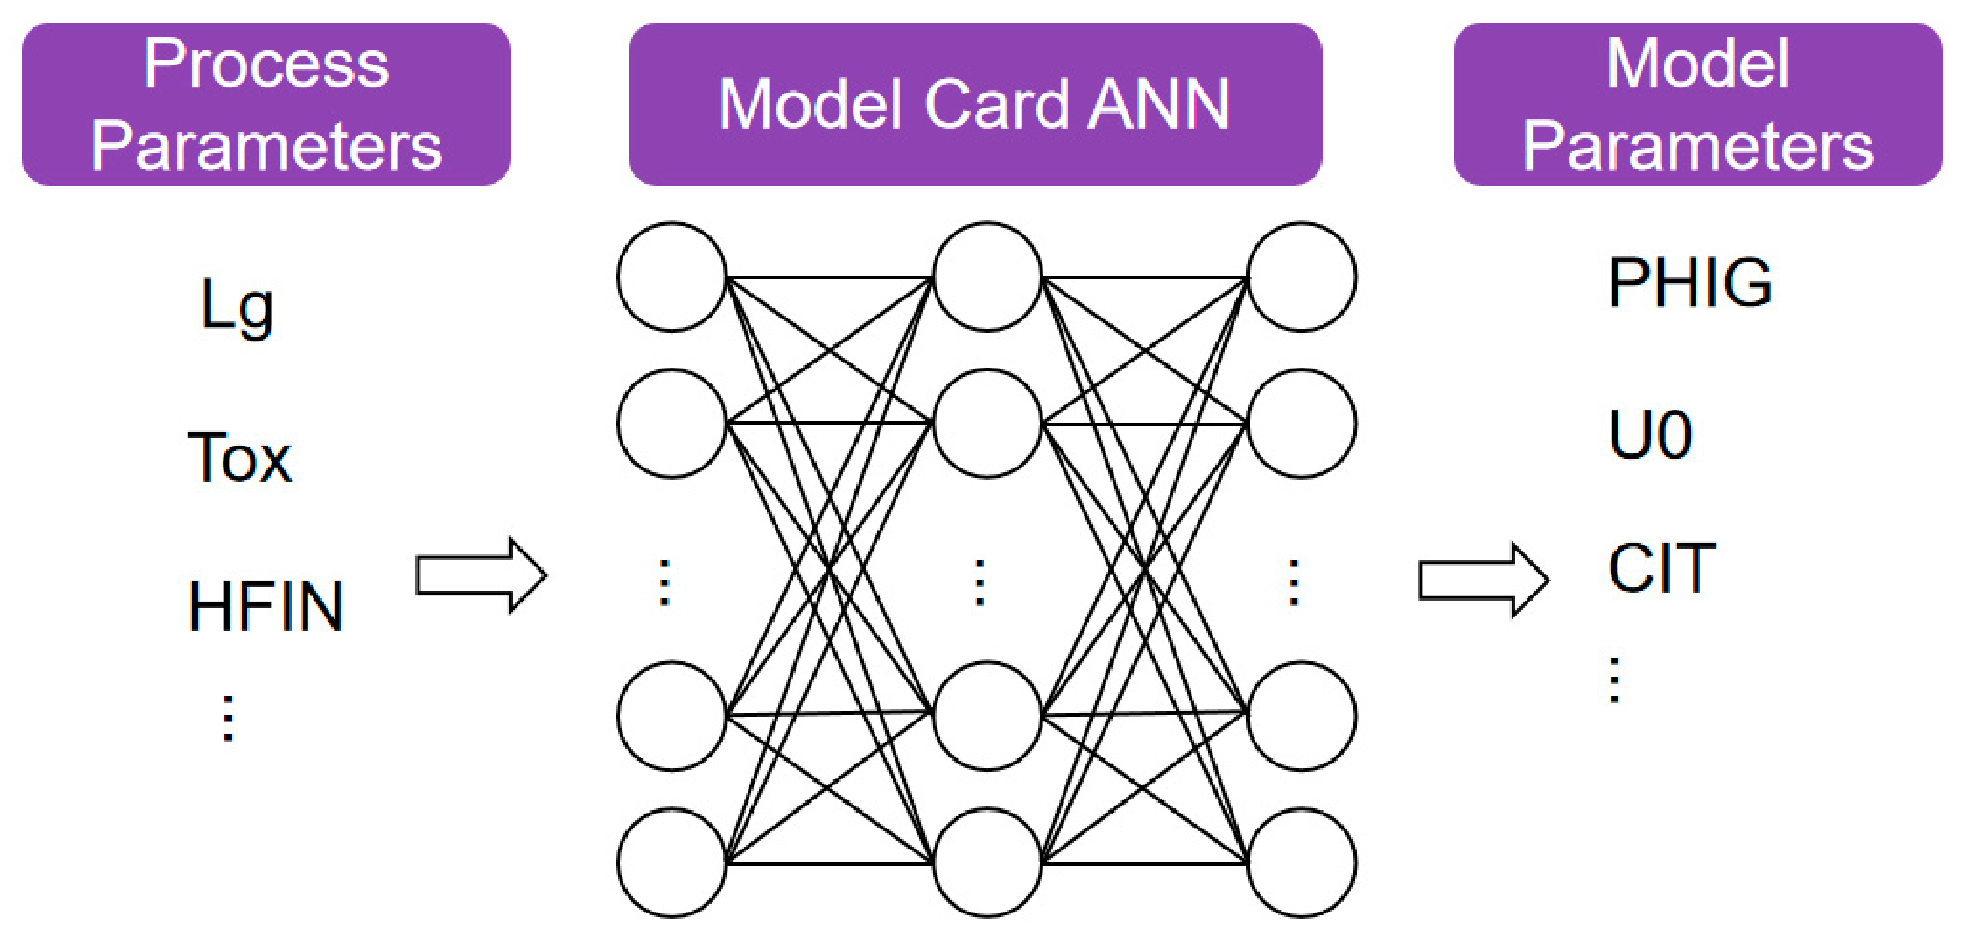
The adoption of automatic parameter extraction algorithms has improved the efficiency of model parameter extraction for advanced processes. Furthermore, based on the generated dataset, an artificial neural network (ANN) is employed to accelerate model parameter prediction.The architecture of the ANN is shown in Figure 5. The ANN network consists of three hidden layers with 800 neurons each. All hidden layers use the ReLU activation function. The loss function is defined as follows [17]:
where α is the weight allocation parameter used for balancing the I-V and C-V loss.
Figure 5.
Model card ANN for the BSIM-CMG model.
The currently adopted ANN models are overly dependent on data. In the future, more consideration will be given to replacing them with network models that possess a certain degree of physical interpretability, such as Physics-Informed Neural Networks. Therefore, TCAD simulations and a parameter extraction procedure based on the BSIM-CMG LM algorithm are still required for the final results’ validation. The current ANN results can serve as a basic predictive reference for the underlying trends.
3. Design-Technology Co-Optimization Framework
3.1. Framework Overview
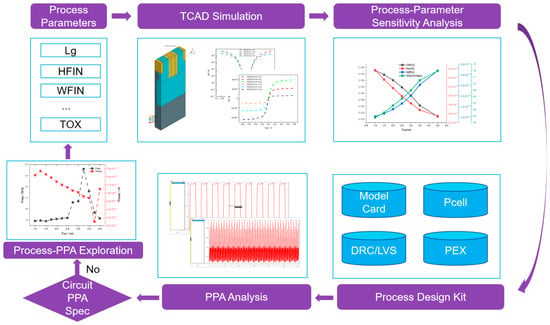
Figure 6 illustrates the DTCO workflow established in this work [18]. First, TCAD tools are employed to build the process simulation flow and configure the process parameters. The initial model calibration is performed using silicon data from tape-out to generate the electrical characteristic curves required for automatic parameter extraction. During the automatic parameter extraction process, the input process parameters and the output model card parameters are used as training sets to iteratively train an artificial neural network. Once the ANN achieves satisfactory predictive performance, it is adopted to enable rapid prediction of compact model parameters from process parameters. A predictive process design kit, comprising the simulation model card, parameterized cells with multiple adjustable parameters, and physical verification files, is constructed to support the design and simulation of ring oscillator circuits. The RO circuits are then used to evaluate the influence of various process devices on key circuit metrics, including oscillation frequency, gate delay, dynamic current, and static leakage current. Corresponding evaluation criteria are established, and if the circuit performance fails to meet the specified requirements, the device performance is iteratively optimized through process adjustments.
Figure 6.
Design-technology co-optimization (DTCO) framework.
3.2. Evaluation of Frequency and Power Consumption in Ring Oscillator Circuits
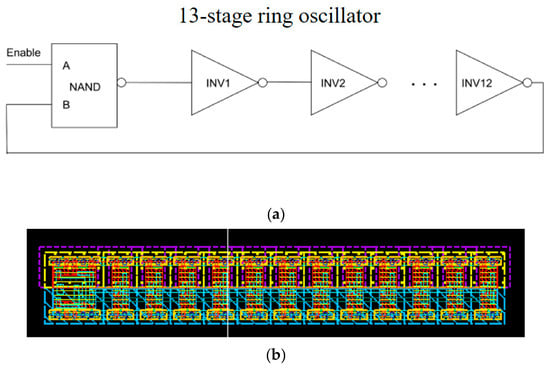
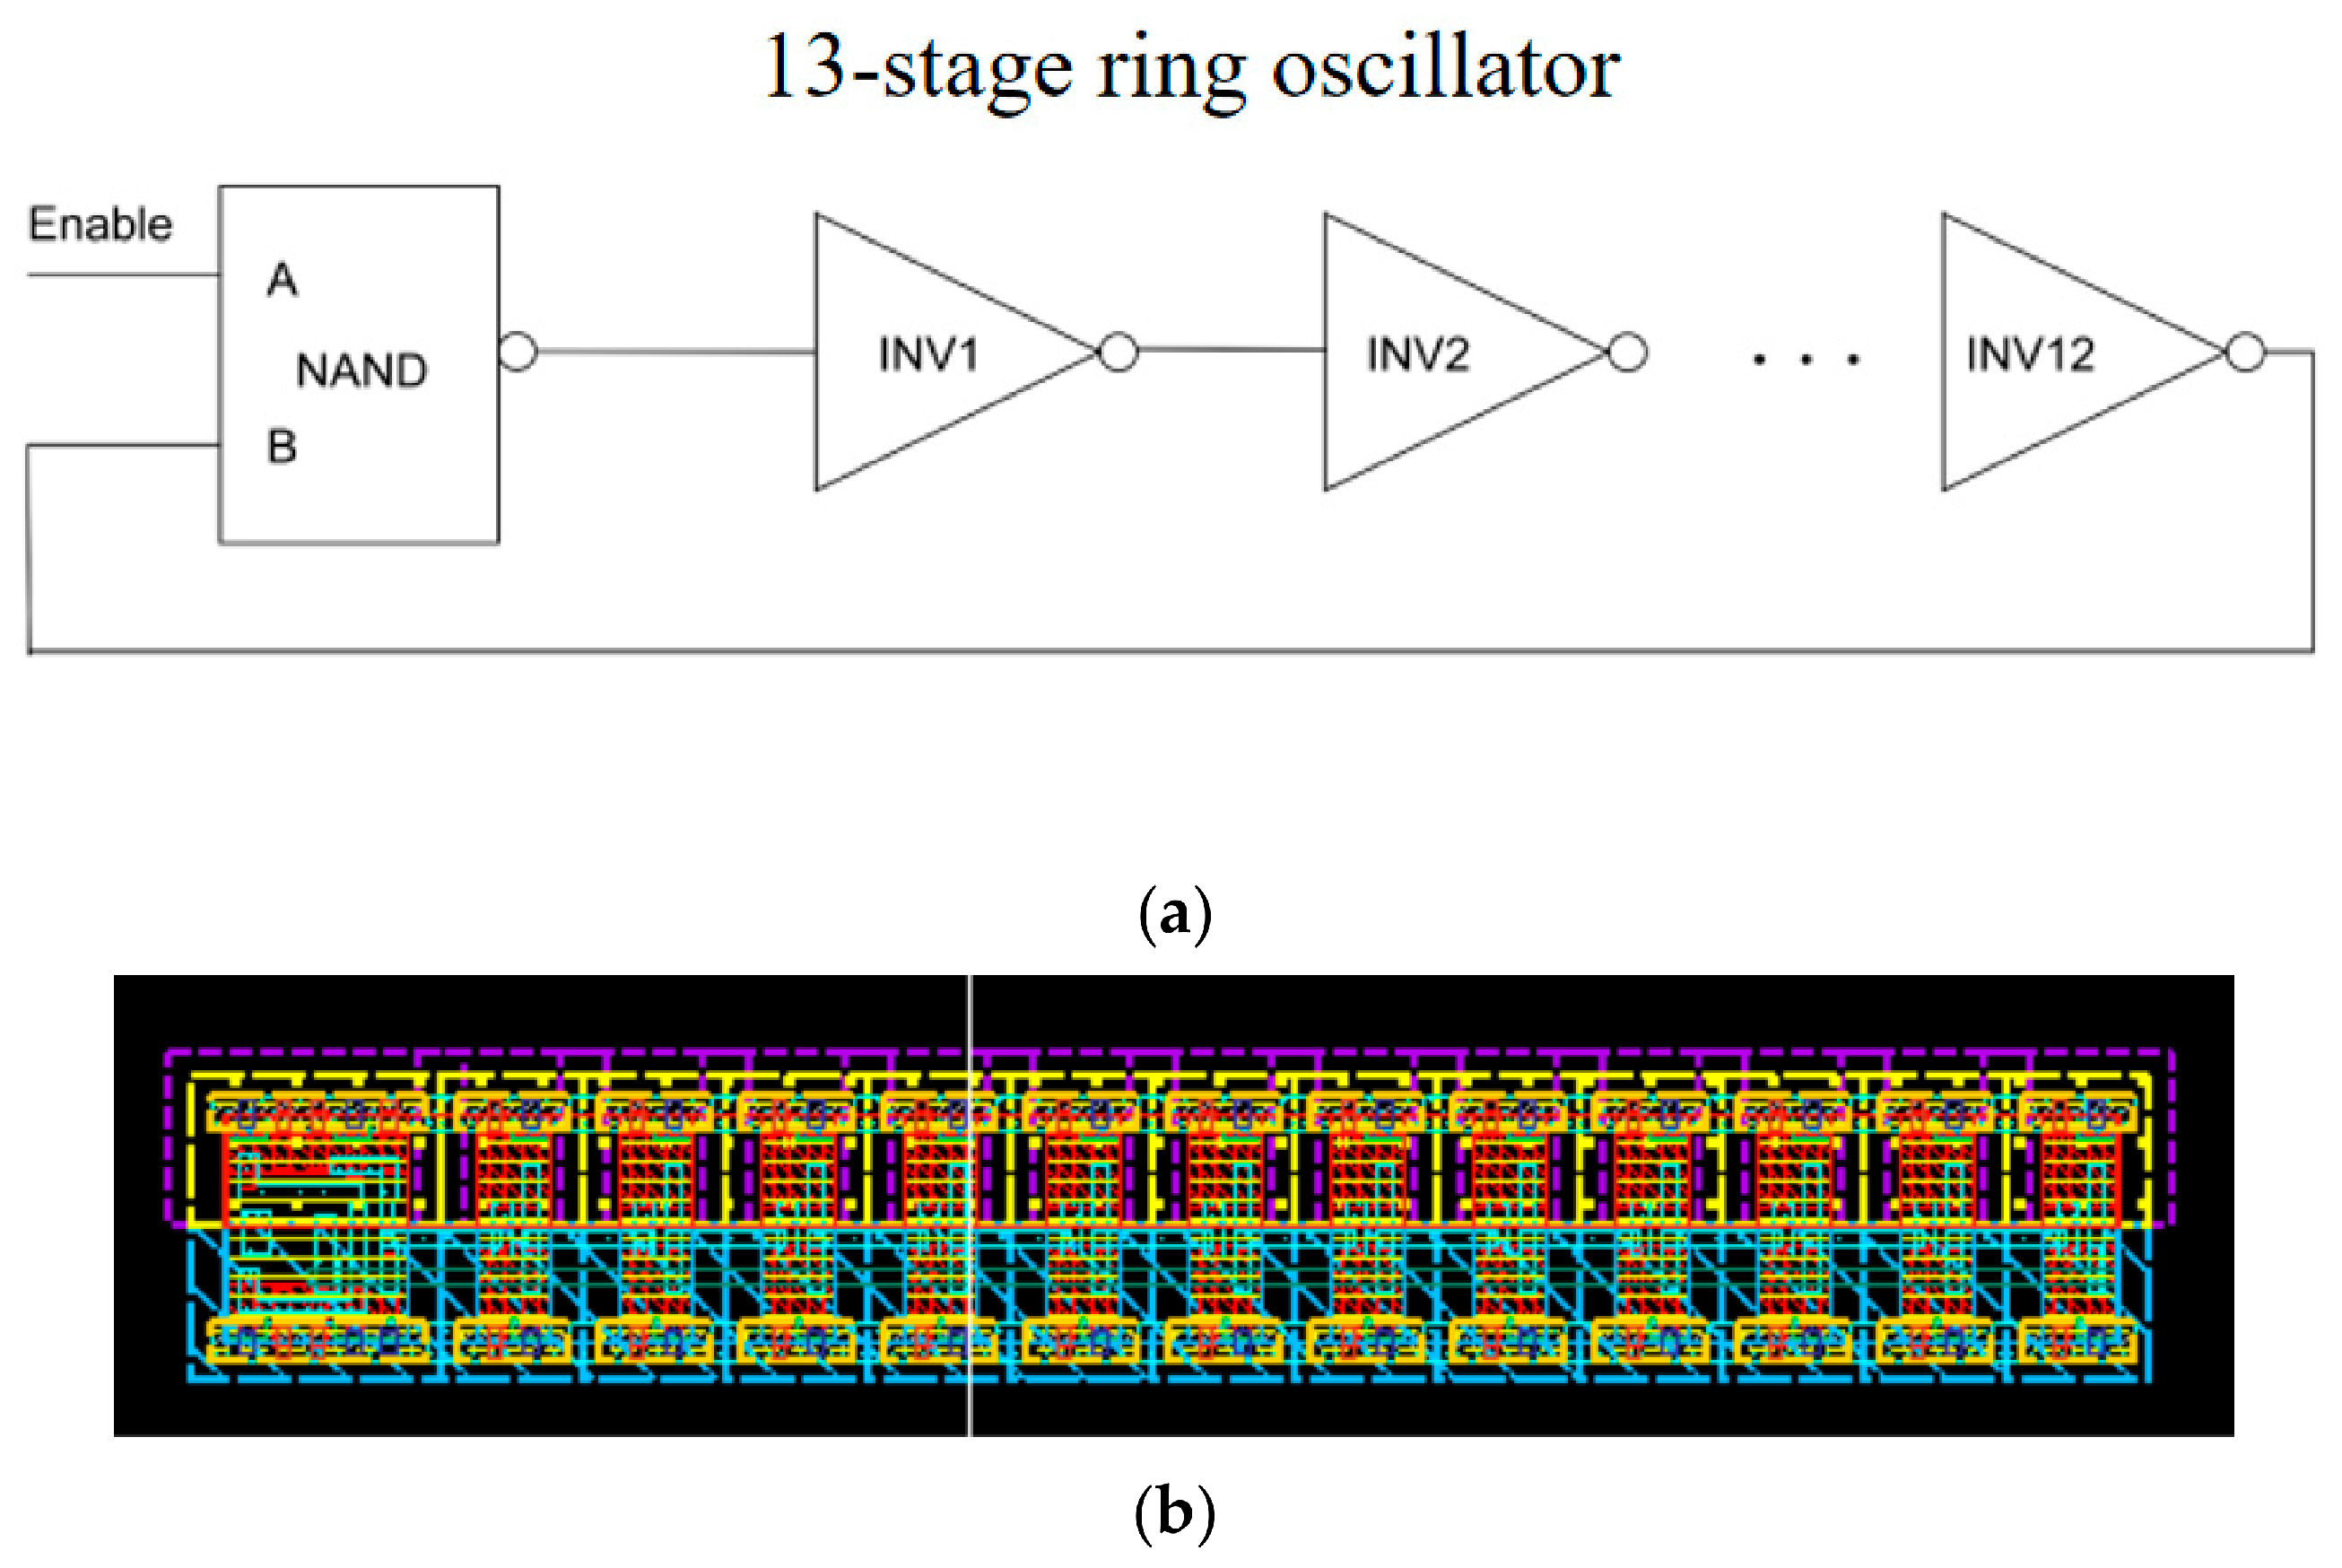
As shown in Figure 7, a 13-stage ring oscillator circuit (comprising 1 NAND gate and 12 inverters) was designed based on the 14 nm predictive process design kit and the Aether analog circuit design platform [18,19]. Layout design rule check (DRC) and layout-versus-schematic (LVS) verification were performed using the Argus platform [20].
Figure 7.
Thirteen-stage ring oscillator circuit: (a) schematic; (b) layout.
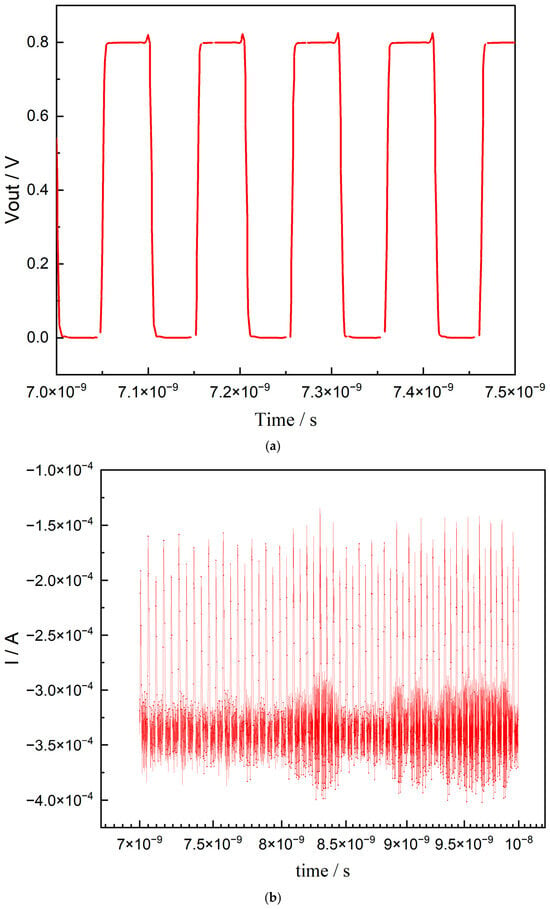
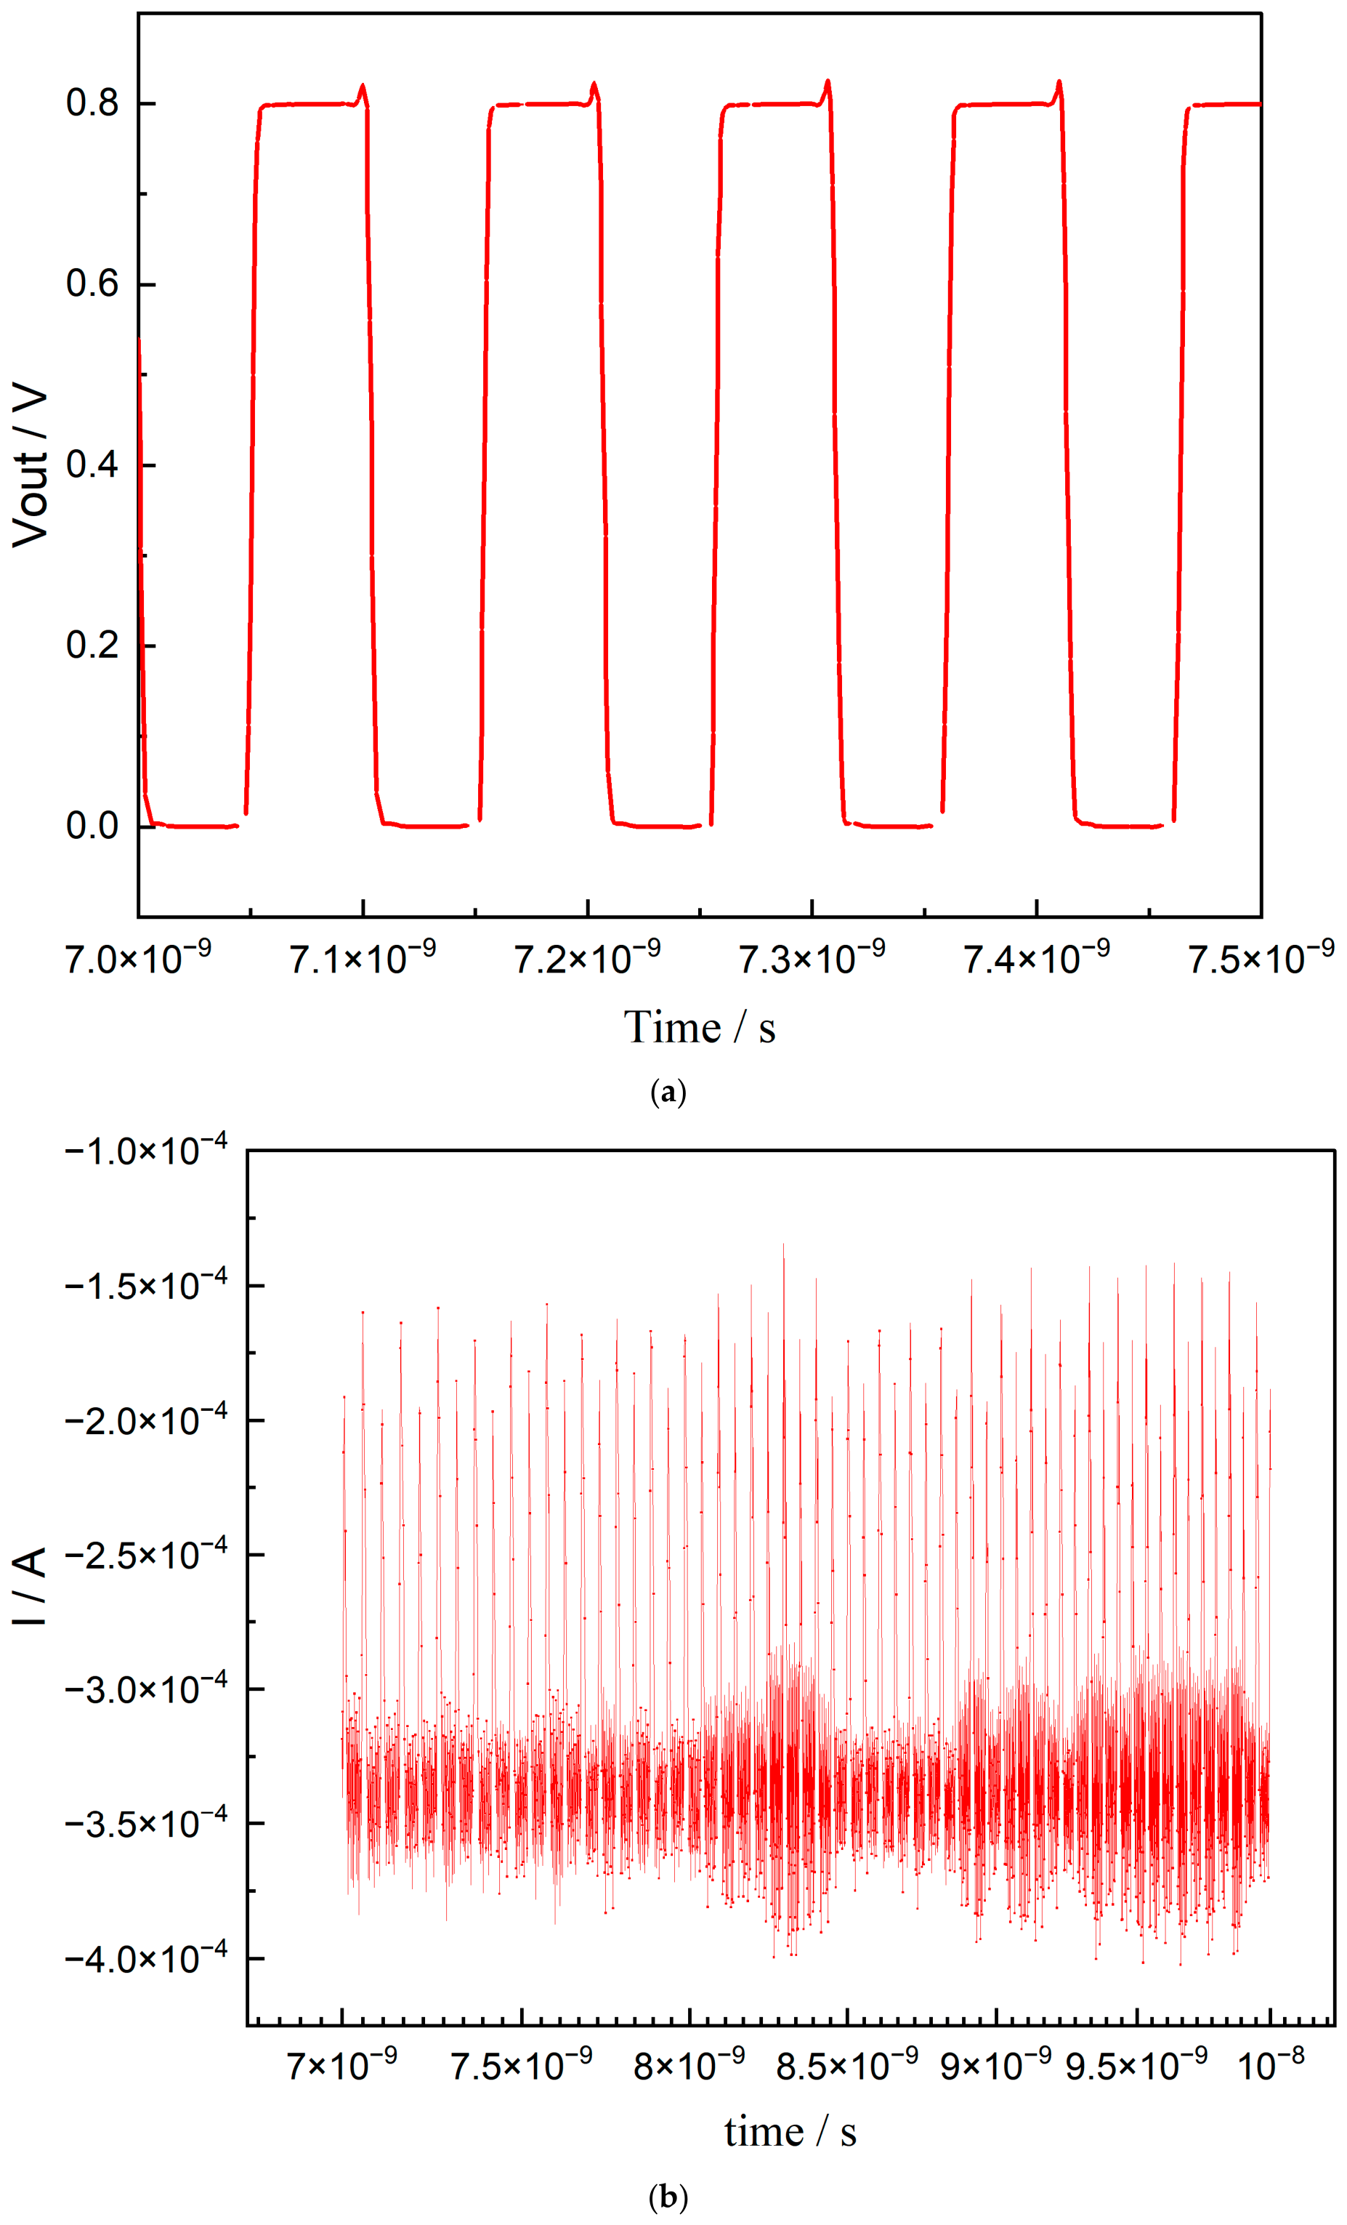
The model card files generated from TCAD data were used to simulate and evaluate the impacts of different process parameters on the key performance metrics—oscillation frequency and power consumption—of the 13-stage ring oscillator, as shown in Figure 8.
Figure 8.
Simulation results of the 13-stage circuit: (a) frequency result; (b) current result.
The oscillation waveform of the RO circuit was obtained through transient simulation testing, from which the oscillation period T was extracted, and the oscillation frequency was calculated using Equation (18):
The circuit power consumption was calculated based on the average current Iavg obtained from Figure 8b, according to Equation (19):
Equation (20) roughly describes the relationship between the RO circuit frequency and the threshold voltage variation:
The frequency f is proportional to (VDD-Vth)2. Consequently, even a minor variation in the threshold voltage is amplified by the squared relationship, resulting in a significant impact on the frequency. Moreover, the frequency decreases as the threshold voltage increases.
For the power consumption of the RO circuit, dynamic power dominates over static power. Dynamic power arises from the charging and discharging of the output node capacitance. The load capacitance CL is considered to be the sum of the following three capacitance components:
Here, Cdiff is the junction capacitance of the source/drain regions of the MOS transistors connected to the output node, Cnet is the parasitic capacitance of the metal interconnects, and Cgate is the gate capacitance of the NMOS and PMOS transistors in the next-stage inverter:
Here, Cox is the gate-oxide capacitance.
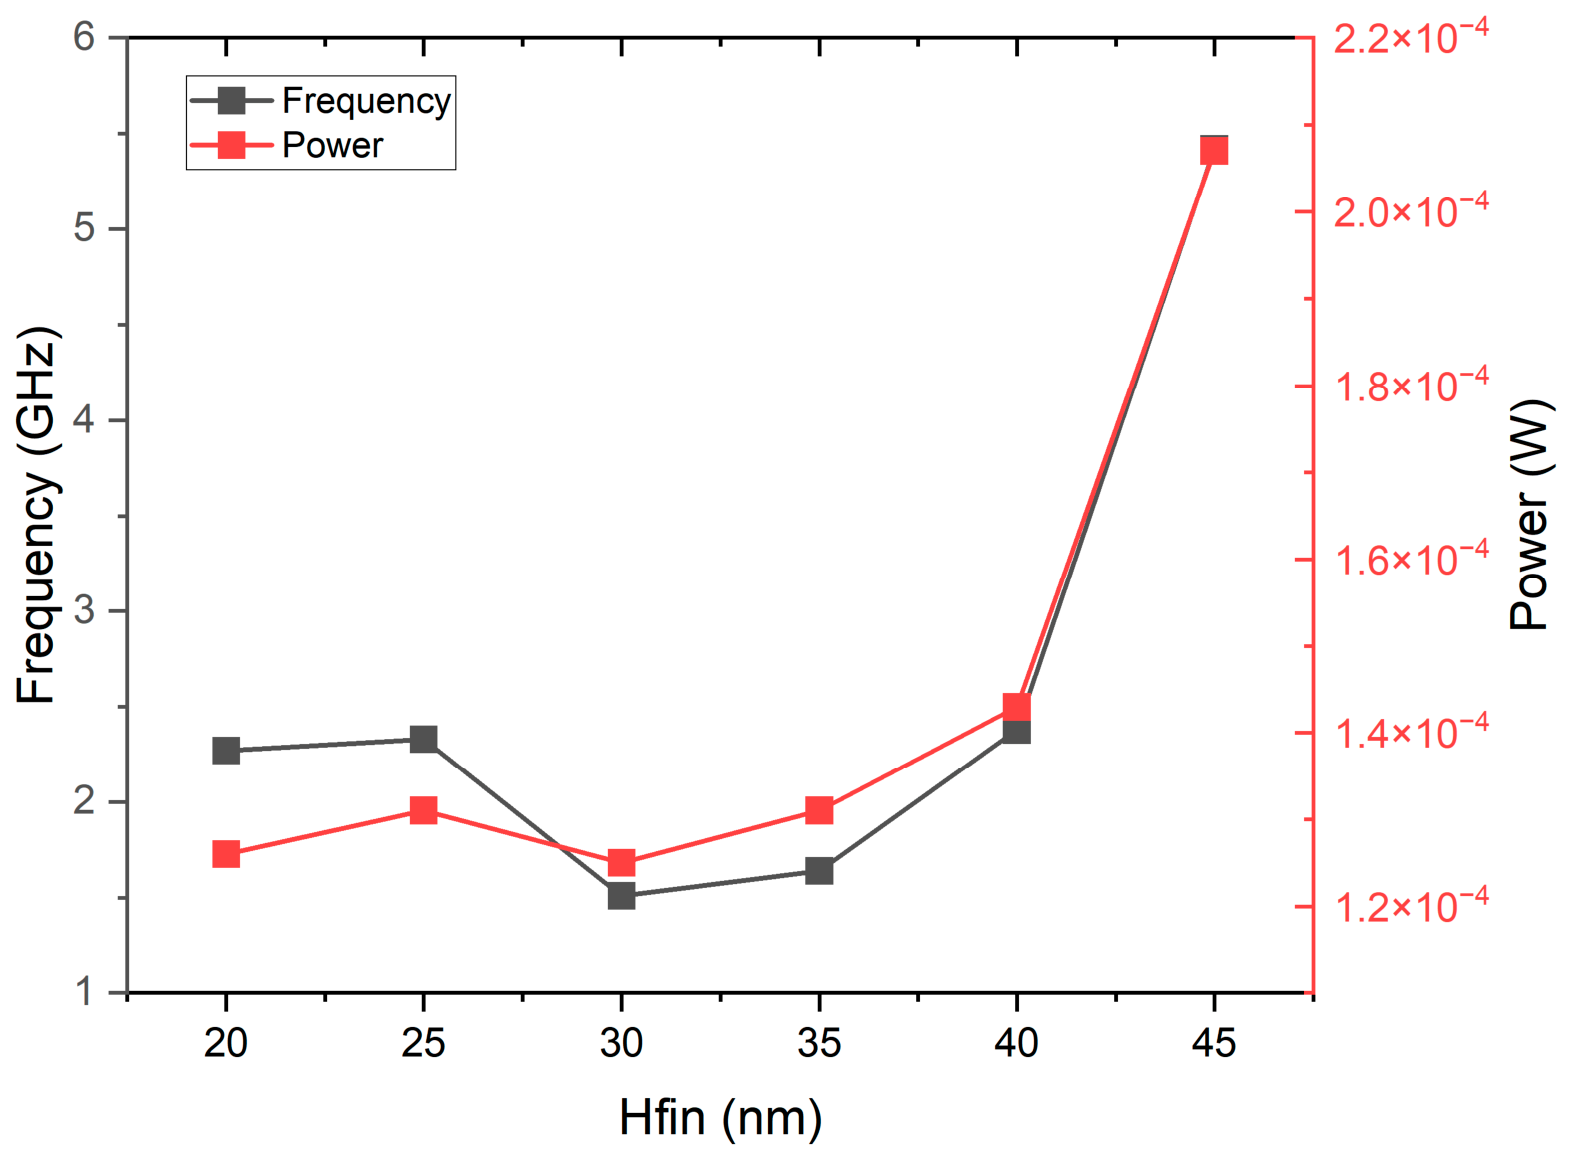
Taking Hfin the target process parameter for optimization, the optimal value within the range of 20 nm to 45 nm was determined with a step size of 5 nm. The resulting simulation results are presented in Table 5 and Figure 9.
Table 5.
Simulation results of circuit frequency and power consumption vs. different Hfin.
Figure 9.
Circuit frequency and power consumption vs. Hfin.
As shown in the table and figure above, over the range of process parameter variations, the circuit frequency varies by up to approximately 350%, while the power consumption varies by up to approximately 165%. For a high-frequency-oriented design, Hfin = 45 nm can be set as the optimal process parameter for achieving high frequency; for a low-power-oriented design, Hfin = 30 nm can be set as the optimal process parameter for achieving low power consumption [21].
3.3. Discussion
As shown in Figure 9, during the increase in HFIN from 20 nm to 45 nm in the 13-stage RO, the variations in frequency and power consumption can be divided into two distinct phases, primarily governed by the trade-off between driving capability and parasitic capacitance.
In the HFIN range of 20 nm to 40 nm, the frequency fluctuates modestly between 1.51 GHz and 2.38 GHz, while the power consumption remains stable at approximately 1.3 × 10⁻⁴ W. An increase in HFIN expands the effective channel width, thereby enhancing the drive current and favoring frequency improvement. However, parasitic capacitances—such as gate capacitance and diffusion capacitance—also grow with increasing fin height, which adversely affects frequency. Between 25 nm and 30 nm, the rapid increase in parasitic capacitance drives the frequency down to its minimum of 1.51 GHz. Subsequently, from 35 nm to 40 nm, improvements in carrier mobility or short-channel effects allow the frequency to recover gradually. Over this entire range, the overall power consumption remains relatively stable because the product of frequency and capacitance does not significantly change.
When HFIN reaches 45 nm, a clear performance turning point emerges: the frequency jumps sharply to 5.42 GHz, approximately 2.3 times the previous level, while power consumption also rises markedly to 2.07 × 10⁻⁴ W, about 1.6 times the prior value. This abrupt change stems from the enhancement of device mobility attributable to dimensional scaling.
As shown above, the key parameters provided in the sensitivity table (Key Device Electrical Characteristics vs. Process Parameters) are inadequate for circuit design optimization analysis. In addition to being sensitive to threshold voltage and drive current, RO circuits also need to consider key electrical parameters such as parasitic capacitance (including the three types of capacitance shown in Equation (18)). Since different types of circuits focus on different aspects, they need to be determined on a case-by-case basis for specific circuits.
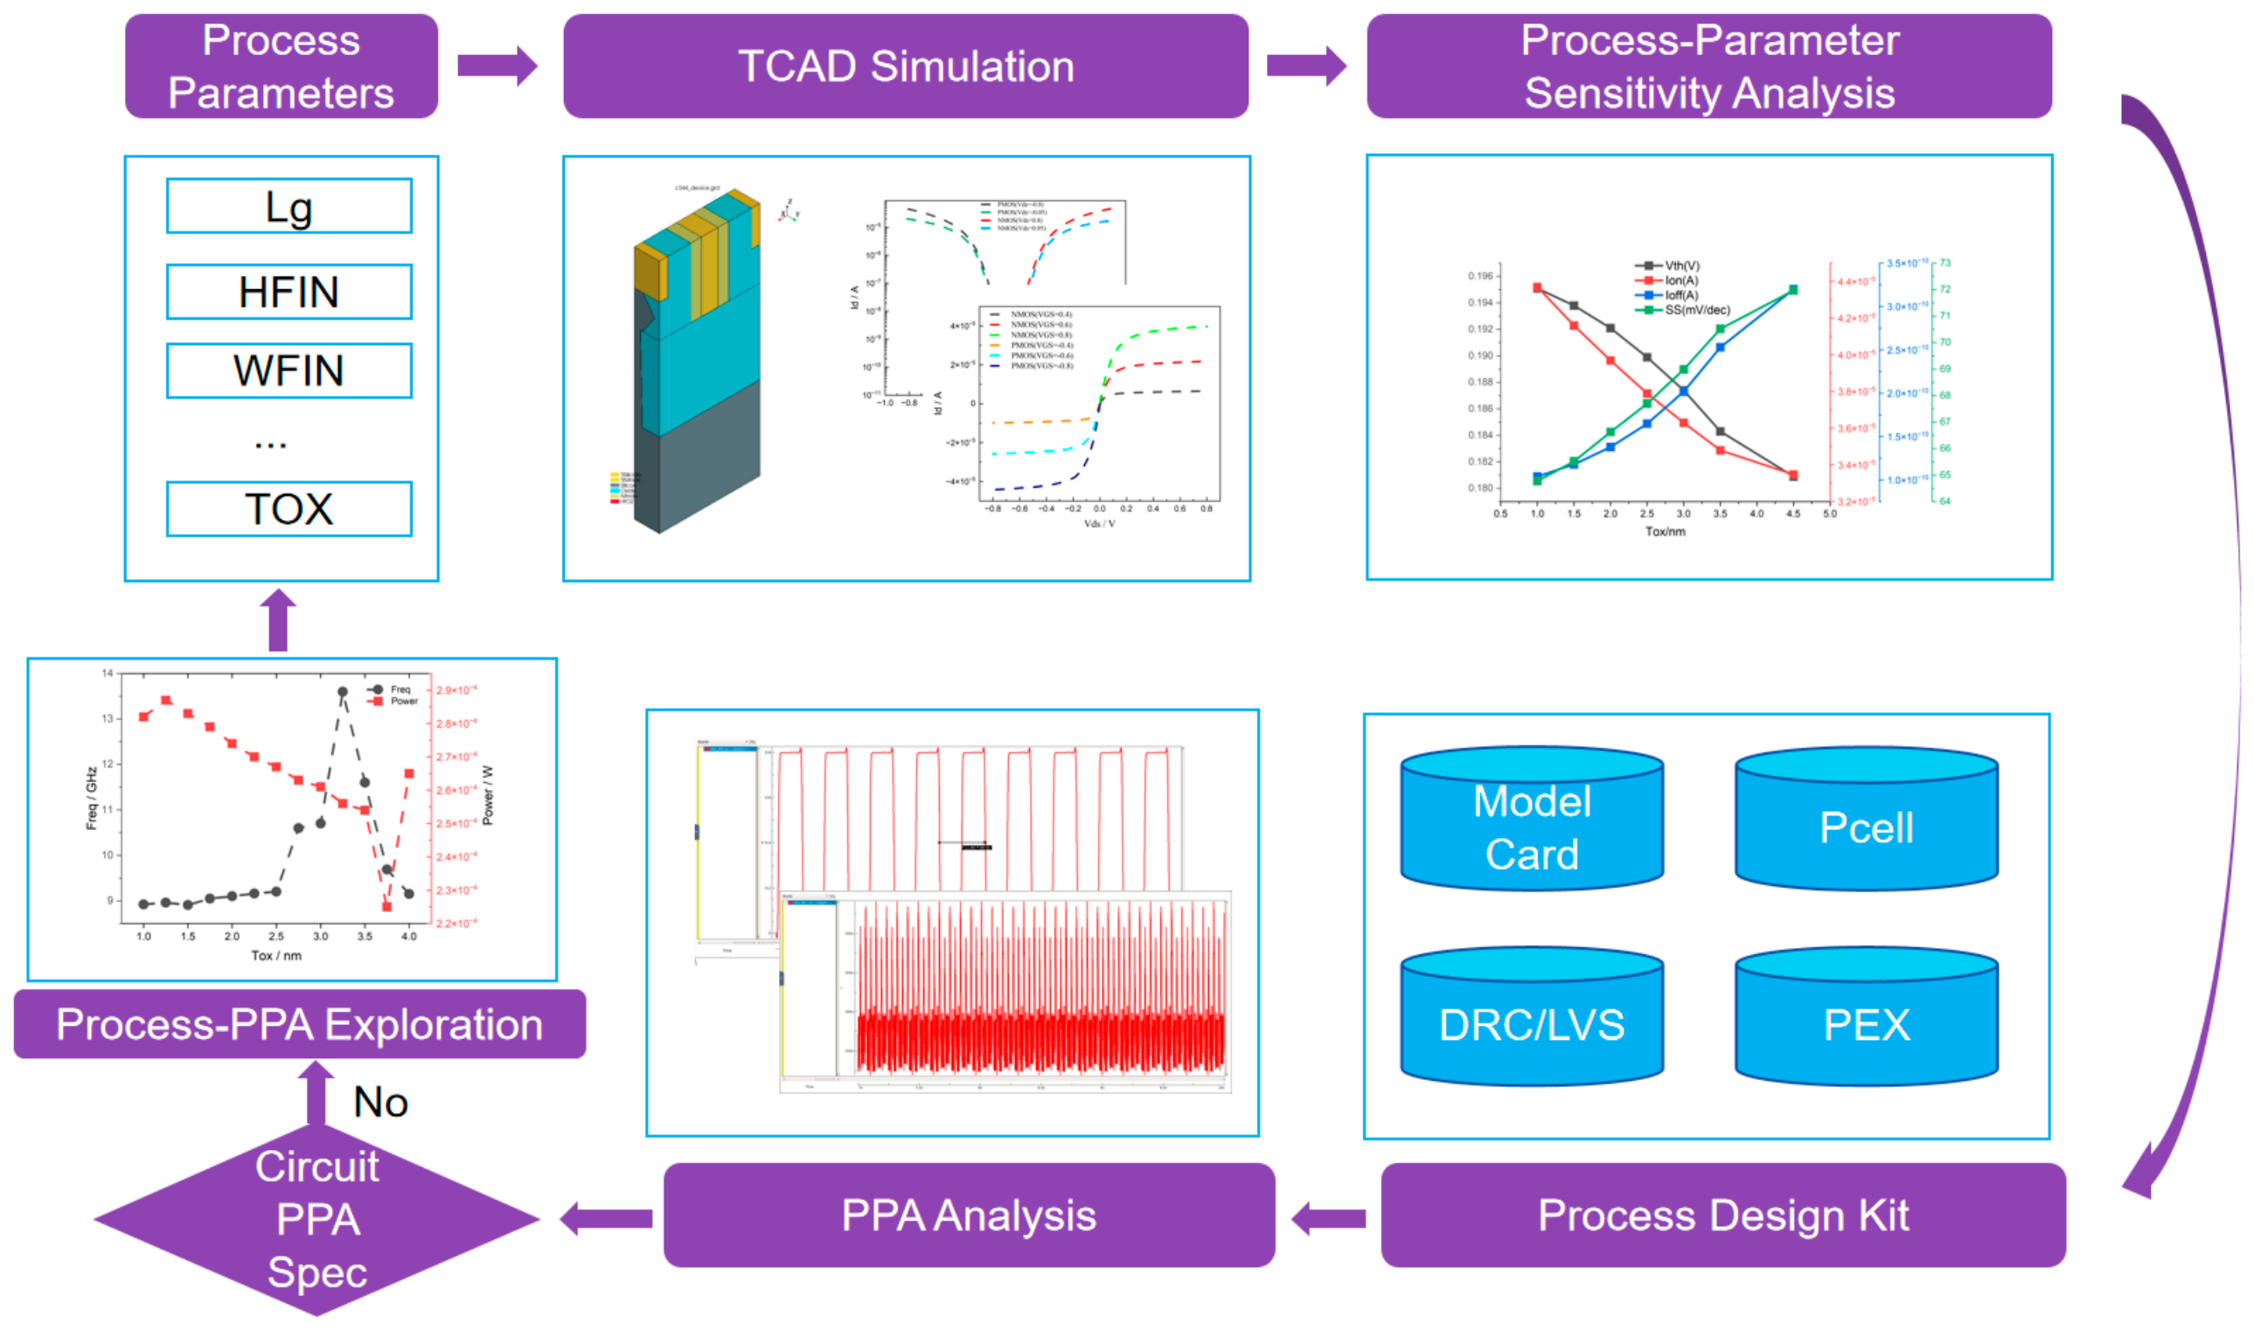
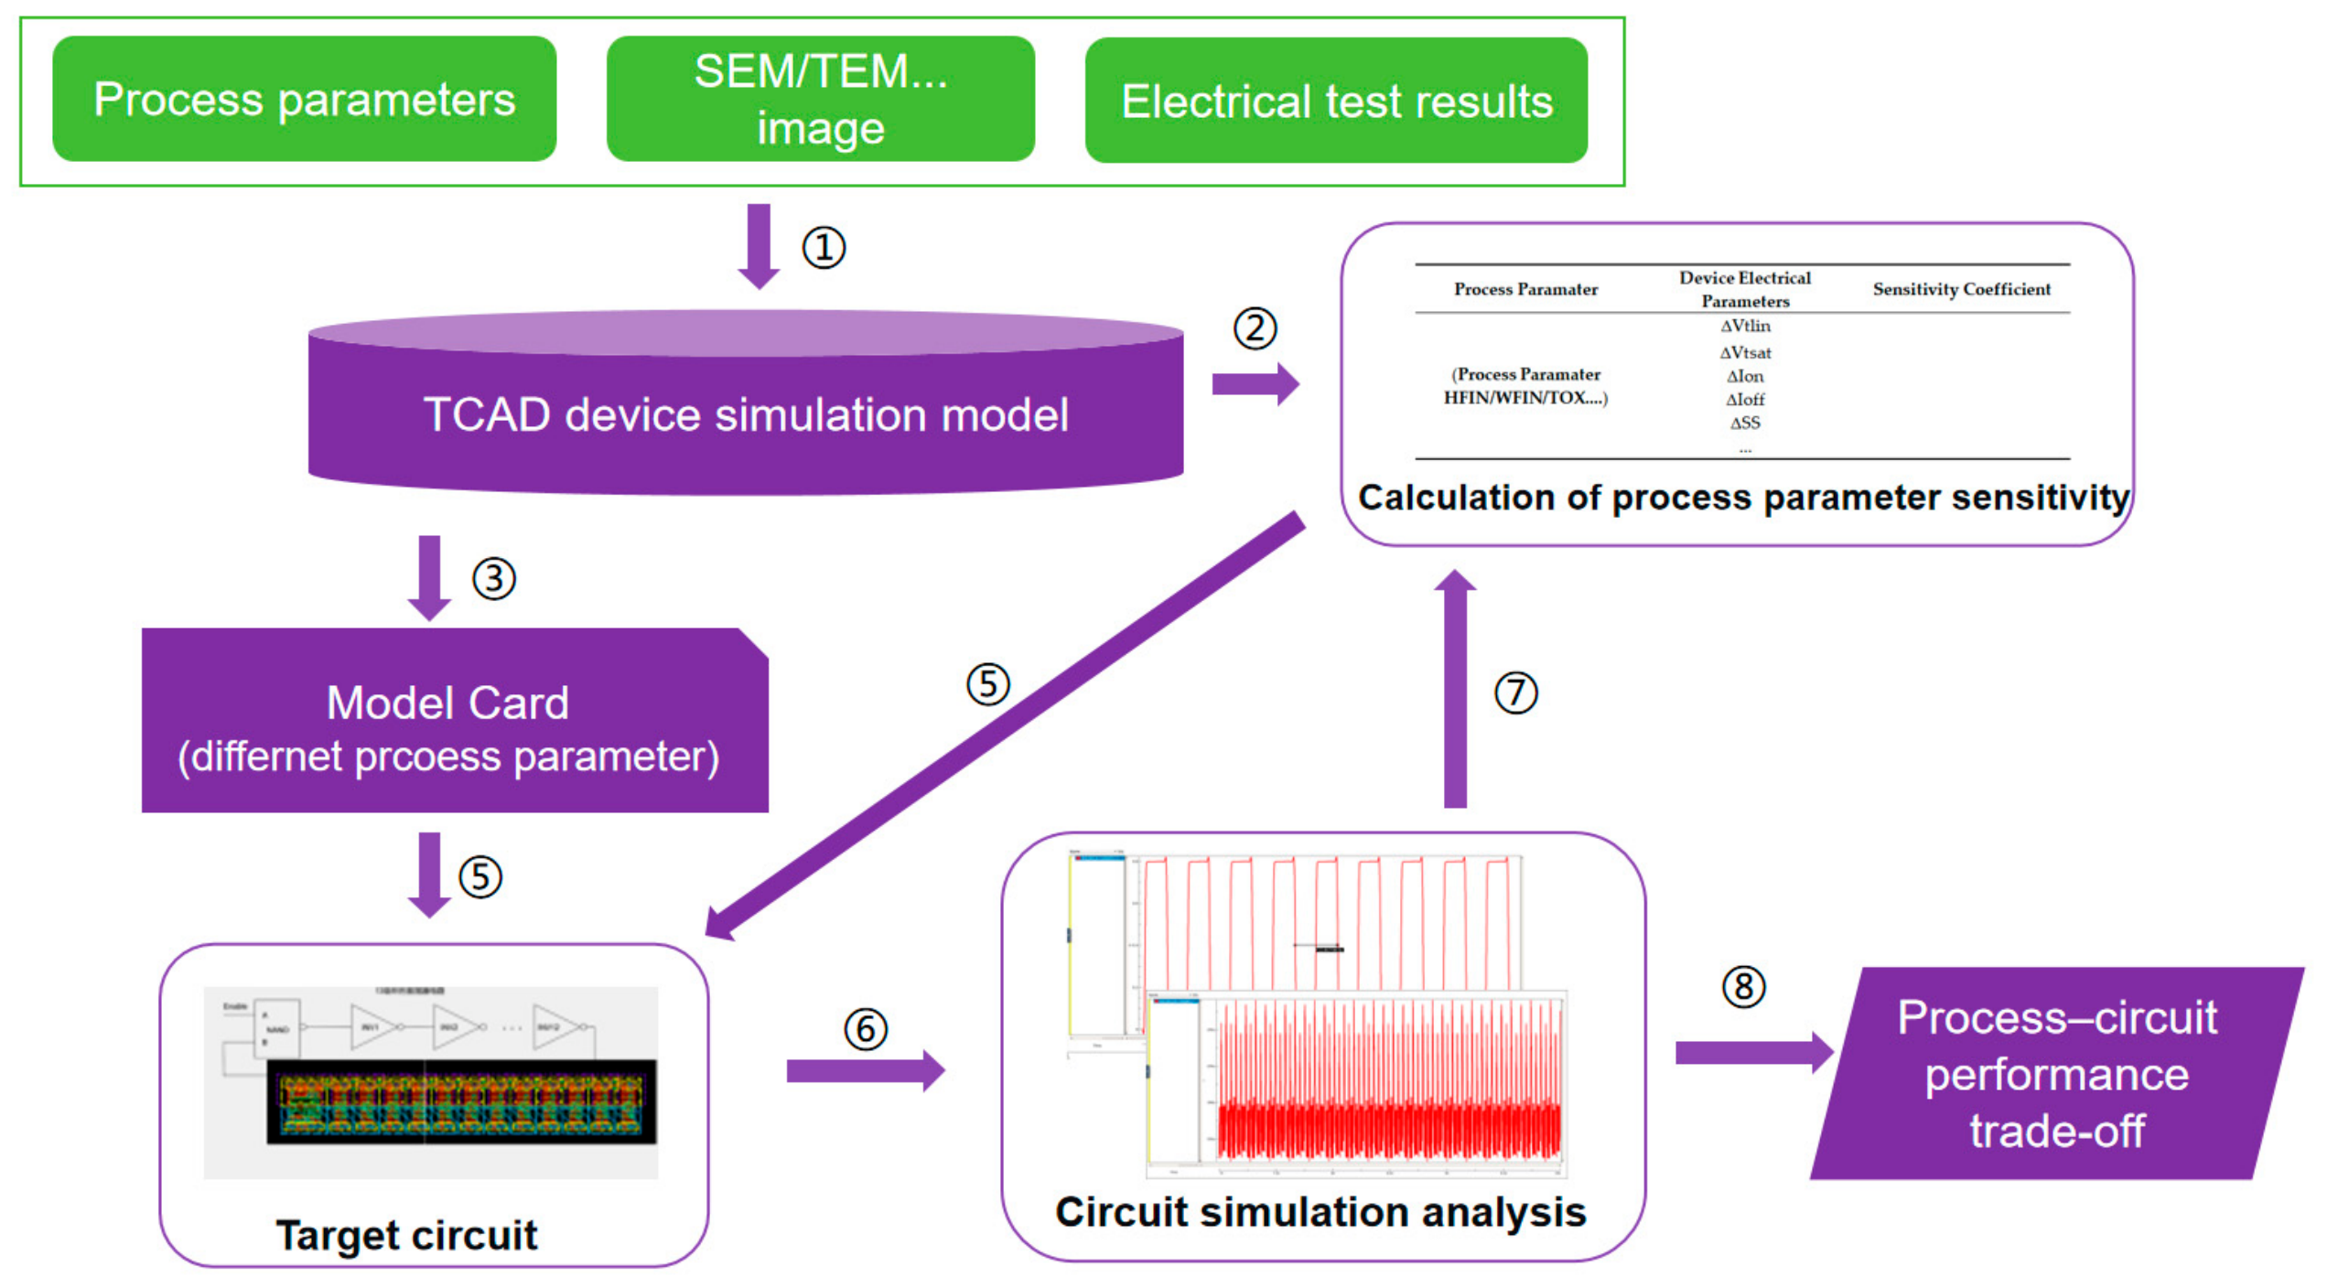
Based on the basic DTCO framework shown in Figure 6, the DTCO flow based on process parameter sensitivity analysis is further determined, as illustrated in Figure 10 below.
Figure 10.
DTCO flow based on process parameter sensitivity analysis.
In this DTCO flow, the TCAD simulation model is first calibrated based on the actual device structure, process parameters, and measured electrical test results. Based on the calibrated TCAD model, a sensitivity analysis of different key parameters with respect to various process parameters is performed, and the optimization range of the process parameters is determined. Based on the determined process parameters, the model card file is simulated and automatically extracted for target circuit simulation. Process sensitivity analysis provides exploration of the impact of the most critical parameters. If the current process parameter sensitivity results are insufficient to support circuit simulation exploration, the process sensitivity results for circuit-related electrical parameters are further extended. Finally, the process parameters are determined under different performance–power trade-offs.
It is worth noting that the current DTCO framework does not fully cover the reliability analysis results. For example, as HFIN is uniformly increased, the device self-heating effect continuously intensifies, and the resulting temperature rise leads to performance degradation.
As scaling advances to more advanced technology nodes, it is necessary to further incorporate technical requirements such as layout-dependent effects (LDE), line-edge roughness (LER), self-heating effects (SHE), and statistical variability into the framework [8,22,23].
4. Conclusions
To address process optimization for advanced technology nodes, this paper proposes a design-technology co-optimization framework based on process-parameter sensitivity analysis. Taking the optimization of the performance and power consumption of a 13-stage RO circuit with respect to the oxide-thickness process parameter as a case study, simulation-based analysis of the impact of different process parameter values on circuit behavior is performed to determine the process optimization boundaries. Based on the simulation results, the optimal process parameters for maximum performance and minimum power consumption are identified, thereby demonstrating the feasibility of the proposed optimization framework. In future work, we will further investigate the impact of process fluctuations—such as line-edge roughness and random metal-grain orientation—on the sensitivity of process optimization. Additionally, Monte Carlo-based methods will be employed to refine the DTCO framework, enabling a comprehensive consideration of multi-corner scenarios.
Author Contributions
Conceptualization, R.L.; methodology, R.L.; software, R.L. and W.S.; validation, C.L.; investigation; resources, C.L. and L.C.; data curation, R.L.; writing—original draft preparation, R.L.; writing—review and editing, R.L.; visualization, Z.Q.; supervision, L.C.; project administration, C.L.; funding acquisition, C.L. All authors have read and agreed to the published version of the manuscript.
Funding
Project Supported by the National Key Research and Development Program of China: Design Technology Co-optimization Methodology (grant number: 2023YFB4402700). The APC was funded by Chip Cloud Microelectronics Technology Co., Ltd.
Data Availability Statement
All the data are reported in the paper.
Conflicts of Interest
Author Renjie Lu was employed by the Chip Cloud Microelectroniics Co., Ltd. The remaining authors declare that the research was conducted in the absence of any commercial or financial relationships that could be construed as a potential conflict of interest.
Abbreviations
The following abbreviations are used in this manuscript:
| PDK | Process Design kit |
| DTCO | Design-Technology Co-Optimization |
References
- Dunga, M.V.; Lin, C.-H.; Niknejad, A.M.; Hu, C. BSIM-CMG: A compact model for multi-gate transistors. In FinFETs and Other Multi-Gate Transistors; Springer: Boston, MA, USA, 2008; pp. 113–153. [Google Scholar]
- Behera, S.; Maheshwari, O.; Mohapatra, N.R. Benchmarking Optimization Algorithms for BSIM-CMG Compact Model Parameter Extraction. In Proceedings of the 2025 IEEE 7th International Conference on Emerging Electronics (ICEE); IEEE: New York, NY, USA, 2025; pp. 1–4. [Google Scholar]
- Chavez, F.; Tung, C.-T.; Kao, M.-Y.; Hu, C.; Chen, J.-H.; Khandelwal, S. Deep learning-based IV global parameter extraction for BSIM-CMG. Solid-State Electron. 2023, 209, 108766. [Google Scholar]
- Huang, Y.; Li, B.; Wu, Z.; Liu, W. ResNet modeling for 12 nm FinFET devices to enhance DTCO efficiency. Electronics 2024, 13, 4040. [Google Scholar] [CrossRef] [Scilit]
- Asenov, A.; Cheng, B.; Wang, X.; Brown, A.R.; Millar, C.; Alexander, C.; Amoroso, S.M.; Kuang, J.B.; Nassif, S.R. Variability aware simulation based design-technology cooptimization (DTCO) flow in 14 nm FinFET/SRAM cooptimization. IEEE Trans. Electron Devices 2014, 62, 1682–1690. [Google Scholar]
- Peng, B.; Cheng, G.; Wang, R.; Huang, R.; Chan, M.; Zhang, L. A Model-driven Design Technology Co-optimization (DTCO) with Multi-Objective Bayesian Algorithm for Advanced Technology. In Proceedings of the 2025 9th IEEE Electron Devices Technology & Manufacturing Conference (EDTM); IEEE: New York, NY, USA, 2025; pp. 1–3. [Google Scholar]
- Karner, M.; Rzepa, G.; Schleich, C.; Schanovsky, F.; Kernstock, C.; Karner, H.-W.; Baumgartner, O.; Stanojevic, Z. An efficient and accurate DTCO simulation framework for reliability and variability-aware explorations of FinFETs, nanosheets, and beyond. In Proceedings of the 2024 8th IEEE Electron Devices Technology & Manufacturing Conference (EDTM); IEEE: New York, NY, USA, 2024; pp. 1–3. [Google Scholar]
- Patil, S.; Rawat, A.; Ganguly, U. An accurate process-induced variability-aware compact model-based circuit performance estimation for design-technology co-optimization. IEEE Trans. Electron Devices 2021, 69, 45–50. [Google Scholar]
- Qina, Z.; Dong, L.; Chen, L.; Lu, R.; Chen, R.; Wang, Y. Degradation Analysis of 14 nm SOI FinFETs by Influence of Hot Carrier Injection and Self-Heating Synergistic Effects. IEEE Trans. Device Mater. Reliab. 2025, 25, 659–667. [Google Scholar] [CrossRef] [Scilit]
- Rajawat, V.S.; Kumar, A.; Choudhary, B. TCAD simulation of sub-10 nm high-k SOI GaN FinFET by implementing fin optimization approach for high-performance applications. Analog. Integr. Circuits Signal Process. 2025, 122, 1. [Google Scholar] [CrossRef] [Scilit]
- Xiong, S.; Bokor, J. Sensitivity of double-gate and FinFETDevices to process variations. IEEE Trans. Electron Devices 2003, 50, 2255–2261. [Google Scholar] [CrossRef] [Scilit]
- Sharma, V.; Kumar, A.; Bhatt, V.; Gupta, N.; Jain, A.; Goyal, A.K. Gate Electrode Work Function Engineered FinFET for Improved Performance. In Proceedings of the 2025 1st IEEE Uttar Pradesh Section Women in Engineering International Conference on Electrical Electronics and Computer Engineering (UPWIECON); IEEE: New York, NY, USA, 2025; pp. 49–53. [Google Scholar]
- Amrouch, H.; van Santen, V.M.; Prakash, O.; Kattan, H.; Salamin, S.; Thomann, S.; Henkel, J. Reliability challenges with self-heating and aging in finfet technology. In Proceedings of the 2019 IEEE 25th International Symposium on On-Line Testing and Robust System Design (IOLTS); IEEE: New York, NY, USA, 2019; pp. 68–71. [Google Scholar]
- Subramanian, V.; Mercha, A.; Parvais, B.; Loo, J.; Gustin, C.; Dehan, M.; Collaert, N.; Jurczak, M.; Groeseneken, G.; Sansen, W. Impact of fin width on digital and analog performances of n-FinFETs. Solid-State Electron. 2007, 51, 551–559. [Google Scholar] [CrossRef] [Scilit]
- Lee, Y.; Shin, C. Impact of equivalent oxide thickness on threshold voltage variation induced by work-function variation in multigate devices. IEEE Trans. Electron Devices 2017, 64, 2452–2456. [Google Scholar] [CrossRef] [Scilit]
- Gavin, H.P. The Levenberg-Marquardt Algorithm for Nonlinear Least Squares Curve-Fitting Problems; Department of Civil and Environmental Engineering, Duke University: Durham, NC, USA, 2019; Volume 3, p. 4. [Google Scholar]
- Zhang, J.; Dou, J.; Shen, Y.; Ye, B.; Li, X.; Shi, Y.; Zhang, Y.; Sun, Y. APEX: Automating Parameter Extraction of Compact Models with Differential Neural Network Approximation. In Proceedings of the 2025 International Symposium of Electronics Design Automation (ISEDA); IEEE: New York, NY, USA, 2025; pp. 622–627. [Google Scholar]
- Liu, H.-H.; Catthoor, F. Circuit-Technology Co-Optimization of SRAM Design in Advanced CMOS Nodes; Springer: Cham, Switzerland, 2025. [Google Scholar]
- Qu, W.; Hou, L.M.; Sun, X.X.; Sun, J.Y.; Li, L.Y. The Design of Bandgap Reference Based on Empyrean Aether Software. Appl. Mech. Mater. 2014, 687, 3489–3493. [Google Scholar] [CrossRef] [Scilit]
- Li, Y.; Yang, Y.; Wang, M.; Nie, T. A Two-Point Modulation Voltage Controlled Oscillator Design and Implementation: Design and Implementation. In Proceedings of the 2018 IEEE International Conference on Signal Processing, Communications and Computing (ICSPCC); IEEE: New York, NY, USA, 2018; pp. 1–6. [Google Scholar]
- Gilardi, C. Design Technology Co-optimization of Energy-Efficient Digital Logic Using Carbon Nanotubes. Ph.D. Thesis, Stanford University, Stanford, CA, USA, 2024. [Google Scholar]
- Bardon, M.G.; Moroz, V.; Eneman, G.; Schuddinck, P.; Dehan, M.; Yakimets, D.; Jang, D.; Van der Plas, G.; Mercha, A.; Thean, A. Layout-induced stress effects in 14 nm & 10 nm FinFETs and their impact on performance. In Proceedings of the 2013 Symposium on VLSI Technology; IEEE: New York, NY, USA, 2013; pp. T114–T115. [Google Scholar]
- Jang, D.; Jung, S.-G.; Min, S.-J.; Yu, H.-Y. Electrothermal characterization and optimization of monolithic 3D complementary FET (CFET). IEEE Access 2021, 9, 158116–158121. [Google Scholar] [CrossRef] [Scilit]

Disclaimer/Publisher’s Note: The statements, opinions and data contained in all publications are solely those of the individual author(s) and contributor(s) and not of MDPI and/or the editor(s). MDPI and/or the editor(s) disclaim responsibility for any injury to people or property resulting from any ideas, methods, instructions or products referred to in the content. |
© 2026 by the authors. Licensee MDPI, Basel, Switzerland. This article is an open access article distributed under the terms and conditions of the Creative Commons Attribution (CC BY) license.