


Abstract
Wavelet denoising is used before side-channel power analysis, but SNR/MSE may not reflect key recovery. This paper evaluates five wavelet methods for measurement-driven DPA/CPA evaluation. On ATMEGA16A AES-128 traces, TH, MOD, TI, WP and GHM are compared under the same dataset and attack flow, using peak separability, correlation stability, trace demand and cost. Denoising and attack rankings differ. In first-byte DPA, GHM achieves 100% success with 387 traces and DPA-SNR about 21.7; TI needs 502 traces and reaches 17.8. In 16-byte CPA, TI performs best overall, with a mean correlation 0.2719 and cumulative trace demand of 2921; MOD has the lowest maximum byte threshold, 647. No method is optimal for all attack statistics. DPA favors peak fidelity and false-peak suppression, CPA favors covariance stability and shift-invariant smoothing, and TI is a practical compromise under attack-path or cost constraints. These conclusions are framed as dataset- and attack-statistic-specific evidence for the measured unprotected ATMEGA16A AES-128 implementation, rather than as a universal ranking of wavelet denoising methods.
1. Introduction
Side-channel attacks infer secret information from physical leakage such as timing behavior and power consumption [1,2]. In power analysis, secret keys are inferred by measuring the power leakage of a cryptographic device during execution, and this is an important technique for evaluating implementation security. Measured power traces normally contain electronic noise, trigger errors, transition noise, and unrelated system activity. Denoising preprocessing therefore changes the separability and stability of the subsequent attack statistics [3,4].
In distributed information systems, embedded nodes, and edge devices, cryptographic algorithms are commonly deployed as software or lightweight hardware on concrete devices. Even when the upper-layer protocol satisfies formal security requirements, physical leakage from the lower-layer implementation may still affect the security evaluation of secure information systems. This paper does not study distributed-system architecture or system-level countermeasures; it focuses on the power-measurement evaluation step for the underlying cryptographic implementation [4,5].
From the viewpoint of measurement-driven security evaluation, trace acquisition, denoising preprocessing, attack-statistic computation, and key-recovery decision form a continuous evaluation chain. Although denoising appears to be a signal-processing problem, its output directly changes the conditional mean difference used by differential power analysis (DPA) and the correlation-peak structure used by correlation power analysis (CPA). More broadly, power-analysis attacks, including profiled attacks, make decisions from statistical relations between leakage and key-dependent variables. Denoising should therefore be assessed from attack statistics rather than from ordinary waveform reconstruction quality alone [6,7,8].
Similar studies have approached this problem from several directions. Classical side-channel analysis established DPA, CPA, template attacks, and fair evaluation principles [2,6,7,9,10]. Signal-preprocessing studies have used fourth-order cumulants, wavelet transforms, wavelet packets, GHM multiwavelets, autoencoder-based denoising, and data-preprocessing optimization to improve attack effectiveness [11,12,13,14,15,16,17]. Adaptive decomposition and dependence-based distinguishers, such as empirical mode decomposition and mutual information analysis, also provide relevant extensions for nonlinear or non-stationary leakage analysis [18,19,20]. These studies show that preprocessing can change side-channel attack outcomes, but they do not provide a unified comparison of several wavelet-family denoising outputs under both DPA and CPA attack statistics on the same measured trace set.
Based on this position, the objective of this paper is not to propose a new wavelet basis, reconstruction algorithm, or attack algorithm. Instead, under the same data platform and attack flow, it establishes an evaluation route linking attack statistics, denoised-output characteristics, and method selection. This route follows the general requirement in side-channel evaluation that methods should be compared under consistent statistical criteria and fair attack settings [9,10].
Recent attack-oriented studies in other signal domains also show the importance of judging transformations by the downstream attack objective rather than by source-domain signal quality alone. For example, Fu et al. studied transferable adversarial attacks for remote-sensing object recognition and image classification using spatial-frequency co-transformation and hierarchical transformation composition [21,22]. Although these studies address remote-sensing imagery rather than side-channel leakage, they illustrate a broader evaluation principle: a preprocessing or transformation method should be assessed by the statistic that drives the final attack decision. The present work applies this principle to measured power traces by evaluating wavelet denoising through DPA and CPA decision statistics.
Wavelet denoising provides time-frequency localization and multiresolution analysis, which make it suitable for power-trace preprocessing. However, ordinary SNR/MSE and visual smoothness mainly describe signal reconstruction quality and cannot directly represent key-recovery efficiency [23,24,25]. Translation-invariant denoising further reduces the shift sensitivity of discrete wavelet denoising [26].
DPA relies on a local differential peak formed by conditional mean differences. The central question is whether the correct-key peak can be separated from background fluctuation and false peaks. CPA relies on the correlation structure between a theoretical power model and measured power traces, and is more sensitive to covariance relations and correlation stability over the sample set. The same denoising method may therefore exhibit different rankings in DPA and CPA scenarios.
The experimental results show that a method with better ordinary denoising metrics does not necessarily achieve better attack performance on measured traces. Comparing ordinary denoising simulation results with ATMEGA16A-AES measured power-attack results, this paper finds inconsistent rankings: GHM multiwavelet denoising performs better in the first-byte DPA case, whereas translation-invariant wavelet denoising is more robust in the 16-byte CPA statistics. This indicates that wavelet-denoising evaluation should shift from ordinary reconstruction quality to attack-statistic adaptability.
This paper uses measured power traces from an unprotected AES-128 software implementation on an ATMEGA16A platform to evaluate five wavelet denoising methods: thresholding (TH), modulus maxima (MOD), translation-invariant wavelet denoising (TI), wavelet packet denoising (WP), and GHM multiwavelet denoising. Preprocessing time and trace demand are further combined to derive DPA/CPA-oriented selection criteria.
The main contributions are therefore threefold. First, the paper formulates an attack-statistic-oriented evaluation route for denoising selection, rather than proposing a new wavelet or attack algorithm. This route separates ordinary reconstruction metrics from DPA differential-peak separability and CPA correct-key correlation. Second, it compares TH, MOD, TI, WP, and GHM under the same measured ATMEGA16A-AES dataset, attack workflow, candidate-key enumeration, and trace-increment rule. The comparison shows that first-byte DPA and 16-byte CPA favor different denoised-output properties. Third, it combines attack-statistic performance with preprocessing time, so that the final method-selection criterion reflects both trace demand and computational cost.
The remainder of this paper is organized as follows. Section 2 introduces the DPA/CPA decision statistics and the wavelet denoising methods considered in this study. Section 3 defines the attack-statistic-oriented evaluation metrics, normalization procedure, and method-selection framework. Section 4 describes the measured dataset, preprocessing setup, attack protocol, and applicable boundary. Section 5 presents the DPA and CPA results, statistical summaries, preprocessing-cost analysis, and method-selection discussion. Section 6 concludes the paper and outlines future validation directions.
2. Attack Statistics and Wavelet Denoising Methods
2.1. Decision Statistics of DPA and CPA
Let the i-th power trace be , where t denotes the sample index and k denotes a candidate subkey. DPA constructs a selection function from a candidate-key-dependent intermediate value, partitions the traces into two groups according to , and computes the difference between the two sample means according to Equation (1) [2]:
When k is the correct key, the selection function is related to the real intermediate value, and the power difference near the target instant appears as a differential peak in . When k is wrong, the grouping is approximately random and the differential curve usually remains close to background fluctuation. DPA decisions therefore depend on the separability of the correct-key differential peak from background and wrong-key peaks.
CPA constructs a theoretical power vector for each candidate subkey. In AES software implementations, this vector can be obtained from the Hamming weight or Hamming distance of an intermediate value. It is then correlated with the measured power vector at each sample point according to Equation (2) [6]:
The correct key is more consistent with the real leakage and is therefore more likely to produce a high correlation peak in the target time window. Unlike the grouping mean difference in DPA, the CPA statistic is jointly affected by the theoretical leakage model, sample covariance, and measured-power variance.
2.2. Requirements of Attack Statistics for Denoised Outputs
The above statistics imply different requirements for DPA and CPA. DPA is driven by local peak separability: after denoising, the target leakage peak should be retained, peak-position drift should be limited, over-broadening or over-sharpening should be avoided, and false peaks caused by ringing, boundary effects, or threshold truncation should be suppressed. If the effective leakage peak is weakened, or if pseudo-peaks close to the correct peak appear at non-target instants, ordinary reconstruction quality may be high while DPA efficiency decreases.
CPA is driven by global correlation-structure stability. Denoised outputs should reduce variance unrelated to the target intermediate value without destroying the covariance relation between the theoretical power vector and the measured power vector. Pseudo-oscillations may alter the correlation structure at multiple sample points, and excessive local reconstruction may increase irrelevant variance or amplify accidental correlation. CPA therefore emphasizes stable correlation estimation, balanced cross-byte correlation levels, and improvement of weak-byte lower bounds.
This paper distinguishes three metrics that are often mixed. Ordinary reconstruction SNR/MSE measures similarity between the denoised signal and a reference signal; DPA-SNR in this paper measures the separability of the correct differential peak from background fluctuation and false peaks; CPA correlation coefficients measure the linear relation between the theoretical power model and the measured traces. These metrics have different statistical objects and cannot replace one another.
2.3. Wavelet Denoising Methods and Output Characteristics
Wavelet thresholding (TH) usually suppresses broadband noise through wavelet decomposition, threshold shrinkage, and reconstruction [24]. Its main advantage is a simple and clear processing flow. Its risk is that the threshold selection affects the separation between effective leakage and noise; an overly strong threshold may remove leakage-related details, and hard thresholding may introduce local discontinuities that affect differential peaks or correlation structures.
The wavelet modulus maxima method (MOD) identifies and retains abrupt structures by exploiting the propagation of singularities in scale space. This mechanism is theoretically favorable for peak-sensitive statistics, but extrema-chain search and cross-scale reconstruction introduce higher computational complexity. Preserving local abrupt changes does not automatically imply better global smoothness or correlation stability [27].
Translation-invariant wavelet denoising (TI) reduces the shift sensitivity of the discrete wavelet transform through circular shifts, threshold denoising, inverse shifts, and averaging [26]. This averaging mechanism helps suppress pseudo-Gibbs effects and local oscillations caused by sampling alignment, and is therefore favorable to CPA correlation stability. However, repeated shift averaging may also change local peak sharpness, so its DPA adaptability must be judged from attack statistics.
Wavelet packet denoising (WP) further subdivides both low-frequency and high-frequency subbands and provides finer frequency-band partitions than ordinary wavelet decomposition [28]. Its risk is that effective leakage and noise may be mixed in high-frequency subbands. If the basis, decomposition depth, or thresholding strategy is not suitable, attack-related components may be weakened while noise is suppressed.
GHM multiwavelet denoising uses multiple scaling functions and mother wavelets, combining compact support, symmetry, and high approximation ability [29,30,31]. It is favorable for local-structure reconstruction and spike-shape preservation. The cost is that one-dimensional traces usually need preprocessing into a multidimensional form and postprocessing back to one-dimensional sequences after denoising. Its local-structure advantage also does not necessarily transfer to CPA global-correlation superiority.
In summary, attack statistics determine evaluation targets, and denoising methods determine output morphology. The following sections analyze the adaptability of the five wavelet methods in DPA and CPA along the chain of attack statistics, signal characteristics, and denoising mechanisms, and then discuss the relationship between statistical gain and preprocessing cost.
2.4. Difference Between Ordinary Denoising Quality and Attack Performance
Ordinary reconstruction SNR and MSE are common metrics for signal-denoising quality. If only these metrics are used, TH is naturally ranked near the top, because in the Bumps-signal denoising simulation used in this study it obtains the highest reconstructed SNR and the lowest MSE. The problem is that side-channel attacks do not decide by reconstruction similarity; they decide by attack statistics such as DPA differential peaks and CPA correlation coefficients.
In practical evaluation scenarios, the distinction is operational. A conventional denoising metric asks whether the processed waveform is closer to a reference waveform. An attack-statistic metric asks whether a fixed attack rule identifies the correct key with fewer traces, higher differential-peak separability, or more stable correct-key correlation. Therefore, the same denoised trace can be judged differently depending on whether the evaluator optimizes waveform reconstruction or key-recovery evidence.
Table 1 gives the key Bumps-signal denoising results. The Bumps signal is used only for ordinary denoising-quality comparison and does not represent a measured power-attack experiment. In all five input-SNR cases, TH obtains the highest reconstructed SNR and the lowest MSE, while GHM is usually below TH and TI/WP are close to each other. If only ordinary signal-reconstruction quality is considered, TH would be ranked first.
Table 1.
Comparison of ordinary signal-denoising metrics.
However, the measured ATMEGA16A-AES attack results show a different ranking: GHM ranks first in the first-byte DPA scenario, and TI is more robust in the CPA scenario. This indicates that ordinary denoising-metric ranking and attack-metric ranking are inconsistent. Ordinary SNR/MSE describes reconstruction relation to the simulation reference signal, but it is insufficient as the sole basis for side-channel preprocessing selection.
The reason is that the evaluation objects are different. SNR/MSE measures similarity between the reconstructed and reference signals; DPA depends on local differential-peak fidelity, peak-position stability, and false-peak suppression; CPA depends on global correlation stability and covariance-structure stability. A method may obtain low MSE on an ordinary signal but still be unsuitable for the differential-peak morphology or correlation structure of a specific attack. Therefore, ordinary denoising metrics are informative but cannot be the only criterion for DPA/CPA preprocessing [11,12,13].
3. Evaluation Metrics for Attack-Statistic-Oriented Wavelet Denoising
3.1. Evaluation Objects and Candidate Methods
The evaluation objects include the attack type A, the candidate method set M, the attack-statistic metric set, the cost metric set C, and an optional cost constraint B. Here , and . Ori denotes the original, non-denoised traces and serves as the baseline for measuring the benefit of denoising.
If the attack path is not fixed, A can be set to a joint DPA/CPA evaluation. If the attack objective is clear, only the corresponding metrics are enabled. In this paper, the DPA evaluation is mainly based on AES first-byte results, whereas the CPA evaluation uses 16-byte statistical results.
3.2. Attack-Statistic and Cost Metrics
DPA metrics include DPA-SNR, the number of traces required for 100% successful attack, peak stability, and key ranks output by the attack program. DPA-SNR and peak stability are positive metrics, whereas required traces and key rank are negative metrics. The subsequent comparison uses first-byte DPA-SNR and the number of traces for 100% success.
For reproducibility, DPA-SNR is defined directly from the DPA difference traces in the selected attack window. For a key hypothesis k, let denote the DPA difference trace at sample t within the attack window W. The peak statistic for the candidate is defined by Equation (3):
Let be the correct subkey, , and be the wrong-key peak set. The attack-oriented DPA-SNR is then defined by Equation (4):
Equations (3) and (4) define the candidate peak statistic and the corresponding correct-key separability measure, respectively. This definition measures correct-key peak separability against wrong-key peak fluctuation. The reported DPA-SNR values are computed from the first-byte DPA summaries generated by the fixed attack workflow. The formula is included to specify the attack-oriented statistic used in this comparison and to distinguish it from ordinary reconstruction SNR.
CPA metrics include the mean correct-key correlation coefficient, the minimum weak-byte correlation coefficient, cumulative trace demand, maximum byte threshold, and number of winning bytes. The mean correlation, weak-byte lower bound, and winning-byte count are positive metrics; cumulative trace demand and maximum byte threshold are negative metrics. This setup covers overall correlation level, weak-byte lower bound, cumulative per-byte cost, and the most difficult byte constraint.
Pearson correlation is used as the primary CPA statistic because CPA explicitly evaluates the linear relation between the hypothetical leakage vector and measured power samples. The same evaluation route can be extended to other similarity or dependence measures. Spearman correlation can be used when monotonic nonlinear relations are expected, normalized cross-correlation or cosine similarity can compare peak-shape similarity under different scaling assumptions, and mutual information can capture nonlinear statistical dependence between leakage models and traces [18]. These alternatives require trace-level samples, a leakage model, an attack window, and estimator settings, so they are discussed as extensible metrics rather than as additional numerical results in the present aggregate comparison.
Cost metrics include the preprocessing time for 10,000 traces and the linearly estimated time required to reach the target success rate. The estimated time is defined by Equation (5):
This metric is used only for trend comparison among methods and does not replace actual per-method runtime measurement.
3.3. Metric Normalization and Comprehensive Evaluation
To avoid directly adding metrics with different dimensions, min–max normalization is used. For a positive metric j, Equation (6) is used,
and for a negative metric j, Equation (7) is used:
If a metric has the same value for all methods, it does not provide discrimination and can be assigned a neutral value or removed from the current scoring round.
The DPA comprehensive score can be written as Equation (8):
where the available metrics may include DPA-SNR, 100% success traces, peak stability, and key rank. The CPA comprehensive score can be written as Equation (9):
where the available metrics may include mean correct-key correlation, weak-byte lower bound, cumulative trace demand, maximum byte threshold, and winning-byte count.
The cost score is defined by Equation (10):
where all cost metrics are normalized as negative metrics. Under a cost constraint, the trade-off score is given by Equation (11):
The attack score can be , , or a weighted combination. If statistical performance is emphasized, the attack-metric weight should be increased; if engineering overhead is emphasized, the cost weight should be increased; if the attack path is unclear, cross-DPA/CPA robustness can receive higher weight.
Other normalization schemes can also be used after metric directions are aligned. Min–max normalization is used here because it keeps the normalized scores bounded between zero and one and preserves the interpretation of positive and negative metric directions. To check whether the overall conclusion is tied to this choice, a summary-metric sensitivity audit was performed using the existing aggregate DPA-SNR, DPA success-trace, CPA correlation, CPA trace-demand, and CPA winning-byte arrays. This audit is not a raw-trace normalization experiment. It only tests the score-level robustness of the heterogeneous metric aggregation.
Table 2 shows that TI remains the first-ranked method under min–max, z-score, and rank-based scoring in this summary-level audit. Direct raw averaging is not used because trace-count variables and correlation variables have different units and scales, so an unnormalized average would be dominated by large-magnitude trace-demand metrics.
Table 2.
Summary-level sensitivity of comprehensive ranking to normalization scheme.
The metric weights in the score equations should be interpreted as objective-dependent evaluation settings rather than optimized universal constants. To reduce arbitrariness, a summary-level weight-sensitivity analysis was performed using the available aggregate metrics: first-byte DPA-SNR, first-byte DPA success traces, 16-byte CPA mean and minimum correlation, 16-byte CPA cumulative and maximum trace demand, and measured preprocessing time for 10,000 traces.
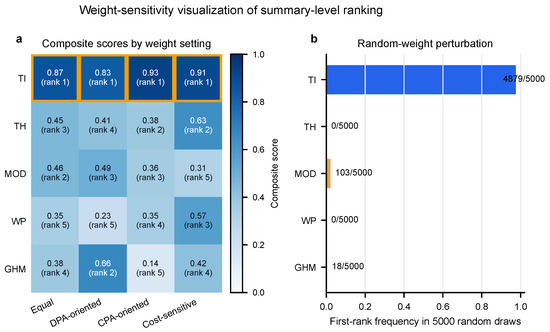
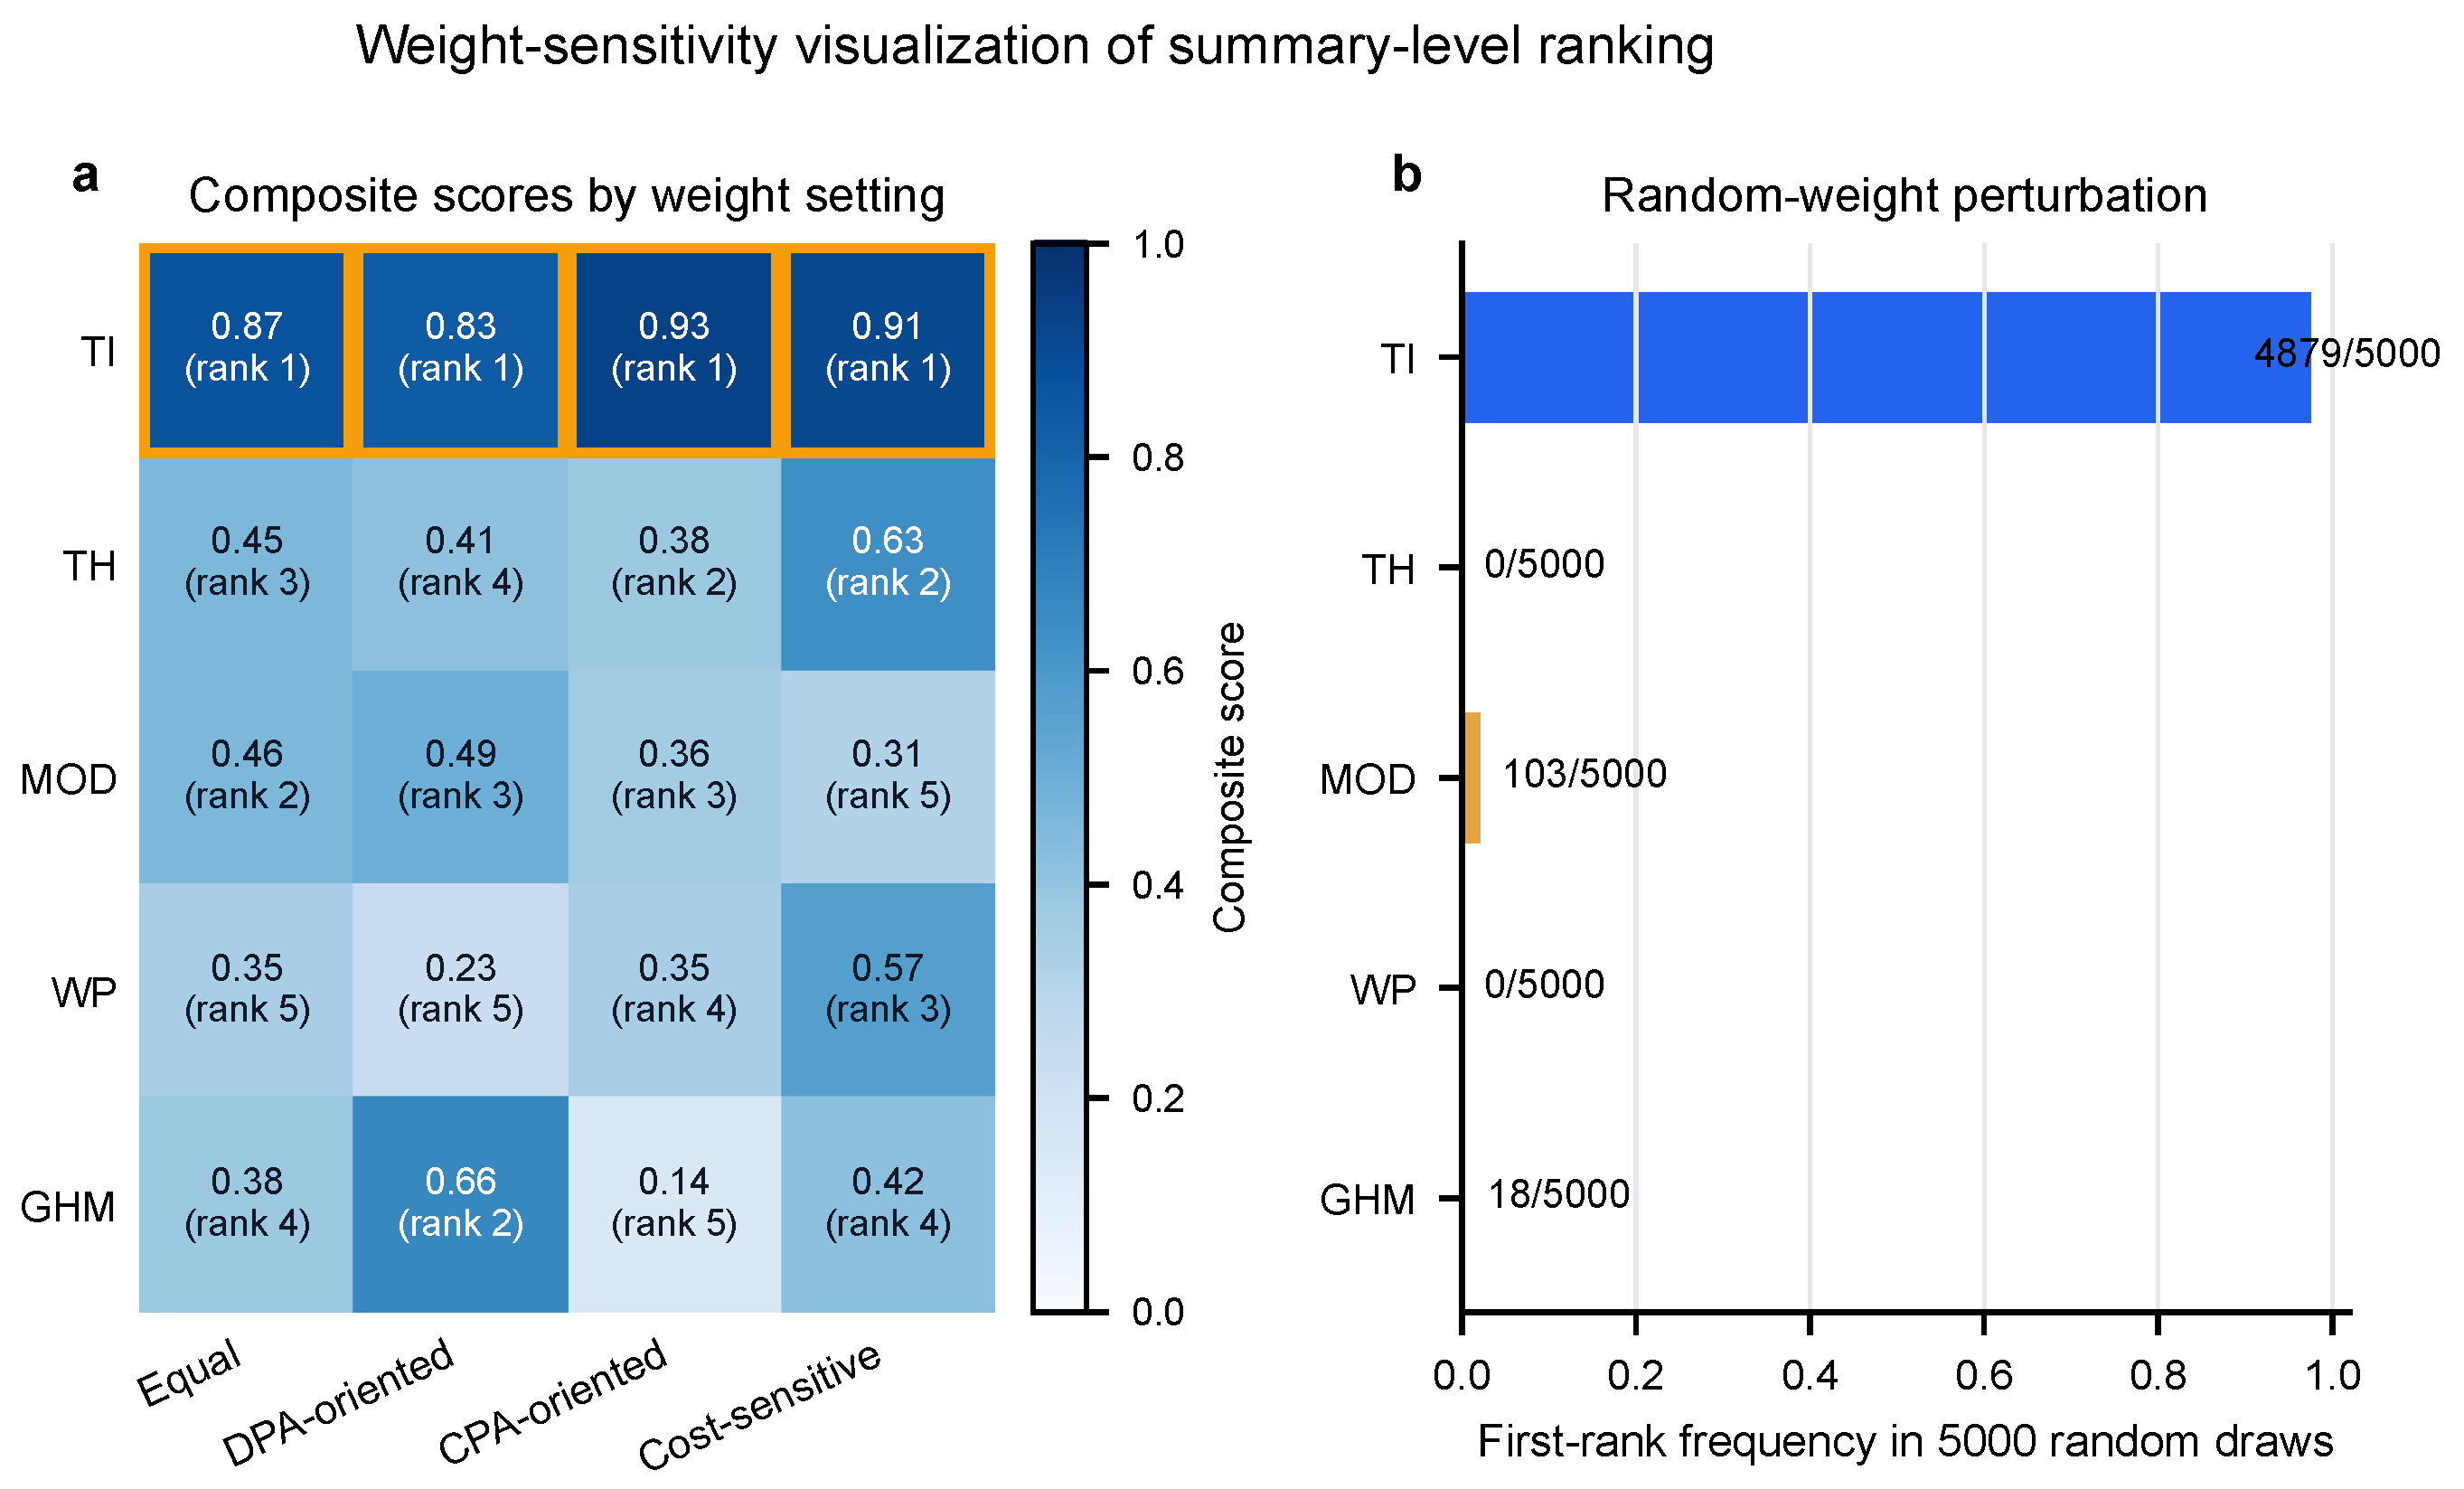
Table 3 indicates that TI remains the top-ranked denoised method under the tested summary-level scenarios. This does not prove universal optimality; it shows only that the current aggregate ranking is not driven by a single arbitrary weight choice. The final method choice should still be tied to the attack objective, available metrics, and cost constraint.
Table 3.
Weight-sensitivity summary for denoised methods.
3.4. Evaluation Flow
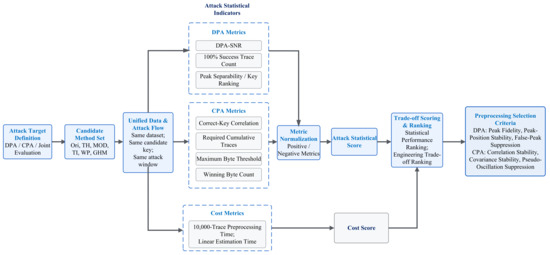
Figure 1 shows the evaluation flow. The attack type, candidate methods, and available metrics are first determined, and then metric-direction normalization is applied. Attack-statistic scores and cost scores are computed separately. Without cost constraints, the method with the higher attack-statistic score is selected as the statistically stronger candidate; with cost constraints, the trade-off score is used to select the engineering compromise.
Figure 1.
Attack-statistic-oriented evaluation flow for wavelet denoising. Blue solid outlines identify processing and selection stages, blue dashed outlines group the DPA, CPA, and cost metrics, and gray arrows indicate data and score flow.
The comparison loop in Figure 1 is as follows: same dataset, same attack flow, different denoising preprocessing, unified attack statistics, and comparison of trace demand, correlation coefficients, differential-peak separability, and cost. This loop ensures that method rankings come from attack-statistic criteria rather than mixed data, scripts, or metrics. The final outputs include a statistically stronger method, an engineering trade-off method, and a candidate-method ranking while preserving cases in which statistical performance and engineering cost disagree.
3.5. Evaluation Results and Scope of Applicability
The evaluation results cover three dimensions: statistically stronger methods, engineering trade-off methods, and complete method rankings. Statistical performance highlights attack-statistic behavior; the engineering trade-off combines attack gain and preprocessing overhead; the complete ranking reveals conflicts among metrics. For instance, in CPA, the cumulative trace demand and the maximum byte threshold may lead to different method preferences.
Based on the first-byte DPA experiment, the 16-byte CPA experiment, and the cost analysis, this paper extracts three selection criteria. For peak-sensitive attacks such as DPA, preprocessing should prioritize local peak fidelity, peak-position stability, and false-peak suppression. For global-correlation attacks such as CPA, preprocessing should prioritize shift invariance, global smoothing, covariance stability, and pseudo-oscillation suppression. When computing resources are constrained or the attack path is unclear, TI can serve as a joint DPA/CPA compromise baseline. If the statistical performance of AES first-byte DPA is the primary target and sufficient computing resources are available, GHM can be prioritized.
The results should be used under the corresponding attack type, metric definition, and experimental conditions. Statistical performance and engineering cost should both be considered. When the statistical ranking and the engineering trade-off are inconsistent, the final choice should depend on the concrete attack objective, available trace number, and preprocessing-time constraint.
4. Experimental Data and Evaluation Setup
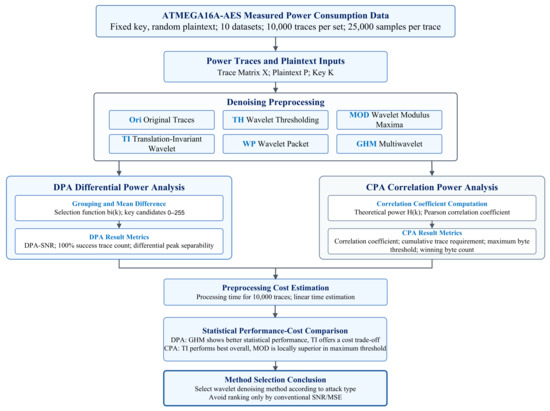
This section describes the experimental platform, data, candidate denoising methods, attack protocol, and evaluation metrics. To avoid mixing ordinary reconstruction quality with side-channel attack effect, the original traces and the five denoised outputs are compared under the same dataset, same attack flow, and same evaluation rule. As shown in Figure 2, the whole flow is: same power dataset, different denoising preprocessing, unified attack-statistic computation, and comparison of trace demand, peak separability, correlation coefficients, and preprocessing cost.
Figure 2.
Processing flow of measured power traces and DPA/CPA attack evaluation.
4.1. Dataset and Experimental Platform
Measured ATMEGA16A-AES power traces are used for method-adaptability analysis. The acquisition uses a fixed key and random plaintexts, producing 10 trace datasets. Each dataset contains 10,000 traces, and each trace contains 25,000 sample points. Table 4 summarizes the experimental platform and dataset settings.
Table 4.
Experimental platform and dataset settings.
The platform and dataset information in Table 4 define the acquisition scope of this controlled case study. The study uses ten fixed-key random-plaintext measurement sets as the acquisition basis and reports the attack statistics preserved for the common DPA/CPA comparison. The reported cross-byte CPA intervals quantify variability across the 16 AES key bytes, whereas cross-dataset inference is not used for method ranking. The selected attack window and implementation constants are treated as fixed protocol settings shared by all denoising outputs, and runtime is interpreted as a relative preprocessing-cost indicator under this common setting.
Table 5 summarizes the implementation and attack-window information available for reproducing the common evaluation protocol.
Table 5.
Reproducibility status of implementation and attack-window details.
The comparison is performed on the same measured dataset. To ensure a consistent comparison criterion, all denoised outputs are processed under the same attack window, selection function, trace-increment strategy, and candidate-key set for DPA/CPA computation. The comparison is therefore a within-protocol comparison among the original traces and five wavelet-family preprocessing outputs, rather than a per-method best-case tuning study. Low-level implementation constants are treated as fixed protocol settings and are not used as additional optimized variables for superiority claims. Related AES power-analysis and countermeasure studies also show that evaluation conclusions depend on consistent attack models, comparison conditions, and statistical decisions [32,33].
4.2. Candidate Wavelet Denoising Methods and Preprocessing Setup
The five candidate wavelet denoising methods are TH, MOD, TI, WP, and GHM. Ori is used as the non-denoised baseline. The five denoising outputs are fed into the same DPA/CPA attack flow. Ori should be interpreted as a no-denoising baseline, not as a representative non-wavelet denoising method. Non-wavelet preprocessing methods, including filtering-based, cumulant-based, data-preprocessing, and learning-based approaches, are important reference directions in side-channel analysis [11,16,17]. They are discussed to contextualize the experimental scope, whereas the numerical ranking is intentionally restricted to the five wavelet-family candidates evaluated under the common attack-statistic protocol.
The five wavelet methods were selected to cover representative branches of wavelet-family denoising rather than to exhaust all possible preprocessing techniques. TH represents classical threshold-shrinkage denoising, MOD represents singularity and modulus-maxima-based peak preservation, TI represents shift-invariant averaging for reducing translation sensitivity, WP represents finer wavelet-packet frequency partitioning, and GHM represents multiwavelet processing with multiple scaling and wavelet functions. This method set therefore spans simple shrinkage, local-structure preservation, shift-invariant smoothing, subband-rich decomposition, and multiwavelet reconstruction within one coherent wavelet framework. Other popular denoising techniques, such as conventional filtering, cumulant-based denoising, EMD-based decomposition, PCA-based preprocessing, and learning-based denoising, are relevant but require different model assumptions, parameter-selection rules, and fair repeated attack protocols. Including them as ranked baselines would change the study from a focused wavelet-family adaptability evaluation into a broader preprocessing benchmark. They are therefore discussed as contextual and future-extension methods rather than mixed into the present five-method wavelet comparison.
The ordinary denoising simulation in this study shows that thresholding rules affect SNR and MSE; soft thresholding is generally smoother than hard thresholding; the Symlet6 basis is relatively stable under low-SNR conditions, Haar is weaker, and Symlet6, Daubechies11, and Coiflet5 are close under high-SNR conditions; the gain becomes limited when the decomposition depth exceeds four. GHM multiwavelet denoising requires preprocessing one-dimensional traces into a multidimensional form and then postprocessing them back to one-dimensional sequences, resulting in higher computational cost. Side-channel signal-preprocessing studies also show that autoencoder-based denoising, data-preprocessing optimization, and wavelet transform affect attack efficiency [16,17,34]. Studies on wavelet packet and GHM multiwavelet preprocessing provide comparative bases for the method set [14,15].
The parameter setting in Table 6 is used to make the five wavelet-family methods comparable under one fixed attack-evaluation protocol. The ordinary denoising screening gives support for the use of Symlet-family wavelets and moderate decomposition depths, while the attack-stage comparison keeps the attack window, leakage selection, candidate-key enumeration, and trace-increment rule unchanged. For TI, circular shifting, inverse shifting, and averaging reduce shift sensitivity, but the same operation may also affect boundary behavior and covariance structure. The present study therefore reports the observed DPA/CPA outcomes under the specified TI shift-set procedure and does not treat shift schedule or boundary-covariance effects as independently optimized variables.
Table 6.
Wavelet denoising preprocessing parameters and implementation notes.
4.3. Attack Protocol and Success Criterion
A unified DPA and CPA attack flow is used to compare Ori and the five denoised outputs on the same ATMEGA16A-AES dataset. The attack inputs include the power-trace matrix, plaintexts, fixed key, and candidate subkey set. Candidate subkeys are enumerated byte by byte over 0–255.
The DPA target is an AES subkey byte, and the reported DPA results mainly come from the first key byte. For each candidate key k, the attack flow partitions the traces into two groups according to and computes the mean difference. The correct-key decision is based on the separability of the correct candidate’s differential peak from wrong-candidate peaks or background fluctuation in the target window, together with the candidate-subkey rank. All denoised outputs use the same attack window and selection function for DPA computation.
CPA constructs a theoretical power vector for each candidate key and computes the Pearson correlation coefficient between and the measured power vector at each sample point. The correct key is determined by the correlation peak and candidate-key rank in the target window. The theoretical power is obtained by mapping AES intermediate values to a leakage-model vector in the CPA program. The candidate-key set, theoretical-power computation, and correlation-coefficient computation are kept consistent across denoising methods. The 16-byte CPA statistics are summarized from byte-wise CPA attack results.
The trace-increment evaluation starts from a smaller sample size and increases to 10,000 traces. DPA or CPA statistics are recomputed at each trace number. A trial is successful when the correct candidate subkey ranks first under the corresponding statistic. The phrase “100% successful attack” refers to satisfying this decision rule in the trace-increment evaluation of this paper, not to a cross-platform, cross-dataset, or cross-countermeasure guarantee.
The DPA evidence is intentionally reported as first-byte DPA evidence. The 16-byte CPA matrices are not reinterpreted as full-byte DPA evidence, and this study does not introduce new guessing-entropy or success-rate curves because such curves require repeated rank trajectories over trace counts under the same attack protocol. Similarly, the fixed-key and unprotected-implementation setting does not validate multi-key robustness, masked implementations, or higher-order leakage attacks; masked implementations deliberately change first-order leakage and can require higher-order analysis [35,36], so these cases are treated as necessary extensions rather than conclusions of the current experiment.
4.4. Evaluation Metrics, Cost Estimation, and Applicable Boundary
This paper distinguishes ordinary signal-reconstruction metrics, attack-statistic metrics, and cost metrics. Ordinary metrics include SNR and MSE and are used only for general denoising-quality assessment. DPA metrics include the number of traces required for 100% successful attack and DPA-SNR, where DPA-SNR measures correct differential-peak separability relative to background noise and wrong-candidate false peaks. CPA metrics include correct-key correlation coefficients, per-byte trace demand, cumulative trace demand, maximum byte threshold, and winning-byte count. The cost metric is the preprocessing time for 10,000 traces; storage counts are not used for ranking or conclusions.
The mean, cross-byte sample standard deviation, median, minimum, and maximum of CPA correlations are computed from the 16-byte correct-key correlation coefficients. They describe overall correlation level, weak-byte lower bound, and cross-byte differences. The 16 bytes are used for cross-byte comparison; the mean and sample standard deviation are not cross-dataset stability statistics. The CPA cumulative trace demand is the sum of per-byte trace demands over 16 bytes. The maximum byte threshold is the largest trace demand among the 16 bytes and is closer to the sample-size constraint when recovering all bytes using the same batch of traces. Winning-byte count allows ties and describes method coverage across bytes.
DPA cost estimation uses the linear approximation in Equation (5). This estimate assumes approximate proportionality between preprocessing time and trace number. Batch processing, cache reuse, or parallel optimization may introduce deviations, so the estimate is used only for cost-trend comparison among methods.
In summary, this paper compares measured traces, DPA/CPA attack results, and statistical summaries. The DPA results mainly come from the first AES key byte, and the CPA results contain 16-byte statistics, all on the same platform. The reported statistical evidence is designed for within-protocol method comparison rather than cross-dataset inference over repeated measurement groups. The conclusions should be understood as empirical evaluations for an unprotected AES-128 software implementation on ATMEGA16A under fixed acquisition conditions, not as universal laws across platforms, countermeasures, or leakage models. Related template-attack research also indicates that feature selection and preprocessing can affect subsequent attack statistics [37].
These boundaries are important for interpreting the reported rankings. The study should be read as a controlled case study on one unprotected software AES platform and one fixed acquisition setting. It does not establish that the same ranking will hold for other chips, masked implementations, alternative leakage models, different attack windows, or repeated cross-dataset trials.
5. Results and Analysis
5.1. Ranking Inconsistency Between Ordinary Denoising Metrics and Attack Metrics
Ordinary denoising metrics and attack metrics are not ranked consistently. In the Bumps ordinary denoising test, TH performs well in ordinary SNR/MSE, but it does not rank first in the subsequent DPA and CPA attack statistics. The following analysis focuses on differential-peak separability, correlation stability, and preprocessing cost.
To make the interpretation more explicit, the DPA and CPA subsections are organized with the same logic: evaluation objective and metrics, visual attack-curve evidence, quantitative ranking, and mechanism-boundary interpretation. This structure separates the observed results from the practical meaning of each attack statistic.
5.2. Differential Peak Separability Analysis in the DPA Scenario
5.2.1. DPA Evaluation Objective and Evidence Chain
This subsection uses the first AES key byte as the DPA analysis target. The objective is to determine whether different preprocessing methods improve the separability between the correct-key differential peak and wrong-key false peaks or background fluctuation. Because the DPA statistic is essentially a conditional mean difference, local peak fidelity, peak-position stability, and false-peak suppression directly affect low-sample attack efficiency.
The metrics are DPA-SNR with 10,000 traces and the number of traces required for 100% successful attack. Table 7 summarizes the first-byte DPA statistics and method ranking; the following two DPA-specific subsections then present the attack curves and quantitative visual comparisons. The DPA-SNR here serves the attack-statistic decision and is not equivalent to ordinary reconstruction SNR.
Table 7.
Quantitative summary of AES first-byte DPA results.
5.2.2. DPA First-Byte Attack-Curve Evidence
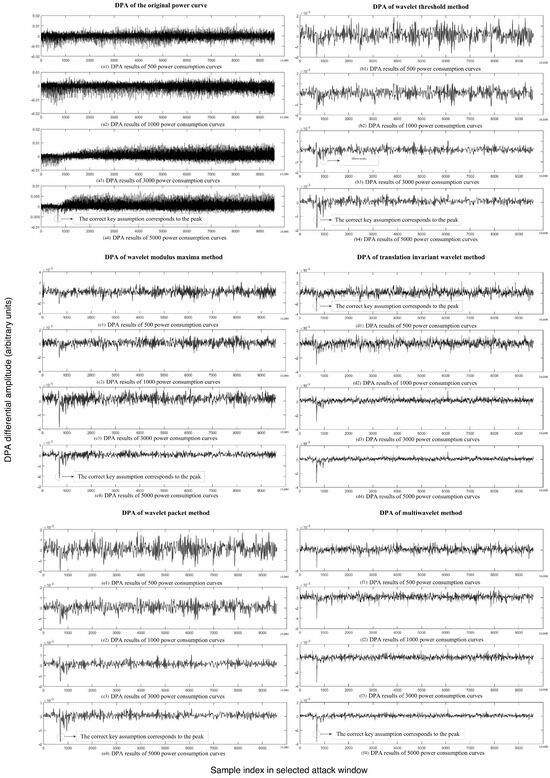
Figure 3 shows the AES first-byte DPA results under different denoising methods, with emphasis on whether the correct-key differential peak can be separated from background fluctuation and wrong-key false peaks.
Figure 3.
AES first-byte DPA attack results under different denoising methods. Panels (a1)–(a4), (b1)–(b4), (c1)–(c4), (d1)–(d4), (e1)–(e4), and (f1)–(f4) correspond to Ori, TH, MOD, TI, WP, and GHM, respectively, at four increasing trace counts. The horizontal axis is the sample index in the selected attack window, and the vertical axis is the DPA differential amplitude in arbitrary units.
The original traces show strong background fluctuation and false peaks under smaller sample sizes, and the correct peak becomes identifiable only after more traces are accumulated. After wavelet denoising, the relative prominence of the correct peak generally increases. GHM and TI show clearer peak separation, MOD follows, and TH/WP improve over Ori but remain limited in false-peak suppression and local peak fidelity.
5.2.3. DPA Quantitative Results and Method Ranking
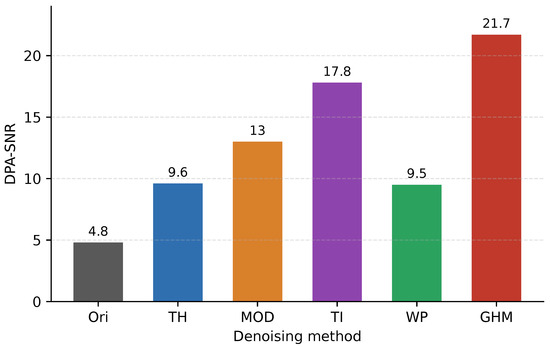
Figure 4 summarizes DPA-SNR values with 10,000 traces. It compares separability between the correct differential peak and background noise or false peaks, rather than ordinary signal-reconstruction quality.
Figure 4.
DPA-SNR comparison among different denoising methods.
In terms of DPA-SNR, GHM reaches about 21.7 with 10,000 traces, TI about 17.8, MOD about 13.0, TH and WP about 9.6 and 9.5, and Ori about 4.8. TH and WP are not weak in ordinary denoising metrics, but they do not lead in DPA-SNR. This confirms that ordinary denoising quality cannot directly predict DPA attack performance.
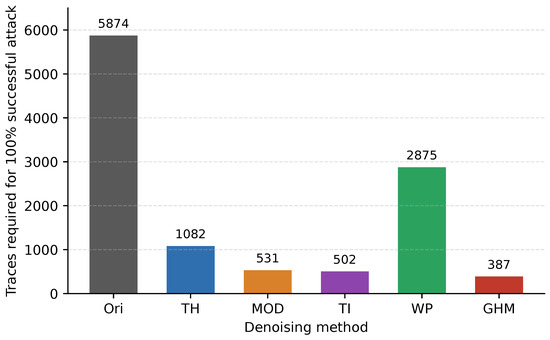
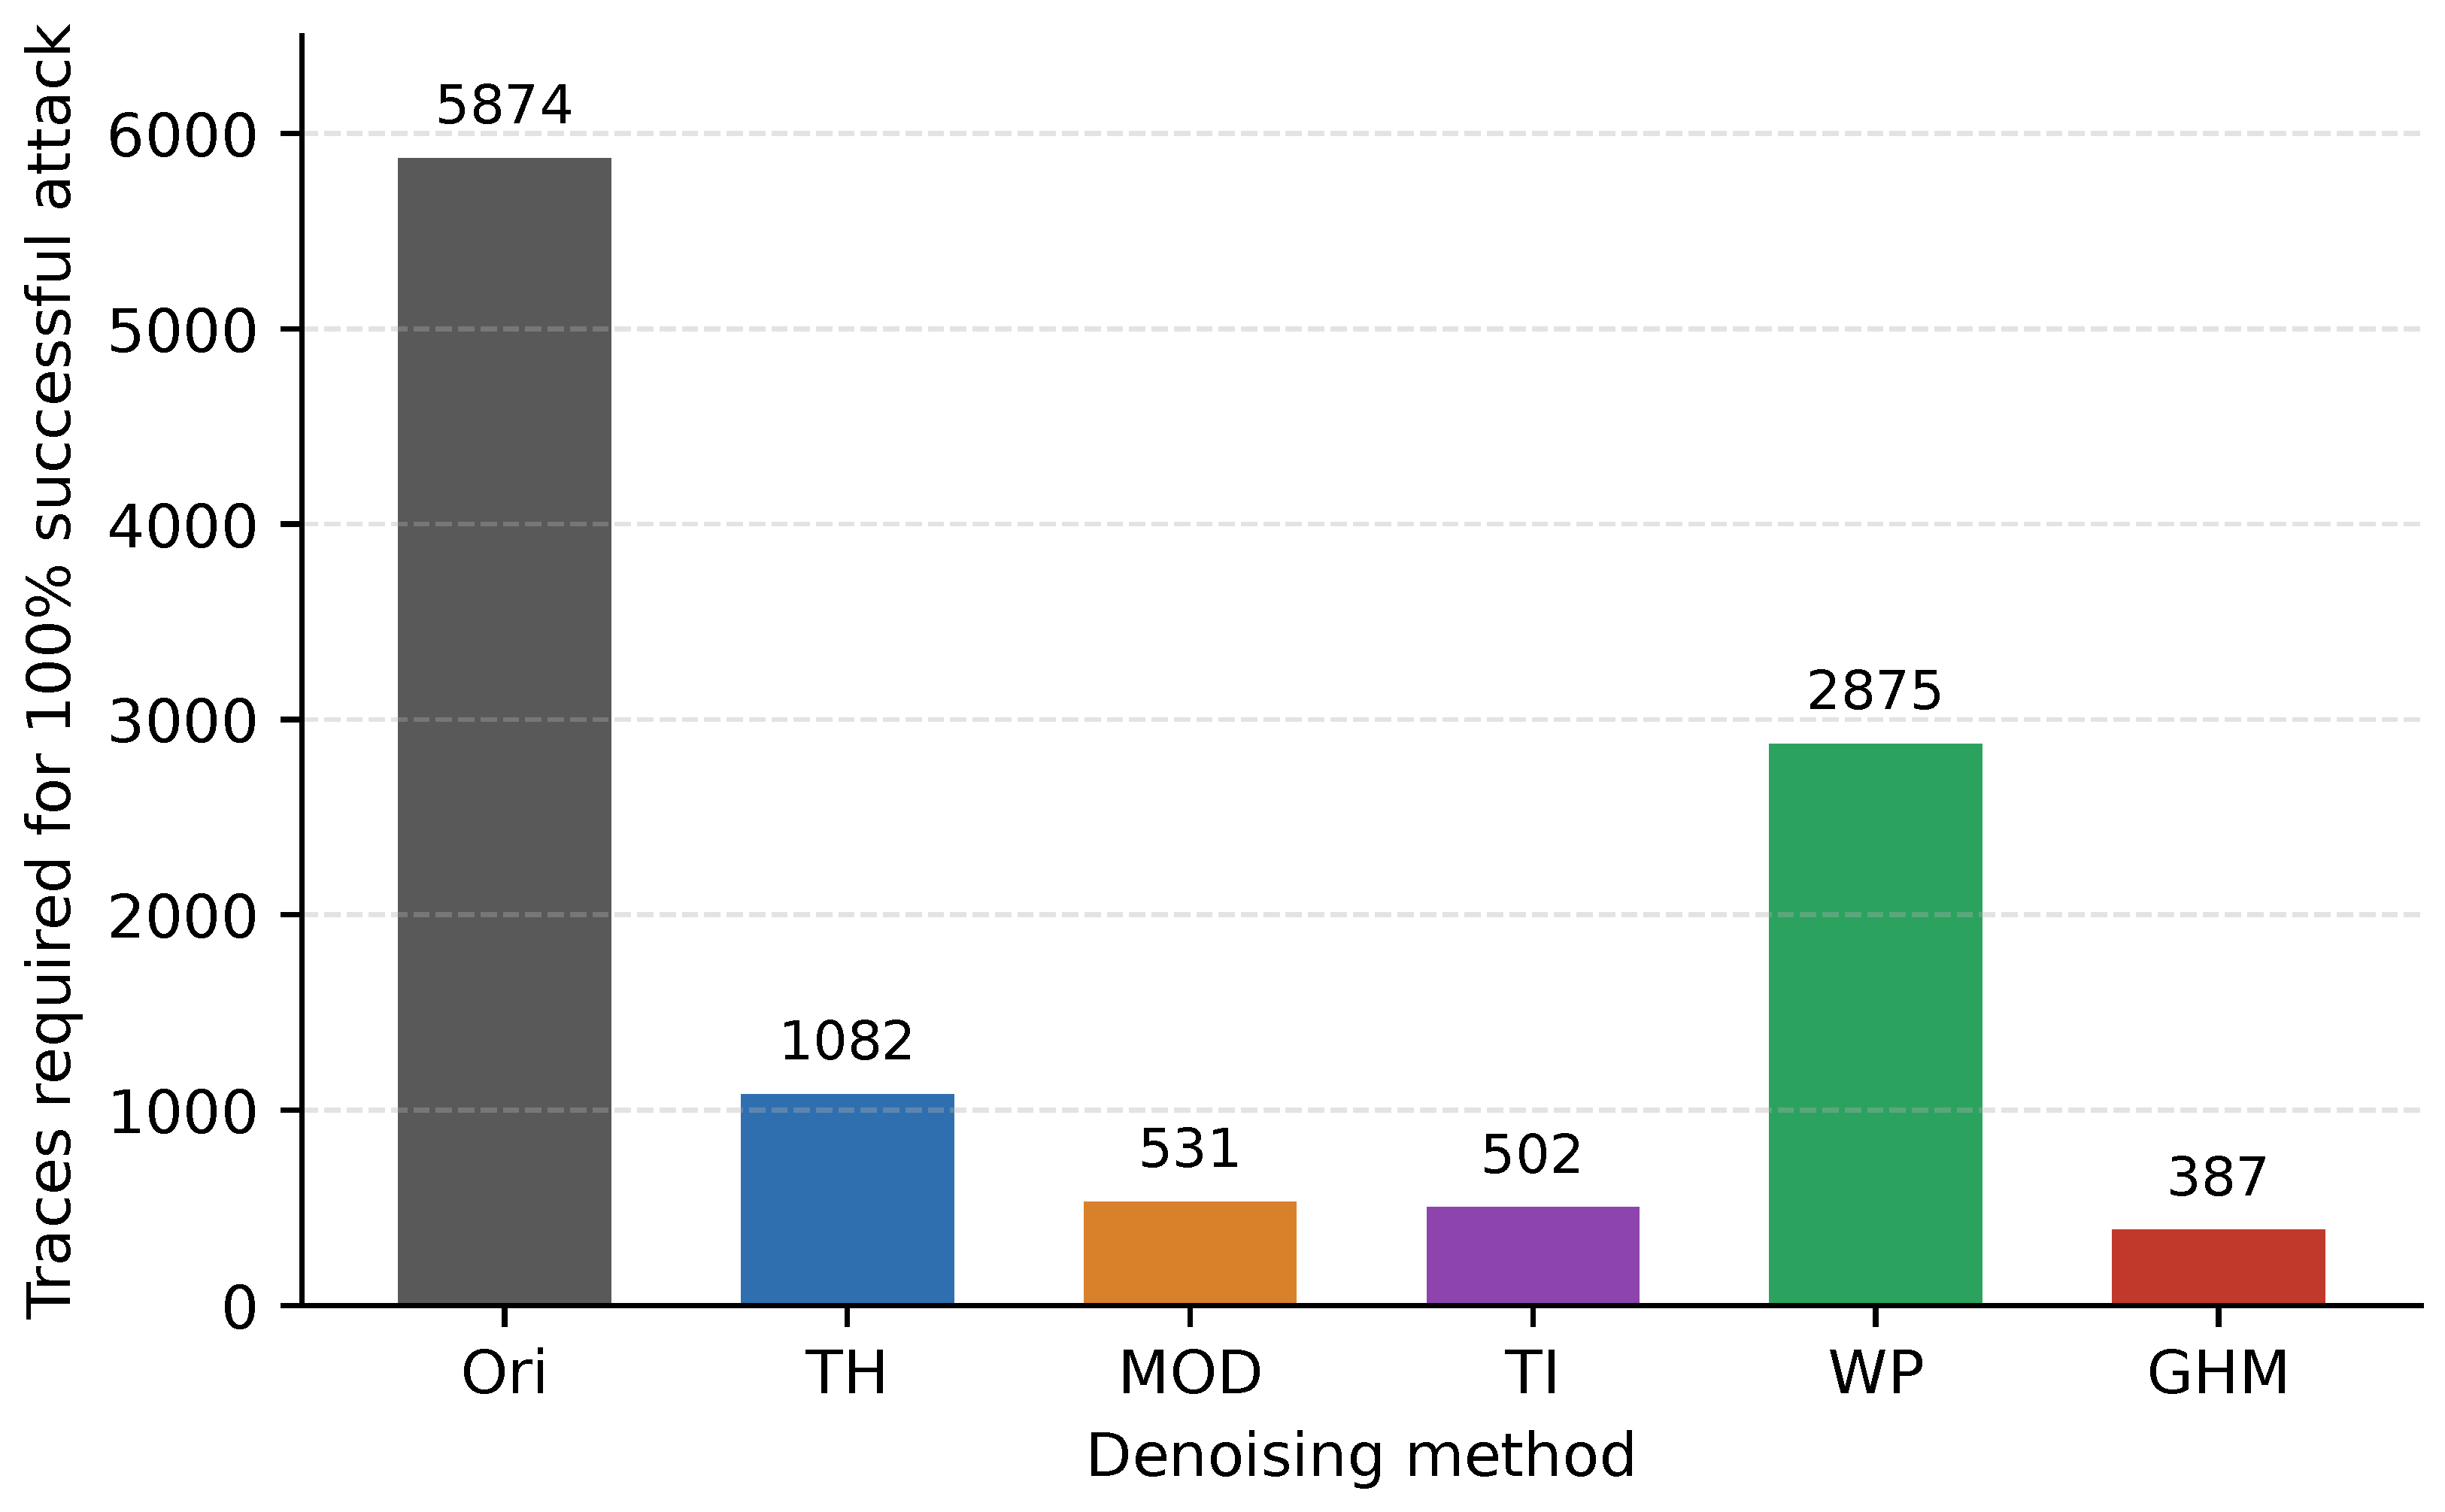
Figure 5 summarizes the number of traces required for 100% successful attack and, together with Table 7, compares low-sample attack efficiency in the first-byte AES case.
Figure 5.
DPA trace counts required for 100% successful attack.
Ranked by traces required for 100% success, GHM requires 387 traces, TI 502, MOD 531, TH 1082, WP 2875, and Ori 5874. This ranking is largely consistent with the DPA-SNR ranking. In the AES first-byte DPA case, GHM ranks first in both peak separability and low-sample success; TI closely follows GHM and has trade-off potential for the cost analysis; MOD is in the middle; TH and WP improve over Ori but remain limited. This subsection only provides statistical ranking, leaving preprocessing cost to Section 5.4.
5.2.4. DPA Mechanism Interpretation and Conclusion
The above ranking follows from the requirements of the DPA statistic. DPA compares conditional mean differences. If local spikes near the target instant are weakened, spread, or shifted, the difference between correct and wrong keys is compressed. If the denoising process introduces ringing or pseudo-peaks, wrong-key false peaks raise the background. DPA is therefore more sensitive to local peak fidelity, peak-position stability, and false-peak suppression than to simple global smoothness.
GHM performs well in the AES first-byte DPA case because its multiscale, multi-function structure can describe local changes more fully. Compact support and near symmetry reduce peak diffusion and phase distortion, and the combination of multiple scaling functions and mother wavelets improves approximation of target spikes. Consequently, GHM obtains both the highest DPA-SNR and the lowest success-trace demand.
TI is close to GHM and has strong engineering appeal. By using circular shifts, thresholding, inverse shifts, and averaging, TI reduces the shift sensitivity of the discrete wavelet transform and suppresses pseudo-Gibbs effects and local pseudo-oscillations. It therefore performs well in false-peak suppression and peak-position stability, although shift averaging may slightly reduce local peak sharpness, so its DPA-SNR and trace threshold are slightly weaker than those of GHM.
MOD outperforms TH and WP under low-sample attacks because it focuses on singularities and local abrupt structures, which are suitable for retaining spike information near the DPA target instant. However, its local-structure preservation does not reach the overall peak separability of GHM and TI. TH and WP improve over raw traces, but TH threshold shrinkage may suppress both noise and effective spikes, while WP frequency subdivision does not guarantee ideal separation between leakage and noise. Therefore, ordinary denoising quality is only a reference and cannot directly predict DPA attack-statistic performance. The DPA interpretation is therefore framed as first-byte evidence rather than as a full-byte superiority claim.
5.3. Correlation Stability Analysis in the CPA Scenario
5.3.1. CPA Evaluation Objective and Evidence Chain
The CPA objective is to evaluate correlation stability between the theoretical power model and measured power traces. Unlike DPA, which primarily observes local differential peaks, CPA depends on covariance and variance estimation over the sample set and needs stable correlation peaks across bytes and trace counts. The metrics include correct-key correlation coefficients, cumulative trace demand, maximum byte threshold, and number of winning bytes.
The evidence consists of first-byte CPA attack curves, 16-byte correct-key correlation coefficients, 16-byte trace demand, and winning-byte counts. These items are introduced and cited sequentially in the following CPA-specific subsections so that each figure and table remains adjacent to its first citation. Cumulative trace demand and maximum byte threshold are complementary: the former reflects total per-byte recovery cost, whereas the latter reflects the sample-size constraint when analyzing all bytes with the same trace batch.
5.3.2. CPA First-Byte Attack-Curve Evidence
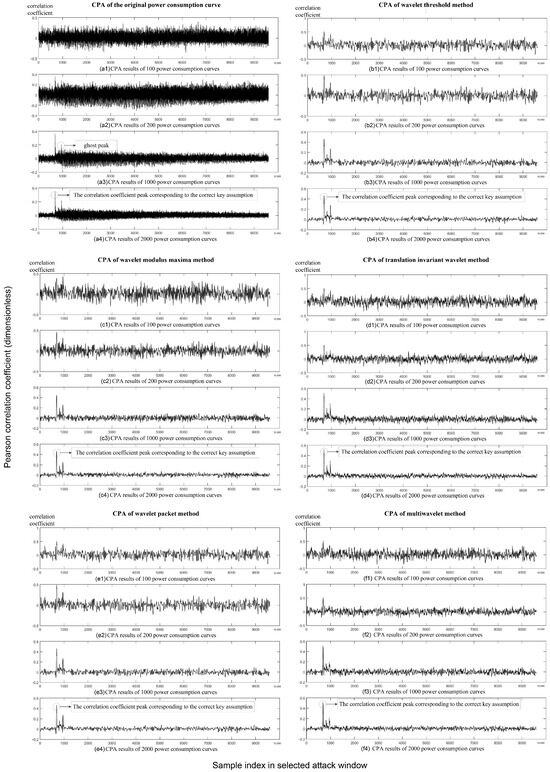
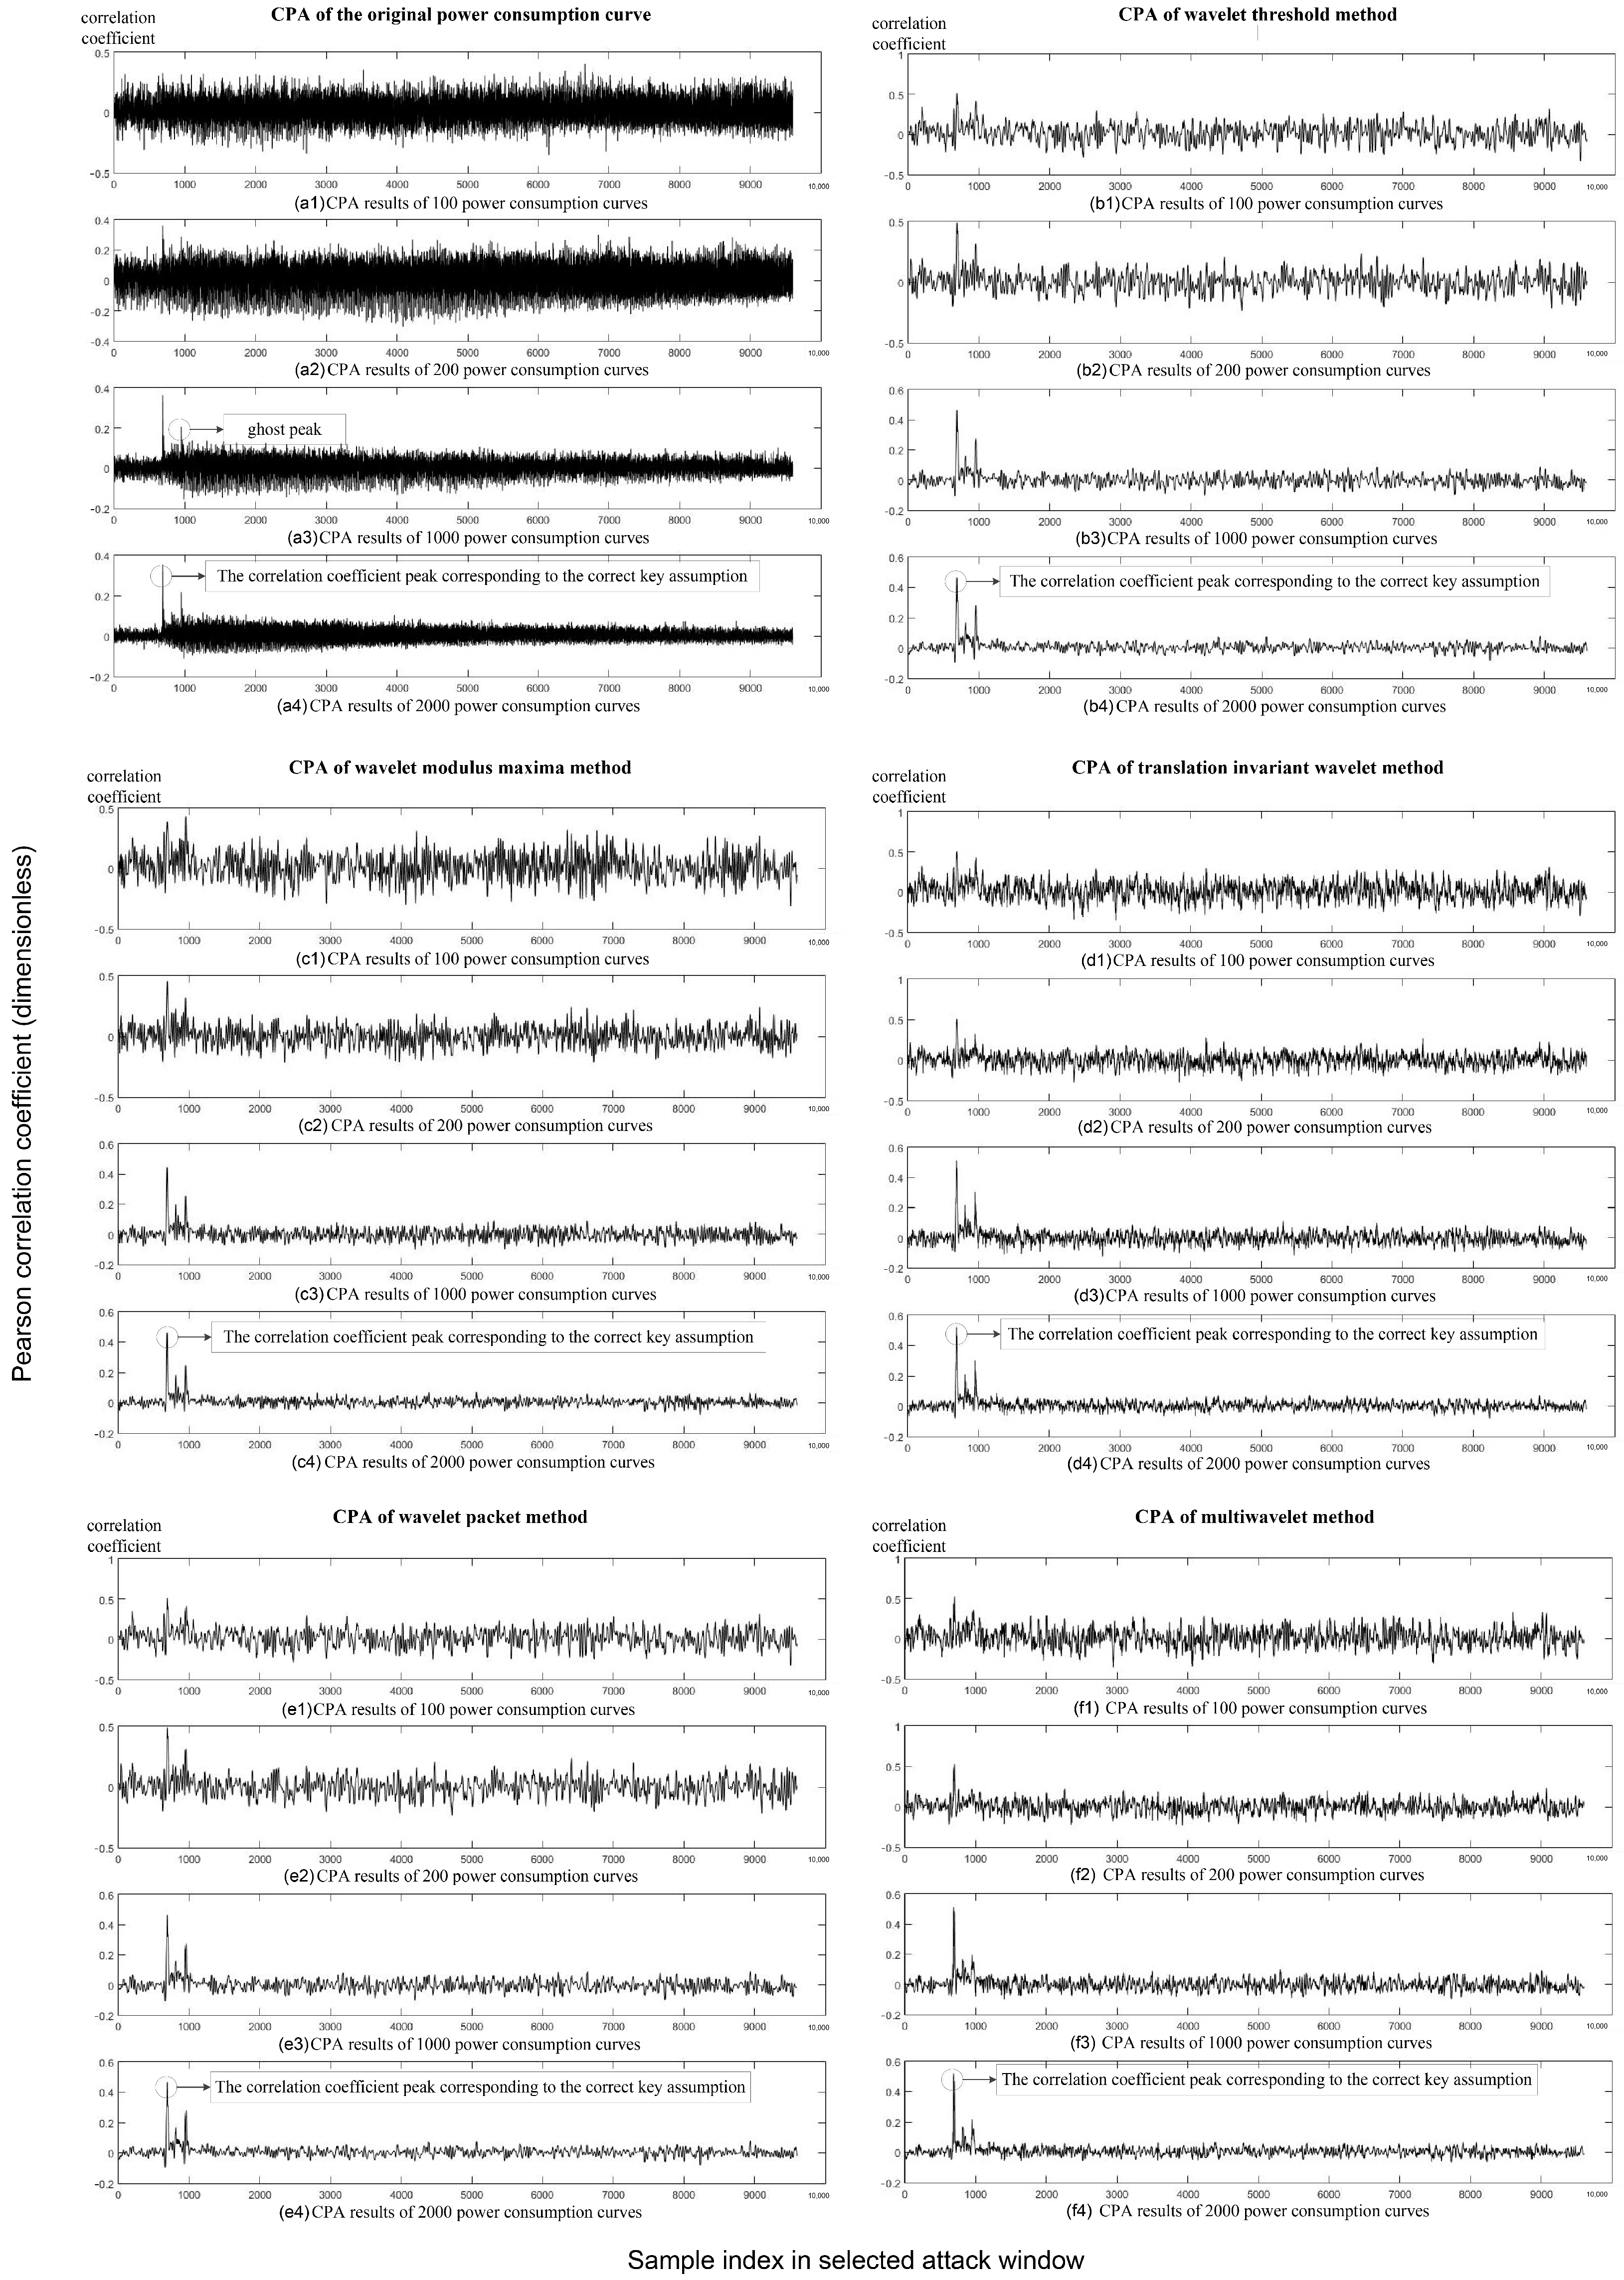
Figure 6 shows the AES first-byte CPA results under different denoising methods, with emphasis on the separation between the correct-key correlation peak and wrong-key false peaks.
Figure 6.
AES first-byte CPA attack results under different denoising methods. Panels (a1)–(a4), (b1)–(b4), (c1)–(c4), (d1)–(d4), (e1)–(e4), and (f1)–(f4) correspond to Ori, TH, MOD, TI, WP, and GHM, respectively, at four increasing trace counts. The horizontal axis is the sample index in the selected attack window, and the vertical axis is the dimensionless Pearson correlation coefficient.
The original traces cannot form a stable correct-key correlation peak with small trace counts; the peak becomes identifiable only as more traces are accumulated. After TH, MOD, TI, WP, and GHM preprocessing, the correct-key peak is separated earlier and more clearly from wrong-key false peaks. This shows that denoising improves CPA not merely by making individual traces visually smoother, but by improving the separability of the correct-key correlation peak.
5.3.3. CPA Cross-Byte Results and Method Ranking
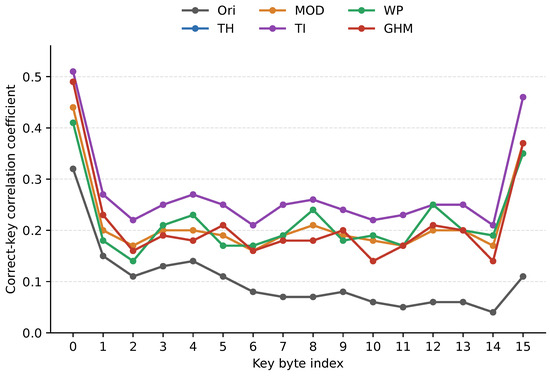
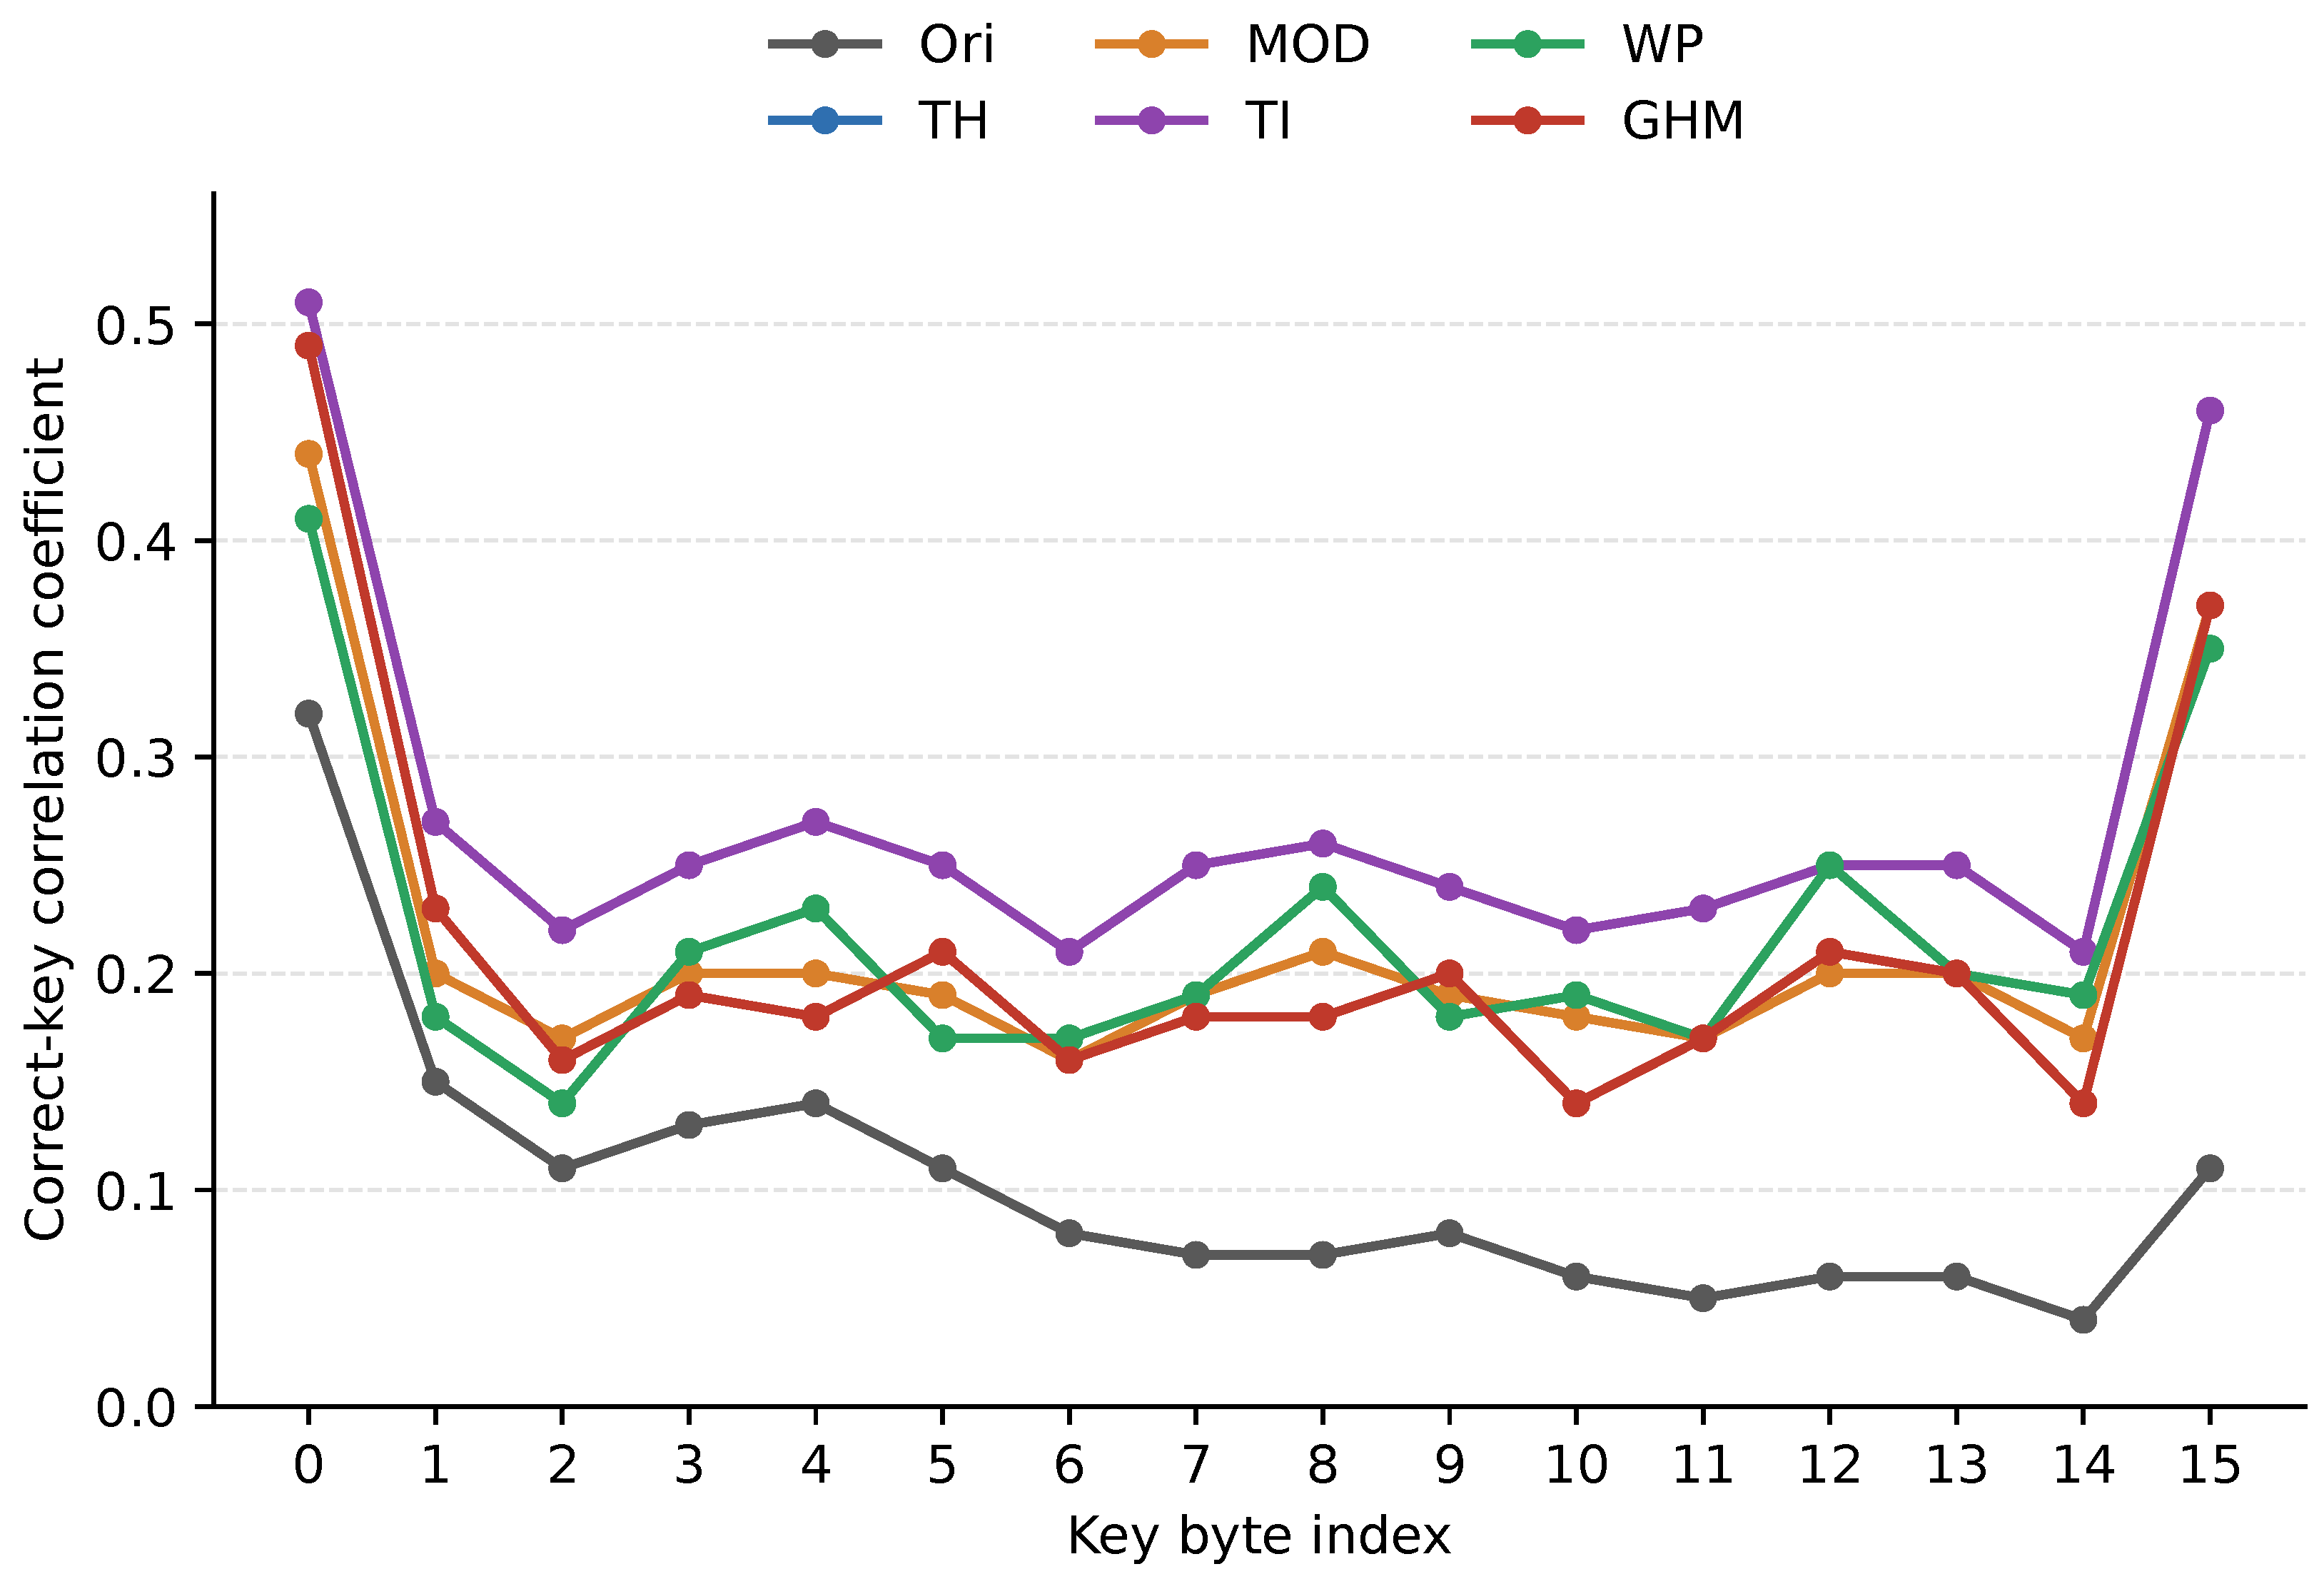
Figure 7 shows the distribution of CPA correct-key correlation coefficients across the 16 AES key bytes. It is used to compare cross-byte correlation levels and weak-byte lower bounds.
Figure 7.
Distribution of 16-byte CPA correct-key correlation coefficients. The gray, blue, orange, purple, green, and red curves denote Ori, TH, MOD, TI, WP, and GHM, respectively.
TI maintains higher correlation coefficients on most key bytes and raises weakly correlated bytes substantially over Ori. Table 8 gives the 16-byte statistics, including mean, cross-byte sample standard deviation, median, minimum, and maximum.
Table 8.
Cross-byte distribution statistics of CPA correlation coefficients.
TI has an average correlation coefficient of 0.2719, a median of 0.250, and a minimum of 0.21, all higher than those of the other methods; Ori has an average of 0.1025. TI therefore performs better in overall correlation level and weak-byte lower bound in the 16-byte CPA results. Its cross-byte sample standard deviation is not the smallest, so its advantage is not that every individual statistic ranks first.
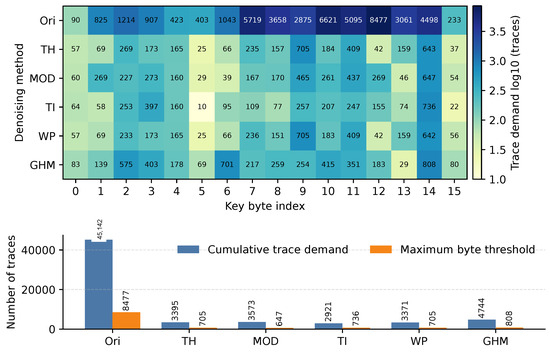
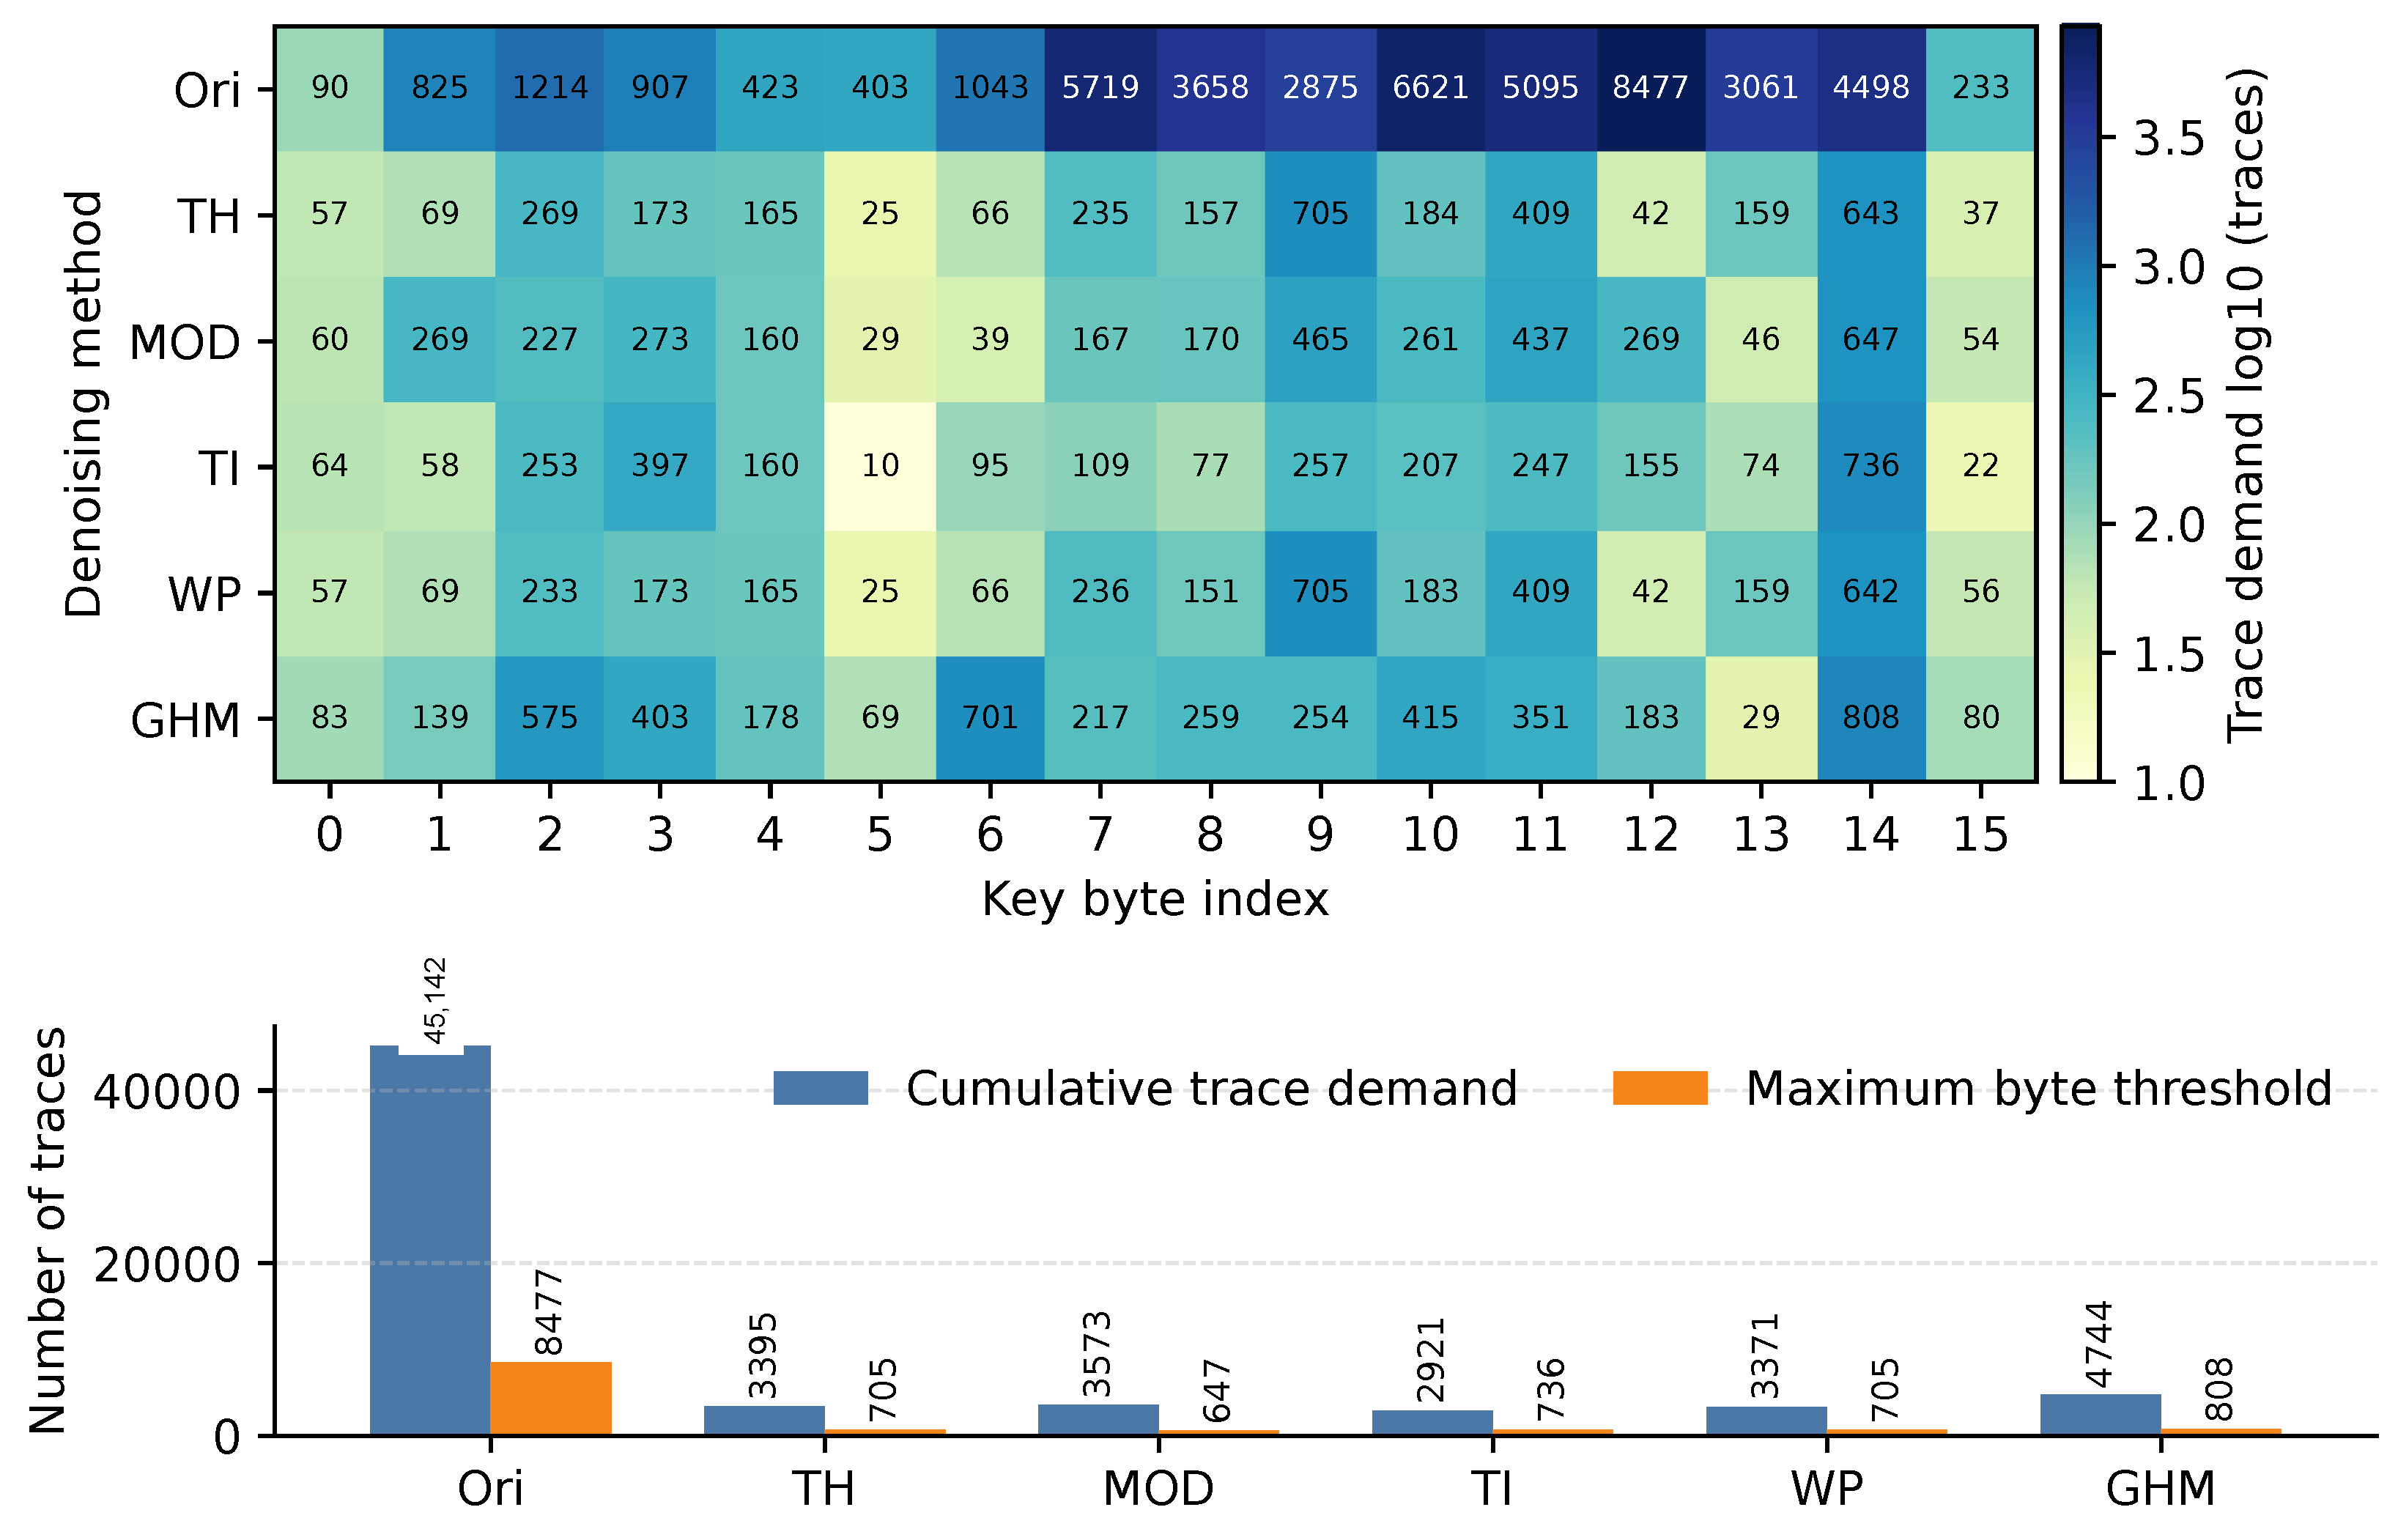
Figure 8 shows the CPA trace-demand statistics over 16 key bytes, including per-byte recovery, cumulative trace demand, and maximum byte threshold.
Figure 8.
CPA trace-demand comparison among different denoising methods.
Ori has high per-byte trace demand overall. After denoising, most key bytes require fewer traces. TI has the lowest cumulative trace demand, while MOD has the lowest maximum byte threshold. This means that CPA trace demand should be viewed from both overall cost and the most difficult byte constraint. Table 9 summarizes these two metrics.
Table 9.
Dual metrics of CPA trace demand.
Table 10 reports the number and identities of AES key bytes on which each denoising method attains the minimum or tied-minimum trace demand.
Table 10.
CPA winning-byte count statistics.
Table 11 consolidates the correlation, trace-demand, hardest-byte, and winning-byte observations used for the CPA conclusion.
Table 11.
Main judgments in the CPA scenario.
To add statistical context without overstating the available evidence, we performed exact paired sign-flip permutation tests on the 16 matched AES key bytes for the CPA trace-demand data. The tested quantity is the per-byte trace-demand reduction of TI relative to each comparator, followed by Holm correction for multiple comparisons. Table 12 reports the resulting paired comparisons. This analysis is a byte-level CPA robustness check under the same fixed dataset and should not be confused with cross-dataset variance analysis over repeated measurement sets.
Table 12.
Byte-level paired tests for 16-byte CPA trace demand.
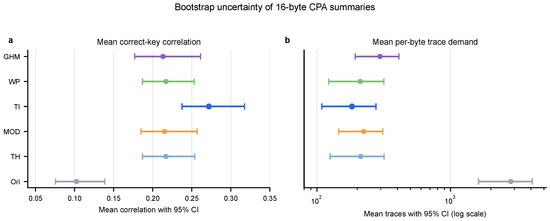
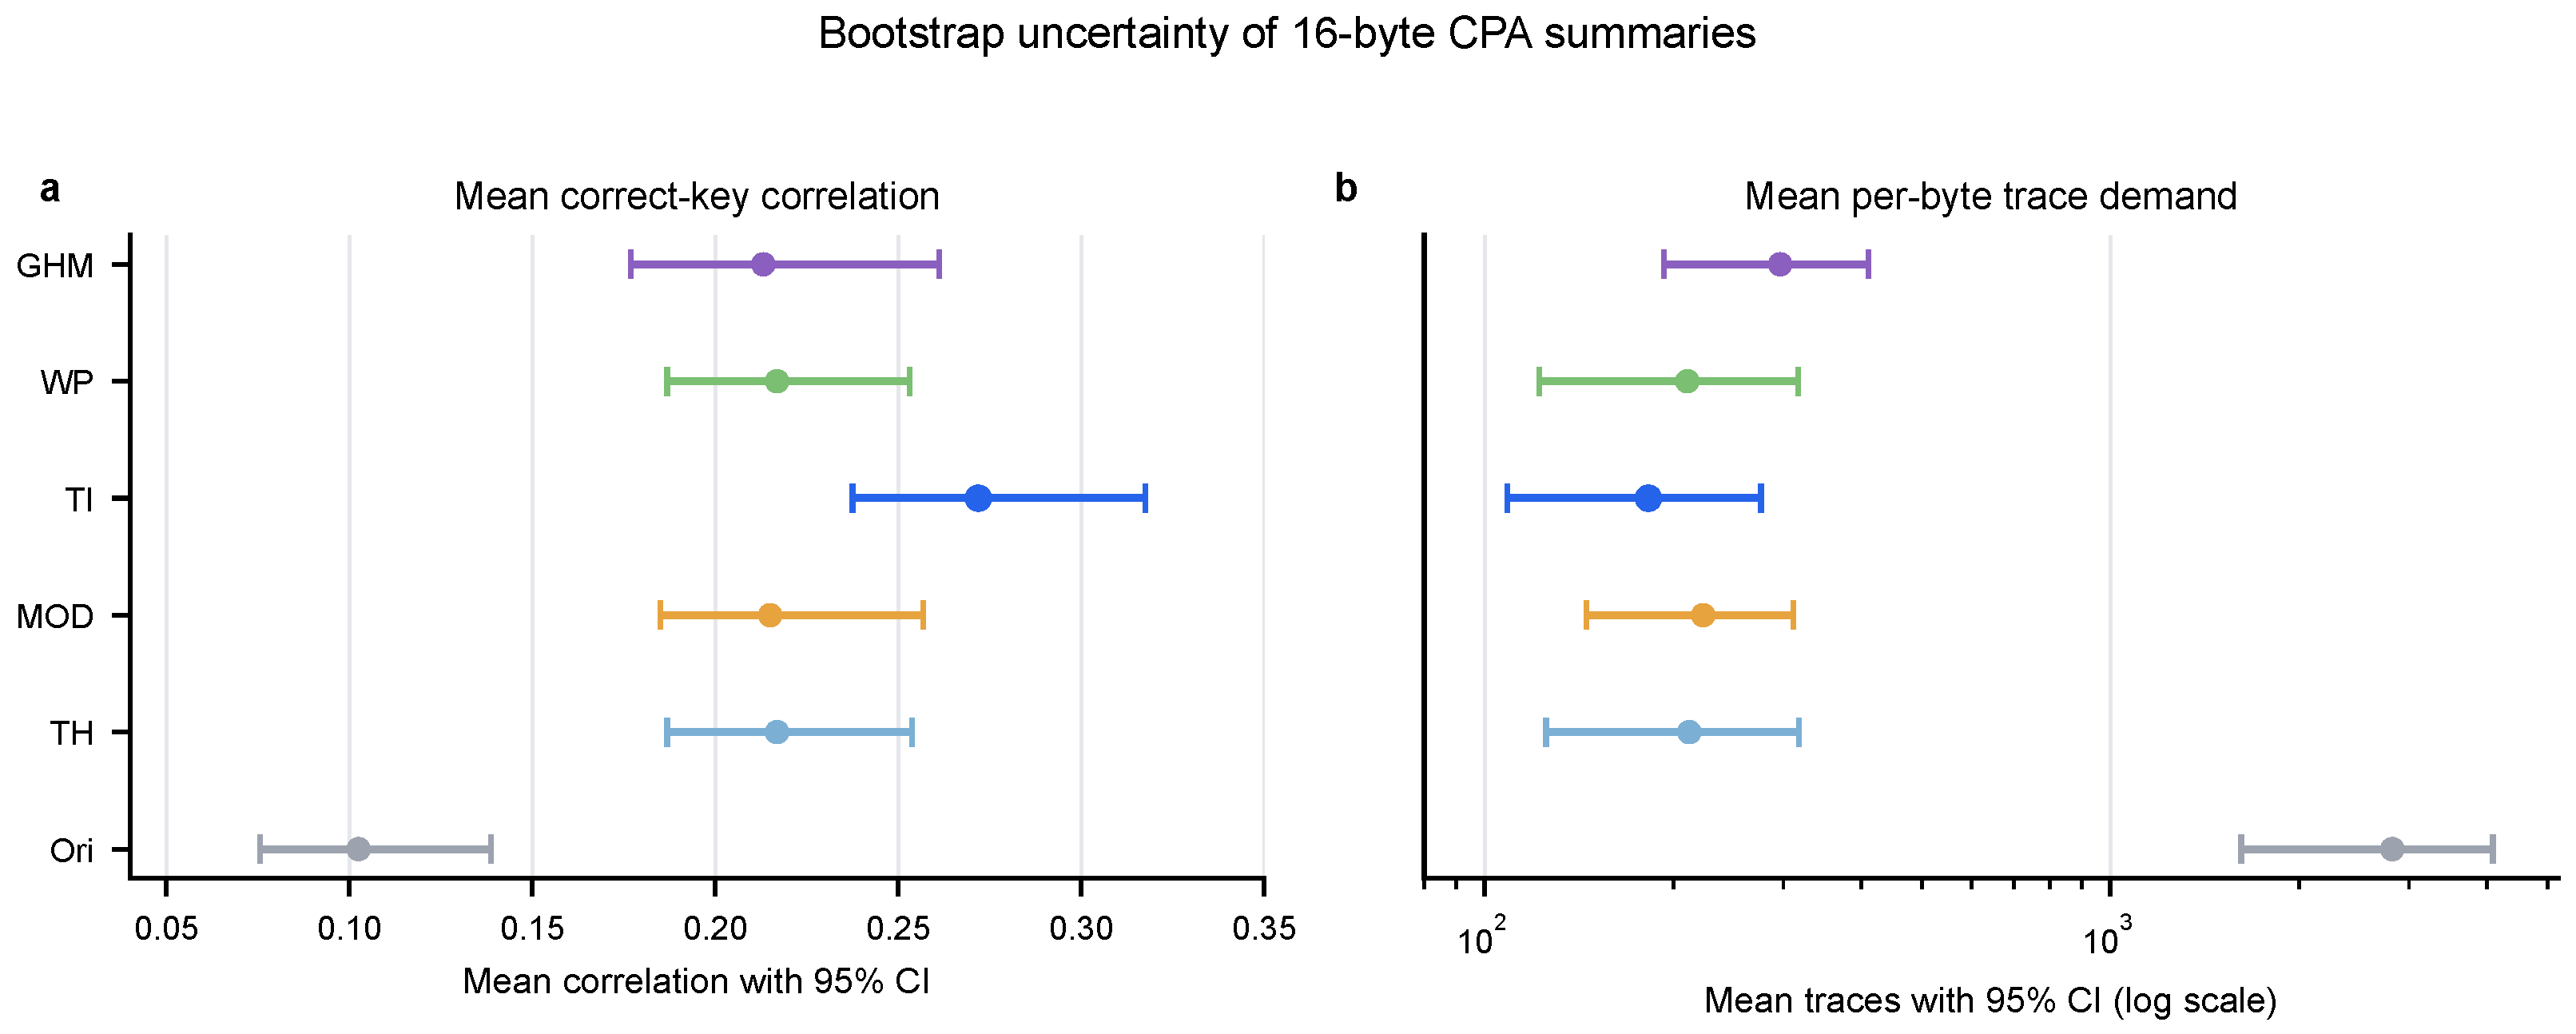
In addition to the paired tests, bootstrap confidence intervals were computed over the 16 matched AES key bytes for two CPA summary quantities: mean correct-key correlation and mean per-byte trace demand. These intervals quantify byte-level dispersion within the fixed-key CPA matrix; they are not cross-dataset confidence intervals over the 10 measurement sets.
Figure 9 visualizes the same bootstrap confidence intervals in Table 13. The purpose of this visualization is to make the statistical uncertainty and byte-level dispersion more directly inspectable, while keeping the interpretation boundary unchanged: the intervals are computed over the 16 matched AES key bytes in the fixed-key CPA matrix and should be interpreted as cross-byte, rather than cross-dataset, uncertainty summaries.
Figure 9.
Bootstrap confidence-interval forest visualization for 16-byte CPA summaries. Panel (a) reports mean correct-key correlation; panel (b) reports mean trace demand. Error bars denote 95% bootstrap confidence intervals over the 16 matched AES key bytes. Gray, light blue, orange, blue, green, and purple denote Ori, TH, MOD, TI, WP, and GHM, respectively.
Table 13.
Bootstrap 95% confidence intervals for 16-byte CPA summaries.
In Table 9, TI has the lowest cumulative trace demand at 2921. WP, TH, MOD, and GHM require 3371, 3395, 3573, and 4744 traces, respectively. Cumulative trace demand is the sum of per-byte trace counts and is not the trace number required to recover the full key in one batch. If one trace batch is used to cover the most difficult byte, the maximum byte threshold is more relevant; MOD obtains the lowest maximum byte threshold, 647, below TI’s 736. Table 10 shows that TI wins or ties on 7 bytes, WP on 5, TH and MOD on 3 each, and GHM on 2. Taken together with Table 11, TI performs better overall in CPA, but not every single metric ranks first; MOD has a local advantage in maximum byte threshold. The difference between MOD and TI is therefore metric-dependent rather than contradictory. MOD can help the most difficult byte because modulus-maxima propagation is favorable for preserving local singular structures and peak-like leakage events. However, cumulative trace demand aggregates all 16 byte-wise thresholds, so a method that stabilizes more bytes moderately can outperform a method that strongly improves only a smaller subset of bytes. TI’s lower cumulative demand is consistent with this broader cross-byte stabilization, whereas MOD’s lower maximum threshold reflects a local hard-byte advantage.
5.3.4. CPA Mechanism Interpretation and Conclusion
CPA correlation coefficients rely on covariance and variance estimates over all samples. If denoising introduces local ringing, excessive sparsification, phase instability, or small-scale pseudo-fluctuations, it may change the measured-power variance structure and weaken the linear relation with the theoretical model. Unlike DPA’s local peak decision, CPA relies more on stable convergence of correlation peaks as the sample number increases.
TI reduces the shift sensitivity of the discrete wavelet transform through circular shifting, threshold denoising, inverse shifting, and averaging, and suppresses pseudo-Gibbs effects. This mechanism helps reduce pseudo-oscillations caused by alignment differences and local threshold truncation, improving CPA correlation stability. MOD retains local structures well and therefore obtains the lowest maximum byte threshold of 647. However, in cumulative trace demand, winning-byte count, and 16-byte correlation statistics, TI is stronger overall.
The CPA conclusion is based on 16-byte statistics and is not a repeated cross-dataset experiment. Under the same ATMEGA16A-AES dataset and five wavelet denoising methods, the CPA scenario cannot mechanically adopt the first-ranked DPA method. TI is more suitable as the overall CPA choice, while MOD has a local advantage in maximum byte threshold.
5.4. Mechanism Association and Causal Boundary
The mechanism interpretation in this paper is associative rather than causal. Better DPA or CPA performance after a denoising method does not by itself prove that a specific signal-processing mechanism caused the improvement. To make this boundary explicit, a summary-level association check was performed using only existing aggregate metrics.
Table 14 supports cautious statements such as “is consistent with” or “suggests”, but it does not establish causal proof. Causal attribution is reserved for targeted trace-level ablation, peak-location stability analysis, boundary/covariance distortion analysis, and controlled preprocessing variants. The discussion and conclusion therefore avoid claiming that a denoising mechanism alone caused the observed attack-performance changes.
Table 14.
Summary-level mechanism association checks.
Figure 10 further visualizes the weight-sensitivity audit summarized in Table 3. The four deterministic weighting scenarios and the 5000 random Dirichlet weight perturbations are shown together, so the reader can inspect both the scenario-level scores and the first-rank stability of TI. This figure supports the limited conclusion that the aggregate ranking is not driven by a single arbitrary weight choice; it does not turn the weights into optimized universal constants.
Figure 10.
Weight-sensitivity visualization of the summary-level ranking. Panel (a) reports deterministic weight-scenario scores; panel (b) reports first-rank frequencies over 5000 random weight perturbations.
5.5. Statistical Performance, Preprocessing Cost, and Method Selection
5.5.1. Preprocessing Time and Linear Estimation Rule
The measured preprocessing times for 10,000 traces are 487.8 s for TH, 36,896.8 s for MOD, 1329.5 s for TI, 1491.4 s for WP, and 13,653.8 s for GHM. Only preprocessing time is used as the cost metric; storage counts are not used for method ranking or conclusions. The linear estimation rule is the same as Equation (5): estimated time equals required traces divided by 10,000 and multiplied by the preprocessing time for 10,000 traces. This estimate is a relative cost-trend calculation under the same trace length and implementation setting. It is not used as a platform-independent runtime predictor, because runtime can vary with CPU, RAM, operating system, software version, compiler setting, and optimization strategy.
The computational-complexity difference among the five methods mainly comes from how many decomposition, reconstruction, search, and averaging operations are applied to each trace. For a trace length L and trace count R, ordinary wavelet thresholding has the simplest processing route because each trace is decomposed, thresholded, and reconstructed once. MOD adds modulus-maxima detection and cross-scale structure tracking, so its runtime can increase substantially when extrema-chain search and reconstruction are applied over several scales. TI repeats the base denoising operation over multiple circular shifts and then averages the inverse-shifted results; its cost therefore increases with the size of the shift set, although the averaging improves shift robustness. WP uses a richer wavelet-packet tree than ordinary wavelet decomposition, which increases the number of processed subbands. GHM introduces additional preprocessing and postprocessing between one-dimensional traces and the multiwavelet representation, together with multi-filter reconstruction. These qualitative complexity sources are consistent with the measured preprocessing times and explain why the statistically strongest method is not always the most attractive engineering choice.
5.5.2. DPA Cost–Benefit Analysis
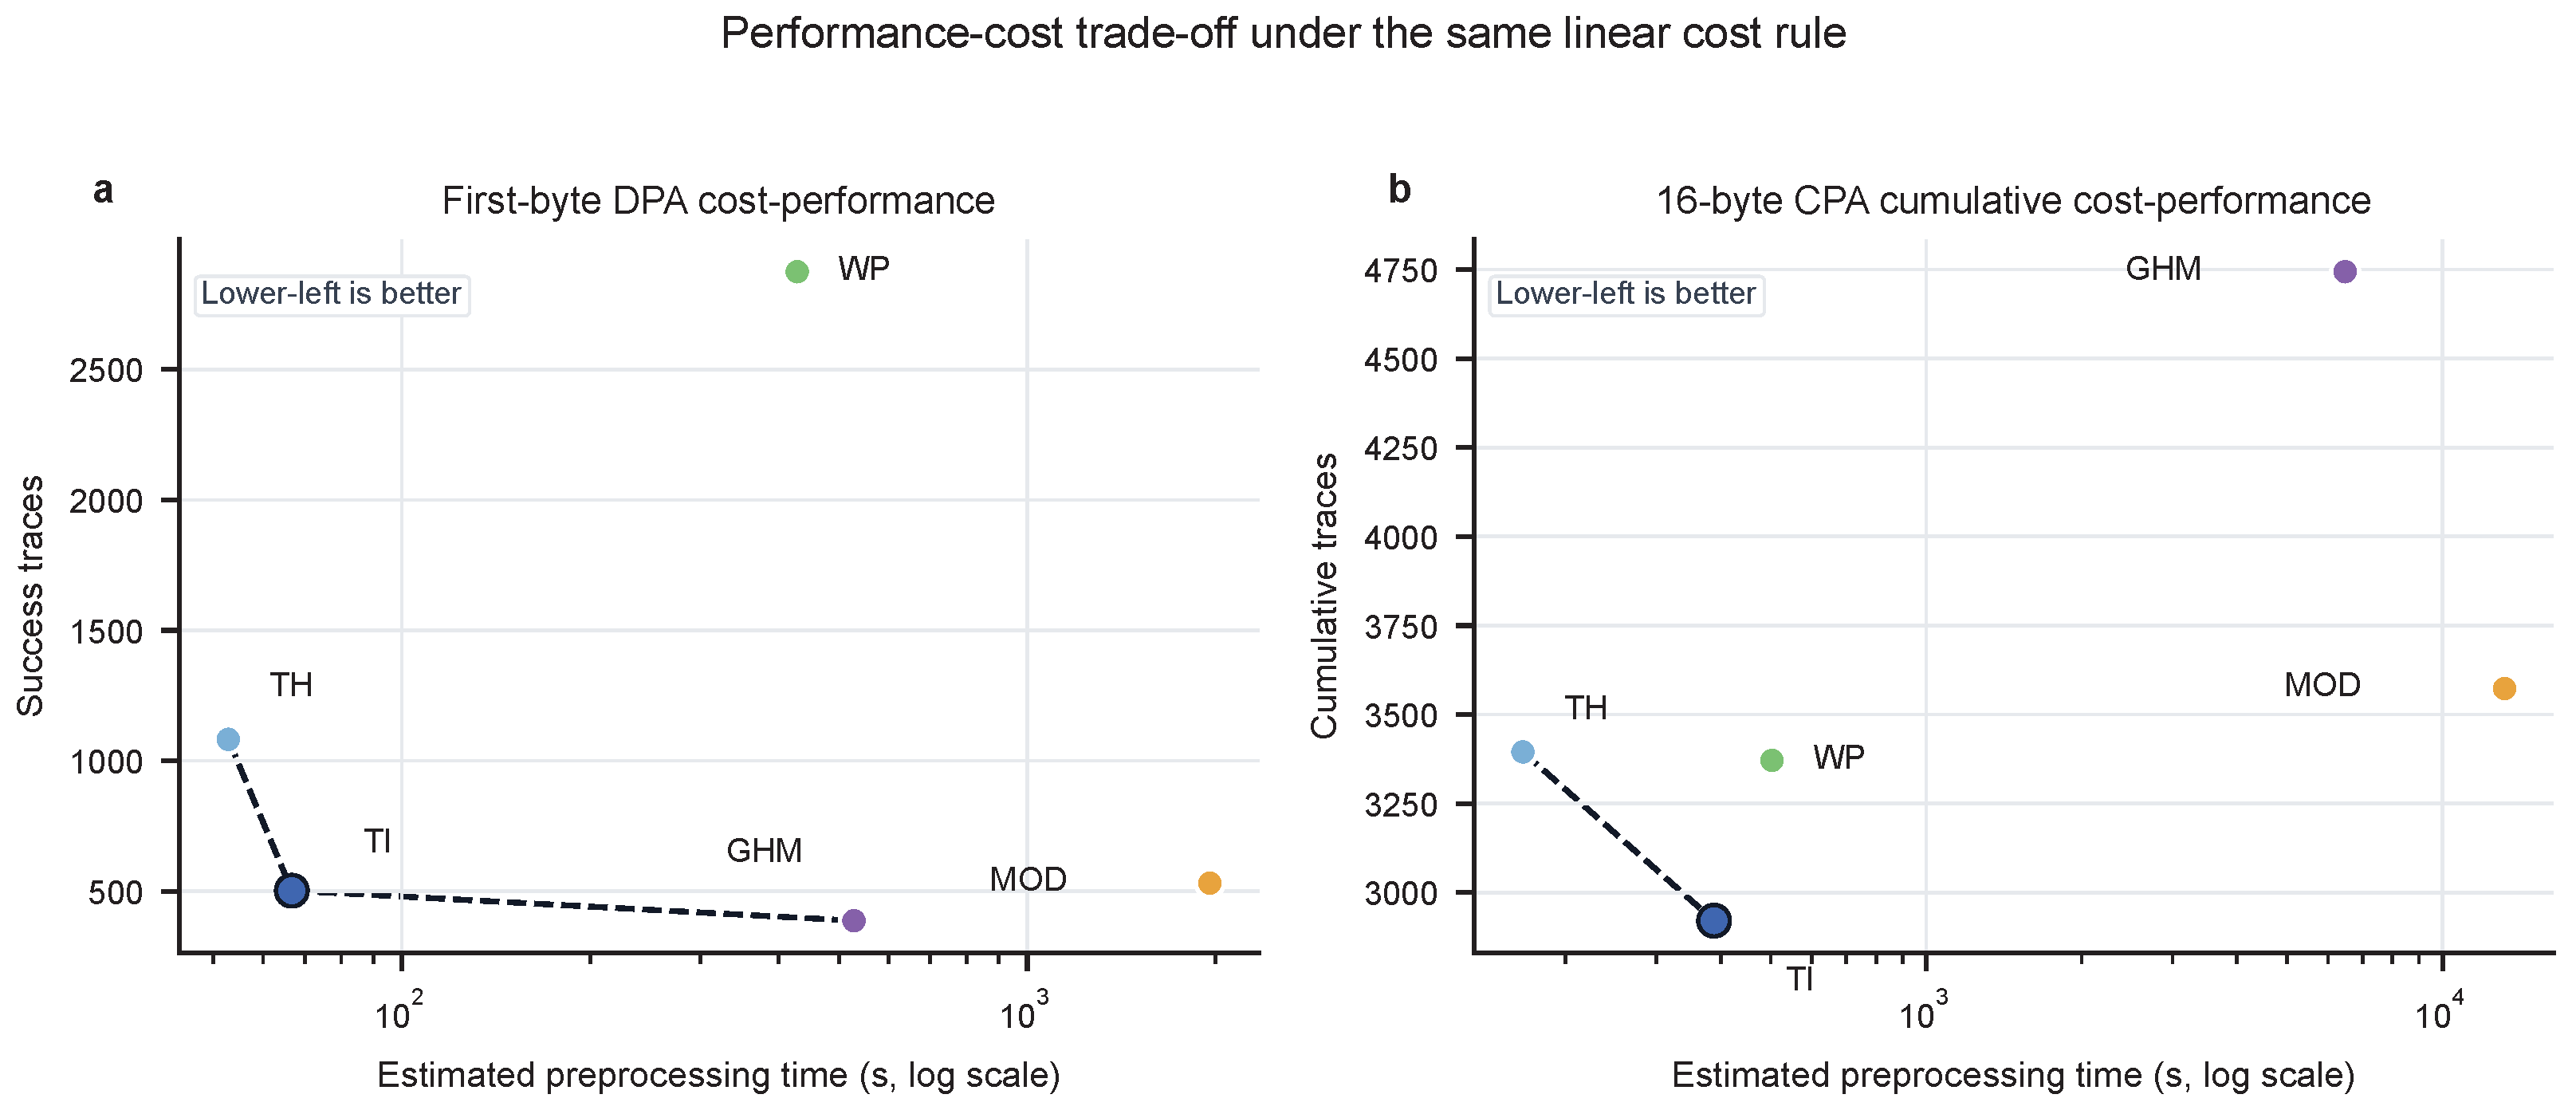
Table 15 shows that GHM ranks first in first-byte DPA statistical performance and reaches 100% success with 387 traces, but its estimated time is 528.4 s. TI reaches 100% success with 502 traces, close to GHM, while its estimated time is only 66.7 s. MOD needs only 531 traces but has a very high 10,000-trace preprocessing time, leading to 1959.2 s estimated time. TH has the lowest processing time and an estimated time of 52.8 s, but its 1082-trace demand is clearly higher than TI and GHM. WP needs 2875 traces and an estimated 428.8 s, so it is not advantageous in either trace demand or estimated cost. These judgments apply only to AES first-byte DPA and are not extended to full-byte DPA.
Table 15.
First-byte DPA performance–cost estimate under a linear assumption.
5.5.3. CPA Cost–Benefit Analysis
CPA cost can be observed from two perspectives. Cumulative trace demand corresponds to the overall cost of per-byte recovery, whereas the maximum byte threshold corresponds to the sample-size constraint when using the same trace batch to recover all bytes. Table 16 applies the same linear-estimation rule to the CPA statistics.
Table 16.
CPA performance–cost dual-metric estimate under a linear assumption.
TI has the lowest CPA cumulative trace demand, 2921, and performs well in mean correlation, weak-byte lower bound, and winning-byte count. Its cumulative-demand estimated time is 388.3 s, much lower than those of MOD and GHM. MOD has the lowest maximum byte threshold, 647, but because its preprocessing time for 10,000 traces is 36,896.8 s, even the maximum-threshold estimate is 2387.2 s, so its overall cost is not competitive. TH has the lowest estimated time, but its CPA statistics are weaker than TI’s; WP is close to TH in cumulative demand but not better than TI; GHM has no advantage in CPA trace demand or cost. Thus, TI is the more suitable overall CPA choice, while MOD has a local advantage only in the maximum byte threshold.
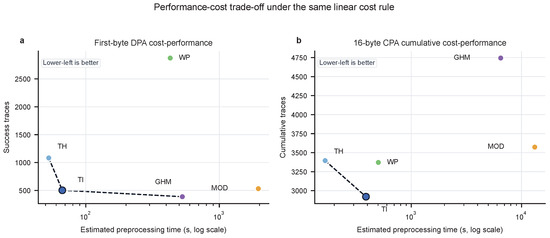
Figure 11 summarizes the performance–cost trade-off in the two attack settings using the same linear cost rule as Table 15 and Table 16. Because preprocessing times span more than one order of magnitude, the horizontal axis uses a logarithmic scale. The figure emphasizes that a method with strong attack statistics can still be less attractive when its preprocessing cost is high, and that the preferred method depends on whether the attack objective is peak-sensitive DPA or cross-byte CPA.
Figure 11.
Performance–cost Pareto visualization under the same linear cost rule. Panel (a) compares first-byte DPA trace demand with preprocessing cost; panel (b) compares 16-byte CPA cumulative trace demand with preprocessing cost. Lower-left positions indicate more favorable trade-offs. Method-label positions were adjusted only for legibility.
5.5.4. Comprehensive Method-Selection Criterion
Combining DPA and CPA results, peak-sensitive attacks such as DPA emphasize local peak fidelity, peak-position stability, and false-peak suppression, whereas global-correlation attacks such as CPA emphasize covariance stability, global smoothing, and pseudo-oscillation suppression. The DPA results mainly come from the AES first-byte case, and the CPA results come from 16-byte statistics.
If the target is first-byte AES DPA statistical performance and preprocessing time is not the main constraint, GHM can be prioritized. If DPA attack effect and computational cost are considered together, TI is a more attractive engineering compromise. If the target is CPA overall correlation stability and cross-byte behavior, TI is the preferred choice. If the most difficult CPA byte threshold is the special focus, MOD has a local advantage but at high preprocessing cost. TH has the lowest preprocessing time, but its attack-statistic benefit is not as prominent as TI or GHM. WP is not advantageous in the DPA/CPA comprehensive comparison. Overall, the method ranked first in statistical performance is not necessarily the best in comprehensive cost. Denoising-method selection should jointly consider attack type, statistical requirement, trace number, and preprocessing cost.
5.6. Extensibility to Other Similarity and Adaptive Decomposition Methods
The proposed evaluation route is not limited to Pearson correlation or to the five wavelet-family denoising methods tested here. For peak-similarity analysis, Spearman correlation, normalized cross-correlation, and cosine similarity can be added when the target is rank stability, waveform-shape similarity, or scale-insensitive vector comparison. Mutual information analysis is also relevant because it can capture nonlinear dependence between key-dependent leakage models and measured traces [18]. These measures should be computed from trace-level samples under a fixed leakage model and attack window, not reconstructed from aggregate CPA tables alone.
Derivative-based or adaptive time-frequency methods can also be considered in the same framework. Wavelet synchrosqueezing refines wavelet-based time-frequency representations and is closely related to empirical-mode-decomposition-like analysis [38]. Empirical mode decomposition is designed for nonlinear and non-stationary signals, and EMD-based denoising has also been studied for side-channel attacks [19,20]. These methods are therefore meaningful extension candidates for non-stationary leakage analysis. In the present paper, they are used to frame the extensibility of the evaluation route rather than to expand the ranked wavelet-family comparison.
6. Conclusions
This paper studied the adaptability between wavelet-denoising preprocessing and DPA/CPA attack statistics in measurement-driven security evaluation of cryptographic implementations in secure information systems. The results show that ordinary SNR and MSE can reflect general reconstruction quality but cannot replace statistical decision metrics in side-channel attacks. DPA relies more on local differential-peak separability near the target instant, whereas CPA relies more on global correlation stability between the theoretical power model and measured traces. Wavelet denoising should therefore be selected according to concrete attack type and statistical requirement, not only by ordinary reconstruction metrics.
On measured power traces from an unprotected AES-128 software implementation on ATMEGA16A, five preprocessing methods were compared: TH, MOD, TI, WP, and GHM. In the DPA experiment, GHM shows strong differential-peak preservation and false-peak suppression in the AES first-byte scenario. It reaches 100% successful attack with 387 traces and a DPA-SNR of about 21.7 with 10,000 traces, obtaining the best first-byte DPA statistical performance within this comparison. TI reaches 100% success with 502 traces and a DPA-SNR of about 17.8, showing a good trade-off between statistical performance and preprocessing cost.
The CPA experiment further shows that DPA and CPA method rankings are inconsistent. In the 16-byte CPA statistics, TI performs better overall in average correlation coefficient, weak-byte lower bound, cumulative trace demand, and winning-byte count. Its average correlation coefficient is about 0.2719, compared with about 0.1025 for Ori, and its cumulative trace demand is 2921. Meanwhile, MOD obtains a favorable maximum byte threshold of 647 traces, indicating that CPA should distinguish cumulative per-byte trace cost from the most difficult byte constraint. These results are consistent with the central judgment of the paper: no single wavelet denoising method has a fixed optimal ranking for all evaluated attack statistics in this controlled setting, and method selection should match the attack decision mechanism.
The resulting preprocessing selection criterion is as follows. For peak-sensitive attacks such as DPA, local peak fidelity, peak-position stability, and false-peak suppression should be prioritized. For global-correlation attacks such as CPA, shift invariance, global smoothness, covariance stability, and pseudo-oscillation suppression should be prioritized. When computing resources are limited or the attack path is not yet fixed, TI can be used as a practical compromise between DPA/CPA effect and preprocessing cost. Within a comparable evaluation protocol, this criterion can help reduce unguided trial-and-error in denoising selection, but it should not be interpreted as a platform-independent rule without revalidation.
The conclusions are bounded by the ATMEGA16A platform, the unprotected AES-128 software implementation, fixed acquisition conditions, and the five wavelet denoising methods evaluated here. The rankings should therefore be used as attack-statistic selection guidance for this controlled setting, not as general signal-processing rules. The same evaluation route can be extended to more chip platforms, sampling conditions, leakage models, and attack windows, and can include full-byte DPA statistics, cross-dataset stability analysis, guessing-entropy and success-rate curves, multi-key and masked-implementation validation, non-wavelet denoising baselines, mutual-information analysis, wavelet synchrosqueezing, EMD-based adaptive decomposition, template attacks, and deep-learning-assisted attacks.
Author Contributions
Conceptualization, Y.Z.; methodology, Y.Z.; investigation, Y.Z.; formal analysis, Y.Z. and J.W.; validation, Y.Z., C.X. and L.Z.; resources, J.W., C.X. and L.Z.; writing—original draft preparation, Y.Z.; writing—review and editing, J.W., C.X. and L.Z.; visualization, Y.Z.; supervision, J.W., C.X. and L.Z.; project administration, J.W. and L.Z. All authors have read and agreed to the published version of the manuscript.
Funding
This work was supported by the Fundamental Research Funds for the Central Universities under Grant Nos. 3282025047, 3282024051, and 3282024009.
Institutional Review Board Statement
Not applicable.
Informed Consent Statement
Not applicable.
Data Availability Statement
The aggregate data supporting the reported tables and figures are available from the corresponding author upon reasonable request. The shared data correspond to the aggregate attack summaries and figure/table source data underlying the analyses reported in this manuscript.
Conflicts of Interest
The authors declare no conflicts of interest. The funders had no role in the design of the study; in the collection, analyses, or interpretation of data; in the writing of the manuscript; or in the decision to publish the results.
References
- Kocher, P.C. Timing Attacks on Implementations of Diffie-Hellman, RSA, DSS, and Other Systems. In Proceedings of the Advances in Cryptology—CRYPTO ’96; Lecture Notes in Computer Science; Springer: Berlin/Heidelberg, Germany, 1996; Volume 1109, pp. 104–113. [Google Scholar] [CrossRef] [Scilit] [PubMed]
- Kocher, P.C.; Jaffe, J.; Jun, B. Differential Power Analysis. In Proceedings of the Advances in Cryptology—CRYPTO ’99; Lecture Notes in Computer Science; Springer: Berlin/Heidelberg, Germany, 1999; Volume 1666, pp. 388–397. [Google Scholar] [CrossRef] [Scilit] [PubMed]
- Messerges, T.S.; Dabbish, E.A.; Sloan, R.H. Examining Smart-Card Security under the Threat of Power Analysis Attacks. IEEE Trans. Comput. 2002, 51, 541–552. [Google Scholar] [CrossRef] [Scilit]
- Kocher, P.; Jaffe, J.; Jun, B.; Rohatgi, P. Introduction to Differential Power Analysis. J. Cryptogr. Eng. 2011, 1, 5–27. [Google Scholar] [CrossRef] [Scilit]
- Gu, D.; Zhang, C.; Lu, X. Progress of and Some Comments on the Research of Side-Channel Attack for Cryptosystems. J. Xidian Univ. 2021, 48, 14–21. (In Chinese) [Google Scholar] [CrossRef]
- Brier, E.; Clavier, C.; Olivier, F. Correlation Power Analysis with a Leakage Model. In Proceedings of the Cryptographic Hardware and Embedded Systems—CHES 2004; Lecture Notes in Computer Science; Springer: Berlin/Heidelberg, Germany, 2004; Volume 3156, pp. 16–29. [Google Scholar] [CrossRef] [Scilit]
- Chari, S.; Rao, J.R.; Rohatgi, P. Template Attacks. In Proceedings of the Cryptographic Hardware and Embedded Systems—CHES 2002; Lecture Notes in Computer Science; Springer: Berlin/Heidelberg, Germany, 2003; Volume 2523, pp. 13–28. [Google Scholar] [CrossRef] [Scilit] [PubMed]
- Mangard, S.; Oswald, E.; Popp, T. Power Analysis Attacks: Revealing the Secrets of Smart Cards; Springer: Boston, MA, USA, 2007. [Google Scholar] [CrossRef] [Scilit]
- Standaert, F.X.; Malkin, T.G.; Yung, M. A Unified Framework for the Analysis of Side-Channel Key Recovery Attacks. In Proceedings of the Advances in Cryptology—EUROCRYPT 2009; Lecture Notes in Computer Science; Springer: Berlin/Heidelberg, Germany, 2009; Volume 5479, pp. 443–461. [Google Scholar] [CrossRef] [Scilit]
- Whitnall, C.; Oswald, E. A Fair Evaluation Framework for Comparing Side-Channel Distinguishers. J. Cryptogr. Eng. 2011, 1, 145–160. [Google Scholar] [CrossRef] [Scilit]
- Le, T.H.; Clediere, J.; Serviere, C.; Lacoume, J.L. Noise Reduction in Side Channel Attack Using Fourth-Order Cumulant. IEEE Trans. Inf. Forensics Secur. 2007, 2, 710–720. [Google Scholar] [CrossRef] [Scilit]
- Debande, N.; Souissi, Y.; El Aabid, M.A.; Guilley, S.; Danger, J.L. Wavelet Transform Based Pre-Processing for Side Channel Analysis. In Proceedings of the 2012 45th Annual IEEE/ACM International Symposium on Microarchitecture Workshops; IEEE: New York, NY, USA, 2012; pp. 32–38. [Google Scholar] [CrossRef] [Scilit]
- Liu, W.; Wu, L.; Zhang, X.; Wang, A. Wavelet-Based Noise Reduction in Power Analysis Attack. In Proceedings of the 2014 Tenth International Conference on Computational Intelligence and Security; IEEE: New York, NY, USA, 2014; pp. 405–409. [Google Scholar] [CrossRef] [Scilit]
- Duan, X.; She, G.; Gao, X.; He, S.; Cui, Q.; Wang, S.; Mao, Z. Correlation Power Analysis Attack for AES Based on Wavelet Packet. Comput. Eng. 2017, 43, 84–91. (In Chinese) [Google Scholar] [CrossRef]
- Duan, X.; She, G.; Gao, X.; Fang, H.; He, S.; Chen, D. Power Analysis Attack Based on GHM Multiwavelet Algorithm. Appl. Res. Comput. 2017, 34, 2777–2781. (In Chinese) [Google Scholar] [CrossRef]
- Yang, G.; Li, H.; Ming, J.; Zhou, Y. CDAE: Towards Empowering Denoising in Side-Channel Analysis. In Information and Communications Security; Lecture Notes in Computer Science; Springer International Publishing: Cham, Switzerland, 2020; Volume 11999, pp. 269–286. [Google Scholar] [CrossRef] [Scilit]
- Zhao, Y.; Wang, Q.; Ma, H.; Zhang, Q.; Ye, M.; Wang, H.; He, J. Side Channel Analysis Optimization Method Based on Data Preprocessing. J. Electron. Inf. Technol. 2023, 45, 49–58. (In Chinese) [Google Scholar] [CrossRef]
- Gierlichs, B.; Batina, L.; Tuyls, P.; Preneel, B. Mutual Information Analysis. In Cryptographic Hardware and Embedded Systems—CHES 2008; Lecture Notes in Computer Science; Springer: Berlin, Germany, 2008; pp. 426–442. [Google Scholar] [CrossRef] [Scilit]
- Huang, N.E.; Shen, Z.; Long, S.R.; Wu, M.C.; Shih, H.H.; Zheng, Q.; Yen, N.C.; Tung, C.C.; Liu, H.H. The Empirical Mode Decomposition and the Hilbert Spectrum for Nonlinear and Non-Stationary Time Series Analysis. Proc. R. Soc. London Ser. A Math. Phys. Eng. Sci. 1998, 454, 903–995. [Google Scholar] [CrossRef] [Scilit]
- Feng, M.; Zhou, Y.; Yu, Z. EMD-Based Denoising for Side-Channel Attacks and Relationships between the Noises Extracted with Different Denoising Methods. In Information and Communications Security; Lecture Notes in Computer Science; Springer International Publishing: Cham, Switzerland, 2013; pp. 259–274. [Google Scholar] [CrossRef] [Scilit]
- Fu, Y.; Liu, Z.; Lyu, J. Transferable Adversarial Attacks for Remote Sensing Object Recognition via Spatial-Frequency Co-Transformation. IEEE Trans. Geosci. Remote Sens. 2024, 62, 1–12. [Google Scholar] [CrossRef] [Scilit]
- Fu, Y.; Bai, Y.; Lyu, J.; Pan, B.; Liu, Z.; Ng, M.K. Transferability Reinforcement of Adversarial Attacks for Remote Sensing Image Classification via Hierarchical Transformation Composition. IEEE Trans. Geosci. Remote Sens. 2026, 64, 5624715. [Google Scholar] [CrossRef] [Scilit]
- Mallat, S.G. A Theory for Multiresolution Signal Decomposition: The Wavelet Representation. IEEE Trans. Pattern Anal. Mach. Intell. 1989, 11, 674–693. [Google Scholar] [CrossRef] [Scilit]
- Donoho, D.L. De-Noising by Soft-Thresholding. IEEE Trans. Inf. Theory 1995, 41, 613–627. [Google Scholar] [CrossRef] [Scilit]
- Mallat, S. A Wavelet Tour of Signal Processing, 2nd ed.; Academic Press: San Diego, CA, USA, 1999. [Google Scholar]
- Coifman, R.R.; Donoho, D.L. Translation-Invariant De-Noising. In Wavelets and Statistics; Antoniadis, A., Oppenheim, G., Eds.; Springer: New York, NY, USA, 1995; pp. 125–150. [Google Scholar] [CrossRef] [Scilit]
- Mallat, S.; Hwang, W.L. Singularity Detection and Processing with Wavelets. IEEE Trans. Inf. Theory 1992, 38, 617–643. [Google Scholar] [CrossRef] [Scilit]
- Coifman, R.R.; Wickerhauser, M.V. Entropy-Based Algorithms for Best Basis Selection. IEEE Trans. Inf. Theory 1992, 38, 713–718. [Google Scholar] [CrossRef] [Scilit]
- Geronimo, J.S.; Hardin, D.P.; Massopust, P.R. Fractal Functions and Wavelet Expansions Based on Several Scaling Functions. J. Approx. Theory 1994, 78, 373–401. [Google Scholar] [CrossRef] [Scilit]
- Chui, C.K.; Lian, J.A. A Study of Orthonormal Multi-Wavelets. Appl. Numer. Math. 1996, 20, 273–298. [Google Scholar] [CrossRef] [Scilit]
- Bui, T.D.; Chen, G. Translation-Invariant Denoising Using Multiwavelets. IEEE Trans. Signal Process. 1998, 46, 3414–3420. [Google Scholar] [CrossRef]
- Crocetti, L.; Baldanzi, L.; Bertolucci, M.; Sarti, L.; Carnevale, B.; Fanucci, L. A Simulated Approach to Evaluate Side-Channel Attack Countermeasures for the Advanced Encryption Standard. Integration 2019, 68, 80–86. [Google Scholar] [CrossRef] [Scilit]
- Ikezaki, Y.; Nozaki, Y.; Yoshikawa, M. Countermeasure Aware Power Analysis Attack and Its Evaluation. IEEJ Trans. Electron. Inf. Syst. 2016, 136, 1621–1628. [Google Scholar] [CrossRef] [Scilit]
- Duan, X.; Chen, D.; Gao, X.; Fan, X.; Jin, J. Research and Implementation of Correlation Power Analysis Based on Wavelet Transform. Appl. Res. Comput. 2020, 37, 1119–1124. (In Chinese) [Google Scholar] [CrossRef]
- Prouff, E.; Rivain, M. Masking against Side-Channel Attacks: A Formal Security Proof. In Advances in Cryptology—EUROCRYPT 2013; Lecture Notes in Computer Science; Springer: Berlin, Germany, 2013; Volume 7881, pp. 142–159. [Google Scholar] [CrossRef] [Scilit]
- Prouff, E.; Rivain, M.; Bevan, R. Statistical Analysis of Second Order Differential Power Analysis. IEEE Trans. Comput. 2009, 58, 799–811. [Google Scholar] [CrossRef] [Scilit]
- Choudary, O.; Kuhn, M.G. Efficient Template Attacks. In Smart Card Research and Advanced Applications; Lecture Notes in Computer Science; Springer International Publishing: Cham, Germany, 2014; Volume 8419, pp. 253–270. [Google Scholar] [CrossRef] [Scilit]
- Daubechies, I.; Lu, J.; Wu, H.T. Synchrosqueezed Wavelet Transforms: An Empirical Mode Decomposition-Like Tool. Appl. Comput. Harmon. Anal. 2011, 30, 243–261. [Google Scholar] [CrossRef] [Scilit]

Disclaimer/Publisher’s Note: The statements, opinions and data contained in all publications are solely those of the individual author(s) and contributor(s) and not of MDPI and/or the editor(s). MDPI and/or the editor(s) disclaim responsibility for any injury to people or property resulting from any ideas, methods, instructions or products referred to in the content. |
© 2026 by the authors. Licensee MDPI, Basel, Switzerland. This article is an open access article distributed under the terms and conditions of the Creative Commons Attribution (CC BY) license.