


Abstract
This work presents an automated vision-based measurement system designed for the precise dimensional characterization of high-aspect-ratio micro-holes, achieving a relative dimensional error of less than 1% for characterizing high-aspect-ratio damage geometries. The system integrates coaxial microscopic imaging with a precision motorized scanning stage. To ensure high-fidelity measurements in early-stage warning applications, depth is determined using a focus variation method driven by a robust data fusion strategy. By capturing a sequence of images along the Z-axis, the focal planes of the defect’s surface orifice and internal base are automatically identified using a data fusion algorithm based on a consensus evaluation of three parallel sharpness metrics (Tenengrad, Laplacian, and Brenner variants). The Z-axis scanning module, featuring encoder feedback and bi-directional compensation, achieves a repeated positioning error of ±0.5 µm. For lateral damage assessment, the system’s high magnification provides an effective sampling resolution of 0.09 µm. The equivalent diameter of the focused orifice image is calculated through a robust pipeline involving adaptive thresholding, morphological filtering, and sub-pixel ellipse fitting, which serves as a highly sensitive indicator for early-stage structural deformation. The entire process can be completed within five minutes, demonstrating a rapid, highly accurate, and localized optical inspection solution that generates high-precision dimensional data crucial for quality inspection in aerospace and precision engineering.
1. Introduction
In high-technology sectors such as aerospace and precision engineering, ensuring structural integrity through rigorous Structural Health Monitoring is of paramount importance. Critical components, such as turbine blades with thermal barrier cooling holes, are highly susceptible to micro-structural degradation, thermal fatigue, and micro-cavity wear. The geometric accuracy and evolutionary changes in these high-aspect-ratio features directly dictate key performance metrics and serve as primary indicators of structural damage. As manufacturing and material technologies continue to advance, traditional contact-based measurement methods are becoming inadequate due to risks of secondary surface damage and the inability to access deep, blind-hole defects [1,2,3,4]. Consequently, the development of advanced electronic control and computer vision techniques has become an urgent necessity to achieve automated and localized dimensional verification.
As manufacturing technologies advance, accurate dimensional verification becomes critical. While tactile Coordinate Measuring Machines (CMMs) and stylus profilometers remain standard for macro-scale component inspection, their probe dimensions and contact forces limit their application in high-aspect-ratio micro-cavities due to accessibility constraints. Consequently, non-contact optical techniques are necessary for localized measurement.
Other advanced optical metrology techniques also present specific trade-offs. White Light Interferometry (WLI) and structured light projection offer exceptional surface profiling but frequently suffer from severe data dropout inside deep, high-aspect-ratio blind holes due to occlusion and steep sidewall angles. Commercial focus variation systems (e.g., those developed by Alicona or Keyence) are highly capable and established industry benchmarks. However, they are often cost-prohibitive and utilize generalized algorithms that may not be optimized for the specific severe sidewall scattering typical of deep micro-cooling holes. The proposed system aims to provide a custom, cost-effective alternative that achieves comparable sub-micron accuracy (<1% relative error) tailored specifically for these extreme geometric constraints.
Currently, while multi-source sensing frameworks—such as Guided Wave and Fiber Optic Sensing—provide excellent macro-scale and continuous global monitoring, high-precision localized computer vision scanning remains irreplaceable for verifying local defect geometries and providing exact dimensional ground-truth data for component geometry profiling. However, existing vision-based techniques face significant challenges when applied to high-aspect-ratio micro-cavities. Confocal microscopy [5,6,7], despite its sub-micron resolution, is fundamentally limited by its shallow depth of field, narrow field of view, and low inspection efficiency. The classic Foucault knife-edge test is similarly impractical for applications [8], as precisely positioning the knife-edge inside a deep micro-hole is mechanically restrictive and highly sensitive to environmental vibrations.
To address these challenges, this paper proposes a measurement system based on the ‘’Focus Variation’’ principle. By integrating a coaxial microscope with a precision motorized Z-axis stage [9], the system transforms depth measurement into a sharpness peak-detection problem. A novel data fusion strategy using a ‘’multi-metric consensus’’ algorithm and ‘’skipped subset analysis’’ strategy are developed to robustly identify the orifice and base focal planes, achieving automated, high-precision measurement of micro-hole geometric parameters with a relative error of <1% in under five minutes.
The remainder of this manuscript is organized as follows. Section 2 details the proposed automated measurement methodology, focusing on the feature-level metric fusion and the skipped subset analysis for dual-focal-plane localization. Section 3 outlines the experimental configuration and clearly separates system calibration from validation. Section 4 presents the quantitative results, statistical analysis, and discussion of system robustness. Finally, Section 5 concludes the paper, highlighting key scientific contributions and specific avenues for future integration into broader monitoring frameworks.
2. Materials and Data Fusion Methods
The core of this methodology lies in reconstructing high-fidelity 3D geometric data to support the defect inspection from the variation in image sharpness during an axial scan, combined with machine vision algorithms for the accurate extraction of lateral damage dimensions. The automation and high precision of this electronic control and computer vision system are primarily achieved through a custom data fusion algorithm suite.
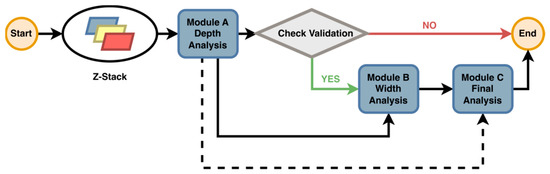
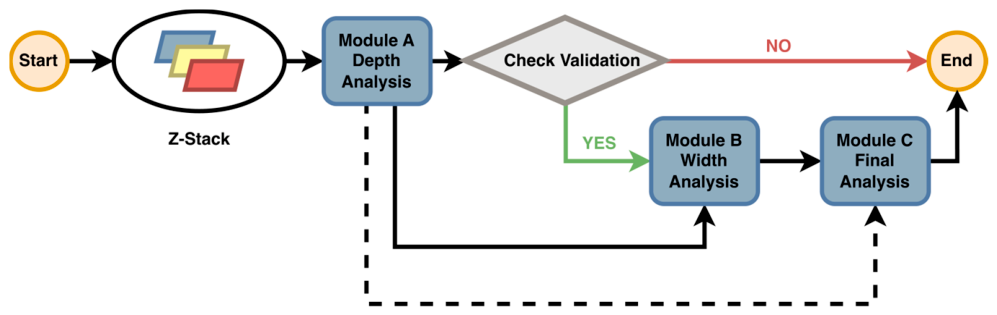
The overall workflow, as illustrated in Figure 1, consists of two main parallel tasks: depth measurement of the micro-cavity based on the image sequence, and lateral defect characterization based on a single focused frame. The workflow sequentially integrates depth (Module A), width (Module B), and final (Module C) analyses via a comprehensive data fusion framework, featuring a validation gate and iterative feedback loops to ensure high-precision assessment.
Figure 1.
Flowchart of the automated algorithm for micro-hole characterization. The workflow sequentially integrates depth (Module A), width (Module B), and final (Module C) analyses, featuring a validation gate and iterative feedback loops to ensure high-precision reconstruction.
2.1. Robust Dual-Focal-Plane Localization via Multi-Metric Data Fusion
The theoretical foundation of defect inspection via machine vision rests on a core synergy between the “Focus Variation” (FV) principle and advanced algorithmic feature-level metric fusion. This method leverages the extremely shallow depth of field (DoF) of the high-magnification microscope objective to perform dimensional measurement on deep, high-aspect-ratio features.
By executing a precision Z-axis scan driven by electronic control, the system acquires an image sequence that captures the object as it moves through the focal plane, from the defect’s surface opening (orifice) to its internal base. To automatically and robustly identify the precise focal planes despite the environmental noise typical in micro-hole measurement, the system employs a feature-level metric fusion strategy. We quantify image sharpness through the parallel computation and consensus evaluation of three complementary indicators: the Tenengrad gradient, Laplacian variance, and Brenner gradient. These fused metrics generate a highly robust bimodal (two-peak) curve against the Z-axis displacement, securely “locking” the optimal focus frames. The machine vision algorithm then performs its damage geometry measurements only on these optimal frames.
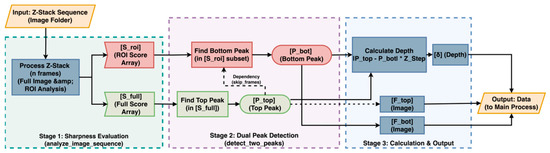
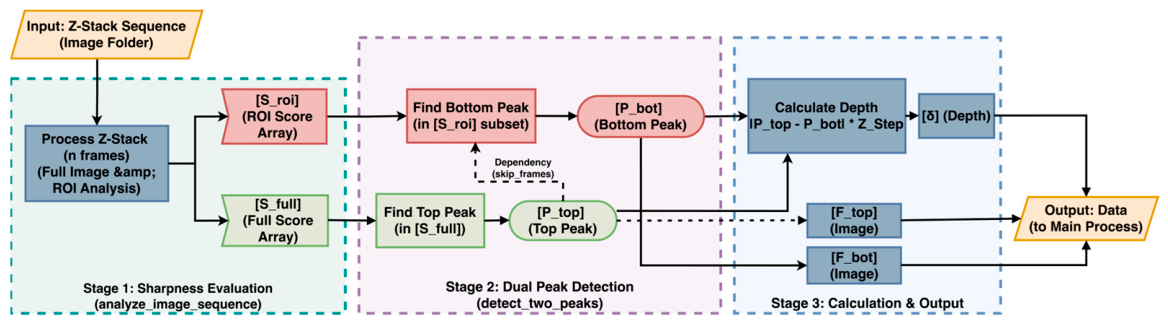
The following Figure 2 illustrates a computer vision processing pipeline. This workflow commences with the “Z-axis Image Sequence Acquisition” module, which provides the input data. This sequence subsequently feeds into the “Parallel Multi-Metric Clarity Assessment” stage. The resulting focus curve is then utilized by the “Bimodal Focal Plane Identification” module to precisely isolate the optimal image frames for the orifice and the bottom. Finally, the locked “Optimal Orifice Frame” is passed to the “Sub-pixel Elliptical Fitting Measurement” algorithm, which outputs the high-precision micro-hole diameter parameters.
Figure 2.
Schematic representation of the processing pipeline based on focus variation. The system identifies the orifice and bottom focal planes through a multi-stage analysis involving sharpness evaluation and dual-peak detection, culminating in the output of depth data and focused imagery.
2.1.1. Synergistic Mechanism of Focus Variation and Machine Vision
Focus Variation leverages the limited depth of field of a microscope objective to reconstruct three-dimensional information from a series of two-dimensional images. The system utilizes a high-precision electronically controlled motorized stage to drive the structural component along the Z-axis (optical axis) in discrete, precise steps. During this scan, an industrial camera synchronously acquires a sequence of 2D images at different focal planes, forming an image stack for subsequent data fusion processing.
Due to the shallow depth of field, only a narrow region of the object is in sharp focus in any single image. As the sample is scanned, different axial positions come into focus. The system’s core task is to identify the two specific frames in the sequence that correspond to the sharpest focus of the micro-hole’s top orifice and bottom base, respectively.
To autonomously determine the precise focal planes, the system employs a multi-metric fusion strategy. We utilize three complementary sharpness indicators: the Tenengrad gradient (sensitive to edge strength), the Variance of Laplacian (sensitive to high-frequency texture), and the Brenner gradient (computationally efficient for differences). Instead of relying on a single metric, parallel computation of these indicators is fused and normalized to [0, 1], ensuring robustness against noise and surface texture variations [10,11,12].
The Tenengrad gradient (FTenengrad), sensitive to edge strength, is computed using Sobel operators:
The Variance of Laplacian (FLaplacian), capturing high-frequency texture, is defined as
where is the mean of the Laplacian of the image.
The Brenner gradient (FBrenner), providing efficient vertical difference computation, is calculated as
Instead of relying on a single metric, the outputs of these three formulas are computed in parallel and normalized to the range [0, 1] (feature-level metric fusion), ensuring robustness against surface texture variations.
2.1.2. Targeted Frame Selection Strategy and Multi-Metric Fusion Model
This section details a robust, two-stage methodology for the automated selection and validation of optimal focus frames from a Z-axis image stack. To enhance computational efficiency and significantly improve the signal-to-noise ratio under complex operational environments typical of micro-hole measurement, the process initiates by localizing a Region of Interest (ROI), which critically aids the detection of the fainter internal damage base peak. This strategy employs the parallel computation of four complementary, standardized (normalized to [0, 1]) sharpness functions. Reliability is ensured through a rule-based data fusion mechanism, termed the “peak coincidence judgment mechanism,” which confirms a true focal plane using a strict mathematical condition. First, a “peak” is explicitly defined as a local maximum within a sliding evaluation window of 20 frames. Second, a focal position is validated as “coincident” only when the local maxima of at least three independent normalized metrics (MTenengrad, MLaplacian, MBrenner) occur within a strict frame index tolerance of 1 frame. Finally, this coincident peak must exhibit a peak-to-valley dynamic range strictly exceeding 30%, an empirically tuned threshold determined during system calibration to robustly isolate the true signal from baseline mechanical fluctuations.
To unambiguously distinguish the structural defect’s surface boundary (Norifice) from its internal damage base (Nbase), the algorithm introduces a “skipped subset analysis strategy.” This decoupled search model leverages the initial localization of the prominent surface boundary peak to intelligently constrain the search space for the deeper damage base peak. This method effectively prevents misidentification caused by structural sidewall artifacts or scattering noise, thereby greatly enhancing the stability and accuracy. With the targeted ROI defined, the algorithm evaluates the entire captured image sequence. This frame selection process is structurally critical, as its metrological effectiveness is validated by quantifying the sharpness enhancement for subsequent feature recognition; for instance, the selected optimal focus frames demonstrate an edge contrast enhancement of over 40% compared to out-of-focus states.
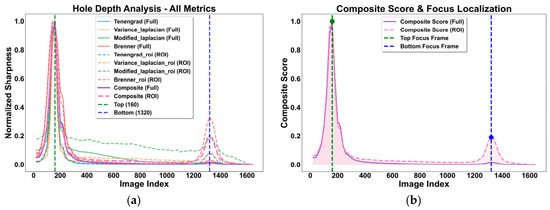
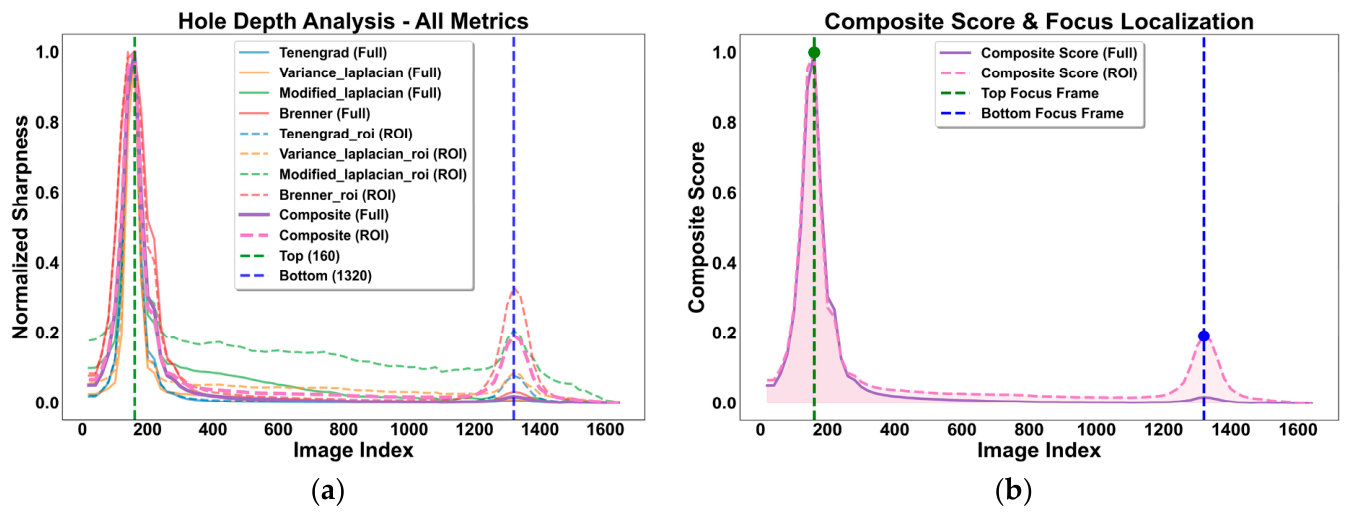
This targeted selection strategy is robustly validated by the comparative evaluation results shown in Figure 3. As illustrated in Figure 3a, single-metric evaluations utilizing the full image (solid lines) are heavily dominated by the high-contrast surface opening signal and entirely fail to discern the low-contrast micro-features at the damage base. While restricting the sharpness analysis to a targeted ROI enhances localized sensitivity (dashed lines), individual metrics—particularly the Brenner gradient variant—remain highly susceptible to environmental noise and exhibit significant spurious peaks in the intermediate scanning region. In contrast, the Composite Score formulated via our data fusion architecture (highlighted in Figure 3b) effectively mitigates these baseline instability issues. By multi-metric data synthesis of the normalized outputs, the algorithm successfully suppresses random mechanical noise and surface artifacts, generating a clean, robust bimodal curve represented by the pink shaded area in Figure 3b.
Figure 3.
Focal plane localization performance. (a) Individual sharpness metrics (Tenengrad, Laplacian, Brenner), highlighting signal enhancement via ROI processing (dashed lines) over full-image analysis (solid lines). (b) Multi-metric strategy. The ROI-based composite curve (pink dashed line) effectively suppresses noise and resolves the bimodal peaks of the micro-hole initiation boundary (Index 160) and internal damage base (Index 1320) for accurate depth characterization.
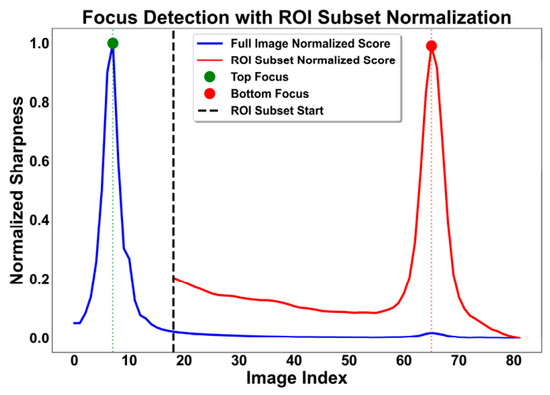
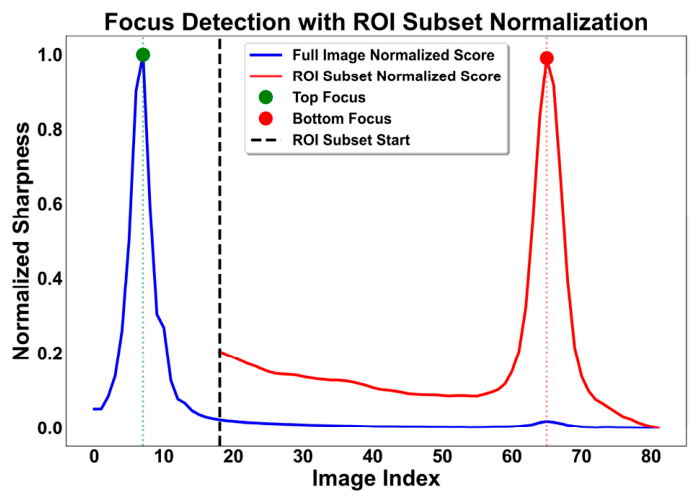
This fused data metric guarantees a peak-to-valley dynamic range exceeding 30%, enabling the monitoring system to unambiguously lock onto the precise focal planes of both the Top Focus (Index 160) and Bottom Focus (Index 1320) for high-precision assessment and early warning. Building upon the robust “multi-metric consensus” curves established in the previous analysis, Figure 4 illustrates the execution of the “skipped subset analysis” strategy employed to decouple the identification of the top surface boundary and bottom base focal planes. This figure plots two distinct, normalized composite scores against the Image Index (Z-axis position driven by electronic scanning), plotting the full-image normalized score against the ROI subset normalized score.
Figure 4.
Illustration of the “skipped subset analysis” strategy for decoupled focal plane identification. The computer vision algorithm prioritizes the full-image signal (blue) to lock the orifice peak, utilizing this position to define a starting boundary (dashed line) for the ROI-based search (red), thereby isolating the bottom peak detection from top-surface interference.
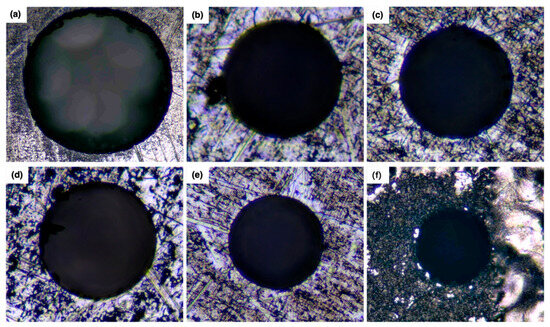
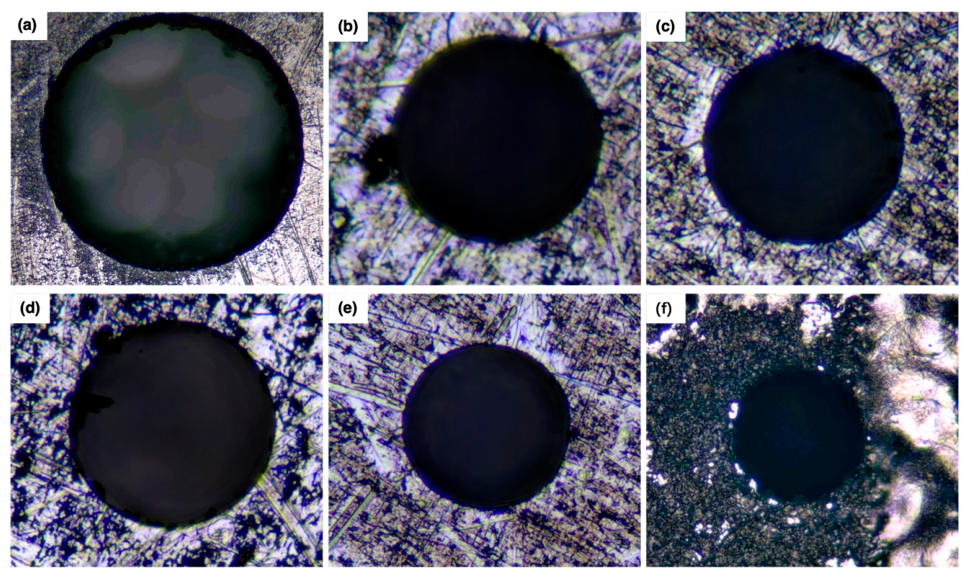
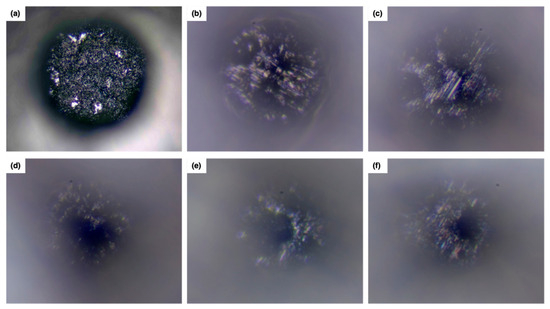
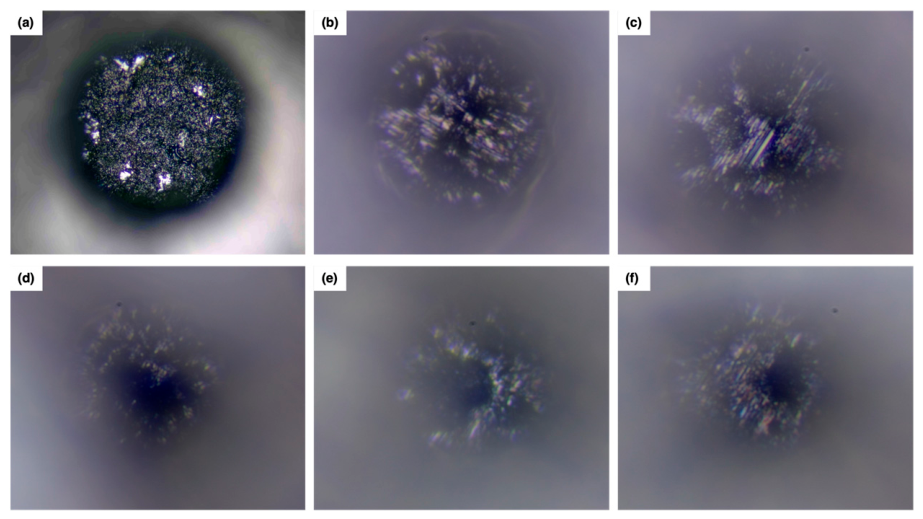
The subsequent image sequence, presented in Figure 5, visualizes the actual image frames captured at the primary sharpness peak during the electronic control scanning process. This visually confirms that the feature-level metric fusion algorithm has successfully locked onto the perfectly in-focus plane of the micro-hole initiation boundary. As depicted in Figure 5a–f, the targeted computer vision detection algorithm demonstrates highly successful focus retrieval across widely varying damage aperture dimensions, complex material surface textures, and fluctuating illumination conditions, thereby validating its robustness for real-world applications.
Figure 5.
Representative images acquired via electronic control scanning of micro-hole orifices identified by the Top Focus detection algorithm, where (a–f) demonstrate successful focus retrieval across widely varying aperture dimensions, material surface textures, and illumination conditions.
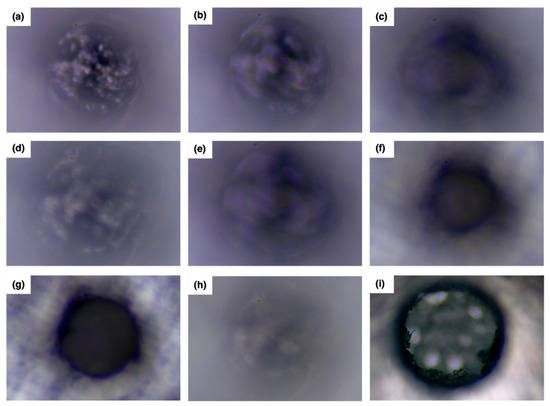
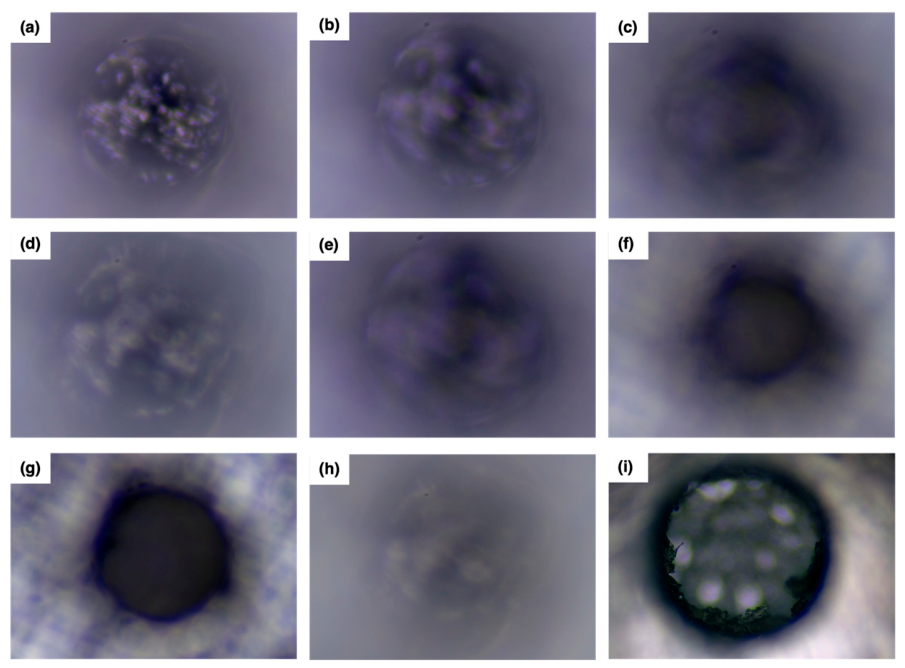
For metrological comparison, Figure 6 illustrates typical intermediate frames extracted from the Z-axis electronically controlled scanning process. These frames correspond to the low-clarity “trough” region of the multi-metric fusion bimodal curve, observably residing in a significantly defocused and blurred state. As shown in Figure 6a–i, these intermediate regions exhibit a pronounced lack of feature resolution required for computer vision analysis, regardless of the diverse target geometries, structural material properties, or lighting environments.
Figure 6.
Visual characterization of the defocused state in the intermediate scan region driven by electronic control, in which (a–i) exhibit a pronounced lack of computer vision feature resolution and substantial blurring irrespective of the diverse target geometries, material properties, and lighting environments.
Finally, Figure 7 displays the precisely focused images of the internal damage base, which were successfully identified and locked by the secondary peak utilizing the ROI-based subset analysis. The representative images acquired via electronic control scanning in Figure 7a–f attest to the accurate recovery of basal surface wear details, maintaining high fidelity independent of variations in cavity depth scale, structural substrate characteristics, or lighting parameters for subsequent computer vision evaluation.
Figure 7.
Representative images acquired via electronic control scanning of the micro-hole base isolated via the ROI-based secondary peak detection, wherein (a–f) attest to the accurate recovery of basal surface details independent of variations in cavity scale, substrate characteristics, or lighting parameters.
In summary, the multi-metric consensus established in Figure 4 demonstrates a highly effective dual-stage focal localization process: the primary evaluation curve securely identifies the top surface boundary using the full image, while the dynamically gated ROI subset analysis reliably isolates the internal damage base. This advanced data fusion strategy effectively overcomes the inherent challenges of dual-peak localization in deep, high-aspect-ratio micro-hole measurement, ensuring the extraction of accurate dimensional ground-truth data for subsequent analysis.
The formal novelty of this framework, distinguishing it from conventional multi-focus image fusion, lies in this “skipped subset analysis”. Traditional focus measures often fail in high-aspect-ratio scenarios due to severe optical scattering from the cavity sidewalls. By intelligently gating the search space relative to the primary surface peak, this method successfully decouples the internal base signal from intermediate noise, ensuring robust generalization across varying hole geometries.
2.2. Lightweight Computer Vision Pipeline for the Micro-Hole Measurement via Sub-Pixel Ellipse Fitting
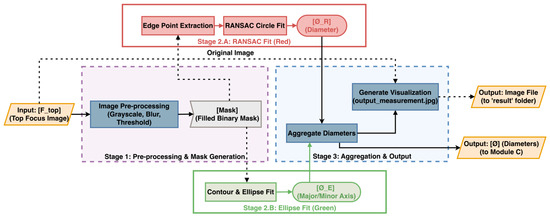
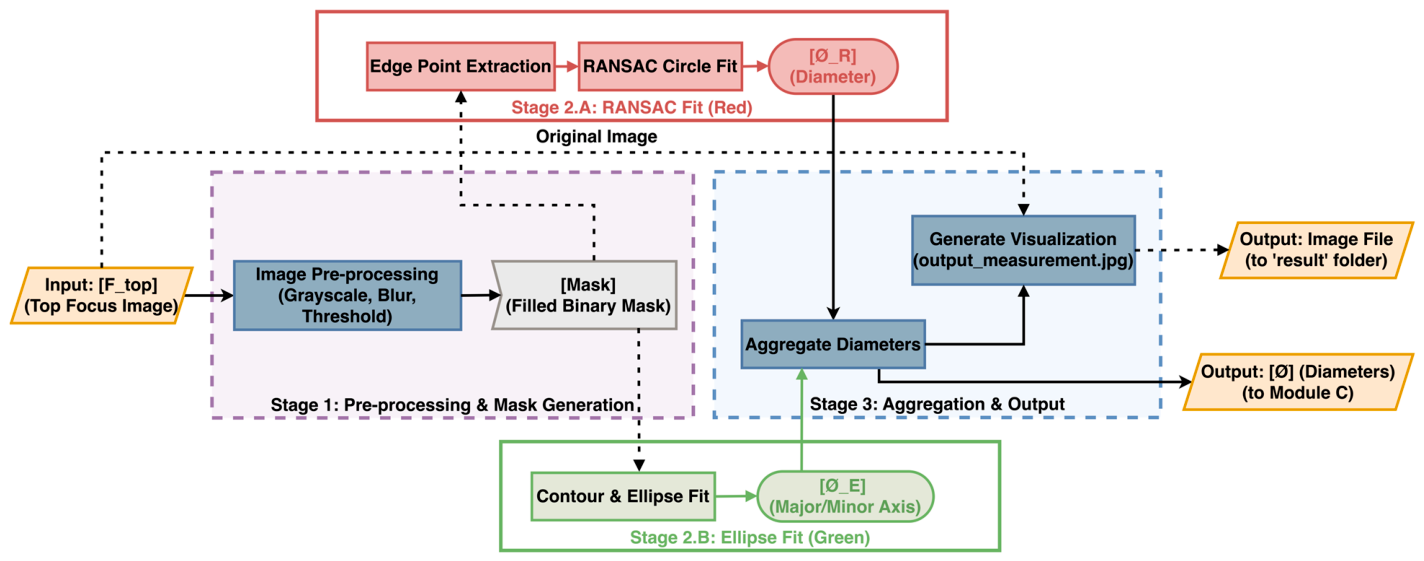
The extraction of the final physical damage dimensions is critically dependent on a multi-stage, lightweight computer vision and decision-level geometric fusion pipeline. This workflow is bifurcated into sequential phases of image pre-processing and geometric characterization. The initial phase is designed to robustly isolate a clean and topologically correct defect contour from the optimal focus frame.
At this juncture, the workflow bifurcates into two complementary fitting strategies (Stage 2) to maximize measurement robustness. The first path (Stage 2.A) utilizes a Random Sample Consensus (RANSAC) algorithm to extract edge points and fit a circle, providing high resilience against outliers and structural edge noise. Simultaneously, the second path (Stage 2.B) applies a sub-pixel, least-squares ellipse fitting algorithm to this refined contour [13,14]. This method transcends the discrete pixel grid’s limitations, allowing the major axis length (dpixel) to be extracted and converted to a physical equivalent defect dimension with a target relative error below 0.5%.
Finally, the outputs from these parallel modules are consolidated in the “Aggregation” stage (Stage 3) through a terminal fusion step, culminating in a structured output that integrates all computed metrics for subsequent assessment.
The following Figure 8 illustrates this parallelized architecture, commencing with a computationally efficient computer vision processing phase that isolates a refined defect contour from the optimal focus frame. Subsequently, the high-precision pipeline diverges to employ both RANSAC-based outlier rejection and sub-pixel ellipse fitting, ensuring the high-precision output of the final physical geometry.
Figure 8.
Schematic of the computer vision data fusion and measurement architecture. The electronic control system transforms the optimal focus frame into a binary mask, subsequently employing parallel algorithms—RANSAC and least-squares ellipse fitting—to reliably reconstruct the physical dimensions of the orifice for the micro-hole measurement.
2.2.1. Lightweight Computer Vision Pipeline
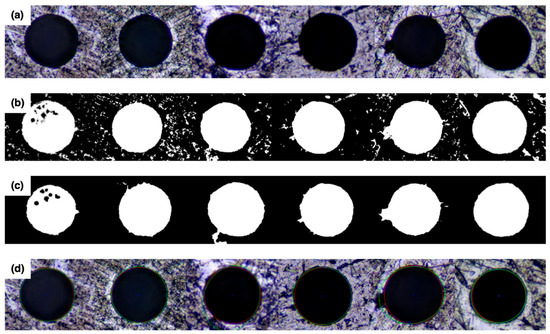
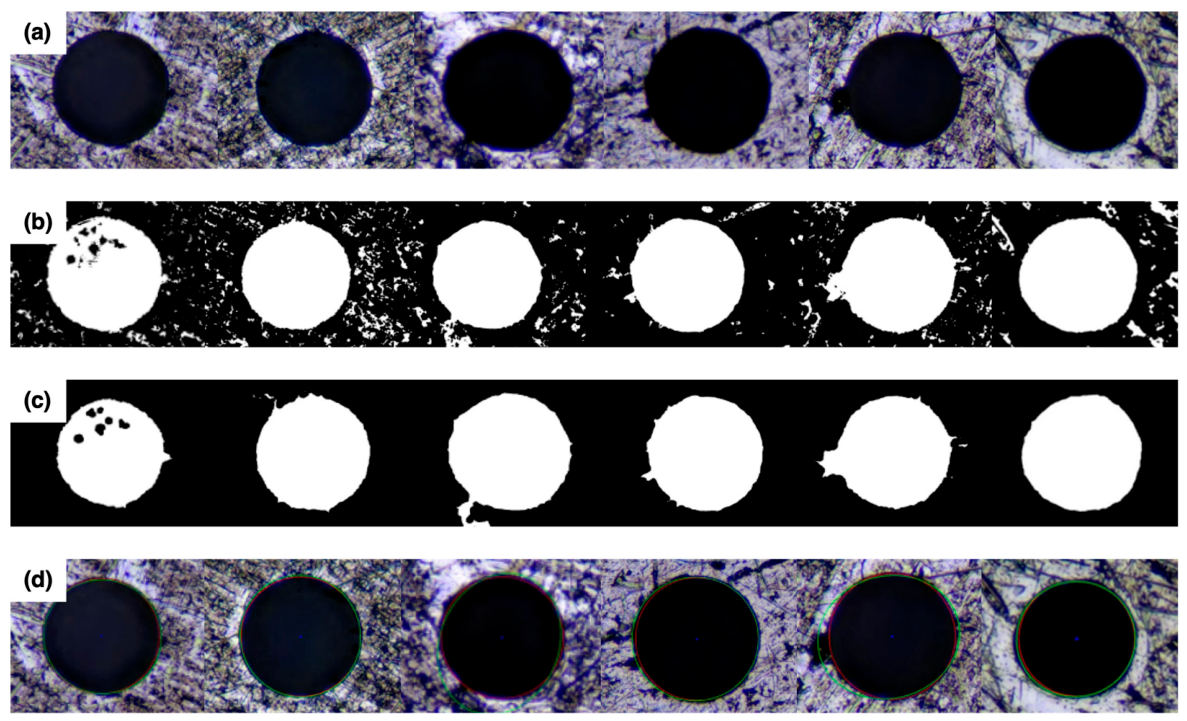
The extraction of the initiation boundary follows a streamlined pipeline, as visually summarized in Figure 9. The optimal focus frame acquired via electronic scanning is first preprocessed using a 7 × 7 Gaussian blur to reduce environmental noise [15]. Segmentation is then performed via adaptive thresholding. The threshold is dynamically set at the 20th brightness percentile based on the typical bimodal histogram of coaxially illuminated micro-holes, which provides superior separation of the dark cavity region from the illuminated surface compared to global Otsu thresholding. Finally, a max connected component analysis is applied to eliminate background artifacts, effectively isolating the target micro-defect mask for the subsequent geometric measurement and evaluation.
Figure 9.
Stepwise visualization of the morphological computer vision pipeline for dimensional measurement. The sequence demonstrates the evolution from the raw input (a) through adaptive binarization (b) and boundary reconstruction (c), culminating in the final artifact-free ROI extraction (d) via connected component analysis.
2.2.2. Parameter Characterization for Initiation
To achieve high-precision assessments that overcome the quantization limits of the discrete pixel grid, the system employs a sub-pixel ellipse fitting algorithm. This method is foundational to achieving the high-precision calculation of the initiation boundary’s lateral spread.
The core of the algorithm is the application of a least-squares fitting (LSF) method [16] within the framework. This sub-pixel parameterization extracts the major axis length, which is then mapped to the physical equivalent defect dimension using a pre-calibrated factor, effectively constraining the relative measurement error to <0.5%.
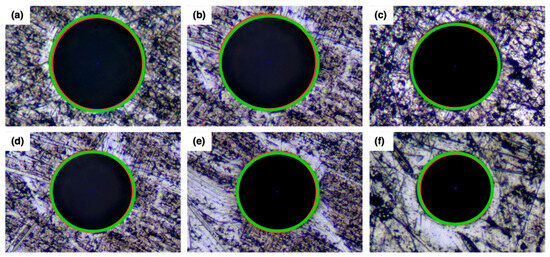
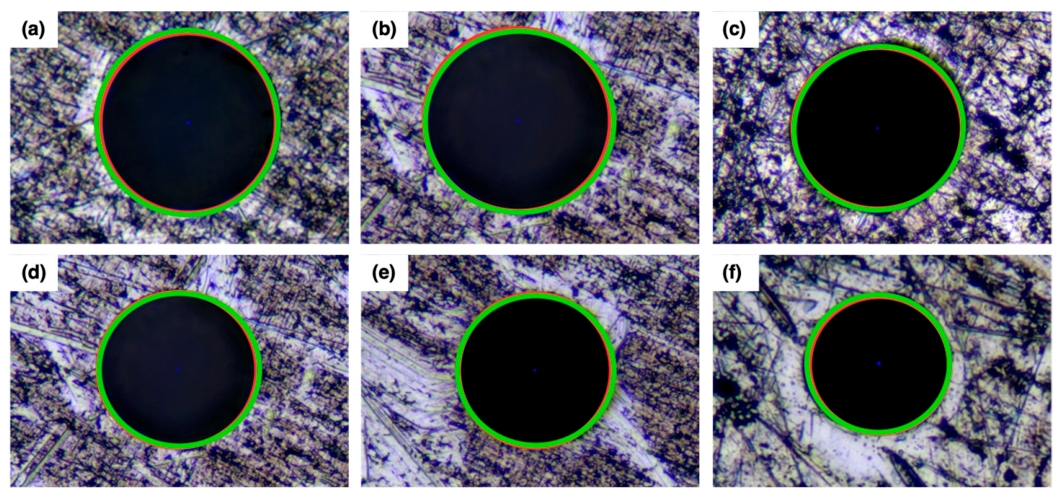
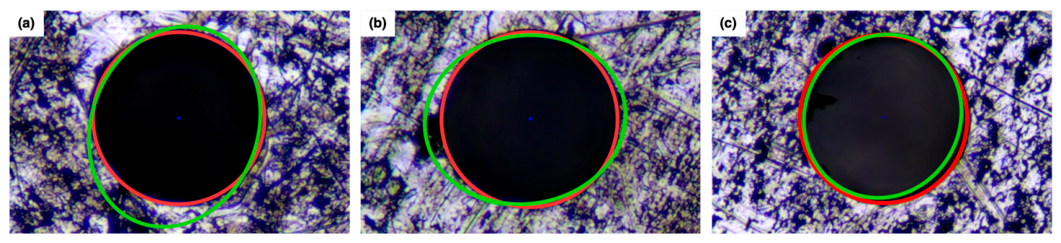
A comparative analysis, illustrated in Figure 10 and Figure 11, reveals a critical trade-off between geometric flexibility and noise robustness driven by electronic control scanning. While the sub-pixel elliptical model (Green) offers superior adherence to asymmetrical initiation boundaries compared to the rigid circular model (Red), it exhibits higher sensitivity to local surface artifacts, such as stress-induced scratches or corrosion pits, leading to potential over-fitting in the computer vision analysis.
Figure 10.
Comparative evaluation of geometric fitting fidelity on irregular orifices for the initiation, wherein (a–f) visually highlight the superior boundary conformance of the proposed computer vision sub-pixel ellipse model (green) contrasting with the local deviations of the standard circular approximation (red).
Figure 11.
Selected automated computer vision measurement results illustrating specific challenges in geometric fitting under complex surface conditions, wherein (a–c) reveal instances where pronounced surface artifacts and scratches induce deviations in the sub-pixel elliptical contour (green).
To mitigate this instability without sacrificing precision, we propose a hybrid detection strategy based on algorithmic data fusion. In this framework, the robust RANSAC-based circle fit serves as a coarse regulator. The computer vision algorithm prioritizes the high-precision sub-pixel ellipse fit but imposes a penalty constraint based on the deviation from the reference circle. This geometric deviation itself serves as a crucial indicator for the micro-hole measurement. If excessive divergence or eccentricity is detected (indicating severe noise interference or complex structural fatigue), the system automatically reverts to the circular approximation or applies a weighted data fusion, ensuring accurate structural feature characterization even under complex surface conditions.
3. Experimental Validation for Assessment
This section presents the experimental setup and validation results obtained using the proposed electronic control and computer vision measurement system. By analyzing the data from a representative high-aspect-ratio micro-hole sample, we validate the efficacy of the multi-indicator method. Furthermore, the system’s metrological precision and accuracy are quantitatively assessed, demonstrating its capability to provide high-fidelity dimensional ground-truth data.
3.1. System Configuration for Electronic Control and Computer Vision
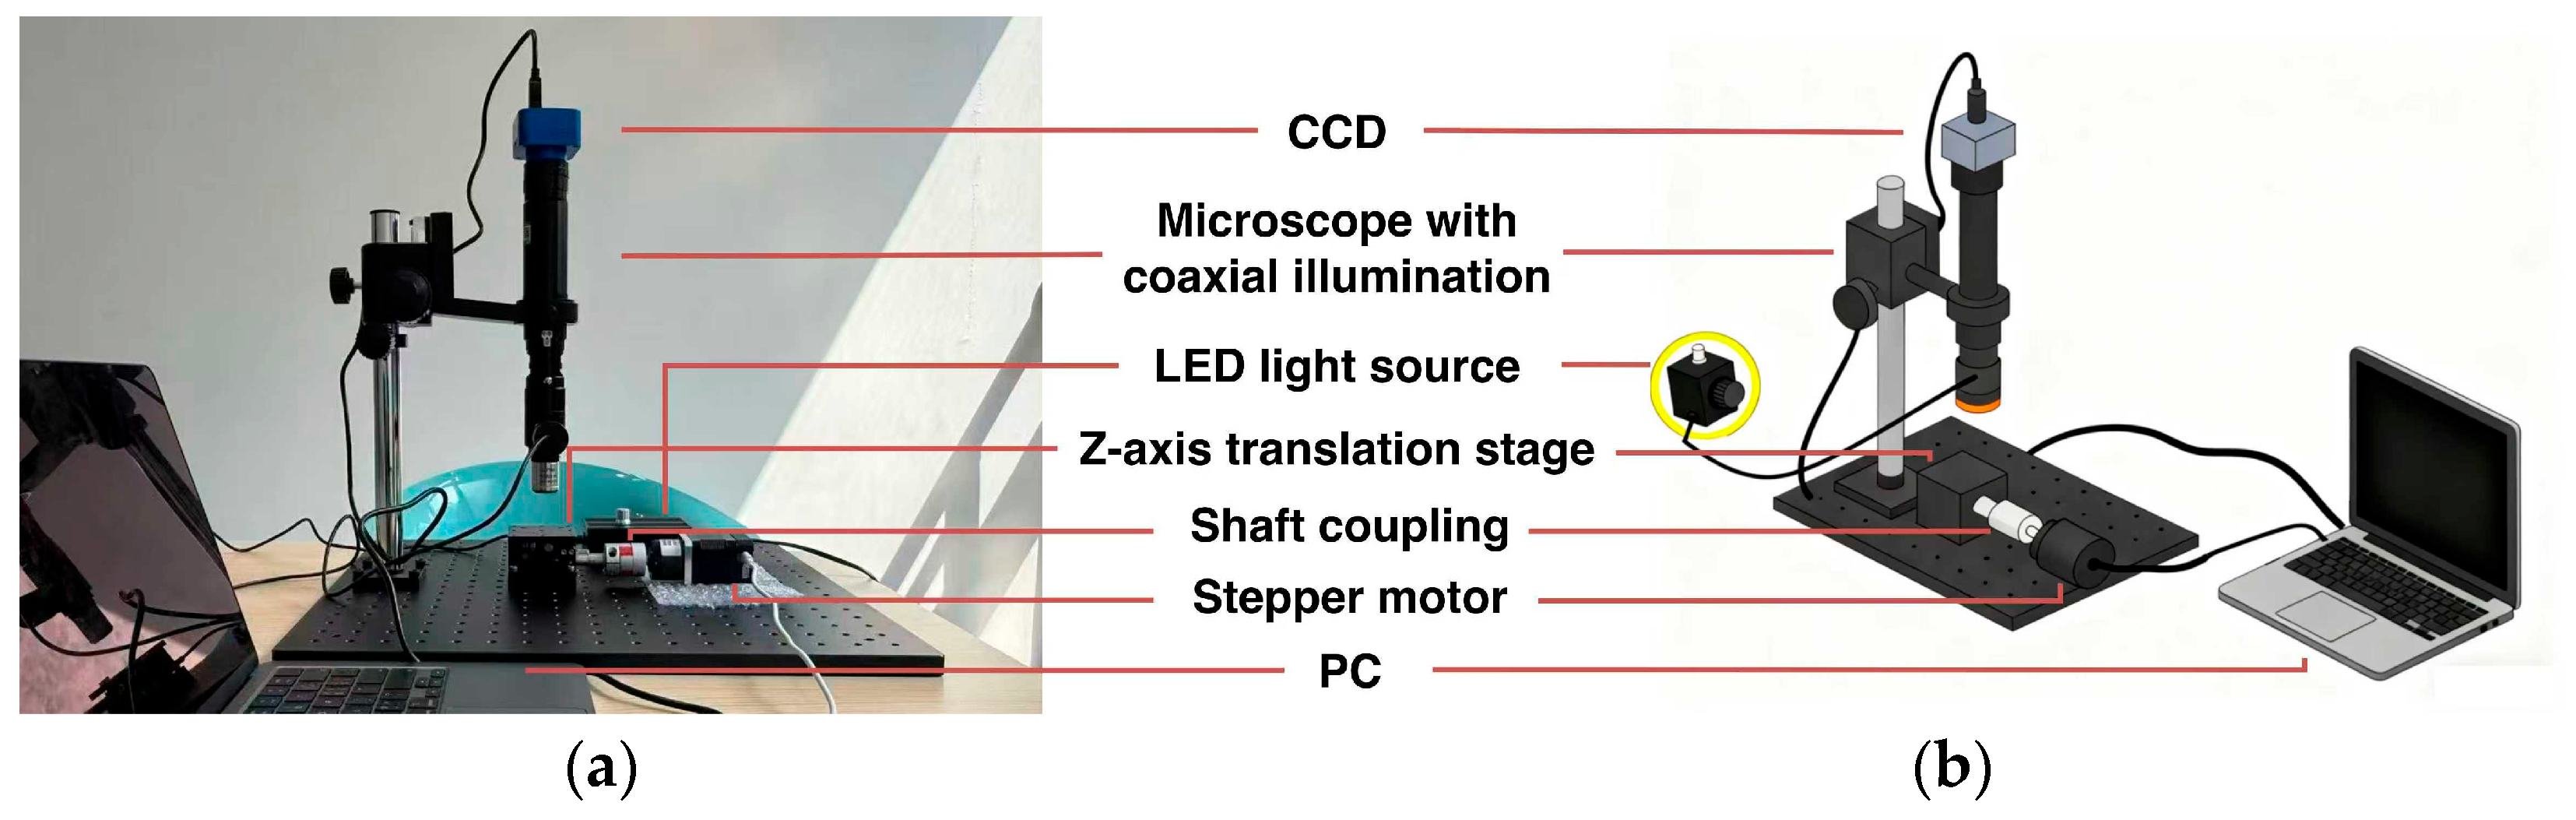
To implement this assessment principle, the hardware is functionally divided into four integrated modules: the Microscopic Imaging Module, the Coaxial Illumination Module, the Z-Axis Scanning and Driving Module [17,18,19], and the Control and Data Fusion Module. The complete hardware setup of this localized electronic control scanning node is depicted in Figure 12.
Figure 12.
The constructed measurement platform. (a) Schematic diagram of the system modules. (b) Annotated photograph of the experimental rig, showing the specific arrangement of the microscopic imaging module and the electronically controlled precision Z-scanning mechanism used for depth data acquisition.
3.1.1. Microscopic Imaging Module
The primary function of the imaging module is to provide high-quality optical data with sufficient resolution for subsequent data fusion analysis. The measurement precision relies on the interplay between optical and sampling resolution. For this system, the Long Working Distance (LWD) objective lens provides a theoretical native feature resolution of approximately 0.9 μm (based on the Rayleigh Criterion). With the integrated high-resolution industrial camera, the system achieves an effective sampling resolution of 0.09 μm. This configuration comfortably satisfies the Nyquist–Shannon sampling theorem, ensuring that the sampling density is significantly finer than the hardware diffraction limit. Consequently, a micro-hole initiation site with a lateral dimension as small as 0.10 mm is captured across approximately 1100 pixels, providing a rich dataset for the subsequent feature-level data fusion and sub-pixel structural characterization algorithms. The Microscopic Imaging Module comprises a Long Working Distance (LWD) objective lens 10×, Numerical Aperture (NA): 0.25, Working Distance: 7.0 mm, paired with an industrial CMOS camera HY-500B (HAYEAR, Shenzhen, China), Sensor Size: 1/2.5 inch, Pixel Size: 2.2 μm 2.2 μm. Images were acquired at a resolution of 1920 × 1080 pixels with an exposure time of 1/250 s.
3.1.2. Coaxial Illumination Module
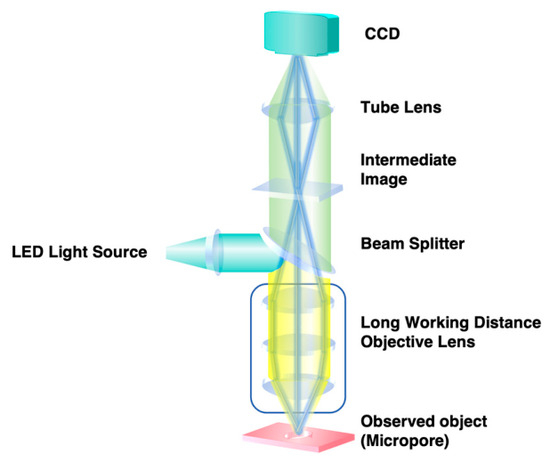
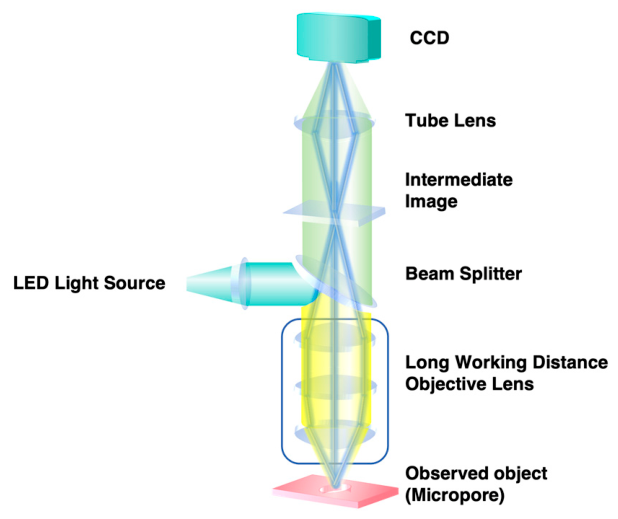
Effective illumination of deep, high-aspect-ratio structural cavities is a critical challenge in micro-hole measurement. To overcome issues of shadowing and insufficient light at the damage base, the system employs a coaxial episcopic illumination scheme. A LED light source is used, and its output is directed into the vision sensor path via a 45 beam splitter, as illustrated in the hardware schematic in Figure 13. This design ensures that the illumination axis is perfectly aligned with the imaging axis, allowing light to travel vertically down into the micro-hole initiation zone. This approach provides uniform, high-contrast illumination of both the surface boundary and the internal base. As a result, the relative brightness of the cavity’s base is maintained at over 45% of the surface’s brightness, and sidewall shadows are suppressed to a grayscale difference of less than 5%, which is crucial for the robustness [20] of the subsequent multi-metric evaluation. These values were quantitatively verified by extracting pixel intensity histograms from defined Regions of Interest (ROIs) at the cavity base and surface zones using standard image analysis software.
Figure 13.
Hardware schematic of the electronic control and computer vision measurement system featuring a coaxial episcopic illumination configuration. The integration of a beam splitter allows for vertical light propagation, effectively suppressing sidewall shadows and enhancing contrast for CCD acquisition and subsequent data fusion.
3.1.3. Z-Axis Scanning and Driving Module
This module provides the precise and controllable electronic axial motion essential for extracting 3D topologies via focus variation. The precision of this motion directly impacts the accuracy of the final damage depth measurement for early warning applications. The theoretical axial resolution (Ztheory) is determined by the interplay of the stepper motor’s characteristics [21], the gearbox reduction, and the lead screw pitch:
where P is the pitch of the lead screw, is the native step angle, and Gr is the gear ratio.
However, the theoretical resolution does not account for systemic mechanical errors, such as backlash (backlash). To mitigate this environmental and mechanical noise, the electronic control module incorporates a closed-loop control system with absolute encoder feedback. This is complemented by a bi-directional approach compensation strategy, ensuring that the target scanning position is always approached from the same direction for robust data fusion. The relative uncertainty (Urel) introduced into a depth measurement (H) by the measured repeated positioning error (repeatability) is given by
After implementing electronic closed-loop control and software compensation, the measured repeated positioning error was reduced to just m. For a deep structural anomaly with a depth of 10 mm, this high precision results in a relative uncertainty of less than 0.01%, confirming that Z-axis positioning error is a negligible factor in the final aspect-ratio evaluation for the micro-hole measurement.
While the motorized stage demonstrates a positioning repeatability of m, it is important to note that the total practical depth measurement error is not solely determined by mechanical repeatability. Other significant factors contributing to total measurement uncertainty include focal-plane identification algorithmic error, the intrinsic peak width of the sharpness curve, potential micro-tilt of the sample stage, and instances of insufficient optical texture at the extreme bottom of the cavity.
3.1.4. System Metrological Calibration
To ensure metrological traceability for baseline data, the electronic control system undergoes rigorous calibration. Lateral calibration determines the pixel equivalent (k, μm/pixel) for the computer vision algorithms using a certified standard plate. Axial calibration is conducted using standard gauge blocks (Hstd) to establish a linear error compensation model, neutralizing systemic mechanical biases and ensuring robust data fusion.
For the representative structural sample (depth = 1.765 mm), the total Z-axis travel range was configured to 2.5 mm. To ensure comprehensive coverage, the scan is programmed to initiate approximately 0.2 mm above the surface boundary and terminate approximately 0.5 mm below the anticipated internal base. With the Z-axis electronic scanning step size set strictly to 5 µm/frame, a single complete scanning cycle captures exactly 500 images.
3.2. Validation of Data Fusion Precision and Accuracy
To establish the quantitative baseline for system repeatability and accuracy, we selected a specific representative high-aspect-ratio stainless steel structural sample (depth = 1.765 mm, equivalent diameter = 0.204 mm). While earlier validation stages (as demonstrated visually in Figure 5, Figure 6 and Figure 7) confirmed the algorithm’s robust focal identification across varying aperture dimensions, diverse material surface textures, and fluctuating illumination conditions, this single stainless steel sample was utilized strictly for continuous 10-cycle quantitative metrological benchmarking. The Z-axis electronic scanning step size was set to 5 μm/frame, and the inspection procedure computer vision data fusion procedure was repeated 10 times to evaluate system reliability.
To validate the proposed data fusion strategy, its performance was benchmarked against a single-metric baseline. The multi-metric consensus method achieved a highly reliable focal plane localization that matched verification across the test set, significantly outperforming the single-metric Laplacian approach (82%). Furthermore, this robust data fusion proved critical for measurement precision; lateral analysis performed on the optimally focused frames consistently yielded a relative dimensional error <0.5%, compared to >2% for out-of-focus frames.
4. Results and Discussion
4.1. Efficiency and Metrological Accuracy
To quantify the operational efficiency of the proposed electronic control and computer vision measurement system, the total processing time for three high-aspect-ratio structural samples was benchmarked. The proposed integrated workflow, driven by the multi-metric data fusion algorithm, completes the full inspection and 3D geometric reconstruction in under 5 min. This is a significant improvement over the 30+ minutes typically required by traditional multi-frame stitching methods or standard confocal microscopy, which is fundamentally limited by inspection inefficiency and operational complexity.
Metrological accuracy was rigorously validated against a certified standard sample (reference diameter 270.48 μm). The system yielded a relative measurement error of approximately 0.23%, which comfortably satisfies the stringent precision requirements for aerospace structural health assessment and damage geometry profiling.
4.2. Stability and Robustness Against Environmental Noise
System stability—a critical metric for real-world deployments—was quantitatively assessed through 10 repeated automated measurements on the calibrated baseline structural site, incorporating re-clamping between cycles. The results demonstrated remarkably high consistency. The depth measurements yielded a mean of 1.765 mm with a Standard Deviation (SD) of 0.62 µm and a Coefficient of Variation (CV) of 0.035%. The lateral diameter measurements yielded a mean of 0.204 mm with an SD of 0.25 µm and a CV of 0.12%. This quantitative evidence, coupled with the visual validations across varied textures (Figure 5, Figure 6 and Figure 7), confirms that the closed-loop hardware effectively suppresses vibration and positioning errors.
5. Conclusions
This article proposes a data fusion-based high-precision micro-hole measurement method, and experimentally validates its effectiveness.
The core technological achievement lies in a fully automated, high-precision computer vision workflow that resolves the fundamental focal ambiguity problem through a multi-metric data fusion strategy. By establishing a consensus among complementary sharpness indicators (Tenengrad, Laplacian, and Brenner) and utilizing a gated “skipped subset analysis,” the algorithm effectively circumvents interference from spurious structural surface noise. Concurrently, the Z-axis scanning module achieves a high repeated positioning precision of m after electronic closed-loop compensation.
For lateral damage dimensions, this work developed a lightweight, integrated computer vision pipeline culminating in sub-pixel ellipse fitting. This algorithmic data fusion workflow effectively suppresses metallic surface artifacts, controlling the micro-hole initiation boundary extraction relative error to strictly under 0.5%. Overall system performance validation demonstrates that these precise geometric measurements ensure the exactness of the final aspect ratio characterization, maintaining a combined relative error of less than 1% and completing the full damage assessment within 5 min.
In summary, this research provides a highly robust automated measurement solution that successfully bridges sub-micron precision with high operational efficiency. The primary scientific contribution is the development of a feature-level metric fusion framework coupled with a “skipped subset analysis.” This targeted algorithmic approach formally resolves the severe sidewall scattering challenges inherent to high-aspect-ratio micro-cavities, successfully decoupling the surface and internal base focal planes without manual parameter tuning.
While the current repeatability studies firmly establish the baseline metrological stability of the system, future work will focus on large-scale statistical validation across an extensive matrix of environmental conditions and varying damage geometries. Furthermore, research will focus on scalability and deployment, specifically, integrating this localized, high-resolution optical inspection node with macro-scale, continuous Fiber Optic Sensing networks.
Author Contributions
Conceptualization, S.L. and Y.Q. (Yiran Qu); methodology, S.L. and Y.Q. (Yiran Qu); software, S.L.; validation, Y.Q. (Yiran Qu); formal analysis, S.L.; investigation, S.L.; resources, Y.Q. (Yiran Qu) and S.L.; data curation, Y.Q. (Yiran Qu); writing—original draft preparation, S.L.; writing—review and editing, W.L. and S.L.; visualization, S.L., Y.Q. (Yuanbin Qiu), H.W. and S.Y.; supervision, W.L.; project administration, W.L. and S.L.; funding acquisition, W.L. All authors have read and agreed to the published version of the manuscript.
Funding
This research was funded by NSAF, grant number U2230127.
Data Availability Statement
The data that support the findings of this study are available from the author S.L. upon reasonable request.
Acknowledgments
We thank Liyun Qiu from the Institute of Laser & Micro-Nano Engineering, College of Electronics & Information Engineering, Sichuan University for reading the manuscript and making several helpful suggestions.
Conflicts of Interest
The authors declare no conflicts of interest.
References
- Golota, N.C.; Preiss, D.; Fredin, Z.P.; Patil, P.; Banks, D.P.; Bahri, S.; Griffin, R.G.; Gershenfeld, N. High Aspect Ratio Diamond Nanosecond Laser Machining. Appl. Phys. A 2023, 129, 490. [Google Scholar] [CrossRef] [Scilit]
- Chen, H.; Yang, X.; Yue, X. EDM ECM Composite Processes of High-Quality Small Hole with Large Aspect Ratio Using Surface Protection and Low Voltage Assistance. Int. J. Adv. Manuf. Technol. 2025, 139, 5577–5594. [Google Scholar] [CrossRef] [Scilit]
- Ahn, S.H.; Ryu, S.H.; Choi, D.K.; Chu, C.N. Electro-Chemical Micro Drilling Using Ultra Short Pulses. Precis. Eng. 2004, 28, 129–134. [Google Scholar] [CrossRef] [Scilit]
- Mehrali, H.; Shafiee Sarvestani, A.; Mirzaei, M.; Shafiey Dehaj, M. Detection of Coating Defects in High Gas Turbine Blades by Image Processing. Signal Image Video Process. 2025, 19, 360. [Google Scholar] [CrossRef] [Scilit]
- Colonna, A.; Scarpa, F. Improving Corneal Nerve Segmentation Using Tolerance Dice Loss Function. Signal Image Video Process. 2024, 18, 1069–1077. [Google Scholar] [CrossRef] [Scilit]
- Huckabay, H.A.; Armendariz, K.P.; Newhart, W.H.; Wildgen, S.M.; Dunn, R.C. Near-Field Scanning Optical Microscopy for High-Resolution Membrane Studies. In Nanoimaging: Methods and Protocols; Springer: Totowa, NJ, USA, 2013; pp. 373–394. [Google Scholar] [CrossRef] [Scilit] [PubMed]
- Yin, J.-F.; Bai, Q.; Zhang, B. Methods for Detection of Subsurface Damage: A Review. Chin. J. Mech. Eng. 2018, 31, 41. [Google Scholar] [CrossRef] [Scilit]
- Meng, X. New Experiments on Knife-Edge Diffraction. Eur. Phys. J. Plus 2024, 139, 872. [Google Scholar] [CrossRef] [Scilit]
- Ma, R.; Söntges, S.; Shoham, S.; Ntziachristos, V.; Razansky, D. Fast Scanning Coaxial Optoacoustic Microscopy. Biomed. Opt. Express 2012, 3, 1724–1731. [Google Scholar] [CrossRef] [Scilit] [PubMed]
- Huang, A.; Wu, Z.; Yin, H.; Ye, Q.; Liang, J.; Lin, J.; Xie, M.; Ye, C.; Li, X.; Wu, Y. Sharpness Evaluation Algorithm for Nailfold Microvascular Images. Signal Image Video Process. 2024, 18, 1515–1523. [Google Scholar] [CrossRef] [Scilit]
- Zhu, M.; Yu, L.; Wang, Z.; Ke, Z.; Zhi, C. A Survey on Objective Evaluation of Image Sharpness. Appl. Sci. 2023, 13, 2652. [Google Scholar] [CrossRef] [Scilit]
- Chen, F.; Fu, H.; Yu, H.; Chu, Y. No-Reference Image Quality Assessment Based on a Multitask Image Restoration Network. Appl. Sci. 2023, 13, 6802. [Google Scholar] [CrossRef] [Scilit]
- Wisaeng, K. Automatic Optic Disc Detection in Retinal Images Using FKMT–MOPDF. Comput. Syst. Sci. Eng. 2023, 45, 2569–2586. [Google Scholar] [CrossRef] [Scilit]
- Septiarini, A.; Harjoko, A.; Pulungan, R.; Ekantini, R. Optic Disc and Cup Segmentation by Automatic Thresholding with Morphological Operation for Glaucoma Evaluation. Signal Image Video Process. 2017, 11, 945–952. [Google Scholar] [CrossRef] [Scilit]
- Esakkirajan, S.; Veerakumar, T.; Subudhi, B.N. Digital Image Processing: Illustration Using Python; Springer Nature: Singapore, 2025. [Google Scholar] [CrossRef] [Scilit]
- Jiang, M.; Cao, Y.; Xia, Y.; Chang, Y.; Lin, Y.; Zhao, W.; Teng, F.; Liu, W. A Robust Pupil Detection Method Based on Multiple Continuous Frames. Signal Image Video Process. 2025, 19, 228. [Google Scholar] [CrossRef] [Scilit]
- Wang, L.; Li, X.; Zhou, Z.; Liu, Y.; Yang, Z.; Zhang, S.; Li, C. Disturbance Observation and Suppression in an Airborne Electro-Optical Stabilized Platform Based on a Generalized High-Order Extended State Observer. Sensors 2024, 24, 3629. [Google Scholar] [CrossRef] [Scilit] [PubMed]
- Lan, T.; Yang, G. A Low-Cost Pipeline Surface 3D Detection Method Used on Robots. Signal Image Video Process. 2024, 18, 3915–3924. [Google Scholar] [CrossRef] [Scilit]
- Dogan, H.; Ekinci, M. Erratum to: Automatic Panorama with Auto-Focusing Based on Image Fusion for Microscopic Imaging System. Signal Image Video Process. 2015, 9, 747. [Google Scholar] [CrossRef] [Scilit]
- Alkurdi, D.A.; Cevik, M.; Akgundogdu, A. Advancing Deepfake Detection Using Xception Architecture: A Robust Approach for Safeguarding against Fabricated News on Social Media. Comput. Mater. Contin. 2024, 81, 4285–4305. [Google Scholar] [CrossRef] [Scilit]
- Zhao, J.; Zhou, Y.; Zhao, J.; Jiang, X.; Gong, K. Rapid-Precision Position Measurement of Linear Motor Mover Based on Joint Spatial Phase Method. IEEE Trans. Ind. Inform. 2020, 16, 4333–4343. [Google Scholar] [CrossRef] [Scilit]
Disclaimer/Publisher’s Note: The statements, opinions and data contained in all publications are solely those of the individual author(s) and contributor(s) and not of MDPI and/or the editor(s). MDPI and/or the editor(s) disclaim responsibility for any injury to people or property resulting from any ideas, methods, instructions or products referred to in the content. |
© 2026 by the authors. Licensee MDPI, Basel, Switzerland. This article is an open access article distributed under the terms and conditions of the Creative Commons Attribution (CC BY) license.