


Abstract
This study focuses on the thermal runaway (TR) risk of lithium-ion batteries (LIBs) and explores data-driven multi-sensor early warning and risk-oriented prognostics based on the intrinsic thermal behavior of batteries. A framework is proposed to support health information extraction using multi-sensor monitoring data, where data-driven approaches are adopted to address multicollinearity among parameters and explore their synergistic effects. The identified health-related features help characterize abnormal behavior and model health index propagation under TR evolution, which support the design of warning points and estimation of remaining time before TR (time-to-TR). The framework is validated through a designed experiment, where the Accelerating Rate Calorimeter (ARC) is employed to create adiabatic conditions for LIBs. The experiment helps minimize external impacts during TR evolution and validate the framework according to the intrinsic characteristics of batteries related to TR risks. The results from Leave-One-Sample-Out cross-validation preliminarily demonstrate the application potential of identified feature behavior patterns in early warning and risk-oriented prognostics. The integration of these functions can enhance the current TR risk management solutions, transforming monitoring data into decision support information for proactive risk mitigation.
1. Introduction
The rapid development of electric vehicles, portable electronics, aerospace, and other fields broadens the applications of lithium-ion batteries (LIBs) [1,2]. LIBs are discussed as having advantages of high energy density, high specific capacity, and long cycle life among currently popular energy storage devices [3,4]. On the other hand, the safety of LIBs has become a critical concern. As discussed in [5,6], there are flammable internal materials stored within the closed structure of LIBs, which makes them face higher thermal runaway (TR) risks. Many studies have revealed accidents caused by TR in LIBs. For example, TR is usually the root cause of electric vehicles’ combustion accidents. Thermal, electrical, and mechanical abuse, such as extreme heat, quick charge/discharge cycles, or physical harm, can result in TR. They trigger the internal reaction of LIBs, generate and accumulate a large amount of gas and heat, and are likely to introduce combustion and even explosion [7,8].
To cope with TR risks of LIBs, numerous endeavors have been conducted to develop early warning technologies and strategies, with the intention of proactively intervening in advance instead of passively reacting after the TR occurrence. Such research relies on the understanding of TR mechanisms, involving initiation conditions, evolution paths, measurements, etc. At the fundamental level, ref. [9] illustrate the TR mechanism as chain reactions, where the abnormal heat generation in LIBs initiates a series of side reactions, like the decomposition of the solid electrolyte interface, reactions at the anode/cathode, decomposition of the electrolyte, etc. More heat has been released by side reactions, forming a Heat–Temperature–Reaction loop. Due to serious fire hazards, the TR process is usually accompanied by some typical phenomena, like gas release, combustion, injection, etc. [10]. Building upon the mechanism, developing TR early warning technologies relies on identifying representative signals from typical TR phenomena. General characteristic parameters can be temperature, voltage, current, gas, acoustic, etc. [11,12]. Currently, TR early warning technology has been discussed as falling into three categories [8]: battery management systems (BMSs), sensors based on internal parameters, and sensors based on gas signals.
A BMS is widely adopted as a proactive safety management method in electric vehicles. Through deploying multiple sensors to monitor temperature, voltage, and other characteristics of batteries, a BMS supports the state estimation (state of charge, stage of health), cell balancing among packs, anomaly detection, diagnosis, and triggering actions in battery thermal management systems (BTMSs) when LIBs are detected beyond the normal operating window [13,14]. At the same time, the limitations of a BMS are obvious when maintaining thermal stability, especially regarding TR risks. For example, a BMS mainly measures surface temperature, terminal voltage, and terminal current; these parameters usually show a slow response. As pointed out in [15], previous experiences have revealed the insufficiency of temperature signal-based alarm triggers, where the significant abnormality has already occurred by the time of triggering. In addition, to diagnose anomalies, threshold analysis is widely employed to determine the fault by predefined parameter boundaries of the temperature or voltage [14]. The determination based on a single or a few parameters limits the robustness of detection results, especially in scenarios influenced by uncertain working conditions and environmental factors.
Compared to the BMS approach based more on external parameters, monitoring internal parameters is another solution. It can directly reflect internal situations of LIBs, like the local temperature, strain, pressure, and refractive index [16]. Introducing internal parameters enhances the state representation of LIBs. However, many of these technologies rely on deploying special equipment and large sensors, which hinders their applicability [17]. In this case, gas signal-based approaches display their advantages in TR early warning. As a typical phenomenon in TR processes, sensing based on gas displays a faster response than conventional temperature sensing when detecting TR propagation [11]. In addition, these approaches show the potential to integrate other technologies. For example, ref. [13] propose a three-level early warning scheme for TR based on gas pressure monitors, with the incorporation of LIBs’ internal reaction mechanisms and exterior state characteristic behaviors. As a relatively comprehensive solution, however, this scheme places higher requirements on sensors, such as the resistance to high temperatures, electrolyte corrosion, having low cross-sensitivity, immunity to interference from extraneous factors, etc. As a summary, though the mentioned three categories of TR early warning technologies show advantages in different aspects, they share the core idea of triggering the alarm according to discovered early features in TR processes through monitoring one or multiple characteristic parameters of LIBs. Therefore, data fusion appears promising to enhance the robustness of safety models by accurately characterizing TR scenarios [16,18].
The performance of early warning strategies also highly relies on fault diagnosis methods. Liang et al. [19] summarize three categories of such methods: the threshold analysis method, model-driven method, and data-driven method. Firstly, the threshold analysis method is widely adopted in a BMS, determining the fault according to predefined parameter boundaries. The warning strategy based on this method relies on identifying key physical characteristic parameters that are highly correlated with TR. Once the TR-related signal is detected, the system immediately triggers the warning alarm [20]. The advantage of this strategy is that it does not require complex mathematical models. However, setting appropriate thresholds is a main challenge. LIBs can exhibit different thermal behaviors under different operation conditions, and it is difficult to define a universally effective threshold [21]. Moreover, effectively collecting physical characteristics requires more advanced sensors, which limits the applicability of such methods [22].
The model-driven methods utilize modeling tools to predict the electrical and thermal characteristics of the battery during TR and TR propagation behavior. The established model could be a physical model and a propagation model. Physical models can be established by coupling the multiphysics of individual cells, such as the electrochemical–thermal model [23], gas diffusion model [24], electrochemical–thermal–mechanical multiphysics field coupling model [25], etc. The development of these models requires a comprehensive understanding of multiphysics coupling. Compared with them, the propagation model focuses on the propagation path of TR within battery modules. However, they face limitations such as large time consumption, high experimental costs, and high uncertainty in TR propagation behavior. These limitations inspire the development of equivalent models, but they usually rely on simplifying assumptions, which may limit the model’s precision [26]. Furthermore, diverse abuse situations of LIBs in actual operations increase the difficulty of recognizing corresponding failure behaviors, which limits the applicability of physical and propagation models [20].
Benefiting from the high availability of battery data, the data-driven methods provide a better solution for leveraging monitoring data to identify early signs of TR. By paying less attention to complex electrochemical modeling and detailed analysis of internal physical parameters, these approaches achieve warning functions through extracting informative features and establishing mappings between data patterns and safety-related states [27]. As an important task, the feature extraction can be supported by statistical analysis [28], signal processing [29], and machine learning algorithms [30]. Among them, machine learning algorithms display strong capability in addressing nonlinear relationships and high-dimensional data, usually relying on neural networks, regression techniques, time-series models, or other sophisticated fusion schemes [31]. More recently, to address the limitations of individual machine learning algorithms and to improve the accuracy, robustness, and generalization ability of data-driven methods, hybrid architectures have been increasingly developed. By integrating techniques such as a convolutional neural network (CNN), long short-term memory network (LSTM), and attention mechanisms, these approaches can collaboratively capture temporal and spatial features from battery monitoring data, and thus enhance the representation of safety-related states based on the fusion of multiple health features [32].
Based on the advantages of data-driven methods, the prognostics approaches of LIBs have been widely developed to forecast the performance of unseen batteries, including state of health (SOH), state of charge, and remaining useful life of LIBs [20]. These approaches enhance current early warning technologies by enabling the capability of health state assessment and potential anomaly/fault prognostics. As a result, sufficient decision support information is available to support proactive decision-making [33,34]. However, current prognostics studies focus more on battery performance degradation and lifetime prediction rather than safety-critical events such as TR. TR management mainly relies on anomaly detection and early warning, which lack the perspective of integrating prognostic capabilities within the TR management framework. Moreover, the reliability of prognostics models faces challenges such as data acquisition with limitations from sensor deployment and monitoring range; extracting health information from heterogeneous monitoring data; limited understanding of the evolution of multidimensional sensing signals; and the complex coupling mechanism between different characteristic signals under varying operating conditions [20,22].
Based on the above literature review, the challenges of establishing physical models to characterize TR risks highlight the potential of adopting data-driven solutions in LIB safety management. And prognostics from a risk perspective are required to support proactive TR risk management. However, the capability of such solutions places higher demands on the reliability of TR characterization, the integration of diagnosis and prognostics models, and the interpretability of models and results. Therefore, this study explores a data-driven framework to extract TR-related health information from multi-sensor monitoring data. The extracted health information is further employed to support TR early warning and risk-oriented prognostics, aiming to explore the potential of transforming monitoring data into actionable information for proactive TR risk management. The framework is preliminarily validated through a designed experiment, where the Accelerating Rate Calorimeter (ARC) is employed to create adiabatic conditions for LIBs. Their intrinsic thermal behavior is monitored and measured by deploying multiple sensors. The experiment helps minimize external impacts during the TR evolution of LIBs and helps validate the framework according to the intrinsic characteristics of batteries related to TR risks.
The contribution of this study has been summarized as three aspects: firstly, a data-driven framework is proposed to extract health information from heterogeneous monitoring data collected during TR evolution and integrate early warning and prognostics functions. Secondly, a risk-oriented prognostic function is developed to estimate the time-to-TR, exploring the applicability of prognostics techniques to TR management from risk perspectives. Lastly, the proposed framework is validated according to the intrinsic thermal behavior of LIBs under different SOH and temperature conditions, which minimizes external impacts from environmental and operational factors in the validation step. As a result, the health management solution can be enhanced by integrating precursor-based early warning and risk-oriented prognostics, and thus support the proactive TR risk mitigations.
The paper has been organized as follows: Section 2 introduces the designed ARC experiment and experimental data. Section 3 introduces the methodology. Section 4 displays and interprets the results. Section 5 provides further discussion about the implications and limitations of the results, leading to the conclusion in Section 6.
2. Experimental Design and Monitored Parameters
The experiment aims to create an adiabatic condition for LIBs using the ARC, where the self-heating of batteries is triggered in the chamber through control systems using the Heat–Wait–Search protocol. From the self-heating onset moment () to the occurrence moment of TR (), the battery behavior is monitored using multiple deployed sensors, which helps to characterize the degradation process of LIBs based on their intrinsic thermal behavior.
Firstly, six Nickel–Cobalt–Manganese (NCM) cells with different initial conditions are prepared as experimental samples. The attributes of NCM cells are provided as the dimension (7.3 × 91.0 × 186.0 mm), the weight (approximately 279 g), the nominal capacity (16 Ah), and the nominal voltage (3.7 V). Each sample is adjusted to different conditions. The design of the condition classes follows both the literature and practical experiences. Studies suggested that the ideal temperature range for safe LIB operation lies between 25 and 40 °C [35,36,37]. In addition, the battery at the 85% SOH level is considered not stably functional in practical applications. Therefore, two levels of operating temperatures (normal temperature, 25 °C, and high temperature, 40 °C) and three levels of state of health (SOH: 100%, 95% 85%) are considered in this experiment, categorizing samples into six condition classes.
In total, six experiments are conducted separately on each sample. The ARC equipment adopted in each experiment is manufactured by HEL-UK Ltd. (Borehamwood, UK), with the series number BTC-500. The sample is placed in the chamber with a diameter of 500 mm and a volume of 98 L. For a detailed experiment setup procedure, please refer to [38].
During the experiment, the monitoring data are recorded at a sampling interval of approximately 20 s (corresponding to a sampling frequency of 0.05 Hz). Three types of parameters are collected to form the database (Table A1): parameters measured by sensors, involving the sample temperature, chamber temperature in different locations, chamber pressure, sample voltage, and sample internal resistance; parameters generated by the control system of the ARC, involving the set point, exotherm, sample ROC, sample self-heat, and chamber heating power; and parameters derived from the above parameters, involving the pressure rate, pressure acceleration, and sample temperature rate. The interpretation of each parameter is summarized in the table. These parameters are not only related to the LIB itself, but also to its interactions with the chamber, exhibiting the overall behavior of the LIB–chamber system. Notably, some parameters have similar physical meanings. They are either parameters measured at different locations (e.g., Chamber Temperature Top/Side/Bottom) or parameters of different types (e.g., Sample ROC: system-generated; : derived). These parameters are chosen to ensure the robustness of the measurement process, which helps reduce the risk of bias caused by single-point measurements. Finally, six datasets are obtained recording each sample’s behavior from to ; each dataset involves thousands of monitoring data for each parameter, supporting the further analysis in the following sections.
3. Methodology
Current research highlights the demands of holistic safety frameworks that can dynamically adapt to the evolving working environment. Three aspects are discussed as significant to safety management: learning from the past, preventing potential loss, and forecasting with technological aids. Especially, the predictive capability has been highly emphasized to enhance risk management and ensure proactive risk control by leveraging advanced technologies [39,40]. In this study, the proposed framework aims to integrate health information extraction, early warning, and risk-oriented prognostics under TR evolution. The results help bridge the monitoring and decision support through transforming sensed data into sufficient decision support information.
3.1. Research Framework
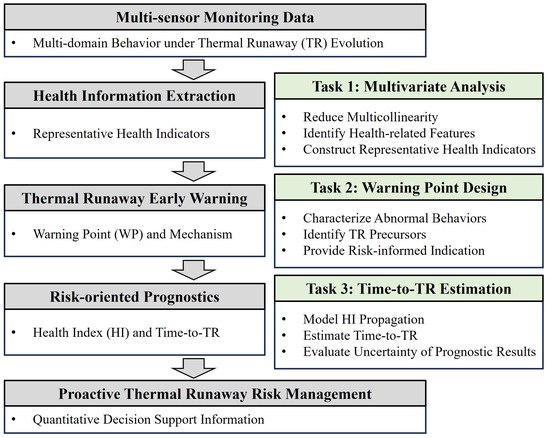
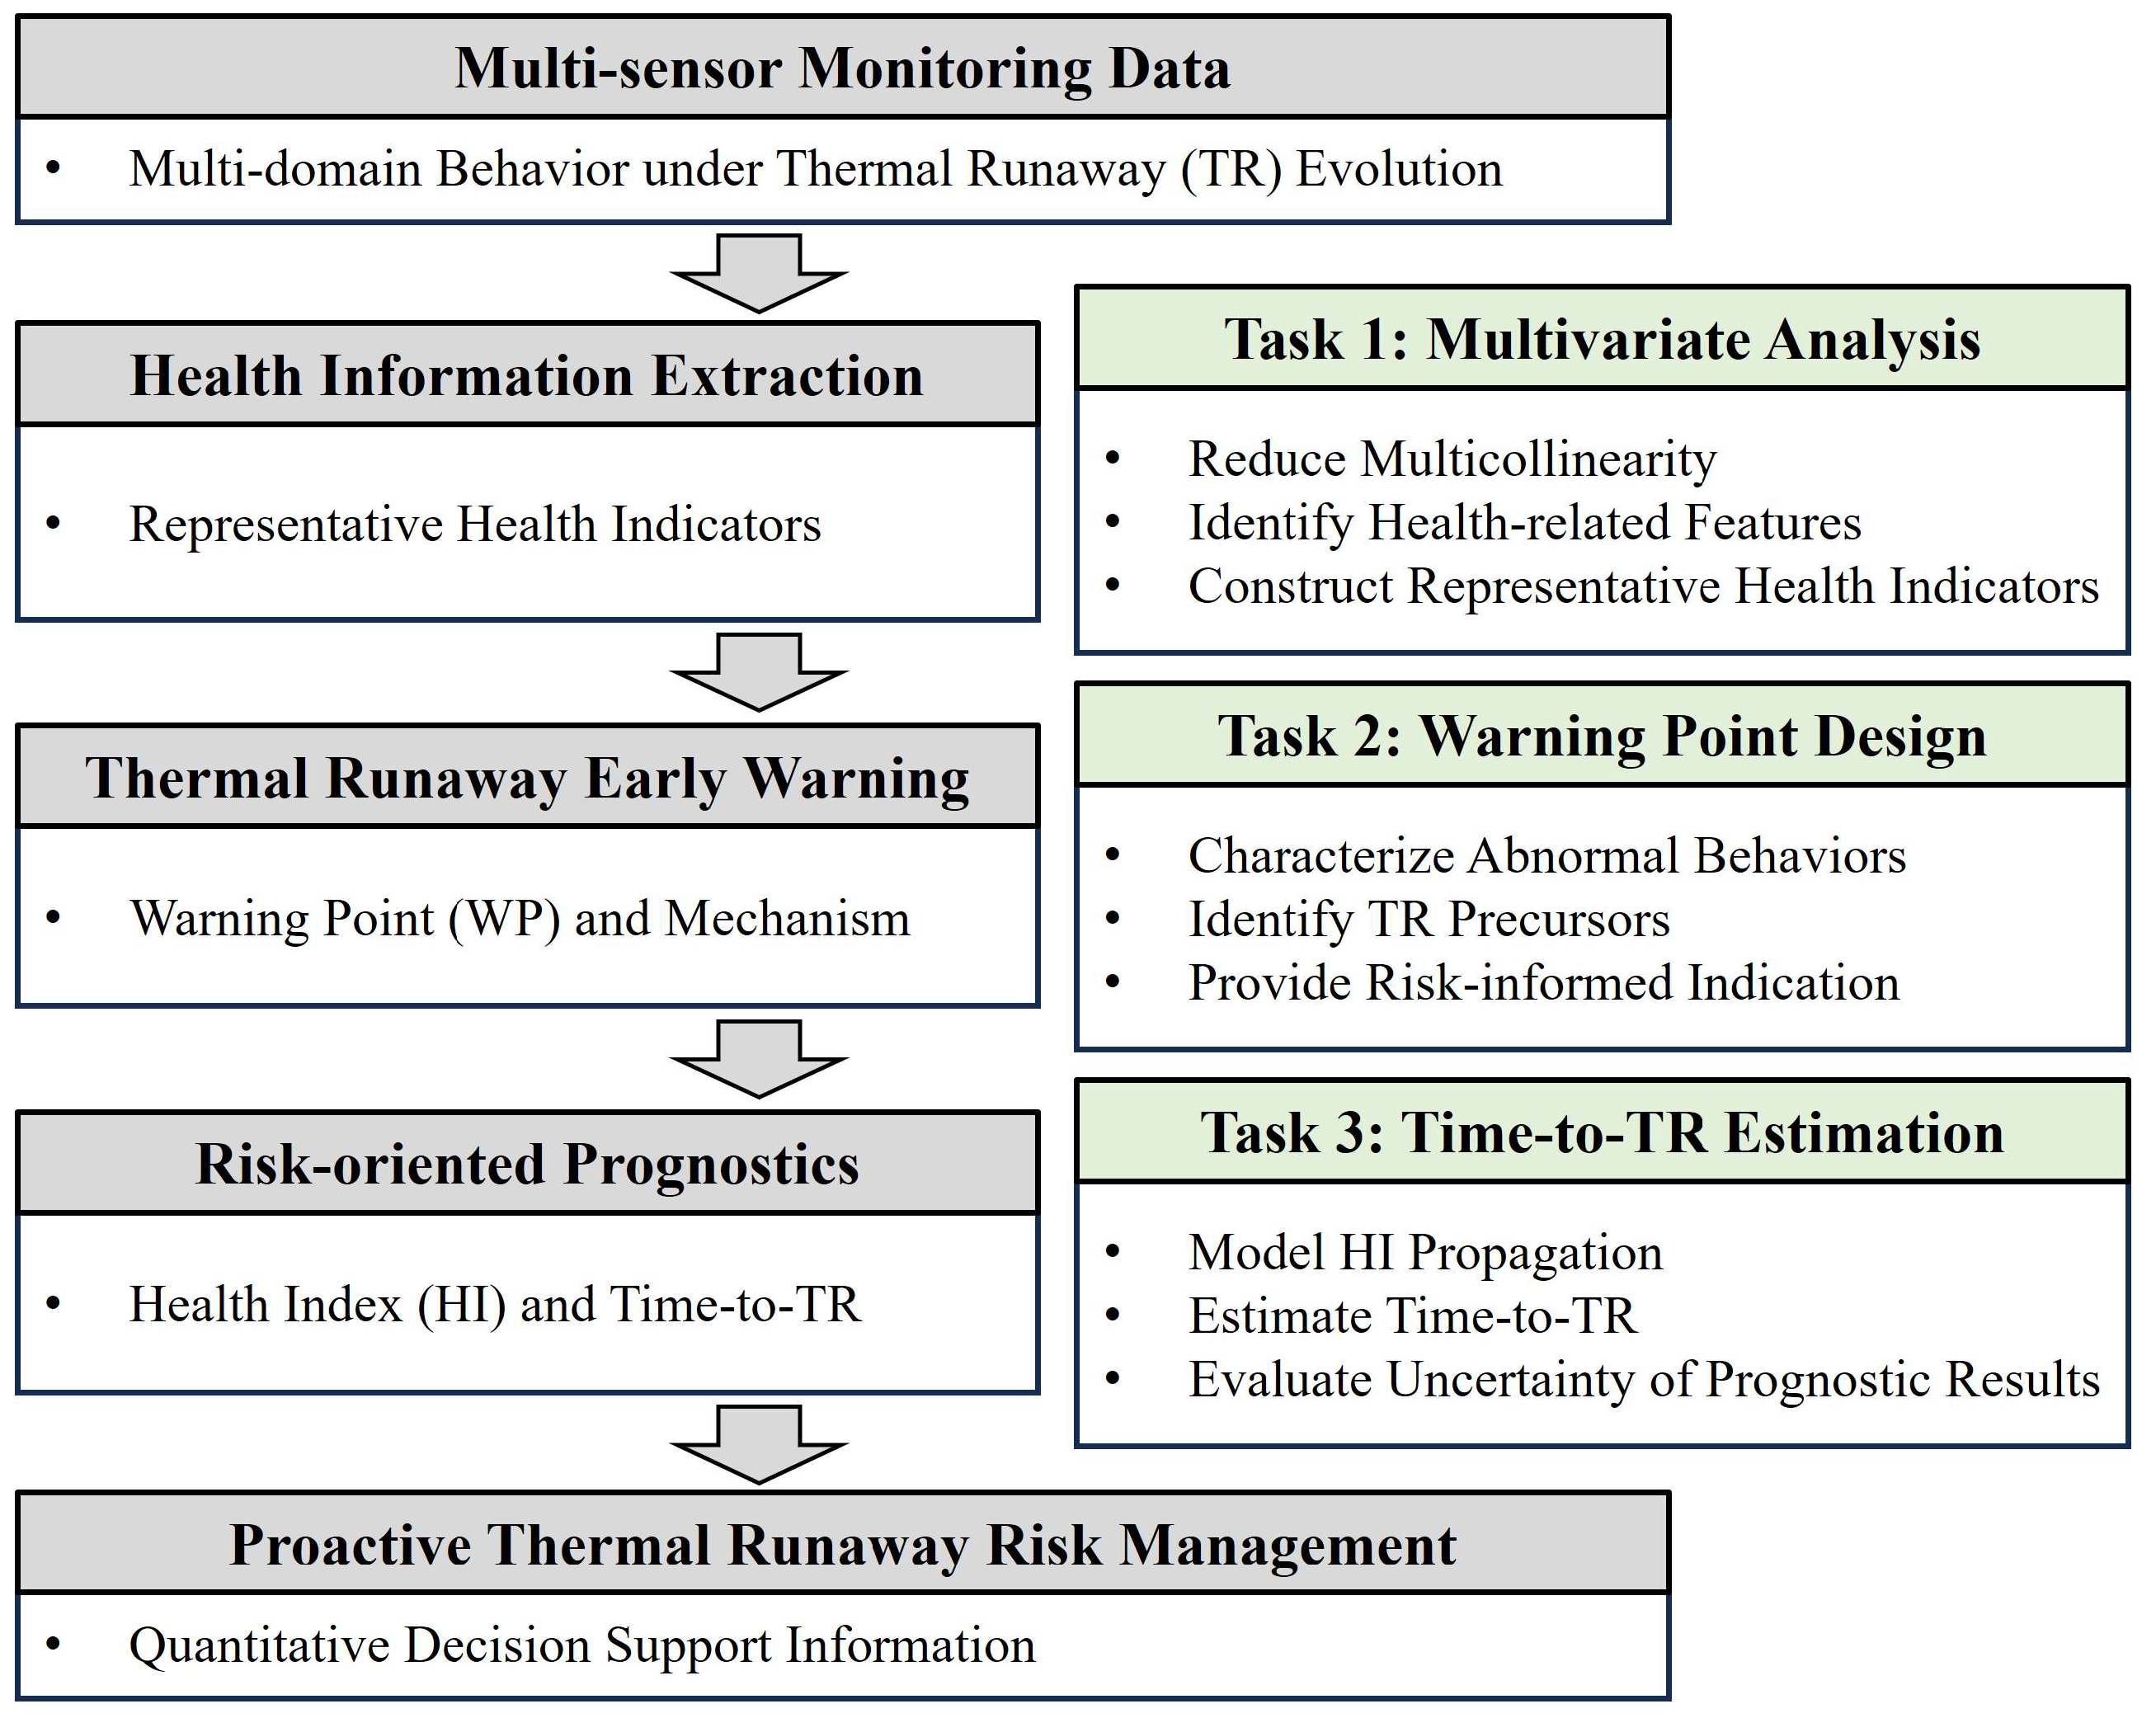
Figure 1 illustrates the overall framework proposed in this study. The framework relies on monitoring the multi-domain behavior of batteries during TR evolution. It involves three functions: health information extraction, TR early warning, and risk-oriented prognostics.
Figure 1.
Framework of data-driven early warning and risk-oriented prognostics solutions.
The function of health information extraction aims to extract representative health information from multi-source heterogeneous monitoring parameters. The main task is multivariate analysis. It helps reduce multicollinearity among parameters, identify health-related features, and construct representative health indicators that characterize battery behavior under TR evolution.
The function of TR early warning aims to identify the occurrence of abnormal safety-related behaviors under TR evolution. These behaviors can indicate potentially hazardous states with higher TR risks. The main task related to this function is the warning point (WP) design. This task characterizes abnormal behavior patterns, identifies potential TR precursors, and provides risk-informed indications regarding the occurrence of TR precursors before TR onset.
The function of risk-oriented prognostics is expected to enhance conventional warning approaches by modeling the propagation of the health index (HI) of batteries and estimating the remaining time before TR (time-to-TR). The prognostic results and associated uncertainty evaluation results from these tasks can provide quantitative information regarding the evolution of TR risks.
Finally, the outputs from early warning and prognostic functions are integrated as quantitative decision support information to benefit proactive TR risk management of LIBs.
3.2. Main Tasks in the Framework
This section summarizes three main tasks in the proposed framework: multivariate analysis, WP design, and time-to-TR estimation. For each task, the adopted techniques as supporting tools for implementation in this study are introduced.
Task 1: Multivariate analysis
The multi-sensor monitoring data can reflect the thermal, electrochemical, and dynamic behavior of LIBs during TR evolution. The high-dimensional data introduce the data redundancy and multicollinearity problem and hinder the extraction of valuable information, which highlights the importance of multivariate analysis. This study employs Principal Component Analysis (PCA) as a supporting tool to address multicollinearity. Synergistic effects among parameters may potentially characterize the degradation behavior of LIBs. PCA aims to find the PCA space to represent the direction of the maximum variance in the given data [41]. For multiple parameters that increase the complexity of data analysis, PCA shows the advantage of converting those potentially correlated parameters into a set of linearly uncorrelated principal components (PCs) through orthogonal transformation. These PCs capture the underlying correlation structure of the original dataset and provide data-driven information support. Based on PCs, health-related features associated with TR risks are determined by combining the loading patterns of each PC with the physical meanings of corresponding parameters. This increases the interpretability of features. These features can further support tasks 2 and 3 as representative health indicators.
Task 2: Warning point design
Task 2 aims to support TR early warning through identifying and characterizing abnormal behaviors from the extracted health information. This task relies on the assumption that the temporal characteristics of health-related features contain precursor information and display distinguishable patterns under TR evolution. In this study, trend analysis is performed to characterize abnormal behavior patterns. These patterns help indicate the trend transition and thus facilitate the WP design. As a result, WP can be detected to indicate whether the battery has entered a hazardous state associated with an increased TR risk.
Task 3: Time-to-TR estimation
Task 3 aims to estimate the time-to-TR of the battery based on the HI propagation model. Thus, two procedures are important in this task: degradation modeling and time-to-TR estimation.
- Degradation modeling.
Let denote the HI value of LIBs at time ; is thus the HI value at the TR occurrence time (). Being inspired by the concept of the first hitting time (FHT), LIBs fail due to TR once they cross the failure threshold, as illustrated in Equation (1):
where denotes the failure threshold corresponding to TR occurrence. The determination form depends on the evolution trend of , i.e., whether it decreases or increases over time. The failure threshold ω can be determined based on the statistical characteristics of .
Stochastic process modeling techniques are employed to model the HI propagation. As discussed in [42,43], these techniques show great potential to capture the stochastic dynamics in degradation processes, involving random errors in measurements, uncertainties in the working environments, and individual variability within a population. The Wiener process, Gamma process, and inverse Gaussian process are commonly selected based on the different natures of assumed degradation processes. Among them, the Wiener process shows advantages of simultaneously characterizing the overall degradation trend and random fluctuations in the health indicator. Gamma and inverse Gaussian processes are more suitable for monotonic degradation processes. In practice, the degradation of LIBs may be influenced by the measurement noise, operating condition variability, and complex mechanisms during TR evolution. Thus, without assuming a strict monotonic degradation process of LIBs under TR evolution, this study employs a Wiener process-based degradation model. Its stochastic differential equation is illustrated in Equation (2):
where denotes the increment in the HI over an infinitesimal time interval , is the drift parameter describing the deterministic degradation trend, is the diffusion parameter characterizing stochastic fluctuations, and denotes a standard Brownian motion. Both and are functions of . In some cases, a simpler form can be employed by considering as a constant parameter. The parameters can be estimated through maximum likelihood estimation.
- Time-to-TR estimation.
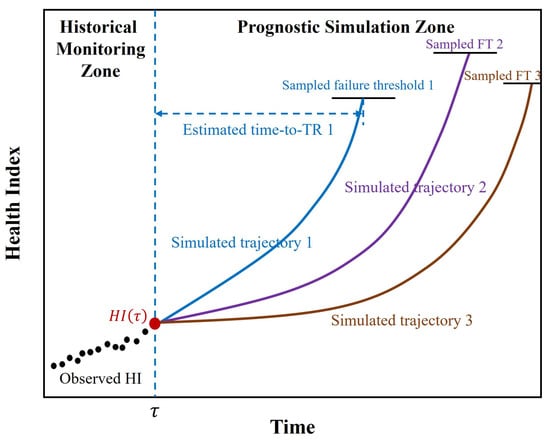
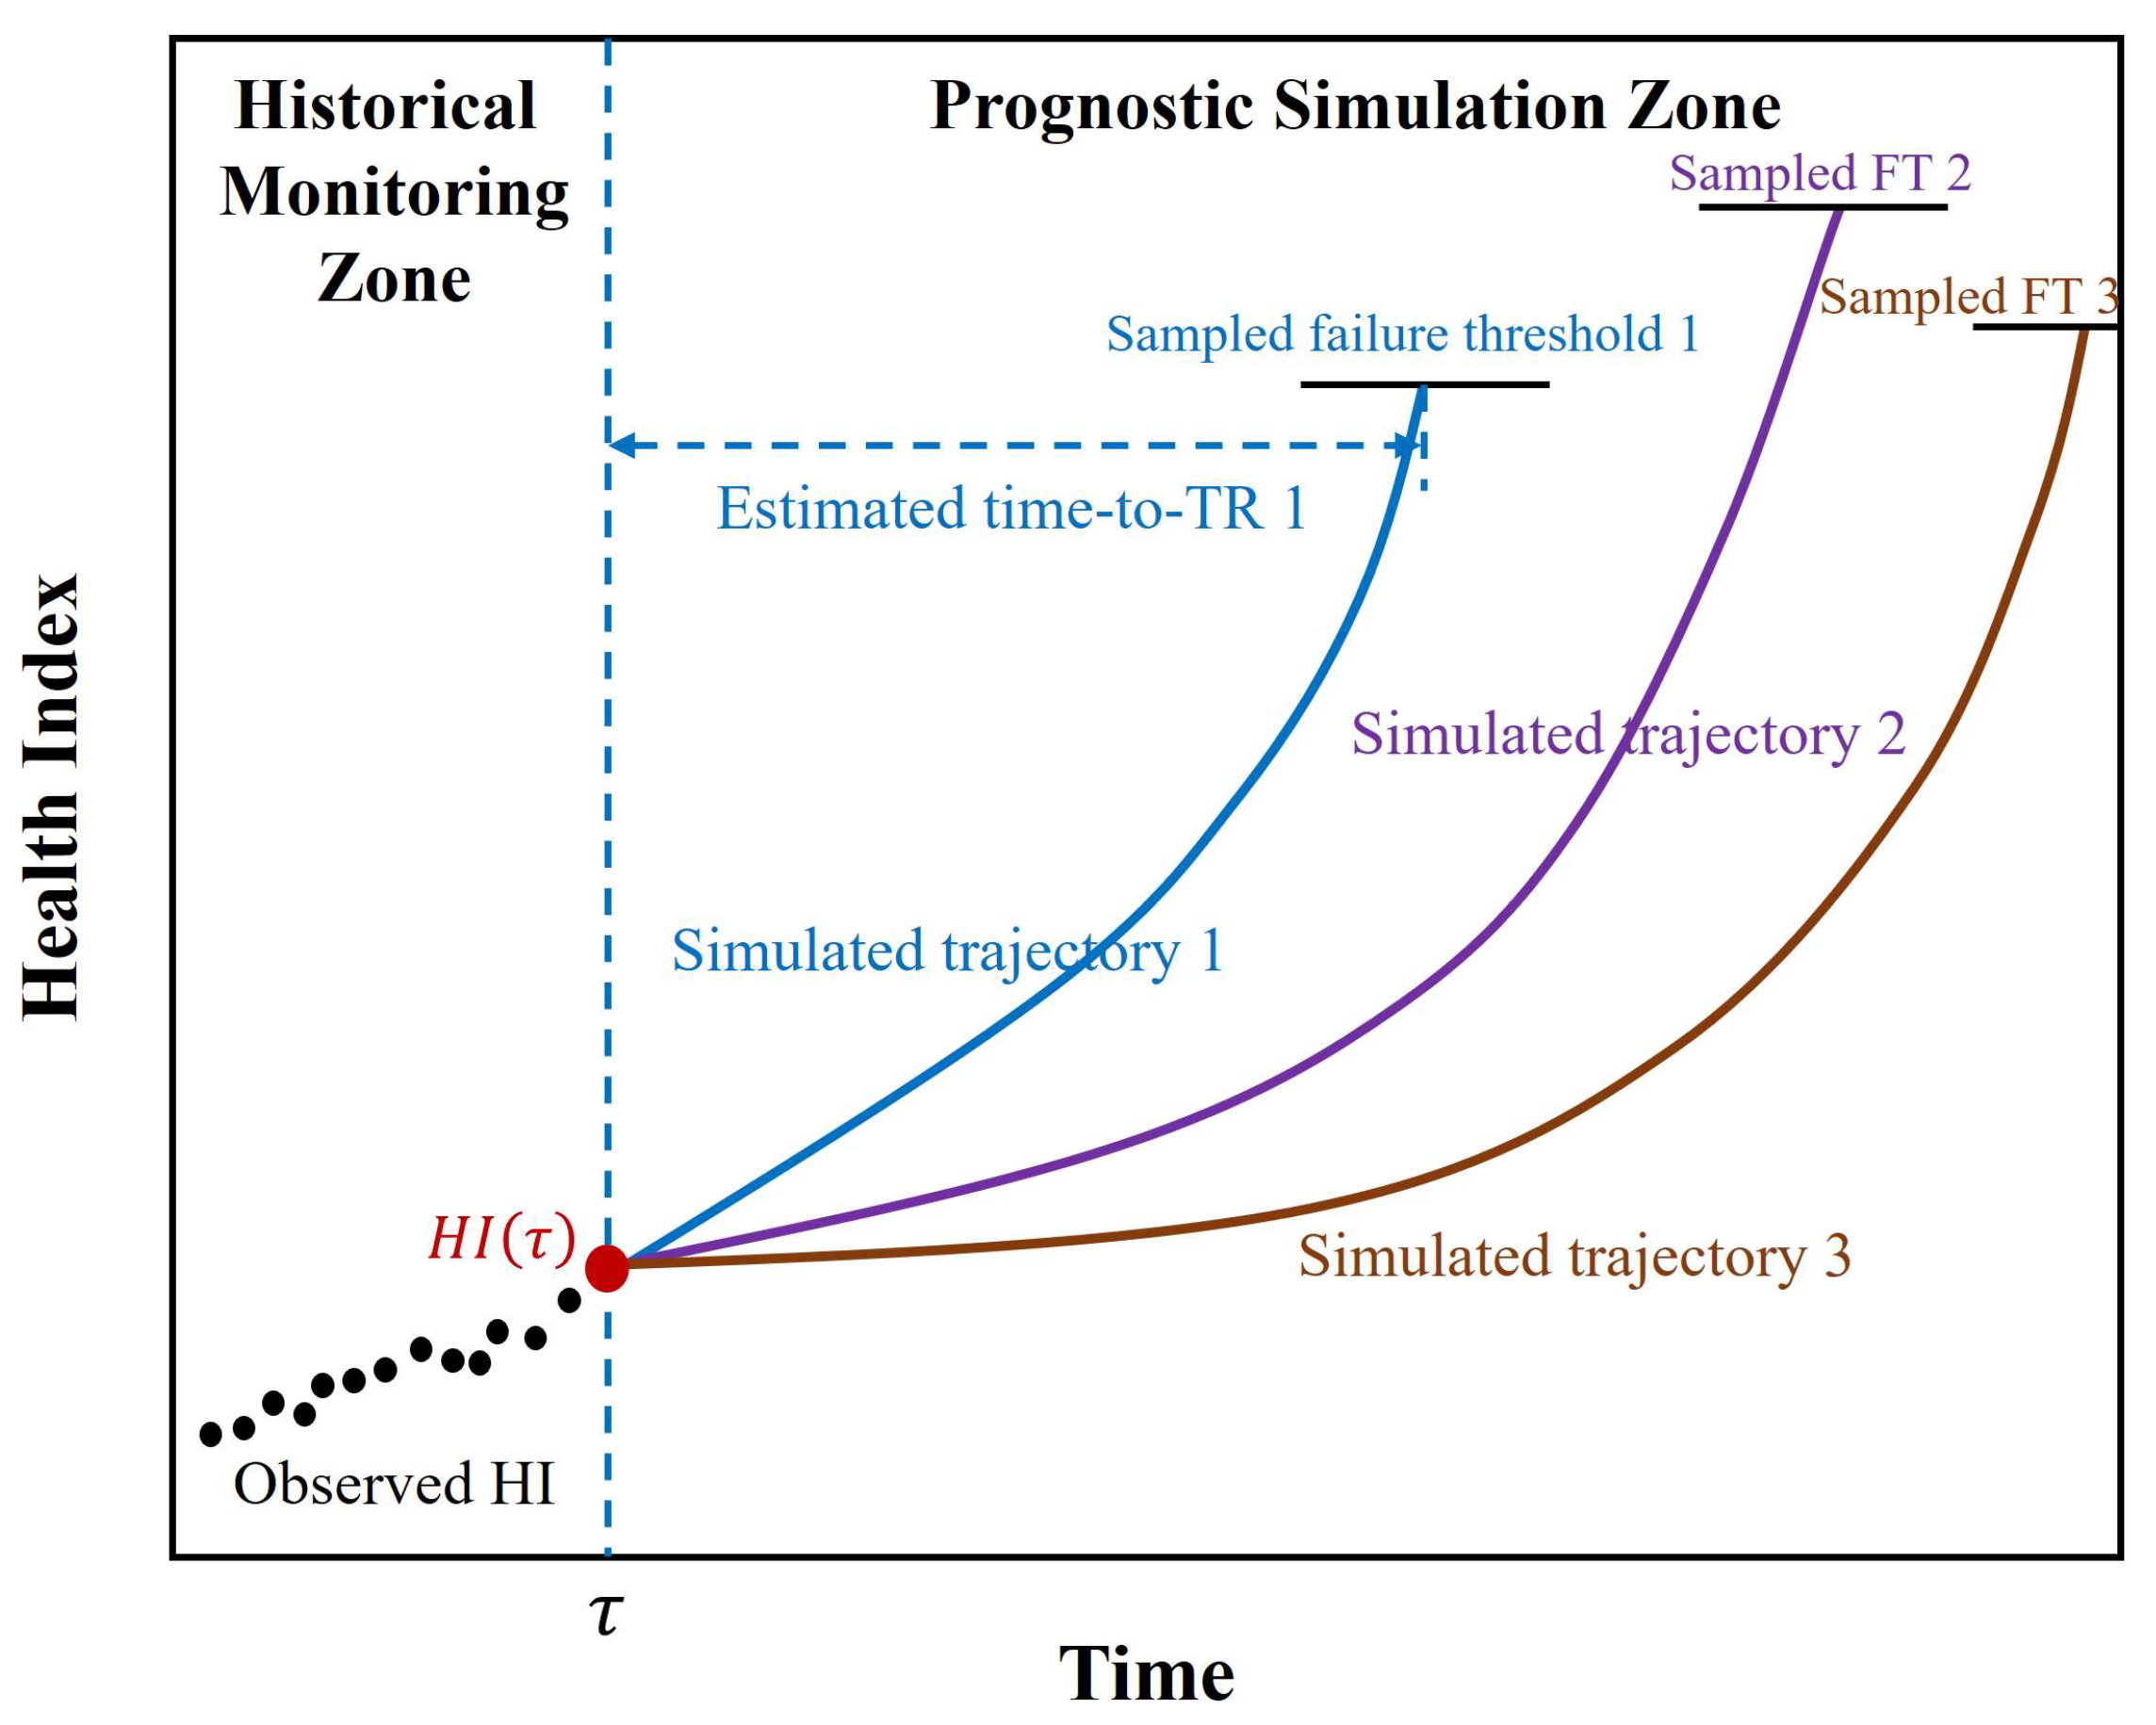
Figure 2 illustrates the time-to-TR estimation mechanism. Given the monitoring data of an unseen LIB, the corresponding HI at the current time can be calculated as . Starting from this condition, Monte Carlo simulations are performed to propagate the future evolution of the HI according to Equation (2). In each simulation run, a potential is sampled from historical observations, which indicates the uncertainty associated with TR occurrence. The simulation continues till the propagated HI reaches the sampled failure threshold according to Equation (1), resulting in a simulated degradation trajectory and TR occurrence time (). Therefore, the time-to-TR can be calculated as Equation (3):
where denotes the current observation time, and denotes the predicted TR occurrence time obtained from the simulated degradation trajectory.
Figure 2.
Schematic illustration of time-to-TR estimation.
Repeating the above procedures by increasing the simulation runs, a distribution of time-to-TR can be obtained with considerations of uncertainties in HI propagation simulations and TR occurrence. Statistical measures such as the expectation, variance, and confidence intervals can be derived to characterize the uncertainty of prognostic results.
4. Results
In the preprocessing section, a calibration is first conducted on all parameters with the following requirements:
- Guarantee time consistency: represents the beginning of self-heating processes for all samples.
- Data quality check: Check for missing values and erroneous data.
- Normalization: All parameters are normalized through Z-score normalization in order to reduce the influence of scale differences. During each Leave-One-Sample-Out cross-validation round, the normalization parameters are calculated exclusively from the training set. The same parameters are subsequently used to normalize the corresponding test sets. This guarantees that no information from the test set is introduced during model development.
4.1. Health Information Extraction
In this section, an exploratory analysis has been conducted to explore the structure of health-related features. To identify physically meaningful feature structures, three cells tested under the normal temperature condition (NT-100%, NT-95%, and NT-85%) are selected in the analysis. By choosing cells operating under identical environmental conditions, more consistent degradation and TR evolution patterns can be observed. This improves the robustness of the identified features.
Building upon the exploratory analysis, the identified feature structure is further validated using all samples. Specifically, the extracted features are evaluated throughout TR evolution to assess their consistency under different operating conditions and their relationship with TR evolution.
4.1.1. Exploratory Analysis of the Feature Structure
The Kaiser–Meyer–Olkin (KMO) measure of sampling adequacy and Bartlett’s test of sphericity are first performed to assess the suitability of the data for dimensionality reduction. The result (, ) shows that strong correlations significantly exist among parameters based on the determining criteria (KMO is greater than 0.8, significance (p-value) is less than 0.05), which supports the application of PCA [44].
Table 1 shows the results of PCA based on 17 parameters (except ‘Time’). Four important features are extracted (PC1 to PC4) with the eigenvalue greater than 1, cumulatively explaining 90.679% variance of the original data.
Table 1.
Extracted PCs and explained variance.
To better reveal the underlying structures of monitored parameters, Varimax rotation with Kaiser Normalization is adopted. As an orthogonal rotation technique, it maximizes the variance in squared loadings within each PC, allowing each PC to be primarily contributed to by a small number of parameters with high loadings. This facilitates the physical interpretation of PCs according to the meaning of dominant parameters. Table A2 displays the factor loading of each parameter on rotated PCs. Parameters with factor loadings greater than 0.5 are regarded as dominant contributors to the corresponding PC. The result provides quantitative evidence for identifying the latent feature structure, which is summarized as follows:
- The rotated component matrix reveals four dominant latent structures underlying the monitored parameters.
- Component 1 is mainly related to temperature measurements, self-heating behavior, internal resistance, and voltage, indicating a coupled thermo-electrochemical evolution.
- Component 2 is mainly associated with chamber heating power levels, pressure, and sample ROC, representing the external thermal stimulation and system response.
- Component 3 is mainly related to first- and second-order temporal derivatives, reflecting the dynamic evolution of the system.
- Component 4 is dominated by the “Control System Exotherm”, which is highly related to the thermal triggering mechanism of the ARC.
Although the PCA results reveal the statistical associations among parameters, several adjustments are made to the feature construction to improve physical interpretability. These adjustments are based on the combined consideration of factor loading patterns, the physical meaning of parameters, and their characteristics:
Firstly, the parameters ‘Control System Set Point’ and ‘Control System Exotherm’ are excluded from health information-contributive parameters because:
- These two parameters are specific to particular experimental stages and are mainly used for system control rather than for directly characterizing the TR evolution of the sample or the behavior of the sample–chamber system.
- ‘Control System Exotherm’ dominates component 4 (0.897); the remaining parameters have factor loadings below 0.316. This result indicates weak correlations between ‘Control System Exotherm’ and others.
Secondly, ‘Chamber Heating Power Top’ is regarded as having a larger contribution to component 2 since:
- It has a higher factor loading on component 2 (0.825) than on component 1 (0.516).
- It is physically consistent with other parameters in component 2 (‘Chamber Heating Power Side’ and ‘Chamber Heating Power Bottom’). Together, these parameters represent heating power levels at different positions in the chamber.
Thirdly, ‘Sample Self-heat (°C)’ is assigned to component 1 because its factor loading on component 1 (0.809) is much higher than that on component 2 (0.506).
Fourthly, though ‘Sample Voltage’ and ‘Sample Internal Resistance’ statistically contribute to component 1, they are retained as independent categories. These two parameters reflect the battery’s internal electrochemical characteristics, whereas other parameters in component 1 mainly reflect external thermal behavior. The existing literature has shown that temperature-related parameters and electrochemical parameters exhibit different characteristics in TR detections. Specifically, temperature signals show increasing trends under TR evolutions once the self-heating of cells is triggered. The temperature can become extremely high during later stages due to the large amount of heat released. Thus, temperature-based detection mainly relies on significant changes in temperature signals. These changes typically emerge during the later stages of TR, making them insensitive to early-stage anomalies. On the contrary, the detection based on electrochemical parameters relies on the inconsistency analysis of the internal electrochemical states of cells. Their abnormal behavior can be detected with higher sensitivity and rapid responses during the early stages of cells [15,45]. Therefore, separating electrochemical parameters from temperature-related parameters enables the feature structure to distinguish early-sensitive parameters from later-stage notable parameters, thereby providing sufficient information for both early warning and risk-oriented prognostic tasks.
Finally, by combining the statistical associations among the monitored parameters with their characteristics under TR evolution, four feature categories are constructed, as summarized in Table 2. Specifically, Feature 1 characterizes the overall thermal behavior of the LIB–chamber system; Feature 2 reflects the external thermal stimulation and system response; Feature 3 represents changes in system dynamics by taking into account the temperature and pressure rate; and Feature 4 characterizes the electrochemical behavior of cells.
Table 2.
The identified feature categories.
4.1.2. Behavioral Analysis of the Identified Feature Structure
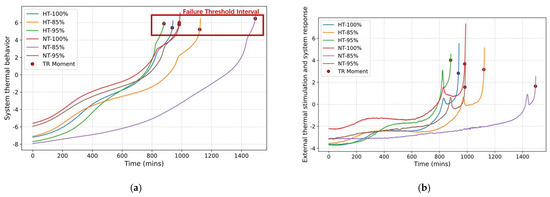
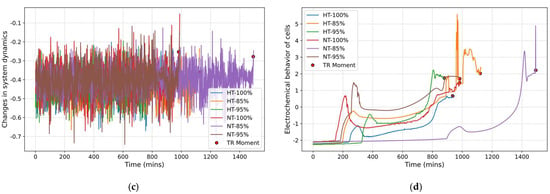
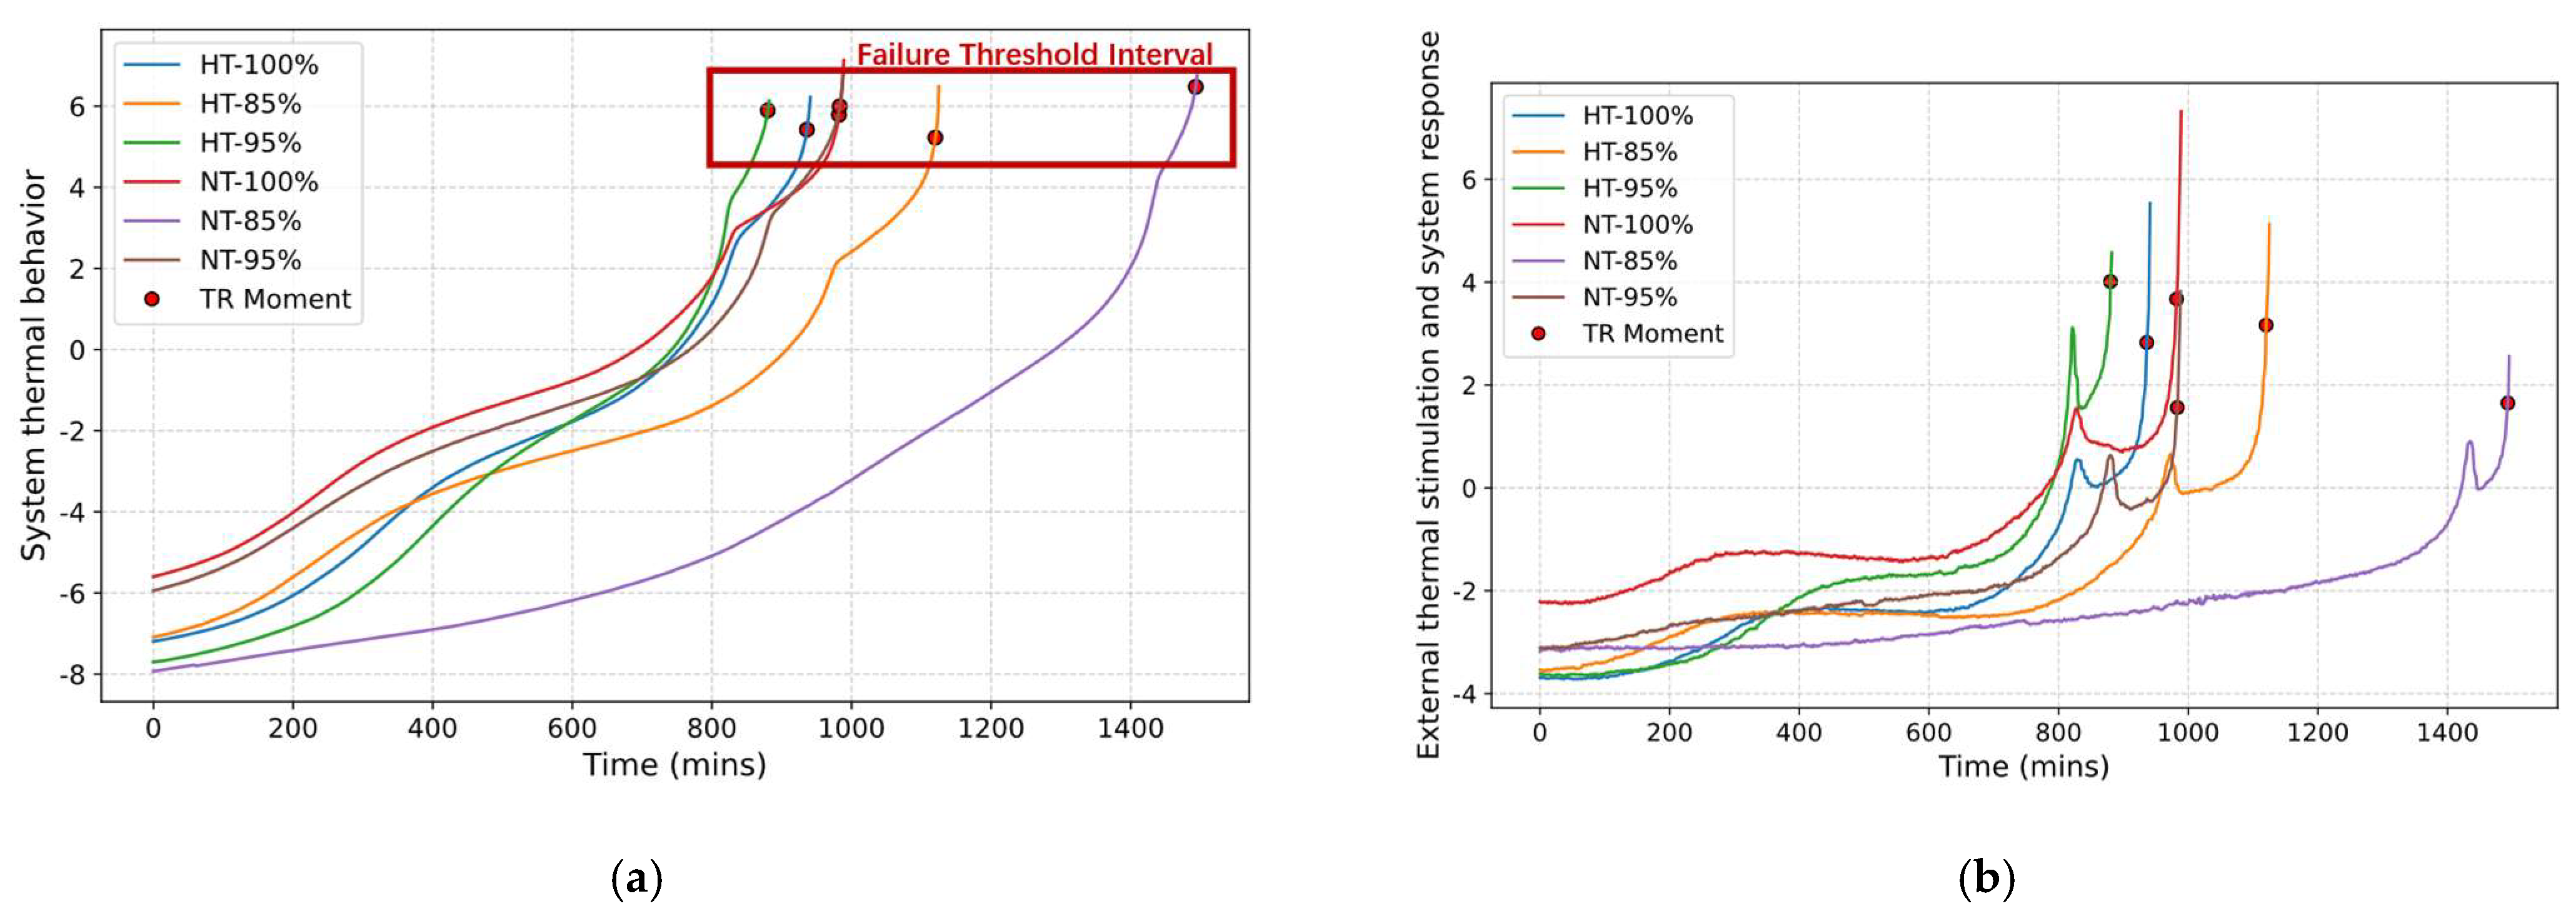
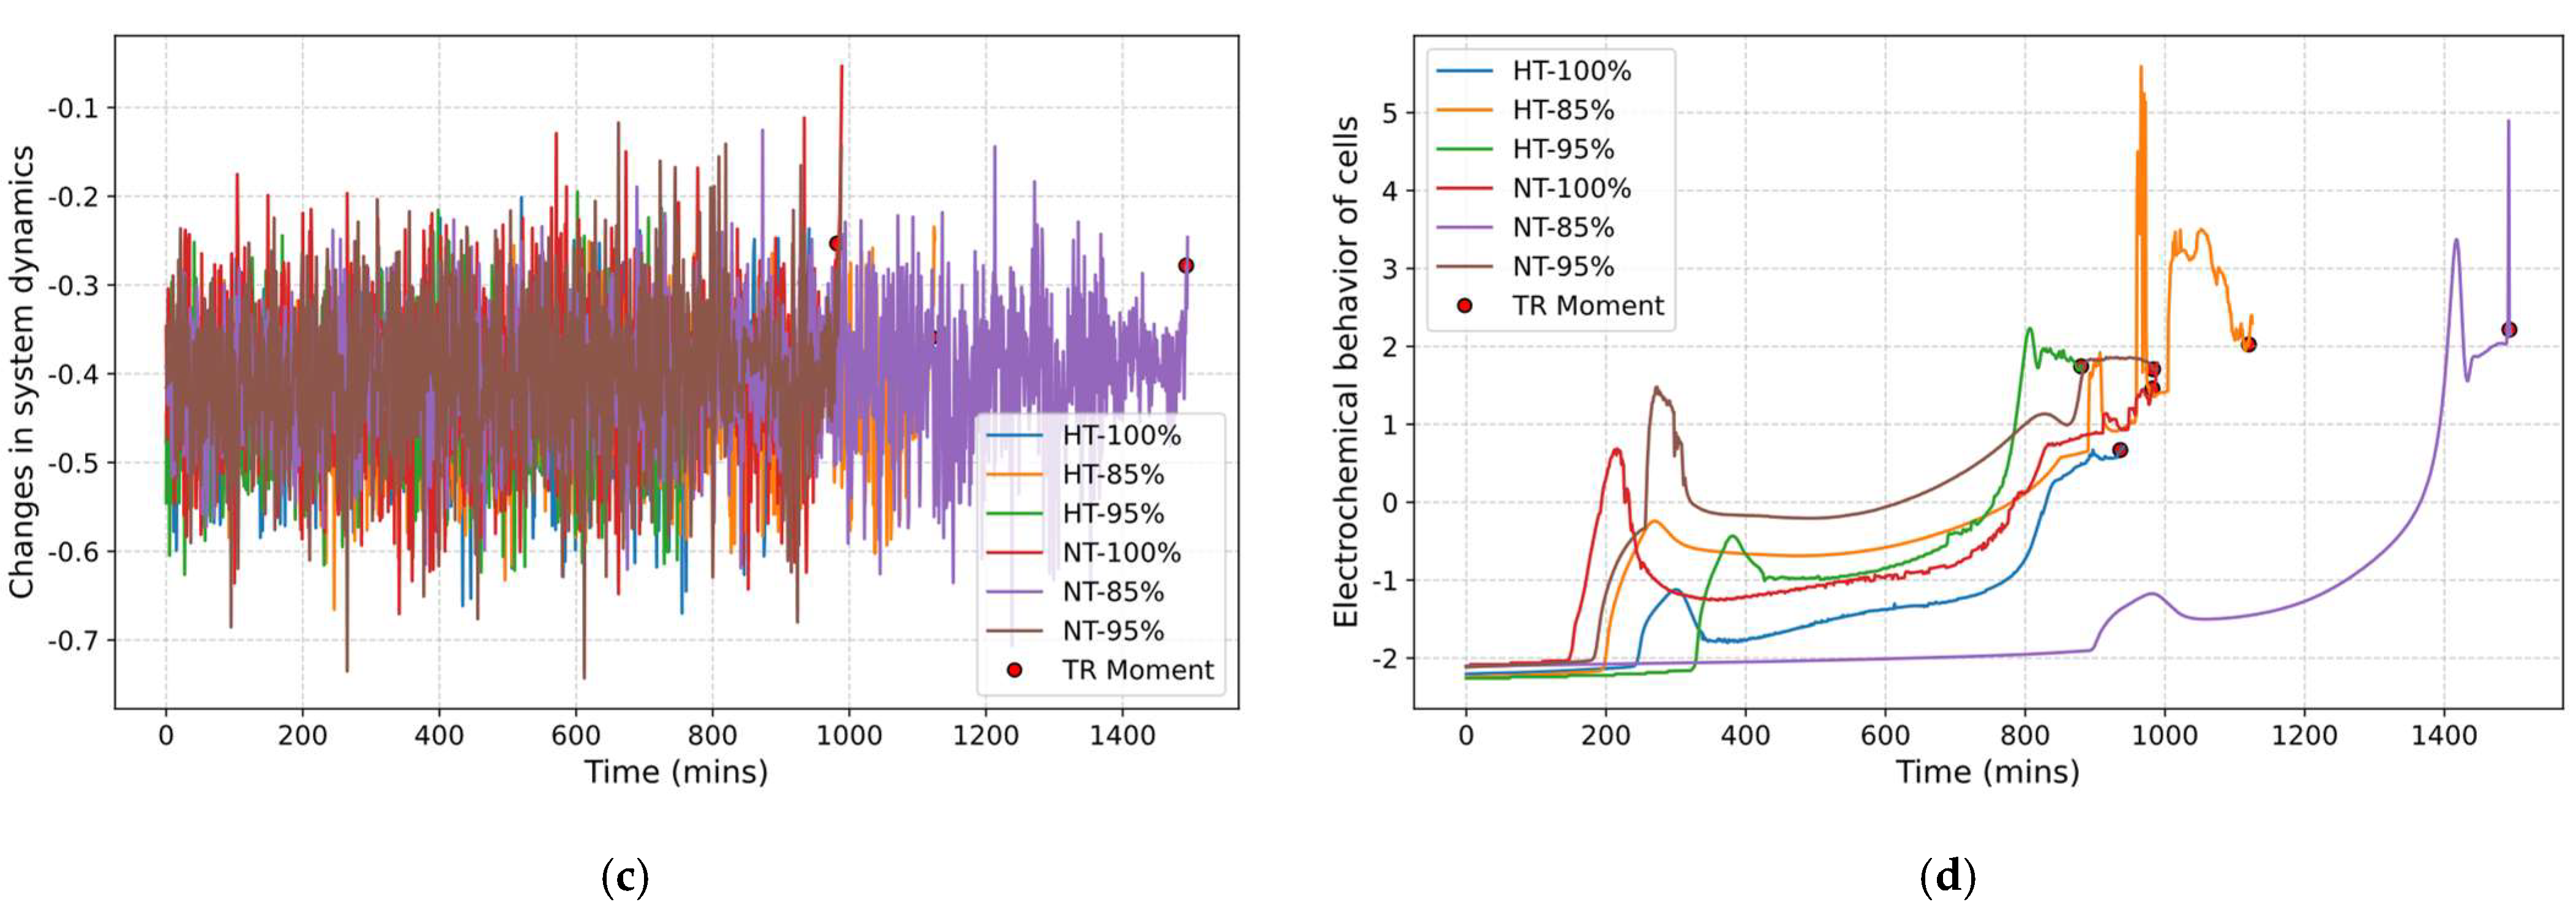
Figure 3 displays the behavior of the four identified features along the TR evolution of all samples. Due to the fact that only one cell is tested under each temperature–SOH condition, the observed differences among cells cannot be directly interpreted as representative characteristics of a specific operating condition. Instead, consistent behavior patterns across different working conditions are more focused on under TR evolution. Specifically, the trend of Feature 1 (Figure 3a) shows a linearly increasing trend while pronounced inflection points are observed based on the trends of Feature 2 (Figure 3b) and Feature 4 (Figure 3d), which give rise to a short-lived peak. The occurrence time of the observed inflection points at Features 2 and 4 is different, being closer to according to Feature 2 and more advanced according to Feature 4. As for the trend of Feature 3 (Figure 3c), it does not show either a clear trend or abrupt change characteristics. The high level of its fluctuations indicates the continuous dynamic variability in the LIB–chamber system.
Figure 3.
Behavior of identified features: (a) system thermal behavior; (b) external thermal stimulation and system response; (c) changes in system dynamics; (d) electrochemical behavior of cells. In the legends, “NT–X%” and “HT–X%” denote operation at normal temperature (25 °C) and high temperature (45 °C), respectively, with X% representing the SOH level of the cell.
The result reveals the consistency of the identified feature structures across cells under different operating temperatures and SOH states. In addition, the observed behavior patterns of Features 1, 2, and 4 under TR evolution show potential for developing early warning and prognostic models. For example, the system thermal behavior represented by Feature 1 shows less sensitivity in the early stage of TR evolution. However, its linearly increasing trend leading to supports the establishment of the process-based degradation model. Through modeling the failure threshold interval according to the score of Feature 1, the prognostic function can be achieved by simulating the reaching time of failure thresholds, resulting in the estimation of the time-to-TR.
The observed behavior patterns suggest that both Feature 2 and Feature 4 support developing early warning models. Compared with Feature 2, Feature 4 shows a more direct relationship with TR evolution by reflecting the dynamic evolution of the stability of the electrochemical characteristics of cells. The consistent sharp variation indicates good sensitivity at the early stage of the TR evolution. As for Feature 2, though mainly reflecting a complex stimulation–response behavior between the chamber and cells, it also shows potential for being used to develop early warning models.
Overall, the identified feature structure (Feature 1, 2, 4) displays great potential in informing the health information of cells during TR evolution and supporting the degradation modeling, early warning, and prognostic functions.
4.2. Validation of the Early Warning and Risk-Oriented Prognostics
In this section, the Leave-One-Sample-Out cross-validation strategy is adopted to validate the early warning and prognostic functions based on the identified feature structure.
4.2.1. Validation Design
The six cells are divided into six validation rounds. In each round, one cell is selected as the test sample, while the remaining five cells are used as the training set. For each validation round, the following procedures are conducted:
Step 1: Training phase
Building upon the identified feature structure, the training set is employed to train the factor loading of each parameter on corresponding features. Feature 1 is further employed as the HI, whose scores are used to establish the degradation model according to Equation (2). Features 2 and 4 are employed to identify warning points.
Step 2: Testing phase
The trained factor loadings of parameters from the training set are directly applied to the test set, which supports the validation of both early warning and prognostic functions.
Early warning validation: The extracted Feature 2 and Feature 4 trajectories of the test set are analyzed to assess the consistency of feature behavior, detectability of warning points, and available warning time before TR.
Prognostic function validation: Four prediction starting points are selected from the test set to represent different stages of TR evolution, including the beginning stage (BS: 50 min), early stage (ES: 25% of the total life), middle stage (MS: 50% of the total life), and late stage (LS: 75% of the total life). At each starting point, the current Feature 1 score is adopted as the initial HI state. The Monte Carlo simulation technique is then applied to propagate the degradation process and estimate the corresponding time-to-TR. The prognostic performance is evaluated by comparing the predicted and actual time-to-TR values using the mean absolute error (MAE), root mean square error (RMSE), and mean absolute percentage error (MAPE).
After repeating these procedures for six validation rounds, the results are summarized to evaluate the generalization capability, robustness, and predictive performance of the framework across cells with different operating conditions and SOH levels.
4.2.2. Early Warning Validation
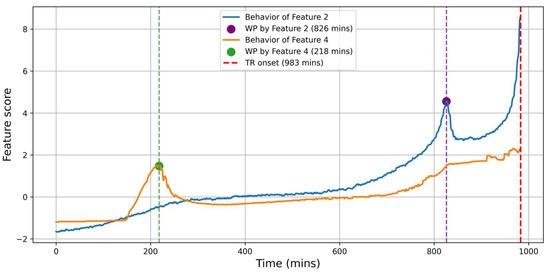
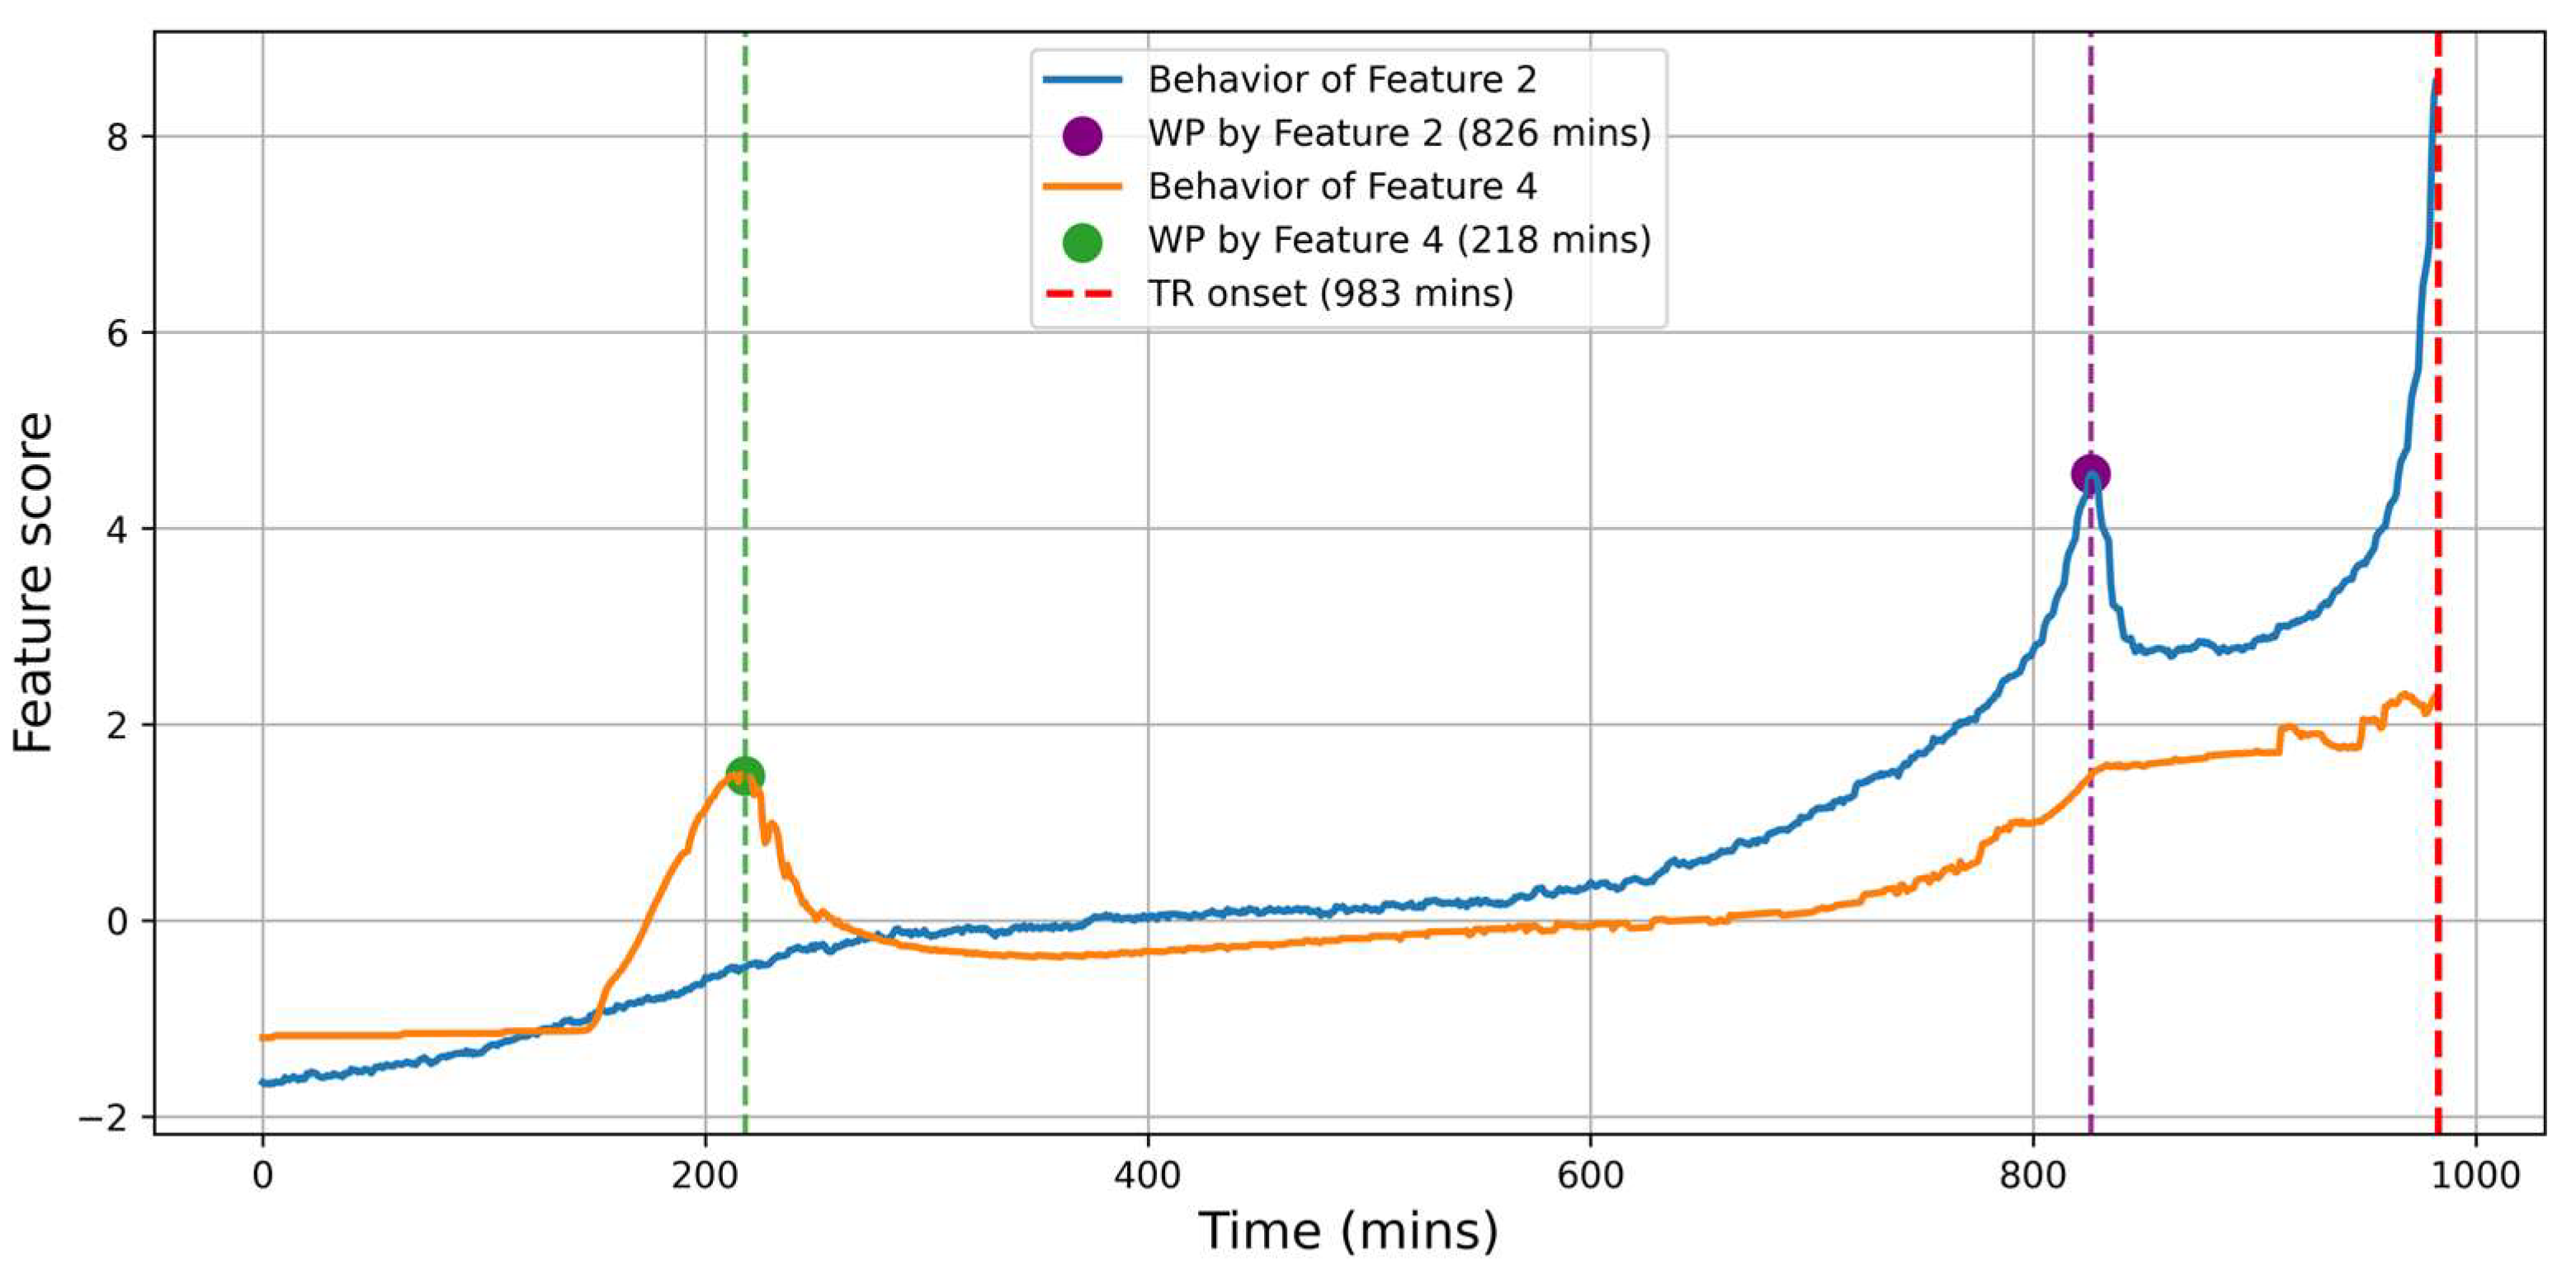
The results validate that the identified feature structure in Table 2 can provide consistent feature behavior patterns across different cells, which reveals the potential of adopting these features in early warning design. As an example, Figure 4 displays the behavior of Features 2 and 4 of the test set in the first-round validation (R1). The warning points are detected according to:
Figure 4.
The behavior of Features 2 and 4 of the test set in the first-round validation (R1). The green and purple dashed lines denote the detected warning points of Feature 4 and Feature 2, respectively, while the red dashed line indicates the thermal runaway onset.
- The prominent local peak of the Feature 2 trajectory as determined in Equation (4), where denotes the Feature 2 value at time .
- The onset of a sustained accelerated increase as determined in Equation (5), where denotes the Feature 4 value at time , and and correspond to the determined criteria.
It should be emphasized that the criteria in Equations (4) and (5) are introduced primarily for validating the detectability of WP and their consistent warning behavior across validation rounds. The proposed criteria are not claimed to be optimal WP criteria.
Table 3 summarizes the results of the detected warning points from all six rounds. Specifically, the WP by Feature 2 occurs 59 to 157 min earlier than on Feature 2, while it occurs much earlier on Feature 4, being 489 to 835 min in advance. However, the feature values of WPs show large variations among cells. This indicates that WP identification should focus on the relative evolution behavior of features rather than their absolute values. Therefore, trend-based indicators are more suitable for developing a generalized early warning strategy.
Table 3.
Detected warning points according to Features 2 and 4.
4.2.3. Prognostic Function Validation
In each round, the stochastic process-based degradation model is established using the Feature 1 score of the training set. Feature 1 is regarded as the HI that reflects the continuous health state evolution associated with TR risks. Due to the nonlinear characteristic of Feature 1, it shows an increasing trend at the later stage under TR evolution. This supports the adoption of the second-order polynomial regression to model the drift part. To avoid overfitting on a small sample size, a constant diffusion parameter is employed in the diffusion part. The average Coefficient of Determination () value of the trained model in each round is 0.904, 0.909, 0.943, 0.912, 0.923, and 0.904, indicating an acceptable fitness across all samples.
The estimation of time-to-TR in the test set is conducted on MATLAB R2026a with the desktop parameters provided as: Intel (R) Core (TM) i5-14600KF CPU @ 3.50 GHz; RAM: 32.0 GB; and NVIDIA GeForce RTX 5070 TI 16 GB. Table 4 summarizes the 95% confidence interval (CI) and evaluation results of the prognostic function in all validation rounds.
Table 4.
Evaluation of the prognostic function in all validation rounds.
The prediction performances display large variations across different validation rounds and prediction stages. Specifically, the MAE ranges from 7.83 min to 505.27 min, the RMSE ranges from 8.38 min to 505.28 min, and the MAPE ranges from 1.06% to 101.97%. These results show that the prediction accuracy is highly dependent on the selected sample and the prediction starting point.
For each round, the prediction results largely vary when considering different prediction starting points. For samples NT-100%, NT-95%, HT-100%, and HT-95%, predictions perform with better accuracy at the beginning and early TR evolution stages (MAPE from 1.06% to 18.67%), while samples NT-85% and HT-85% show better prediction accuracy at the middle and late stages (MAPE from 2.55% to 2.71%). Among them, HT-95% shows worse prediction accuracy and large variation at all stages, with the MAPE ranging from 18.67% to 101.79%. The results show that the trained prognostic model faces challenges in precisely capturing the TR evolution for all samples at different stages.
The 95% CI simulated by Monte Carlo simulations is narrow in each round, with widths of around 7 to 13 min. In addition, the CI shows different degrees of deviation from the reference value. These results indicate that the stochastic uncertainty captured by the trained model is insufficient to account for the overall prediction uncertainty. The remaining prediction errors may also be influenced by the differences between the training and validation cells, which are not sufficiently represented by the generalized model in each round.
Though showing varying prediction performances, the results preliminarily demonstrate that the proposed framework can support time-to-TR estimations under different operating conditions and degradation states.
Overall, by adopting the Leave-One-Sample-Out cross-validation strategy, the validation results indicate the potential of utilizing the identified feature structure in early warning and risk-oriented prognostics toward TR risks.
4.3. Proactive TR Risk Management Solutions
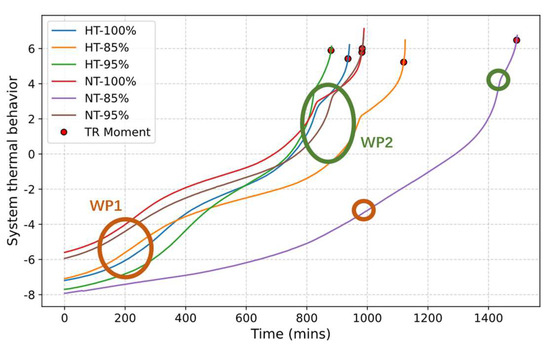
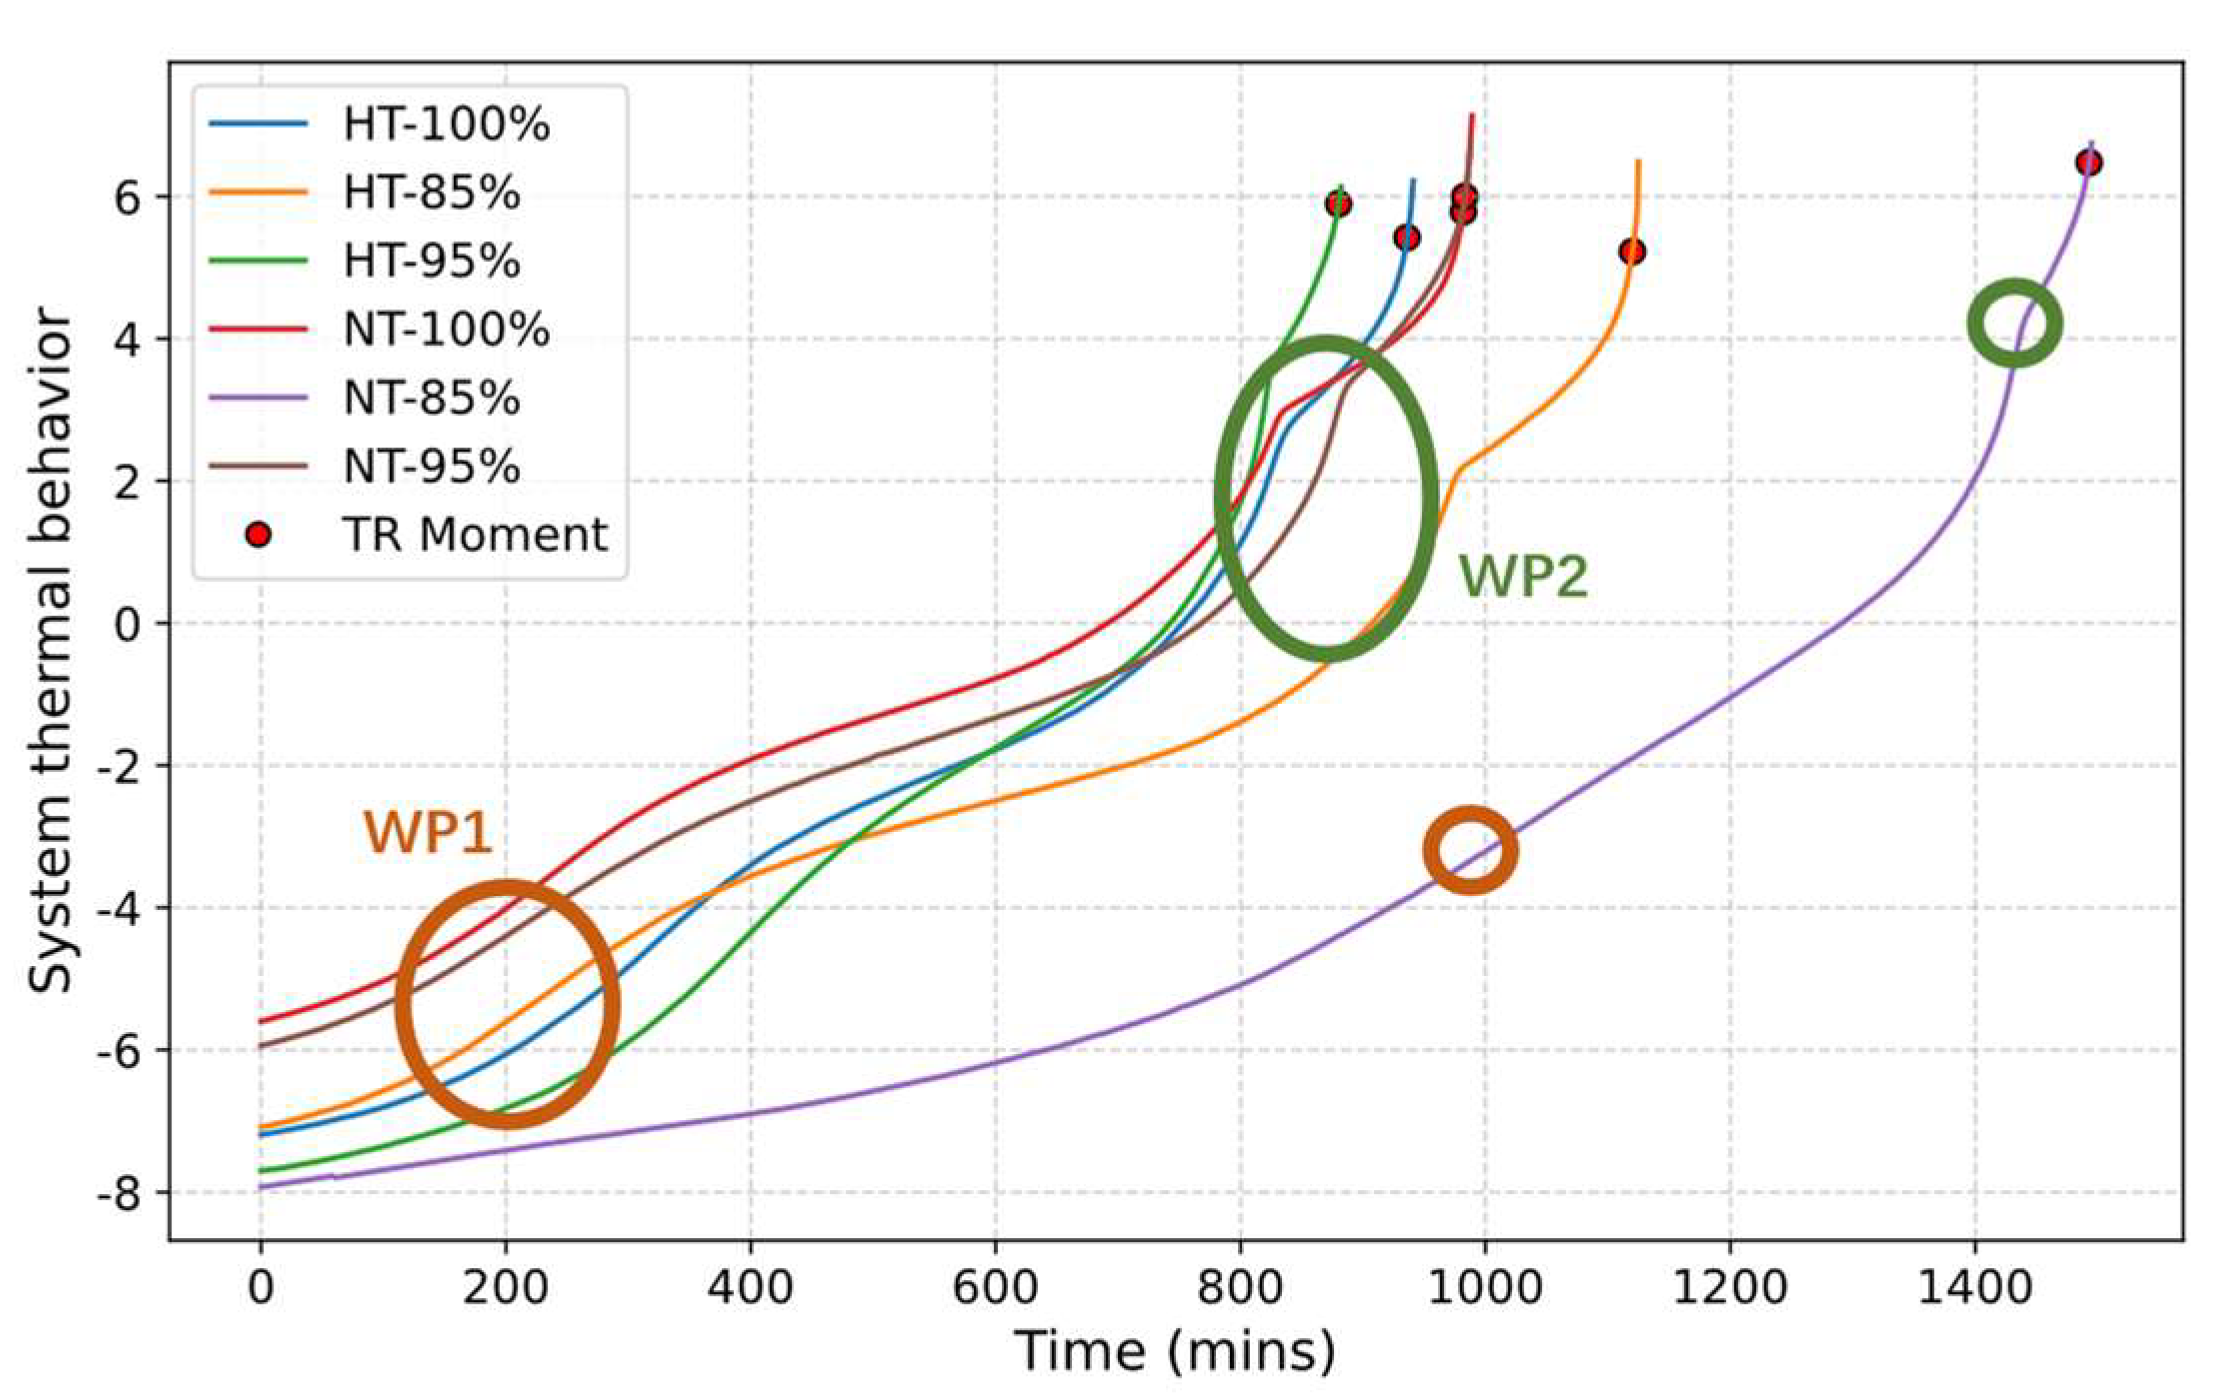
To help illustrate how the proposed framework supports proactive TR risk management, a schematic example (Figure 5) is provided to demonstrate the integration of health information extraction, early warning, and risk-oriented prognostics for decision support.
Figure 5.
Schematic illustration of the proactive TR risk management.
Specifically, HI-related features (like system thermal behavior in the figure) characterize the evolution of TR risks and provide quantitative prognostic information through time-to-TR estimation. WP-related features indicate transitions related to the occurrence of hazardous conditions. As illustrated in Figure 5, WP1 and WP2 represent different warning stages under TR evolution, indicating the increase in TR risks. This information supports risk-informed decision-making under different TR risk conditions. Overall, the integration of WP detection and time-to-TR estimation transforms monitoring data into decision support information, enabling proactive TR risk management.
5. Discussion
This study demonstrates the benefits of characterizing TR risks using multi-sensor monitoring data. The intrinsic thermal behavior of LIBs exhibits structural characteristics across multiple monitored parameters. The validation results demonstrate that these characteristics support both WP design and time-to-TR estimation, showing their potential for TR early warning and risk-oriented prognostics.
Firstly, the designed feature structure according to the intrinsic thermal behavior of LIBs helps characterize the evolution of TR risks. For example, Feature 1 can reflect the overall thermal state evolution of the cell. The temperature-related parameters included in this feature help describe heat accumulation caused by internal reactions, which is a fundamental mechanism driving the progression of TR. Feature 2 characterizes the coupling between external thermal stimulation and system response. Feature 4 reflects electrochemical behavior and may indicate the deterioration in internal electrochemical stability prior to obvious thermal responses. Feature 3 is not directly adopted in early warning and risk-oriented prognostics. However, it contains information on changes in system dynamics that may be related to internal reaction rates and gas generation processes.
Designed based on Features 2 and 4, the advantages of WPs are reflected by their detected lead time. They can be detected 1 and 8 h earlier compared with the actual . The consistent patterns in each validation round further demonstrate their robustness, displaying their application potential. However, Feature 4 shows a more direct relationship with TR progression, which makes it easier to be utilized in WP development and application in practical scenarios. Compared with it, Feature 2 mainly reflects the chamber–LIB system behavior, including external thermal stimulations and system responses. Its behavior may be influenced by heat exchange, ARC control actions, gas generation, etc. Therefore, although Feature 2 contains useful information, further analysis of the chamber–LIB system behavior is necessary before directly adopting it as the early warning indicators in practice.
The validation results further demonstrate the reasonability of separating electrochemical parameters from temperature-related parameters in the extracted component 1. Specifically, the electrochemical parameters can be more sensitive than others in TR early warning, while temperature signals tend to show noticeable changes at later stages of TR. This also implies that though data-driven approaches can extract meaningful information from multi-source monitoring data, the physical interpretation, generalization ability, and robustness of features still rely on the support of physical and mechanistic knowledge. As a result of this study, electrochemical parameters are suggested in early warning design, while temperature signals show more application potential in degradation modeling and time-to-TR estimations.
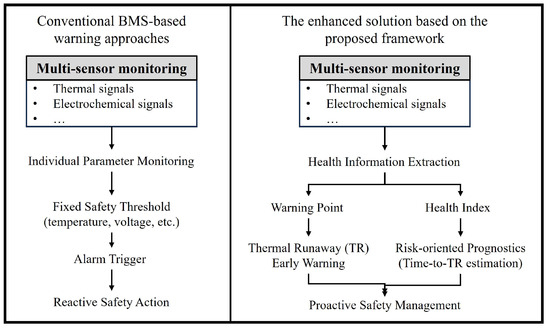
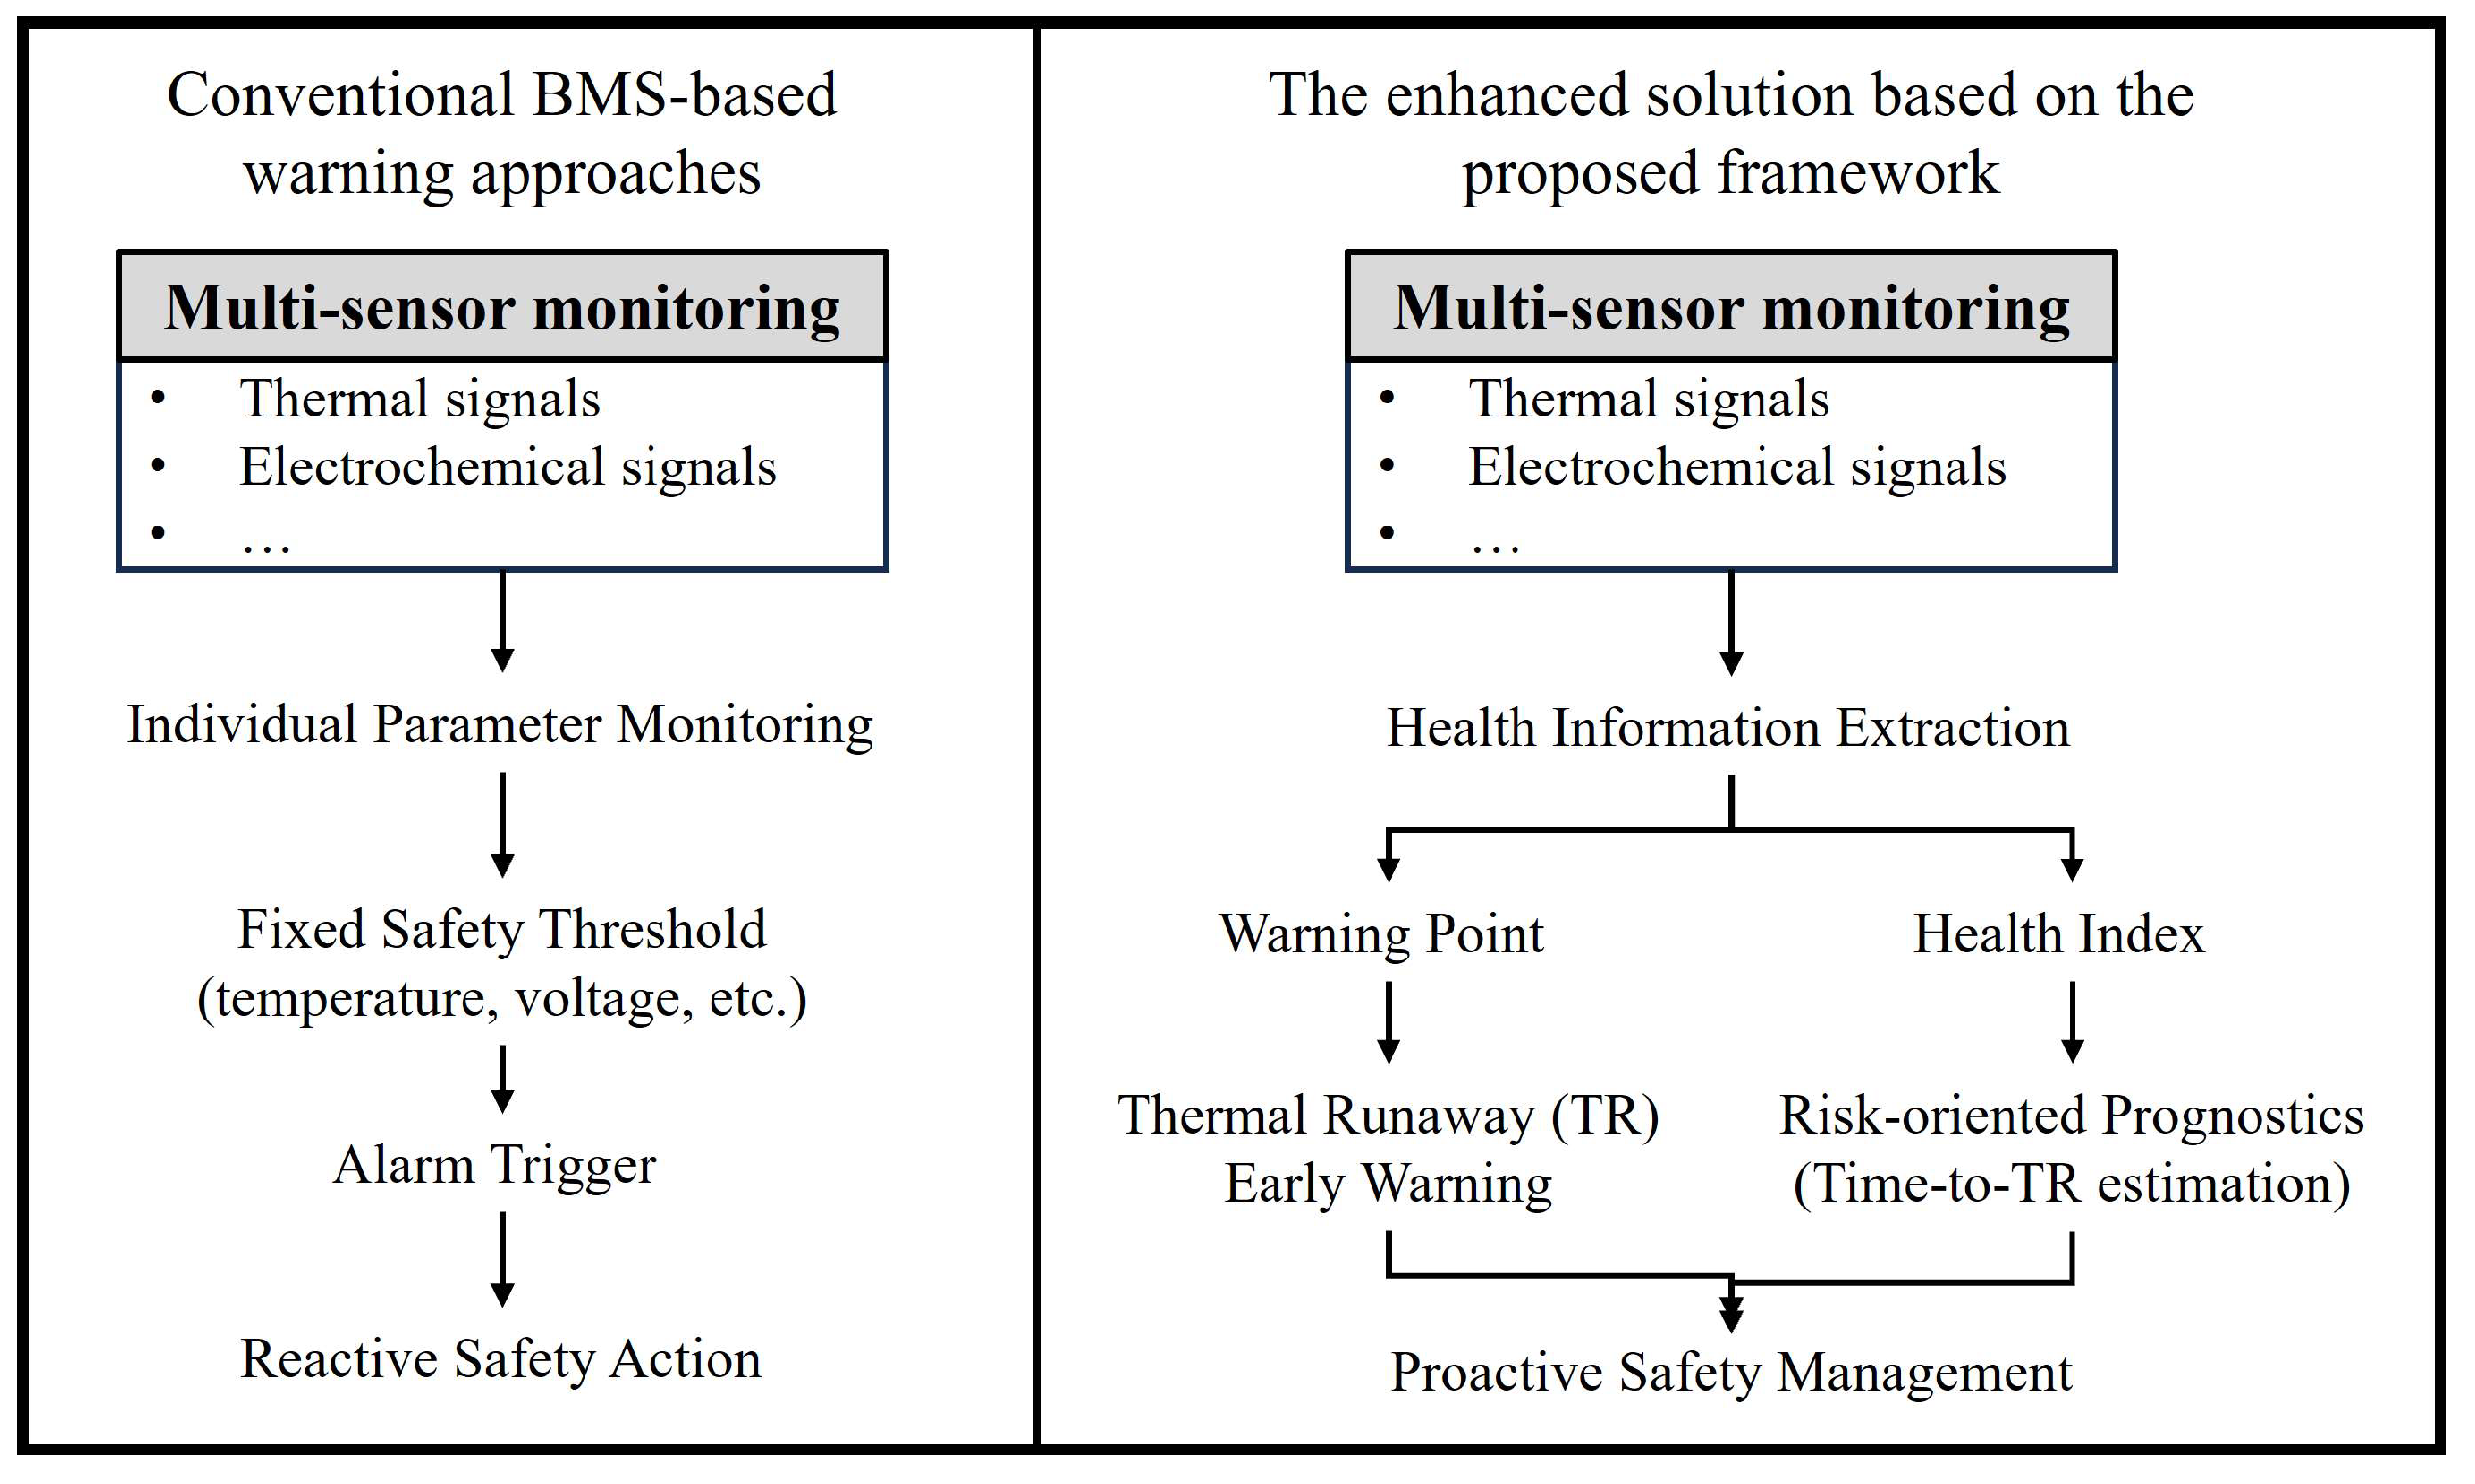
The findings also provide implications for the development of battery safety management strategies. Firstly, the identified feature structure shows potential in extracting health information from multi-sensor monitoring during TR evolution. This implies that existing BMSs may not only support condition monitoring but also benefit degradation information extraction related to safety risks. Secondly, the observed feature behavior patterns support the early warning mechanism design. This implies the advantage of incorporating feature-based health indicators to detect anomalies at the early stage of TR evolution. This is more reliable than relying on fixed safety thresholds of a single parameter. Moreover, the validation of the risk-oriented prognostic function preliminarily demonstrates that the TR onset time can be predicted based on health information extraction. Temperature signals show more advantages in these tasks. The results help to extend their practical applicability in BMSs. Unlike conventional warning approaches that focus more on noticeable changes at a later stage, temperature signals can be adopted to develop proactive safety management strategies, such as proactive risk monitoring and prognostic decision-making. Furthermore, the design of the framework follows the concept of extracting health information from multi-sensor monitoring data and supporting the early warning and risk-oriented prognostics. This concept is not limited to ARC measurements. Thus, the framework shows potential to be transferred to practical BMS environments. Monitoring signals available in real applications can be incorporated in the framework, but it relies on validation in practical scenarios. Figure 6 displays the schematic comparison between the framework and conventional BMS-based warning approaches. It helps illustrate how health information extraction, feature-based warning mechanisms, and time-to-TR estimation complement conventional condition monitoring by providing additional risk-oriented safety information for decision support.
Figure 6.
Schematic comparison between the proposed framework and conventional BMS-based warning approaches.
Overall, this study presents a preliminary proof-of-concept framework. It also demonstrates the feasibility of transforming multi-sensor monitoring data into health-related features that support both TR early warning and risk-oriented prognostics. The proposed framework provides a preliminary foundation for developing data-driven and proactive TR risk management strategies. The results indicate the application potential of data-driven solutions for future BMS applications.
The limitations of this study are from three perspectives: the scope of the experimental validation, methodological limitations, and limitations related to the practical applicability of the proposed framework. Firstly, the complexity and high cost of the ARC experiments limit the availability of the dataset. There are only six cells being adopted for model development and validation. Though the Leave-One-Sample-Out cross-validation strategy is employed to improve the robustness of the result assessment, the limited samples still constrain the statistical representativeness of the extracted health-related features and the developed degradation model. As a consequence, several methodological simplifications are adopted in this study. For example, the feature structure is primarily explored from a normal temperature dataset, and the degradation model is developed using a limited training set in each validation round. In addition, though different SOH and operating temperature levels are considered as different initial conditions of cells in experiments, this study mainly focuses on the identification of consistent feature behavior patterns. The variability due to condition differences is not fully considered. Thus, the validation results are limited to providing solid evidence of the framework’s generalization capability. Secondly, the determination of the feature structure is not directly constructed on the PCA results. The consideration of the parameters’ physical meaning and characteristics relies on expert knowledge. The robustness of the feature structure requires further assessment and comparison with alternative schemes. In addition, this study employs stochastic process-based degradation models and Monte Carlo simulations to characterize uncertainty propagation in TR evolution. However, they show limitations in incorporating additional uncertainty sources, such as cell-to-cell variability, parameter estimation uncertainty, and model-form uncertainty. This hinders the reliability of the framework. Furthermore, the results are limited to providing a quantitative comparison against other methods, such as threshold-based warning strategies, conventional machine learning methods, or other TR-related prognostic approaches. The performance of the framework needs to be further evaluated with other methods. As for limitations related to practical applicability, the framework is validated only through single-cell TR experiments. The heat propagation effects and interactions within battery packs are not considered. This may affect the framework’s applicability at battery pack levels. Furthermore, all experiments are conducted under adiabatic ARC conditions, which cannot represent real-world battery systems. TR evolution can be affected by more factors in practice. Thus, though ARC experiments provide an effective validation platform, further validation under practical battery operating conditions is still required.
As for future perspectives, it is meaningful to establish a larger and more diverse TR dataset. This helps extract more generalized degradation patterns and investigate how different conditions impact the behavior of LIBs in their TR evolution. Based on them, adaptive approaches can be adopted to better consider the variability due to cells’ characteristics and operating conditions in early warning and prognostic functions. This can improve the generalization capability of the framework for unseen batteries. From a methodological perspective, future work is expected to improve the methodological robustness. For example, by employing more objective feature construction strategies, the robustness of different feature structure schemes can be evaluated by quantitative sensitivity analyses. It is also meaningful to incorporate additional uncertainty sources, such as cell-to-cell variability, parameter estimation uncertainty, and model-form uncertainty. To further evaluate the robustness and practical applicability of the framework, comprehensive quantitative comparisons with existing early warning and TR-related prognostic approaches should be conducted. Moreover, this study focuses more on individual cells than on the battery pack. The interactions among cells in a battery pack, especially the TR propagation, have received relatively limited attention. They have been shown to cause more severe safety consequences in some studies, which can be another future perspective. Finally, the study is conducted based on the intrinsic thermal behavior of LIBs. The applicability of the framework in practical scenarios needs to be further validated. Impacts from external factors, the complexity of sensor deployment in practical scenarios, and the integration of data-driven strategies into current LIB health management solutions require further investigation. In summary, future work will focus on improving the experimental validation and methodological robustness through larger-scale experiments, optimizing uncertainty modeling, establishing benchmarks for performance evaluation, and conducting validation in practical battery management scenarios.
6. Conclusions
This study investigates data-driven multi-sensor early warning and risk-oriented prognostics for thermal runaway (TR) risk management of lithium-ion batteries (LIBs) based on their intrinsic thermal behavior. The results preliminarily demonstrate the advantages of employing multi-sensor monitoring data to characterize TR evolution. By analyzing the synergistic effects among multiple parameters, representative health information can be extracted to support the development of early warning and risk-oriented prognostics. This enhances TR risk management solutions by transforming monitoring data into decision support information. Overall, this study presents a preliminary proof-of-concept framework for LIB TR risk management, whose robustness, generalizability, and practical applicability in battery management systems require further validation.
Author Contributions
Conceptualization, Y.X., H.S., J.G. and M.D.; methodology, H.S. and Y.X.; software, Y.X., L.M., Y.L. and C.Z.; validation, H.S., J.G., H.T. and M.D.; formal analysis, H.S. and Y.X.; investigation, H.S. and Y.X.; resources, Y.X.; data curation, Y.X., L.M., Y.L., C.Z. and J.L.; writing—original draft preparation, H.S.; writing—review and editing, H.S., J.G., D.F. and M.D.; visualization, H.S.; supervision, D.F., M.D. and Y.X.; project administration, Y.X.; funding acquisition, Y.X. All authors have read and agreed to the published version of the manuscript.
Funding
This research is funded by the Zhejiang Provincial Administration for Market Regulation’s Eagle Plan Cultivation Major Project, “Risk assessment of thermal runaway in lithium-ion power batteries and research on modification of positive electrode materials”, grant number CY2023105.
Data Availability Statement
Data will be made available on request.
Acknowledgments
This research is supported by the program of the China Scholarship Council (No. CSC202207930021).
Conflicts of Interest
The authors declare no conflicts of interest.
Abbreviations
The following abbreviations are used in this manuscript:
| ARC | Accelerating Rate Calorimeter |
| BMS | Battery Management System |
| BTMS | Battery Thermal Management System |
| LIBs | Lithium-ion Batteries |
| NCM | Nickel–Cobalt–Manganese |
| SOC | State of Charge |
| SOH | State of Health |
| ROC | Rate of Change |
| TR | Thermal Runaway |
Appendix A
Table A1.
The monitored parameters in the experiment.
Table A2.
Rotated PCs and component factor loading.
References
- Liu, M.; Kong, Y.; Tang, J.; Zhang, B.; Shen, X. Structure and Performance Evolutions with Temperature, Stress, and Thermal-Force Coupling of the Silica Aerogel Composite for Suppressing Thermal Runaway Propagation of LIBs. Compos. Part A Appl. Sci. Manuf. 2025, 190, 108692. [Google Scholar] [CrossRef] [Scilit]
- Chen, H.; Zhou, W.; Yuan, Y.; Heidarshenas, B. Effect of Tube Location on the Temperature of Plate Lithium-Ion Battery Applicable in the Aerospace Industry in the Presence of Two-Phase Nanofluid Flow inside a Channel Placed in Phase Change Material. Eng. Anal. Bound. Elem. 2023, 150, 624–635. [Google Scholar] [CrossRef] [Scilit]
- Luo, X.; Wang, J.; Dooner, M.; Clarke, J. Overview of Current Development in Electrical Energy Storage Technologies and the Application Potential in Power System Operation. Appl. Energy 2015, 137, 511–536. [Google Scholar] [CrossRef] [Scilit]
- Hu, X.; Yuan, H.; Zou, C.; Li, Z.; Zhang, L. Co-Estimation of State of Charge and State of Health for Lithium-Ion Batteries Based on Fractional-Order Calculus. IEEE Trans. Veh. Technol. 2018, 67, 10319–10329. [Google Scholar] [CrossRef] [Scilit]
- Zhang, Q.; Liu, T.; Wang, Q. Experimental Study on the Influence of Different Heating Methods on Thermal Runaway of Lithium-Ion Battery. J. Energy Storage 2021, 42, 103063. [Google Scholar] [CrossRef] [Scilit]
- Qi, C.; Liu, Z.; Lin, C.; Hu, Y.; Yan, T.; Zhou, Y.; Chen, B. Study on the Thermal Runaway Characteristics and Debris of Lithium-Ion Batteries under Overheating, Overcharge, and Extrusion. J. Energy Storage 2023, 72, 108821. [Google Scholar] [CrossRef] [Scilit]
- Cui, H.; Wu, H.; He, D.; Ma, S. Noble Metal (Pd, Pt)-Functionalized WSe2 Monolayer for Adsorbing and Sensing Thermal Runaway Gases in LIBs: A First-Principles Investigation. Environ. Res. 2025, 269, 120847. [Google Scholar] [CrossRef] [Scilit] [PubMed]
- Hu, D.; Huang, S.; Wen, Z.; Gu, X.; Lu, J. A Review on Thermal Runaway Warning Technology for Lithium-Ion Batteries. Renew. Sustain. Energy Rev. 2024, 206, 114882. [Google Scholar] [CrossRef] [Scilit]
- Feng, X.; Ouyang, M.; Liu, X.; Lu, L.; Xia, Y.; He, X. Thermal Runaway Mechanism of Lithium Ion Battery for Electric Vehicles: A Review. Energy Storage Mater. 2018, 10, 246–267. [Google Scholar] [CrossRef] [Scilit]
- Wang, J.; Yang, J.; Bai, W.; Wang, Z.; Yu, K.; Lu, Y.; Han, C. Thermal Runaway and Jet Flame Features of LIBs Undergone High-Rate Charge/Discharge: An Investigation. J. Energy Chem. 2025, 103, 826–837. [Google Scholar] [CrossRef] [Scilit]
- Cai, T.; Stefanopoulou, A.G.; Siegel, J.B. Early Detection for Li-Ion Batteries Thermal Runaway Based on Gas Sensing. ECS Trans. 2019, 89, 85. [Google Scholar] [CrossRef] [Scilit]
- Li, Y.; Chang, L.; Kong, L.; Zhao, X.; Zheng, J.; Wen, X.; Kou, G.; Mu, M. A Novel Cold Plate Battery Thermal Management System for NEDC and WLTC Driving Conditions. Appl. Therm. Eng. 2025, 279, 127874. [Google Scholar] [CrossRef] [Scilit]
- Tan, K.; Wang, S.; Jiang, J.; Liu, H.; Dai, X.; Li, S.; Li, X.; Li, X.; Liu, T. Operando Monitoring Gas Pressure for Accurate Early Warning of Thermal Runaway in Lithium-Ion Batteries Induced by Overheating Based on an Optical Fiber Fabry-Perot Interferometer. J. Power Sources 2024, 615, 235096. [Google Scholar] [CrossRef] [Scilit]
- She, C.; Liu, C.; Li, Y.; Wang, X.; Ye, H.; Zeng, C.; Mei, W.; Wang, Q. A Novel Early Warning Method for Thermal Runaway of Lithium-Ion Batteries Based on Mechanical Stress Signal. Process Saf. Environ. Prot. 2025, 201, 107626. [Google Scholar] [CrossRef] [Scilit]
- Yang, J.; Hong, J.; Zhang, X.; Du, Y.; Hou, Y.; Chen, Y.; Wang, F.; Chen, Y.; Wang, H. Thermal Runaway Classification and Early Warning for Lithium-Ion Batteries Based on Voltage Feature Statistics and Multi-Model Fusion. Appl. Therm. Eng. 2025, 280, 128075. [Google Scholar] [CrossRef] [Scilit]
- Su, Y.-D.; Preger, Y.; Burroughs, H.; Sun, C.; Ohodnicki, P.R. Fiber Optic Sensing Technologies for Battery Management Systems and Energy Storage Applications. Sensors 2021, 21, 1397. [Google Scholar] [CrossRef] [Scilit] [PubMed]
- Zhang, Y.; Li, Y.; Guo, Z.; Li, J.; Ge, X.; Sun, Q.; Yan, Z.; Li, Z.; Huang, Y. Health Monitoring by Optical Fiber Sensing Technology for Rechargeable Batteries. eScience 2024, 4, 100174. [Google Scholar] [CrossRef] [Scilit]
- Tran, M.-K.; Panchal, S.; Khang, T.D.; Panchal, K.; Fraser, R.; Fowler, M. Concept Review of a Cloud-Based Smart Battery Management System for Lithium-Ion Batteries: Feasibility, Logistics, and Functionality. Batteries 2022, 8, 19. [Google Scholar] [CrossRef] [Scilit] [PubMed]
- Liang, X.; Wang, P.; Cao, X.; Wan, X.; Chao, P.; Zhao, X.; Yu, A.; Liu, C.; Li, J. Research on Improving the Safety of New Energy Vehicles Exploits Vehicle Operating Data. Saf. Sci. 2025, 181, 106681. [Google Scholar] [CrossRef] [Scilit]
- Xiao, Y.; Zhou, X.; Zhang, T.; Zhang, H.; Su, M.; Yin, S.; Si, Y.; Wang, Y.; Liu, Y. Advanced Thermal Runaway Warning Methods for Lithium-Ion Batteries: Challenges and Solutions. J. Energy Storage 2026, 155, 121565. [Google Scholar] [CrossRef] [Scilit]
- Ye, J.; Huang, J.; Kuang, J.; Tang, J.; Liu, C.; Li, R.; Tan, G. Data-Driven Methods for Early Warning of Battery Thermal Runaway: A Review of Multi-Signal Fusion and Machine Learning Approaches. J. Energy Storage 2025, 133, 118043. [Google Scholar] [CrossRef] [Scilit]
- Xie, S.; Wang, Z.; Fu, J.; Lv, P.; He, Y. A Review of Sensing Technology for Monitoring the Key Thermal Safety Characteristic Parameters of Lithium-Ion Batteries. J. Power Sources 2024, 624, 235598. [Google Scholar] [CrossRef] [Scilit]
- Azuaje–Berbecí, B.J.; Ertan, H.B. A Model for the Prediction of Thermal Runaway in Lithium–Ion Batteries. J. Energy Storage 2024, 90, 111831. [Google Scholar] [CrossRef] [Scilit]
- Huang, W.; Feng, X.; Pan, Y.; Jin, C.; Sun, J.; Yao, J.; Wang, H.; Xu, C.; Jiang, F.; Ouyang, M. Early Warning of Battery Failure Based on Venting Signal. J. Energy Storage 2023, 59, 106536. [Google Scholar] [CrossRef] [Scilit]
- Wang, X.; Mi, Y.; Zhao, Z.; Cai, J.; Yang, D.; Tu, F.; Jiang, Y.; Xiang, J.; Mi, S.; Wang, R. Investigating the Thermal Runaway Behavior and Early Warning Characteristics of Lithium-Ion Batteries by Simulation. J. Electron. Mater. 2024, 53, 7367–7379. [Google Scholar] [CrossRef] [Scilit]
- He, C.X.; Liu, Y.H.; Huang, X.Y.; Wan, S.B.; Lin, P.Z.; Huang, B.L.; Sun, J.; Zhao, T.S. A Reduced-Order Thermal Runaway Network Model for Predicting Thermal Propagation of Lithium-Ion Batteries in Large-Scale Power Systems. Appl. Energy 2024, 373, 123955. [Google Scholar] [CrossRef] [Scilit]
- Zhao, X.; Liu, Q.; Ma, J.; Zhang, K.; Peng, J.; He, Y. Identification of Internal Short Circuit on Cell-Level via Similarity Assessment of Partial Voltage Segments in Adjacent Charging Cycles. IEEE Trans. Power Electron. 2025, 40, 17073–17090. [Google Scholar] [CrossRef] [Scilit]
- Li, D.; Deng, J.; Zhang, Z.; Liu, P.; Wang, Z. Multi-Dimension Statistical Analysis and Selection of Safety-Representing Features for Battery Pack in Real-World Electric Vehicles. Appl. Energy 2023, 343, 121188. [Google Scholar] [CrossRef] [Scilit]
- Chang, C.; Wang, Q.; Jiang, J.; Jiang, Y.; Wu, T. Voltage Fault Diagnosis of a Power Battery Based on Wavelet Time-Frequency Diagram. Energy 2023, 278, 127920. [Google Scholar] [CrossRef] [Scilit]
- Wu, P.; Tian, E.; Tao, H.; Chen, Y. Data-Driven Spiking Neural Networks for Intelligent Fault Detection in Vehicle Lithium-Ion Battery Systems. Eng. Appl. Artif. Intell. 2025, 141, 109756. [Google Scholar] [CrossRef] [Scilit]
- Ma, Z.; Huo, Q.; Wang, W.; Zhang, T. Voltage-Temperature Aware Thermal Runaway Alarming Framework for Electric Vehicles via Deep Learning with Attention Mechanism in Time-Frequency Domain. Energy 2023, 278, 127747. [Google Scholar] [CrossRef] [Scilit]
- Liu, G.; Deng, Z.; Xu, Y.; Lai, L.; Gong, G.; Tong, L.; Zhang, H.; Li, Y.; Gong, M.; Yan, M.; et al. Lithium-Ion Battery State of Health Estimation Based on CNN-LSTM-Attention-FVIM Algorithm and Fusion of Multiple Health Features. Appl. Sci. 2025, 15, 7555. [Google Scholar] [CrossRef] [Scilit]
- Oyewole, I.; Hassanieh, W.; Chelbi, M.; Chehade, A. Uncertainty-Aware Deep Learning with Physics-Informed Bayesian Sampling for Lithium-Ion Battery Prognostics. Appl. Energy 2025, 402, 126880. [Google Scholar] [CrossRef] [Scilit]
- Duan, C.; Cao, H.; Liu, F.; Duan, X.; Pu, H.; Luo, J. An Interactive Prognostics Framework for Lithium-Ion Battery Remaining Useful Life Based on Neural Networks and Statistical Processes. Reliab. Eng. Syst. Saf. 2025, 264, 111434. [Google Scholar] [CrossRef] [Scilit]
- Saw, L.H.; Poon, H.M.; Thiam, H.S.; Cai, Z.; Chong, W.T.; Pambudi, N.A.; King, Y.J. Novel Thermal Management System Using Mist Cooling for Lithium-Ion Battery Packs. Appl. Energy 2018, 223, 146–158. [Google Scholar] [CrossRef] [Scilit]
- Mashayekhi, M.; Houshfar, E.; Ashjaee, M. Development of Hybrid Cooling Method with PCM and Al2O3 Nanofluid in Aluminium Minichannels Using Heat Source Model of Li-Ion Batteries. Appl. Therm. Eng. 2020, 178, 115543. [Google Scholar] [CrossRef] [Scilit]
- Yin, L.; Wei, R.; Zhang, L.; Chen, S.; Ren, Z.; Wang, Z.; Huang, S. Analysis of the Fire Evolution Process of an Electric Vehicle in a Confined Garage. Tunn. Undergr. Space Technol. 2026, 167, 107062. [Google Scholar] [CrossRef] [Scilit]
- Shi, H.; Xu, Y.; Qiu, J.; Xu, Y.; Zheng, C.; Geng, J.; Fissore, D.; Demichela, M. Adopting Data-Driven Safety Management Strategy for Thermal Runaway Risks of Electric Vehicles: Insights from an Experimental Scenario. Appl. Sci. 2026, 16, 996. [Google Scholar] [CrossRef] [Scilit]
- Qian, Y.; Vaddiraju, S.; Khan, F. Safety Education 4.0—A Critical Review and a Response to the Process Industry 4.0 Need in Chemical Engineering Curriculum. Saf. Sci. 2023, 161, 106069. [Google Scholar] [CrossRef] [Scilit]
- Wang, H.; Lv, L.; Li, X.; Li, H.; Leng, J.; Zhang, Y.; Thomson, V.; Liu, G.; Wen, X.; Sun, C.; et al. A Safety Management Approach for Industry 5.0′s Human-Centered Manufacturing Based on Digital Twin. J. Manuf. Syst. 2023, 66, 1–12. [Google Scholar] [CrossRef] [Scilit]
- Maćkiewicz, A.; Ratajczak, W. Principal Components Analysis (PCA). Comput. Geosci. 1993, 19, 303–342. [Google Scholar] [CrossRef] [Scilit]
- Zhang, Z.; Si, X.; Hu, C.; Lei, Y. Degradation Data Analysis and Remaining Useful Life Estimation: A Review on Wiener-Process-Based Methods. Eur. J. Oper. Res. 2018, 271, 775–796. [Google Scholar] [CrossRef] [Scilit]
- Liu, D.; Wang, S. An Artificial Neural Network Supported Stochastic Process for Degradation Modeling and Prediction. Reliab. Eng. Syst. Saf. 2021, 214, 107738. [Google Scholar] [CrossRef] [Scilit]
- Liu, C.; Wen, X.; Zhong, J.; Liu, W.; Chen, J.; Zhang, J.; Wang, Z.; Liao, Q. Characterization of Aging Mechanisms and State of Health for Second-Life 21700 Ternary Lithium-Ion Battery. J. Energy Storage 2022, 55, 105511. [Google Scholar] [CrossRef] [Scilit]
- Li, Y.; Jiang, L.; Zhang, N.; Wei, Z.; Mei, W.; Duan, Q.; Sun, J.; Wang, Q. Early Warning Method for Thermal Runaway of Lithium-Ion Batteries under Thermal Abuse Condition Based on Online Electrochemical Impedance Monitoring. J. Energy Chem. 2024, 92, 74–86. [Google Scholar] [CrossRef] [Scilit]

Disclaimer/Publisher’s Note: The statements, opinions and data contained in all publications are solely those of the individual author(s) and contributor(s) and not of MDPI and/or the editor(s). MDPI and/or the editor(s) disclaim responsibility for any injury to people or property resulting from any ideas, methods, instructions or products referred to in the content. |
© 2026 by the authors. Licensee MDPI, Basel, Switzerland. This article is an open access article distributed under the terms and conditions of the Creative Commons Attribution (CC BY) license.