


Abstract
Diffusion models for 3D genome structures make inference an ensemble-generation and tiling problem. In the released ChromoGen workflow, millions of independent denoising trajectories are executed through a single-GPU path, while overlapping genomic windows are sampled without enforcing consistency of their shared physical interval. We introduce ParaChromo, a parallel inference framework for conditioned, tiled 3D genome diffusion workloads built around the trained diffusion U-Net and distance-map interface. ParaChromo organizes the workload into three inference-layer modules: a workload-dispatch module schedules region, guidance, and sample chunks across worker groups; an encoder-aware sharded-conditioning module scales and shards the EPCOT front end with FSDP while keeping the inner-loop U-Net replicated; and a seam-coherent tiled-synchronization module projects the shared 12-bead overlap of adjacent reverse chains in distance-map space. On eight A6000 GPUs, the combined reduced-step and task-parallel systems path raises throughput from to samples/s, a -fold gain over the released single-GPU baseline. The reduced-step setting is supported by a sweep from 50 to 1000 DDIM steps, where distance-distribution and Hi-C-based metrics remain stable across four chromosomes. For the synchronization module, the chr22 seam discrepancy falls from 150.9 pm to 7.9 pm, while matched internal and Hi-C-based quality metrics are preserved. The synchronized chr22 run also gives a chromosome-scale coordinate rendering over 32 paper-aligned tiles. Together, these results show that conditioned, tiled 3D genome diffusion can be executed as a scalable workload when throughput parallelism, sampler length, encoder placement, and spatial consistency are treated as separate but compatible constraints.
1. Introduction
Diffusion models are now used to sample three-dimensional scientific structures, not only images. Recent models generate point clouds [1,2], synthesize 3D objects [3], design protein structures [4], predict biomolecular structures [5], and sample chromatin conformations [6]. In these settings, the target is often an ensemble whose statistics are compared with experiments. Inference systems must therefore run many stochastic trajectories per condition, preserve the distribution learned by the scientific model, and keep geometric outputs consistent when the object is represented by overlapping local windows.
Existing acceleration paths cover only part of this regime. Sampler methods reduce the number of denoising steps [7,8]. Distributed training and model-parallel systems partition large neural networks through pipeline parallelism [9,10] or tensor/model parallelism [11]. These tools address sampler length or parameter placement, but they do not by themselves define a chromosome-scale inference framework that keeps task-parallel ensemble sampling, scalable conditioning, and physical consistency as separate, auditable constraints. In 3D genome diffusion, the tiling issue is concrete: a long chromosome cannot be generated in one local model call, so the model is invoked on overlapping regions. If those regions are sampled independently, the same physical interval can receive different geometry in two neighboring outputs. MultiDiffusion and SyncDiffusion showed that synchronized tiled diffusion can improve coherence in image generation [12,13]; distance-map-based genome generators require the analogous constraint to act on physical pairwise distances.
ChromoGen [6] makes these systems-level and spatial-consistency issues concrete. It maps DNA sequence and cell-type-specific chromatin accessibility to an EPCOT [14] conditioning embedding, denoises a folded distance map with a conditional U-Net, and recovers a 64-bead point cloud for each 1.28 Mb genomic region. Its paper-aligned genome-wide protocol evaluates 2658 regions, two cell types, two classifier-free guidance settings [15], and up to 1000 stochastic samples per condition. The released implementation reaches conformations/s on our single-A6000 benchmark, which implies approximately days for one cell type at full scale. Peak allocation is only GiB on a 48 GiB GPU, so the first limitation is workload organization rather than memory capacity: the outer loop exposes millions of independent denoising trajectories, but the released workflow executes them through a largely single-GPU path. The second limitation is tiled spatial consistency: the official 1.28 Mb tiling creates 12-bead overlaps that describe the same physical monomer pairs, but adjacent windows are sampled independently and no sampling-time constraint enforces agreement between their shared distance-map subblocks. The conditioning encoder adds a third placement issue, because it is separable from the repeatedly invoked denoising U-Net and is likely to grow as genomic foundation models mature, as illustrated by Enformer [16], Borzoi [17], and Nucleotide Transformer models [18].
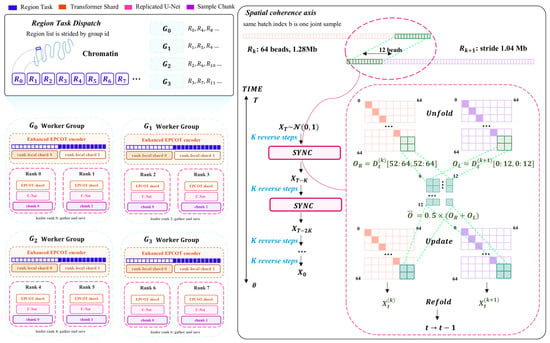
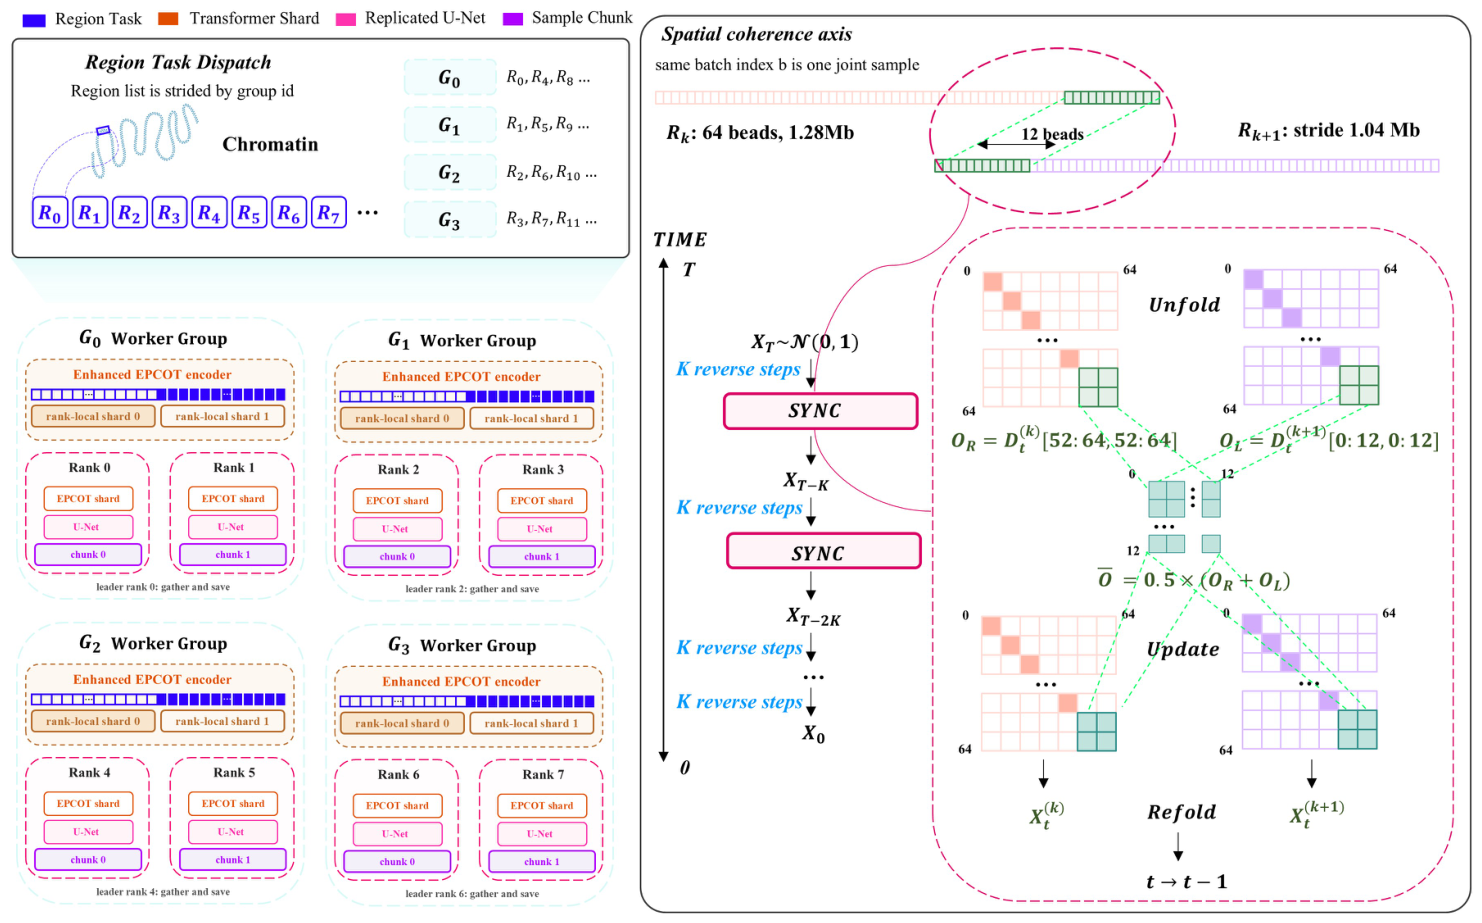
We present ParaChromo, a parallel inference framework for conditioned, tiled 3D genome diffusion workloads, evaluated here with ChromoGen as a published base model (Figure 1). The contribution is a systems formulation and implementation around the trained denoiser interface rather than a new diffusion backbone or biological representation. At the framework level, ParaChromo formulates conditioned, tiled 3D genome diffusion inference as a workload with three co-existing structures: stochastic task multiplicity, a separable genomic-conditioning path, and tiled physical overlap. At the module level, ParaChromo implements this formulation through three inference-layer modules. The workload-dispatch module turns the region, guidance, and sample dimensions into an explicit worker-group schedule. The encoder-aware sharded-conditioning module scales the EPCOT conditioning front end from M to M parameters and shards the enlarged Transformer modules with FullyShardedDataParallel while keeping the diffusion U-Net replicated. The seam-coherent tiled-synchronization module adds a lightweight overlap-consistency projection to the reverse-diffusion chain. The projection averages the two distance subblocks that represent the same genomic overlap and writes the result back to both regions within the trained denoiser’s distance-map interface. At the evidence level, the modules are evaluated with different endpoints rather than collapsed into one speedup claim: throughput and memory for workload dispatch and encoder-aware sharding, and seam coherence with quality preservation for tiled synchronization.
Figure 1.
ParaChromo framework. The framework contains three inference-layer modules for conditioned, tiled 3D genome diffusion: workload dispatch assigns region, guidance, and sample-chunk tasks to worker groups; encoder-aware sharded conditioning shards the enhanced EPCOT front end within each group while keeping the U-Net replicated; and seam-coherent tiled synchronization projects adjacent distance maps onto their shared overlap during reverse diffusion.
On eight A6000 GPUs, the combined reduced-step and task-parallel systems path raises throughput from to samples/s, a gain over the released single-GPU baseline. Under the same enhanced-front-end, 50-step DDIM setting, task-DP alone scales from to samples/s from one to eight GPUs. The reduced-step sweep shows stable distance-distribution and Hi-C-based metrics across on chr1, chr6, chr22, and the training-excluded chrX. The seam-coherent synchronization module reduces mean chr22 seam discrepancy from to pm, preserves contact-probability correlation with experimental GM12878 Hi-C, and produces a chromosome-scale coordinate rendering of all 32 paper-aligned chr22 tiles, spanning Mb with 1676 unique 20 kb monomers. These module-specific results show that conditioned, tiled 3D genome diffusion can be organized as a scalable inference workload.
2. Related Work
2.1. Diffusion Inference for Scientific 3D Outputs
Diffusion models generate samples by iteratively reversing a noising process [19,20]. This iterative structure is central to sample quality, but it makes inference expensive when the scientific target is an ensemble rather than one output. U-Net denoisers remain a common backbone for image-like diffusion states [21,22]. Transformer denoisers further show that generative backbones can scale with model size [23]. For ChromoGen, the denoising state is a folded distance map, and the generated coordinates are evaluated through structural statistics rather than visual plausibility [6].
The move from 2D images to 3D and scientific domains has broadened what diffusion inference must preserve. Prior work has generated point clouds [1,2] and 3D assets [3], and scientific diffusion systems now generate protein or biomolecular structures with geometric constraints [4,5]. In such settings, faster sampling is useful only if the generated distribution remains usable for downstream measurement. DDIM and ODE-based samplers reduce the number of reverse steps [7,8]. The resulting samples still need to be checked against the scientific statistics of interest. Accordingly, our evaluation tracks distance distributions, contact-probability maps, and Hi-C correlations rather than throughput alone.
2.2. Sequence-Conditioned 3D Genome Modeling
Sequence-based models have made it possible to predict aspects of 3D genome organization from DNA sequence. Akita [24], DeepC [25], and Orca [26] learn sequence-to-contact-map relationships across genomic scales. These models established the value of sequence context for genome folding, but they mainly target deterministic or population-level contact maps. Single-cell measurements, including Dip-C [27] and super-resolution chromatin tracing [28], reveal substantial cell-to-cell variability in chromatin structure. This variability motivates generative models that sample conformational ensembles.
EPCOT learns sequence and chromatin-accessibility embeddings for epigenomic and chromatin-organization prediction tasks [14]. ChromoGen uses EPCOT embeddings to condition a diffusion model for single-cell chromatin conformations [6]. This changes the computational unit from one prediction per genomic interval to many stochastic conformations per interval, guidance setting, and cell type. It also preserves the standard tiling structure of genome-wide prediction: each model call covers a local region, while chromosome-scale output is assembled from overlapping regions. ParaChromo uses these two properties to define the systems workload.
2.3. Parallelism for Ensemble Inference and Encoder Scaling
Diffusion workloads expose several kinds of parallelism. Independent requests can be distributed across devices, denoising steps can be reduced by sampler design, and large modules can be partitioned by model-parallel or sharding techniques. Tensor parallelism has been used in large Transformer systems [11], pipeline parallelism underlies GPipe and PipeDream [9,10], and ZeRO/FSDP-style sharding reduces replicated parameter memory [29,30]. ParaChromo uses these tools in an inference setting where the independent task graph is explicit: region, guidance, and sample chunks can be scheduled without communication during denoising, while the conditioning encoder can be sharded within a worker group.
The encoder side is likely to matter more as genomic conditioning models grow. Enformer [16], Borzoi [17], and the Nucleotide Transformer family [18] show the scale now used for sequence-to-function modeling. ESM-2 shows the same trend in protein modeling [31]. The released ChromoGen encoder is much smaller than its diffusion U-Net, but this balance is not fixed. The enhanced EPCOT front end used here provides a controlled setting for studying the memory and throughput consequences of a larger conditioning encoder while keeping the distance-map denoiser and output interface intact.
2.4. Synchronized Tiled Generation
Tiling creates a different problem from throughput. If adjacent windows are generated independently, each window can be locally valid while their overlap disagrees. MultiDiffusion averages diffusion paths across overlapping image windows, and SyncDiffusion synchronizes tiled generations through a shared objective [12,13]. These methods motivate synchronization as a sampling-time operation for tiled outputs.
Chromatin distance maps provide a more structured overlap. Adjacent 1.28 Mb ChromoGen regions share 12 beads, so both regions contain a distance subblock for the same physical monomer pairs. ParaChromo applies the tiled-diffusion idea directly to those subblocks during the reverse chain. The projection acts before coordinate recovery and enforces agreement in distance-map space, where ChromoGen performs denoising.
3. Workload Formulation
3.1. ChromoGen Inference Unit
Let denote a genomic region, a cell type specified by its DNase-seq accessibility track, and a classifier-free guidance setting [15]. ChromoGen [6] maps to a conditioning embedding with an EPCOT [14] front end. A conditional U-Net then denoises a folded distance-map state for reverse DDPM steps. The final state is unfolded into a symmetric distance map and converted to a point cloud by distance-geometry initialization followed by coordinate refinement.
3.2. Genome-Wide Task Graph
The native inference unit is local. One model call covers a Mb genomic interval represented by 64 beads at 20 kb resolution. The official paper-aligned genome-wide protocol contains regions, cell types, guidance settings, and S stochastic samples per condition. At , this corresponds to approximately generated structures. The scale arises from a Cartesian product of requests rather than from one dense chromosome-level tensor.
The tiling also has spatial structure. Adjacent regions are placed with a stride of approximately Mb, so neighboring Mb windows share 240 kb, or beads. Each adjacent pair contains two distance subblocks for the same physical overlap: the lower-right block of the left region and the upper-left block of the right region. The released sampler treats the two windows as independent requests even though they describe the same monomer pairs in the overlap.
3.3. Framework-Level Workload Structure
At the framework level, this formulation exposes three co-existing workload structures that ParaChromo instantiates in Section 4. The first is task multiplicity. For fixed , stochastic samples differ only through their initial noise. Across regions, cell types, and guidance settings, the released reverse chain has no inter-task communication. The outer task graph is therefore embarrassingly parallel from a systems perspective, even though adjacent genomic windows share a physical overlap.
The second is the separation between conditioning and denoising. The EPCOT front end computes one region- and cell-type-specific embedding, while the diffusion U-Net consumes that embedding across many samples and reverse steps. This separation lets the conditioning front end grow, be cached, or be sharded without changing the U-Net interface. It also makes the bottleneck depend on both model scale and sampler length: a small encoder is hidden by a long denoising chain, whereas a larger encoder or a shorter sampler makes the conditioning path visible.
The third is tiled spatial redundancy. A valid chromosome-scale interpretation assigns one distance submatrix to each shared 12-bead overlap. This consistency requirement is created by applying a local sampler to a long genomic object. In the released workflow, neighboring reverse chains are sampled independently, so overlap agreement for tiled chromosome-scale output must be introduced at sampling time.
These three structures define the framework abstraction used by ParaChromo and set up the module mapping: task multiplicity maps to the workload-dispatch module, conditioning–denoising separation maps to the encoder-aware sharded-conditioning module, and tiled spatial redundancy maps to the seam-coherent tiled-synchronization module. The next section instantiates this mapping while keeping the trained denoiser, distance-map state, and coordinate-recovery interface fixed.
4. ParaChromo Framework
ParaChromo operates at the inference layer around the released ChromoGen generator. The released diffusion U-Net, folded distance-map state, distance-map interface, and coordinate-recovery procedure define the base inference interface. The framework is described through three levels. The framework level defines the workload structures introduced in Section 3: conditioned, tiled 3D genome diffusion combines task multiplicity, separable conditioning, and overlap consistency. The module level implements these structures around the fixed denoiser interface. The workload-dispatch module schedules the outer task graph over worker groups. The encoder-aware sharded-conditioning module shards the enlarged conditioning encoder within a worker group when needed while leaving the denoising U-Net replicated. The seam-coherent tiled-synchronization module synchronizes adjacent tiled regions in distance-map space during reverse diffusion. The evidence level is reported separately in the Results: the parallel execution modules are evaluated by throughput and memory, whereas the synchronization module is evaluated by seam discrepancy and preservation of matched quality metrics.
4.1. Workload Dispatch Module
We define one inference task in Equation (1) as
where , , and are as defined in Section 3, and is a contiguous stochastic-sample chunk. The full queue is the Cartesian product, split so that each chunk fits the per-rank GPU memory budget (a per-rank chunk size of 64 samples in our runs). Given M worker groups, task is assigned by striding over the queue, . This assignment is sufficient because tasks do not communicate during denoising once their conditional embeddings have been computed.
The atomic unit is a region task rather than an individual sample. Samples for the same share a single EPCOT embedding, so a worker group computes this tensor once and reuses it across sample chunks and guidance settings. Each group writes its generated distance maps independently, and total throughput is the sum of completed-task rates across groups. The DDIM step count is an independent sampler parameter. Reducing the number of reverse steps shortens the inner loop for every task without changing the task queue or the encoder-sharding boundary.
4.2. Encoder-Aware Sharded Conditioning Module
ChromoGen factorizes generation into a conditioning encoder and a diffusion denoiser. The released EPCOT front end contains M parameters, whereas the diffusion U-Net contains M. ParaChromo keeps the U-Net fixed and scales only the conditioning side, preserving the original input tensor and the embedding consumed by the denoiser. The enhanced front end deepens the local Transformer stack and downstream trunk while retaining the same external contract (Table 1). It contains M parameters, an increase over the released front end.
Table 1.
Released and enhanced EPCOT front-end configurations.
The enhanced encoder serves as a systems-capacity setting. Its role is to expose the module boundary at which encoder-side sharding becomes relevant while keeping the denoiser and output semantics unchanged. The enhanced front end was initialized from an enlarged EPCOT pretraining checkpoint, trained through the GM12878 downstream Hi-C path, and then kept fixed during ParaChromo inference. The released ChromoGen diffusion generator was also kept fixed, and no model weights are updated during inference benchmarking. Quality measurements in this setting check compatibility and stability under the larger conditioning path.
Inside a worker group, ParaChromo wraps the two Transformer-heavy components of the enhanced front end with FullyShardedDataParallel under a full-shard policy [29,30]. These components are the local Transformer encoder–decoder of the EPCOT pretraining module and the downstream Transformer trunk. Together they account for M of the M front-end parameters, or approximately . FSDP partitions these parameters across ranks while the module is idle, gathers them for the forward pass, and releases the gathered copy afterward.
The remaining M front-end parameters are replicated, including the CNN backbone, attention-pooling block, and projection layers. The diffusion U-Net is also replicated. This boundary is intentional: the U-Net is invoked at every reverse-diffusion step, so sharding it would introduce an all-gather into the inner sampling loop. By restricting FSDP to the conditioning path, ParaChromo separates the memory benefit of encoder sharding from the high-frequency denoising computation.
4.3. Seam-Coherent Tiled Synchronization Module
4.3.1. Cross-Region Inconsistency in the Released Framework
Section 3 defines the overlap created by the paper-aligned tiling. For adjacent regions and , physical consistency requires the two distance maps to agree on the shared monomer pairs, as expressed in Equation (2):
The released sampler has no operator that enforces this equality. Each region starts from independent Gaussian noise and follows an independent reverse-diffusion chain, so the two overlapping subblocks can disagree before coordinate recovery. This is the local form of the chromosome-extension problem noted in the ChromoGen discussion, where the original authors proposed conditioning future generation on already established coordinates [6].
ParaChromo enforces this constraint directly in distance-map space. The mechanism is a structural counterpart to MultiDiffusion [12] and SyncDiffusion [13]; here, the synchronized object is the distance subblock that two neighboring ChromoGen regions assign to the same genomic overlap.
4.3.2. Overlap-Consistency Projection
Let be a sequence of N paper-aligned regions on a single chromosome with overlapping beads between and . For each region we maintain a folded reverse-diffusion state , where B is the per-region stochastic sample count. The same batch index b across all regions is interpreted as one joint tiled sample, so the projection couples corresponding stochastic trajectories rather than averaging independent ensemble members. At every reverse step t, each is updated independently by the standard ChromoGen p-sample operator. Let be a synchronization interval. Every K steps, we apply an overlap-consistency projection.
- Unfold. The folded state is mapped through the inverse origami transform [6] to its symmetric distance-map representation .
- Average overlapping subblocks. For every adjacent pair , we extract the right-overlap subblock from and the corresponding left-overlap subblock from . Both subblocks describe the same pairwise distance matrix in physical units. We replace each in-place by their elementwise mean,Because the projected subblocks are themselves symmetric averages of two symmetric matrices and overwrite a symmetric subregion of the distance map, the symmetry of the full map is preserved.
- Refold. Each updated is mapped back through the origami transform to recover the folded state on which the next K reverse-diffusion steps operate.
The full procedure is summarized in Algorithm 1. At each seam, the projection writes one subblock in each adjacent region map, corresponding to of each map. ParaChromo uses the standard denoiser , cosine- schedule, classifier-free guidance mechanism, and coordinate-recovery procedure, and inserts periodic in-place averaging at the 12-bead overlap during sampling.
The projection is deliberately local: it enforces consistency only on distance entries for monomer pairs that lie fully inside the 12-bead overlap. The synchronization module outputs a seam-coherent set of tiled distance maps, while longer-range cross-tile distances and global coordinate relaxation remain outside this local projection. Coordinate visualizations in Section 5.5 are obtained by applying the standard ChromoGen coordinate-recovery procedure to each tile and, when desired, rigidly aligning adjacent tiles at the overlap.
| Algorithm 1 Overlap-consistency projection over N paper-aligned regions. |
|
5. Results
We report the evidence according to the framework hierarchy rather than as one undifferentiated speedup number. The systems experiments evaluate the workload-dispatch and encoder-aware sharded-conditioning modules under matched sampler settings. The reduced-step sweep evaluates the sampler setting used by the throughput path. The synchronization experiments evaluate the seam-coherent tiled-synchronization module with the released ChromoGen checkpoint so that seam reduction can be compared directly with matched vanilla outputs.
5.1. Setup
Shared protocol.
Unless stated otherwise, all experiments use the released ChromoGen diffusion checkpoint, GM12878 DNase-seq conditioning, classifier-free guidance , and the official paper-aligned region tiling defined in Section 3. Runs are executed on one node with eight NVIDIA RTX A6000 GPUs (48 GiB each); multi-GPU runs use PyTorch 2.5.0 (CUDA 12.4) torchrun. The default per-region sample budget and per-rank chunk size are both 64.
5.1.1. Throughput and Encoder-Scaling Setup
Section 5.2, Section 5.3, Section 5.4, Section 5.4.1, Section 5.4.2 and Section 5.4.3 use a fixed 8 region benchmark: chr1:8.68 Mb, chr1:29.02 Mb, chr22:26.26 Mb, chr6:6.00 Mb, chr6:131.86 Mb, chr21:28.50 Mb, chr2:50.00 Mb, and chr12:35.00 Mb. End-to-end throughput uses 128 samples per region; memory and quality probes use the default 64. We compare the released and enhanced EPCOT front ends from Table 1, with the diffusion U-Net unchanged. The DDIM step count is set per experiment: for the released single-GPU reference and for the multi-GPU enhanced-encoder runs unless a step sweep is being reported.
The core throughput, stage-decomposition, and matched FSDP timing benchmarks are repeated over three base seeds, 0, 1, and 2, and reported as mean ± s.d. For a single-GPU run, the random seed is the base seed; for a distributed run, rank r uses base seed . Timing benchmarks return distance maps in memory and omit per-sample file-writing overhead.
5.1.2. Spatial-Coherence Setup
Section 5.5, Section 5.6 and Section 5.7 use the released EPCOT front-end and the original DDPM sampler. This matches the official saved Zenodo conformations used as the spatial-quality reference and isolates the effect of the overlap projection. ParaChromo sync uses by default; this empirical default is evaluated in the synchronization-frequency sweep in Section 5.7. Matched comparisons share checkpoint, guidance, sample count, and random-seed schedule; vanilla independent runs the released sampler separately on each tile, while ParaChromo sync applies Algorithm 1 jointly to a contiguous tile block.
5.2. Single-GPU Characterization
We first profile the released ChromoGen pipeline under the systems setup above. At DDPM steps, end-to-end inference reaches samples/s. DDPM denoising accounts for of wall time, while EPCOT embedding accounts for . Peak allocated memory is GiB and peak reserved memory is GiB. Extrapolating this rate to one cell type in the protocol from Section 3, with 2658 regions, two guidance settings, and stochastic samples, gives an estimated runtime of days. Section 5.3, Section 5.4, Section 5.4.1, Section 5.4.2 and Section 5.4.3 report speedups against this reference point.
5.3. Multi-GPU Scaling with Task Dispatch and Encoder Sharding
The workload-dispatch module treats each as an independent inference job once its embedding is available, while the encoder-aware module shards the enhanced front-end within a worker group. We separate the two by sweeping two configurations: a task-DP only curve at group_size over GPUs, and a task-DP × FSDP hybrid curve at group_size over GPUs.
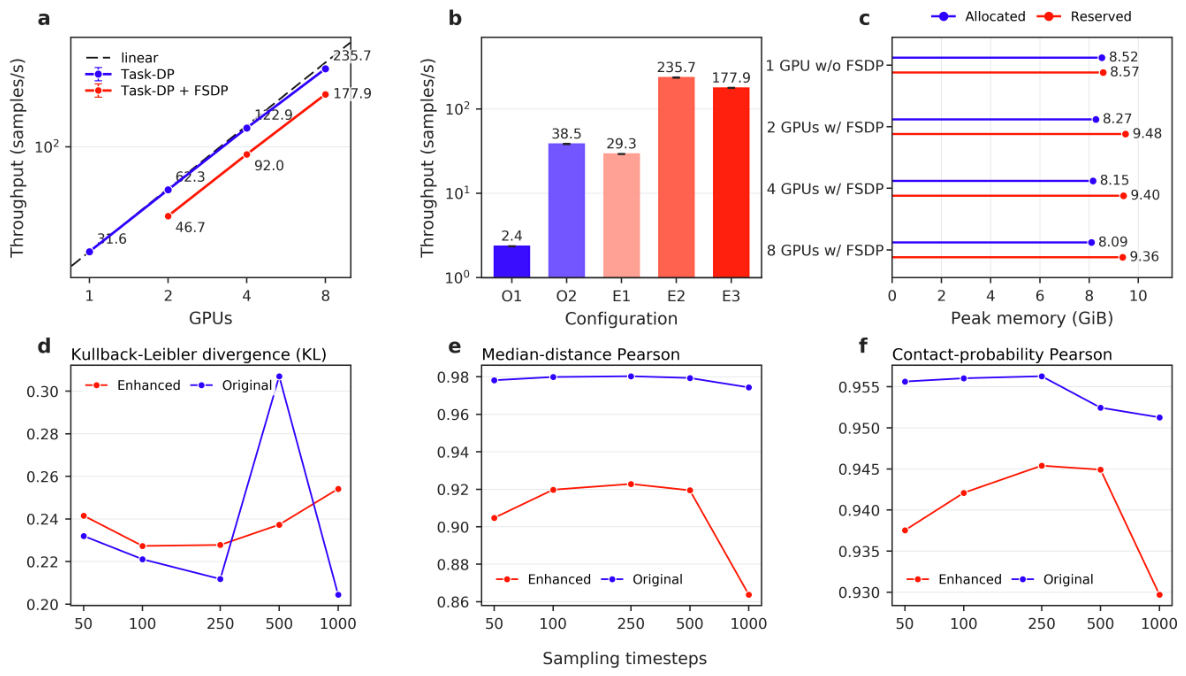
End-to-end throughput on the task-DP-only curve scales near-linearly with the number of workers, from samples/s at one GPU to samples/s at eight GPUs (, Figure 2a, Table 2). The approximately deviation from ideal linear scaling is consistent with per-region data-load overhead, which is weakly amortized when each region is processed by a single rank. The hybrid curve (group_size) is uniformly below the task-DP-only curve at the same world size: samples/s for GPUs. At eight GPUs, this is of task-DP-only throughput. The gap reflects the all-gather communication overhead introduced by FSDP inside each worker group. In the present configuration, the enhanced EPCOT front end is small relative to the replicated U-Net, so this overhead is not offset by a proportional compute reduction. We report the hybrid path as a throughput–memory frontier and return to its role under larger conditioning encoders in Section 6.
Figure 2.
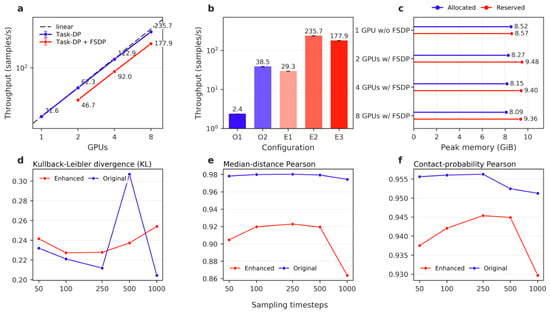
Systems and quality characterization. (a) Multi-GPU throughput. (b) Throughput decomposition relative to the released ChromoGen configuration. O1, released front end with 1000 denoising steps on one GPU; O2, released front end with 50 steps on one GPU; E1, enhanced front end with 50 steps on one GPU; E2, enhanced front end with 50 steps and 8 GPU Task-DP; E3, enhanced front end with 50 steps and 8 GPU hybrid Task-DP/FSDP. (c) Per-GPU peak memory (GiB). (d–f) Quality metrics across DDIM step counts on four chromosomes.
Table 2.
Multi-GPU throughput on the 8-region benchmark. Values are mean ± s.d. over three base seeds; speedup is relative to 1 GPU task-DP.
5.4. Speedup Decomposition
The single-GPU released baseline of Section 5.2 and the 8 GPU task-DP enhanced run of Section 5.3 differ by approximately two orders of magnitude. We attribute this gap by toggling one design choice at a time while holding the remaining configuration fixed (Figure 2b, Table 3).
Table 3.
Speedup decomposition on the 8-region benchmark. Values are mean ± s.d. over three base seeds; speedup is computed relative to the seed-matched released single-GPU baseline.
Reducing the sampler from to on the released encoder raises throughput from to samples/s (). This is the dominant gain because denoising accounts for nearly all baseline wall time. Replacing the released encoder with the enhanced front end at the same setting reduces single-GPU throughput from to samples/s, reflecting the larger conditioning cost. This 1 GPU enhanced-front-end row defines the systems-capacity setting used before parallelization. Adding 8 GPU task parallelism on top of this configuration raises throughput to samples/s, or over the released baseline for the cumulative reduced-step, enhanced-front-end, and task-parallel systems path. The isolated task-DP scaling factor under the fixed enhanced-front-end, 50-step setting is (Section 5.3). The hybrid task-DP × FSDP configuration reaches samples/s (), trading throughput for the memory behavior analyzed in Section 5.4.2.
As a matched wall-clock comparison for the hybrid path, the serial enhanced run completed the same 1024-sample request at samples/s, whereas the 8 GPU task-DP × FSDP run completed it at samples/s. This corresponds to end-to-end speedup and diffusion-stage speedup across the three base seeds. This makespan comparison uses request completion time, whereas Table 2 reports summed per-group throughput for the scaling curves.
5.4.1. Encoder–Denoiser Stage Cost
Table 4 records per-region wall time for the conditioning encoder and diffusion denoiser. With the released encoder at , encoding takes s and denoising takes s. With the enhanced encoder at , encoding rises to s while denoising falls to s, making the encoder of total wall time. The total reduction from to s is driven by sampler shortening. The enhanced encoder exposes an encoder-side memory and sharding regime while preserving the reduced-step quality behavior evaluated in Section 5.4.3.
Table 4.
Per-region stage cost. Values are mean ± s.d. over three base seeds; time columns are seconds, and Thr. denotes throughput in samples/s.
5.4.2. Memory–Throughput Frontier
We next measure the memory side of the task-DP × FSDP trade-off. With a single 64-sample chunk and the U-Net replicated, per-GPU peak allocated memory falls from GiB without FSDP to , , and GiB at group_size (Figure 2c). Reserved memory follows the same trend within GiB. The saving is modest at the present encoder size because only the two enlarged Transformer modules are sharded ( M of the M front-end parameters), while M front-end parameters and the M U-Net remain replicated. This measurement quantifies the current throughput–memory frontier: task-DP is faster when the encoder fits comfortably on each GPU, while FSDP becomes relevant as the conditioning front end grows.
5.4.3. Quality Preservation Across Reduced-Step Regimes
The speedup above is useful only if reduced-step sampling remains within the quality range needed for downstream analysis. We sweep DDIM steps over on both encoders, using four chromosomes (chr1, chr6, chr22, and the training-excluded chrX) at the validation regions of Section 5.6. Each step–chromosome pair uses 64 stochastic samples. We evaluate per-pair distance-distribution KL against the official saved Zenodo conformations [6], median-distance Pearson against the same reference, and contact-probability Pearson against experimental balanced GM12878 Hi-C [32].
Quality is stable across step settings on both encoders (Figure 2d–f). Per-pair KL lies in for the enhanced encoder and for the released encoder, with no monotone improvement at larger T. Median-distance Pearson is – on the enhanced encoder and – on the released encoder; contact-probability Pearson is – and –, respectively. The released encoder remains robust down to on all three metrics. The enhanced encoder gives lower Pearson correlations but comparable KL across T, including settings where its KL is lower than the released encoder (for example, vs. at ). We interpret the Pearson gap as a fit gap of the available enhanced-front-end weights, separate from the task-placement strategy evaluated above. The weak dependence on T for both encoders supports the throughput setting within the tracked distance-distribution and Hi-C-based metrics.
5.5. Whole-Chromosome Coherent Generation
We evaluate seam coherence on chromosome 22 using all 32 paper-aligned tiles in the released ChromoGen tiling, spanning Mb of the mappable interval. Following Section 5.1.2, the comparison is matched in checkpoint, guidance, sample count, and seed schedule. The only difference is whether adjacent reverse chains are synchronized by Algorithm 1.
For each of the 31 adjacent region pairs we evaluate the seam discrepancy as the mean absolute distance-map difference between the per-sample-mean overlap subblocks using Equation (6),
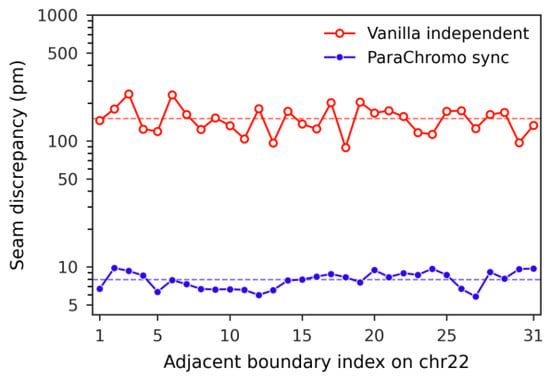
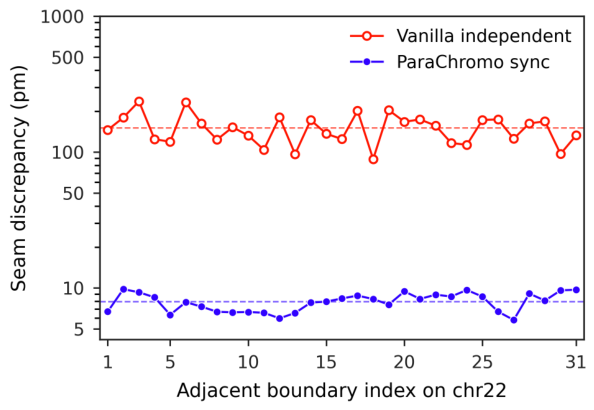
where is the elementwise mean of the 64 generated distance maps for region k, and the subblock indexing follows Section 4.3.2. The generated distance maps are represented in nanometers; because these overlap discrepancies are sub-nanometer quantities, we report them in picometers (). Across all 31 chr22 seams (Figure 3), ParaChromo sync attains a mean seam discrepancy of pm with standard deviation pm, compared with pm for the matched unsynchronized baseline. Every synchronized seam falls within – pm, indicating consistent reduction across the chr22 tiled run.
Figure 3.
chr22 seam discrepancy. Per-seam mean absolute overlap discrepancy for vanilla independent and ParaChromo sync across the 31 chr22 tile boundaries.
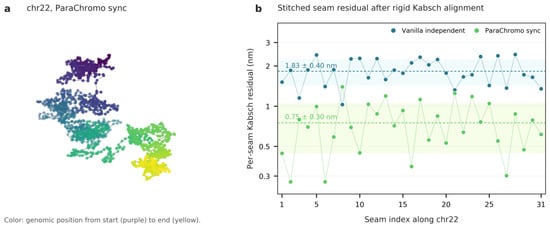
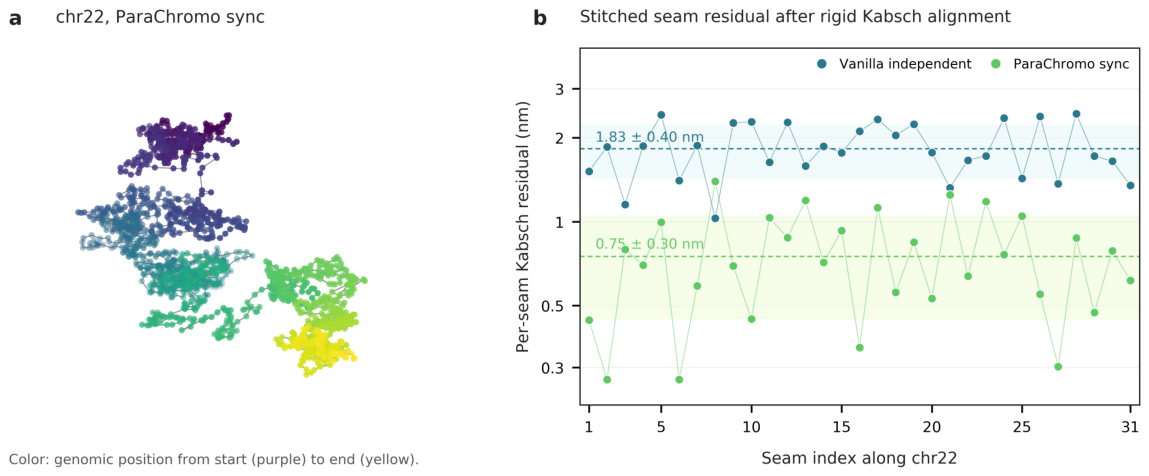
Figure 4a gives a coordinate rendering of the synchronized chr22 output as a 1676-monomer point-cloud chain. We reconstruct each per-region distance map with ChromoGen’s distance-geometry initializer and stitch adjacent regions by Kabsch alignment on the 12-bead overlap. The rendering uses one stochastic sample per region, because averaging distances across 64 samples would remove the per-sample seam structure that synchronization acts on.
Figure 4.
Chromosome 22 coordinate rendering. (a) Kabsch-stitched rendering of 32 ParaChromo-sync tiles. (b) Per-seam Kabsch residual after stitching (nm).
Figure 4b reports the Kabsch residual after stitching. The mean residual drops from nm under vanilla independent sampling to nm under ParaChromo sync (). Distance-map discrepancies are reported in pm, whereas this coordinate-space Kabsch residual is reported in nm. We use the Kabsch residual as a coordinate-level diagnostic because rigid alignment fixes an arbitrary frame and coordinate recovery has non-convex uncertainty. The primary synchronization measurement is the distance-map seam discrepancy in Figure 3.
The full chr22 synchronized run is small relative to the available device memory. Sweeping on one GPU, wall time increases from to min and peak allocated memory remains below GiB (Table 5). At the largest tested budget, the run produces seam-coherent conformations in under 15 min.
Table 5.
Whole-chromosome chr22 sync feasibility on one A6000 GPU. S denotes samples per region.
5.6. Quality Evaluation
We next quantify whether synchronization preserves the within-region distribution produced by ChromoGen. The evaluation has two parts: internal consistency against the released saved conformations, and external agreement with experimental GM12878 Hi-C. We use four chromosomes (chr1, chr6, chr22, and the training-excluded chrX), three paper-aligned regions per chromosome, and the middle region in each triplet.
5.6.1. Internal Consistency
We compute pairwise KL divergence between generated per-pair distance distributions and the official saved Zenodo conformations [6], and Pearson correlation between 64-sample median distance maps. Sync agrees with the official saved conformations at the same level as the matched independent baseline: the KL difference is at most , and median-distance Pearson is ≥0.967 for every comparison across the four chromosomes (Table 6).
Table 6.
Internal consistency across four chromosomes.
5.6.2. External Validation Against Experimental Hi-C
We compare generated contact-probability maps against experimental GM12878 Hi-C (GSE63525 in situ replicate-combined [32], processed to balanced 20 kb resolution). Each generated distance map is converted to contact probability using the ChromoGen Methods parameters , , and [6]. We average over 64 samples and compute Pearson correlation against the corresponding experimental Hi-C submatrix. We also report the Pearson correlation between the median generated distance map and .
The matched comparison is sync vs. vanilla on the same samples and seeds. Across all four chromosomes, contact-probability Pearson changes by at most in absolute units relative to the independent baseline, with a mean change of (Table 7). Median-distance Pearson against changes by on average. The same pattern holds on chromosome X, which is excluded from ChromoGen’s training set.
Table 7.
External consistency against experimental GM12878 Hi-C. = sync − vanilla.
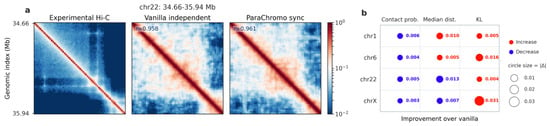
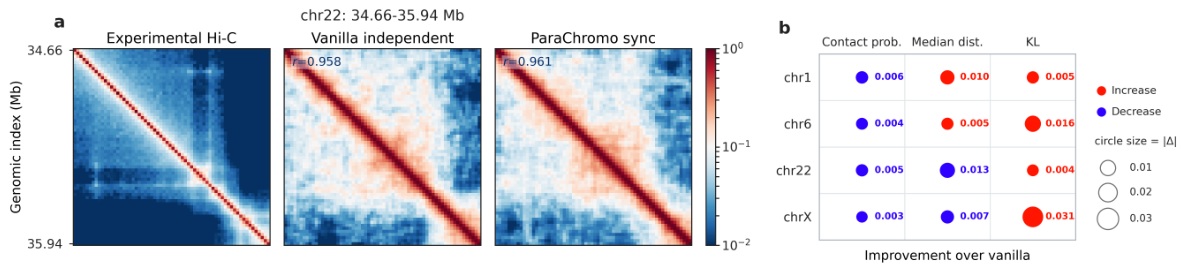
Figure 5 summarizes the same comparisons visually. Panel (a) shows that experimental Hi-C, vanilla independent, and ParaChromo sync have similar off-diagonal contact patterns on the representative chr22 region, with generated-map Pearson values of for vanilla and for sync. Panel (b) reports sync-minus-vanilla deltas across four chromosomes and three metrics. All 12 entries satisfy , and the largest absolute change is the chrX KL delta relative to the official saved conformations.
Figure 5.
Quality preservation. (a) Contact-probability heatmaps for a representative chr22 region. (b) Sync-minus-vanilla differences across four chromosomes and three quality metrics: contact probability (Contact prob.), median distance (Median dist.; Pearson against ), and Kullback–Leibler divergence (KL).
5.7. Synchronization-Frequency Ablation
The synchronization interval K controls how often the overlap projection is applied. Smaller K values correct the shared overlap more frequently, whereas larger K values allow adjacent reverse chains to evolve independently for longer between corrections. We treat K as an empirical synchronization-frequency parameter. We sweep on three paper-aligned regions of chromosome 1 with eight samples per region; all other parameters follow Section 5.1.2. Table 8 reports the mean overlap discrepancy, the relative drift of non-overlapping distance values from the independent baseline, and the wall-time ratio of sync to unsynchronized sampling.
Table 8.
Synchronization-frequency ablation on three chr1 regions. Drift is measured outside overlapping subblocks; wall ratio is sync/vanilla.
In the chr1 three-region sweep, seam discrepancy increases monotonically as synchronization becomes less frequent, from 11 pm at to 321 pm at , but remains below 60 pm for . Non-overlap drift stays within – across the sweep, indicating that changes remain concentrated around the synchronized subblocks. Wall-time ratios remain within measurement noise of the independent baseline. We use as the default because it lies within the low-discrepancy regime, reduces the number of projection operations by an order of magnitude relative to per-step synchronization, and gives a mean seam discrepancy of pm in the full chr22 run.
6. Discussion
6.1. Composing the Modules
The framework/module/evidence framing matters because each module has a distinct interface boundary, while the sampler setting is measured separately. Workload dispatch changes how region, guidance, and sample-chunk tasks are placed. Encoder-aware sharding changes where conditioning-encoder parameters are stored and gathered. The overlap projection changes only the shared distance entries after selected reverse steps. Reduced-step DDIM changes the length of the sampler, not the definition of the ParaChromo modules. These boundaries make the modules interface-compatible while preserving clear measurement targets. Throughput experiments use the enhanced encoder with DDIM, whereas spatial-coherence experiments use the released encoder with DDPM to match the official saved conformations used as a quality reference. The step sweep in Section 5.4.3 supports applying the projection in the enhanced-encoder setting, since quality remains stable over on both encoders. Thus, throughput scaling, reduced-step quality, and chromosome-scale synchronization are reported as separate measurements of interface-compatible modules and sampler settings rather than merged into a single undifferentiated claim.
6.2. Encoder Scaling
At the current enhanced front-end size, task-DP is the faster multi-GPU configuration. FSDP reduces peak allocated memory from to GiB at group_size, but lowers 8 GPU throughput from to samples/s. This is the measured cost of sharding a M-parameter conditioning front end while keeping the M U-Net replicated. The forward-looking value of the encoder-aware module is the scaling boundary: under the same sharding policy, memory saved by FSDP grows with the sharded front-end parameter count, while pure task-DP must replicate the full encoder on every device. As sequence-conditioning models move toward foundation-scale front ends, encoder sharding changes from a modest memory optimization to a fit constraint. Larger genomic encoders will require direct benchmarking, but the present measurements identify the parameter-placement regime in which encoder sharding becomes relevant.
6.3. Sampler and Quality
Most of the measured speedup comes from shortening the reverse chain from to . The current implementation keeps the U-Net architecture, noise schedule, and diffusion training objective fixed. More aggressive sampler changes, including step distillation [33] and higher-order solvers such as DPM-Solver [8], are compatible with the workload-dispatch and encoder-aware modules. The distance-distribution, contact-probability, and Hi-C metrics used here provide the relevant checks for such sampler changes, because ChromoGen’s utility is statistical and not visual.
6.4. Spatial Output Semantics
The overlap projection produces seam-coherent tiled distance maps by acting on the shared overlapping subblock. Chromosome-level distance matrices, distances between non-overlapping portions of adjacent tiles, and global Euclidean embeddings belong to a coordinate-level layer beyond this local projection. The chr22 rendering in Figure 4 is a coordinate-level diagnostic obtained by standard per-tile coordinate recovery followed by rigid alignment at overlaps. The preservation diagnostics in Appendix A extend the seam analysis to local distance-map statistics, including insulation profiles, within-window long-range contacts, and ensemble variability. A natural extension is global coordinate relaxation over all stitched tiles, building on the distance-map synchronization evaluated here.
7. Conclusions
We presented ParaChromo, a parallel inference framework for conditioned, tiled 3D genome diffusion workloads. The framework-level contribution is to formulate conditioned, tiled 3D genome diffusion inference as a workload with three co-existing structures: many stochastic region-level tasks, a separable genomic conditioning front end, and physically shared overlaps between local tiles. The module-level implementation addresses these structures through workload dispatch for region, guidance, and sample chunks; encoder-aware sharded conditioning for enlarged EPCOT front ends; and seam-coherent tiled synchronization for shared distance-map overlaps. The evidence is module-specific by design: systems modules are assessed by throughput and memory, whereas synchronization is assessed by seam coherence and quality preservation. On eight A6000 GPUs, the combined reduced-step and task-parallel systems path raises throughput from to samples/s (), while the reduced-step quality sweep remains stable across the tested chromosomes. On chromosome 22, the synchronization module reduces mean distance-map seam discrepancy from to pm and preserves matched internal and Hi-C-based quality metrics. Together, these results show that conditioned, tiled 3D genome diffusion can be executed as a scalable inference workload when throughput parallelism, sampler length, encoder placement, and spatial consistency are measured as separate but compatible constraints.
Author Contributions
X.S. and W.S. contributed equally to this work. X.S.: Conceptualization, methodology, software, validation, formal analysis, visualization, writing—original draft, writing—review and editing. M.Z.: Conceptualization, methodology, resources, supervision, project administration, writing—review and editing. W.S.: Methodology, validation, formal analysis, visualization, revised-draft preparation, writing—review and editing. Z.O.: Discussion, writing—review and editing. All authors have read and agreed to the published version of the manuscript.
Funding
This research received no external funding.
Institutional Review Board Statement
Not applicable.
Informed Consent Statement
Not applicable.
Data Availability Statement
This study used publicly available resources. The released ChromoGen source code is available at https://github.com/ZhangGroup-MITChemistry/ChromoGen (accessed on 17 June 2026). The ChromoGen model weights, saved conformations, embeddings, and associated archived data are available from Zenodo at https://doi.org/10.5281/zenodo.14218666 (accessed on 17 June 2026). The EPCOT codebase used by the ChromoGen conditioning front end is available at https://github.com/liu-bioinfo-lab/EPCOT (accessed on 17 June 2026). Experimental GM12878 Hi-C data were obtained from GEO accession GSE63525, https://www.ncbi.nlm.nih.gov/geo/query/acc.cgi?acc=GSE63525 (accessed on 17 June 2026). GM12878 DNase-seq conditioning used the ENCODE bigWig file ENCFF901GZH, https://www.encodeproject.org/files/ENCFF901GZH/ (accessed on 17 June 2026). The ParaChromo reproducibility package is available at https://anonymous.4open.science/r/ParaChromo-010F (accessed on 17 June 2026).
Conflicts of Interest
The authors declare no conflicts of interest.
Appendix A. Biological-Preservation Diagnostics for Synchronization
This appendix reports preservation diagnostics for the seam-coherent tiled-synchronization module. The analysis uses the released ChromoGen U-Net, training objective, distance-map representation, conditioning interface, and coordinate-recovery procedure, and quantifies local biological proxy statistics in the matched sync-vs.-vanilla outputs used in Section 5.6.
The diagnostics focus on local preservation within the Mb window produced by the base generator. We measured three local properties. First, as a TAD-like local-domain proxy, we computed a boundary-crossing insulation profile from each generated contact-probability map using a 10-bin window on each side, corresponding to 200 kb per side at 20 kb resolution. Second, for within-window long-range interactions, we evaluated contact-probability entries with genomic separation of at least 20 bins, corresponding to 400 kb. Third, for cell-to-cell variability, we computed per-entry variance maps across stochastic samples and mean sample-to-sample distance-map diversity in the non-overlapping beads 12–51. The directly averaged overlapping subblocks were excluded from the variability score.
All analyses used the released ChromoGen front end, the original DDPM sampler, matched vanilla independent and ParaChromo sync outputs, 64 generated samples per region, and the same four validation chromosomes as Section 5.6 (chr1, chr6, chr22, and chrX). Experimental comparisons used balanced GM12878 Hi-C at 20 kb resolution, after converting generated distance maps to contact-probability maps with the ChromoGen parameters , , and .
The results support a preservation interpretation (Table A1). Local insulation profiles remain highly similar between sync and vanilla outputs, with Pearson correlation . Agreement with Hi-C remains within the observed chromosome-level variation for both the insulation profile () and the within-window long-range contact profile (). The long-range sync-vs.-vanilla contact correlation is lower than the insulation-profile correlation (), indicating broad preservation without exact invariance. Outside the directly synchronized overlapping subblocks, the variance-map Pearson correlation remains , and sample-to-sample diversity remains of the vanilla independent baseline. Thus, the overlap projection substantially improves seam coherence while preserving the local biological proxy statistics evaluated here and modestly constraining stochastic variability in a manner consistent with the overlap constraint.
Table A1.
Targeted biological-preservation diagnostics for matched ParaChromo sync and vanilla independent outputs. Values are mean ± s.d. across chr1, chr6, chr22, and chrX.
To quantify uncertainty in the quality-preservation metrics reported in Section 5.6, we also computed bootstrap confidence intervals for the sync-minus-vanilla differences (Table A2). This analysis uses the same matched outputs as the manuscript tables. For the internal KL and median-distance Pearson metrics, bootstrap resampling was performed over the four chromosome-level matched evaluation units. For the Hi-C-based metrics, bootstrap resampling was performed over the 12 region-level matched comparisons whose chromosome-wise means are reported in Table 7. The intervals provide descriptive uncertainty estimates for the preservation analysis.
Table A2.
Bootstrap uncertainty for sync-minus-vanilla quality differences. Negative values indicate lower KL under synchronization; positive values indicate higher Pearson correlation.
Appendix B. EPCOT Input Data-Loading Profile
The systems design of ParaChromo was motivated by both model execution and the data path that feeds the EPCOT conditioning front end. The original DNA and DNase inputs were stored in sparse NPZ/Pickle form. During online loading, this representation required per-sample sparse slicing, CSR-to-dense conversion, upstream/downstream sequence padding, and multimodal feature concatenation. These CPU-bound operations could make data preparation slower than GPU computation, causing devices to wait between batches. We therefore moved the repeated sparse slicing and feature assembly to an offline preprocessing step and stored the processed tensors as dense NPY memory-mapped arrays. During training or profiling, the DataLoader then performs contiguous slicing and tensor conversion.
This appendix reports the data-loading measurements used to diagnose that bottleneck and documents the EPCOT-side input path used in the systems-capacity setting. These data-loading measurements are reproducibility diagnostics for the conditioning input path and are not included in the throughput speedups reported in the main systems benchmarks. The aggregate data-loading profile and read micro-benchmark are reported in Table A3 and Table A4, respectively.
Table A3.
EPCOT data-loading profile after replacing sparse NPZ/Pickle inputs with dense NPY memory-mapped arrays.
Table A4.
Read micro-benchmark for sparse NPZ/Pickle and dense NPY memory-mapped input representations.
References
- Luo, S.; Hu, W. Diffusion probabilistic models for 3d point cloud generation. In Proceedings of the IEEE/CVF Conference on Computer Vision and Pattern Recognition, Virtual, 19–25 June 2021; pp. 2837–2845. [Google Scholar]
- Nichol, A.; Jun, H.; Dhariwal, P.; Mishkin, P.; Chen, M. Point-e: A system for generating 3d point clouds from complex prompts. arXiv 2022, arXiv:2212.08751. [Google Scholar]
- Poole, B.; Jain, A.; Barron, J.T.; Mildenhall, B. DreamFusion: Text-to-3D using 2D Diffusion. In Proceedings of the Eleventh International Conference on Learning Representations, Kigali, Rwanda, 1–5 May 2023. [Google Scholar]
- Watson, J.L.; Juergens, D.; Bennett, N.R.; Trippe, B.L.; Yim, J.; Eisenach, H.E.; Ahern, W.; Borst, A.J.; Ragotte, R.J.; Milles, L.F.; et al. De novo design of protein structure and function with RFdiffusion. Nature 2023, 620, 1089–1100. [Google Scholar] [CrossRef] [Scilit] [PubMed]
- Abramson, J.; Adler, J.; Dunger, J.; Evans, R.; Green, T.; Pritzel, A.; Ronneberger, O.; Willmore, L.; Ballard, A.J.; Bambrick, J.; et al. Accurate structure prediction of biomolecular interactions with AlphaFold 3. Nature 2024, 630, 493–500. [Google Scholar] [CrossRef] [Scilit] [PubMed]
- Schuette, G.; Lao, Z.; Zhang, B. ChromoGen: Diffusion model predicts single-cell chromatin conformations. Sci. Adv. 2025, 11, eadr8265. [Google Scholar] [CrossRef] [Scilit] [PubMed]
- Song, J.; Meng, C.; Ermon, S. Denoising Diffusion Implicit Models. In Proceedings of the International Conference on Learning Representations, Virtual, 3–7 May 2021. [Google Scholar]
- Lu, C.; Zhou, Y.; Bao, F.; Chen, J.; Li, C.; Zhu, J. Dpm-solver: A fast ode solver for diffusion probabilistic model sampling in around 10 steps. Adv. Neural Inf. Process. Syst. 2022, 35, 5775–5787. [Google Scholar] [CrossRef] [Scilit]
- Huang, Y.; Cheng, Y.; Bapna, A.; Firat, O.; Chen, D.; Chen, M.; Lee, H.; Ngiam, J.; Le, Q.V.; Wu, Y.; et al. Gpipe: Efficient training of giant neural networks using pipeline parallelism. Adv. Neural Inf. Process. Syst. 2019, 32. [Google Scholar] [CrossRef] [Scilit]
- Narayanan, D.; Harlap, A.; Phanishayee, A.; Seshadri, V.; Devanur, N.R.; Ganger, G.R.; Gibbons, P.B.; Zaharia, M. PipeDream: Generalized pipeline parallelism for DNN training. In Proceedings of the 27th ACM Symposium on Operating Systems Principles, Huntsville, ON, Canada, 27–30 October 2019; pp. 1–15. [Google Scholar]
- Shoeybi, M.; Patwary, M.; Puri, R.; LeGresley, P.; Casper, J.; Catanzaro, B. Megatron-lm: Training multi-billion parameter language models using model parallelism. arXiv 2019, arXiv:1909.08053. [Google Scholar]
- Bar-Tal, O.; Yariv, L.; Lipman, Y.; Dekel, T. MultiDiffusion: Fusing diffusion paths for controlled image generation. In Proceedings of the 40th International Conference on Machine Learning, JMLR.org, ICML’23, Honolulu, HI, USA, 23–29 July 2023. [Google Scholar]
- Lee, Y.; Kim, K.; Kim, H.; Sung, M. Syncdiffusion: Coherent montage via synchronized joint diffusions. Adv. Neural Inf. Process. Syst. 2023, 36, 50648–50660. [Google Scholar] [CrossRef] [Scilit]
- Zhang, Z.; Feng, F.; Qiu, Y.; Liu, J. A generalizable framework to comprehensively predict epigenome, chromatin organization, and transcriptome. Nucleic Acids Res. 2023, 51, 5931–5947. [Google Scholar] [CrossRef] [Scilit] [PubMed]
- Ho, J.; Salimans, T. Classifier-free diffusion guidance. arXiv 2022, arXiv:2207.12598. [Google Scholar]
- Avsec, Ž.; Agarwal, V.; Visentin, D.; Ledsam, J.R.; Grabska-Barwinska, A.; Taylor, K.R.; Assael, Y.; Jumper, J.; Kohli, P.; Kelley, D.R. Effective gene expression prediction from sequence by integrating long-range interactions. Nat. Methods 2021, 18, 1196–1203. [Google Scholar] [CrossRef] [Scilit] [PubMed]
- Linder, J.; Srivastava, D.; Yuan, H.; Agarwal, V.; Kelley, D.R. Predicting RNA-seq coverage from DNA sequence as a unifying model of gene regulation. Nat. Genet. 2025, 57, 949–961. [Google Scholar] [CrossRef] [Scilit] [PubMed]
- Dalla-Torre, H.; Gonzalez, L.; Mendoza-Revilla, J.; Lopez Carranza, N.; Grzywaczewski, A.H.; Oteri, F.; Dallago, C.; Trop, E.; De Almeida, B.P.; Sirelkhatim, H.; et al. Nucleotide transformer: Building and evaluating robust foundation models for human genomics. Nat. Methods 2025, 22, 287–297. [Google Scholar] [CrossRef] [Scilit] [PubMed]
- Ho, J.; Jain, A.; Abbeel, P. Denoising diffusion probabilistic models. Adv. Neural Inf. Process. Syst. 2020, 33, 6840–6851. [Google Scholar]
- Song, Y.; Sohl-Dickstein, J.; Kingma, D.P.; Kumar, A.; Ermon, S.; Poole, B. Score-Based Generative Modeling through Stochastic Differential Equations. In Proceedings of the International Conference on Learning Representations, Virtual, 3–7 May 2021. [Google Scholar]
- Ronneberger, O.; Fischer, P.; Brox, T. U-net: Convolutional networks for biomedical image segmentation. In Proceedings of the International Conference on Medical Image Computing and Computer-Assisted Intervention; Springer: Cham, Switzerland, 2015; pp. 234–241. [Google Scholar]
- Rombach, R.; Blattmann, A.; Lorenz, D.; Esser, P.; Ommer, B. High-resolution image synthesis with latent diffusion models. In Proceedings of the IEEE/CVF Conference on Computer Vision and Pattern Recognition, New Orleans, LA, USA, 18–24 June 2022; pp. 10684–10695. [Google Scholar]
- Peebles, W.; Xie, S. Scalable diffusion models with transformers. In Proceedings of the IEEE/CVF International Conference on Computer Vision, Paris, France, 2–6 October 2023; pp. 4195–4205. [Google Scholar]
- Fudenberg, G.; Kelley, D.R.; Pollard, K.S. Predicting 3D genome folding from DNA sequence with Akita. Nat. Methods 2020, 17, 1111–1117. [Google Scholar] [CrossRef] [Scilit] [PubMed]
- Schwessinger, R.; Gosden, M.; Downes, D.; Brown, R.C.; Oudelaar, A.M.; Telenius, J.; Teh, Y.W.; Lunter, G.; Hughes, J.R. DeepC: Predicting 3D genome folding using megabase-scale transfer learning. Nat. Methods 2020, 17, 1118–1124. [Google Scholar] [CrossRef] [Scilit] [PubMed]
- Zhou, J. Sequence-based modeling of three-dimensional genome architecture from kilobase to chromosome scale. Nat. Genet. 2022, 54, 725–734. [Google Scholar] [CrossRef] [Scilit] [PubMed]
- Tan, L.; Xing, D.; Chang, C.H.; Li, H.; Xie, X.S. Three-dimensional genome structures of single diploid human cells. Science 2018, 361, 924–928. [Google Scholar] [CrossRef] [Scilit] [PubMed]
- Bintu, B.; Mateo, L.J.; Su, J.H.; Sinnott-Armstrong, N.A.; Parker, M.; Kinrot, S.; Yamaya, K.; Boettiger, A.N.; Zhuang, X. Super-resolution chromatin tracing reveals domains and cooperative interactions in single cells. Science 2018, 362, eaau1783. [Google Scholar] [CrossRef] [Scilit] [PubMed]
- Rajbhandari, S.; Rasley, J.; Ruwase, O.; He, Y. Zero: Memory optimizations toward training trillion parameter models. In Proceedings of the SC20: International Conference for High Performance Computing, Networking, Storage and Analysis; IEEE: Piscataway, NJ, USA, 2020; pp. 1–16. [Google Scholar]
- Zhao, Y.; Gu, A.; Varma, R.; Luo, L.; Huang, C.C.; Xu, M.; Wright, L.; Shojanazeri, H.; Ott, M.; Shleifer, S.; et al. PyTorch FSDP: Experiences on Scaling Fully Sharded Data Parallel. Proc. VLDB Endow. 2023, 16, 3848–3860. [Google Scholar] [CrossRef] [Scilit]
- Lin, Z.; Akin, H.; Rao, R.; Hie, B.; Zhu, Z.; Lu, W.; Smetanin, N.; Verkuil, R.; Kabeli, O.; Shmueli, Y.; et al. Evolutionary-scale prediction of atomic-level protein structure with a language model. Science 2023, 379, 1123–1130. [Google Scholar] [CrossRef] [Scilit] [PubMed]
- Rao, S.S.; Huntley, M.H.; Durand, N.C.; Stamenova, E.K.; Bochkov, I.D.; Robinson, J.T.; Sanborn, A.L.; Machol, I.; Omer, A.D.; Lander, E.S.; et al. A 3D map of the human genome at kilobase resolution reveals principles of chromatin looping. Cell 2014, 159, 1665–1680. [Google Scholar] [CrossRef] [Scilit] [PubMed]
- Salimans, T.; Ho, J. Progressive Distillation for Fast Sampling of Diffusion Models. In Proceedings of the International Conference on Learning Representations, Virtual Event, 25–29 April 2022. [Google Scholar]

Disclaimer/Publisher’s Note: The statements, opinions and data contained in all publications are solely those of the individual author(s) and contributor(s) and not of MDPI and/or the editor(s). MDPI and/or the editor(s) disclaim responsibility for any injury to people or property resulting from any ideas, methods, instructions or products referred to in the content. |
© 2026 by the authors. Licensee MDPI, Basel, Switzerland. This article is an open access article distributed under the terms and conditions of the Creative Commons Attribution (CC BY) license.