


Abstract
The safe management of flammable and explosive objects is critical for preventing industrial accidents. However, there is currently no publicly available dataset dedicated to their automated detection. To address this gap, we present EF-Data as the primary contribution of this work—the first publicly available benchmark dataset dedicated to single-class flammable and explosive object detection, comprising 7102 images and 19,233 annotated instances across diverse industrial, commercial, and residential environments. To demonstrate the utility of EF-Data, we further propose an improved YOLOv11-based detection model incorporating the Convolutional Block Attention Module (CBAM) as a strong baseline for future research. Experimental comparisons with six state-of-the-art models demonstrate that our improved model achieves the highest mAP@0.5, yielding an absolute increase of 1.5 percentage points (from 0.885 to 0.900) over the original model, while experiencing only a marginal inference speed reduction from 191.62 to 189.43 FPS (a relative reduction of approximately 1.1%). This work contributes a dedicated benchmark and baseline model to support future research on automated flammable and explosive object detection.
1. Introduction
Chemical raw materials play a crucial role in daily life, industrial manufacturing, and technological advancements. In recent years, China’s chemical manufacturing industry has experienced significant growth, making it a global leader in chemical production [1]. However, some chemical substances possess explosive and flammable properties. If such hazardous materials catch fire or explode, these major chemical accidents can have severe adverse impacts on human well-being and surrounding ecosystems [2,3,4]. Industrial accidents of this type highlight the critical need for timely detection and monitoring of flammable and explosive objects, motivating the development of computer vision-based automated detection methods [5,6].
The safe management and maintenance of hazardous chemicals constitute a key component in safeguarding urban public safety [7]. Among them, flammable and explosive substances, as a special category of chemical materials, are widely distributed across various urban areas. Common examples include liquefied gas and gasoline frequently found in chemical enterprises and residential communities, with instances of illegal storage also reported. Ensuring the safe handling and management of such flammable and explosive objects is therefore of critical importance. However, while extensive research has been conducted on traffic sign detection [8,9,10], studies focusing on safety sign detection remain limited [11,12], and research specifically targeting the detection of flammable and explosive objects is even more scarce. This discrepancy stands in stark contrast to the widespread presence and significant risks associated with such materials, underscoring the urgency and necessity of advancing research in this domain. Specifically, we formally define our research task as the single-class object detection of these visible targets across diverse industrial, commercial, and residential environments.
To address the lack of high-quality datasets in the field of flammable and explosive object detection, we have constructed the Flammable and Explosive Object Detection Dataset (EF-Data), which serves as a unified benchmark for evaluating related detection algorithms. EF-Data consists of images collected from the internet, covering various industrial, commercial, and residential environments, thus effectively reflecting the distribution characteristics of flammable and explosive objects in real-world scenarios. The dataset includes objects with various shapes, sizes, and packaging forms, and takes into account factors such as occlusion, lighting variations, and complex backgrounds, ensuring its completeness, complexity, and diversity.
In this work, EF-Data represents the primary contribution; the proposed YOLOv11-CBAM model is developed as a reference baseline to demonstrate the dataset’s practical utility. The specific contributions are as follows:
- First, we created an open dataset containing 7102 images of flammable and explosive objects, captured from both domestic and international sources. These images were taken from different angles, distances, lighting conditions, and various scenes.
- Second, we compared the performance of several deep learning models on this dataset, including DETR [13], YOLOv5 [14], YOLOv6 [15], YOLOv8 [16], YOLOv10 [17], and YOLOv11 [18]. The results of these models form a baseline for future research.
- Third, we demonstrated that YOLOv11 effectively addresses the problem of detecting flammable and explosive objects. Additionally, we integrated the CBAM attention module [19] into the feature extraction network of YOLOv11, enhancing the feature extraction quality of flammable and explosive objects by focusing on semantic information in both the channel and spatial dimensions.
2. Related Work
In recent years, computer vision technologies have found widespread application across a variety of complex scenarios, including agriculture, industry, and robotics, driving continuous advancements in object detection methods. To address the challenges posed by highly dynamic and complex environments, researchers have proposed numerous structural optimizations and data augmentation strategies. Representative approaches include illumination domain adaptation based on CycleGAN [20], and context-based attention mechanisms. These studies demonstrate the broad applicability of deep learning in complex visual environments and provide relevant methodological context for the detection task addressed in this work.
Existing methods for detecting flammable and explosive objects can generally be classified into two main categories: those based on traditional physical parameter measurements and those employing deep learning-based image detection techniques. The former typically relies on mature chemical analysis methods. Common techniques include various methods such as gas chromatography [21], liquid chromatography [22], ion chromatography [23], mass spectrometry [24], differential scanning calorimetry (DSC) [25], thermogravimetric analysis (TGA) [26], spectrophotometry [27], X-ray spectroscopy [28], ultraviolet spectroscopy [29], Fourier transform infrared spectroscopy [30], Raman spectroscopy [31], and terahertz spectroscopy [32]. Although these methods are technically mature and each is applicable to different detection targets and scenarios, they share the common drawback that they require contact or laboratory testing after sampling. This not only limits the timeliness of these methods but also makes it impossible for them to achieve remote, non-contact detection. Although non-contact detection methods perform excellently in terms of detection accuracy, they come with issues such as expensive equipment, complex sample preparation, and long analysis times [33]. Additionally, the maintenance of hardware poses significant challenges during usage.
With the rapid development of artificial intelligence technologies, Zhang et al. [34] combined neural networks and sensor technologies to create a system known as the “Novel Electronic Nose” (E-nose), which mimics the human olfactory system and is applied to the recognition of chemical gases. At the same time, Zhao et al. [35] proposed a fast, effective, and accurate combustible gas recognition method by combining a kernel-based wide learning system (KBLS) with the AdaBoost algorithm for combustible gas classification. However, the application of these methods has been mainly limited to gas detection and recognition, making it difficult to directly detect flammable and explosive objects in actual transportation or storage environments.
In recent years, Albert Parra et al. [11] focused on hazardous material (hazmat) label recognition, conducting research to meet the requirements of rescue robot tasks, and innovatively proposed an attention pre-selection method combined with the SIFT algorithm. J. Cai et al. [36] proposed a new hazardous materials recognition dataset, which is the first RGB-D hazardous material label detection dataset. Amir Sharifi et al. [37] utilized an improved YOLOv3-tiny model and developed a custom non-maximum suppression method, ANMS, which avoids suppressing key information while maintaining the maximum gain of NMS. In addition, Sharifi et al. released a standard HAZMAT dataset that conforms to the PASCAL VOC format. Based on machine learning, their model can classify various types of hazardous material labels with an accuracy of about 99% and has been successfully applied to mobile robots. Shuoyi Ran et al. [12] created a comprehensive chemical safety label detection benchmark dataset. Through comparative analysis, the study showed that YOLOv5 performs best overall and can serve as a baseline method for this application scenario. However, this method still faces challenges when dealing with small labels, complex external scenes, and multi-label scenarios, and other models also have their own limitations.
However, most of these methods rely heavily on the presence of intact surface labels. Once these labels are damaged or missing, the detection performance degrades significantly, making it difficult to ensure robustness under complex conditions. Existing studies have highlighted that hazard labels often become difficult to recognize reliably during transportation, storage, or emergency scenarios due to image distortion, occlusion, or physical damage, resulting in a higher miss detection rate for label-dependent methods. For instance, the DeepHAZMAT system proposed by Sharifi et al. shows noticeably limited detection performance when the capture distance exceeds one meter, mainly due to reduced image resolution and distortion [37]. Similarly, previous research indicates that in challenging scenarios involving occlusion or cluttered backgrounds, detection methods that depend on labels or surface markings are prone to interference, leading to performance degradation [38]. Therefore, compared with approaches that rely solely on label information, directly performing end-to-end detection on the flammable and explosive objects themselves by leveraging their inherent multidimensional features can significantly reduce the risk of detection failure caused by missing labels, occlusion, or long-distance observations, thereby improving the robustness and practical applicability of the method in complex real-world scenarios.
In addition to the YOLO series, two-stage detectors, such as Faster R-CNN, remain widely adopted as a classical detection paradigm in practical security scenarios, including baggage screening and hazardous materials detection [39]. In recent years, transformer-based detectors, exemplified by DETR and its subsequent enhancements such as AO-DETR and DINO-DETR, have emerged as state-of-the-art developments in the field of object detection and have gradually been applied to challenging contexts like X-ray prohibited item inspection, achieving further improvements in detection accuracy under multi-object occlusion conditions [40]. While these methods demonstrate outstanding accuracy, their slower inference speed and high hardware resource consumption limit their broader deployment in applications that demand high real-time performance.
Considering the aforementioned challenges, performing end-to-end object detection directly on the flammable and explosive objects themselves, combined with structural optimizations and the integration of attention mechanisms, represents an effective approach to enhancing detection accuracy and robustness. Consequently, this study proposes an improved YOLOv11-based detection framework, which incorporates the CBAM attention module to strengthen the representation of critical information. To support this line of research, this study constructed EF-Data, a large-scale benchmark dataset designed to facilitate automated hazard detection in real-world environments.
3. Materials and Methods
In the training of deep neural networks, the availability of large-scale and high-quality data is essential. Consequently, when addressing domain-specific applications, constructing a comprehensive and sufficiently large dataset becomes a critical step. Such a dataset should encompass diverse real-world scenarios, covering variations in lighting conditions, camera angles, and weather environments to ensure robust model generalization.
However, in the field of flammable and explosive object detection, there is currently no publicly available comprehensive dataset for researchers to use. The lack of such a diverse and large-scale dataset weakens the foundation for algorithm training and performance evaluation. A comprehensively annotated dataset is strictly required to train robust object detection models and accurately evaluate their generalization capabilities.
3.1. Data Collection
In constructing the EF-Data (Flammable and Explosive Data) dataset, we primarily sourced candidate images of flammable and explosive objects through keyword-based searches and content filtering across the internet and publicly available industry databases. To ensure high data quality and diversity, the initially collected images were then subjected to multiple rounds of manual screening and cleaning. The explicit screening criteria included the following:
- Removal of duplicate or highly similar scenes.
- Exclusion of images where the target object is unrecognizable due to blur, severe occlusion, or extreme lighting.
- Inclusion of varied scenarios, lighting conditions, camera angles, and weather conditions to reflect real-world diversity.
- Use of a multi-scene grouping and sampling strategy to mitigate potential bias from overly concentrated sources or excessive samples from a single scene.
Ultimately, the EF-Data dataset consists of 7102 precisely annotated images, which are divided into two independent subsets: the training set and the test set. The training set contains 5332 images, while the test set contains 1770 images. To mitigate the impact of scene bias and source concentration, we made efforts to distribute images from the same scene proportionally between the training and test sets.
3.2. Annotation
The annotation of the EF-Data dataset was conducted collaboratively by multiple researchers. Each image was initially annotated independently by several annotators, after which a systematic process of cross-validation and random sampling was applied to thoroughly compare and standardize the bounding boxes. This structured workflow significantly reduced human errors and subjective biases, ensuring high consistency and accuracy of the annotations.
All objects in the dataset were assigned to a unified category label “flammable.” Although the task is described as flammable and explosive object detection, a single shared label is adopted for two reasons. First, from a visual perspective, flammable and explosive objects—such as gas cylinders, fuel barrels, chemical tanks, and pressurized canisters—share strongly overlapping appearances in RGB images, making reliable visual distinction between the two subcategories impractical without additional sensor modalities or chemical analysis. Second, from an application perspective, the primary goal of this work is to detect and localize hazardous objects in a scene rather than to classify the specific hazard subcategory; a unified label is therefore both sufficient and appropriate for this purpose. The label “flammable” is used throughout as a shorthand for the broader category “flammable and explosive object.”
Each object was annotated with a tightly fitting rectangular bounding box. To guarantee annotation quality, the following rules were applied:
- Completeness—All objects must be annotated, even if partially obscured by text or other elements.
- Occlusion Handling—For overlapping or partially occluded objects, bounding boxes should cover only the visible portions.
- Tightness—Bounding boxes must closely conform to object contours, avoiding excessive background inclusion or noticeable omissions.
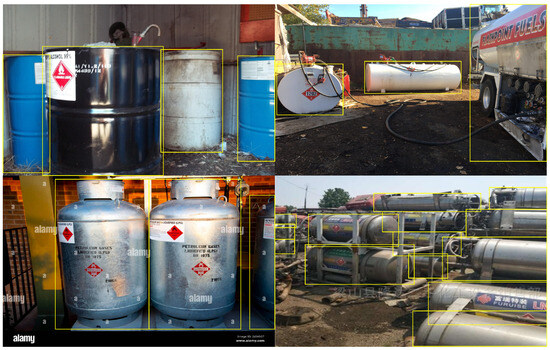
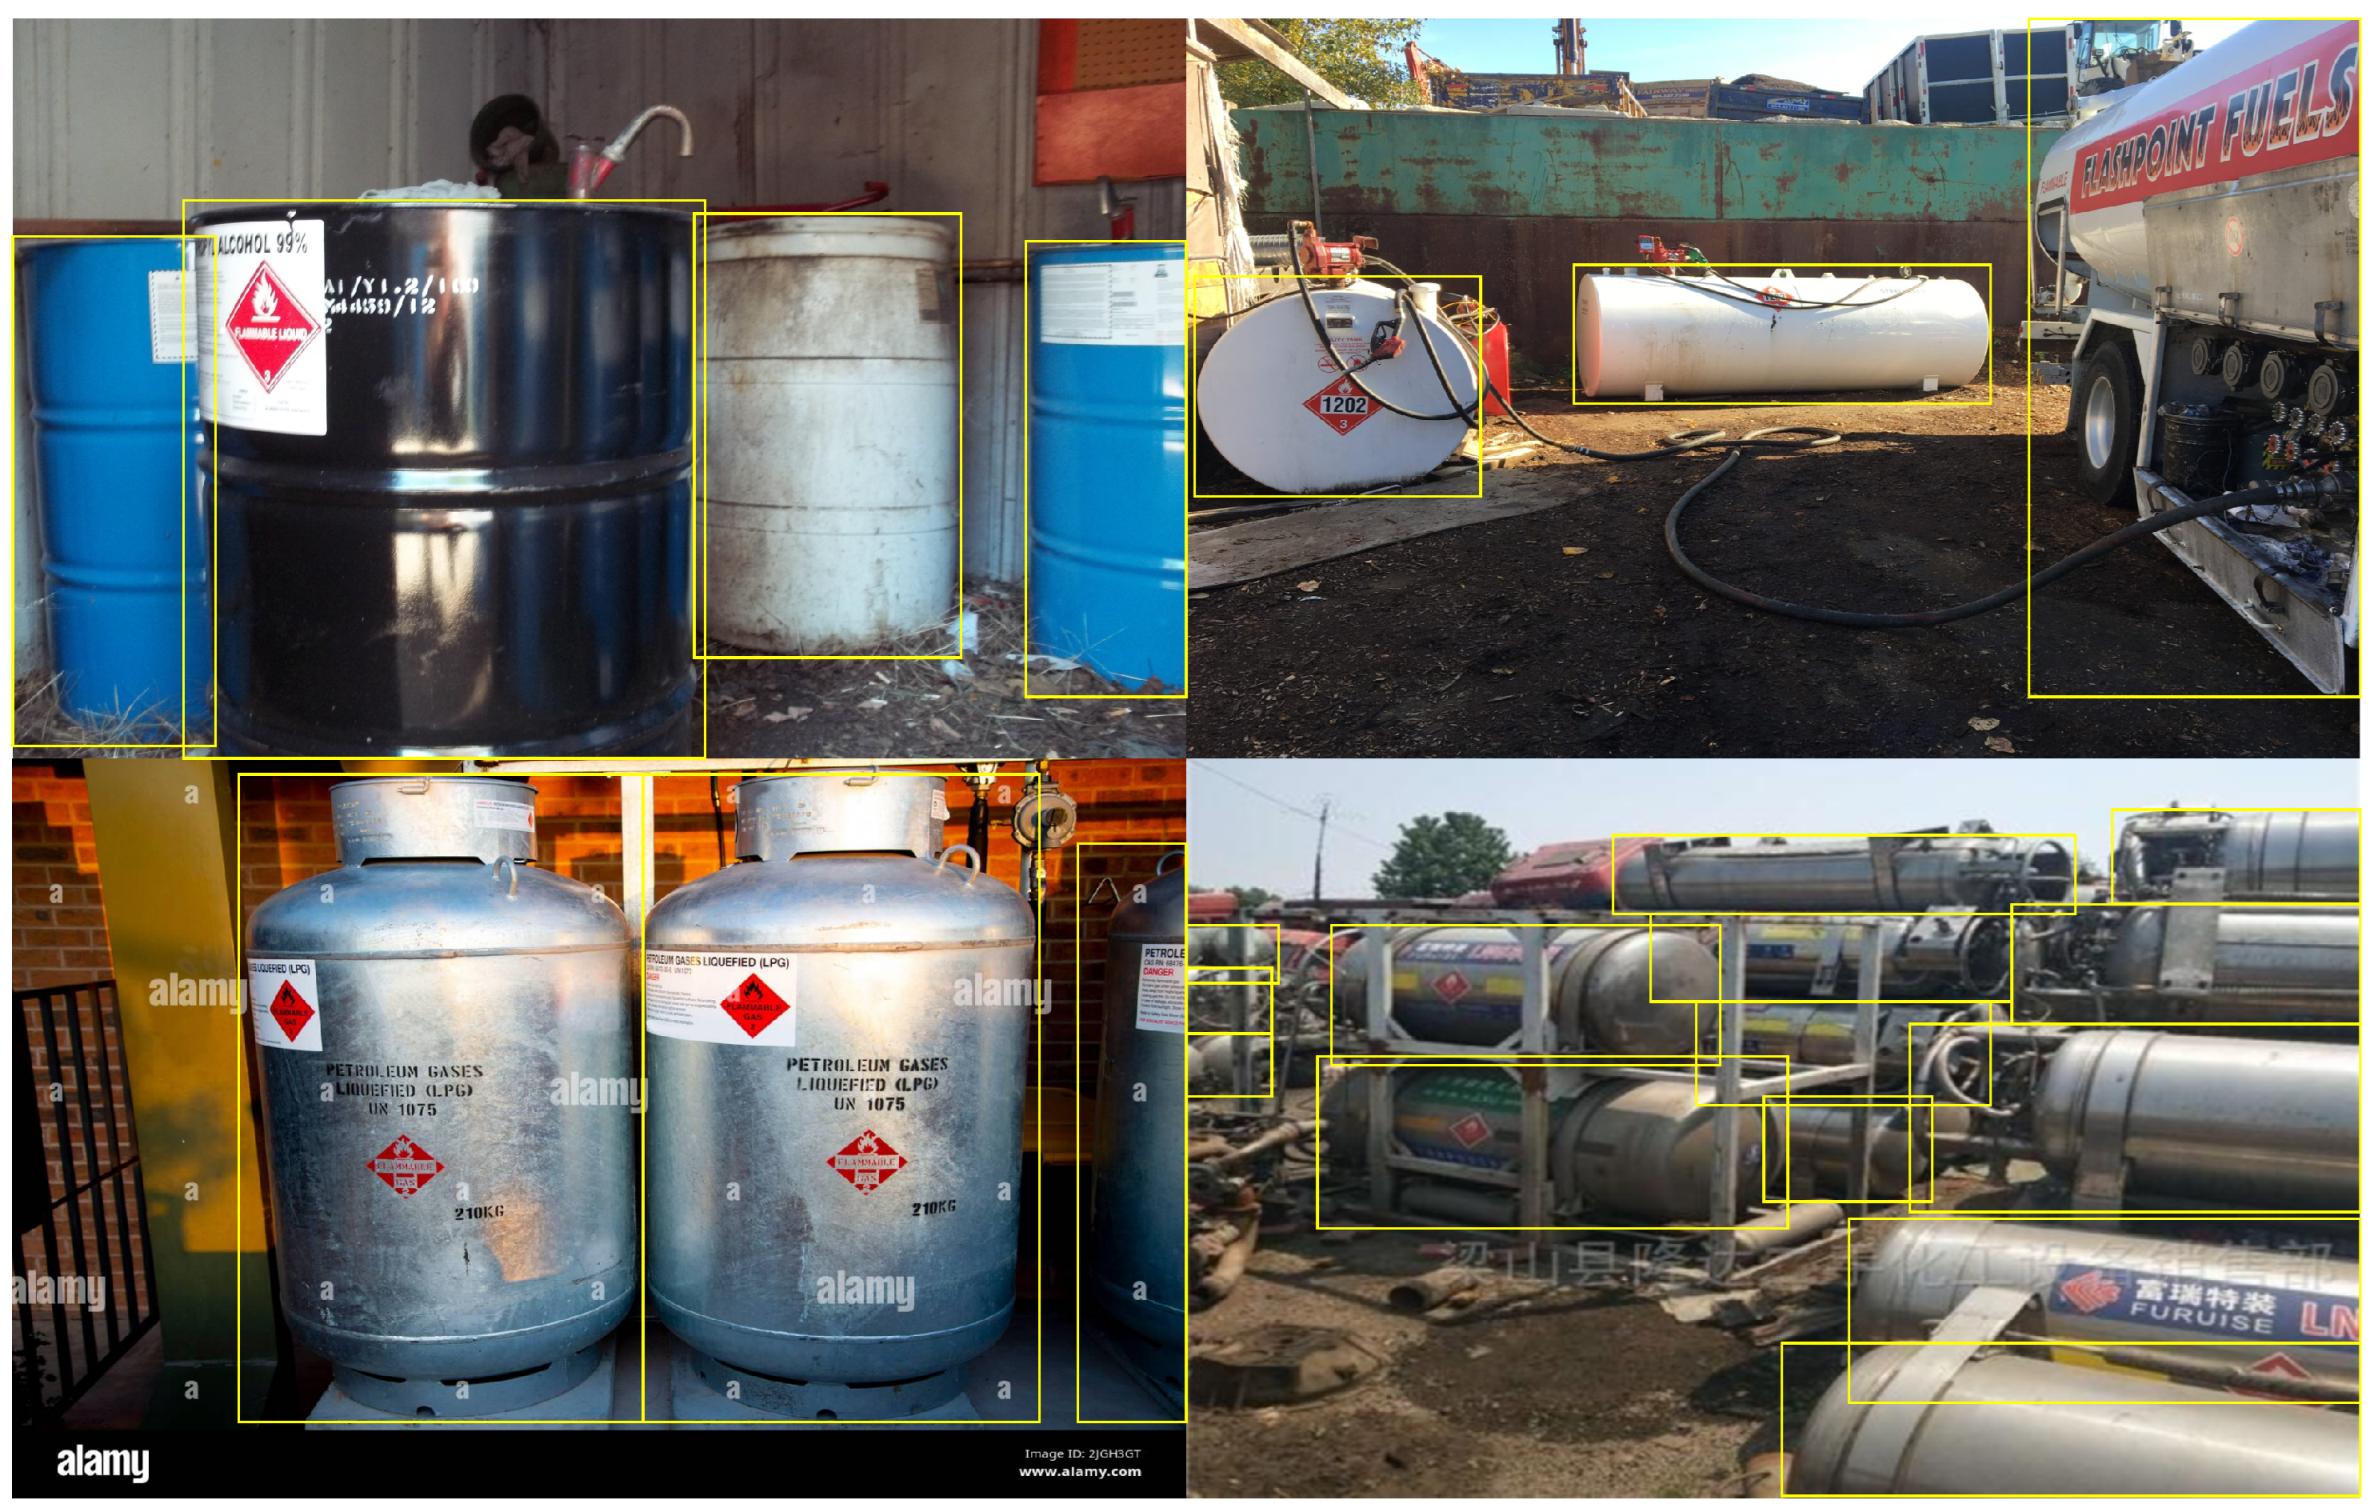
All annotations were performed using the VGG Image Annotator (VIA) tool and stored in JSON format. Figure 1 presents representative annotated images from the EF-Data dataset.
Figure 1.
Example annotated images in the EF-Data dataset, with yellow rectangles representing the annotated bounding boxes in the dataset.
3.3. Dataset Statistics
This section analyzes the composition and characteristics of the EF-Data dataset to establish its diversity and representativeness. The images included in the data set were captured in various daytime periods, including early morning, noon, and afternoon, encompassing a wide range of lighting and environmental conditions. This approach aims to realistically reflect the diverse appearances of flammable and explosive objects in real-world scenarios. The image sources are geographically diverse, covering regions in Europe (e.g., the United Kingdom), North America (e.g., the United States), Oceania (e.g., Australia), and Asia (e.g., China, Thailand). This geographical diversity enhances the dataset’s coverage across different regions and environmental conditions. This diversity provides essential data variance for model training and unbiased evaluation.
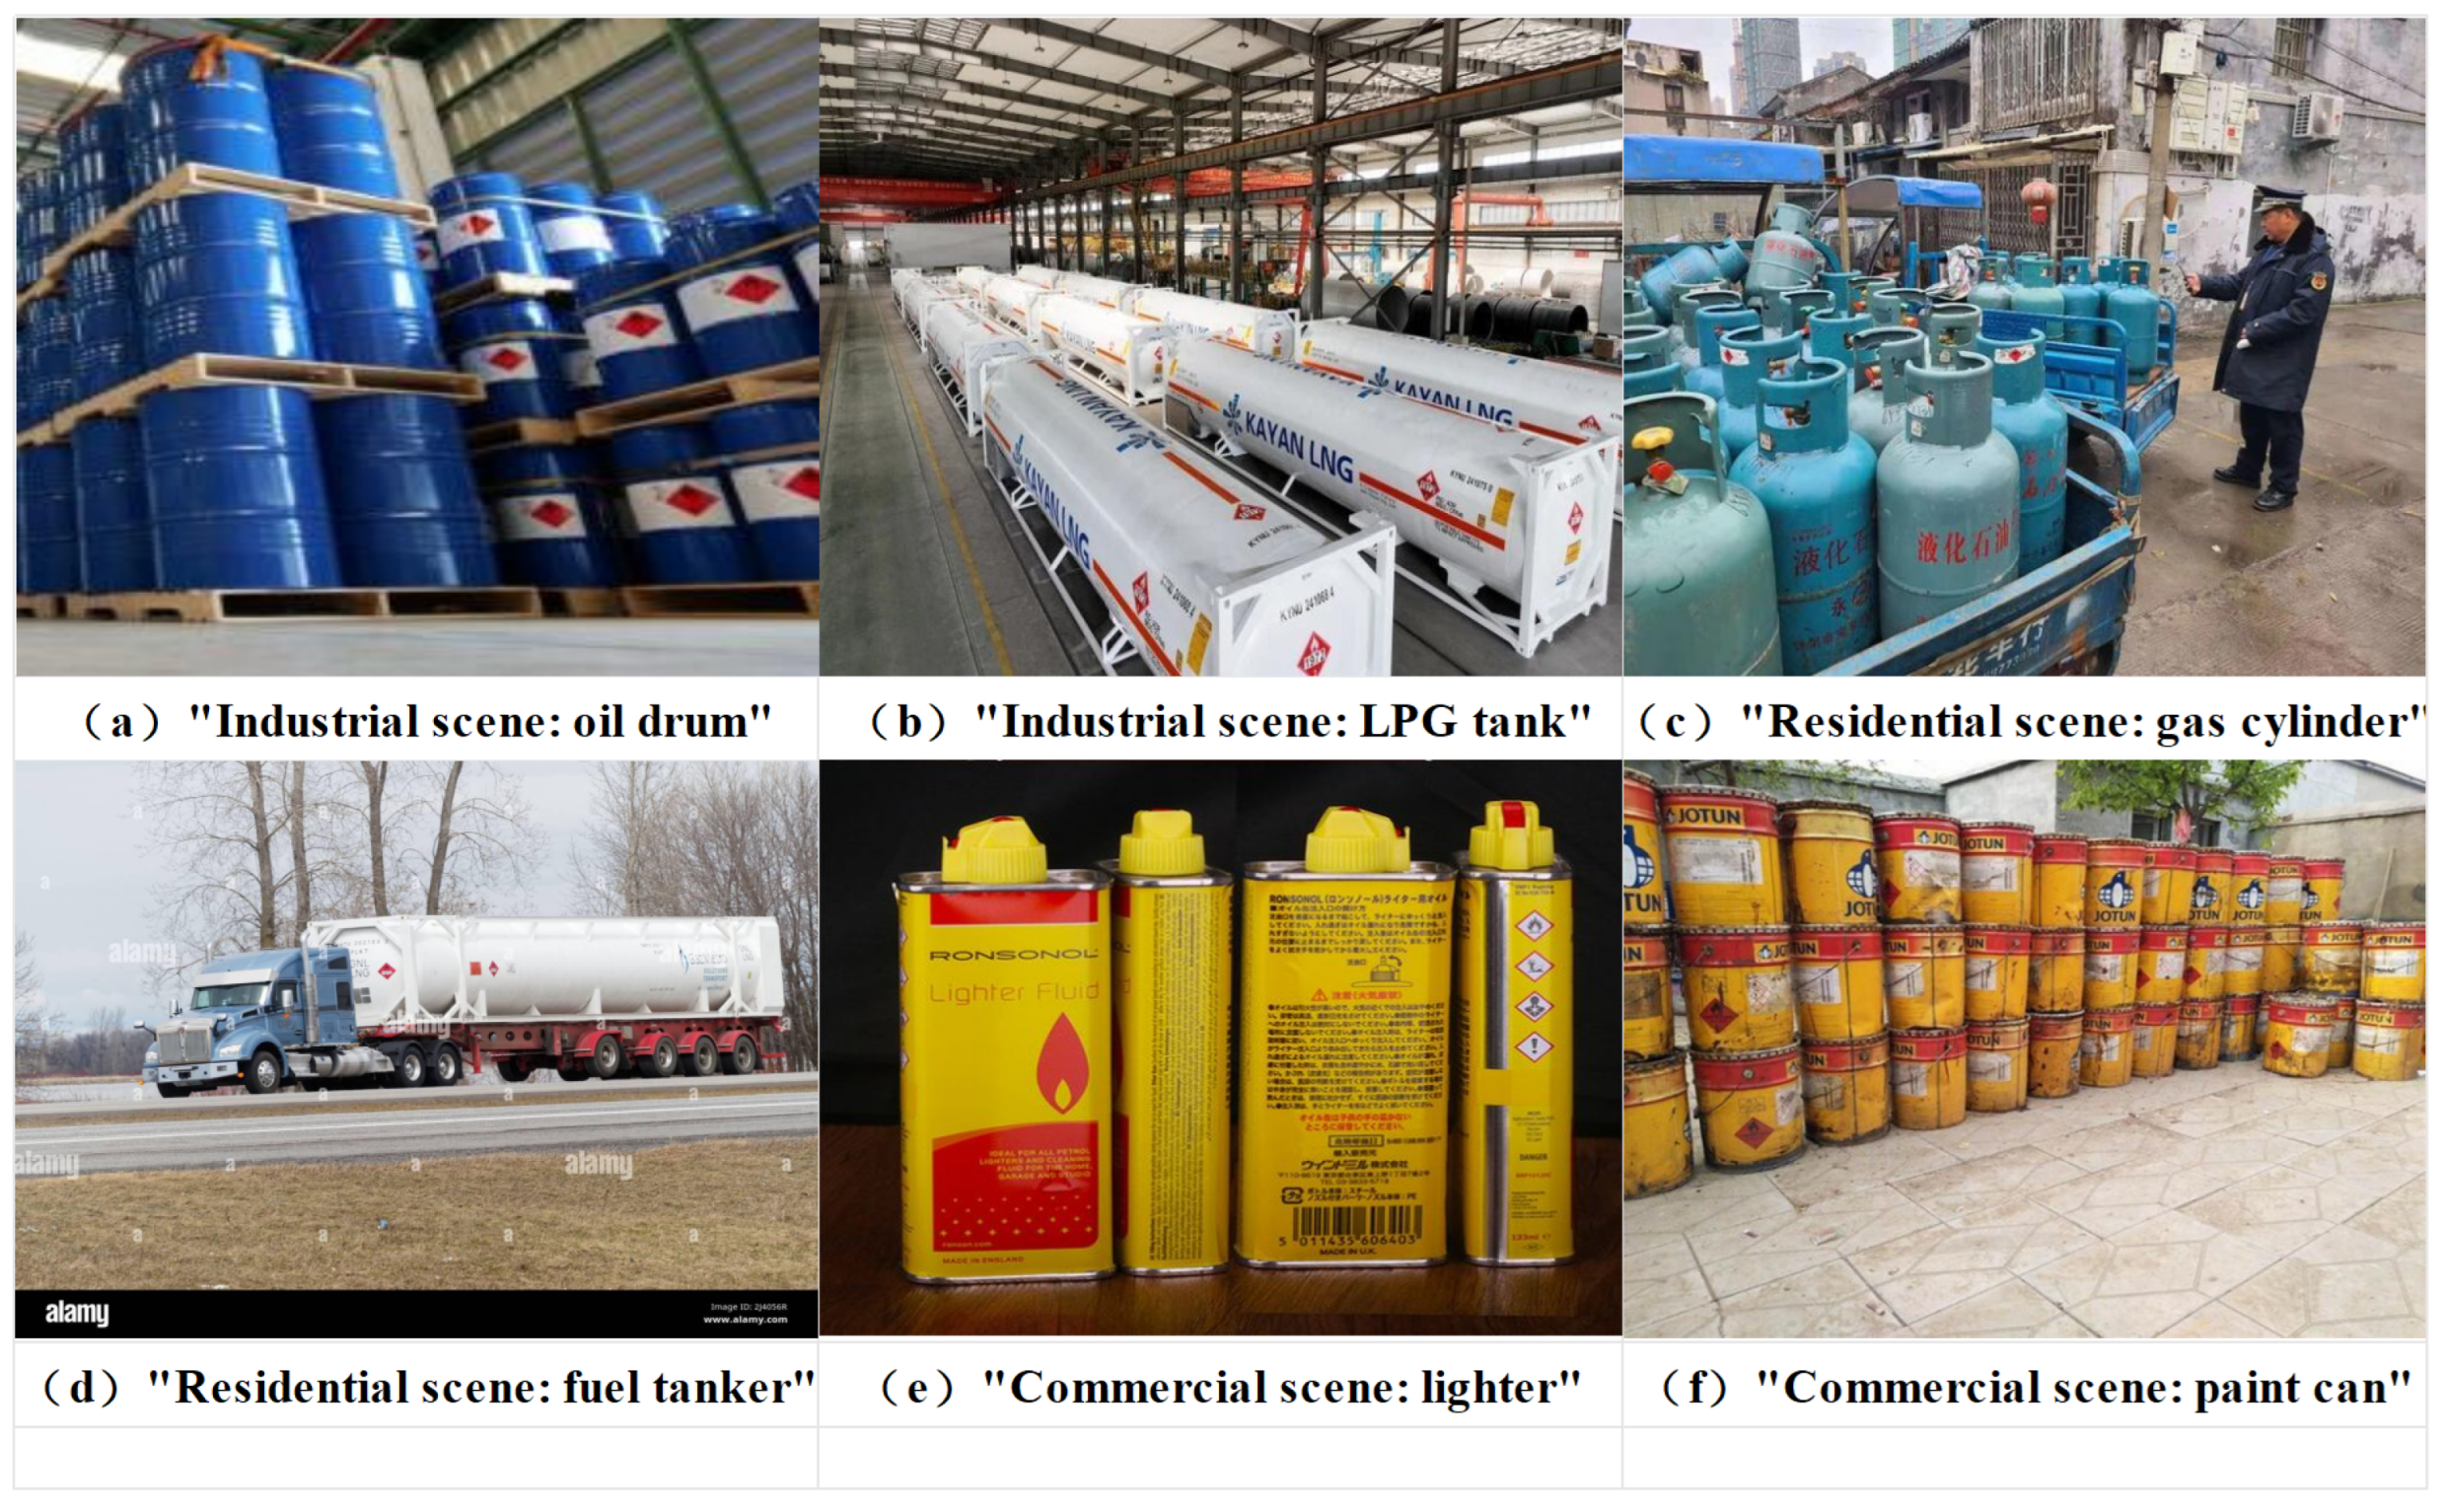
In terms of scene composition, EF-Data encompasses three typical usage environments: industrial, residential, and commercial, taking into account the real-world distribution of flammable and explosive objects. Industrial scenes account for approximately 31.2% of the dataset and include chemical production, petroleum refining, and natural gas extraction and transportation, characterized by complex backgrounds and dense equipment, which pose high demands on the robustness and accuracy of detection algorithms. Residential scenes also account for about 31.2% and include household liquefied petroleum gas cylinders, festive fireworks sales points, and gas stations in residential areas, featuring irregular and less structured environments. Commercial scenes make up approximately 27.6%, covering flammable chemicals and industrial gas cylinders in paint shops and hardware stores, with compact layouts and diverse product arrangements.
Regarding category distribution, it is important to clarify that the dataset is formulated for a single-class detection task; thus, all annotated instances are assigned to a unified label (“flammable”) during model training. However, to comprehensively characterize the dataset’s composition and visual diversity, descriptive statistics are provided based on their underlying physical states. Specifically, flammable liquids constitute approximately 39.1% of the dataset, explosive gases 32.2%, and solid flammable materials 28.7%. This statistical breakdown reflects the proportional representation of various flammable and explosive objects in real-world practical applications.
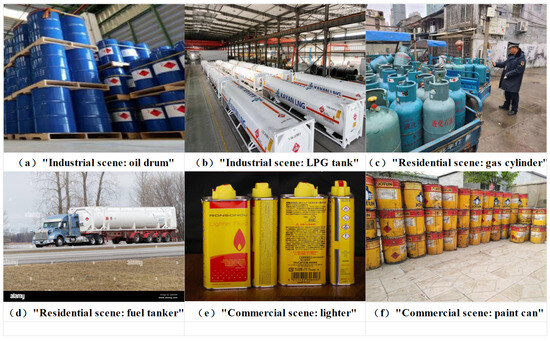
Overall, the EF-Data dataset covers flammable and explosive objects in various scenarios, providing a diverse range of images for model training and evaluation. This ensures the model’s effectiveness in multiple environments. Figure 2 illustrates some representative images from the EF-Data dataset.
Figure 2.
Displays representative samples from our dataset, covering industrial, commercial, and residential scenes.
4. Methodology
In this section, an overview of the YOLOv11 network is first presented. Then, based on the original YOLOv11 architecture, a Convolutional Block Attention Module (CBAM) is integrated to enhance the model’s performance. The modified model, referred to as YOLOv11-CBAM, aims to improve the accuracy of detecting flammable and explosive targets.
4.1. YOLOv11
YOLOv11, released by the Ultralytics team on 30 September 2024, marks the latest advancement in real-time object detection technology. Compared to previous models, YOLOv11 enhances detection accuracy while maintaining detection speed. Several significant structural improvements have been implemented in comparison to YOLOv8. Notably, the CF2 module has been replaced with the C3K2 module, which enhances feature extraction by integrating repetitive convolutions with an efficient information flow design. Additionally, the C2PSA module is introduced after the SPPF module, allowing the model to focus more on important areas of the image and effectively suppress irrelevant details. YOLOv11’s detection head also integrates lightweight deep convolutions (DWConv), reducing computational demands through more efficient data processing. These improvements collectively enhance YOLOv11’s computational efficiency while maintaining high detection accuracy. Notably, YOLOv11 achieves higher mAP on the COCO dataset [41] with fewer computational resources than earlier models [42], facilitating deployment in practical scenarios.
YOLOv11 adopts an overall architecture that includes the backbone network, neck modules, and prediction heads [43].
First, the input image is processed through a data augmentation module, which includes operations such as adjustments, flipping, cropping, and scaling to enhance the model’s generalization ability. Next, the backbone network extracts features from the image. This network consists of the C3K2 module, C2PSA module, and SPPF layer [44,45]. The C3K2 module efficiently extracts features using smaller 3 × 3 convolutional kernels, while maintaining a low computational cost. The C2PSA module introduces an attention-like mechanism, further enhancing focus on specific regions, particularly small objects. The SPPF layer combines multi-scale pooling operations to enlarge the receptive field, making the model more accurate when detecting objects of different scales. The extracted features are then fused through the neck modules and passed to the prediction head. The neck part integrates SPPF and upsampling techniques to extract information from features at different scales, improving detection accuracy. Finally, the prediction head outputs object categories and bounding box coordinates. During the output phase, YOLOv11 employs a bounding box regression loss function and integrates non-maximum suppression (NMS) to effectively detect overlapping objects while reducing computational resource consumption.
4.2. Introduction of Convolutional Attention Module
This paper presents a modified YOLOv11 architecture that incorporates the Convolutional Block Attention Module (CBAM) to improve target feature representation. In the field of deep learning, attention mechanisms [46] focus on the important features of the input image. The core principle behind this mechanism involves constructing a mask using neural networks, where the values within the mask accurately quantify the attention weights for different locations. This highlights critical information while downplaying secondary details, thus improving model performance. Currently, mainstream attention mechanisms include channel attention mechanisms, spatial attention mechanisms, and hybrid-domain attention mechanisms. The channel attention mechanism generates a mask for the input feature map channels, assigning corresponding weights to each channel to achieve channel differentiation. The spatial attention mechanism generates a mask based on spatial locations in the input feature map, distributing weights across different regions to achieve spatial differentiation. The hybrid attention mechanism is constructed by simultaneously integrating both the channel and spatial attention mechanisms, combining their advantages to focus on multi-dimensional features. Common attention modules include SimAM [47], CBAM, EMA [48], and others. However, in the improved YOLOv11 algorithm proposed in this paper, the use of modules such as SimAM and EMA does not fully satisfy the complex requirements for detecting flammable and explosive objects.
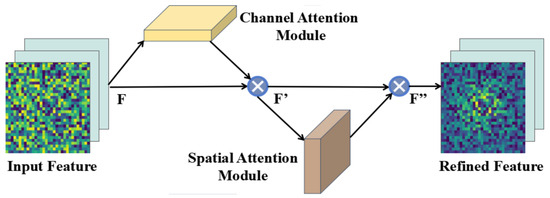
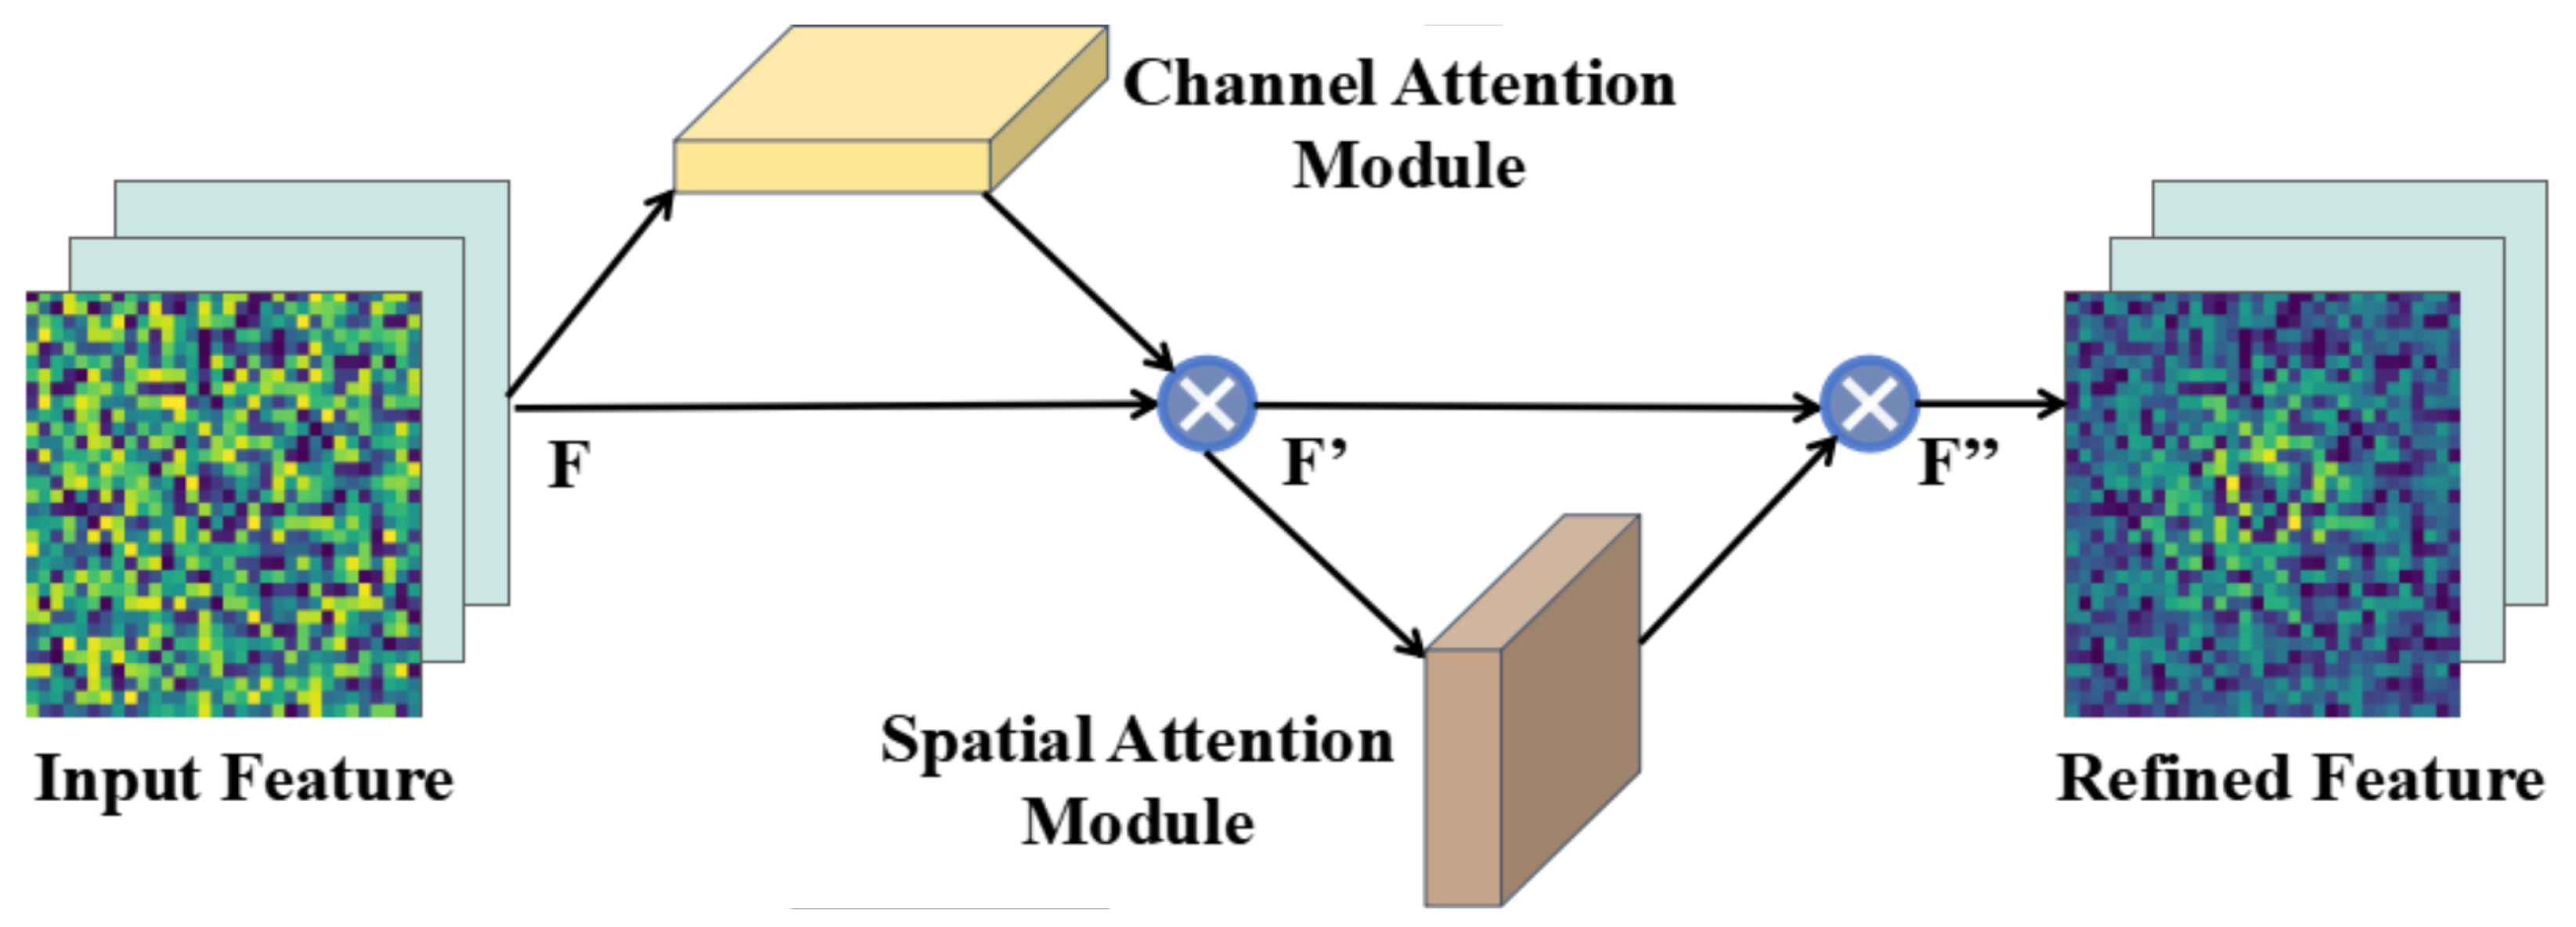
In the detection of flammable and explosive objects across various scenarios, occlusions or small targets, which occupy fewer pixels, can cause their features to be lost in deep networks. To address this issue, this paper introduces the lightweight CBAM attention module. By using both channel and spatial attention mechanisms, the CBAM module effectively strengthens the importance of feature maps, especially for occluded or small targets, allowing the network to better capture relevant information. The network structure is shown in Figure 3.
Figure 3.
The structure of the CBAM attention module.
Specifically, the extracted features of flammable and explosive object images are represented as F. A channel attention map is first generated based on the relationships between features, and it is multiplied with F to produce new features, F’, which emphasize the features related to the target object area. Next, a spatial attention map is generated by considering the spatial relationships between features, and it is multiplied with F’ to obtain the enhanced features, F". This process helps increase the weight of features related to the target area in both the channel and spatial dimensions, ultimately improving the detection performance of flammable and explosive objects.
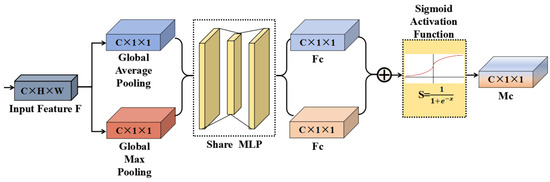
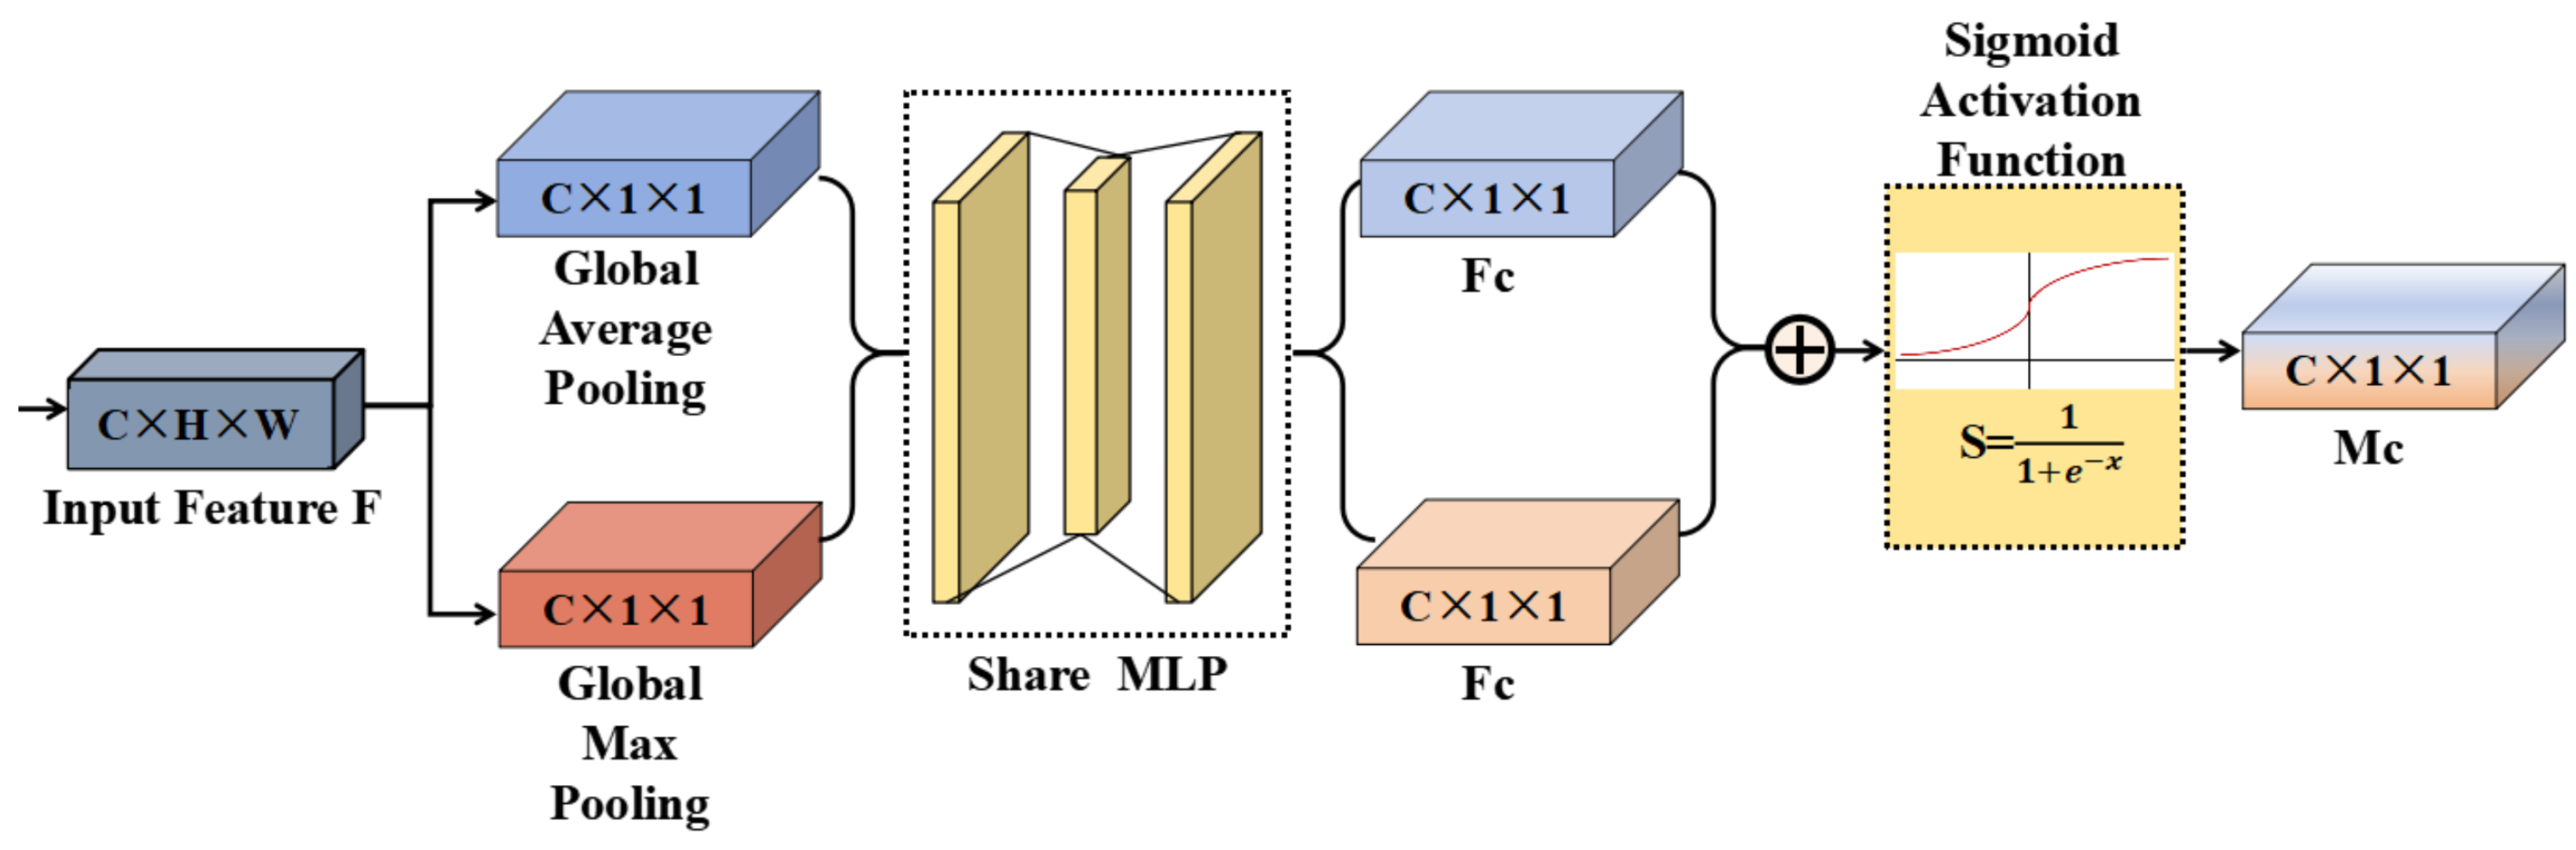
The structure of the Channel Attention Module (CAM) is shown in Figure 4. It works by performing maximum pooling and average pooling operations on the input feature map, compressing the spatial information of each channel to produce an output of shape (B, C, 1, 1), thus extracting global information. This step enhances the relationships between channels, helping the network better capture features. Next, a shared network consisting of two convolutional layers and a ReLU activation function is used to reduce the number of parameters through dimensionality reduction and expansion, while using the same weight matrices (W0 and W1) to process the input. Finally, the weight vector is generated through element-wise summation followed by a Sigmoid activation function [49], producing per-channel weights in the range [0, 1] without normalizing them to sum to 1.
Figure 4.
The framework for CAM (Channel Attention Module).
The channel attention mechanism can be expressed as:
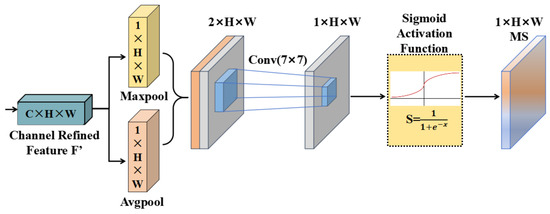
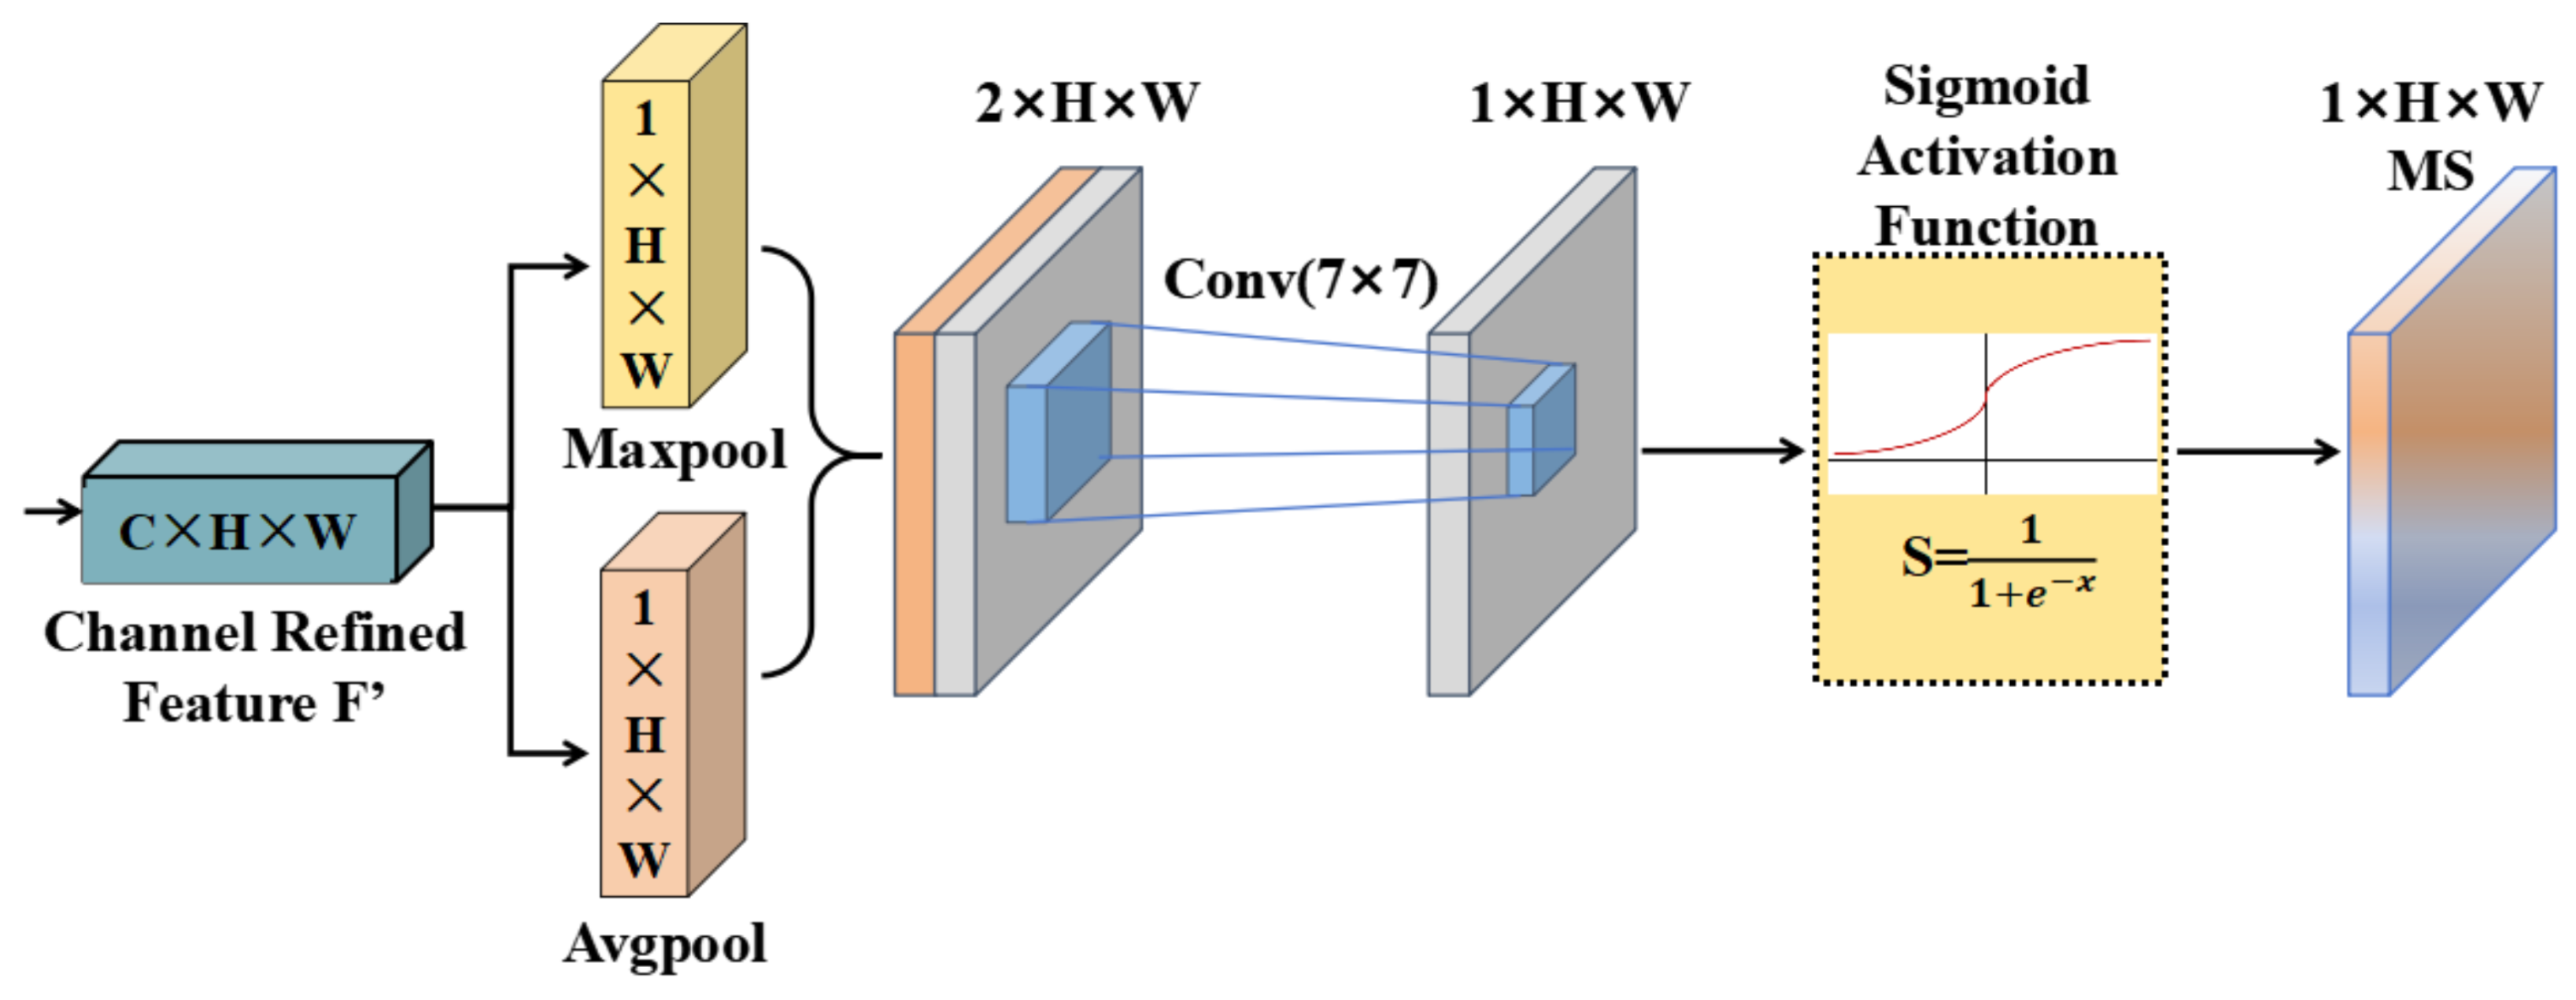
Figure 5 illustrates the structure of the Spatial Attention Module (SAM). It first applies average and max pooling operations along the channel axis to compress the channel dimension (C) of the input feature map, producing an output feature map of shape (B, 1, H, W). This step helps integrate global channel information while reducing both the number of parameters and computational complexity. The matrices obtained from the pooling operations are then concatenated along the channel axis (using torch.cat) and passed through a convolutional layer to reduce the channel count to 1. Finally, a Sigmoid function is used to generate the weight vector.
Figure 5.
The framework for SAM (Spatial Attention Module).
The spatial attention mechanism can be expressed as:
4.3. Improvement of YOLOv11
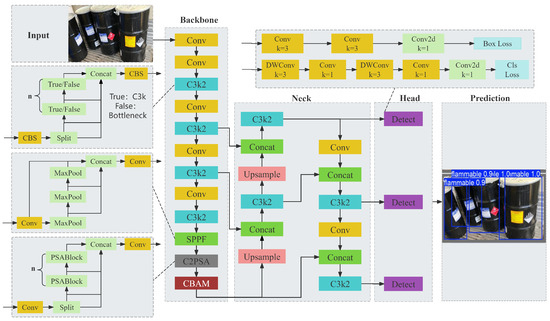
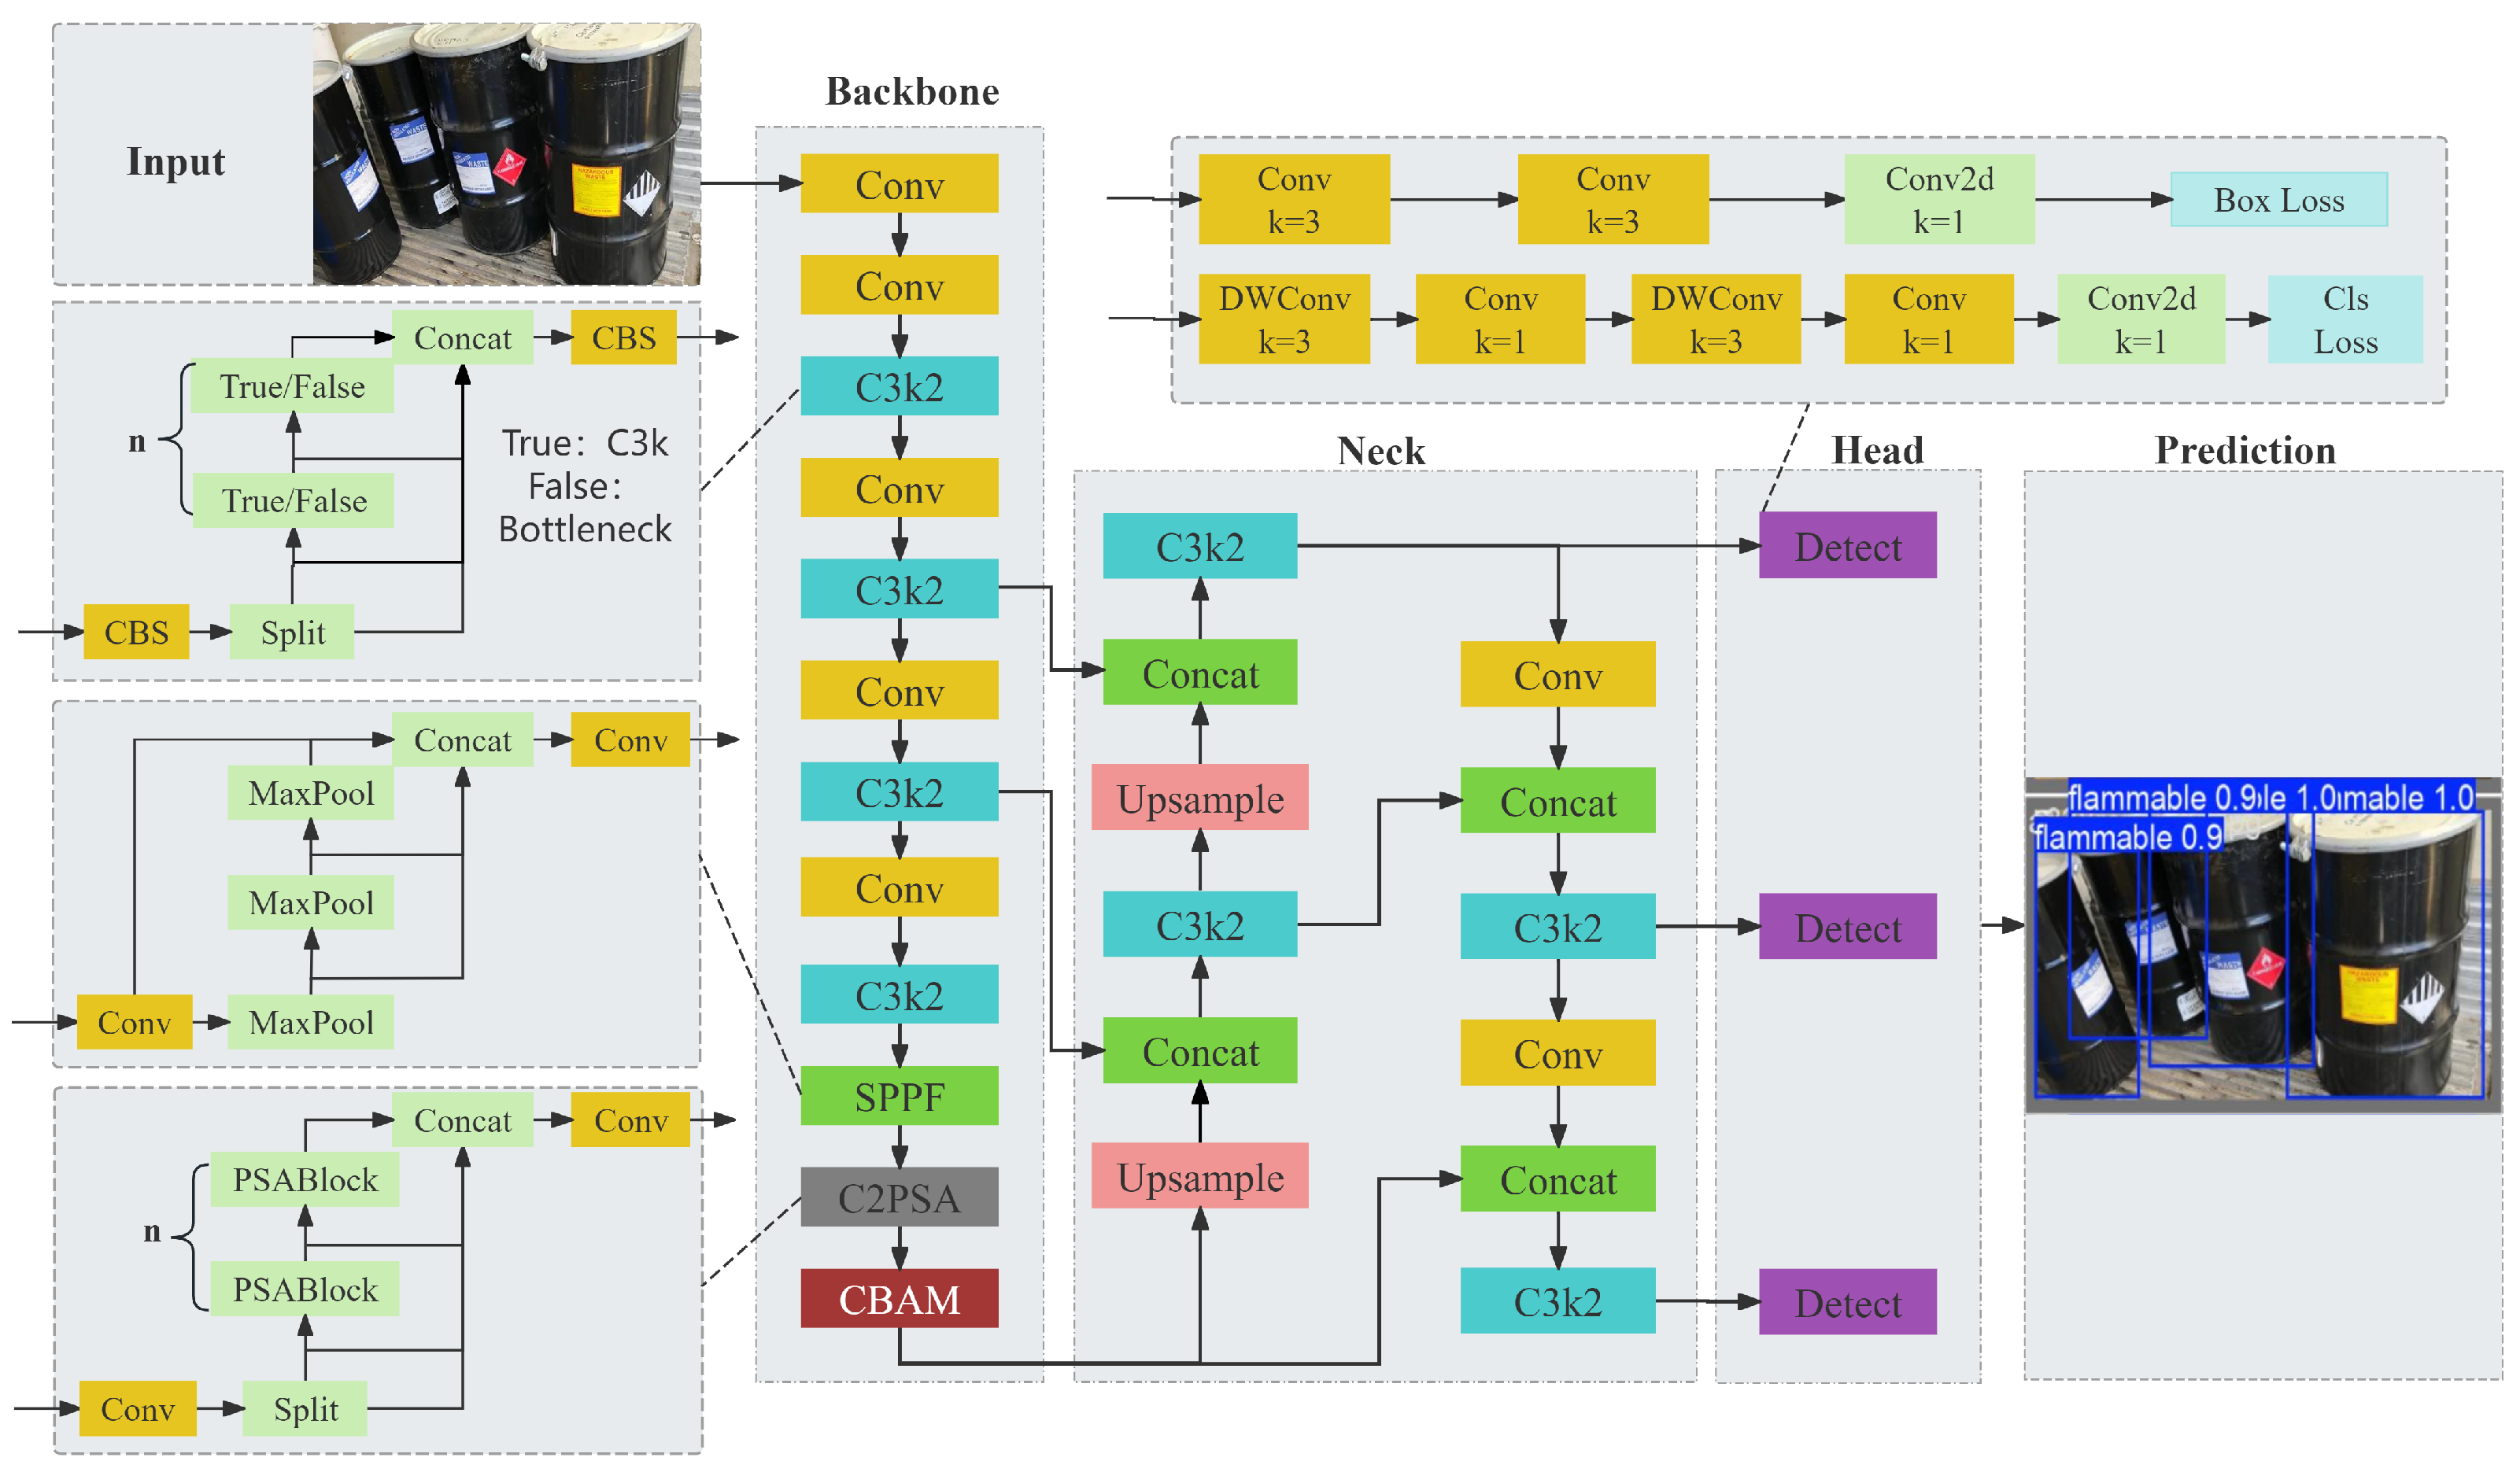
This study integrates the Convolutional Block Attention Module (CBAM) into the YOLOv11 backbone to enhance feature representation, as illustrated in Figure 6.
Figure 6.
The architecture of the modified YOLOv11 network, highlighting the improvements made to the backbone.
Specifically, the CBAM module is incorporated immediately following the final SPPF block in the backbone network, positioned at the eleventh layer. By sequentially applying channel and spatial attention, CBAM effectively refines the highest-level semantic features and transmits the enhanced feature representations to the detection head. Structurally, CBAM comprises two consecutive submodules: a channel attention mechanism, which adaptively recalibrates channel-wise feature responses, and a spatial attention mechanism, which further emphasizes informative regions while suppressing irrelevant background information. This design enables the network to focus more precisely on critical cues, thereby improving overall detection robustness in complex environments.
During training, the stochastic gradient descent (SGD) optimizer with an initial learning rate of 0.01 was employed over a total of 200 epochs. The training process utilized the default learning rate warm-up strategy provided by the Ultralytics YOLO framework, wherein the learning rate gradually increases linearly from a smaller value at the start of training to the preset initial learning rate, ensuring stability and convergence. Other hyperparameters remained consistent with those listed in the corresponding table.
5. Results
5.1. Experimental Parameters
The experimental setup of this paper is shown in Table 1.
Table 1.
Experimental environment configuration.
5.2. Evaluation Metrics
To comprehensively evaluate model performance, this study focuses on two key metrics: detection accuracy and detection speed. When evaluating detection accuracy, Precision (P) and Recall (R) are the core components, and their specific definitions are as follows:
Here, True Positives () refer to the number of flammable and explosive objects that the model correctly identifies, while False Positives () represent the number of non-target objects incorrectly classified as flammable and explosive items, i.e., the cases where ordinary objects are mistakenly identified as hazardous items.
Here, False Negatives () refer to the flammable and explosive objects that are incorrectly classified as non-hazardous by the model. Precision and Recall are interrelated and influence each other, reflecting the model’s detection performance from different perspectives. However, relying on a single metric is insufficient to comprehensively and objectively assess the actual performance of the model.
In the field of flammable and explosive object detection, mean Average Precision () is a critical metric for evaluating detection accuracy, playing a vital role. The Average Precision () value precisely reflects the model’s performance in this domain, and its calculation is based on precision and recall, derived through in-depth analysis. The implementation process is as follows: First, by adjusting the confidence threshold, the model can obtain different values for precision and recall. When the model is tested using a complete range of confidence thresholds from 0 to 1, a set of corresponding precision and recall values is obtained. These values are then plotted on a coordinate system, generating a precision-recall (P-R) curve. The area under this curve (AUC) is the Average Precision value. Together, these metrics provide a quantitative assessment of the model’s localization and classification accuracy in detecting flammable and explosive objects.
The formulas for calculating AP and mAP are as follows:
Here, C represents the total number of defined categories. Given that the proposed task is formulated strictly as a single-class detection problem—focusing exclusively on the unified “flammable” superclass—the parameter C is inherently constrained to C = 1. Under this paradigm, the generalized mAP formulation mathematically collapses to the Average Precision of this single target class.
In addition, according to the COCO evaluation standard, the Intersection over Union () threshold is not limited to a single value but instead spans a range from 0.5 to 0.95 in increments of 0.05. Therefore, this study reports not only the mean Average Precision at IoU = 0.5 (mAP@0.5) but also the mean Average Precision averaged over multiple IoU thresholds (mAP@[0.5:0.95]). Specifically, the Average Precision is computed at each IoU threshold of 0.50, 0.55, 0.60, and so on up to 0.95, and the mean of these values is taken as the final COCO-style mAP. This multi-threshold evaluation method provides a more comprehensive and robust assessment of the detector’s performance under varying levels of localization strictness.
The calculation process for mAP is as described above: first, the AP for this single category is computed under different IoU thresholds; then, the AP values across these IoU thresholds are averaged to obtain the overall mAP score. This metric effectively measures the model’s detection accuracy and localization quality by jointly considering classification precision and overlap extent.
5.3. Ablation Study
This section evaluates the impact of CBAM insertion location and attention module selection on detection performance. All experiments were conducted under identical parameter settings and system environments.
To analyze the impact of the CBAM module on the performance of different parts of YOLOv11, we designed five experimental setups, adding the CBAM module to different locations within YOLOv11 and comparing the mAP and AP values with those of the original YOLOv11 algorithm. Specifically, we added the CBAM module to the backbone network, neck network, and head network of YOLOv11, without replacing any layers in the original architecture. We then compared the performance of the model before and after integration, with the experimental results shown in Table 2.
Table 2.
The impact of CBAM module on YOLOv11.
The experimental results indicate that integrating the CBAM module significantly improves performance across various network locations. Although inserting CBAM at Layer 14 (Neck Network) yields a marginally higher mAP@0.5 (0.903) and Recall (82.5%) compared to Layer 11 in the Backbone (0.900 and 80.6%, respectively), Layer 11 achieves the absolute highest Precision (92.8%) among all configurations. In the context of industrial flammable and explosive object monitoring, minimizing false alarms (maintaining high precision) is of paramount importance to prevent unnecessary panic and operational disruptions. Therefore, we ultimately selected Layer 11 as the optimal insertion point, prioritizing peak detection precision while maintaining highly competitive overall accuracy.
To verify the effectiveness of the CBAM attention mechanism in enhancing the detection accuracy of flammable and explosive objects, we also conducted a series of rigorous comparative experiments. In these experiments, we added five classic attention mechanisms to the original YOLOv11 network: CoordAtt [50], GAM [51], PSA [52], SimAM, and EMA. Here, YOLOv11 refers to the original network, and YOLOv11+CoordAtt indicates the addition of the CoordAtt attention mechanism, and so on. The comparison results of different attention mechanisms are shown in Table 3.
Table 3.
Improvements of different attention modules.
According to the quantitative results in Table 3, while CoordAtt, GAM, SimAM, and EMA yielded varying degrees of improvement over the baseline (enhancing mAP@0.5 by 0.1 to 1.2 percentage points), none of them surpassed the performance of CBAM. PSA even resulted in a marginal 0.1% performance drop. Empirically, the CBAM module demonstrates the most optimal compatibility with our improved YOLOv11 architecture for the specific task of flammable and explosive object detection. By effectively integrating channel and spatial attention, CBAM achieves an mAP@0.5 increase of 1.5 percentage points (from 0.885 to 0.900) while maintaining a competitive inference speed, making it the most suitable choice for our final model.
5.4. Comparative Experiments
This section further demonstrates the detection advantages of the proposed model by comparing its performance with several state-of-the-art object detection frameworks.
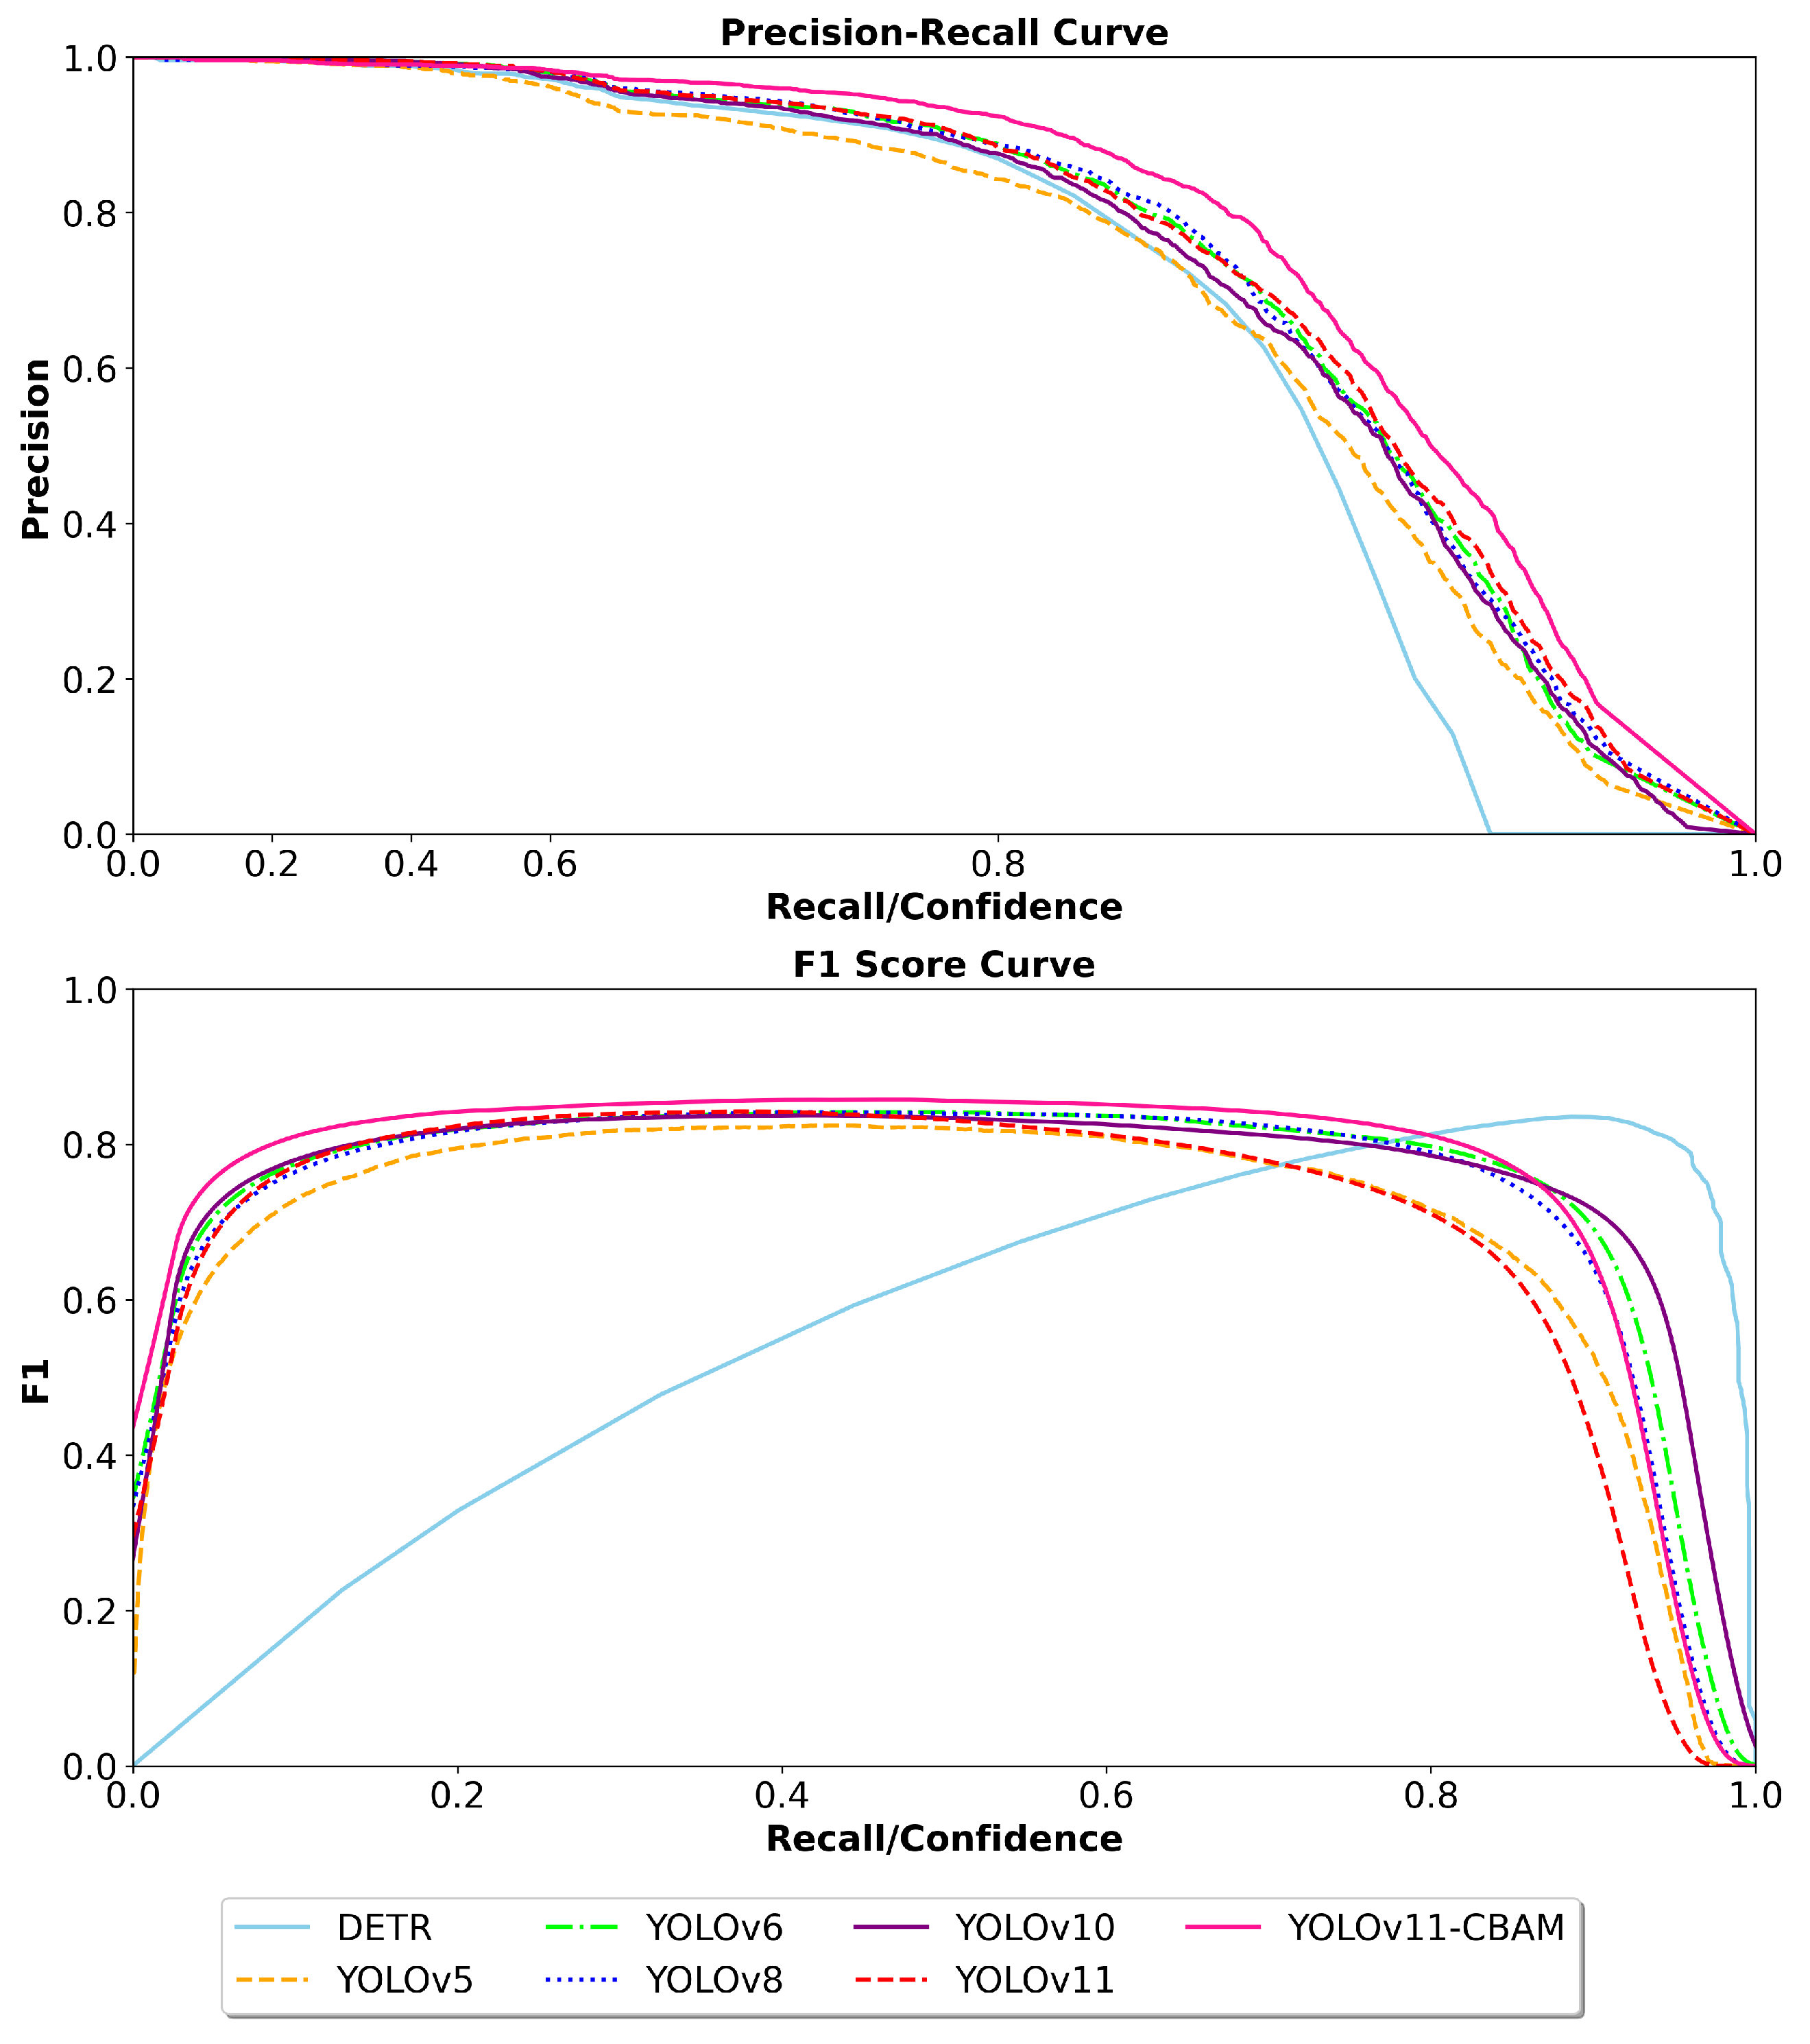
To visualize and evaluate detection accuracy, the Precision–Recall (PR) curve is employed, where a larger area under the curve indicates higher average precision (AP). An area value approaching 1 implies near-perfect target detection. In addition, the F1 score—computed as the harmonic mean of precision and recall—provides a balanced metric that reflects both the correctness and completeness of detections, offering a more comprehensive assessment of model performance.
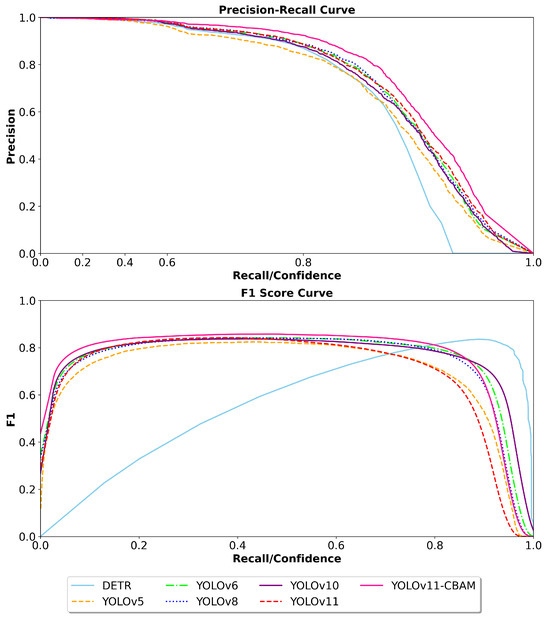
Figure 7 presents the PR and F1 curves of several state-of-the-art detection models on the EF-Data dataset, including YOLOv5, YOLOv6, YOLOv8, YOLOv10, YOLOv11, DETR, and the proposed enhanced version of YOLOv11. The results demonstrate that the enhanced model achieves superior Average Precision (AP) compared to other baseline methods for detecting flammable and explosive objects. Moreover, it attains a better balance between precision and recall, as reflected in the F1 score, indicating both high accuracy and robustness. These findings indicate that the proposed CBAM integration improves the model’s AP and F1 score across the evaluated baseline comparisons.
Figure 7.
Precision–Recall and F1 score curves of YOLOv5, YOLOv6, YOLOv8, YOLOv10, YOLOv11, DETR, and the improved YOLOv11 with CBAM on the EF-Data dataset. A custom non-linear transformation is applied to the recall axis in the PR curve to emphasize differences in the low-recall region, while the F1 score curves use the original linear scale.
The detection performance of DETR, YOLOv5, YOLOv6, YOLOv8, YOLOv10, YOLOv11, and the improved YOLOv11 on flammable and explosive objects is summarized in Table 4, which presents a comparison of these models on the EF-Data dataset in terms of precision, recall, mAP, FPS, FLOPs, and parameter count. The improved YOLOv11 (YOLOv11-CBAM) achieves an improvement of 1.5 percentage points in mAP@0.5 over the original YOLOv11 (from 0.885 to 0.900), while inference speed decreases slightly from 191.62 to 189.43 FPS (a relative reduction of approximately 1.1%), indicating minimal computational overhead. These results suggest that integrating CBAM enhances detection accuracy with minimal impact on inference speed, demonstrating a favorable trade-off between performance and computational cost.
Table 4.
Comparison of different state-of-the-art algorithms on the EF-Data dataset.
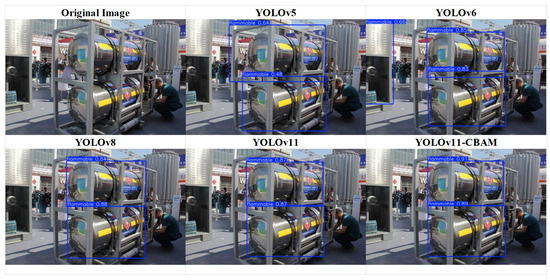
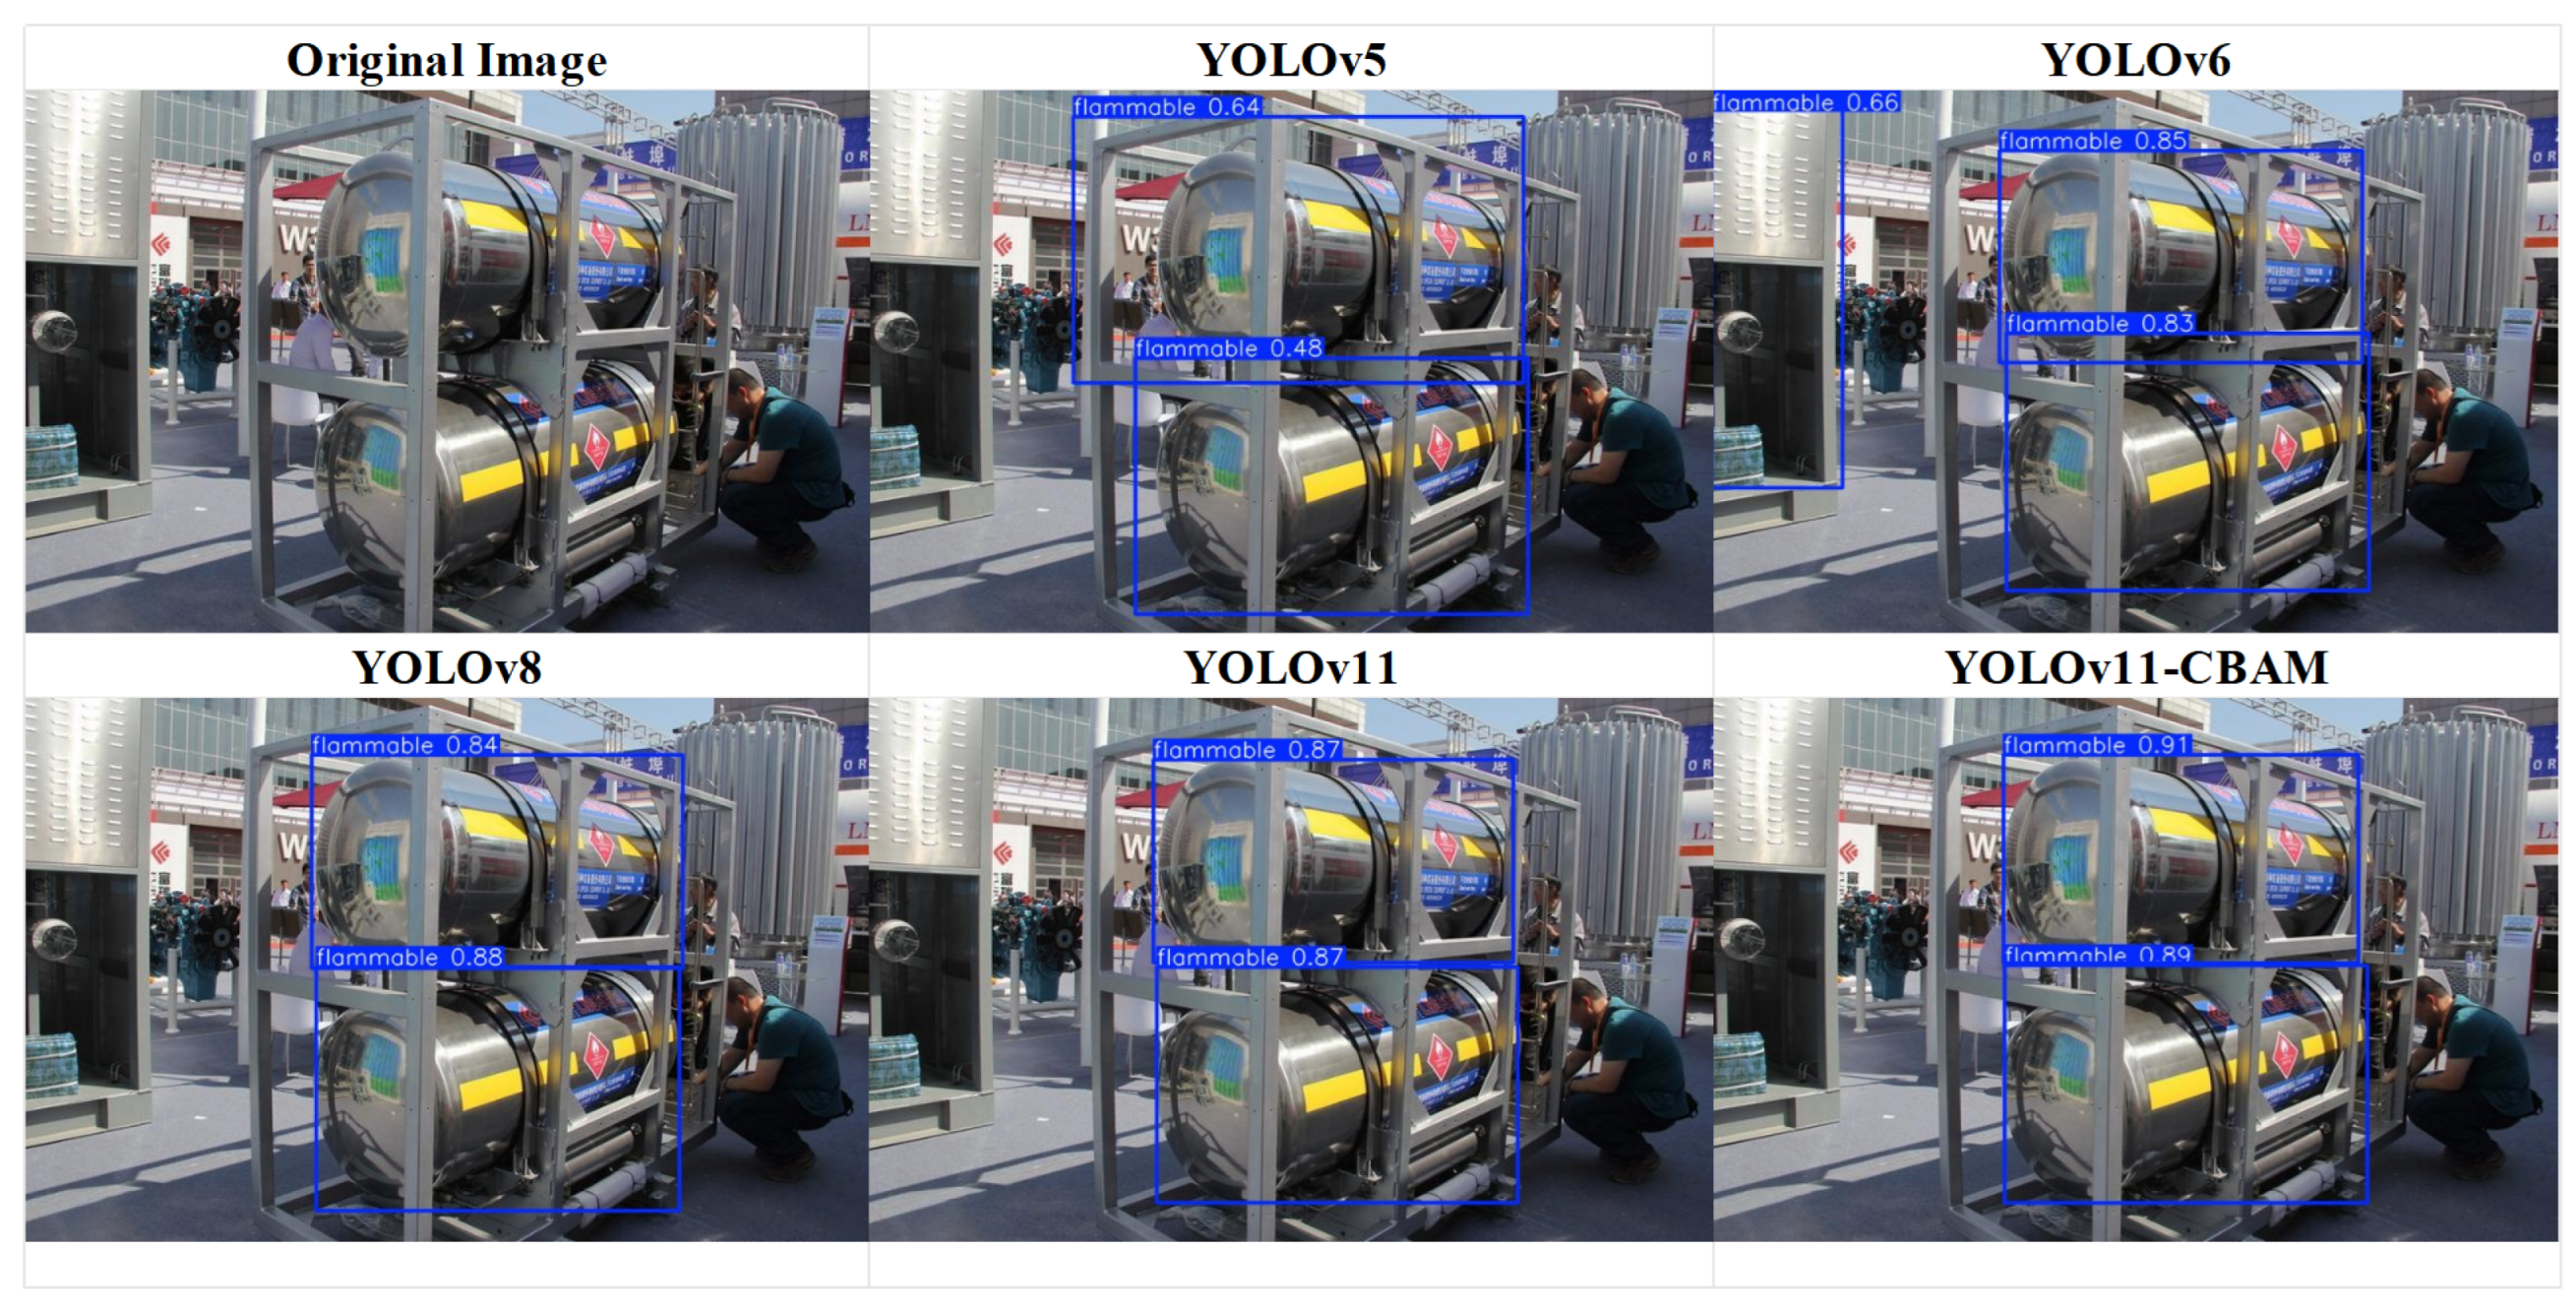
Figure 8 shows selected prediction results on the EF-Data dataset. Numbers on each bounding box represent the model’s confidence in the presence of flammable and explosive objects, with values near 1 indicating high confidence. YOLOv11-CBAM produces more accurate bounding boxes and reduces false detections, confirming the stability and reliability of its predictions. Overall, the improved model achieves superior detection performance while maintaining inference efficiency, demonstrating its advantage over the original YOLOv11 on the EF-Data dataset.
Figure 8.
Comparison of visual outputs between YOLOv5, YOLOv6, YOLOv8, YOLOv11, and YOLOv11-CBAM.
5.5. Visualization Experiments
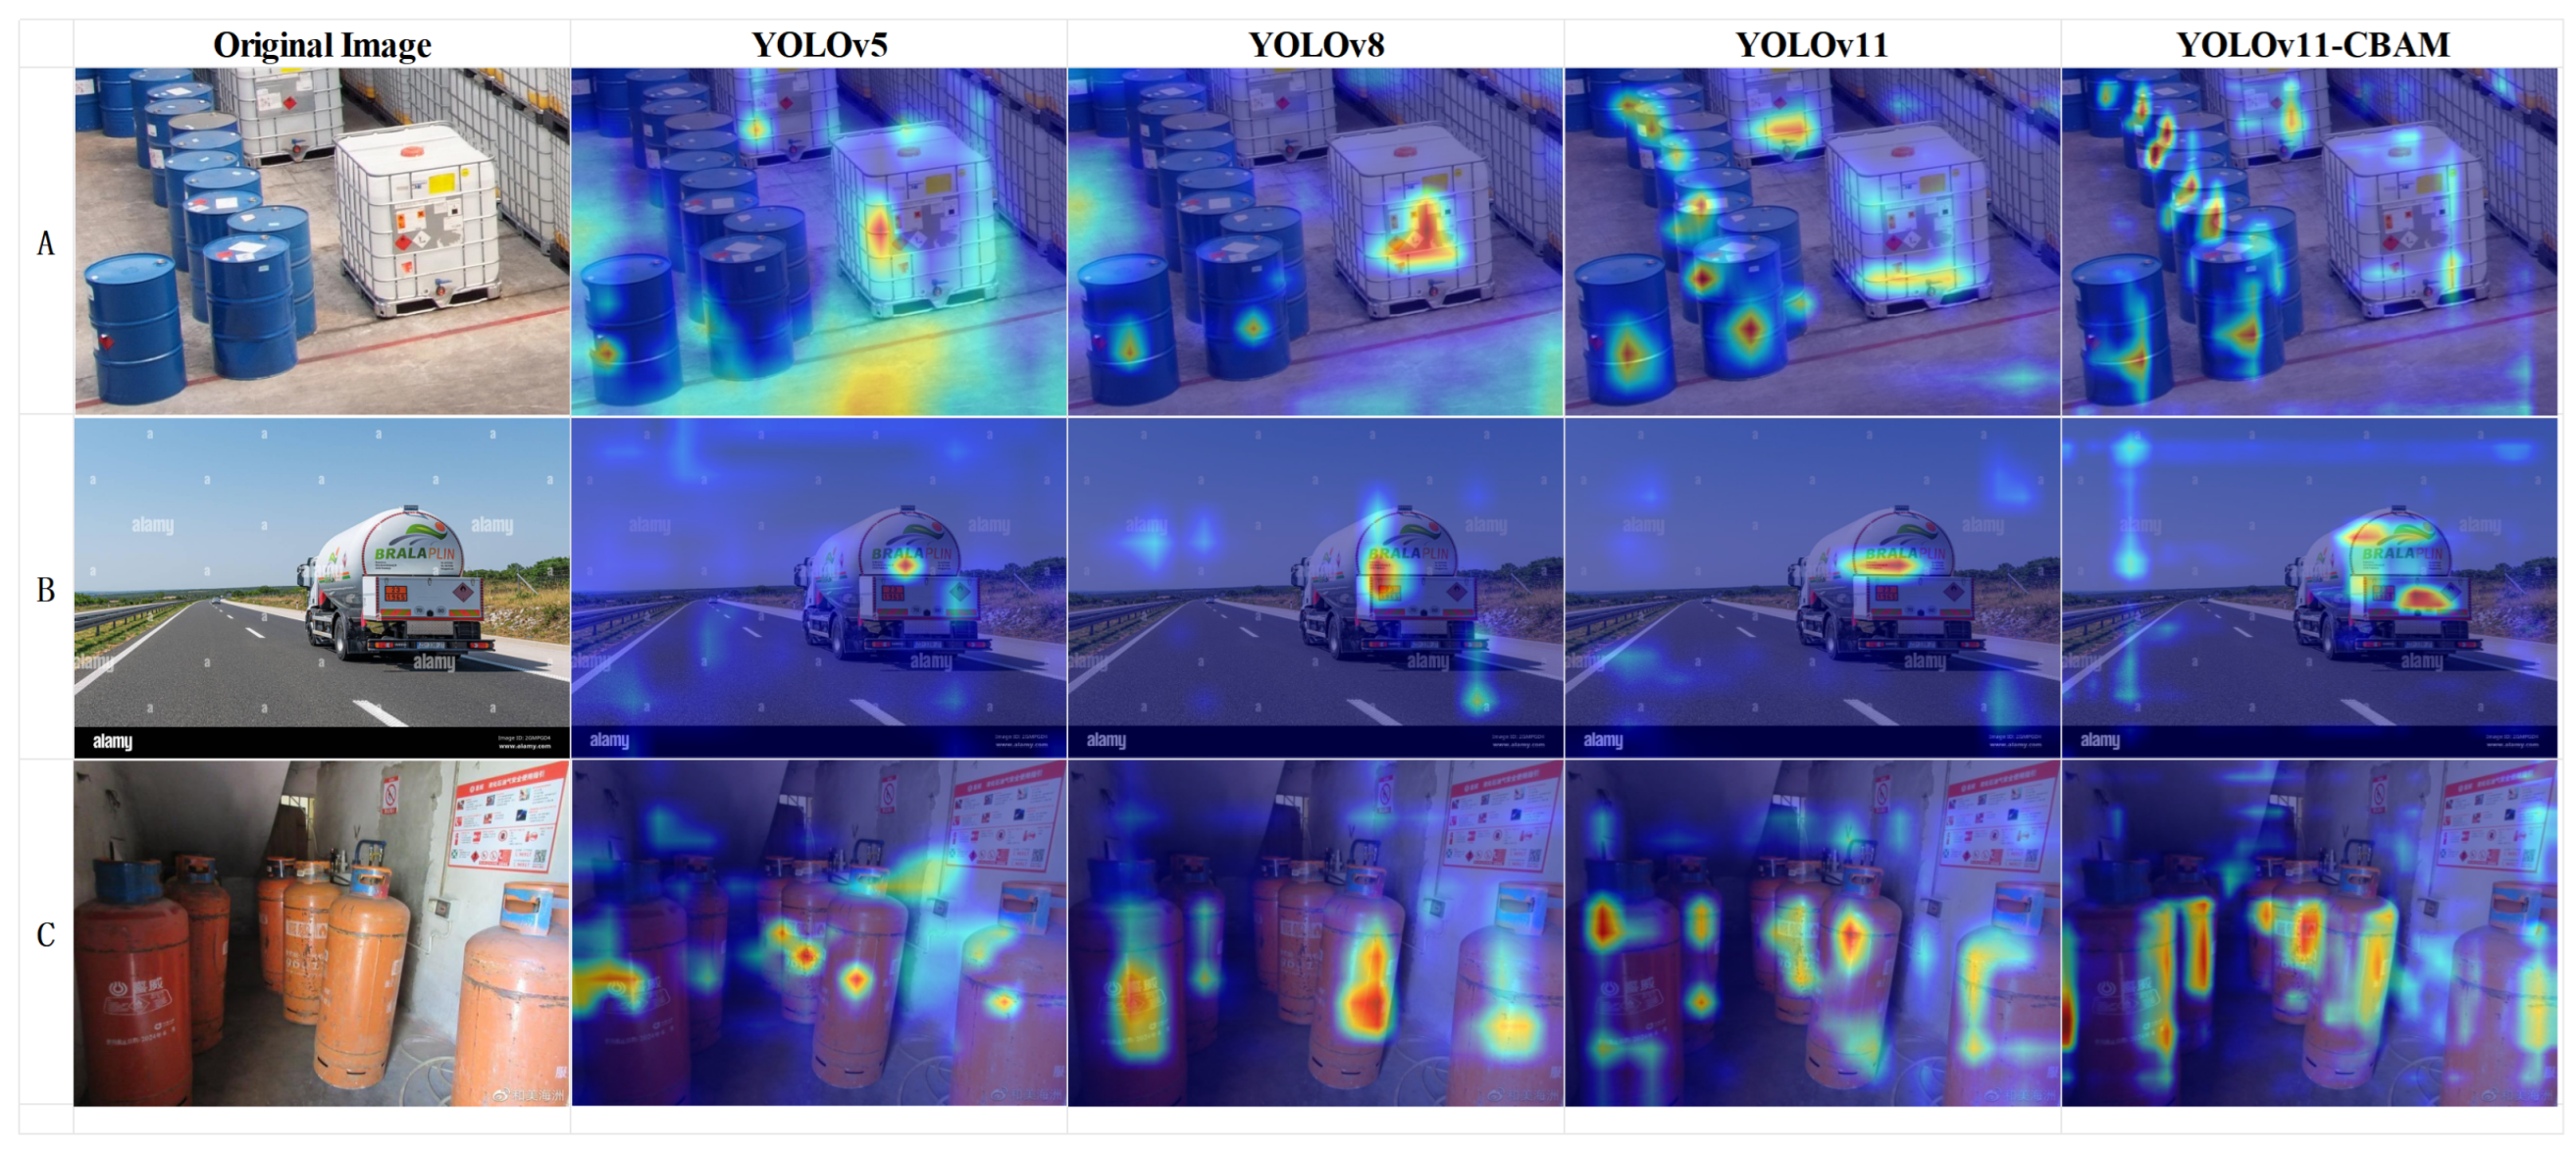
To further analyze the model’s attention distribution on detected targets, this study utilized Grad-CAM (Gradient-weighted Class Activation Mapping) [53] technology for feature response visualization. This technique generates heatmaps by backpropagating gradient information, visually presenting the decision weights the neural network assigns to different regions of the input image. In detection tasks, if the model effectively detects flammable and explosive objects, the corresponding heatmap will show significant color intensity differences—areas with higher color saturation (red regions) indicate that the model has more thoroughly extracted semantic features from those regions.
Additionally, the model performance was evaluated through multi-scenario comparative experiments, systematically validating YOLOv5, YOLOv8, YOLOv11, and the improved YOLOv11-CBAM. Figure 9 presents typical qualitative detection results across three representative scenarios: (A) industrial environment, (B) vehicle environment, and (C) residential environment. In scenario (A), the proposed YOLOv11-CBAM successfully detects a concealed gasoline canister that the other models fail to detect accurately due to occlusion. In scenario (B), YOLOv11-CBAM demonstrates clear advantages in recognizing multiple objects, including an oil tank and a gasoline container, highlighting its improved capability for capturing geometric features. In scenario (C), while all models can localize the gas cylinder, YOLOv11-CBAM achieves significantly higher detection confidence. These examples illustrate that the integration of CBAM effectively enhances the model’s ability to focus on critical regions, thereby reducing missed detections in complex real-world conditions.
Figure 9.
The figure shows a comparison of the Grad-CAM results between YOLOv5, YOLOv8, YOLOv11, and YOLOv11-CBAM. The darker the color in the image, the greater the contribution of that area to the detection result. (A) Industrial environment image. (B) Vehicle environment image. (C) Residential environment.
To quantitatively evaluate the spatial alignment between the model’s visual focus and the actual targets, this study introduces a customized metric tailored specifically for heatmap analysis, which we explicitly term the Peak-to-Center Distance (PCD). Distinct from standard bounding box regression metrics utilized in generic object detection benchmarks, the PCD strictly measures the spatial deviation between the coordinate of maximum response within the Grad-CAM activation map and the geometric center of the ground-truth object. The PCD is defined as follows:
In this formula, denotes the coordinates of the maximum response point in the activation map, while represents the center coordinates of the ground truth bounding box.
Table 5 summarizes the average PCD of different models across three scenarios. The results show that YOLOv11-CBAM achieves an average PCD of 249.42 px, 34.47 px, and 147.48 px in industrial, vehicle, and residential scenes, respectively, demonstrating more stable and accurate target localization compared to other models. The reduction in PCD is particularly notable in residential environments. Both quantitative and qualitative analyses confirm that YOLOv11-CBAM exhibits more precise attention distribution across diverse scenarios, indicating that the CBAM module effectively enhances the model’s feature focusing capability.
Table 5.
Average Peak-to-Center Distance (PCD) of Different Models across Three Scenarios. Here, PCD denotes the average spatial deviation between the heatmap peak and the ground-truth center. (A): Industrial environment images. (B): Vehicle environment images. (C): Residential environment images.
5.6. Cross-Domain Generalization and Robustness
To evaluate the generalization capability of the improved YOLOv11-CBAM model during training and its robustness in unseen environments, this section conducts assessments from two perspectives: training process analysis and cross-domain experiments.
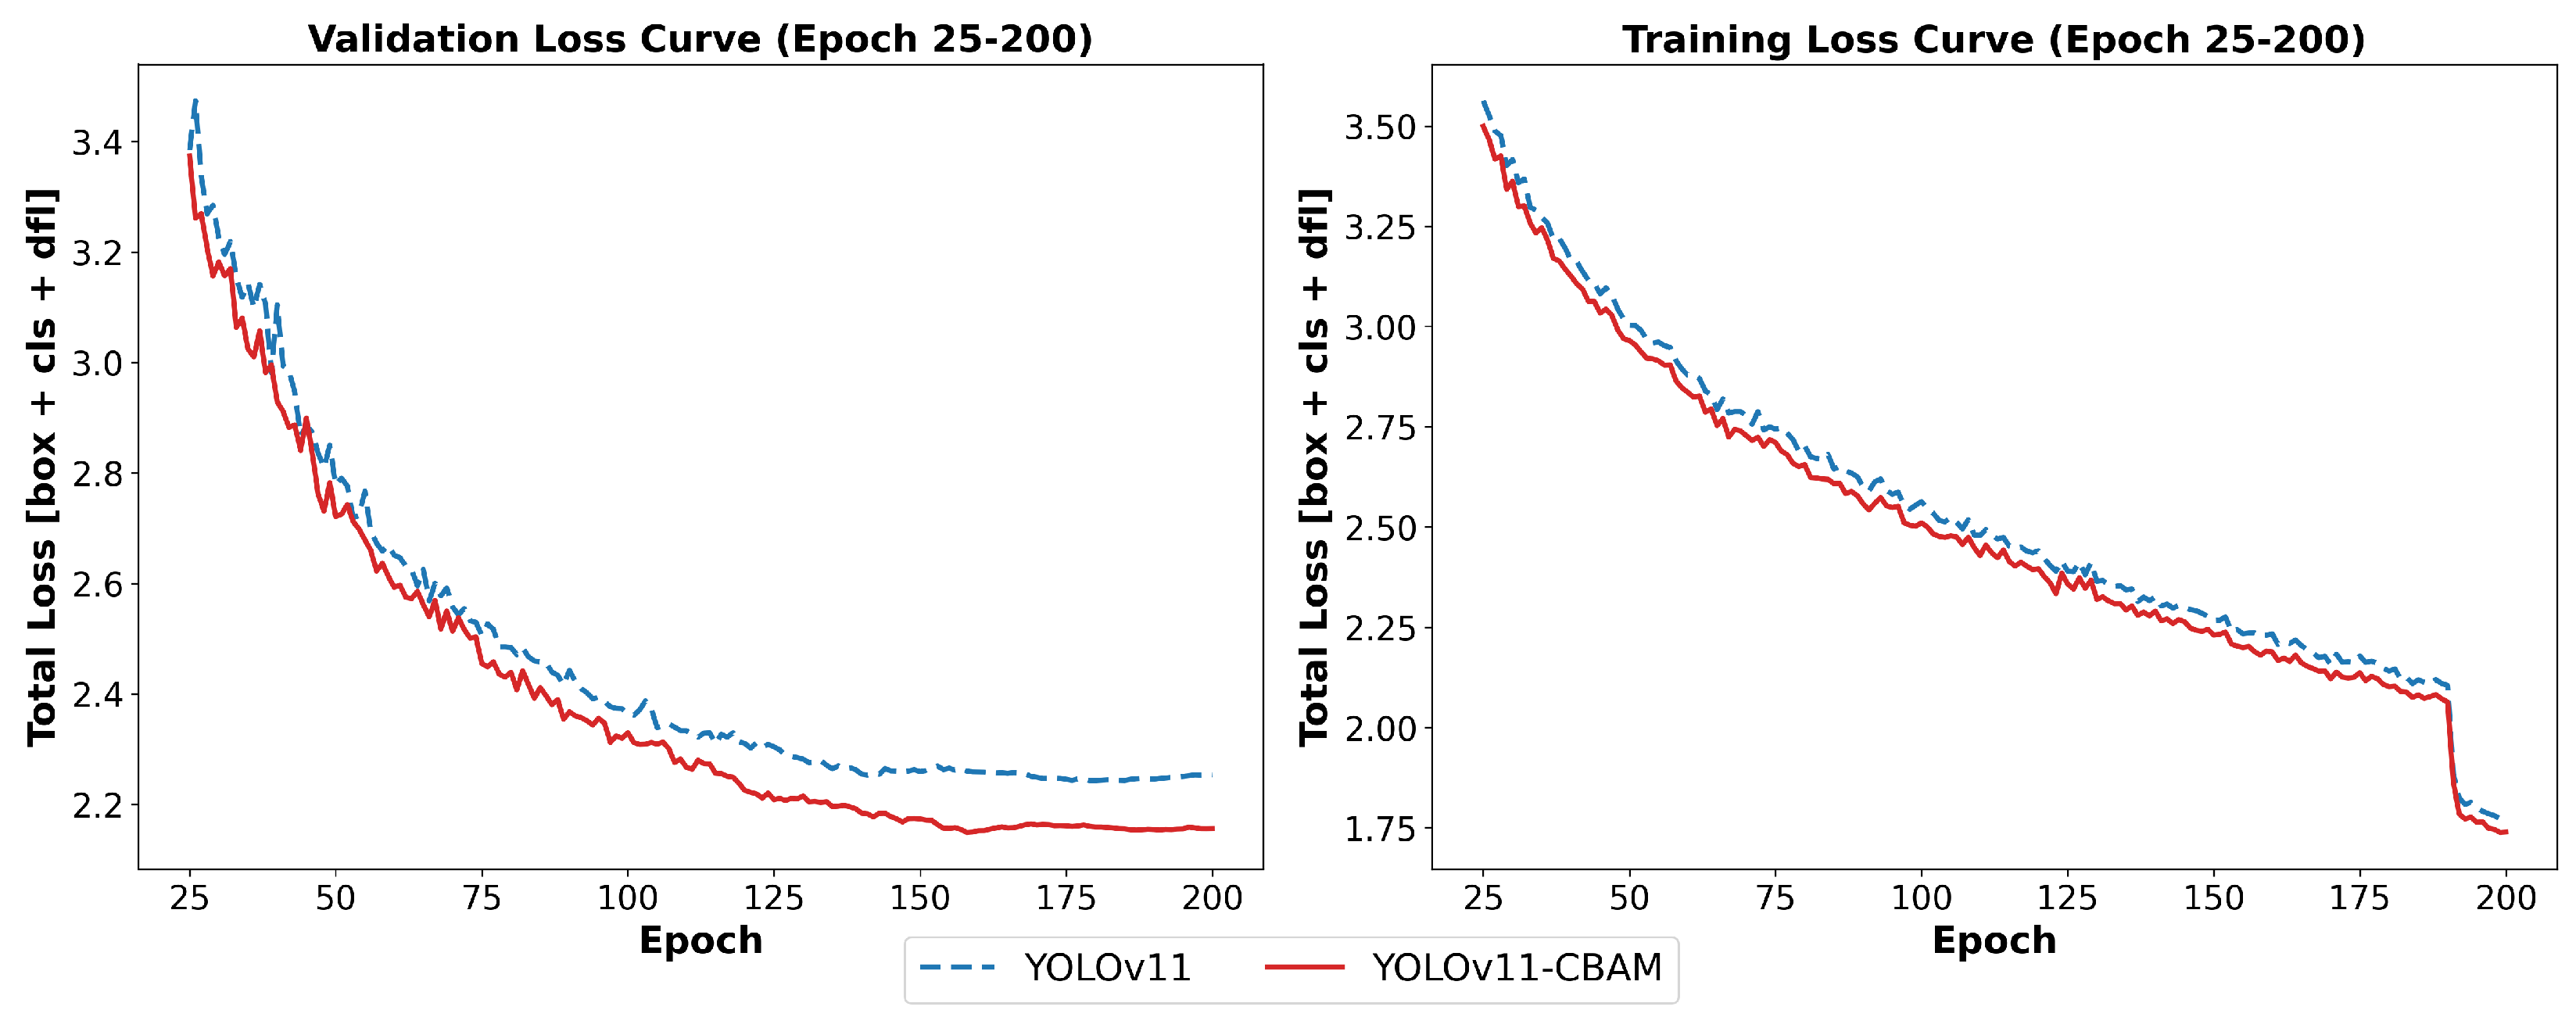
During training, we compared the total loss curves of the original YOLOv11 and the improved YOLOv11-CBAM on both the training and validation sets. As illustrated in Figure 10, the trends of training loss and validation loss are shown, with epochs 25–200 highlighted to emphasize the model’s performance in the stable training phase. The training loss gradually decreases with increasing epochs, while the validation loss follows a consistent trend without significant divergence or escalation, indicating that the model effectively learns data representations and no obvious overfitting was observed. Moreover, YOLOv11-CBAM exhibits a markedly faster convergence rate and consistently lower validation loss than the original YOLOv11, demonstrating that the introduction of the CBAM attention mechanism enhances both feature representation capability and training stability.
Figure 10.
Training and Validation Loss Curves of YOLOv11 and YOLOv11-CBAM.
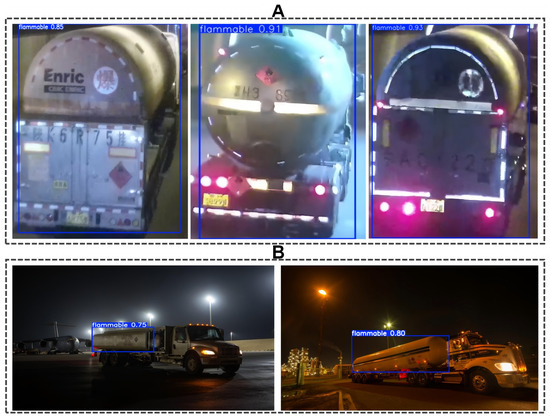
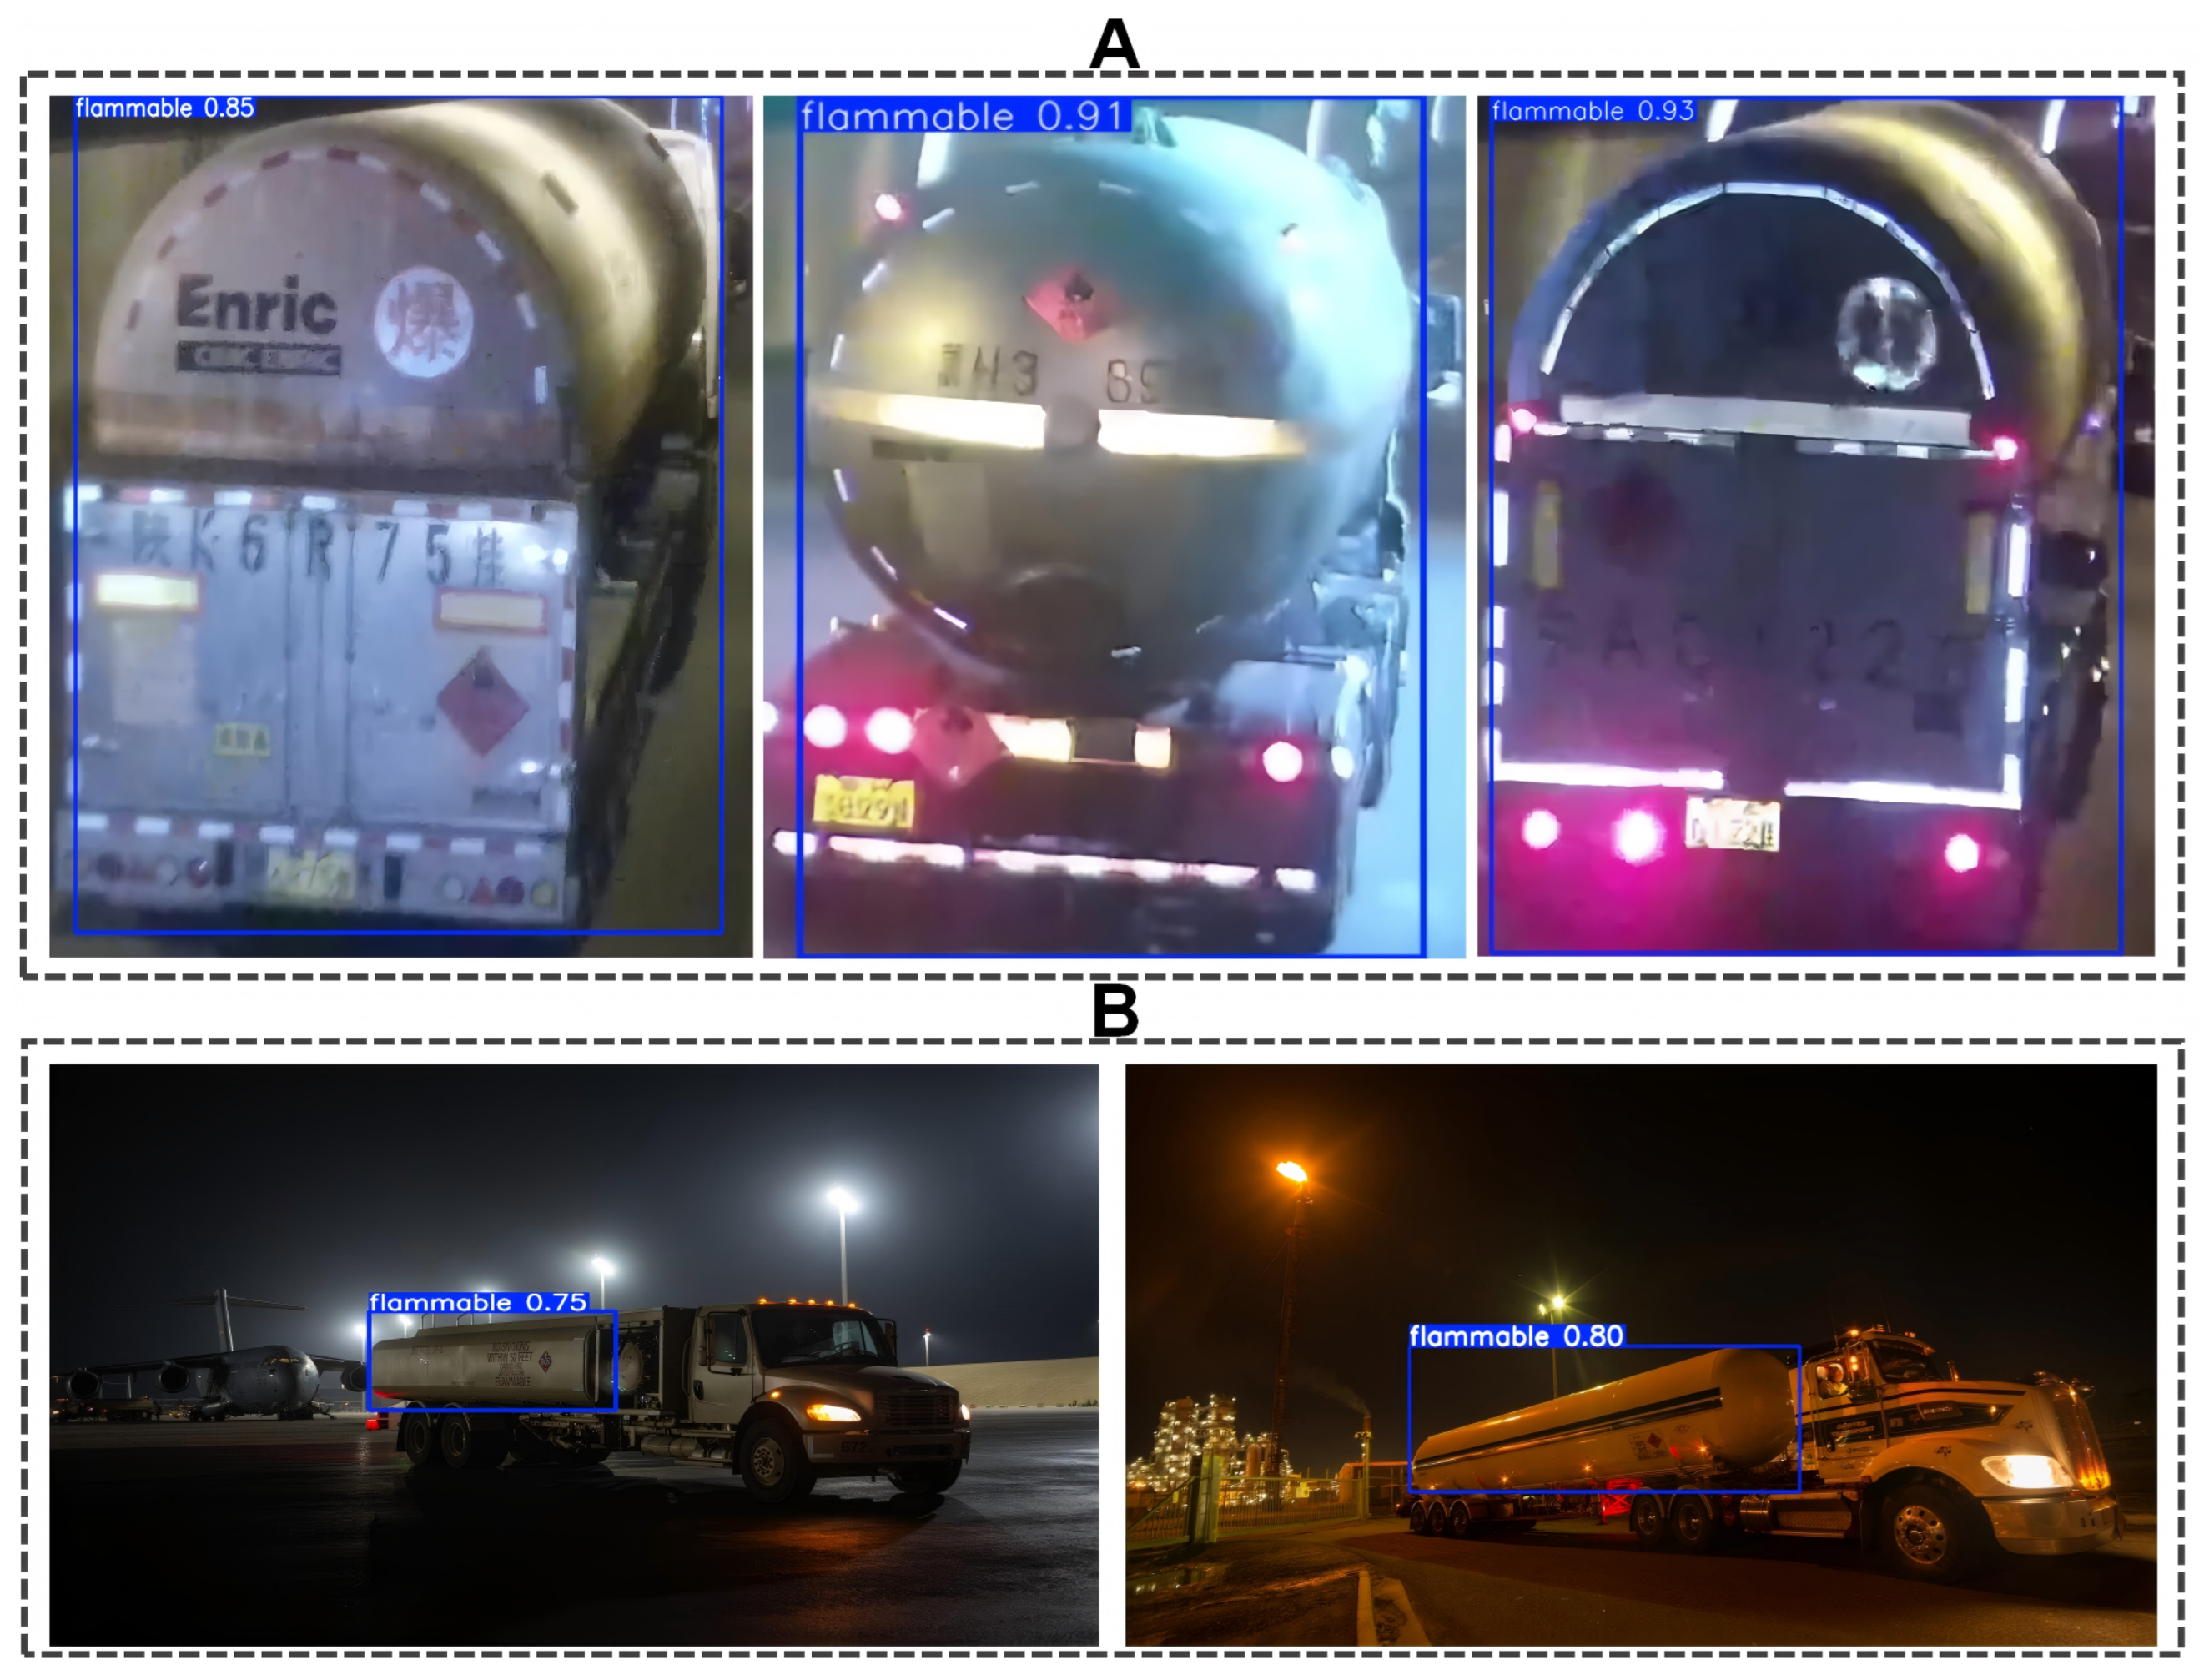
To further assess the model’s generalization capability under varying illumination conditions and complex environments, cross-domain evaluations were conducted on two external datasets. External Test Set A was derived from the public VisInt-THV-ReID dataset [54], which contains images of transport vehicles captured in low-light tunnel environments with motion blur. Since the original dataset lacks annotation information, representative samples were selected and manually labeled by our team following the EF-Data annotation protocol, with multiple rounds of verification to ensure labeling accuracy and consistency. External Test Set B is a self-collected nighttime multi-scene dataset covering tunnels, highways, and urban streets. It was annotated by our team under a unified standard with rigorous quality control procedures. Both external datasets were excluded from model training and were used solely to evaluate cross-domain detection performance. The statistical information of these datasets is summarized in Table 6.
Table 6.
Statistics of external test sets. External Test Set A is selected from the publicly available VisInt-THV-ReID hazardous chemical transportation vehicle dataset (tunnel and low-light environments), while External Test Set B is a self-collected dataset captured under various nighttime scenes.
The inference results on the external test sets are presented in Table 7. Compared with the original YOLOv11, the proposed YOLOv11-CBAM model achieved substantial improvements across all key metrics. In the low-light and motion-blurred tunnel dataset (External Test Set A), the Precision increased by approximately 9.8 percentage points (from 0.680 to 0.778), and the mAP@0.5 improved by 6.8 percentage points (from 0.623 to 0.691), demonstrating that the CBAM module effectively enhances the feature representation of dim and blurred targets. In the self-collected nighttime multi-scene dataset (External Test Set B), both models maintained high detection accuracy, while YOLOv11-CBAM still exhibited moderate gains in Precision and mAP@0.5:0.95, providing additional evidence of its adaptability to unseen environments.
Table 7.
Experimental results of original and improved models on different external datasets.
Figure 11 presents the detection visualization results on representative tunnel and nighttime multi-scene images. It can be clearly observed that the proposed model maintains accurate localization even under extreme conditions such as low illumination and motion blur. Combining the external testing outcomes with the visual analysis, the proposed YOLOv11-CBAM demonstrates reliable adaptability to unseen environments. Although the small scale of the external test sets (100 images each) inherently restrains the statistical power of broader generalization claims, the consistent detection performance across these challenging samples provides preliminary evidence of the model’s cross-domain adaptability.
Figure 11.
Visualization of detection results of the improved YOLOv11 model on the generalization experiment datasets. (A) Detection examples from the publicly available complex environment dataset; (B) Detection examples from the self-collected hazardous chemical transportation vehicle dataset.
5.7. Discussion
The EF-Data dataset, constructed primarily from web-sourced images, contains only a single category of flammable and explosive objects and is designed to support research on an improved YOLOv11 framework for flammable and explosive object detection. It is planned to be publicly released via Zenodo with a DOI to ensure experimental reproducibility. However, relying on web-sourced images inherently introduces image curation bias (e.g., targets are often well-lit and centrally framed) and a domain mismatch with actual surveillance imagery (e.g., top-down angles and severe occlusions). Despite our efforts to mitigate source concentration, these biases remain. Consequently, the lack of samples from highly complex real-world environments may limit the model’s generalization under conditions such as rain, fog, nighttime, or actual low-resolution surveillance.
Despite this, the enhanced YOLOv11 demonstrates strong practical potential. It can serve as the core visual perception module in emergency monitoring systems, enabling continuous, automated surveillance of chemical production sites, as well as the storage and transportation processes of flammable and explosive objects, thereby facilitating early risk detection and improving warning and response efficiency. Moreover, by integrating with city-level Emergency Management Systems (EMSs), the framework supports dynamic hazard perception and informatized regulation, aligning with prior studies that highlight the value of deep learning-based object detection in urban emergencies, hazardous chemical management, and intelligent emergency command [55].
Future work will focus on three directions:
- Efficiency optimization to improve inference speed and resource utilization for high-frequency monitoring.
- The dataset will be further expanded. Although the current dataset includes representative hazardous targets such as oil drums and gas cylinders, all instances are categorized under a single class, flammable and explosive objects, without finer-grained distinctions. Future work will incorporate multi-class annotations and samples from real industrial monitoring scenarios—specifically targeting extreme conditions such as rain, fog, nighttime, and actual low-resolution surveillance—to construct a more diverse dataset, thereby supporting complex classification tasks and fine-grained safety monitoring, while optimizing the model to better handle extreme edge cases such as very small objects and severe multi-label occlusions.
- Model lightweighting through compression and structural optimization for deployment on resource-constrained edge devices, such as mobile inspection robots or drones.
These developments are expected to enhance detection accuracy, robustness, and practical applicability across diverse and heterogeneous environments.
6. Conclusions
The detection of flammable and explosive objects is crucial for industrial safety. Traditional methods rely on manual inspections and rule-based algorithms, which are inefficient and susceptible to subjective bias. With the advancement of deep learning, automated detection has become the key to improving both accuracy and efficiency. This study proposes an improved YOLOv11-based algorithm for detecting flammable and explosive objects. The dataset includes images of various objects, such as gas cylinders, gasoline barrels, and flammable chemicals, in different scenarios. To enhance detection performance, we integrate the CBAM attention mechanism with YOLOv11, improving the model’s detection accuracy with an absolute increase of 1.5 percentage points in mAP@0.5 compared to the original YOLOv11 model.
Experimental results show that the improved YOLOv11 accurately detects various flammable and explosive objects in complex backgrounds and occlusion scenarios, demonstrating higher robustness and detection accuracy. It achieves higher mAP@0.5 than YOLOv5, YOLOv6, YOLOv8, and other evaluated baseline models on the EF-Data dataset. However, while the CBAM attention mechanism enhances target focus, it increases computational complexity, resulting in a slight decrease in detection speed. Future work will focus on optimizing inference efficiency and detection speed to meet the demands of real-time applications.
Author Contributions
Conceptualization, Y.D. and Y.S.; methodology, Y.D.; software, Y.D.; validation, Y.D. and L.L.; formal analysis, Y.D.; investigation, Y.D.; resources, Y.S., X.X. and S.L.; data curation, Y.D.; writing—original draft preparation, Y.D.; writing—review and editing, L.L., S.L. and Y.S.; visualization, Y.D.; supervision, Y.S., X.X. and S.L.; project administration, Y.S.; funding acquisition, Y.S. and X.X. All authors have read and agreed to the published version of the manuscript.
Funding
This work was supported in part by the Guangxi Key Research and Development Program (Grant No. Guike AB23026004) and in part by the Guangxi Science and Technology Base and Talent Special Project (Grant No. Guike AD24010012). The funders had no role in the design of the study, data collection and analysis, decision to publish, or preparation of the manuscript.
Institutional Review Board Statement
Not applicable.
Informed Consent Statement
Not applicable.
Data Availability Statement
The dataset EF-Data supporting the findings of this study is available from the corresponding author upon reasonable request. This dedicated dataset for flammable and explosive object detection will be publicly released via the Zenodo open data platform with the DOI https://doi.org/10.5281/zenodo.15560776 after the publication of the present article.
Acknowledgments
The authors thank the anonymous reviewers for their valuable comments and suggestions.
Conflicts of Interest
The authors declare no conflicts of interest.
Abbreviations
The following abbreviations are used in this manuscript:
| YOLO | You Only Look Once |
| CNN | Convolutional Neural Network |
| mAP | mean Average Precision |
| FPS | Frames Per Second |
References
- Liang, H.Y.; Yan, T.; Zhao, W.W. Comprehensive Assessment of Recent Major Chemical Accidents in China and Path to Sustainable Solutions. Smart Constr. Sustain. Cities 2024, 2, 1. [Google Scholar] [CrossRef] [Scilit]
- Jung, S.; Woo, J.; Kang, C. Analysis of Severe Industrial Accidents Caused by Hazardous Chemicals in South Korea from January 2008 to June 2018. Saf. Sci. 2020, 124, 104580. [Google Scholar] [CrossRef] [Scilit]
- Yang, J.; Li, F.; Zhou, J.; Zhang, L.; Huang, L.; Bi, J. A Survey on Hazardous Materials Accidents During Road Transport in China from 2000 to 2008. J. Hazard. Mater. 2010, 184, 647–653. [Google Scholar] [CrossRef] [Scilit] [PubMed]
- Erkut, E.; Tjandra, S.A.; Verter, V. Hazardous Materials Transportation. In Transportation; Handbooks in Operations Research and Management Science; Elsevier: New York, NY, USA, 2007; Volume 14, pp. 539–621. [Google Scholar] [CrossRef] [Scilit]
- Wang, B.; Li, D.; Wu, C. Characteristics of Hazardous Chemical Accidents During Hot Season in China from 1989 to 2019: A Statistical Investigation. Saf. Sci. 2020, 129, 104788. [Google Scholar] [CrossRef] [Scilit]
- Yang, J.F.; Wang, P.C.; Liu, X.Y.; Bian, M.C.; Chen, L.C.; Lv, S.Y.; Tao, J.F.; Suo, G.Y.; Xuan, S.Q.; Li, R.; et al. Analysis on Causes of Chemical Industry Accident from 2015 to 2020 in Chinese Mainland: A Complex Network Theory Approach. J. Loss Prev. Process Ind. 2023, 83, 105061. [Google Scholar] [CrossRef] [Scilit]
- Teng, M.C.; Ke, S.S. Disaster Impact Assessment of Underground Hazardous Materials Pipelines. J. Loss Prev. Process Ind. 2021, 71, 104486. [Google Scholar] [CrossRef] [Scilit]
- Garg, P.; Chowdhury, D.R.; More, V.N. Traffic Sign Recognition and Classification Using YOLOv2, Faster R-CNN, and SSD. In Proceedings of the 2019 10th International Conference on Computing, Communication and Networking Technologies (ICCCNT), Kanpur, India, 6–8 July 2019; pp. 1–5. [Google Scholar] [CrossRef] [Scilit]
- Saadna, Y.; Behloul, A. An overview of traffic sign detection and classification methods. Int. J. Multimed. Inf. Retr. 2017, 6, 193–210. [Google Scholar] [CrossRef] [Scilit]
- Zhang, J.; Zou, X.; Kuang, L.D.; Wang, J.; Sherratt, R.S.; Yu, X. CCTSDB 2021: A More Comprehensive Traffic Sign Detection Benchmark. Hum.-Centric Comput. Inf. Sci. 2022, 12, 23. [Google Scholar] [CrossRef]
- Parra, A.; Zhao, B.; Haddad, A.; Boutin, M.; Delp, E.J. Hazardous Material Sign Detection and Recognition. In Proceedings of the 2013 IEEE International Conference on Image Processing (ICIP); IEEE: New York, NY, USA, 2013; pp. 2640–2644. [Google Scholar] [CrossRef] [Scilit]
- Ran, S.; Weise, T.; Wu, Z. Chemical Safety Sign Detection: A Survey and Benchmark. In Proceedings of the 2022 International Joint Conference on Neural Networks (IJCNN); IEEE: New York, NY, USA, 2022; pp. 1–7. [Google Scholar] [CrossRef] [Scilit]
- Carion, N.; Massa, F.; Synnaeve, G.; Usunier, N.; Kirillov, A.; Zagoruyko, S. End-to-end Object Detection with Transformers. In Proceedings of the Lecture Notes in Computer Science; Springer International Publishing: Cham, Switzerland, 2020; pp. 213–229. [Google Scholar] [CrossRef] [Scilit]
- Ultralytics. YOLOv5. GitHub Repository. 2020. Available online: https://github.com/ultralytics/yolov5 (accessed on 1 January 2023).
- Li, C.; Li, L.; Jiang, H.; Weng, K.; Geng, Y.; Li, L.; Ke, Z.; Li, Q.; Cheng, M.; Nie, W.; et al. YOLOv6: A Single-Stage Object Detection Framework for Industrial Applications. arXiv 2022, arXiv:2209.02976. [Google Scholar] [CrossRef] [Scilit]
- Jocher, G.; Chaurasia, A.; Qiu, J. YOLO by Ultralytics. 2023. Available online: https://github.com/ultralytics/ultralytics (accessed on 12 January 2023).
- Wang, A.; Chen, H.; Liu, L.; Chen, K.; Lin, Z.; Han, J.; Ding, G. YOLOv10: Real-time End-to-End Object Detection. arXiv 2024, arXiv:2405.14458. [Google Scholar]
- Khanam, R.; Hussain, M. YOLOv11: An Overview of the Key Architectural Enhancements. arXiv 2024, arXiv:2410.17725. [Google Scholar] [CrossRef] [Scilit]
- Woo, S.; Park, J.; Lee, J.Y.; Kweon, I.S. CBAM: Convolutional Block Attention Module. In Lecture Notes in Computer Science; Springer: Cham, Switzerland, 2018; Volume 11211, pp. 3–19. [Google Scholar] [CrossRef] [Scilit]
- Wu, F.; Zhu, R.; Meng, F.; Qiu, J.; Yang, X.; Li, J.; Zou, X. An Enhanced Cycle Generative Adversarial Network Approach for Nighttime Pineapple Detection of Automated Harvesting Robots. Agronomy 2024, 14, 3002. [Google Scholar] [CrossRef] [Scilit]
- Jerzak, W.; Wądrzyk, M.; Sieradzka, M.; Magdziarz, A. Valorisation of tyre waste from a vulcanisation plant by catalytic pyrolysis—Experimental investigations using pyrolysis–gas chromatography–mass spectrometry and drop-tube–fixed-bed reactor. Energy Convers. Manag. 2024, 313, 118642. [Google Scholar] [CrossRef] [Scilit]
- Wang, H.; Zhong, L.; Su, W.; Ruan, T.; Jiang, G. Machine learning-assisted identification of environmental pollutants by liquid chromatography coupled with high-resolution mass spectrometry. TrAC Trends Anal. Chem. 2024, 180, 117988. [Google Scholar] [CrossRef] [Scilit]
- Skedung, L.; Savvidou, E.; Schellenberger, S.; Reimann, A.; Cousins, I.T.; Benskin, J.P. Identification and quantification of fluorinated polymers in consumer products by combustion ion chromatography and pyrolysis-gas chromatography-mass spectrometry. Environ. Sci. Process. Impacts 2024, 26, 82–93. [Google Scholar] [CrossRef] [Scilit] [PubMed]
- Frazier, J.; Benefield, V.; Zhang, M. Practical Investigation of Direct Analysis in Real Time Mass Spectrometry for Fast Screening of Explosives. Forensic Chem. 2020, 18, 100233. [Google Scholar] [CrossRef] [Scilit]
- Bracht, C.; Preitschopf, T.; Schöneich, M.; Neff, T.; Kallfaß, C.; Finze, M. Influence of Crucible Types on Thermal Stability Analysis of Li-Ion Battery Components by Thermogravimetric Analysis–Differential Scanning Calorimetry. Energy Technol. 2024, 12, 2400365. [Google Scholar] [CrossRef] [Scilit]
- Di, H.; Wang, Q.; Sun, B.; Sun, M. Reactivity and Catalytic Effect of Coals During Combustion: Thermogravimetric Analysis. Energy 2024, 291, 130353. [Google Scholar] [CrossRef] [Scilit]
- Głowacki, A.; Rybiński, P.; Czerwonka, G.; Żukowski, W.; Mirkhodjaev, U.Z.; Żelezik, M. Flammability, Toxicity, and Microbiological Properties of Polyurethane Flexible Foams. Materials 2024, 17, 3517. [Google Scholar] [CrossRef] [Scilit]
- Savchenko, V.; Eckert, S.; Fondell, M.; Mitzner, R.; da Cruz, V.V.; Föhlisch, A. Electronic Structure, Bonding and Stability of Fumarate, Maleate, and Succinate Dianions from X-ray Spectroscopy. Phys. Chem. Chem. Phys. 2024, 26, 2304–2311. [Google Scholar] [CrossRef] [Scilit]
- Zak, A.K.; Hashim, A.M.; Esmaeilzadeh, J. Role of CeO2 and Calcination Temperature on the Structural and Optical Properties of (ZnO)1-x/(CeO2)x Nanocomposites in the UV–Visible Region. Ceram. Int. 2024, 50, 4167–4177. [Google Scholar] [CrossRef] [Scilit]
- Bunaciu, A.A.; Vu, D.H.; Aboul-Enein, H.Y. Edible oil discrimination by Fourier transform infrared (FTIR) spectroscopy and chemometrics. Anal. Lett. 2023, 57, 445–455. [Google Scholar] [CrossRef] [Scilit]
- Zeng, Q.; Cheng, Z.; Li, L.; Yang, Y.; Peng, Y.; Zhou, X.; Zhang, D.; Hu, X.; Liu, C.; Chen, X. Quantitative analysis of the quality constituents of Lonicera japonica Thunberg based on Raman spectroscopy. Food Chem. 2024, 443, 138513. [Google Scholar] [CrossRef] [Scilit]
- Shoji, Y.; Ohmichi, E.; Takahashi, H.; Ohta, H. Rapid-scan broadband frequency-domain terahertz spectroscopy via dynamic optical phase lock. Appl. Phys. Lett. 2024, 125, 031102. [Google Scholar] [CrossRef] [Scilit]
- Pastor, K.; Ilić, M.; Vujić, D.; Ačanski, M.; Kravić, S.; Stojanović, Z.; Đurović, A. Gas chromatography and mass spectrometry: The technique. In Emerging Food Authentication Methodologies Using GC/MS; Springer: Cham, Switzerland, 2023; pp. 3–31. [Google Scholar] [CrossRef] [Scilit]
- Zhang, H.; Ye, W.; Zhao, X.; Teng, R.K.; Pan, X. A novel convolutional recurrent neural network based algorithm for fast gas recognition in Electronic nose system. In Proceedings of the 2018 IEEE International Conference on Electron Devices and Solid State Circuits (EDSSC); IEEE: New York, NY, USA, 2018; pp. 1–2. [Google Scholar] [CrossRef] [Scilit]
- Zhao, W.; Wang, X.; Li, W.; Peng, X.; Feng, P.; Duan, S.; Wang, L.; Chu, J. Fast identification of flammable chemicals based on Broad Learning System. Process Saf. Environ. Prot. 2024, 191, 1181–1192. [Google Scholar] [CrossRef] [Scilit]
- Cai, J.; Hou, J.; Lu, Y.; Chen, H.; Kneip, L.; Schwertfeger, S. Improving CNN-Based Planar Object Detection with Geometric Prior Knowledge. In Proceedings of the 2020 IEEE International Symposium on Safety, Security, and Rescue Robotics (SSRR); IEEE: New York, NY, USA, 2020; pp. 387–393. [Google Scholar] [CrossRef] [Scilit]
- Sharifi, A.; Zibaei, A.; Rezaei, M. A deep learning based hazardous materials (HAZMAT) sign detection robot with restricted computational resources. Mach. Learn. Appl. 2021, 6, 100104. [Google Scholar] [CrossRef] [Scilit]
- Jiao, L.; Zhang, F.; Liu, F.; Yang, S.; Li, L.; Feng, Z.; Qu, R. A Survey of Deep Learning-Based Object Detection. IEEE Access 2019, 7, 128837–128868. [Google Scholar] [CrossRef] [Scilit]
- Dhiraj; Jain, D.K. An Evaluation of Deep Learning Based Object Detection Strategies for Threat Object Detection in Baggage Security Imagery. Pattern Recognit. Lett. 2019, 120, 112–119. [Google Scholar] [CrossRef] [Scilit]
- Li, M.; Jia, T.; Wang, H.; Ma, B.; Lu, H.; Lin, S.; Cai, D.; Chen, D. AO-DETR: Anti-Overlapping DETR for X-Ray Prohibited Items Detection. IEEE Trans. Neural Netw. Learn. Syst. 2024, 36, 12076–12090. [Google Scholar] [CrossRef] [Scilit]
- Lin, T.Y.; Maire, M.; Belongie, S.; Hays, J.; Perona, P.; Ramanan, D.; Dollár, P.; Zitnick, C.L. Microsoft COCO: Common Objects in Context. In Computer Vision—ECCV 2014; Lecture Notes in Computer Science; Springer: Cham, Switzerland, 2014; Volume 8693, pp. 740–755. [Google Scholar] [CrossRef] [Scilit]
- Sazak, H.; Kotan, M. Automated Blood Cell Detection and Classification in Microscopic Images Using YOLOv11 and Optimized Weights. Diagnostics 2024, 15, 22. [Google Scholar] [CrossRef] [Scilit]
- Jegham, N.; Koh, C.Y.; Abdelatti, M.; Hendawi, A. YOLO Evolution: A Comprehensive Benchmark and Architectural Review of YOLOv12, YOLO11, and Their Previous Versions. arXiv 2024, arXiv:2411.00201. [Google Scholar]
- Zhou, K.; Jiang, S. Forest Fire Detection Algorithm Based on Improved YOLOv11n. Sensors 2025, 25, 2989. [Google Scholar] [CrossRef] [Scilit]
- Alif, M.A.R. YOLOv11 for Vehicle Detection: Advancements, Performance, and Applications in Intelligent Transportation Systems. arXiv 2024, arXiv:2410.22898. [Google Scholar] [CrossRef] [Scilit]
- Li, J.; Li, Y.; Xiao, Y.; Bai, Y. HDRANet: Hybrid Dilated Residual Attention Network for SAR Image Despeckling. Remote Sens. 2019, 11, 2921. [Google Scholar] [CrossRef] [Scilit]
- Yang, L.; Zhang, R.Y.; Li, L.; Xie, X. SimAM: A Simple, Parameter-Free Attention Module for Convolutional Neural Networks. In Proceedings of the 38th International Conference on Machine Learning (ICML); PMLR: Cambridge, MA, USA, 2021; pp. 11863–11874. [Google Scholar]
- Ouyang, D.; He, S.; Zhang, G.; Luo, M.; Guo, H.; Zhan, J.; Huang, Z. Efficient Multi-Scale Attention Module with Cross-Spatial Learning. In Proceedings of the ICASSP 2023—2023 IEEE International Conference on Acoustics, Speech and Signal Processing (ICASSP); IEEE: New York, NY, USA, 2023; pp. 1–5. [Google Scholar] [CrossRef] [Scilit]
- Yin, X.; Goudriaan, J.; Lantinga, E.A.; Vos, J.; Spiertz, H.J. A Flexible Sigmoid Function of Determinate Growth. Ann. Bot. 2003, 91, 361–371. [Google Scholar] [CrossRef] [Scilit]
- Hou, Q.; Zhou, M.; Feng, J. Coordinate Attention for Efficient Mobile Network Design. In Proceedings of the 2021 IEEE/CVF Conference on Computer Vision and Pattern Recognition (CVPR) 2021; IEEE: New York, NY, USA, 2021; pp. 13713–13722. [Google Scholar] [CrossRef] [Scilit]
- Liu, Y.; Shao, Z.; Hoffmann, N. Global Attention Mechanism: Retain Information to Enhance Channel-Spatial Interactions. arXiv 2021, arXiv:2112.05561. [Google Scholar] [CrossRef] [Scilit]
- Liu, H.; Liu, F.; Fan, X.; Huang, D. Polarized Self-Attention: Towards High-Quality Pixel-Wise Regression. arXiv 2021, arXiv:2107.00782. [Google Scholar]
- Selvaraju, R.R.; Cogswell, M.; Das, A.; Vedantam, R.; Parikh, D.; Batra, D. Grad-CAM: Visual Explanations from Deep Networks via Gradient-Based Localization. In Proceedings of the 2017 IEEE International Conference on Computer Vision (ICCV); IEEE: New York, NY, USA, 2017; pp. 618–626. [Google Scholar] [CrossRef] [Scilit]
- Jia, L.; Li, X.; Wang, W.; Wang, J.; Yu, H.; Wang, T.; Li, Q. HAZMAT Vehicle Reidentification in Road Tunnels Based on the Fusion of Appearance and Spatiotemporal Information. Comput. Intell. Neurosci. 2023, 2023, 3677387. [Google Scholar] [CrossRef] [Scilit]
- Lyu, J.; Zhou, S.; Liu, J.; Jiang, B. Intelligent-Technology-Empowered Active Emergency Command Strategy for Urban Hazardous Chemical Disaster Management. Sustainability 2023, 15, 14369. [Google Scholar] [CrossRef] [Scilit]

Disclaimer/Publisher’s Note: The statements, opinions and data contained in all publications are solely those of the individual author(s) and contributor(s) and not of MDPI and/or the editor(s). MDPI and/or the editor(s) disclaim responsibility for any injury to people or property resulting from any ideas, methods, instructions or products referred to in the content. |
© 2026 by the authors. Licensee MDPI, Basel, Switzerland. This article is an open access article distributed under the terms and conditions of the Creative Commons Attribution (CC BY) license.