


Abstract
We propose a methodological framework based on design science research for the design and development of data and information artifacts in data analysis projects, particularly managerial performance analysis. Design science research methodology is an artifact-centric creation and evaluation approach. Artifacts are used to solve real-life business problems. These are key elements of the proposed approach. Starting from the main current approaches of design science research, we propose a framework that contains artifact engineering aspects for a class of problems, namely data analysis using machine learning techniques. Several classification algorithms were applied to previously labelled datasets through clustering. The datasets contain values for eight competencies that define a manager’s profile. These values were obtained through a 360 feedback evaluation. A set of metrics for evaluating the performance of the classifiers was introduced, and a general algorithm was described. Our initiative has a predominant practical relevance but also ensures a theoretical contribution to the domain of study. The proposed framework can be applied to any problem involving data analysis using machine learning techniques.
1. Introduction
Design science research is a research paradigm with well-established conceptualizations applicable in engineering and, more recently, in the field of information systems.
According to Pfeffers et al. [1], design science research (DSR) is important in disciplines oriented towards the creation of successful artifacts. In data analysis, key artifacts are the “useful data artifacts” (UDA) and data-related information artifacts [2]. UDAs are “nonrandom subsets or derivative digital products of a data source, created by an intelligent agent (human or software) after performing a task on the data source”, e.g., a labelled dataset or train and test dataset, while information artifacts refer to the objectives of the solution and requirements for final data visualizations or data specifications. Based on the importance of data/information artifacts in data analysis, we propose the design and development of a DSR process in this field of investigation.
Performance measurement is “the process of collecting, analyzing, and/or reporting information regarding the performance of an individual, group, organization, system, or component” [3]. According to Stroet [4], performance measuring is influenced by the usage of machine learning (ML) techniques “in a way that it becomes more accurate through the use of more current and accurately collected data, performance data are gathered easier, is done more continuous, is less biased and done with a more proactive attitude than before ML was implemented in the process”. Managers and employees are frequently evaluated using 360-degree feedback. In general, 360 feedback focuses on behaviors and competencies more than basic skills, job requirements, and performance objectives. Therefore, the 360 feedback is incorporated into a larger performance management process and it is clearly “communicated on how the 360 feedback will be used”. Because 360-feedback is time-consuming, the use of machine learning techniques for analyzing performance data determines the fluidization of the entire process, and the evaluation results are obtained in real time [4,5].
The process is a priori reviewed with staff members, and is started by collecting confidential information from managers’ colleagues and sending the evaluation form to be completed by the employees [6]. Data are automatically collected and integrated into a single dataset. Further, mean values for each competence for all evaluated managers are calculated. The resulting dataset is subjected to analysis using machine learning algorithms.
The paper develops a theoretical applied research discourse based on:
- -
- a methodological framework using design science research (DSR) for data analysis with machine learning techniques, such as classification algorithms;
- -
- a theoretical approach to classification evaluation metrics;
- -
- a set of competencies for evaluating the managers’ performance using 360 feedback;
- -
- an approach to apply the methodological framework to a performance related dataset.
2. Materials and Methods
2.1. Machine Learning Techniques—Clustering and Classification
The study of machine learning (ML) led to the development of many methods depending on the purpose, data representation, and learning strategy. Depending on the experience gained during the learning, we distinguish supervised, unsupervised, or semi-supervised learning methods. In addition, learning can occur through reinforcement or through “learning” [7]. According to El Bouchefry and De Souza [8], “ML algorithms are programs of data-driven inference tools that offer an automated means of recognizing patterns in high-dimensional data”. Supervised algorithms search for inherited structures in a dataset, whereas unsupervised algorithms provide the correct labels or function values.
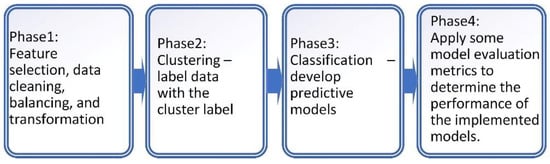
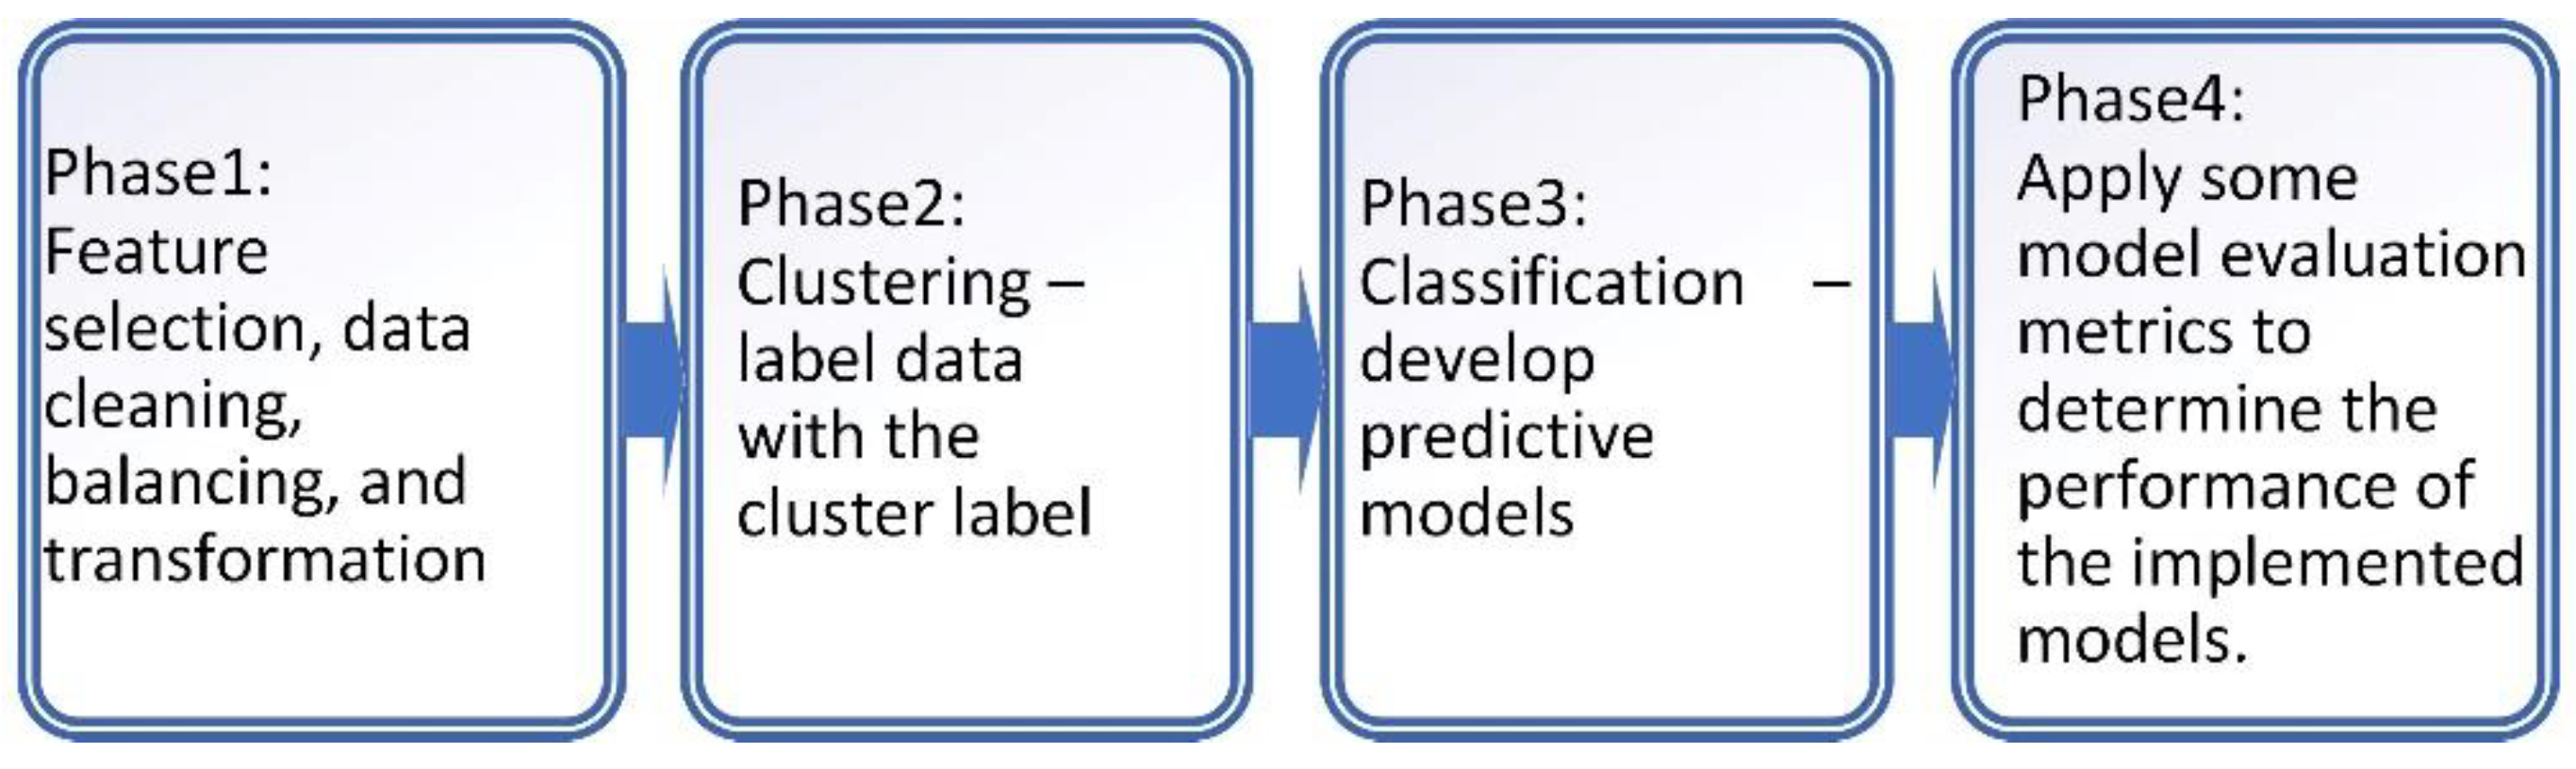
Both clustering and classification algorithms are proven to be successful in different analyses [9]. Classification algorithms require labelled datasets to perform the learning process. We proposed applying classification algorithms to datasets that were previously subjected to a clustering process. According to Alapati and Sindhu [10], the accuracy of a classifier can be improved by applying a classification algorithm to clustered data. We propose the following phases for the prediction analysis and performance prediction (Figure 1).
Figure 1.
Prediction analysis phases.
To evaluate the quality of the classification, the performance of the classifier was analyzed, regardless of whether it may be, with the help of the following measures: sensitivity, specificity, accuracy, and F1 score [11,12].
2.1.1. Feature Selection
Not all attributes or features are important for a specific learning task. The challenging task in feature selection is to obtain an optimal subset of relevant and non-redundant features, which will provide an optimal solution without increasing the complexity of the modelling task [13]. According to Dash and Koot [14], for clustering tasks, it is not so obvious which features are to be selected: some of the features may be redundant, some are irrelevant, and others may be “weakly relevant”. In the context of classification, feature selection techniques can be categorized as filter methods (ANOVA, Pearson correlation, and variance thresholding), wrapper methods (forward, backward, and stepwise selection), embedded methods (LASSO, RIDGE, and decision tree), and hybrid methods [15]. All feature selection methods help reduce the dimensionality of the data and the number of variables, while preserving the variance of the data.
2.1.2. Clustering
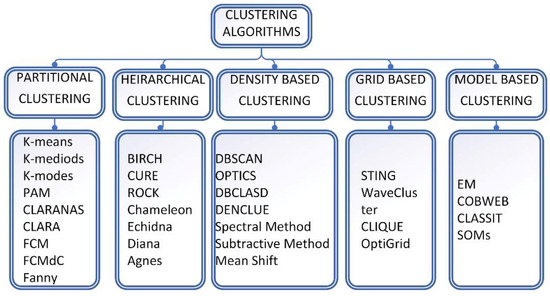
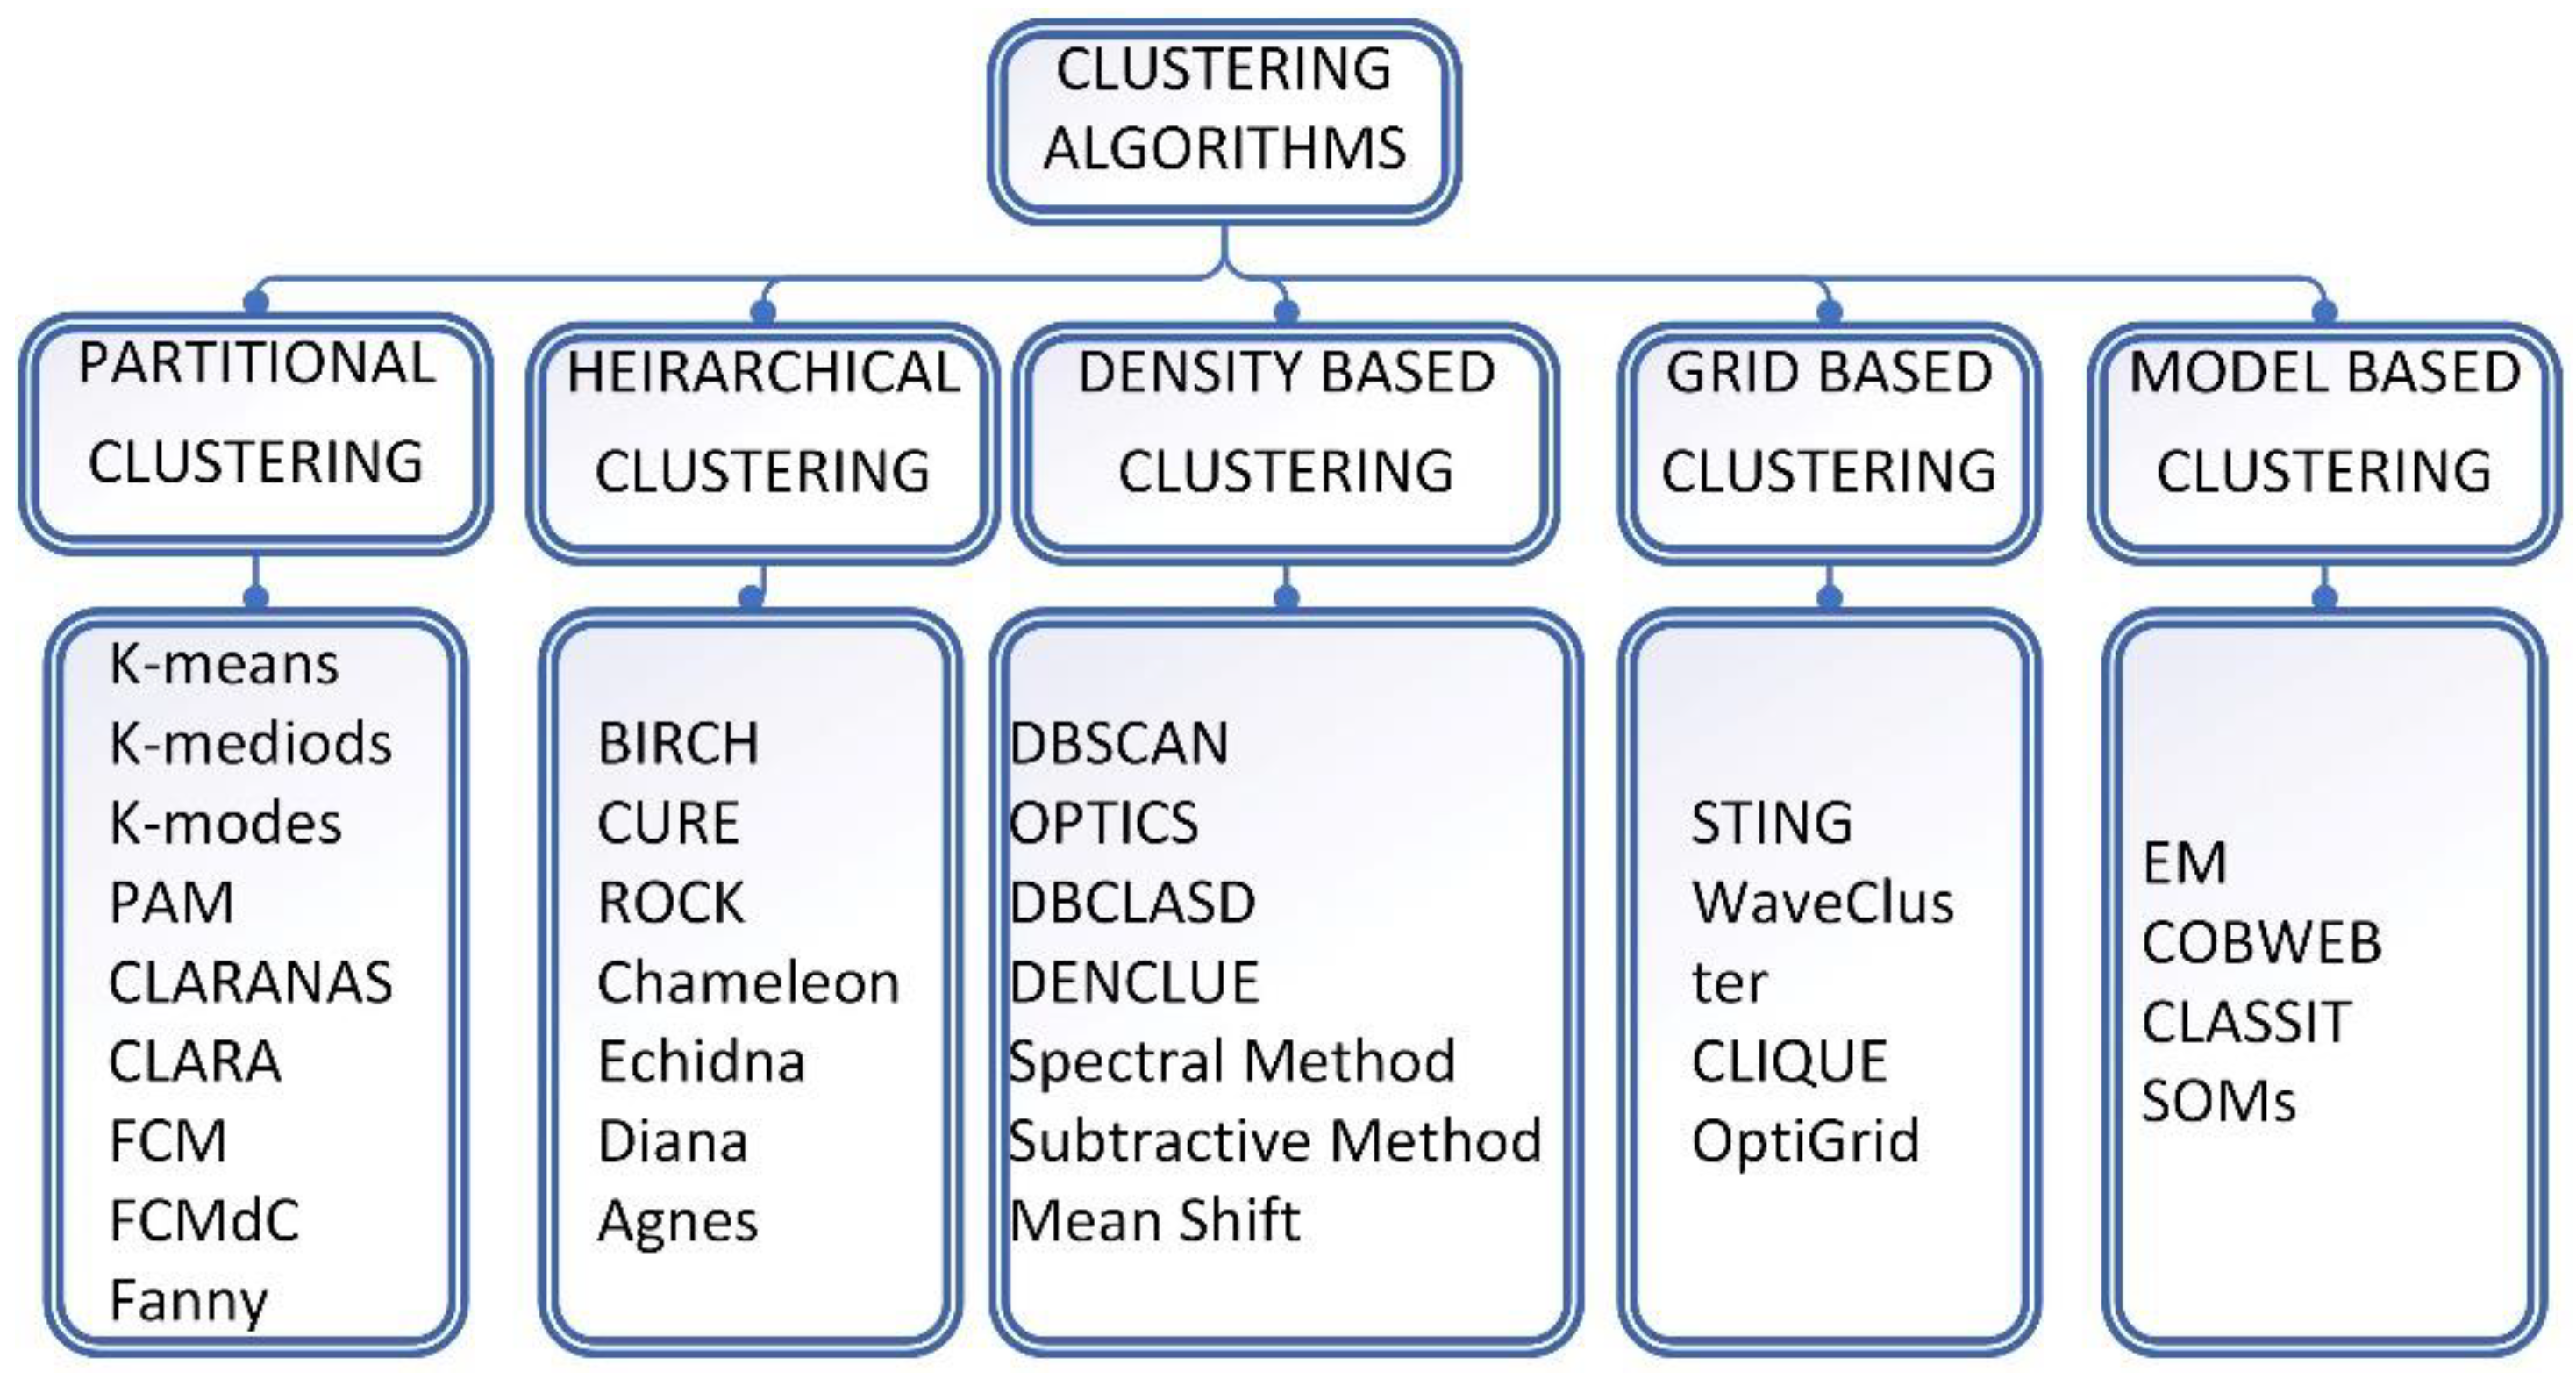
Clustering is an unsupervised learning problem that involves finding a structure in a collection of unlabelled data. A cluster is “a collection of objects that are similar between them and dissimilar to objects belonging to other clusters” [16]. Clustering algorithms can be classified as hierarchical, partitioning, density, grid, or model-based (Figure 2). According to Witten, Frank, Hall, and Pal [17], a cluster contains instances that bear a stronger resemblance to each other than to other instances.
Figure 2.
Clustering algorithms [18].
Partitional clustering algorithms divide datasets into mutually disjointed partitions. Data points are assigned to K clusters using an iterative process [19]. The partitional clustering techniques start with randomly chosen clustering, and then optimize the clustering according to the accuracy measurements. Owing to its simplicity and low time complexity, the K-means algorithm is commonly used for mining data and labeling them with cluster labels [20]. This requires pre-defining the number of clusters K, and the optimal K value is determined a priori [21]. Determining the optimal number of clusters is fundamental for clustering. According to Loukas [22], the optimal number of clusters depends on the method used for measuring similarities and the parameters used for partitioning (the elbow method, silhouette analysis, and gap statistics method).
Hierarchical clustering can be divided into two types: agglomerative (bottom-up) and divisive (top-down) clustering. Data objects (instances) are organized into a tree of clusters called a dendrogram. Each intermediate level can be viewed as combining two clusters from the next lower level (bottom-up) or splitting a cluster from the next higher level (top-down) [23]. Frequently applied in the construction of taxonomies, hierarchical clustering requires considerable computational and storage resources for deploying the dendrogram. Unfortunately, once a merge or split step is performed, it cannot be undone. Therefore, it is recommended to integrate hierarchical clustering with other techniques for multi-phase clustering.
Density-based clustering algorithms identify distinctive clusters in the data based on the idea that “a cluster in a data space is a contiguous region of high point density”, separated from other such clusters by contiguous regions of low point density [24]. The algorithms detect areas where points are concentrated, and where they are separated by areas that are empty or sparse.
Grid-based approaches are popular for mining clusters in large multidimensional spaces, in which clusters are regarded as denser regions than their surroundings. Such an algorithm is concerned not with data points but with the value space that surrounds them [25].
Finally, model-based clustering assumes that data are generated by a model, and attempts to recover the original model from the data.
2.1.3. Classification
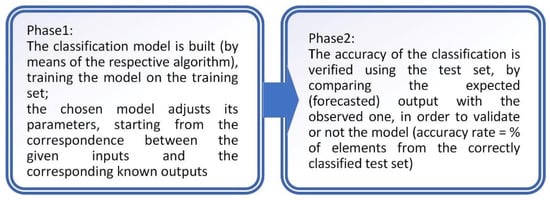
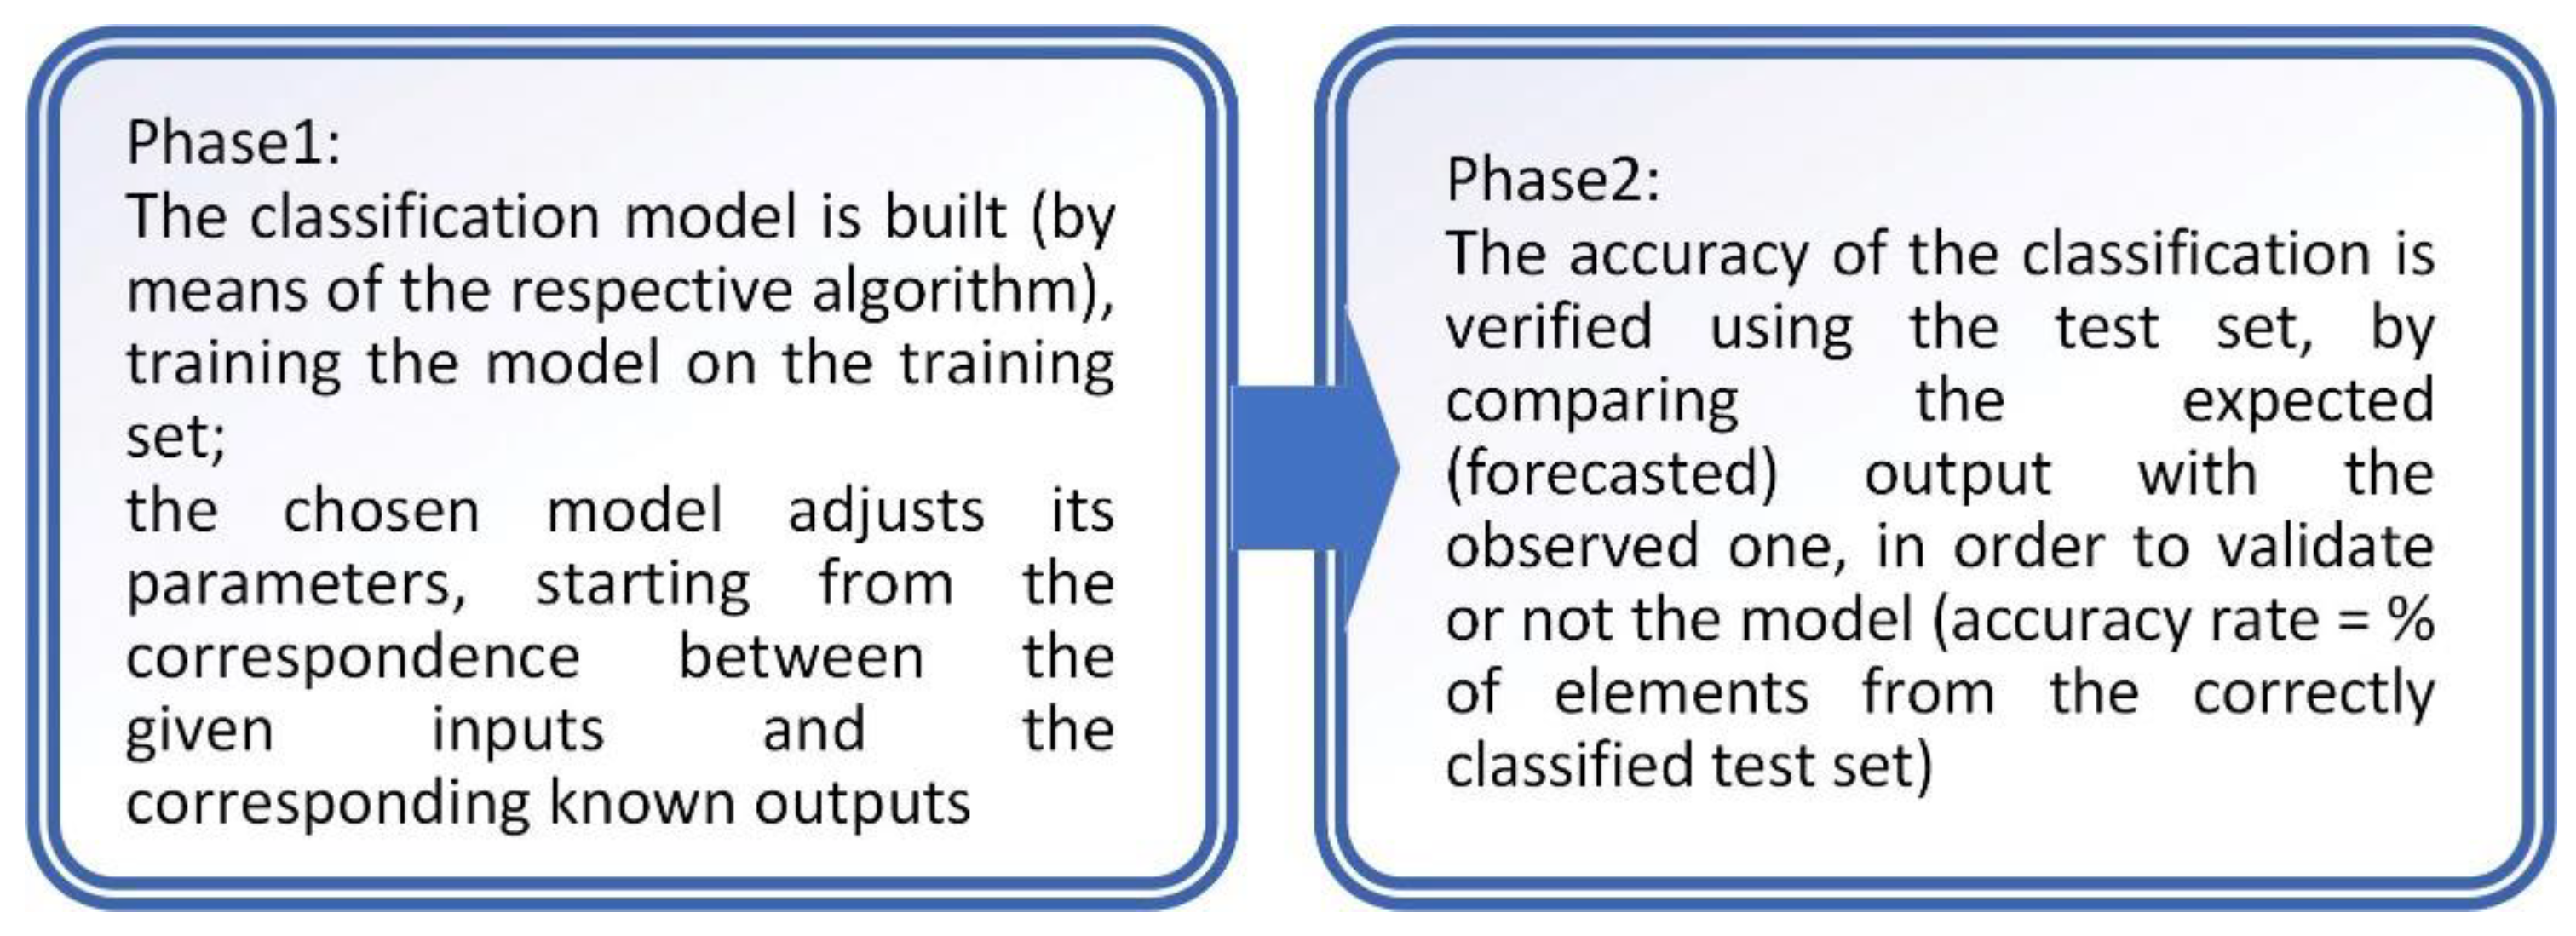
Classification algorithms are supervised learning techniques that are used to identify the category (class) of new data. The classification involves the following processing phases (Figure 3).
Figure 3.
Classification process.
Among the most well-known models (methods) used for classification, we can mention the following [26]: decision trees, Bayesian classifiers, neural networks, k-nearest neighbor classifiers, statistical analysis, genetic algorithms, rough sets, rule-based classifiers, memory-based reasoning, support vector machines (SVMs), and boosting algorithms.
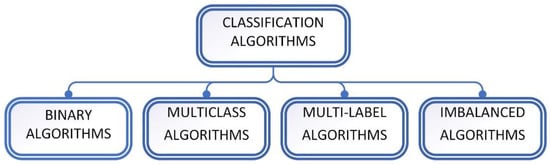
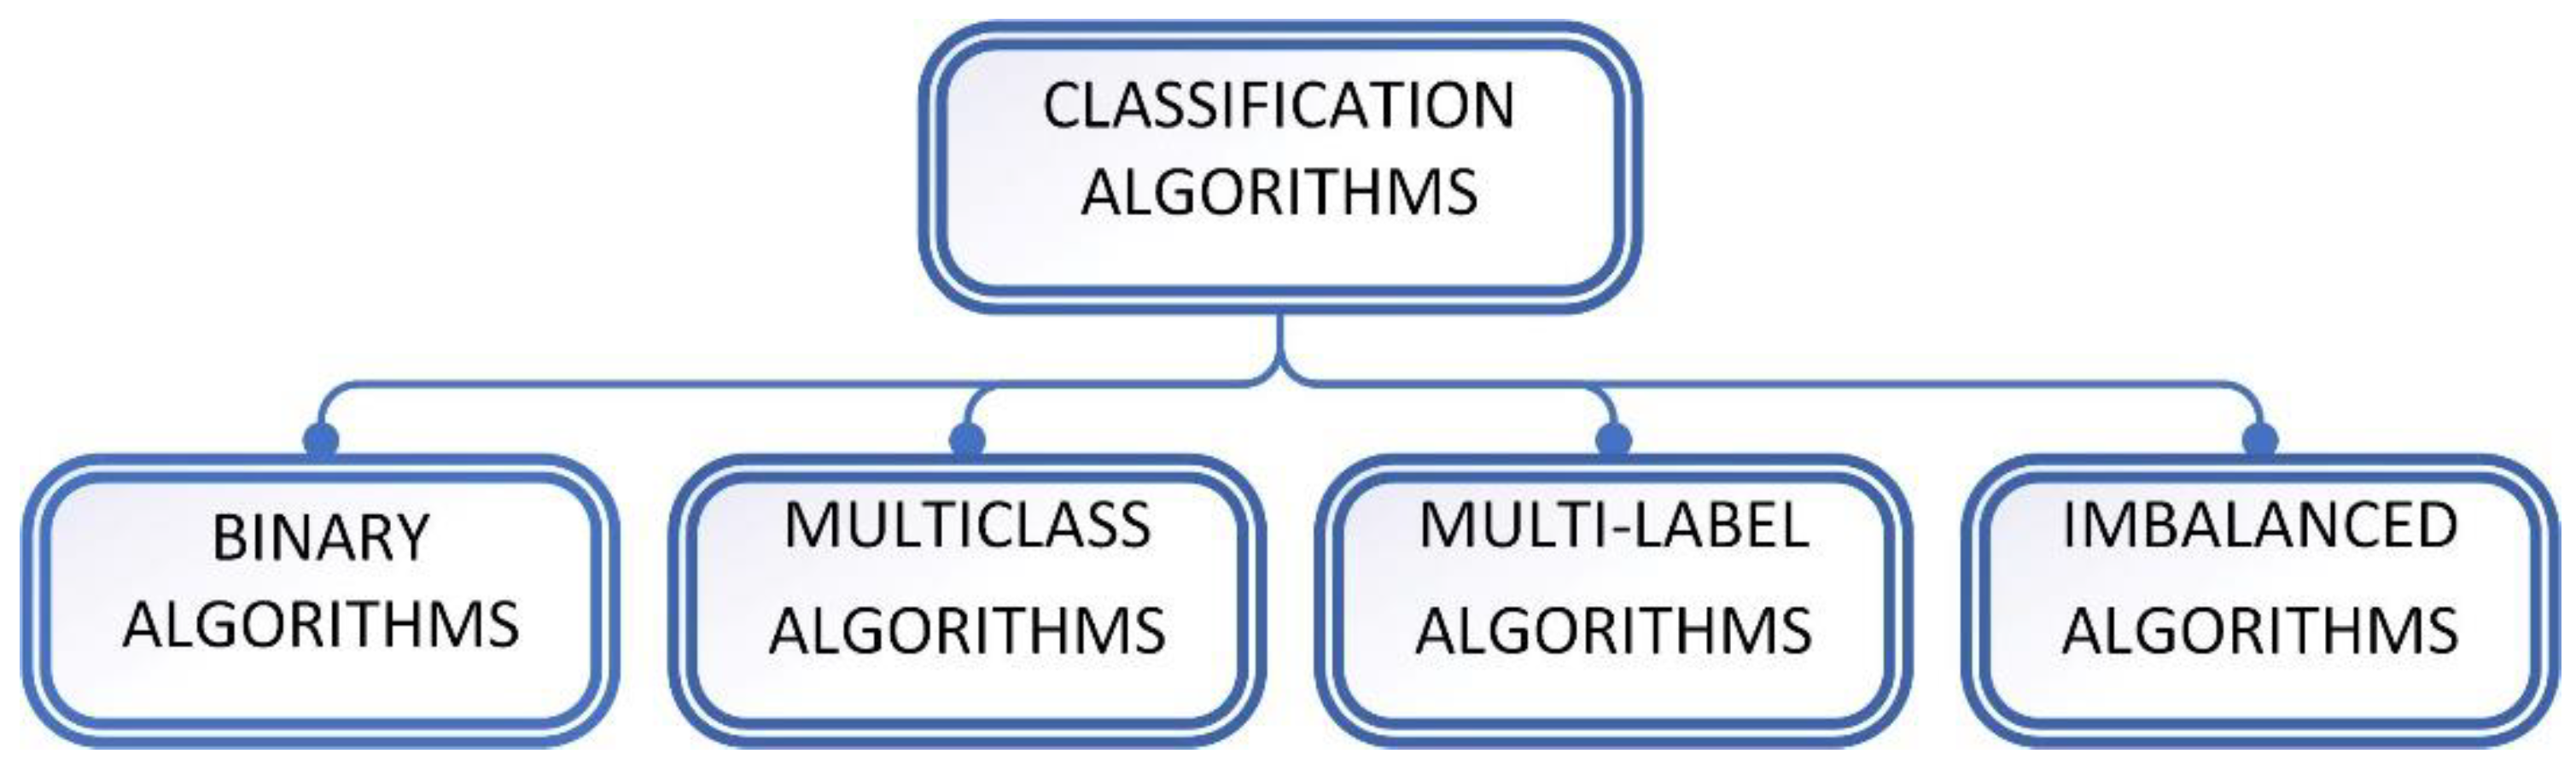
Binary classification (Figure 4) refers to classification tasks that have only two class labels (k-nearest neighbors, decision trees, support vector machines, and naive Bayes), whereas multiclass classification refers to classification tasks that have more than two class labels (k-nearest neighbors, decision trees, naive Bayes, random forest, and gradient boosting).
Figure 4.
Classification algorithms.
A multi-label classifier can predict one or more labels for each data instance (multi-label decision trees, multi-label random forests, and multi-label gradient boosting). Unbalanced classification processes determine the classification of an unequal number of instances into classes (cost-sensitive logistic regression, cost-sensitive decision trees, and cost-sensitive support vector machines).
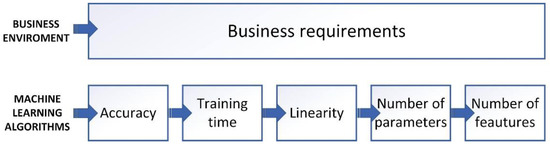
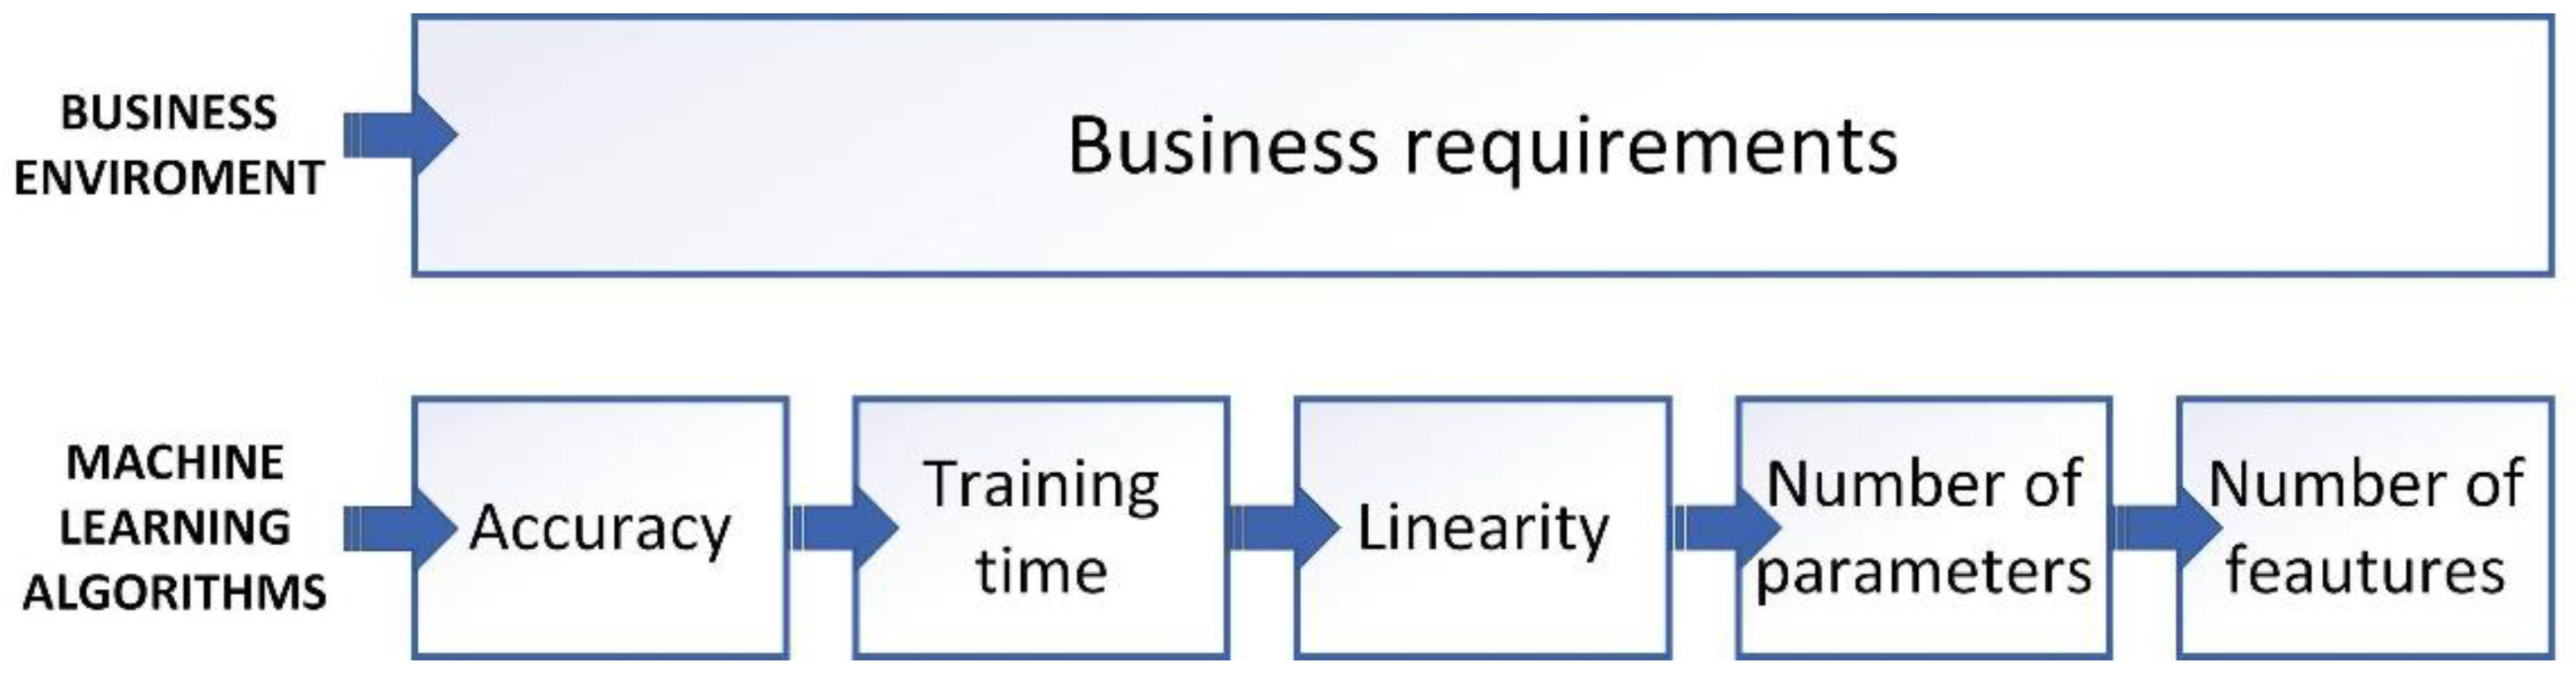
According to [27], it is necessary to first identify business needs and then map them to the corresponding machine learning tasks (Figure 5). After establishing the business requirements, the requirements for the machine learning algorithm were established. Characteristics, such as the accuracy of the algorithm, training time, linearity, number of parameters, and number of features influence the classifier selection [5]. The accuracy reflects the effectiveness of a model, that is, the proportion of true results in all cases. The training time varies from one classifier to another. Many machine learning algorithms use linearity. The parameters are the values that determine the algorithm behavior, and a large number of features substantially influence the training time [28]. Classification performance can be improved by mixed approaches [29].
Figure 5.
Criteria for selecting machine learning algorithms [28].
2.2. Design Science Research
According to Nunamaker et al. [30], research is “represented by its objectives and methods, whereby the objectives require a methodological approach to integrate theory building, system development, and experimentation”. On a theoretical scale (Figure 6), the degree of theoretical importance is represented on one side versus the practical relevance on the other side [31].
Figure 6.
Research paradigm [30].
Research in information systems and data science implies an interdisciplinary research process that fits more than one paradigm [31].
Design science research (DSR) is a paradigm that is accepted in disciplines, such as engineering. This research paradigm is extended to information systems and data science [32]. As asserted by Hevner et al. [32], guidelines for design science research include methodological choices for the DSR process.
Several research methodologies were developed to support the DSR process [33]. The main methodologies are the systems development research methodology (SDRM) [30], DSR process model (DSRPM) [34], design science research methodology (DSRM) [7], action design research (ASR) [35], soft design science methodology (SDSM) [36], and participatory action design research (PADR) [37].
According to Nunamaker et al. [33], SDRM is a five-step research process that includes the following steps: constructing a conceptual framework, developing a system architecture, analyzing and designing the system, building the (prototype) system, and observing and evaluating the system.
In their “Design Research in Information Systems”, Vaishnavi and Kuechler [34] explain the process steps of design research. By pointing out the importance of artifacts, the DSR process includes the following steps: awareness of the problem, suggestion, development, evaluation, and conclusion.
Peffers et al. [1] proposed a six-step design science research methodology: identifying the problem and motivation, defining the objectives of a solution, design and development, demonstration, evaluation, and communication. DSR methodology is “an artifact-centric creation and evaluation approach” [1,34]. The research methodology implies the design cycle of “artifacts of practical value to either the research or professional audience” [38,39]. Artifacts are systems, applications, methods, data models, data sets, and others “that could contribute to the efficacy of information systems and business analysis in organizations” [40].
ADR methodology combines action research with DSR [33]. It includes four phases: problem formulation, building intervention and evaluation, reflection and learning, and formalization of learning [35].
The eight activities of SDSM are: learning about a specific problem, inspiring and creating the general problem and general requirements, intuiting the general solution, general evaluation, designing specific solution for specific problem, specific evaluation, constructing specific solution, and post evaluation [33,36].
The PADR methodology is recommended for developing solutions to problems involving large heterogeneous groups of stakeholders [33,37]. It consists of the following steps: diagnosis and problem formulation, action planning, action taking: design, impact evaluation, and reflection and learning.
Based on the DSRM and DSRPM, we recommend the methodological framework shown in Figure 7 for performing data analysis.
Figure 7.
Design science research framework.
The activities shown in Figure 7 indicate the design and development of the artifacts. Furthermore, the artifacts are evaluated, and after validation, they are e communicated and processed in the next phase [41]. Artifact evaluation provides a better interpretation of the problem and feedback to improve the quality of designed artifacts [42].
Owing to its focus on developing information artifacts, DSR is a research approach with a predominant practical relevance. Artifacts are designed and developed in order to improve business activities, processes, or to support decisions. Therefore, the targeted business beneficiaries of the artifacts are involved in their testing and validation [31].
3. Methods
3.1. Artifacts Development in Design Science Research
“Current design science research method does not have a systematic methodological process to follow in order to produce artifacts” [43]. In general, the following research methods, techniques and tools are used for artifact design and development (Table 1).
Table 1.
DSR process. Research methods, techniques and tools.
We propose an approach to prediction analysis (Figure 1) in a DSR framework (Figure 7) using appropriate research methods, techniques and tools (Table 1).
Artifact engineering using machine learning techniques implies a set of activities and tasks that are highlighted in Table 2. The initial, intermediate, and final artifacts were established for each phase.
Table 2.
DSR process. Using machine learning techniques.
Our proposal establishes all necessary processing to perform data analysis in general, and performance analysis in particular.
Data analysis is part of a larger business process, such as the process of evaluating performance, and is meant to add value to a business [7]. Data analysis takes primary information from the information flows and returns the information artifacts to the information flows in the corporate environment. As part of the performance management process, the proposed framework is closely linked to process elements downstream and upstream. This implies a scalable deployment approach containing the following stages: top management involvement, proper planning and scoping, introducing the data analysis in terms of a business case, implementing the DSR process, and maintaining a solid data governance program.
3.2. Metrics for Evaluating Classification Models
Classification algorithms are widely used to make predictions and meaningful decisions [42]. Once a classification algorithm produces a model, it is evaluated with respect to certain criteria such as accuracy, ROC curve, or F1 score [44].
According to the prediction approach (Figure 1), classification represents the third phase after feature selection and clustering [11]. A classification model is constructed by applying a classifier to the training dataset (80% of the data). Furthermore, classification accuracy was verified using a test set (20% of the data) by comparing the forecasted output (class label) with the observed output (cluster label provided by the clustering algorithm). Building acceptable classification models implies, despite accuracy and justifiability, that the model should be in line with the existing domain knowledge [45].
According to Choi et al. [46], six evaluation metrics are recommended to evaluate multilevel classification: accuracy, precision, recall, F1-score, receiver operating characteristic curve, and AUC. A greater number of indicators are used in specific contexts, such as software fault predictions [47]. In addition, the classification performance was measured using G-mean, J-coefficient, error rate, and balance. A review of evaluation metrics for data classification evaluations presented a set of suitable indicators for obtaining the optimal classifier: accuracy, error rate, sensitivity, specificity, precision, recall, F-score, geometric mean, average accuracy, average error rate, average precision, average recall, and average F-score [48].
In all approaches, the basic metrics are true positive (TP), true negative (TN), false positive (FP), and false negative (FN) [49]. A true positive is a predicted outcome that is similar to the actual class (cluster label). A false positive result occurs when the classifier labels (or categorizes) a data instance that it should not contain. A true negative result occurs when the classifier does not correctly label (or categorize) the output. A false negative result occurs when the classifier does not label a data instance but should have. Based on these considerations, we introduced the following metrics to evaluate the classification performance (Table 3).
Table 3.
Classification model evaluation metrics (adapted from [49]).
Accuracy is widely used to evaluate the classification performance. Additionally, in the case of imbalanced datasets, the F1-score and metrics presented in Table 3 were used [49].
3.3. General Algorithm for Determining the Classification Model Evaluation Metrics
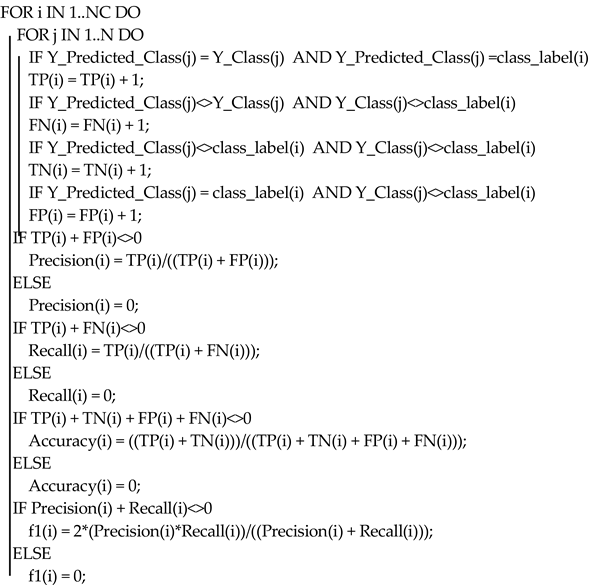
Let DS be a labelled dataset with N instances and different NC class labels. During the training phase, a classification model was generated, and predicted class labels were added during the testing phase (1).
Metrics TP(i), TN(i), FP(i), FN(i), Precision(i), Recall(i), Accuracy(i) and f1(i) were calculated for each class_label(i) according to Pseudocode 1.
| Pseudocode 1 |
 |
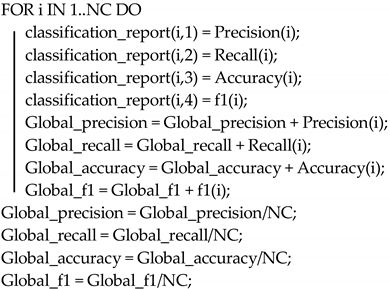
The classification report was assembled, and the global metrics of precision, recall, accuracy, and F1 for the classification algorithm were determined, as indicated in Pseudocodes 2.
| Pseudocode 2 |
 |
We recommend using MS Power BI to perform the data analysis. It is used in business and industry sectors as an integral part of the technological and information systems framework. In a self-service manner, business users can integrate data from a variety of sources, perform advanced analysis, and design dashboards for process tracking and decision support. Automated machine learning (AutoML) for dataflows enables business analysts to train, validate, and invoke machine learning models directly in MS Power BI. Pycaret, an open source, low-code machine learning library in Python, accessible from MS Power BI offers support for automated machine learning workflow.
4. Analysis and Results
Right from the beginning, the objectives of our theoretical applied discourse were established. Objective one aims to the introduction of a methodological framework using design science research for data analysis. Based on relevant references on DSR [1,2,31,32,33,34,35,36,37], we propose a multi-phase framework (Figure 7). Further, the development of artifacts was systematized by establishing activities and tasks specific to each phase within the DSR framework (Table 2). Concrete specifications regarding the use of machine learning algorithms are formulated.
The second objective refers to the unitary approach of metrics for evaluating the performance of classification algorithms. The main evaluation metrics were briefly presented (Table 3) and a general algorithm for determining the classification model evaluation metrics was proposed (Pseudocodes 1 and 2).
The next two objectives, mentioned in the introductory chapter, aim at the application of the theoretical considerations for performance analysis.
The analysis regarding the “managerial capacity” of decision makers was performed using the DSR framework, in compliance with the phases listed in Table 2. A 360-degree evaluation form was chosen as the investigation tool and means of data collection [50]. The following competencies are evaluated: decision making ability, conflict management, relationship management, employee motivation, influence and negotiation, strategic thinking, results orientation, and last but not least planning and organization. Each competence was based on four statements, each of which was assessed by assigning a score on a scale of one to five. The resulting competency scores are in a range from 4 to 20 points (Appendix A).
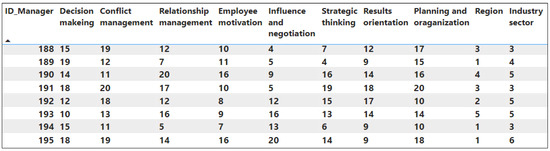
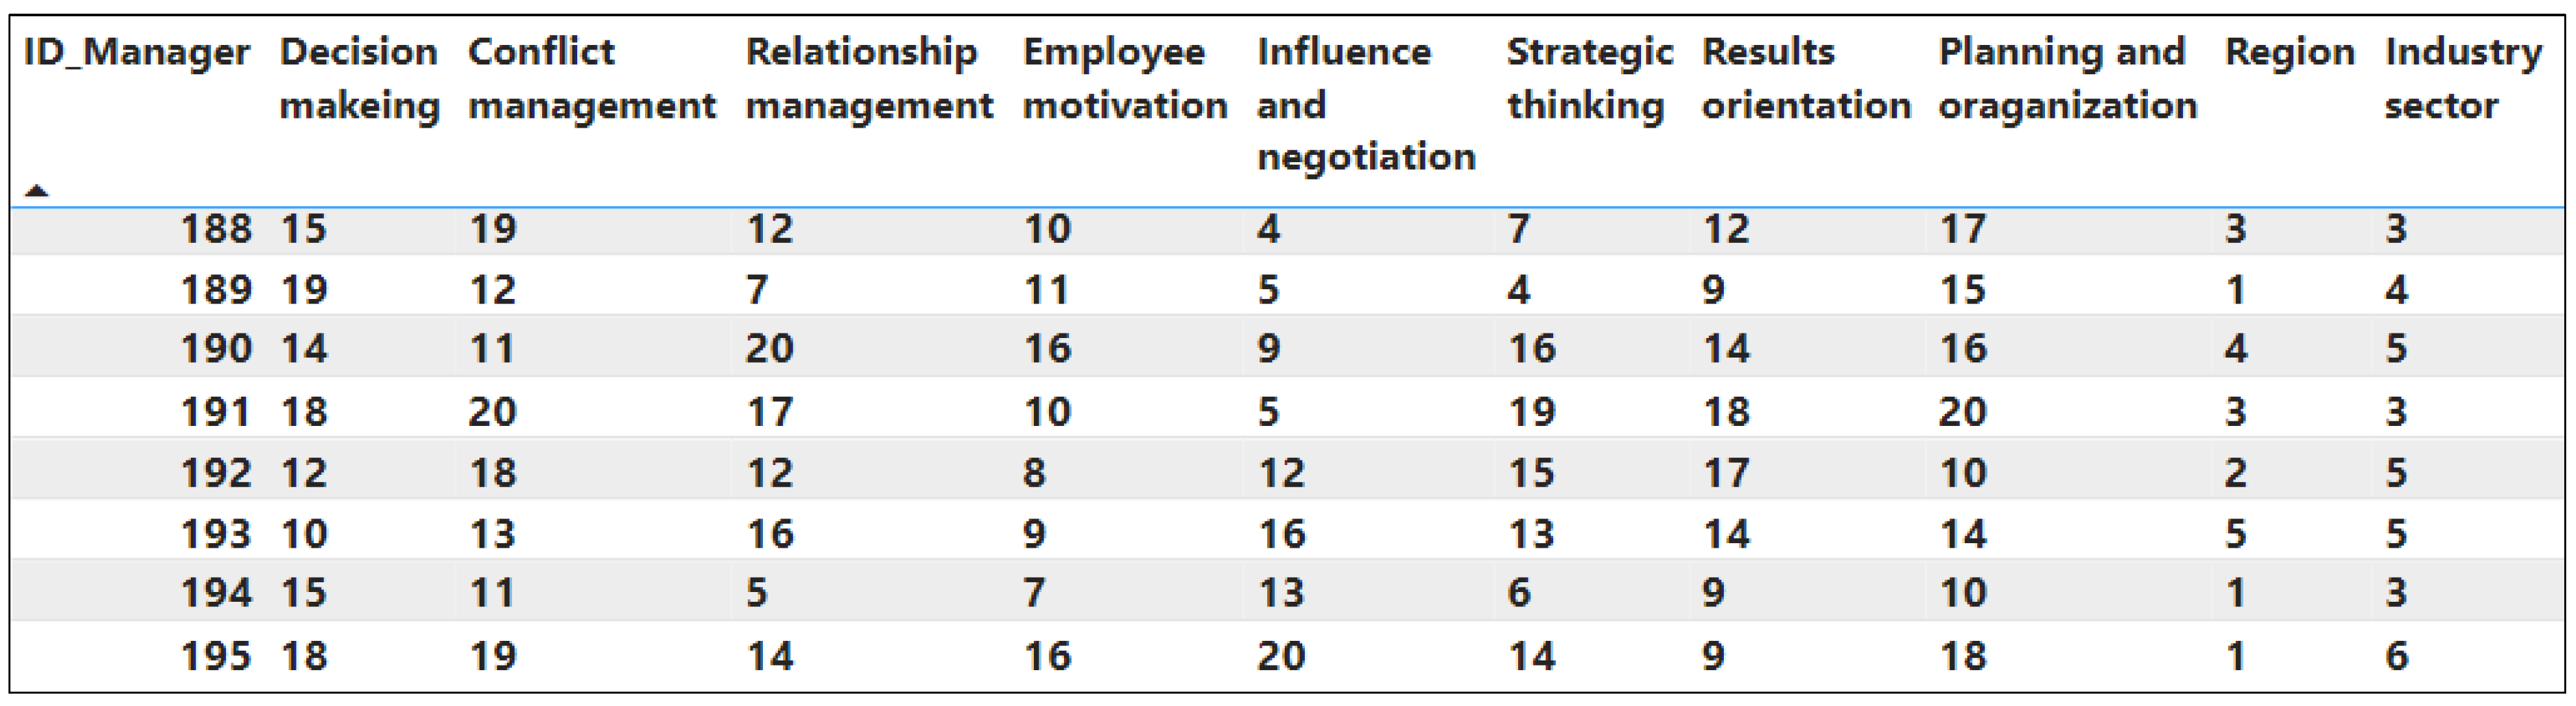
The dataset centralizes the scores obtained by various managers and contains 195 final instances (Figure 8). Eight competencies (decision making ability, conflict management, relationship management, employee motivation, influence and negotiation, strategic thinking, result orientation, planning, and organization) were selected for data analysis using machine learning techniques, such as clustering and classification.
Figure 8.
O21. Dataset. Partial data.
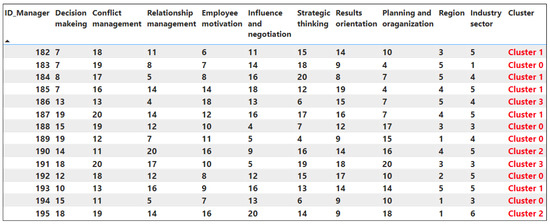
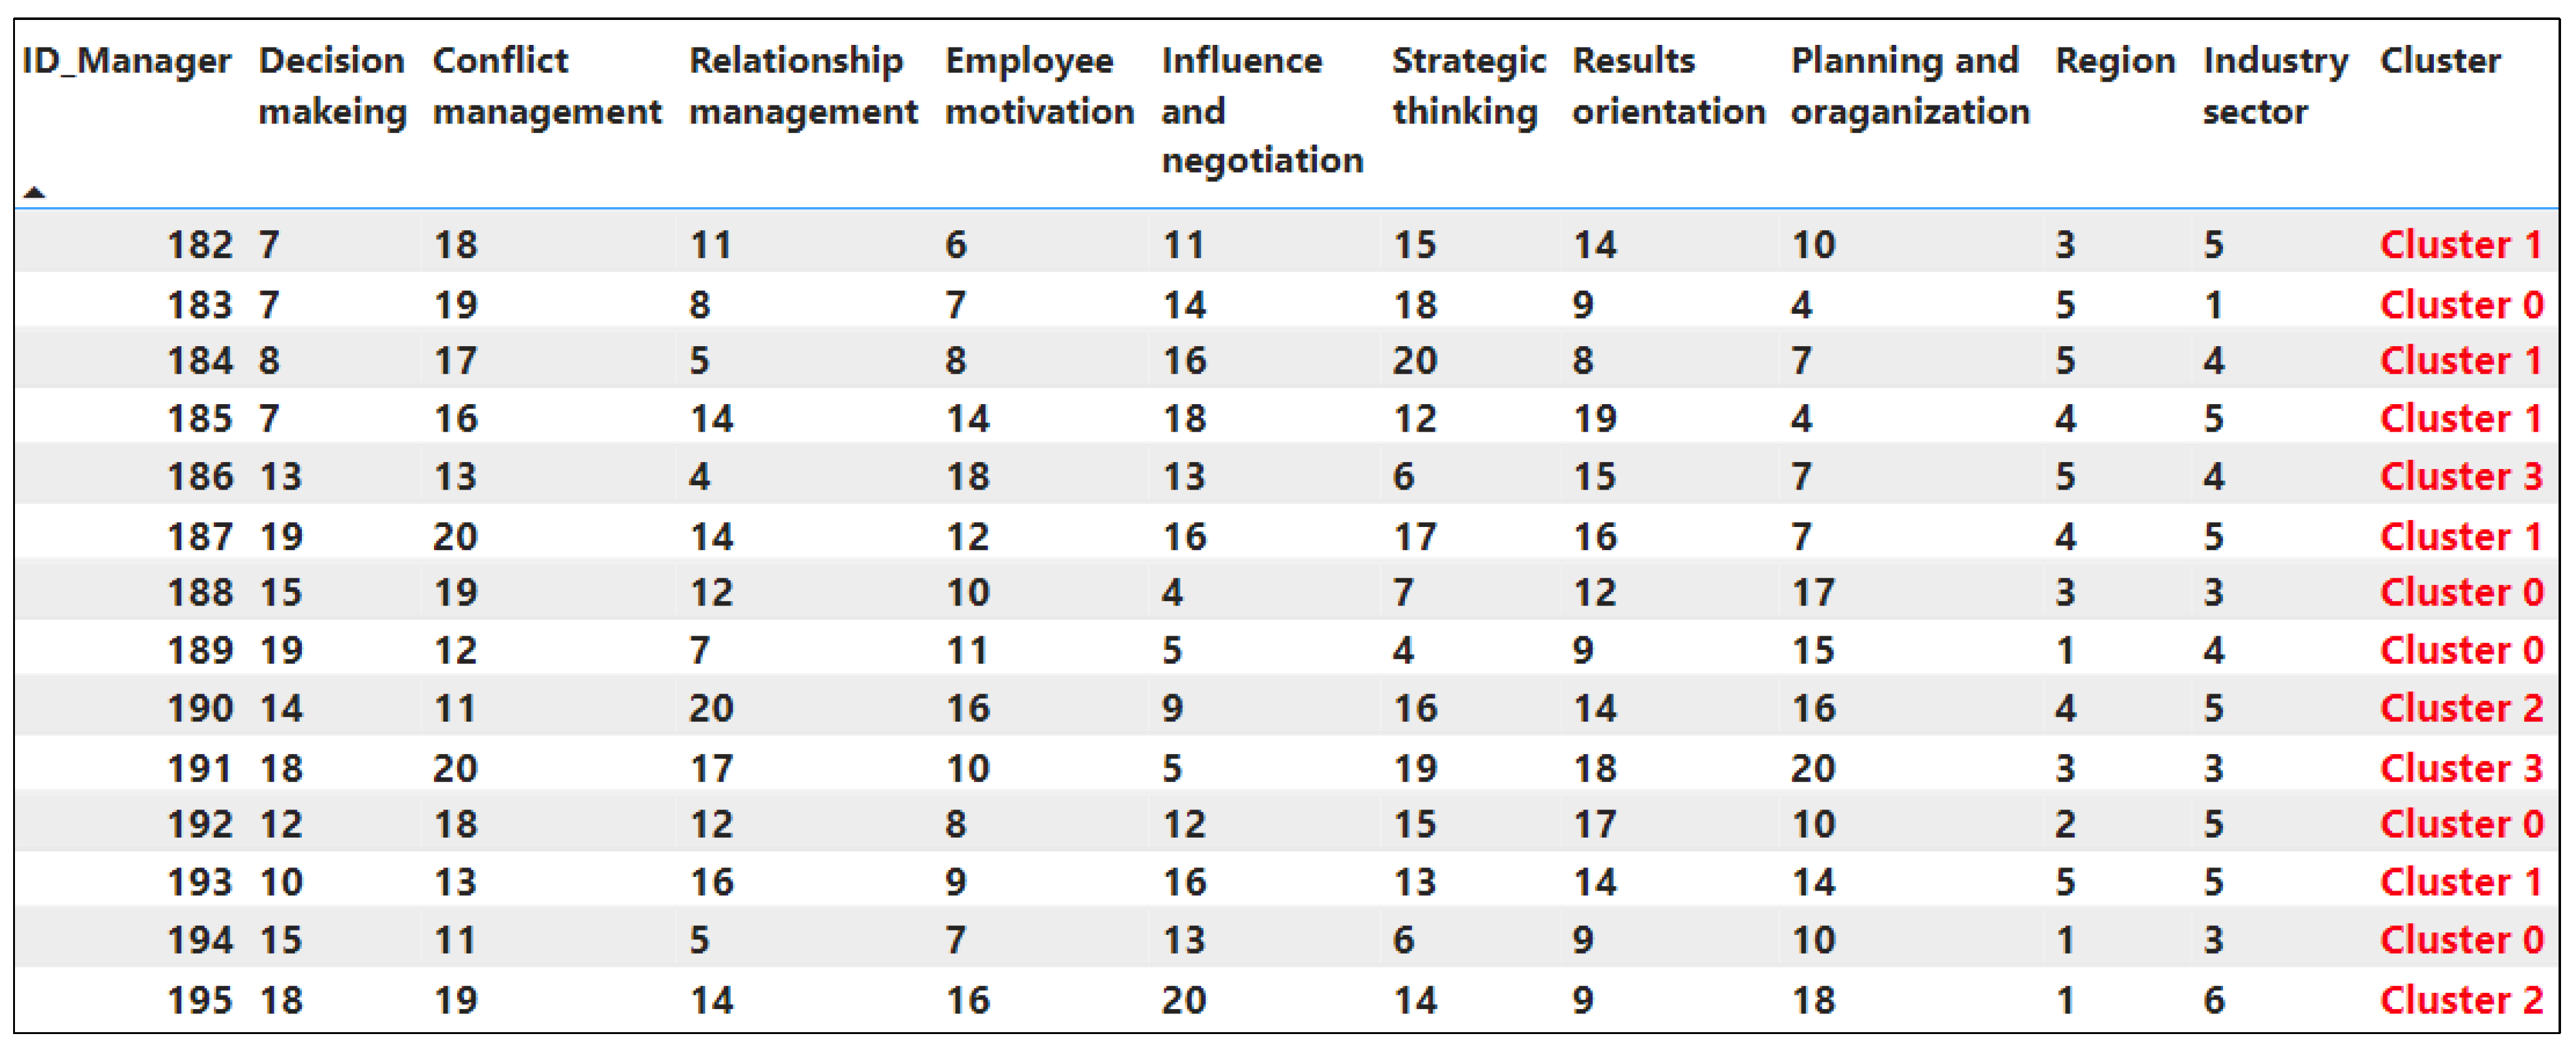
The dataset contained unlabeled data and required further annotation. This was achieved by modelling the data through clustering. PyCaret’s clustering module is an unsupervised machine learning module that groups of a set of objects such that those in the same group (called a cluster) are more similar to each other than to those in other groups. Clustering was performed using the K-means algorithm (Script 1, Figure 9).
| Script 1 |
| from pycaret.clustering import * dataset = get_clusters(dataset, num_clusters = 4, ignore_features = [‘ID_Manager’, ‘Industry_sector’, ‘Region’]) |
Figure 9.
O31. Labelled dataset. Partial data.
The classification module is “a supervised machine learning module that is used for classifying elements into groups. The goal is to predict discrete and unordered categorical class labels” [26]. We used various classification algorithms (Table 2) and calculated evaluation metrics for each algorithm. The models were saved as pkl files. (Script 2).
| Script 2 |
| clf1 = setup(df, target = ‘Cluster’, silent = True, ignore_features = [‘ID_Manager’, ‘Industry_sector’,’Region’]) # train multiple models algorithms = [‘knn’,’dt’,’catboost’,’nb’,’rbfsvm’,’lr’,’gpc’,’mlp’,’rf’,’qda’,’ada’,’gbc’,’lda’,’et’, ‘xgboost’,’lightgbm’,’svm’,’ridge’] models = [create_model(i) for i in algorithms] final_models = [finalize_model(models[i]) for i in range(len(algorithms))] for x in range(len(algorithms)): save_model(final_models[x], ‘D:/’+ algorithms [x]) |
After training different classification algorithms, the models were tested (Script 3).
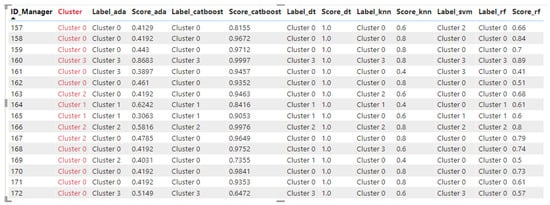
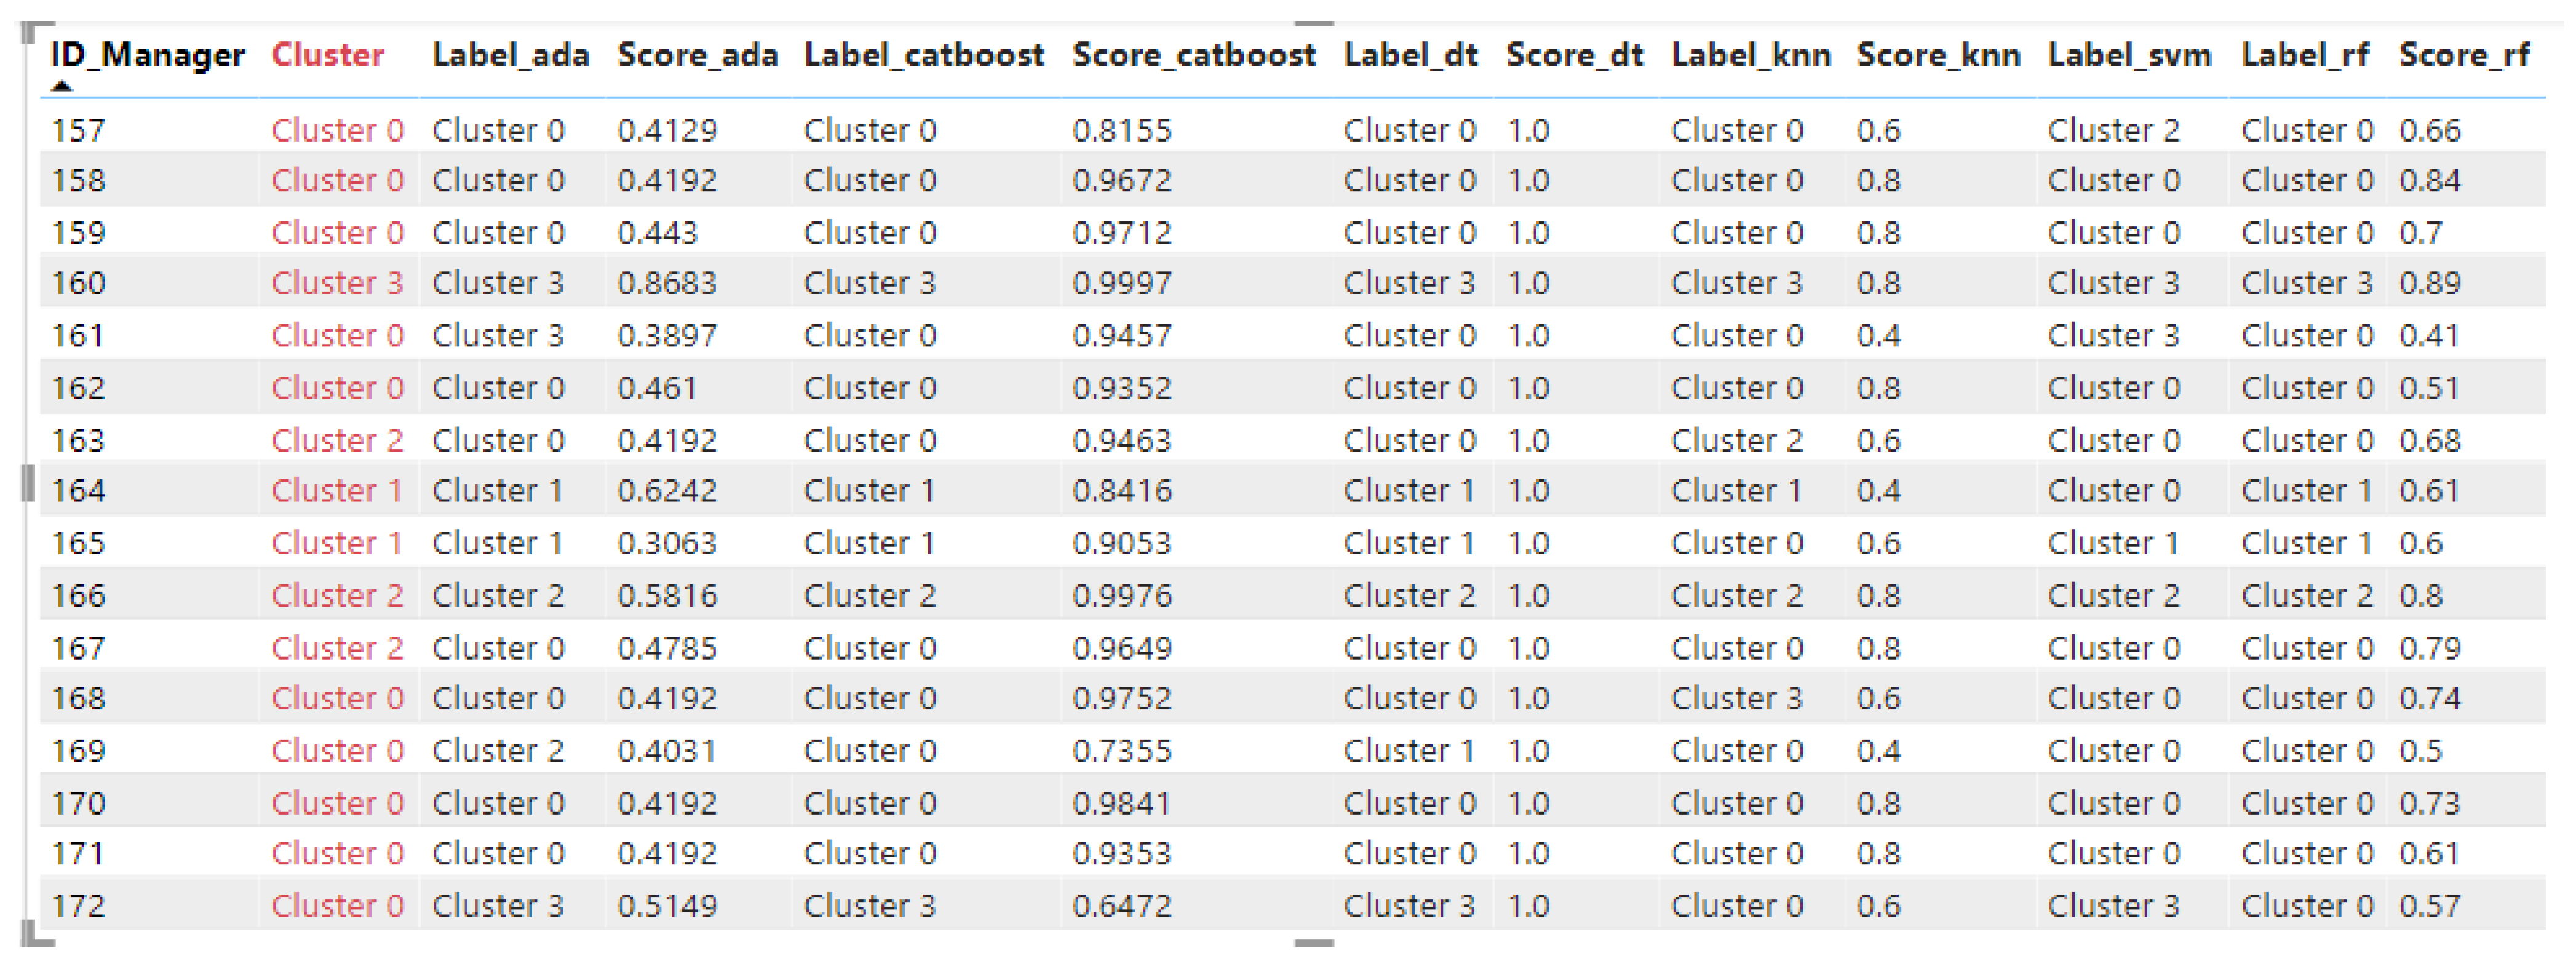
The predicted class labels are associated with each instance of the test dataset (Figure 10).
| Script 3 |
| algorithms = [‘knn’,’dt’,’catboost’,’nb’,’rbfsvm’,’lr’,’gpc’,’mlp’,’rf’,’qda’,’ada’,’gbc’,’lda’,’et’, ‘xgboost’,’lightgbm’,’svm’,’ridge’] from pycaret.classification import * for i in range(len(algorithms)): clasificator = load_model(‘D:/’ + algorithms[i]) dataset = predict_model(clasificator, data = dataset) dataset.rename(columns = {‘Label’:’Label_’ + algorithms[i],’Score’: ‘Score_’ + algorithms[i]}, inplace = True) |
Figure 10.
O44. Results of the testing process.
The evaluation metrics were calculated for each classification model according to the previously described “general algorithm for determining the classification model evaluation metrics” (Pseudocodes 1 and 2).
We created, trained, and deployed a machine leaning model for each classification algorithm available in PyCaret library. The following algorithms, which are listed in alphabetical order, were applied: adaboost (ada), cat booster classifier (catboost), decision tree (dt), extra tree classifier (et), extreme gradient boosting (xgboost), gaussian process classifier (gpc), gradient boosting classifier (gbc), light gradient boosting (lightgbm), linear disc analysis (lda), logistic regression (lr), k nearest neighbor (knn), multi level perceptron (mlp), naives bayes (nb), random forest (rf), ridge classifier (ridge), support vector machine (svm and rbfsvm), and quadratic disc analysis (qda) [26]. They are representative for all classification algorithm categories (Figure 4).
The automated machine learning (AutoML) workflow implemented by Scripts 2 and 3 generated the data artifacts specified in Table 2.
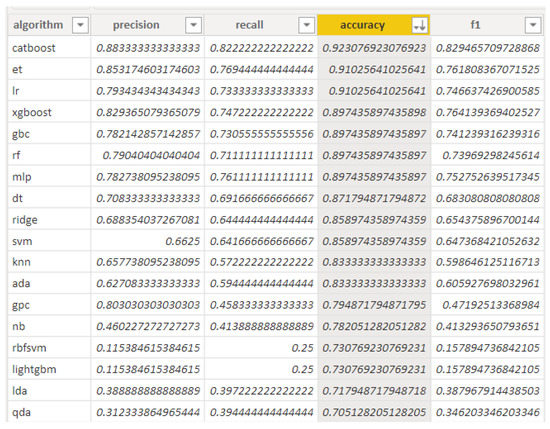
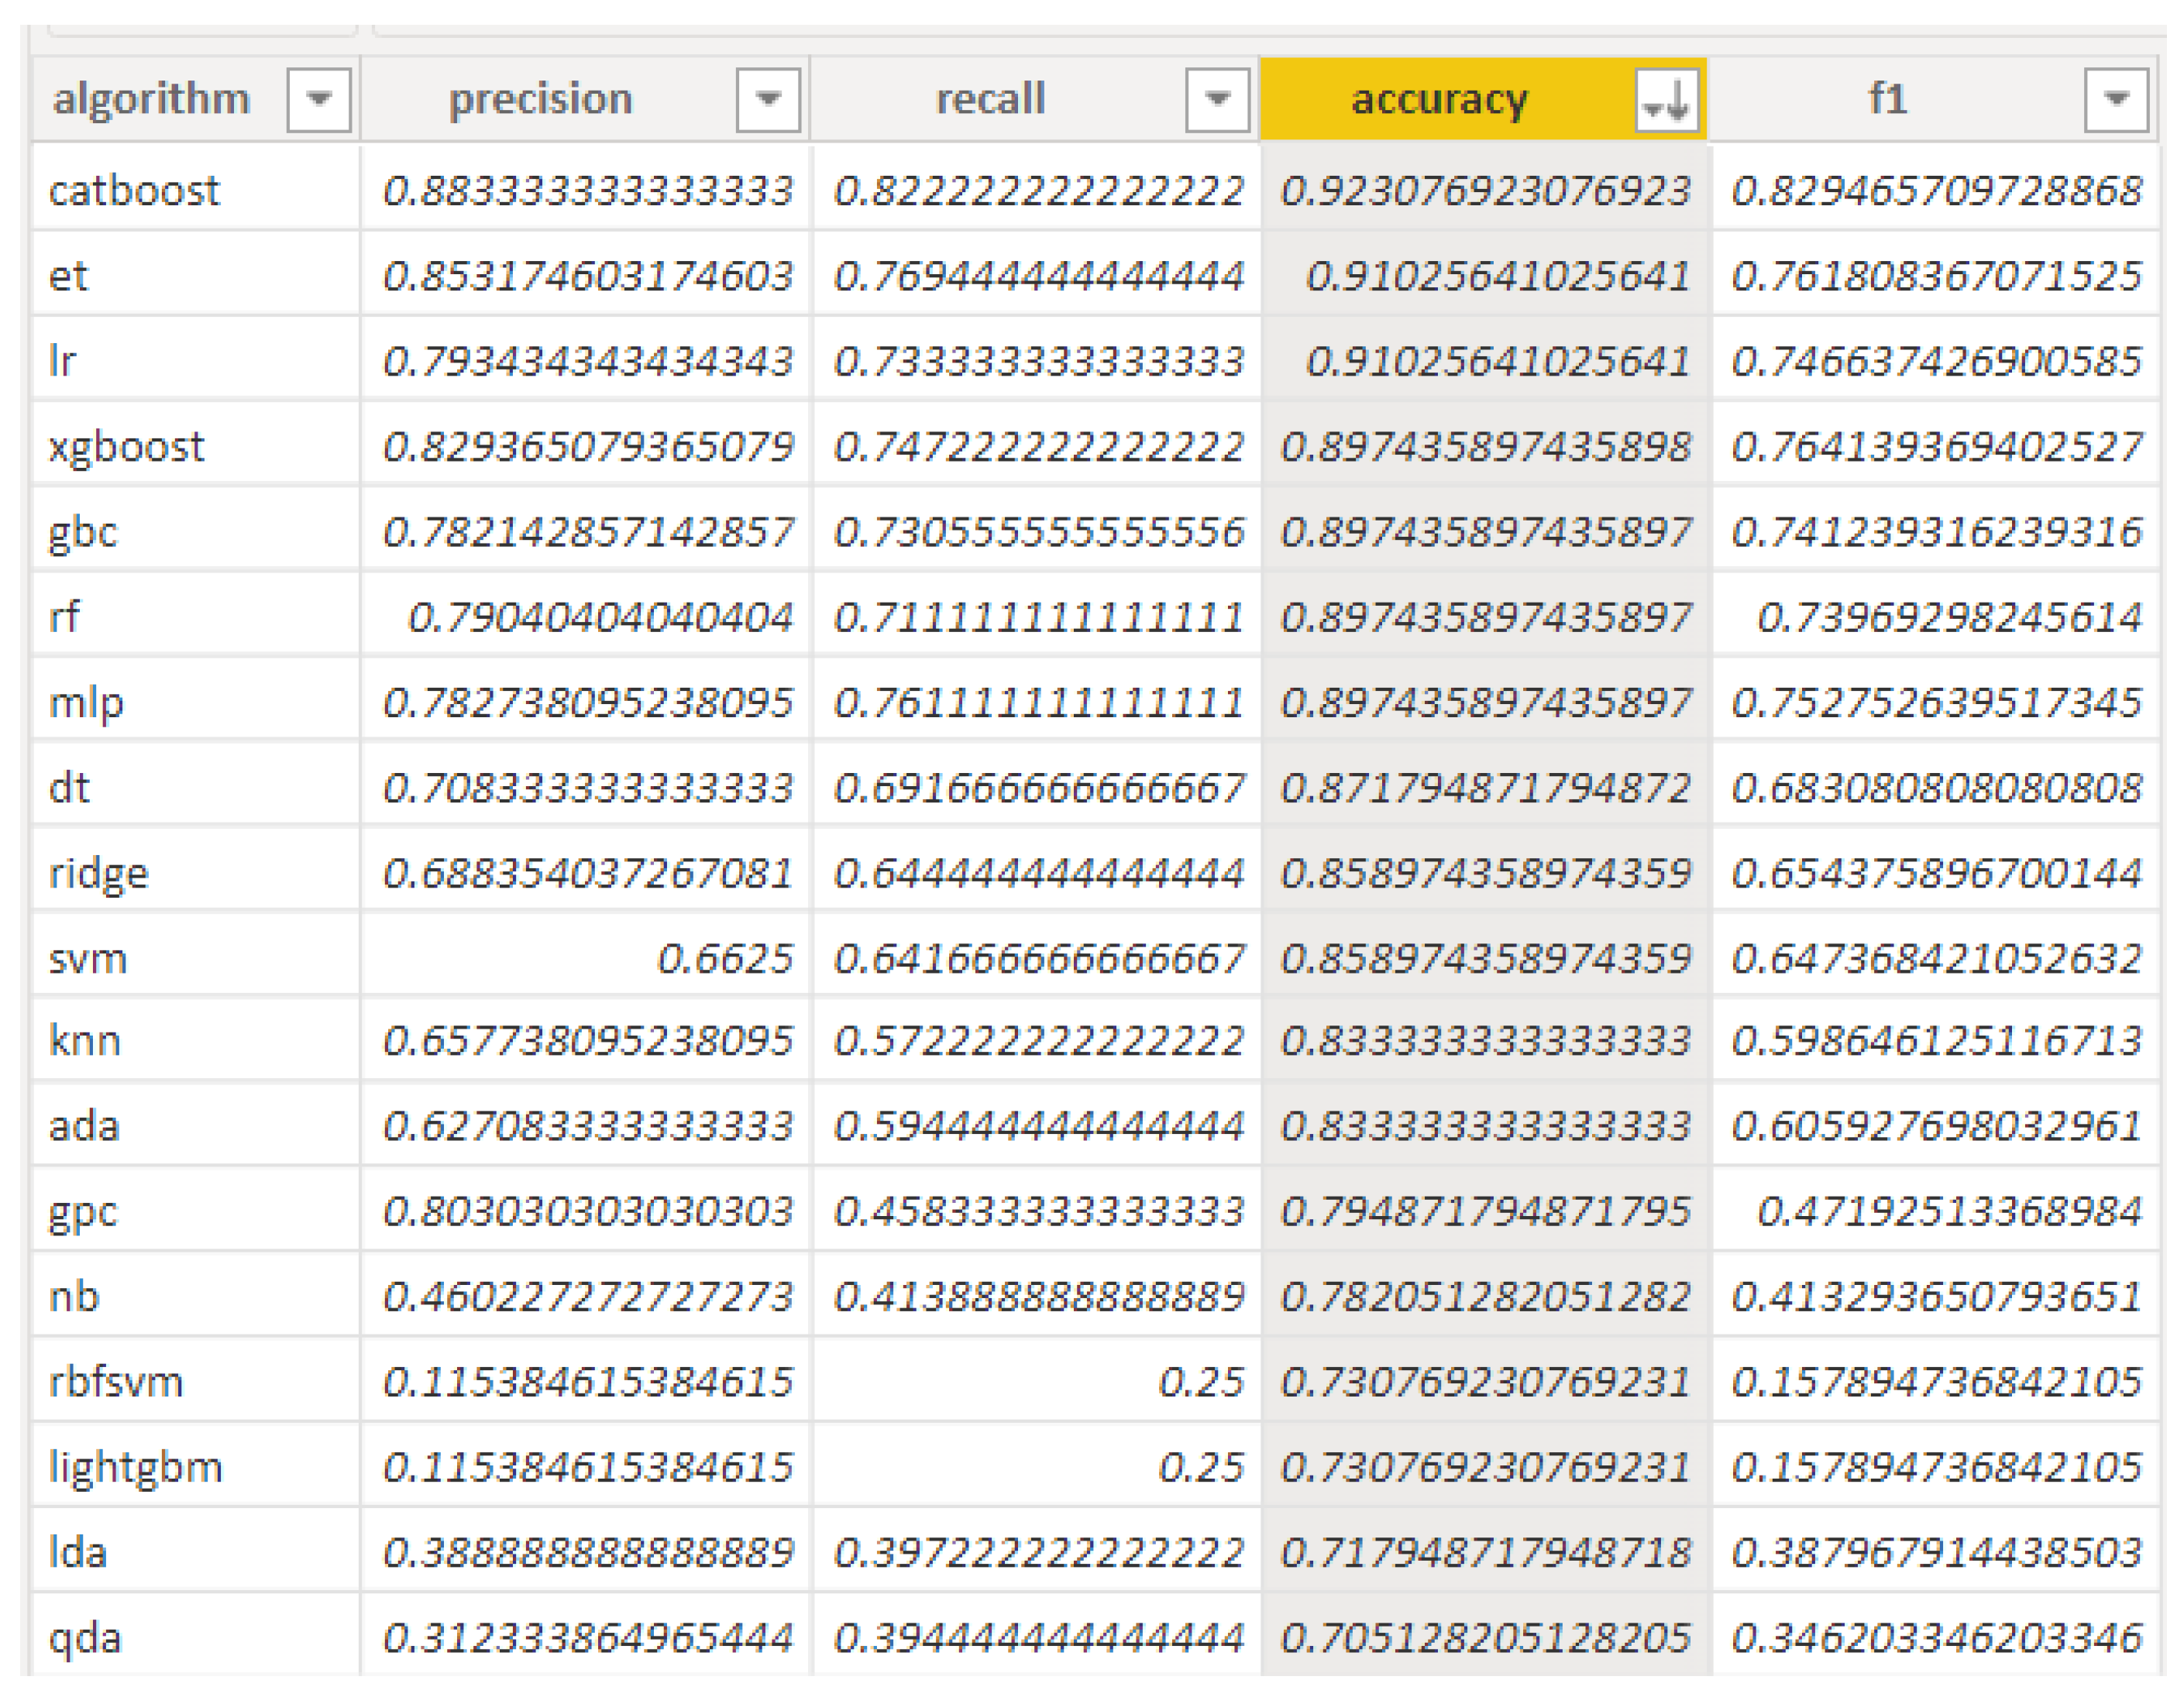
Further, the evaluation metrics for each algorithm were processed, namely precision, recall, accuracy, and f1 metric (Figure 11). Script 4 is part of the Auto ML approach.
| Script 4 |
| algorithms = [‘knn’,’dt’,’catboost’,’nb’,’rbfsvm’,’lr’,’gpc’,’mlp’,’rf’,’qda’,’ada’,’gbc’,’lda’,’et’, ‘xgboost’,’lightgbm’,’svm’,’ridge’] final_models = [finalize_model(models[i]) for i in range(len(al))] for x in range(len(al)): save_model(final_models[x], ‘D:/[x]) best = compare_models(include = al) results = pull() print(results) |
Figure 11.
O45. Evaluation metrics synthesis.
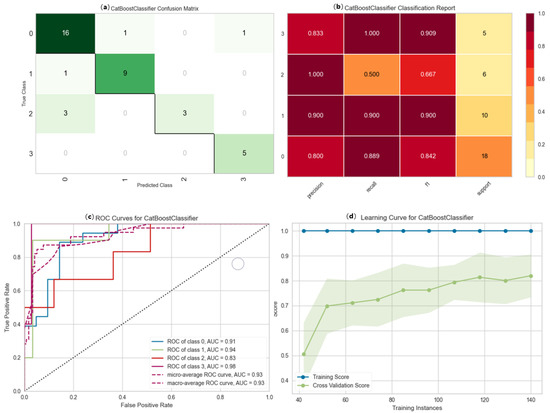
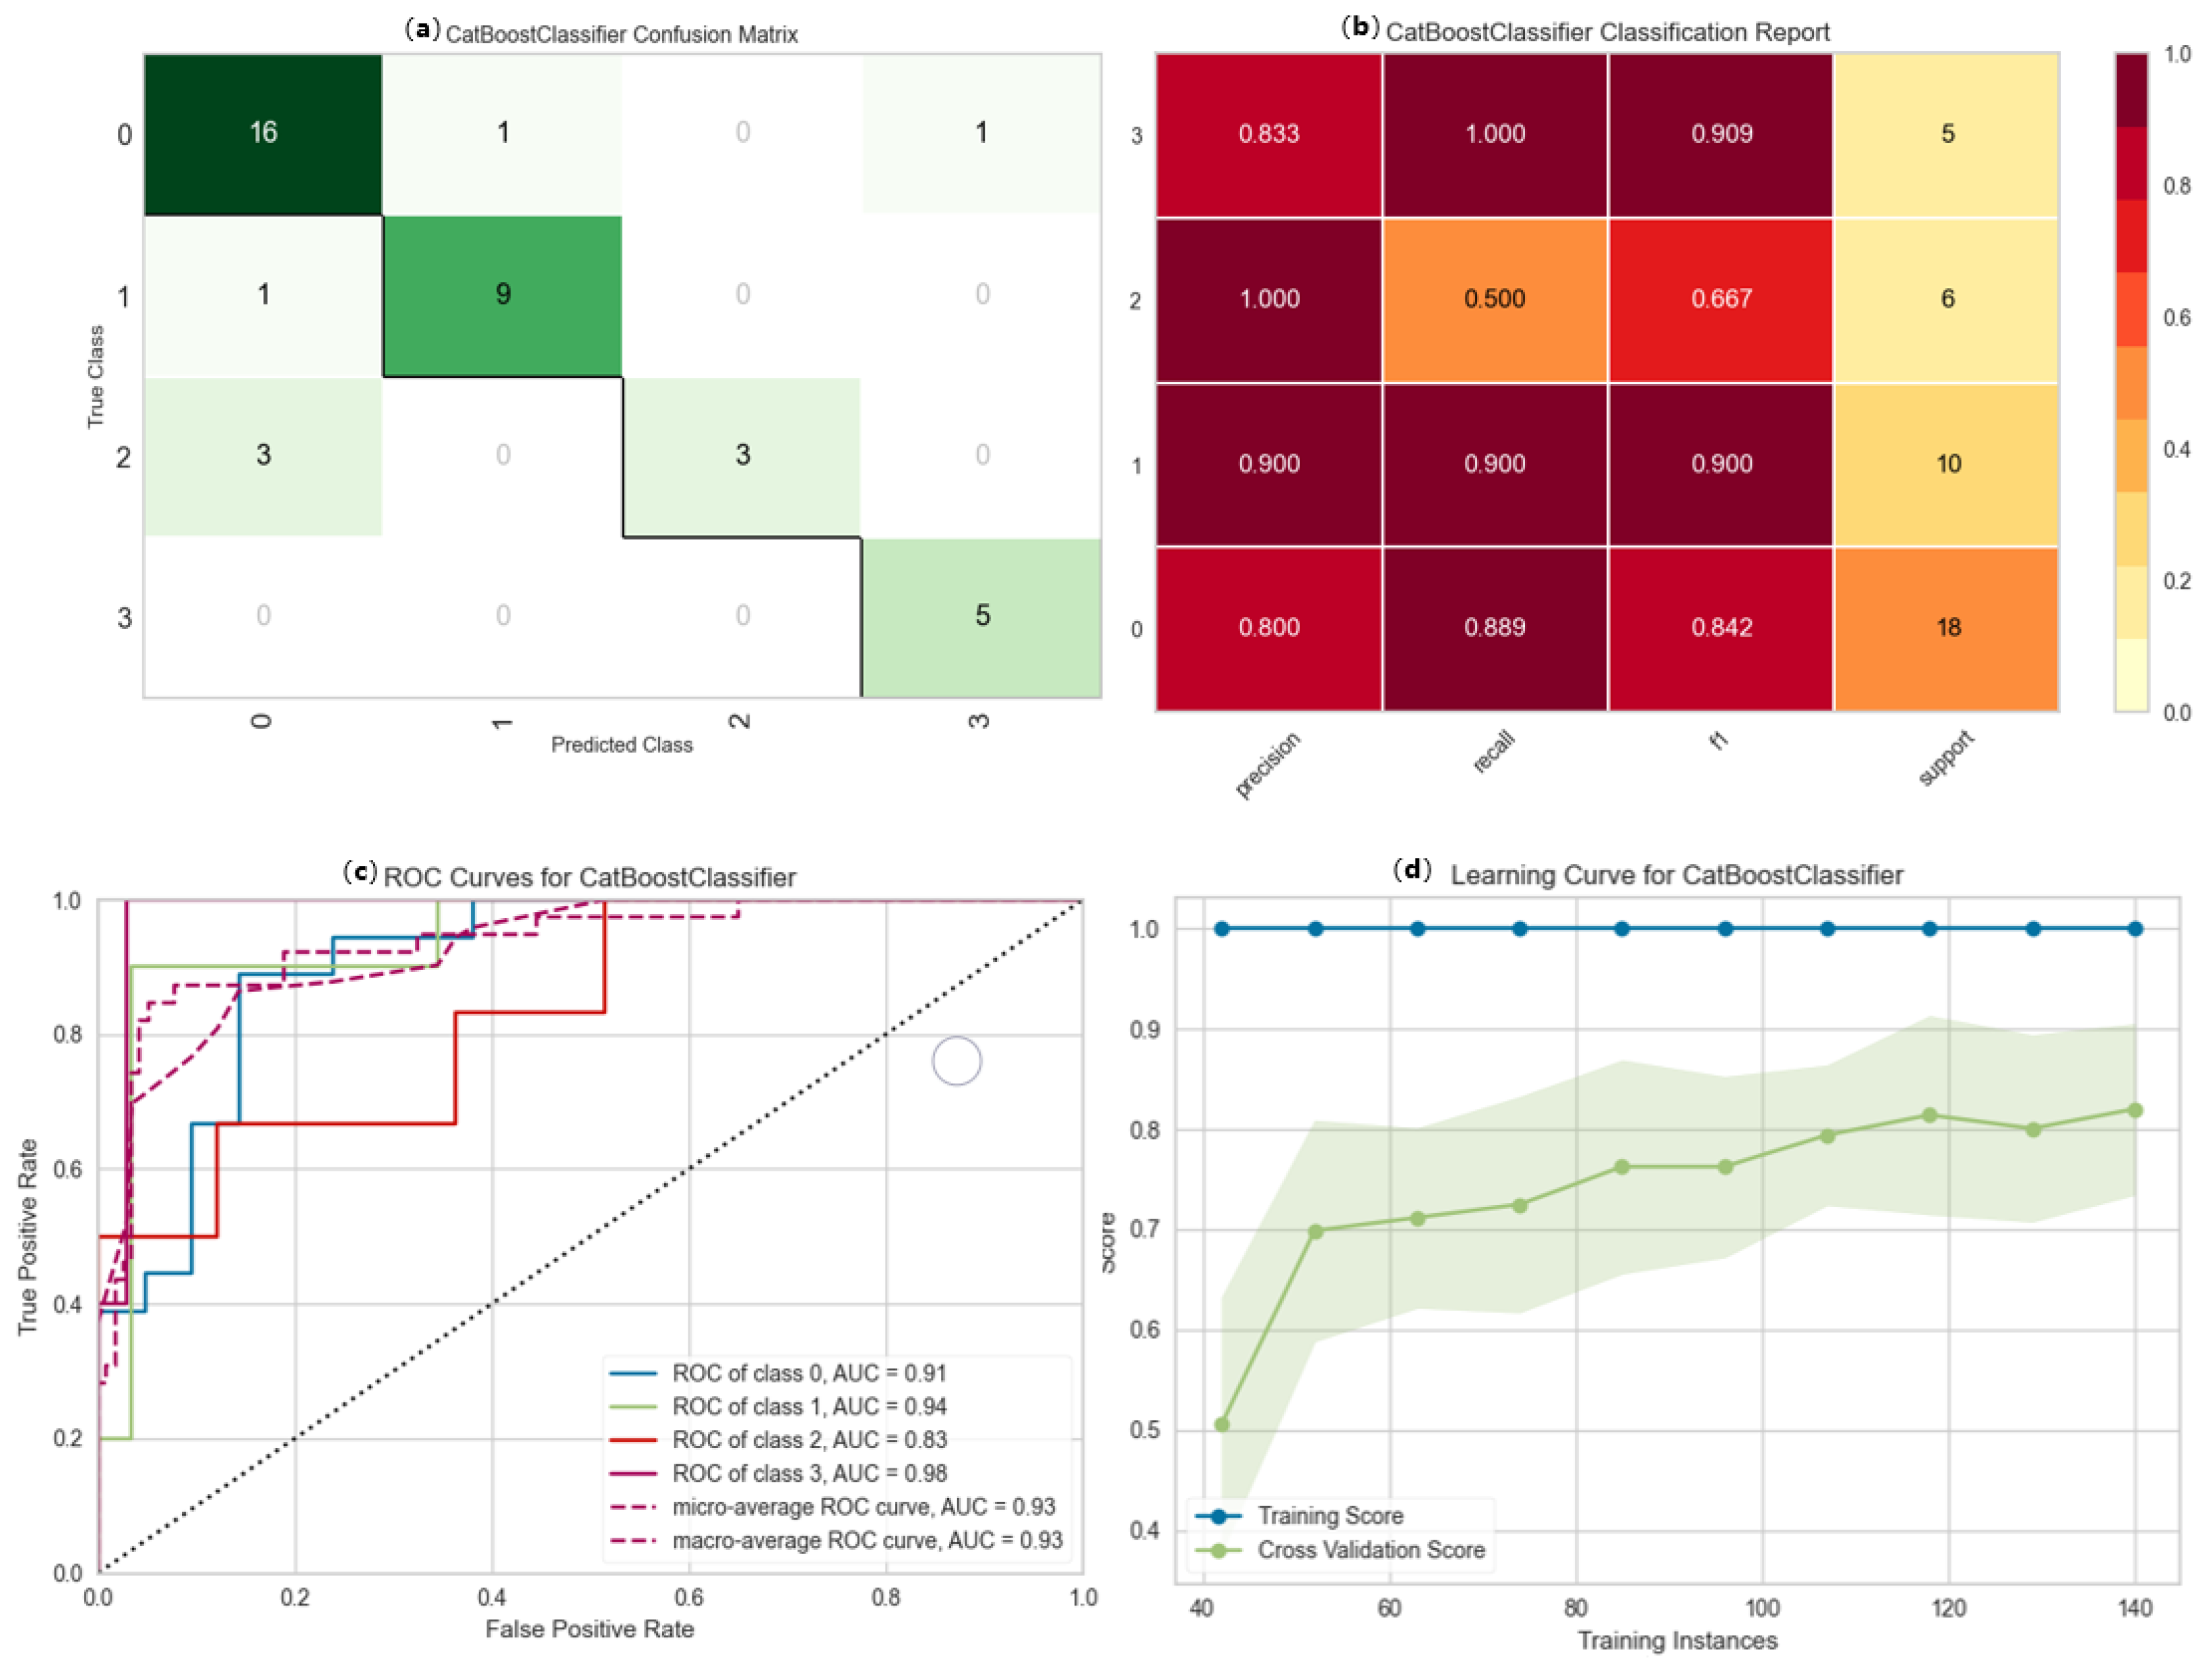
According to the values obtained for accuracy, as well as for the other metrics, the CatBoost algorithm proved to be the best performant classification algorithm in our analysis. Therefore, this will be investigated further (Figure 12). CatBoost is an algorithm for gradient boosting of decision trees. According to Pramoditha [51], CatBoost is one of the best machine learning models for tabular heterogeneous datasets.
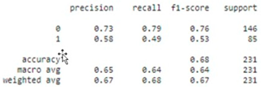
Figure 12.
CatBoost algorithm. Evaluation metrics.
The confusion matrix contains the values of true positive (TP), true negative (TN), false positive (FP), and false negative (FN) calculated for each class (Figure 12a). We observed that most instances were correctly labelled. Most instances that were incorrectly labelled belonged to class 0 (cluster 0).
The classification report presents the main classification matrices, namely, precision, recall, and F1 score for each class (Figure 12b). We can notice that:
- -
- The algorithm has a significant ability to label instances correctly, particularly in classes 1 and 2.
- -
- For classes 0, 1, and 3, the algorithm had a high capacity to find all instances; however, it correctly labelled only half of the instances in class 2.
- -
- The values of f1 for classes 0, 1, and 3 are appropriate and approximately equal to an average of 0.9; however, for class 2, f1 is only 0.667. Although the precision of the classification of the instances in class 2 was 1, the algorithm identified only three out of the six instances of class 2.
The graph of the ROC curve shows that the classification model can place the instances in a single class (Figure 12c). The graph shows that the instances of classes 0, 1, and 3 are approximately equal to the algorithm average of 0.93, indicating that these classes are well-separated. The only class for which a lower score was obtained was class 2, which had a score of 0.83. However, even for this class, the model provides a good measure of the separability.
The learning curve for the CatBoost classifier indicated that increasing the number of instances in the training set led to an increase in the validation score (Figure 12d). The training score maintains a value of one, which indicates that the model perfectly integrates each newly added instance.
According to Huilgol [52], accuracy is used when true positives and true negatives are decisive in the analysis, whereas the F1-score is used when false negatives and false positives are the most important. Furthermore, the accuracy can be used when the class distribution is similar, whereas the F1-score is a better metric when dealing with imbalanced classes.
The use of machine learning techniques for performance analysis makes a significant contribution when operating with large datasets [27]. We identified concrete applications of our proposal, namely: the application of the procedure within a multinational company or in statistical research studies on companies.
The Power BI application integrates the data obtained through 360-feeback and performs the analysis. The results are available to the management boards and research coordinators.
DSR is applied in various business and industrial engineering areas [53]. The literature indicates different approaches to designing artifacts [31,32,33,34,35,36,37,38,39,40,41]. Our proposal comes to offer a framework for data analysis using machine learning techniques. The theoretical discourse was applied to a performance analysis.
5. Conclusions
DSR opens new research perspectives in information systems and data analysis. We managed to complete an artifact design-centric approach adapted for data analysis. The proposed DSR framework describes a multi-phase process containing activities and tasks that allow the design, development, testing, validation, and communication of the considered data and information artifacts.
Artifacts engineering is performed using machine learning techniques. We recommend the use of AutoML to automate the iterative tasks of machine learning model development. Mainly based on classification algorithms, the workflow also provides for the evaluation of the applied algorithms.
The proposed design science research was applied in a managerial performance evaluation project. Further steps are necessary to define a secure connection to the operational HR database, where performance data are stored. In this sense, we are concerned to respect all internal regulations and data governance prescriptions.
Author Contributions
Conceptualization, M.M.; methodology, M.M.; software, F.D.M.; validation, M.M. and F.D.M.; writing—review and editing, M.M. and F.D.M. All authors have read and agreed to the published version of the manuscript.
Funding
This research received no external funding.
Acknowledgments
This study was conducted by Muntean Mihaela, associate member of the East European Center for Research in Economics and Business (ECREB) at the Faculty of Economics and Business Administration, West University of Timisoara. Florin Daniel Militaru, contributed to the completion of the paper, with the results of research undertaken within the Business Information Systems Department.
Conflicts of Interest
The authors declare no conflict of interest.
Appendix A
Table A1.
The 360 feedback form for measuring a manager’s performance [51].
References
- Peffers, K.; Tuunanen, T.; Rothenberger, M.A.; Chatterjee, S. A design science research methodology for information systems research. J. Manag. Inf. Syst. 2007, 24, 45–77. [Google Scholar] [CrossRef] [Scilit]
- Paquette, J. A Brief Introduction to Useful Data Artifacts—And the Next Generation of Data Analysis Systems. Medium, 2021. Available online: https://medium.com/tag-bio/a-brief-introduction-to-useful-data-artifacts-and-the-next-generation-of-data-analysis-systems-1f42ef91ce92 (accessed on 30 December 2021).
- Behn, R.D. Why measure performance? different purposes require different measures. Public Adm. Rev. 2003, 63, 586–606. [Google Scholar] [CrossRef] [Scilit]
- Stroet, H. AI in Performance Management: What Are the Effects for Line Managers? Bachelor’s Thesis, University of Twente, Enschede, The Netherlands, 2020. [Google Scholar]
- Bhardwaj, G.; Singh, S.V.; Kumar, V. An empirical study of artificial intelligence and its impact on human resource functions. In Proceedings of the 2020 International Conference on Computation, Automation and Knowledge Management (ICCAKM), Dubai, United Arab Emirates, 9–10 January 2020. [Google Scholar] [CrossRef] [Scilit]
- Eight-Step Guide to Performance Evaluations for Managers—The Management Center. 2021. Available online: https://www.managementcenter.org/article/eight-step-guide-to-performance-evaluations-for-managers/ (accessed on 30 December 2021).
- Attaran, M.; Deb, P. Machine learning: The new ‘big thing’ for competitive advantage. Int. J. Knowl. Eng. Data Min. 2018, 5, 277–305. [Google Scholar] [CrossRef] [Scilit]
- El Bouchefry, K.; de Souza, R.S. Learning in big data: Introduction to machine learning. In Knowledge Discovery in Big Data from Astronomy and Earth Observation; Elsevier: Amsterdam, The Netherlands, 2020; pp. 225–249. [Google Scholar] [CrossRef] [Scilit]
- Chakraborty, T. EC3: Combining clustering and classification for Ensemble Learning. In Proceedings of the 2017 IEEE International Conference on Data Mining (ICDM), New Orleans, LA, USA, 18–21 November 2017. [Google Scholar] [CrossRef] [Scilit]
- Alapati, Y.K.; Sindhu, K. Combining Clustering with Classification: A Technique to Improve Classification Accuracy. Int. J. Comput. Sci. Eng. 2016, 5, 336–338. [Google Scholar]
- Bertsimas, D.; Dunn, J. Optimal classification trees. Mach. Learn. 2017, 106, 1039–1082. [Google Scholar] [CrossRef] [Scilit]
- Durcevic, S. 10 Top Business Intelligence and Analytics Trends for 2020. Information Management. 2019. Available online: https://www.information-management.com/opinion/10-top-business-intelligence-and-analytics-trends-for-2020 (accessed on 20 March 2022).
- Walowe Mwadulo, M. A review on feature selection methods for classification tasks. Int. J. Comput. Appl. Technol. Res. 2016, 5, 395–402. [Google Scholar] [CrossRef] [Scilit]
- Dash, M.; Koot, P.W. Feature selection for clustering. In Encyclopedia of Database Systems; Springer: Boston, MA, USA, 2009; pp. 1119–1125. [Google Scholar] [CrossRef] [Scilit]
- Rong, M.; Gong, D.; Gao, X. Feature selection and its use in big data: Challenges, methods, and Trends. IEEE Access 2019, 7, 19709–19725. [Google Scholar] [CrossRef] [Scilit]
- Madhulatha, T.S. An overview on clustering methods. IOSR J. Eng. 2012, 2, 719–725. [Google Scholar] [CrossRef] [Scilit]
- Witten, I.H.; Frank, E.; Hall, M.A. Data Mining: Practical Machine Learning Tools and Techniques; Elsevier: Amsterdam, The Netherlands, 2011. [Google Scholar]
- Ghosal, A.; Nandy, A.; Das, A.K.; Goswami, S.; Panday, M. A short review on different clustering techniques and their applications. In Advances in Intelligent Systems and Computing; Springer: Singapore, 2019; Volume 937, pp. 69–83. [Google Scholar] [CrossRef] [Scilit]
- Celebi, M.E.; Kingravi, H.A. Linear, deterministic, and order-invariant initialization methods for the K-means clustering algorithm. In Partitional Clustering Algorithms; Springer: Cham, Switzerland, 2014; pp. 79–98. [Google Scholar] [CrossRef] [Scilit]
- Sinaga, K.P.; Yang, M.-S. Unsupervised K-means clustering algorithm. IEEE Access 2020, 8, 80716–80727. [Google Scholar] [CrossRef] [Scilit]
- Papas, D.; Tjortjis, C. Combining clustering and classification for Software Quality Evaluation. In Artificial Intelligence: Methods and Applications; Springer: Cham, Switzerland, 2014; pp. 273–286. [Google Scholar] [CrossRef] [Scilit]
- Loukas, S. K-Means Clustering: How It Works & Finding the Optimum Number of Clusters in the Data. Medium, 2020. Available online: https://towardsdatascience.com/k-means-clustering-how-it-works-finding-the-optimum-number-of-clusters-in-the-data-13d18739255c (accessed on 30 December 2021).
- Rani, Y.; Harish, R. A study of hierarchical clustering algorithm. Int. J. Inf. Comput. Technol. 2013, 3, 1115–1122. [Google Scholar]
- Webb, G.I.; Fürnkranz, J.; Fürnkranz, J.; Fürnkranz, J.; Hinton, G.; Sammut, C.; Sander, J.; Vlachos, M.; Teh, Y.W.; Yang, Y.; et al. Density-based clustering. In Encyclopedia of Machine Learning; Springer: Boston, MA, USA, 2011; pp. 270–273. [Google Scholar] [CrossRef] [Scilit]
- Grabusts, P.; Borisov, A. Using grid-clustering methods in data classification. In Proceedings of the International Conference on Parallel Computing in Electrical Engineering, Warsaw, Poland, 25 September 2002. [Google Scholar] [CrossRef] [Scilit]
- Duda, R.O.; Hart, P.E. Pattern Classification and Scene Analysis; Wiley: New York, NY, USA, 1973; Volume 3. [Google Scholar]
- Narula, G. Machine Learning Algorithms for Business Applications—Complete Guide. Emerj, 2021. Available online: https://emerj.com/ai-sector-overviews/machine-learning-algorithms-for-business-applications-complete-guide/ (accessed on 30 December 2021).
- How to Select a Machine Learning Algorithm—Azure Machine Learning. 2021. Available online: https://docs.microsoft.com/en-us/azure/machine-learning/how-to-select-algorithms (accessed on 30 December 2021).
- Zhao, L.; Lee, S.; Jeong, S.P. Decision tree application to classification problems with boosting algorithm. Electronics 2021, 10, 1903. [Google Scholar] [CrossRef] [Scilit]
- Nunamaker, J.F.; Chen, M.; Purdin, T.D.M. Systems development in information systems research. J. Manag. Inf. Syst. 1990, 7, 89–106. [Google Scholar] [CrossRef] [Scilit]
- Weber, S. Design Science Research: Paradigm or Approach? AMCIS 2010 Proceedings. 2010. Available online: https://aisel.aisnet.org/amcis2010/214/ (accessed on 2 March 2022).
- Hevner, A.; March, S.; Park, J.; Ram, S. Design science in information systems research. MIS Q. Manag. Inf. Syst. 2004, 28, 75–105. [Google Scholar] [CrossRef] [Scilit]
- Venable, J.R.; Heje, J.P.; Baskerville, R.L. Choosing a Desing Science Research Methodology. ACIS 2017 Proceedings. 2017. Available online: https://aisel.aisnet.org/acis2017/112 (accessed on 2 March 2022).
- Vaishnavi, V.; Kuechler, W.; Petter, S. (Eds.) Design Science Research in Information Systems; Association for Information Systems: Atlanta, GA, USA, 2004; Available online: http://www.desrist.org/design-research-in-information-systems/ (accessed on 2 March 2022).
- Sein, M.K.; Henfridsson, O.; Purao, S.; Rossi, M.; Lindgren, R. Action design research. MIS Q. Manag. Inf. Syst. 2011, 35, 37–56. [Google Scholar] [CrossRef] [Scilit]
- Baskerville, R.; Pries-Heje, J.; Venable, J. Soft design science methodology. In Proceedings of the 4th International Conference on Design Science Research in Information Systems and Technology—DESRIST’09, Philadelphia, PA, USA, 6–8 May 2009. [Google Scholar] [CrossRef] [Scilit]
- Bilandzic, M.; Venable, J. Towards participatory action design research: Adapting Action Research and Design Science Research Methods for Urban Informatics. J. Community Inform. 2011, 7. [Google Scholar] [CrossRef] [Scilit]
- Ahmed, M.; Sundaram, D. Design Science Research Methodology: An Artefact-Centric Creation and Evaluation Approach. In Proceedings of the Australasian Conference on Information Systems (ACIS), Sydney, Australia, 30 November–2 December 2011. [Google Scholar]
- Herselman, M.; Botha, A. Evaluating an artifact in Design Science Research. In Proceedings of the 2015 Annual Research Conference on South African Institute of Computer Scientists and Information Technologists—SAICSIT’15, Stellenbosch, South Africa, 28–30 September 2015. [Google Scholar] [CrossRef] [Scilit]
- Peffers, K.; Tuunanen, T.; Niehaves, B. Design science research genres: Introduction to the special issue on exemplars and criteria for applicable Design Science Research. Eur. J. Inf. Syst. 2018, 27, 129–139. [Google Scholar] [CrossRef] [Scilit]
- Muntean, M.; Dănăiaţă, D.; Hurbean, L.; Jude, C. A Business Intelligence & Analytics framework for clean and affordable energy data analysis. Sustainability 2021, 13, 638. [Google Scholar] [CrossRef] [Scilit]
- Elragal, A.; Haddara, M. Design science research: Evaluation in the lens of Big Data Analytics. Systems 2019, 7, 27. [Google Scholar] [CrossRef] [Scilit]
- Achampong, E.K.; Dzidonu, C. Methodological Framework for Artefact Design and Development in Design Science Research. J. Adv. Sci. Technol. Res. 2017, 4, 1–8. Available online: https://www.researchgate.net/publication/329775397_Methodological_Framework_for_Artefact_Design_and_Development_in_Design_Science_Research (accessed on 30 December 2021).
- Chicco, D.; Jurman, G. The advantages of the Matthews correlation coefficient (MCC) over F1 score and accuracy in binary classification evaluation. BMC Genom. 2020, 21, 6. [Google Scholar] [CrossRef] [Scilit]
- Martens, D.; Baesens, B. Building acceptable classification models. In Annals of Information Systems; Springer: Boston, MA, USA, 2009; pp. 53–74. [Google Scholar] [CrossRef] [Scilit]
- Choi, J.-G.; Ko, I.; Kim, J.; Jeon, Y.; Han, S. Machine Learning Framework for multi-level classification of company revenue. IEEE Access 2021, 9, 96739–96750. [Google Scholar] [CrossRef] [Scilit]
- Muhammad, R.; Nadeem, A.; Azam Sindhu, M. Vovel metrics—Novel coupling metrics for improved software fault prediction. PeerJ Comput. Sci. 2021, 7, e590. [Google Scholar] [CrossRef] [Scilit] [PubMed]
- Hossin, M.; Sulaiman, M.N. A review on evaluation metrics for Data Classification Evaluations. Int. J. Data Min. Knowl. Manag. Process 2015, 5, 2. [Google Scholar] [CrossRef] [Scilit]
- Vujovic, Ž.Ð. Classification Model Evaluation Metrics. Int. J. Adv. Comput. Sci. Appl. 2021, 12, 6. [Google Scholar] [CrossRef] [Scilit]
- Apt360. Chestionar Pentru Evaluarea Managerilor Din Prima Linie. 2019. Available online: https://www.evaluare360.ro/wp-content/uploads/2019/01/Chestionar-angajati-Manageri-prima-line2019.pdf (accessed on 30 December 2021).
- Pramoditha, R. 5 Cute Features of CatBoost. Towardsdatascience, 2021. Available online: https://towardsdatascience.com/5-cute-features-of-catboost-61532c260f69 (accessed on 30 December 2021).
- Huilgol, P. Accuracy vs. F1-Score. Medium, 2021. Available online: https://medium.com/analytics-vidhya/accuracy-vs-f1-score-6258237beca2 (accessed on 30 December 2021).
- Goecks, L.S.; De Souza, M.; Librelato, T.P.; Trento, L.R. Design Science Research in practice: Review of applications in Industrial Engineering. Gest. Prod. 2021, 28, e5811. [Google Scholar] [CrossRef] [Scilit]

Publisher’s Note: MDPI stays neutral with regard to jurisdictional claims in published maps and institutional affiliations. |
© 2022 by the authors. Licensee MDPI, Basel, Switzerland. This article is an open access article distributed under the terms and conditions of the Creative Commons Attribution (CC BY) license (https://creativecommons.org/licenses/by/4.0/).