1. Introduction
Geothermal resources can provide non-variable renewable heat and electricity, yet their early development is constrained by a distinctive asymmetry: High-cost decisions are often required before the resource is fully characterized [
1]. National and regional assessments are therefore expected to do more than indicate where temperature anomalies or surface manifestations occur [
2,
3]. They must also help decision makers determine where additional geochemistry, geophysics, slim hole drilling, community engagement, and environmental studies can most effectively reduce uncertainty. In data-limited settings, this decision is particularly difficult because the absence of observations may reflect limited exploration rather than the absence of a geothermal resource [
1,
2]. Recent depth-integrated fuzzy MCDA also demonstrates how surface and subsurface evidence can be combined and evaluated at a controlled geothermal test site [
4].
Geographic information systems (GISs) and multicriteria decision analysis (MCDA) have become established tools for integrating geological, geochemical, hydrogeological, remote sensing, and accessibility evidence into geothermal favorability assessments [
4,
5,
6,
7,
8,
9,
10,
11]. Applications span regional geothermal exploration, resource potential assessment, play fairway analysis, and screening for direct use opportunities [
5,
6,
7,
8,
9,
10,
11]. Knowledge-driven approaches are particularly useful when consistent regional or national subsurface data are unavailable [
5,
6,
7,
8], while geothermal play-fairway approaches provide a framework for organizing multiple lines of evidence and their associated confidence [
9]. Nevertheless, many regional applications remain centered on a single weighted or favorability surface [
5,
6,
7,
8,
10,
11]. Weighted aggregation is transparent and operationally convenient, but it is also compensatory because a strong score in one criterion can offset weak evidence or an unfavorable territorial condition in another. This property becomes problematic when a screening result is interpreted as an indication of uniform project readiness.
Recent geothermal play-fairway studies make the distinction between favorability and confidence increasingly explicit. The Snake River Plain workflow organized geologic, geophysical, and hydrologic evidence into resource-risk products with accompanying confidence information [
12]; comparable applications in the Modoc Plateau and Hawai‘i combined evidence, uncertainty, resource probability, and development-viability screening to support staged exploration [
13,
14,
15]. Bayesian evidential-learning and value-of-information research addresses a later decision stage by quantifying how new observations may change predicted resource outcomes [
16]. Together, these studies show that uncertainty is decision-relevant rather than merely a cartographic qualifier. However, most regional workflows still culminate in a single favorability or risk product, whereas national agencies must decide both which areas to advance and where additional information has the greatest strategic value.
Colombia provides a relevant case for examining this problem. Its geothermal systems are associated mainly with the Andean volcanic and tectonic setting, with identified hydrothermal areas in the Central Cordillera and localized sectors of the Eastern and Western Cordilleras. The national volumetric assessment considered 324 hot springs, grouped into 165 clusters, and estimated approximately 1170.2 MWe across 21 preliminary geothermal areas [
17]. However, the progression from regional resource assessment to exploration investment remains uneven. This setting provides an opportunity to examine whether favorable composite conditions necessarily correspond to exploration readiness and whether areas with unresolved evidence may instead warrant priority for additional information acquisition.
To address this limitation, this study moves beyond a single composite suitability score by separating geoscientific prospectivity, territorial compatibility, institutional alignment, and evidence gaps. Institutional alignment is retained as a contextual implementation dimension but does not enter Pareto dominance, which is constructed from prospectivity, compatibility, and evidence gap. A paired Pareto framework is then used to identify areas that are non-dominated either for advancement or for information acquisition, while robustness is evaluated under uncertainty in expert preferences and alternative transformations of key geoscientific evidence. This design allows stable composite rankings to be contrasted with non-compensatory decision efficiency and distinguishes areas that are robustly attractive for advancement from those for which their principal screening rationale is to reduce consequential uncertainty.
Research Gap and Questions
The unresolved problem is not how to add another geothermal suitability map to the literature. It is how to prevent a regional weighted score from being mistaken for uniform exploration readiness. This study addresses this problem through three questions:
How do registered Colombian geothermal areas differ when geoscientific prospectivity, territorial compatibility, institutional alignment, and evidence gaps are reported separately?
Which areas remain Pareto efficient for advancement or information acquisition under uncertainty in expert preferences and geoscientific evidence transformations?
How does non-compensatory efficiency change the interpretation of stable composite ranks and the official geothermal inventory?
The proposed answer is a paired frontier analysis for which its stability is evaluated under both expert preference and geoscientific transformation uncertainty. The advancement frontier identifies areas that are not dominated when low evidence risk is desirable, whereas the learning frontier identifies areas that are not dominated when unresolved evidence is treated as an opportunity to reduce consequential uncertainty. Secondary action labels support communication but do not replace continuous indicators, project scale validation, or reserves classification.
2. Materials and Methods
2.1. Study Context and Units of Analysis
This study covered continental Colombia using MAGNA-SIRGAS 2018/Origen-Nacional (EPSG:9377). Two connected units were analyzed. The first was a 300 m raster screening envelope defined by the availability of the transformed geothermal evidence layers. The second comprised 23 environmentally corrected polygons associated with geothermal areas or registrations. These polygons were used to summarize scores, uncertainty, evidence gaps, estimated power potential, and environmental area retention. Their interpretation is regional and exploratory: polygon means do not represent a confirmed reservoir, productive well location, or bankable capacity.
The geothermal areas correspond to recognized Andean prospects and additional registrations associated with hydrocarbon operations. The database includes an estimated electric potential attribute (MWe), development-status descriptions, environmental-conflict attributes, original polygon areas, and corrected geometries. For national contexts, municipal and departmental boundaries, official geothermal-area polygons, aquifer information, and thematic rasters were available in the project geodatabase. The project geodatabase contains 326 thermal-spring records representing 324 distinct mapped locations. Although the 2021 national volumetric assessment also considered 324 springs [
17], the two counts refer to different data structures: in the project geodatabase, two pairs of separately identified springs share mapped coordinates.
2.2. Criteria, Transformations, and Semantic Audit
Eleven conceptual criteria were retained from the expert-elicitation design (
Table 1). Continuous and categorical source variables had previously been transformed to a common 1–5 scale, where 5 represents the most favorable implemented condition and 1 represents the least favorable condition. Thermal springs and interpolated fluid temperature were evaluated within a 5 km exploration influence used by the project. The geothermal gradient combined the national bottom-hole-temperature surface [
18] with geothermal-area-specific information where available. Estimated power potential followed the national volumetric resource inventory [
17] based on the regional volumetric assessment framework [
3]. Aquifer evidence was based on the national aquifer systems map [
19]. Environmental sensitivity incorporated RUNAP protected areas, Ramsar wetlands, and páramos. The governmental-interest criterion was derived from a documentary review of 27 departmental and 226 municipal development plans. The 5 km distance was fixed a priori as a reconnaissance support radius because mapped manifestations may be displaced by several kilometers from productive or upflow zones and comparable direct-use screening has used a 5 km influence envelope [
6,
11]. The temperature interpolation was restricted to the same radius to limit extrapolation beyond the local observation support.
Supplementary File S5 reports the original variable, source, and year available in the retained project documentation; transformation thresholds; categorical coding; missing-value handling; and spatial preprocessing for every criterion. Where source-layer snapshot dates were not retained in the analytical export, S5 states that limitation explicitly.
A semantic and structural audit preceded re-integration. Departmental and municipal governmental-interest layers were averaged so that a criterion with two administrative representations did not receive twice its elicited weight. Mining-use and general land-use representations were likewise averaged into one land-compatibility criterion. National and geothermal-area gradient surfaces were treated as alternative spatial coverage for the same criterion. Territorial diversification was assigned 5 inside identified geothermal areas and 1 outside them. Finally, although the project report named the last criterion ‘scarcity of detailed studies’, its implemented 1–5 scale assigned 5 to the presence of exploratory geothermal or hydrocarbon wells and 1 to their absence. The present analysis therefore uses the monotonic and auditable name ‘detailed-study evidence’ or ‘evidence maturity’. This correction changes only the interpretation of the existing scale, not the underlying cell values. For governmental interest, each departmental and municipal plan received 5 when it contained an explicit geothermal or non-excluding FNCER project, indicator, or target, and it received 1 otherwise; averaging the two administrative signals produced possible combined values of 1, 3, or 5. This variable measures documentary policy attention, not institutional capacity, budget execution, permitting performance, or durable political commitment.
2.3. Best–Worst Method and Group Aggregation
Fifteen experts evaluated the geothermal criteria using the linear Best–Worst Method (BWM) [
20]. Expert judgments were analyzed and reported only in aggregate, without associating individual responses with identifiable participants. Participants authorized the processing of the information provided for technical and academic purposes. Each participant identified the most important criterion (Best) and the least important criterion (Worst) and completed the corresponding Best-to-Others and Others-to-Worst comparisons using the 1–9 preference scale. For expert
, the linear optimization model minimized the maximum deviation
, subject to the Best-to-Criterion and Criterion-to-Worst constraints, non-negativity, and a unit-sum weight vector. Individual
values ranged from 0.0672 to 0.1737 (median of 0.1029), providing a transparent indication of internal fit rather than a binary exclusion rule [
21,
22].
The panel was assembled through purposive, non-probability technical recruitment for geothermal-specific judgment rather than population representation. The questionnaire recorded current role, organization, energy-sector experience, and a free-text statement of geothermal experience; because it requested current position rather than academic degree, disciplinary breadth is described from self-reported roles without inferring unreported credentials. Affiliations comprised public energy, mining, environmental, or geoscience agencies (7/15; 46.7%); universities, research, or postgraduate training (4/15; 26.7%); industry, consulting, or utility organizations (3/15; 20.0%); and a professional association (1/15; 6.7%). Seven participants reported more than five years of energy-sector experience, one reported three to five years, and seven reported fewer than three years. Eleven participants (73.3%) described geothermal-related experience in research, exploration, project development, regulation, community relations, or sector organizations. Self-reported roles included geologists and geothermal specialists or consultants, academic researchers, environmental and regulatory professionals, community-relations personnel, and sector-support roles. All 15 completed BWM responses were retained. These characteristics document the breadth of the observed panel but do not make it representative of Colombia’s geothermal expert or stakeholder population.
The individual weight vector of each expert was normalized to sum to one. Let
denote the normalized weight assigned to criterion
by expert
. Group weights were obtained using the normalized geometric mean, which is appropriate for aggregating ratio-based judgments [
23]. For
experts and
criteria, the aggregated weight
of criterion
was calculated as follows:
where
is the number of experts,
is the number of criteria, and
is the normalized weight assigned to criterion
by expert
.
The clean composite score
for a cell or registered area
was then calculated as follows:
where the standardized score and aggregated weight retain the notation defined above. For the national cellwise screening surface only, a missing transformed raster value at an otherwise valid screening location received the least favorable score of 1 so that the term could not disappear from the weighted sum. Registered-area criterion means and diagnostic dimensions were instead calculated over valid cells; missing cells were not assigned 1 in those area means. Their influence on the Pareto analysis was carried separately through criterion-specific coverage and the evidence-gap indicator. The two operations therefore apply to different outputs and do not impose a double penalty on area-level prospectivity.
2.4. Dimension-Separated Diagnostics
Four diagnostics were calculated for each registered area. Geoscientific prospectivity was the within-dimension weighted mean of estimated power potential, thermal springs, fluid temperature, geothermal gradient, and aquifer evidence. Territorial compatibility was the within-dimension weighted mean of sensitive ecosystems, land compatibility, and distance from Indigenous territories. Institutional alignment was the within-dimension weighted mean of governmental interest and territorial diversification. Detailed-study evidence was reported separately. All diagnostic scores retained the 1–5 scale. Within each diagnostic dimension, the relevant area-level criterion means were combined using BWM weights renormalized to sum to one within that dimension. No normalization or aggregation was then applied across the three Pareto objectives.
Technical-data coverage was calculated as the geoscientific-weighted proportion of polygon cells with valid evidence for each of the five prospectivity criteria. An evidence-gap indicator combined (i) the absence of detailed-study evidence and (ii) missing technical coverage. For registered area
, the indicator was defined as
where
is the detailed-study evidence score rescaled from 1–5 to 0–1,
is technical-data coverage expressed as a proportion, and
controls the relative contribution of evidence maturity and data coverage. The baseline analysis used
(equal weighting). Sensitivity cases used
and
, corresponding to 30/70 and 70/30 splits, respectively. The evidence gap approaches zero where both detailed-study evidence and spatial data coverage are strong. Both advancement and learning frontiers, not only the secondary labels, were recomputed for every alpha specification.
A directed missing-data sensitivity test nevertheless recomputed each area-level geoscientific criterion as , where is the valid-cell mean, is criterion-specific coverage, and is an imputed missing-cell score. Two alternatives were evaluated: conservative imputation () and neutral imputation (). Geoscientific prospectivity and both Pareto frontiers were recomputed while retaining the original evidence-gap coverage term, thereby testing whether frontier identity depends on treating missing cells as part of prospectivity.
2.5. Non-Compensatory Advancement and Learning Frontiers
Two Pareto frontiers were calculated from the dimension-separated area scores. The advancement frontier maximized geoscientific prospectivity and territorial compatibility while minimizing evidence gap. It represents areas for which no other registered area was at least as favorable on all three dimensions and strictly more favorable on at least one. The learning frontier maximized prospectivity, compatibility, and evidence gap. A high gap is desirable only in this second objective because it represents the opportunity to reduce consequential uncertainty in an otherwise relevant area. Thus, the learning frontier is a preliminary information-gap screening tool, not a value-of-information calculation, cost-effectiveness analysis, positive recommendation, or funding rule. The learning frontier operates on registered areas as portfolio units and does not itself optimize adjacency, road or grid access, survey mobilization, or spatial clustering; membership is a pre-feasibility information-acquisition screening signal that requires a subsequent logistics and cost screen.
Pareto dominance was evaluated without assigning trade-off weights across the three dimensions. This prevents a large gain in one dimension from automatically compensating for a loss in another and distinguishes the method from a second weighted-sum ranking. Institutional alignment was reported as contextual information but excluded from dominance because an administrative signal should not determine geological or territorial efficiency. For each area, the analysis retained baseline frontier membership and the number of other areas that dominated it. This exclusion also prevents a short-term documentary policy signal from creating non-dominance independently of geoscientific prospectivity, territorial compatibility, and evidence status; institutional alignment therefore remains a contextual implementation variable. Dominance was evaluated using full-precision area diagnostics and a numerical tolerance of . An area was considered to dominate another when it was no worse than the other area, within , on all objectives and better by more than on at least one objective. The corresponding supplementary analysis script implements this rule exactly.
2.6. Expert-Panel Resampling and Frontier Stability
Sensitivity to the composition of the observed expert panel was evaluated through a non-parametric bootstrap. In each of 10,000 replicates, 15 experts were sampled with replacement from the observed panel. Group weights were recalculated through the geometric mean, applied to the 23 area-level criterion vectors, and converted to ranks. The diagnostic dimensions and evidence gap were then recomputed, and both Pareto frontiers were reevaluated. For every criterion and area, the analysis reports the 2.5th and 97.5th percentiles. Area-level outputs include the score interval, median rank, rank interval, empirical frequencies of appearing in the top three and top five, and empirical frequencies of membership in each frontier. Reporting how often an alternative retains a rank or decision status follows the broader acceptability principle used in decision analysis under uncertain preferences [
24]; here, however, the sampling distribution is the observed expert panel rather than an unrestricted weight space. The procedure does not represent all sources of uncertainty, including measurement error and alternative transformations, but directly tests sensitivity to expert panel composition. The same resampled expert indices were applied jointly across all criteria, preserving each respondent’s complete preference vector and the within-expert dependence among criterion weights. The elicitation did not collect criterion-specific confidence or expertise scores, so the bootstrap does not estimate a hierarchical expertise model; criterion-weighted resampling is a priority for future elicitation designs. Accordingly, these percentiles and membership frequencies describe perturbations of the finite observed panel and are not population confidence intervals or estimates of population-level expert uncertainty.
2.7. Geoscientific-Transformation Sensitivity
Transformation-model uncertainty was evaluated for estimated MWe, thermal springs, fluid temperature, and geothermal gradient. These four layers account for 0.4333 of the total BWM weight and 84.35% of the geoscientific dimension. For every valid 300 m cell in the original geodatabase, the delivered standardized score
was first mapped to the unit interval as
and then transformed according to
The exponent yields a permissive concave membership function, reproduces the delivered linear transformation, and yields a conservative convex function. The bounding exponents were selected a priori as reciprocal deviations around the linear case, since . They provide a moderate, log-symmetric perturbation of membership function curvature while preserving the scale endpoints and the ordering within each layer. These bounds were defined as part of the robustness analysis and should not be interpreted as confidence limits or estimates of measurement error. Applying the three alternatives independently to the four geoscientific layers produced evidence models, after which zonal means and both Pareto frontiers were recomputed.
Transformation robustness was summarized using two outputs. Evidence model frontier frequency is the fraction of the 81 scenarios in which an area is nondominated under the baseline group weights, while Jaccard similarity measures retention of frontier identity relative to the linear baseline. Joint robustness frequency was then estimated from 10,000 Monte Carlo replicates by pairing one expert bootstrap weight vector with one transformation scenario selected uniformly from the 81 scenarios and recomputing both frontiers. Equal scenario selection gives each of the = 81 cells of the factorial stress test the same representation; it does not assign an empirical probability to any transformation model. Expert-only bootstrap membership frequency remains a separate output. Because the three membership functions are stress test cases rather than calibrated stochastic models, and are robustness frequencies and should not be interpreted as empirical probabilities of spatial layer errors. In each joint replicate, the expert bootstrap draw and the transformation scenario were selected independently. This independence is a transparent design assumption because this study provides no empirical basis for associating an expert’s preferences with a particular transformation model. Accordingly, is conditional on this independence assumption and would require reinterpretation if such dependence were established.
2.8. Secondary Action Labels and Environmental Retention
For communication after the Pareto analysis, secondary action labels were defined from the sample medians of geoscientific prospectivity, territorial compatibility, and evidence gap. Values equal to a median were assigned to the upper side of that dimension; thus, ‘high’ means greater than or equal to the median, and ‘low’ means strictly below it. Areas high in prospectivity and compatibility were labeled advanced candidates when their gap was low, or they were labelled characterize-first opportunities when it was high. Areas high in prospectivity but low in compatibility were labeled conflict-sensitive. Areas low in prospectivity and low in evidence gap were labeled evidence-rich with lower relative prospectivity; the remainder were frontier research targets. Under this rule, the exact median values for Cerro Bravo and Villamaría–Termales are consistently assigned to the upper prospectivity and upper evidence-gap sides, respectively. These median rules are a descriptive communication layer, not a universal cutoff or a portfolio optimization model.
Environmental retention was measured as 100 times the corrected polygon area divided by its original registered area. The national clean surface was screened at the project’s reference threshold of 3.5. Cells above this threshold were intersected with official geothermal polygons and municipal boundaries to identify how much high-priority area remained outside the existing inventory. All raster calculations used a 300 m cell size (0.09 km2). The territorial-diversification mask was a rasterization of the same 23 official geothermal-area polygons used in the overlap comparison, and the estimated potential was assigned through inventory-linked influence zones. The overlap statistic was therefore treated as an internal consistency check, not independent validation. To expose this dependence, the national screen was repeated after removing potential and territorial diversification; renormalizing the remaining nine weights; and applying thresholds of 3.25, 3.50, and 3.75. The polygon correction defines the spatial support for zonal summaries, while the sensitive-ecosystem layer enters once as a proximity criterion within territorial compatibility. Environmental retention is not multiplied into the composite and is not a Pareto objective. The two stages can nevertheless reinforce environmental screening, so robustness to alternative correction geometries remains a validation priority.
3. Results
3.1. Criterion Importance and Expert-Panel Sensitivity
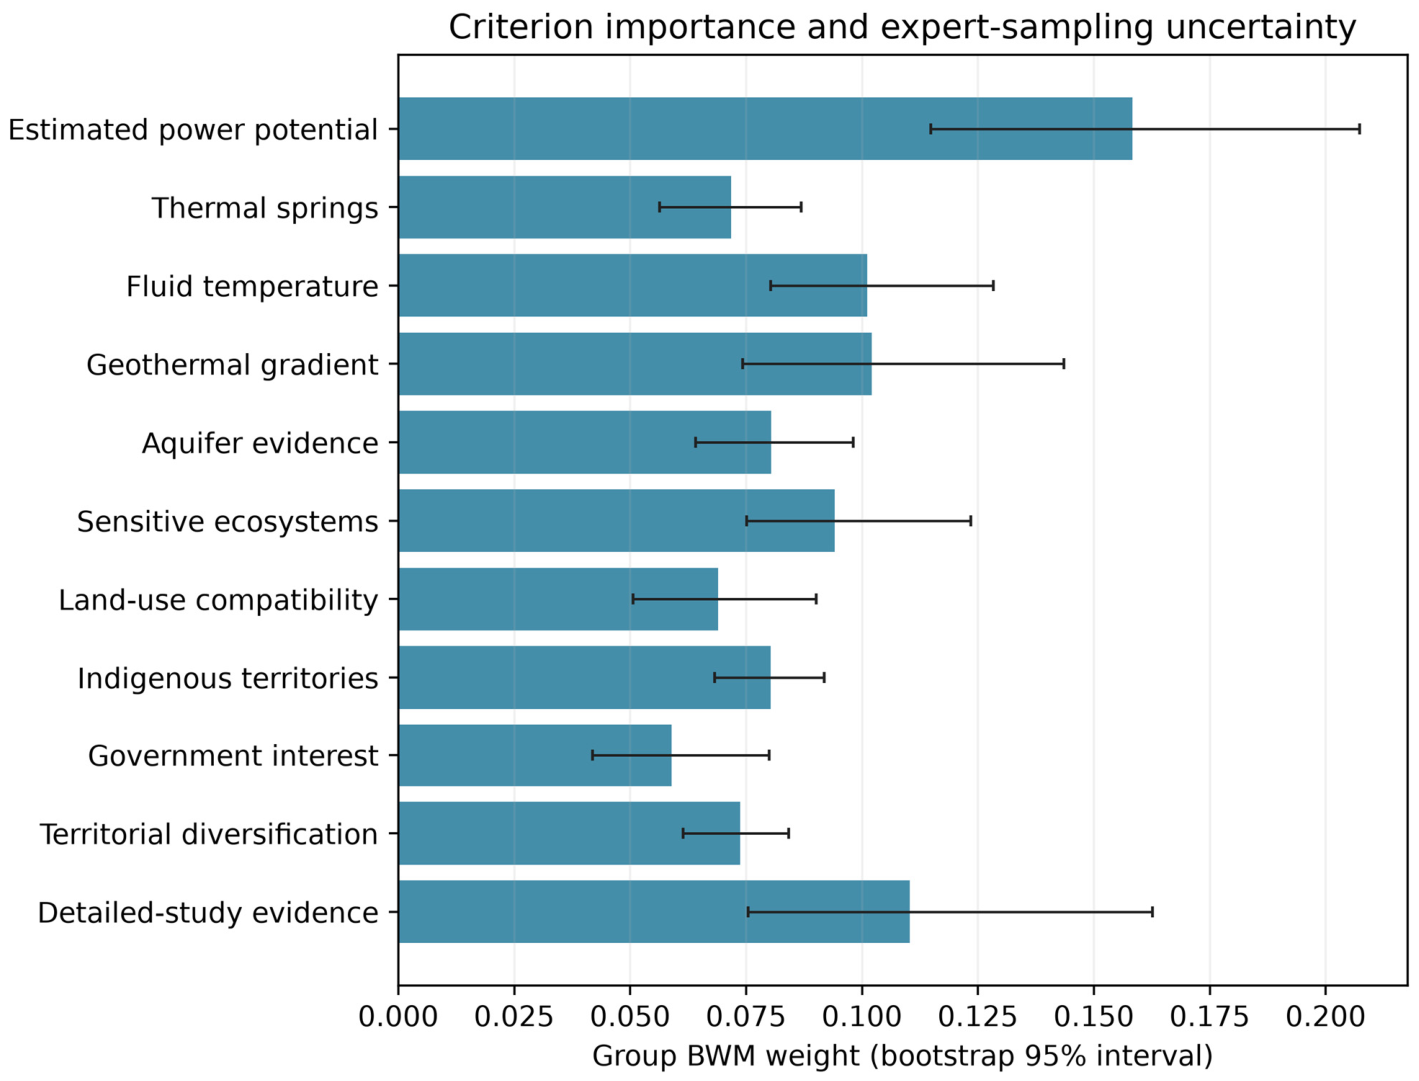
Estimated electric potential was the most influential criterion, with a group weight of 0.1584. Detailed-study evidence followed at 0.1102, while geothermal gradient (0.1021) and fluid temperature (0.1011) had nearly equal group importance. Sensitive ecosystems received 0.0941. The remaining criteria ranged from 0.0589 for government interest to 0.0804 for aquifer evidence. This ordering indicates that the panel did not frame geothermal prioritization as resource magnitude alone: Evidence maturity and environmental compatibility together accounted for substantial decision weight.
Figure 1 summarizes the group BWM weights and their 95% expert-resampling percentile intervals across the 11 criteria.
The expert-resampling percentile intervals reveal where apparent precision should be avoided. Estimated potential ranged from 0.1148 to 0.2073 across the central 95% of resampled panels. Detailed-study evidence had an interval of 0.0754–0.1626 and the largest expert standard deviation (0.1263 after individual-vector normalization). Geothermal gradient also showed appreciable variability (0.0742–0.1435). By contrast, territorial diversification and the Indigenous-territory criterion had narrower intervals. The corresponding group weights, expert-resampling percentile intervals, and expert dispersion values are reported in
Table 2. These patterns imply that adding experts with different exploration backgrounds could alter mid-ranked areas even when the leading tier remains stable.
3.2. Composite Ranking Is Not the Same as Geoscientific Prospectivity
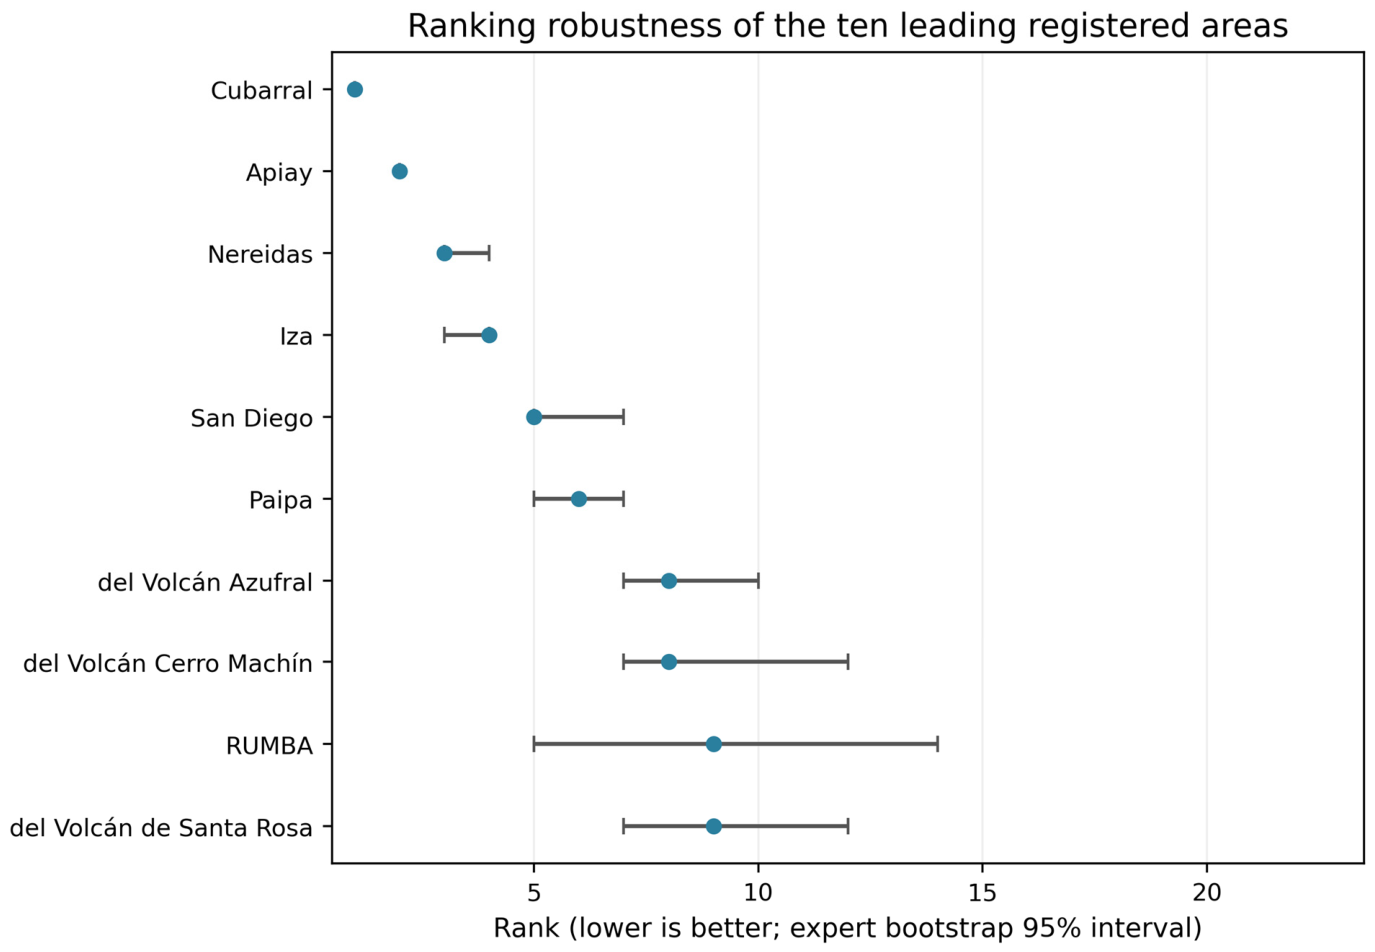
Cubarral achieved the highest clean composite score (3.806; 95% expert-resampling percentile interval of 3.676–3.933) and ranked first in every bootstrap replicate. Apiay was second (3.600; 3.478–3.720) and also retained its position in every replicate. Nereidas ranked third with a median bootstrap rank of 3 and a 71.5% expert-resampling frequency of appearing in the top three. Iza ranked fourth overall but entered the top three in 28.5% of replicates. The next tier, comprising San Diego, Paipa, Cerro Machín, Azufral, RUMBA, and Santa Rosa, showed progressively wider rank intervals. RUMBA was especially sensitive, with a 95% rank interval from 5 to 14.
Figure 2 shows the rank uncertainty of the ten leading registered areas under expert resampling, and
Table 3 summarizes their clean composite scores and diagnostic dimensions.
The dimension-separated results change the interpretation of this ordering. Paipa (3.132) and Santa Rosa (3.135) had the highest geoscientific prospectivity scores among the leading areas, despite ranking sixth and tenth in the composite. Iza also scored highly on prospectivity (3.080). Cubarral’s composite leadership instead reflected a balanced combination of moderate-to-high prospectivity, very high territorial compatibility (4.842), strong evidence maturity, institutional alignment, and full environmental-area retention. Apiay had high compatibility and mature evidence but fell just below the sample median for geoscientific prospectivity. The composite is therefore useful as a descriptive screening reference, but it must not be reported as a geological resource ranking.
3.3. Advancement and Learning Frontiers
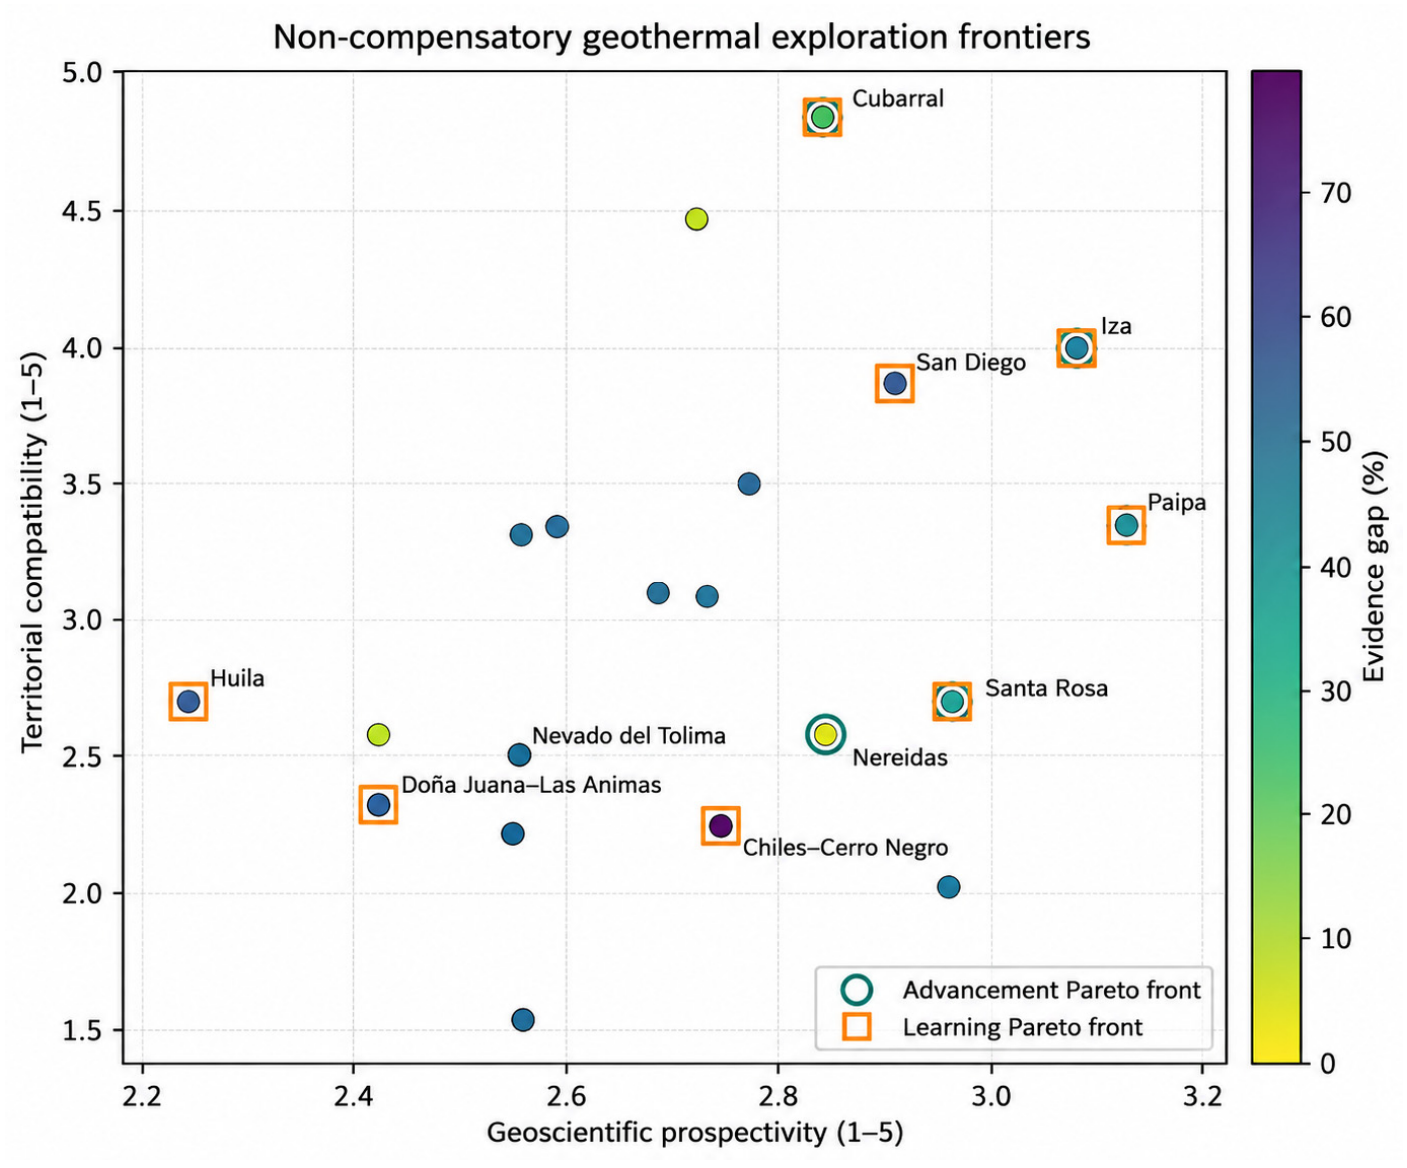
Five areas formed the baseline advancement frontier: Cubarral, Nereidas, Iza, Paipa, and Santa Rosa. Cubarral, Nereidas, and Paipa remained advancement-efficient in every expert bootstrap; Iza did so in 99.68% of replicates and Santa Rosa in 84.03%. The result is not a five-site ranking. Each area survives because no competitor simultaneously improves prospectivity and territorial compatibility while reducing its evidence gap. Nereidas, for example, remains efficient because its combination of prospectivity and mature evidence is not replicated elsewhere, despite comparatively low compatibility. Santa Rosa is less stable because modest changes in dimension weights can make it dominated by a nearby alternative.
Figure 3 shows the advancement frontier in the prospectivity, compatibility, and evidence-gap space.
Nine areas formed the baseline learning frontier. Cubarral, Iza, San Diego, Paipa, Santa Rosa, Chiles–Cerro Negro, Nevado del Tolima, Doña Juana–Las Ánimas, and Huila were non-dominated when a large evidence gap was treated as an information-acquisition screening signal. San Diego, Chiles–Cerro Negro, and Huila had 100% learning-front membership; Nevado del Tolima had 99.39%, Paipa had 97.77%, Doña Juana–Las Ánimas had 94.63%, and Santa Rosa had 61.31%. Paletará was not on the baseline frontier but entered it in 10.07% of resampled panels. These empirical frequencies distinguish targets with persistent non-dominance under expert-panel resampling from cases for which their learning-front membership depends on expert composition. The corresponding learning frontier is also shown in
Figure 3.
The contrast with the weighted ranking is consequential. Apiay occupied the second composite position in every bootstrap replicate, yet it belonged to neither Pareto frontier because other areas offered a more efficient combination of prospectivity, compatibility, and evidence status. Conversely, Huila ranked near the lower end of the composite but remained on the learning frontier because its evidence deficit represents a distinct unresolved exploration question. A stable composite rank and a stable decision frontier therefore answer different questions.
Table 4 summarizes the baseline frontier roles and their robustness under expert resampling, geoscientific transformation scenarios, and the joint ensemble.
3.4. Robustness to Geoscientific-Transformation Uncertainty
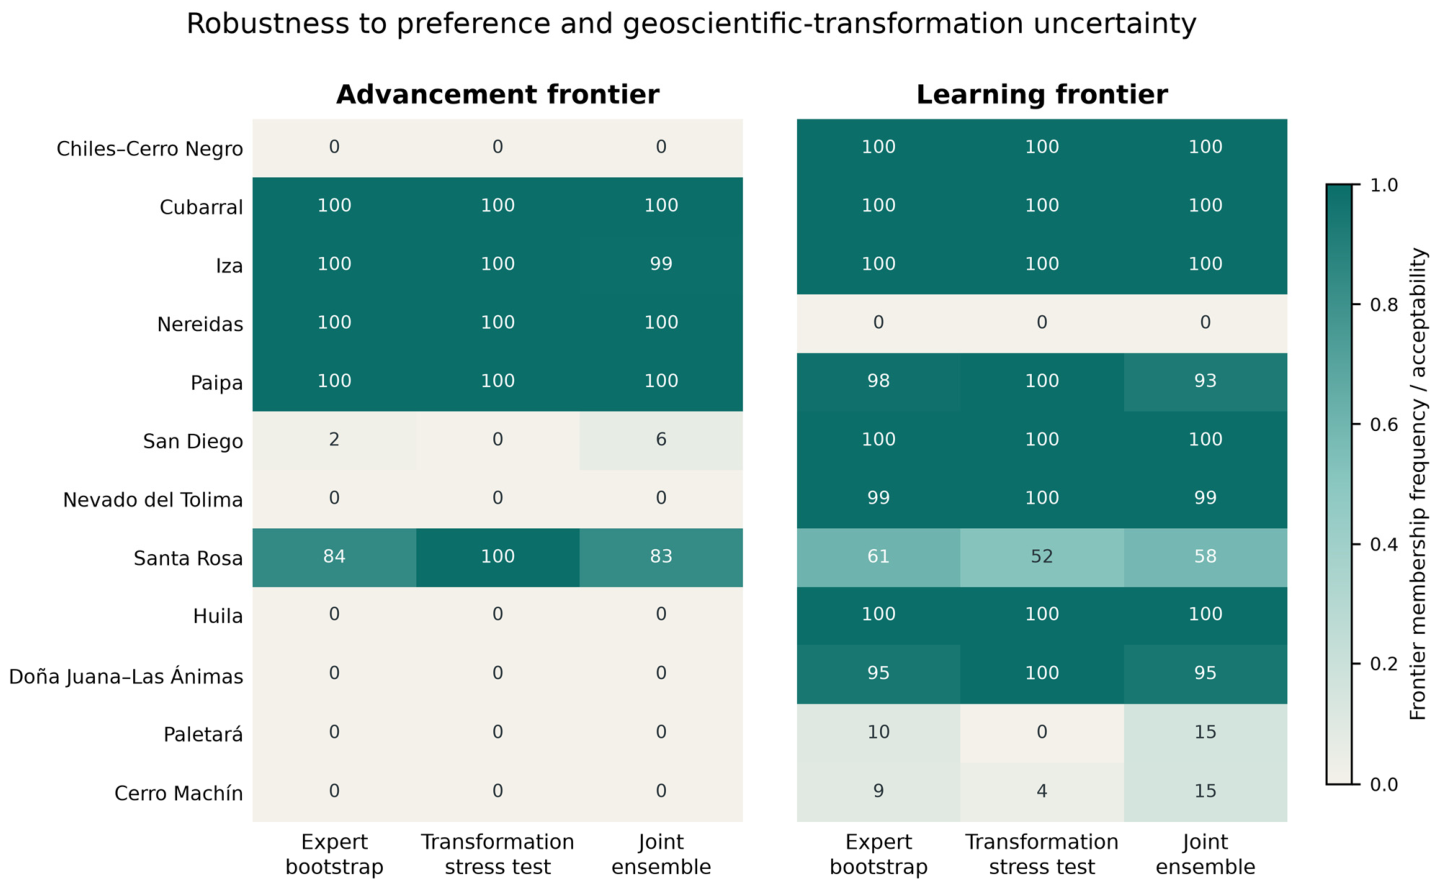
The linear cellwise scenario reproduced the delivered zonal means to machine precision. The advancement frontier was identical in all 81 evidence models (Jaccard = 1.000): Cubarral, Nereidas, Iza, Paipa, and Santa Rosa each had TF (advancement) = 100%. The learning frontier was also highly stable, with Jaccard similarity from 0.889 to 1.000 (median 0.900) and exact reproduction of the baseline set in 39 scenarios. Eight of the nine baseline learning members persisted in every scenario. Santa Rosa was the only baseline member sensitive to transformation shape, with TF (learning) = 51.9%; Cerro Machín entered in 3.7% of scenarios. The changes therefore concerned a boundary case rather than wholesale replacement of the decision set.
The joint ensemble did not overturn the core conclusion. Joint advancement robustness frequency was 100% for Cubarral and Nereidas, 99.96% for Paipa, 98.84% for Iza, and 83.38% for Santa Rosa. For learning, Cubarral, Iza, San Diego, Chiles–Cerro Negro, and Huila retained 100% joint robustness frequency; Nevado del Tolima, Doña Juana–Las Ánimas, and Paipa remained above 92.9%, while Santa Rosa declined to 58.2%. Paletará and Cerro Machín reached only 15.3% and 15.1%, respectively, identifying them as jointly sensitive boundary cases rather than robust frontier members.
Table 4 and
Figure 4 thus distinguish preference sensitivity, transformation sensitivity, and joint sensitivity at the decision endpoint.
The missing-data sensitivity separated a stable core from rule-sensitive boundary cases. Conservative score-1 imputation reproduced the five-member advancement frontier exactly (Jaccard = 1.000); its learning frontier had Jaccard = 0.800 because Santa Rosa left and Gabriel López entered. Neutral score-3 imputation retained Cubarral, Nereidas, and Santa Rosa on the advancement frontier but removed Iza and Paipa (Jaccard = 0.600); the learning frontier retained eight of nine baseline members, with only Paipa leaving (Jaccard = 0.889). Thus, the principal advancement and learning signals persisted, but some frontier identities depend on how incomplete geoscientific coverage is incorporated. These nonspatial endpoints are reported in
Supplementary File S6. Varying α across 0.30, 0.50, and 0.70 left both frontier identities unchanged, with advancement and learning Jaccard similarities of 1.000 in every specification.
Supplementary File S8 releases the area-level evidence gaps and frontier endpoints.
3.5. Secondary Exploration-Action Labels
Three areas were classified as advanced exploration candidates: Cubarral, Paipa, and Santa Rosa. They combine above-median geoscientific prospectivity with above-median territorial compatibility and a below-median evidence gap. The label does not imply equivalent project maturity. Cubarral is a registered area associated with subsurface hydrocarbon information and full spatial retention; Paipa and Santa Rosa require very different technical and environmental programs. The value of the class is that new spending can emphasize prospect testing and project-specific validation rather than basic regional data acquisition.
Four areas were characterize-first opportunities: Iza, San Diego, Azufral, and Villamaría–Termales. Their relative resource and compatibility conditions justify continued attention, but evidence gaps remain above the median. The appropriate next step is targeted information gain: geochemical sampling, updated structural interpretation, magnetotellurics or other geophysical surveys, and carefully staged drilling where warranted. Five areas—Nereidas, Cerro Machín, Chiles–Cerro Negro, Cerro Bravo, and Paletará—were conflict-sensitive resources because their prospectivity was above the median while compatibility was below it. For these areas, technical exploration should be coupled with early environmental and rights-based procedural work; advancing subsurface knowledge without addressing territorial conditions would leave a major implementation risk unresolved.
Four areas were evidence-rich, with lower relative prospectivity: Apiay, RUMBA, Cumbal, and Sotará–Sucubún. These sites should not be promoted as the strongest resource prospects merely because their evidence status is comparatively favorable. For Apiay and RUMBA, this reflects mature subsurface evidence, whereas for Cumbal and Sotará–Sucubún, it primarily reflects high technical data coverage. They may nevertheless provide useful analogue, monitoring, or alternative use opportunities, but their resource concept must be matched to temperature and end-use requirements. Seven areas were frontier research targets. These require low-cost reconnaissance and conceptual model development before they compete for expensive exploration funds.
Figure 5 shows the distribution of the 23 registered areas in terms of geoscientific prospectivity and evidence gap, with bubble size proportional to the estimated MWe and color indicating the secondary action label.
Table 5 summarizes the secondary exploration action classes and the corresponding decision implications.
The action labels were stable to the evidence-gap mixing assumption. In total, 19 of 23 areas retained the same label under the 30/70, 50/50, and 70/30 combinations of study maturity and technical coverage. Changes were limited to cases near the median gap boundary; no area moved between a conflict-sensitive label and a compatibility-favorable label because territorial compatibility was independent. This supports the labels for communication, while the continuous indicators and frontier robustness frequencies should govern decisions near boundaries. Because the medians are calculated from the current 23-area comparison set, the labels are comparison-dependent and may change when new areas are added even if an existing area’s measurements do not. They should therefore be used as communication descriptors rather than eligibility thresholds; continuous diagnostics, frontier membership, and robustness endpoints remain the decision basis.
3.6. Environmental Retention and Spatial Concentration
Environmental correction substantially reduced the spatial footprint of many recognized geothermal areas. The median retained share was 53.4%, and 11 of the 23 polygons retained less than half of their original area. Cumbal retained 12.9%, Santa Rosa retained 14.7%, Nevado del Tolima retained 16.3%, Sotará–Sucubún retained 25.3%, Paletará retained 30.5%, and Paipa retained 46.9%. In contrast, Cubarral, Apiay, Nereidas, and Iza retained their full mapped areas. The retention metric should not be read as an environmental-impact assessment; it quantifies the spatial consequence of applying the project’s national sensitivity correction and shows where site-scale alternatives are likely to be narrow.
Figure 6 shows the relationship between the retained area after environmental correction and the clean composite score, with bubble size proportional to the estimated MWe. The denominator is the original registered geometry, not a reconstructed pre-correction suitability surface; consequently, low retention can reflect both environmental exclusions and an initially broad or overestimated boundary. The metric does not assume that every original cell was equally developable.
The clean national surface contained 109,169 valid screening cells, equivalent to 9825.21 km
2. Under the 11-criterion model, the share of high-score cells inside registered polygons was 99.5% at 3.25, 99.7% at 3.50, and 100% at 3.75. At the reference threshold of 3.50, 3685 cells (331.65 km
2) were selected, including 12 cells (1.08 km
2) outside the polygons in Becerril, Cesar. After removing estimated potential and territorial diversification and renormalizing the remaining nine weights, the corresponding inside-polygon shares were 55.2%, 69.6%, and 85.3%; at 3.50, 996 of 3280 high-score cells (89.64 km
2) occurred outside the registered inventory. The threshold-only result is stable, but the reduced-model result confirms that the original 99.7% largely reflects inventory-linked criteria. It is therefore an internal consistency diagnostic rather than independent validation of the official polygons. The Becerril signal remains a baseline data-check and reconnaissance cue, not evidence of a new developable field.
Table 6 reports the full comparison, and
Figure 7 maps the baseline threshold of 3.50.
4. Discussion
4.1. From Favorable Cells to Exploration Decisions
The central result is interpretive rather than cartographic: a single high geothermal score can arise from different combinations of resource promise, evidence maturity, territorial compatibility, and policy alignment. This distinction is consistent with geothermal play-fairway thinking, which treats evidence and confidence as related but non-identical properties [
9]. It is also essential in Colombia, where one deep or hydrocarbon well can sharply improve knowledge without establishing the strongest hydrothermal prospect and where a high-potential volcanic area may face a narrow environmentally compatible footprint.
The contrast between Apiay and Iza illustrates the practical value. Apiay is second in the composite and extremely rank-stable because it combines well-related evidence and strong compatibility; nevertheless, its geoscientific score is comparatively lower, and it is dominated on both decision frontiers. Iza ranks fourth, has higher geoscientific prospectivity and compatibility, and a large evidence gap; it remains efficient for both advancement and learning in essentially every resampled panel. A conventional ranking might allocate the next dollar to Apiay because it is second. The Pareto analysis instead distinguishes whether a candidate remains non-dominated for advancement or for preliminary information-gap screening; it does not identify the optimal expenditure. Apiay may still offer analogue, monitoring, or lower-temperature-use value, but the composite rank alone does not establish priority.
Nereidas provides a second example. It remains in the leading tier and has no evidence gap under the implemented indicator, consistent with its deep exploration history. Yet it falls below the territorial-compatibility median. The appropriate conclusion is neither to discard the resource nor to equate knowledge with readiness. Rather, technical work and territorial-risk management must be designed as a coupled program. This is especially important because national-scale environmental and sociocultural layers are screening inputs; only site-specific engagement can establish legitimate project alternatives.
4.2. Methodological Contribution
This study combines four methodological elements that together support the decision framework. First, it treats semantic auditing as part of reproducible GIS–MCDA. Layer names, transformation direction, and criterion multiplicity were inspected before calculation. This step exposed a consequential ambiguity in the detailed-study criterion: Its title suggested scarcity, whereas its implemented scale measured maturity. Making the direction explicit prevents opposite policy interpretations of the same raster.
Second, the analysis reduces structural double counting. When the expert panel weights one conceptual criterion, administrative or cartographic sublayers should not each receive the full weight unless the elicitation explicitly distinguished them. Averaging municipal and departmental interest, consolidating land representations, and selecting between alternative gradient surfaces preserve the elicited 11-criterion decision structure. This is a simple but transferable audit rule for spatial MCDA.
Third, uncertainty is propagated to decision outputs rather than stopping at weight intervals. The expert bootstrap quantifies whether an area remains non-dominated under changes in panel composition, while the cellwise transformation stress test asks whether the same decision survives bounded changes in how the four dominant geoscientific layers translate evidence into standardized scores. Their joint ensemble makes the interaction observable. The unchanged advancement set and the localized learning-front changes show that preference uncertainty and evidence-model uncertainty need not have the same decision consequences.
Fourth, the paired Pareto formulation operationalizes non-compensation without abandoning the transparent weighted sum as a diagnostic reference. No site is recommended from that score alone, and no cross-dimension exchange rate is imposed. The advancement frontier searches for efficient combinations of promise, compatibility, and low evidence risk; the learning frontier treats unresolved evidence as a reason to investigate rather than as proof of low resource values. Unlike suitability-oriented implementations that terminate in a composite score or favorability class, the paired-frontier framework preserves two non-equivalent decisions: advancing comparatively mature prospects and acquiring information where uncertainty remains consequential.
4.3. Position Within Geothermal-Resource Assessment
Geothermal GIS–MCDA has progressively improved the integration of geological, thermal, geochemical, environmental, and accessibility evidence, from regional favorability mapping to play-fairway and depth-integrated assessments [
4,
5,
6,
7,
8,
9]. Related applications address mine-land direct use, hot-spring end uses, information-driven regional screening, and alternative aggregation operators [
10,
11,
25,
26]. These advances improve where and how prospectivity is estimated. The present framework addresses the next decision layer: after screening, which alternatives cannot be improved simultaneously in prospectivity, territorial compatibility, and evidence status?
Geothermal-risk research has separately emphasized multiple subsurface interpretations, decision analysis, and value-of-information (VOI) methods [
1]. Recent play-based work monetizes how information obtained from one prospect changes the economics of subsequent prospects through spatial correlation and decision trees [
2]. The learning frontier proposed here is deliberately earlier-stage and non-monetary. It identifies registered areas where a detailed VOI analysis may be consequential when comparable survey costs, success probabilities, and cash-flow models are not yet available at the national scale; it is not a substitute for economic VOI.
This positioning is relevant to resource management because scarce public attention must be divided between advancing comparatively mature areas and resolving uncertainty in areas that may otherwise remain systematically undervalued. The two objectives require different evidence directions and different decision gates, even when they draw on the same national database.
4.4. Contribution to Exploration-Decision Theory
The paired-frontier formulation contributes three decision principles. First, the meaning of an evidence gap is made conditional on the objective. In an advancement decision, a large gap is a liability; in a learning decision, it can be an opportunity, but only when the area’s prospectivity and territorial compatibility are not jointly dominated. The learning frontier therefore does not reward ignorance indiscriminately.
Second, Pareto dominance prevents unexamined compensation across prospectivity, compatibility, and evidence status. The weighted composite remains useful for descriptive screening, but frontier membership answers a stricter question: whether another observed area performs at least as well on every decision dimension and better on at least one. Apiay and Huila demonstrate the consequence. Apiay is a perfectly stable composite leader but is dominated on both frontiers; Huila is low in the composite yet persistently efficient for learning.
Third, frontier-membership and robustness frequencies convert a static non-dominated set into design-conditional stability measures under two uncertainty sources. Values near one across expert, transformation, and joint endpoints indicate robust non-dominance under the examined specifications; divergence among the three identifies whether status is preference-sensitive, evidence-model-sensitive, or jointly sensitive. These outputs can identify candidates for subsequent costed appraisal, but they do not allocate funds, establish net information value, or replace project-scale go/no-go analysis.
4.5. Limitations and Validation Priorities
Several limitations bound the claims. The 300 m resolution is appropriate for regional screening but not for well siting. Thermal springs can be spatially offset from their underlying reservoirs, and temperature interpolation within a 5 km envelope can create apparent continuity unsupported by permeability or structural connectivity. The national gradient surface has incomplete coverage and relies largely on hydrocarbon bottom-hole temperatures. Aquifer presence is a coarse proxy for fluid availability and does not establish reservoir transmissivity. Estimated MWe values inherit the assumptions of the national volumetric assessment [
3,
17,
27].
The BWM bootstrap quantifies sensitivity to the composition of the observed expert panel, and the new cellwise stress test addresses bounded curvature in the four dominant standardized transformations. Neither analysis quantifies measurement error, spatial misregistration, interpolation uncertainty, or uncertainty in the raw MWe, temperature, gradient, and thermal-spring observations; the transformation exponents are stress-test bounds rather than estimated probability distributions. Pareto membership also depends on the selected dimensions and on the observed 23-area comparison set, and it can change when new registrations or evidence are included. The learning frontier is a preliminary information-gap screen and does not estimate value of information, survey cost-effectiveness, or expected decision value. Government-interest coding measures explicit policy attention, not budget execution, permitting capacity, or long-term commitment. Distance from Indigenous territories must not be interpreted as acceptance or opposition; it is only a national-scale indicator of procedural complexity, and project decisions require rights-based participation and consultation. The joint ensemble further assumes independent pairing of preference and transformation draws. Neither the expert bootstrap nor the original elicitation distinguishes criterion-specific expertise or confidence. The environmental-retention denominator is an administratively registered polygon and may inherit initially broad boundaries. Secondary median labels are comparison-set dependent. Finally, the learning frontier does not include spatial contiguity, infrastructure, survey logistics, or cross-area information spillovers; isolated members should not be interpreted as immediately executable survey programs. All robustness frequencies are conditional on the observed 23-area comparison set, selected objectives, α range, transformation bounds, equal factorial scenario design, and independence assumption. The protected geodatabase prevents independent spatial rerunning, and some institutional source-layer snapshot dates were not retained in the analytical export; the implemented rules are auditable in S5 but cannot substitute for validation against the restricted source GIS.
The next validation stage should prioritize four additions: (i) independent geochemistry and geothermometry for characterize-first areas; (ii) structural and permeability evidence, including fault characterization and geophysics; (iii) empirical error models and spatial ensembles for the raw MWe, temperature, gradient, and thermal-spring inputs; and (iv) participatory validation of territorial compatibility in Paipa, Villamaría, and other affected areas. A value-of-information analysis could then estimate which survey most improves the probability of an exploration decision at the lowest cost. A portfolio implementation should additionally cluster compatible surveys, represent access and infrastructure constraints, elicit criterion-specific expert confidence, and test dependence structures between preference and evidence-model uncertainty.
4.6. Transferability, Resource Outlook, and Implications
The framework is transferable as a decision architecture rather than as a fixed Colombian scoring model. Its required elements are a common set of portfolio units, locally meaningful prospectivity and compatibility criteria, an explicit representation of evidence maturity and spatial coverage, and a defensible comparison set. In volcanic, sedimentary, enhanced-geothermal, or direct-use settings, the evidence layers, distance functions, institutional indicators, rights context, and decision thresholds must be re-elicited. The Colombian BWM weights, 5 km envelope, median labels, and resource cutoffs should not be exported without local validation. What transfers is the sequence: audit semantics and duplicated representations, keep evidence status separate from resource favorability, compute advancement and learning frontiers, and stress-test both preference and evidence models [
12,
13,
14,
15,
16].
This architecture is particularly relevant where exploration data are spatially uneven. A conventional favorability map can systematically demote poorly studied areas; the paired frontiers instead expose whether an area is efficient under a low-evidence-risk objective or under an information-acquisition objective. Implementation elsewhere should report the local scoring rules; distinguish missing observations from unfavorable evidence; and add cost, accessibility, infrastructure, contiguity, permitting, and community-governance constraints before converting a learning frontier into a field program.
For Colombia, the approximately 1170.2 MWe reported by the national volumetric assessment remains contextual inventory potential, not an updated estimate of recoverable reserves, generation capacity, or bankable projects. The present analysis does not revise that resource magnitude. Its outlook is procedural: robust advancement-front members are candidates for project-scale conceptual modeling and gated validation, whereas robust learning-front members identify areas where targeted data acquisition merits subsequent costed evaluation. The reduced-criterion national sensitivity also shows that high-score concentration inside official polygons is partly constructed by inventory-linked inputs; it cannot validate those polygons independently. New outside-polygon signals should therefore be treated as reconnaissance hypotheses, while registered areas still require reservoir confirmation, environmental alternatives, rights-based engagement, and economic appraisal before development decisions.