


Abstract
The surface layer of coal influences its physicochemical, mechanical, and gas-storage properties, but its characteristic thickness has not been systematically determined for coals of different rank within a single basin. This study quantifies the surface-layer thickness of coals from the Karaganda Basin (Kazakhstan) using a physi-co-mathematical surface-layer model combined with previously obtained laboratory, geophysical, and production data. After substitution of the surface-energy relation-ship, the temperature cancels out, giving d ≈ 0.17 × υ (nm), where υ = M100/ρ is the mo-lar volume of the organic matter of coal. The calculated thickness decreases from 198.7 ± 19.1 nm (long-flame coals) to 151.5 ± 17.0 nm (anthracites), and the number of mon-olayers from ≈550 to ≈420; all values (146.0–214.2 nm) are consistent between adjacent ranks within ±10–11%, whereas the end members differ significantly. The theoretical shear strength of the surface layer, τt = 2σ/d, increases from 4.4 to 9.0 MPa, comparable to the strength of the basin coals estimated from the Protodyakonov coefficient. The calculated thickness covaries with gas content, permeability, and propensity for spon-taneous combustion; these relationships are mediated by depth and rank and are for-mulated as testable hypotheses. The results can serve as an additional structural indi-cator for ranking seams in degassing and hazard prediction, but not as a stand-alone hazard index. Future work will focus on experimental validation (nanoindentation, low-temperature N2/CO2 adsorption, surface-energy measurements) and model cali-bration.
1. Introduction
The Karaganda Coal Basin is one of the largest coking- and steam-coal basins of the Republic of Kazakhstan. Its coal seams are characterized by high gas content, a hazard of sudden coal-and-gas outbursts, and a propensity for spontaneous combustion; therefore, the prediction of gas-dynamic phenomena, improvement of the efficiency of mine-field degassing, and assessment of endogenous fire hazard remain key tasks for the safe mining of coal seams [1,2]. Solving these tasks requires knowledge not only of the macroscopic characteristics of the seams (gas content, permeability, strength), but also of the structural characteristics of coal matter that govern methane sorption and transport, as well as coal oxidation [3,4].
The surface layer of solid materials has been the subject of numerous studies by J.W. Gibbs [5], H. Gleiter [6], A.I. Rusanov [7], K. Oura et al. [8], A.Ya. Gokhshtein [9], and many other researchers.
Building on the established regularities of variation in the properties of the surface layers of solids, the authors investigated the surface layer of coal as an object for the theoretical development of a physico-mathematical model relating its thickness to coal seams of different rank (degree of coalification) in the Karaganda Basin.
It is known that the nanostructures of various carbon compounds—diamond, graphite, carbynes, and fullerenes—have surface layers of different thickness related to the volume of the solid.
Coals are a mixture of carbon compounds (the maceral component), mineral impurities (mineral matter), gaseous components (methane, nitrogen, carbon dioxide), and moisture. The studies were carried out for coals reduced to a dry, ash-free basis (organic matter) by recalculation from the as-received state of coals of different rank using known formulas [10,11]. Thus, reducing coals to a carbon compound provides the basis for studying the surface layer of coals of different rank.
A number of studies [11,12] have noted that the surface layer of materials possesses special physical properties compared with the bulk phase: the particle growth rate, melting point, strength characteristics, and other physicochemical properties change [13]. This feature of the surface layer is related to the position of surface atoms and molecules, which, compared with bulk atoms and molecules, are more weakly bonded to one another and less constrained in their thermal motion [14].
A characteristic feature of the surface layer of substances, including coals, is the size effect, whereby the physical properties of a material change with the size of the surface-layer particles owing to surface processes—sorption, diffusion, wetting, and others. All these features are related to the substantial difference in the surface-area-to-volume ratio and to the high surface energy [12,14]. Methods for measuring the surface energy and surface tension of solids have been developed for a number of coal seams of the Karaganda Basin [15].
The surface layer [6] is an extremely thin film that is in thermodynamic equilibrium with the bulk phase of the body and possesses properties and a structure different from those of the bulk [7,13]. Gibbs treated the surface layer as a purely geometric surface of zero thickness [5].
The relationship between surface-layer thickness, molar volume, density, and surface energy has been established for chemical elements, structural materials, and carbon nanostructures [14,16] and has been applied to individual coal ranks [17,18,19]. At the same time, current studies of coals of different rank focus mainly on measurable porosity, sorption, and micromechanical characteristics: the heterogeneity of the nanopore–fracture structure [3], the role of functional groups and pores in CH4 adsorption [4], methane diffusion considering the heterogeneity of micromechanical properties [20], and the reservoir properties of tectonically deformed coals [21,22]. Thus, a gap remains in the literature: (i) the characteristic surface-layer thickness has not been systematically determined for the entire metamorphic series of coals within a single coal basin; (ii) it has not been analyzed which input parameters of the model actually control the calculated layer thickness and how sensitive it is to their uncertainty; and (iii) the calculated surface-layer scale has not been compared with the gas-bearing, filtration, and thermal characteristics of a specific basin. For the Karaganda Basin, where coal rank, depth of occurrence, microporosity, permeability, gas sorption, and propensity for spontaneous combustion are closely interrelated, filling this gap is of both scientific and practical importance.
The aim of this study is to quantify the characteristic surface-layer thickness of coals of different rank in the Karaganda Coal Basin using a physico-mathematical model and to test whether its variation is consistent with the gas-bearing, petrophysical, mechanical, and thermal characteristics of the coal seams.
To achieve this aim, the following objectives were addressed: (1) to derive explicitly the calculation relationship for the layer thickness and to establish which parameters control it; (2) to calculate the layer thickness, the number of monolayers, and the idealized shear strength for the main formations and coal ranks of the basin and to assess the sensitivity of the results to the uncertainty of the input data; and (3) to compare the calculated layer scale with data on gas content, permeability, methane occurrence forms, and spontaneous combustion of coals. The novelty of the study is as follows: the surface-layer model has been systematically parameterized for the first time for the entire metamorphic series of Karaganda Basin coals (from long-flame coals to anthracites); it is shown that, in the adopted formulation, the calculated layer thickness depends only on the molar volume of the organic matter of coal, whereas the ignition temperature affects only the surface energy and the shear strength; the sensitivity of the calculated thickness to density and to the parameters used to calculate the molecular mass has been evaluated; and the calculated layer scale has been compared with basin data on gas content, permeability, and spontaneous combustion, with the identified relationships formulated as testable hypotheses for subsequent experimental studies.
2. Materials and Methods
2.1. Object of the Study
The object of the study is the coals of the Karaganda Coal Basin, located in the Karaganda Region of Central Kazakhstan (Figure 1a). The coals of the basin are used by the region’s power-generation enterprises, and the coking coals are supplied to the Karaganda Metallurgical Combine of Qarmet JSC.
Figure 1.
(a) Geological structure of the Karaganda Coal Basin and its location within Kazakhstan. The boundary of the coal basin (study area) is shown by a thick dark-green line and labeled “Karaganda coal basin”; the inset in the upper-right corner shows the territory of Kazakhstan, and the dot indicates the position of the basin relative to the city of Astana. Fragment of sheet M-43 V of the Geological Map of Sary-Arka at a scale of 1:500,000 (ed. V.I. Serykh, 2007) [23]. (b) Sedimentary sequence of the Karaganda Coal Basin. Both panels were adapted from [24] under the Creative Commons Attribution 4.0 International License (CC BY 4.0; https://creativecommons.org/licenses/by/4.0/ (accessed on 14 October 2026)). Changes include English labeling, highlighting of the basin boundary, and addition of the location inset. Legend: 1—polymictic greywackes, intermediate (j2-3); 2—polymictic greywackes, acidic (l4-j1); 3—monzogranite (K-granite) (μγ4c22-4); 4—leucogranite (lγ1c6-p1); 5—K-Na granosyenite (γξ2c7-p2); 6—monzogranodiorite (K-granodiorite) (μγδ3c22-4); 7—petroclastic greywackes, intermediate sodic (c); 8—Na trachyandesite (ταd5-6, ταc2-4); 9—Na trachydacite (τϚd5-6); 10—K trachyrhyodacite (τλϚd5-6); 11—K trachybasaltic andesite (ταβd5-6); 12—trachybasalt (τβd5-6); 13—Na and K-Na trachybasaltic andesite porphyrites (ταβπd5-6); 14—Na and K-Na trachyandesite porphyrites (ταπd5-6); 15—trachyrhyolite porphyry (τλπd5-6) and ayurhyolite porphyry (υλπd5-6); 16—trachybasalt porphyrite (τβπd5-6); 17—Na and K-Na trachyrhyodacite porphyries (τλζπd5-6); 18—Na, K-Na, and K trachydacite porphyries (τζπd5-6); 19—K-Na quartz monzonite (qμd5-6, qμc7-p2); 20—K-Na syenogranites (εγ3d5-6); 21—basalt (βo4-5); 22—basaltic andesite (αβo4-6); 23—ayulite (νo1); 24—basaltic and tholeiitic porphyrites (βπo4-6).
The fractional, mineral, and petrographic composition, moisture, and ash content of the coals were determined in the accredited laboratory of the Research Center “Ugol” (Karaganda). Gas content and gas occurrence forms were determined by the DMT method (DMT GmbH & Co. KG, Essen, Germany) in the laboratory of “Spetsmontazhdegazatsiya”, a subsidiary of Karagandaugol LLP. A number of physical characteristics of the coal seams were determined in the “Methane” Laboratory of Abylkas Saginov Karaganda Technical University.
In accordance with the aim of the study, the surface layer of the organic part of coal matter was investigated. The material comprised coals from seams in the four main areas of the Karaganda Basin—Karaganda, Sherubay-Nura, Tentek, and Verkhne-Sokur. In sampling, priority was given to the most productive coal-bearing formations—the Karaganda and Dolinka formations. Sampling was carried out in accordance with the procedure established by GOST R ISO 18283-2010 (“Hard coal and coke—Manual sampling”) [25].
The coal-seam gas of the basin consists of 95–98% methane, up to 1% carbon dioxide, and 0.1–3% nitrogen. In general, all coal seams are characterized by high gas content, which increases with depth of occurrence, degree of coalification, tectonic disturbance, thickness variability, and the presence of zones of tectonically crushed coal [26,27]. These data are considered in the context of the broader practical task of ensuring safe and productive coal mining [1,2].
In accordance with the mathematical model for assessing the metamorphism of Karaganda Basin coals developed by M.V. Golitsyn [28], the level of metamorphism is assessed using the metamorphism impulse I:
where ti is the residence time of coal at temperature Ti (°C), Myr; Ki is the reaction-rate constant at stage i, proportional to the amount of remaining unreacted organic matter; and βi is the pressure coefficient, which accounts for how burial depth and overburden (lithostatic) pressure retard or accelerate the destruction and restructuring of the organic matter of coal at stage i. Ki follows an Arrhenius-type relationship:
where Ti is the absolute temperature of the process at the metamorphism stage, K.
I = ΣKitiβi,
ln Ki = f(1/Ti),
The results of calculations using Equations (1) and (2) are presented in Table 1.
Table 1.
Relationship between paleotemperatures, vitrinite reflectance, and volatile-matter yield for coals of the Karaganda Basin (after M.V. Golitsyn) [28].
Pre-inversion metamorphism and the associated generation of metamorphogenic gases in the basin began at the start of the Late Carboniferous and continued for 30–35 Myr. Subsidence of the lower part of the coal-bearing sequence to a depth of up to 2 km was accompanied by a temperature increase to 70 °C. The subsequent metamorphism proceeded intensively and was completed by the beginning of the Late Permian, when subsidence exceeded 5 km and the temperature reached 131–140 °C. By that time, the metamorphism impulse had reached 85%.
The metamorphism stages were assessed from vitrinite reflectance (R°), volatile-matter yield (Vdaf), carbon content, calorific value, and caking capacity. The measurements were carried out in the specialized laboratory of the Research Center “Ugol” (Karaganda). The results show that coals of stages III and IV predominate in the Karaganda Basin, whereas stage V is less common; R0 ranges from 0.52% to 2.8%. Overall, coal metamorphism increases toward the south (Table 2 and Table 3).
Table 2.
Variation in metamorphism stage with stratigraphic depth across the basin.
Table 3.
Thickness of coal-bearing sequences and metamorphism stages by area of the Karaganda Basin. Adapted from [29] under the Creative Commons Attribution 3.0 Unported License (CC BY 3.0; https://creativecommons.org/licenses/by/3.0/ (accessed on 14 October 2026)).
A relationship has been noted between the metamorphism stage of coals of different formations across the deposits of the basin and the thickness of the overlying coal-bearing sequence (Table 3) [28].
Differences in the gas content of the coal seams of the Tentek and Dolinka formations required a study of their density and volumetric clay content (Kgl, %), which was carried out in boreholes in the mine fields of the Kazakhstanskaya mine (boreholes No. 1/2, 2, and 3) and the Lenin mine (boreholes No. 1–4) under natural stress–strain conditions. The studies were performed using a suite of geophysical well-logging methods, including gamma–gamma density logging, gamma-ray logging, broadband acoustic logging, and thermal logging, with all necessary corrections for borehole conditions (Table 4 and Table 5).
Table 4.
Average density, volumetric clay content, and lithology of the coal seams of the Tentek and Dolinka formations. Adapted from [30] under the Creative Commons Attribution 4.0 International License (CC BY 4.0; https://creativecommons.org/licenses/by/4.0/ (accessed on 14 October 2026)).
Table 5.
Average density and volumetric clay content of non-gas-bearing and gas-bearing coal seams of the Karaganda Basin.
Table 5 shows that at the Lenin mine the average density of non-gas-bearing coals of the Dolinka formation is 0.10 g/cm3 lower than that of the Tentek formation coals, whereas for gas-bearing seams the Dolinka coals are on average 0.24 g/cm3 less dense than the Tentek coals. This difference is explained by the different volumetric clay content of the two formations.
Analysis of the measurement results showed that the gas-bearing coal seams of the Dolinka formation have a lower average density (1.42 g/cm3) than the gas-bearing seams of the overlying Tentek formation (1.66 g/cm3); a similar relationship is observed for the non-gas-bearing seams. The established regular relationship between the density and clay content of coals can serve as a basis for a quantitative assessment of the gas content of the coal seams of the basin. The results of studying the physico-mechanical characteristics of the gas-bearing formations by geophysical borehole methods are presented in Table 6.
Table 6.
Average physico-mechanical properties of the gas-bearing coals of the Tentek and Dolinka formations. Adapted from [30] under the Creative Commons Attribution 4.0 International License (CC BY 4.0; https://creativecommons.org/licenses/by/4.0/ (accessed on 14 October 2026)).
In terms of strength, the coals of the Karaganda Basin are classified as weak, medium-strength, and strong rocks and are generally tough (plastic–brittle). The Protodyakonov strength coefficient ranges from 0.47 to 2.0. The highest strength is characteristic of seams K4, K12, K14, and K18.
Particular attention was paid to the distribution of methane in the coal seams of the Karaganda Basin, one of the most gas-bearing coal basins in the region. Processing of methane-content data for core samples obtained by various gas-extraction methods established an increase in the average gas content of the combustible mass (G, m3/t) with depth; this relationship is described by the Langmuir equation [31].
where P = 10−2(H − H0) is the reservoir gas pressure of the coal seams of the Karaganda Basin, MPa; H is the depth of occurrence of the coal seam, m; H0 is the depth of the gas-weathering zone, m; VL is the maximum sorption capacity of the combustible mass, m3/t, which is determined by the seam depth, degree of coalification, microporosity, specific surface area, and thermodynamic conditions and varies across the basin within (20.0–26.5) m3/t; and PL is the Langmuir pressure, whose average values for the seams of the basin are (1.0–2.8) MPa depending on the depth of occurrence.
G = VL × P/(PL + P),
In the depth interval from 320 to 760 m, the Langmuir pressure varies within (1.0–1.6) MPa, and for seams K7, K10, and K12 of the Karaganda formation these values are (1.2–1.5) MPa. Analysis of the variation in gas content shows that gas content increases with depth of occurrence, starting from the depth of the gas-weathering zone [27,32].
The above ranges of the parameters of the Langmuir Equation (3) were obtained from core studies in the laboratory of “Spetsmontazhdegazatsiya”, a subsidiary of Karagandaugol LLP.
The temperature dependence of VL is described by the equation:
where T is the temperature at the depth of occurrence of the coal seam, °C; it was determined from thermometric data of exploration boreholes for each seam.
2.2. Calculation of the Surface-Layer Thickness of Coals Reduced to a Dry, Ash-Free Basis
This physico-mathematical model was developed by the authors’ research group. Its theoretical basis is the general relationship between surface-layer thickness, surface energy, molar volume, and density established for solids and carbon nanostructures by Gibbs [5], Gleiter [6], Rusanov [7], Oura et al. [8], and Gokhshtein [9]. Building on this foundation, the authors formulated and tested a specific model for coal matter reduced to a dry, ash-free (organic) basis in a number of previous studies [14,17]. The calculation formulas used below (Equations (6)–(10)) were derived and justified in those studies and are applied here for the first time to the entire metamorphic series of Karaganda Basin coals. The theoretical surface-layer model described in [10,19] represents the surface layer as a thin phase in thermodynamic equilibrium with the bulk material. A characteristic feature of the surface layer is that, within it, the mechanical, physical, and sometimes chemical properties differ from those of the bulk phase [11,12,13].
In studying these characteristics, it was taken into account that surface energy (Ws) and surface tension (σs) should be distinguished. Based on the thermodynamic definition on which the model is built, this relationship is expressed by the equation [9]:
Ws = σs + S × dσs/ds
For liquids, the difference between surface energy Ws and surface tension σs is negligible, since the second term is zero for the surface layer of liquids. For solids, these differences are usually small but nevertheless exist and are taken into account in rigorous models.
In [14,17], a theoretical model of the surface layer of coal matter was formulated and a method for calculating its thickness was proposed. To describe the model, a schematic structure of the coal layer and particles was proposed, as shown in Figure 2 [17].
Figure 2.
Schematic representation of the surface layer [17].
The variation in physical properties (Figure 2) within the layers is described by the following Equation (6):
A(h) = A0[1 − d/(d + h)], h ≥ 0
where h is the coordinate measured from the outer boundary into the surface layer; A0 is the physical characteristic of the bulk phase of the material; and d is the sur-face-layer thickness. For h ≫ d (in practice, for h > 9d, when A(h) differs from A0 by no more than 10%), A(h) → A0 = const.
The surface-layer thickness d, m, is determined by the expression [17]:
where d is the surface-layer thickness (in the model [17], it is taken to be equal to the length of the primary crack), m; is the molar volume, cm3/mol; M is the molar mass, g/mol; is the density, g/cm3; m · mol/cm3 is an empirical coefficient (in SI units, mol/m2 for in m3/mol).
Expression (7) was verified for gold and silicon: the calculated values of d were 1.7 and 2.0 nm, respectively, which agrees well with the experimental values of 1.9 and 2.1 nm obtained by grazing-incidence X-ray methods [14,19].
It follows from Equation (7) that the surface-layer thickness of coals of different rank is determined by the molar (atomic) volume of coal [14].
The molecular mass of coal M100, calculated per 100 carbon atoms, is determined by the formula [33]:
where C and O are the carbon and oxygen contents of coal from elemental analysis data; f is the degree of aromaticity; and N is the number of paramagnetic centers.
M100 = 130.385 × C − 1.941 × O – 14,042 · f + 461.909 × N, g/mol
The surface energy of a solid is related to its melting temperature by the empirical relationship [14,16]:
where Tm is the melting temperature of the solid, K, and cσ is an empirical coefficient. In the present study, the ignition temperature of coals is used instead of the melting temperature (see the justification below).
Because coal is a heterogeneous organic material that undergoes thermal decomposition rather than exhibiting a well-defined melting transition, the melting temperature used in the original surface-energy relationship cannot be directly assigned to coal. Therefore, in the present study, the ignition temperature is adopted as an effective characteristic temperature for parameterizing the surface-energy relationship of coal. This substitution is a modeling assumption and should not be interpreted as an experimentally established equivalence between ignition and melting temperatures. Accordingly, the calculated surface-layer thickness and surface energy should be regarded as theoretical characteristic values. Independent measurements of coal surface energy and surface-layer thickness are required to verify this assumption.
The relationship between the surface-layer thickness, the surface tension of the sample σ, and the molar volume υ (cm3/mol) is given in [11,16,34]:
where R = 8.314 J/(mol · K) is the universal gas constant and T is the absolute temperature, K. For σ in J/m2 and υ in m3/mol, d is obtained in meters (values of υ in cm3/mol are multiplied by 10−6).
d = 2συ/(RT), nm
Relationship between Equations (7), (9) and (10). Substituting (9) into (10) and setting T = Tm gives d = 2cσTmυ/(RTm) = (2cσ/R) × υ = kLυ, where kL = 2cσ/R = 2 × 0.7 × 10−3/8.314 ≈ 1.68 × 10⁻⁴ mol/m2, or ≈0.17 nm ×mol/cm3 for υ in cm3/mol; this is Equation (7). Thus, the temperature cancels out of the expression for the layer thickness, and in the adopted formulation d depends only on the molar volume υ = M100/ρ, i.e., on the calculated molecular mass and density of the organic matter of coal, but not on the ignition temperature. Two conclusions important for the interpretation of the results follow from this. First, the assumption that the melting temperature is replaced by the ignition temperature does not affect the calculated values of d and the number of monolayers (Table 7); it affects only the surface energy σ calculated from (9) and the theoretical shear strength that depends on it (Table 8). Second, the physical meaning of the temperature in (10) becomes clear when this equation is written as RT = 2σ × (υ/d), where υ/d is the surface area per mole of layer material of thickness d: the surface-layer thickness corresponds to the depth at which twice the surface energy per mole of layer material becomes equal to the energy of thermal motion RT. For coal, which has no melting point, the ignition temperature is used as the effective characteristic temperature at which intensive thermal destruction of the structure of the organic matter begins, i.e., as an analog of the temperature at which the solid phase loses its stability. Because it enters the relationship d = 2συ/(RT) only through the ratio σ/T = cσ, the uncertainty in its choice propagates into the estimates of σ and τt, but not into d.
Table 7.
Surface-layer thickness for various coal seams and coal-bearing formations of the Karaganda Basin.
Table 8.
Surface energy and theoretical shear strength of bituminous coals of different ranks of the Karaganda formation of the Karaganda Coal Basin [18].
2.3. Calculation Example and Sensitivity of the Calculated Surface-Layer Thickness
Input data. The input parameters of Equation (8) are the carbon content C and oxygen content O of the organic matter of coal (from elemental analysis), the degree of aromaticity f (from X-ray diffraction analysis or 13C NMR spectroscopy), and the number of paramagnetic centers N (from EPR). The input data for coals of different ranks of the Saran site (Karaganda formation) are given in Table A1 (Appendix A). The carbon and oxygen contents and the degree of aromaticity were taken as average values for the corresponding ranks; the carbon content is consistent with the typical ranges for the corresponding ranks (Section 3.5). The M100 values [18,33] are reproduced by Equation (8) with an error of less than 0.1%.
Calculation example. For coking coal (K) of the Saran site with C = 88.5%, O = 4.0%, f = 0.81, and N = 2.584 (Table A1), Equation (8) gives M100 = 130.385 × 88.5 − 1.941 × 4.0 − 14,042 × 0.81 + 461.909 × 2.584 = 11,539.1 − 7.8 − 11,374.0 + 1193.6 ≈ 1351 g/mol. For ρ = 1.27 g/cm3, the molar volume is υ = M100/ρ = 1351/1.27 = 1063.8 cm3/mol. From Equation (7), d = 0.17 × 1063.8 = 180.8 nm; with the exact value kL = 2cσ/R = 0.168 nm · mol/cm3, d = 179.1 nm, i.e., rounding of kL leads to a systematic overestimation of d by approximately 1%, which is the same for all ranks. The number of monolayers is n = d/a = 180.8/0.36 ≈ 502, where a ≈ 0.36 nm is the intermolecular distance in coal [35] (Table 7). The surface energy from Equation (9) at the average ignition temperature of coking coal T = 743 K is σ = 0.7 × 10−3 × 743 = 0.520 J/m2. The theoretical shear strength of the surface layer from Equation (12) is τt = 2σ/d = 2 × 0.520/(180.8 × 10−9) = 5.75 × 10⁶ Pa = 5.75 MPa (Table 8).
Sensitivity. Since d = kL · M100/ρ, the relative error in the layer thickness is determined by the errors in the molecular mass and density: δd/d = [(δM100/M100)2 + (δρ/ρ)2]^½. The estimate was made for each member of the metamorphic series under the following assumptions: the density error is ±0.05 g/cm3 (Table 4), and the error in the degree of aromaticity is ±0.01, which, with ∂M100/∂f = −14,042 g/mol, gives δM100 = ±140 g/mol. The density contribution is ±3.2–4.1% and decreases as ρ increases from 1.23 to 1.56 g/cm3; the contribution of the degree of aromaticity is ±8.9–10.7% and increases as M100 decreases from 1578 to 1310 g/mol. The total relative uncertainty of d is ±9.6% for D, ±10.5% for G, ±10.8% for Zh, ±11.1% for K, ±11.2% for T and A, and ±11.0% for OS, which corresponds to ±16.0–20.8 nm in absolute terms. For brown coal, for which the input values of M100 and ρ are not given, an upper estimate of ±11% was adopted. Thus, the uncertainty of d is practically the same across the entire series (±10–11%) and does not introduce a systematic bias between its members. The uncertainty in the degree of aromaticity accounts for 85–91% of the variance of d; therefore, the accuracy of determining f is the key factor for further refinement of the model. The uncertainty in the number of paramagnetic centers (ΔN = ±0.1 → δM100 = ±46 g/mol, i.e., ±2.9–3.5%) increases the total estimate by no more than 0.5 percentage points and is not considered further. The errors in the coefficients kL and cσ are the same for all ranks: rounding overestimates all values of d by approximately 1%, and the uncertainty of cσ propagates proportionally into d. Therefore, they do not affect the ratio of layer thicknesses between members of the series, which is considered below.
Consistency of values across the metamorphic series. The calculated values of d in Table 7 and Table 8 (and the value for brown coal used in Section 3.5) were obtained from the same Equation (7), but for different sample sets: Table 8 gives a single series of ranks from D to A of the Karaganda formation with consistent input data, whereas Table 7 gives coal ranks of individual formations with the densities of specific seams. Therefore, throughout this study, the end members of the metamorphic series are taken from the single series in Table 8: long-flame coal (D), 198.7 ± 19.1 nm, and anthracite (A), 151.5 ± 17.0 nm. Taking the uncertainty into account, the combined series in order of increasing rank is as follows: B, 214.2 nm (±11%; Section 3.5); D, 198.7 ± 19.1; G, 198.5 ± 20.8; GZh, 161.4–180.7; Zh, 165.3–190.4; KZh, 158.1–168.3; K, 161.7–186.7; OS, 146.0 ± 16.0; T, 172.9 ± 19.4; and A, 151.5 ± 17.0 nm (for ranks represented in several formations, the range from Table 7 and Table 8 is given). The confidence intervals of all adjacent members of the series overlap; therefore, all calculated values are mutually consistent. This also applies to the apparent deviations from a monotonic decrease in d: OS (146.0 nm) and A (151.5 nm), T (172.9 nm) and OS, as well as the scatter of values for ranks K, KZh, Zh, and GZh in different formations (158.1–190.4 nm), which is due to differences in seam density (1.23–1.50 g/cm3). Only the group of low-rank coals (B, D, G: 198.5–214.2 nm) and the group of high-rank coals (OS, A: 146.0–151.5 nm) are statistically distinguishable: for example, the intervals for D (179.6–217.8 nm) and A (134.5–168.5 nm) do not overlap, and the difference between them (47.2 nm, ≈24%) is 1.8 times their combined uncertainty (25.6 nm).
Thus, the conclusion that the surface-layer thickness decreases with increasing coal rank refers to the series as a whole, from D to A (198.7 → 151.5 nm), whereas the full range of calculated values for all samples is 146.0–214.2 nm.
3. Results: Molecular Mass and Surface-Layer Thickness of Coals of Different Rank on a Dry, Ash-Free Basis
3.1. Calculation of the Surface-Layer Thickness
The calculated surface-layer thicknesses for coals of the main formations and ranks of the Karaganda Basin are given in Table 7. The numbers in parentheses show the number of monolayers in the surface layer, obtained by dividing the layer thickness d by the intermolecular distance in coal (~0.36 nm) determined by X-ray scattering [35].
The depth range of the formations (Table 7) depends on their position within the Karaganda syncline. These formations are the main commercially significant formations for coal mining.
The calculated surface-layer thicknesses of coals are close to the surface-layer thicknesses of higher fullerenes [14,16], which provides a basis for further study of the factors affecting coal characteristics and their variation with rank.
3.2. Relationship Between the Coal Surface Layer and Theoretical Strength
According to A. Griffith’s theory, the fracture stress of a brittle solid is determined by its elastic modulus and surface energy σ (J/m2) [36]; therefore, the strength characteristics of the coal surface layer can be estimated from its surface energy and thickness.
The theoretical shear strength τt of the surface layer relative to the bulk phase of solids is determined in [37] by the formula:
where G is the shear modulus, GPa.
τt ≈ 0.1 G, GPa
For coals of the Tentek and Dolinka formations of the Karaganda Basin, G ranges within (1.40–2.60) GPa.
To calculate the theoretical shear strength of the Karaganda formation coals, the values of surface energy σ and surface-layer thickness d of coals of different rank were used [17]. The rationale is that shear is associated with the work of breaking interatomic bonds, and the energy required to form new surfaces is 2σ; hence,
τt ≈ 2σ/d, MPa (for σ in J/m2 and d in m, in Pa)
It should be noted that this formula gives an idealized estimate that does not account for the actual state of coal (defects, microcracks in the layer and in the bulk phase of coal, micropores). This effect can be taken into account using a material structure coefficient (0 < k < 1), which will be a direction for further research in this field.
The calculated theoretical shear strength is an idealized estimate of the strength of the surface layer (4.4–9.0 MPa, Table 8), which is 1.5–2 orders of magnitude lower than the theoretical strength of the bulk phase estimated from Equation (11), and it should not be equated with the macroscopic shear strength of undisturbed coal seams. The calculation does not explicitly account for the cleat system, mineral inclusions, micropores, microcracks, bedding, tectonic deformation, and the sample scale effect, each of which can substantially reduce the effective mechanical strength of natural coal [1]. Before these values can be used for engineering design or quantitative hazard assessment, they must be quantitatively compared with the results of laboratory mechanical tests, for example, micromechanical nanoindentation tests.
Table 8 shows that the theoretical shear strength of the surface layer relative to the bulk phase increases with the degree of coalification of the basin coals, which is controlled by depth of occurrence, whereas the surface-layer thickness and the number of monolayers in it decrease. The ignition-temperature data of the Research Center “Ugol” were used in the calculations. The increase in τt from 4.4 to 9.0 MPa is due to the simultaneous increase in surface energy (with increasing ignition temperature) and decrease in layer thickness.
3.3. Gas-Bearing Characteristics of the Coal Seams of the Basin
The main factors controlling the gas content of deep coal seams are depth of occurrence, coal rank, petrographic composition of the coals, and gas pressure [38,39]. Within the studied mine fields, depth of occurrence is the most significant of these factors, which is justified as follows. First, depth acts as an integral parameter: the reservoir methane pressure (P = 10−2(H − H0); see the explanation of Equation (3)), coal rank (Table 2 and Table 3), and temperature increase regularly with depth, whereas the petrographic composition of coals of individual formations varies along the section less regularly. Second, this is supported by empirical data for the basin: in the depth interval of 700–1400 m, the methane content of the Karaganda formation coal seams increases by 0.8–3.4 m3/t (on a dry, ash-free basis), and seam permeability decreases steadily with depth (r ≈ −0.85) [27]; at these depths, the coals belong mainly to rank K and, to a lesser extent, to rank OS. For seam K10, as the depth increases from 370 to 680 m, the gas content increases from 15.0 to 18.2–18.5 m3/t, and the reservoir pressure increases from 3.8 to 4.9 MPa (Table 9; r ≈ 0.89). Third, the Langmuir Equation (3) with a linear increase in pressure with depth implies a monotonic increase in sorbed gas content (Equations (14) and (15)). At the same time, the effect of depth is not unlimited: the sorption capacity decreases with increasing temperature (Equation (4)), which causes the gas-content curve to flatten at great depths.
Table 9.
Average values of the reservoir methane pressure ΔP, volatile-matter yield Vdaf, gas content, and permeability of seams K10 and K12 of the Karaganda Basin. Authors’ compilation based on factual data reported in [32]; coal-rank assignments and surface-layer thickness d were calculated in the present study. The table is not reproduced from [32].
The total methane content C of a coal seam is determined by the methane sorbed by the organic matter of coal, Csorb, and the free methane in pores and fractures of various sizes, Cfree. The overall depth dependence of the methane content of a coal seam is then given by
Based on the Langmuir formula (3), we write the change in the concentration of sorbed methane, assuming that the gradient α of the methane pressure in the seam with depth adopted for the Karaganda Basin is not less than α = 0.01 MPa/m. Let P0, MPa, denote the methane pressure at the lower boundary of the gas-weathering zone, and let H be the depth of the seam measured from the lower boundary of this zone. Then
and the rate of increase in the concentration of sorbed gas is
Assuming that the Langmuir parameters VL and PL are positive and do not change within the depth range of coal seams K7, K10, K12, and K13, and that α > 0, Formula (15) indicates an increase in sorbed gas content with depth, which is confirmed by experimental data [27,32,40].
The change in the concentration of free gas with the depth of a coal seam can be described by the real-gas equation of state [38]
where is the methane pressure at depth H, with being the ratio of the methane pressure in the coal seam to the geostatic pressure of the host rocks; ρ is the average density of the host rocks, kg/m3; m/s2; is the depth of the coal seam; is the pore volume accessible to methane, m3/t (for the basin, the average value is 0.03 m3/t, with a range of 0.02–0.04 m3/t); is the gas compressibility factor, which depends on the reservoir methane pressure (for example, for a depth of 800–1000 m ( MPa), it was taken as 0.95); R is the universal gas constant; and T is the absolute seam temperature, K. The value of Cfree in Equation (16) is reduced to standard conditions.
In general, as the methane pressure increases with the depth of the coal seams, the free-gas content also increases: from 0.60 m3/t at a depth of 400 m to 1.52 m3/t at 1000 m, and at a depth of 1500 m (calculated value) it is 4.00 m3/t.
Analysis of formulas (14)–(16) indicates a general increase in the methane concentration of coal seams with depth, which is confirmed by experimental and production studies. It should be noted that the trend of the methane content of coal seams is described by a Langmuir-type equation:
where and are empirical coefficients equal to = 0.265 and at m (Saran site), recalculated to the average as-received basis (average ash content = 25.4% and moisture 4.3%). The coefficients c and B were obtained by approximating the gas-sampling data for the Saran site [41]; Equation (17) is similar in form to the empirical depth dependences of coal-seam gas content given in [42].
The determining factors of gas retention and migration in coal seams are the natural methane pressure, porosity, gas permeability of the coal seams, and the sorption properties of coal. Methane occurs mainly in the absorbed (solid solution) and adsorbed states and only in relatively small volumes in the free state. The natural pressure in coal seams below the upper boundary of the methane zone is usually lower than hydrostatic; however, in a number of formations of the Karaganda Basin, it exceeds hydrostatic pressure (Table 9) [32].
According to Table 9, the reservoir pressure of seam K10 shows a strong positive correlation with depth (r ≈ 0.89, n = 4), and permeability shows a strong negative correlation with depth (r ≈ −0.96, n = 4). Owing to the small sample size, these coefficients are regarded as preliminary. The calculated layer thickness d in Table 9 reflects the coal rank and is itself strongly correlated with depth (r ≈ −0.96); therefore, its covariation with pressure, gas content, and permeability may be mediated by common factors—depth of occurrence and coal rank—and does not indicate a cause-and-effect relationship.
The distribution of gas occurrence forms in coal was studied in the laboratory of “Spetsmontazhdegazatsiya”, a subsidiary of Karagandaugol JSC. In total, 250 coal samples collected during drilling of seam D6 at the Kazakhstanskaya and Lenin mines were analyzed (Table 10).
Table 10.
Gas-content components of coal seam D6 in the Kazakhstanskaya mine field.
According to the DMT method, the total gas content of a sample Q is determined as the sum of three components: q1, the lost gas released from the sample between its separation from the rock mass and its placement in a sealed canister (estimated by extrapolation of the initial part of the desorption curve); q2, the gas desorbed from the sample in the sealed canister; and q3, the residual gas released when the sample is crushed in a sealed mill. The quantity is the residual (non-recoverable) gas content of coal at atmospheric pressure, and D = Q − is the desorbable gas content. As shown in Table 10 and Figure 3, the values of q1, q3, and differ little between samples and average 0.88, 3.15, and 2.12 m3/t, respectively, whereas q2 varies consistently with the total gas content Q. The difference between Q and D for the mean values (12.67 − 10.55 = 2.12 m3/t) corresponds to the average free-gas content.
Figure 3.
Gas-analysis components of borehole samples from seam D6 of the Kazakhstanskaya mine.
The desorbed gas content D of 10.55 m3/t is apparently determined by two main components: methane adsorbed on the surfaces of micropores and microcracks, including microcracks of the coal surface layer, and methane absorbed by the surface layer and the entire volume of coal matter.
The studies were performed on seam D6 in mine fields where degassing (preliminary and current) had already been carried out; no clear correlation was found between the total gas content of the seam, volatile-matter yield, and ash content. The relationship between these characteristics for coal seams of the Karaganda Basin under natural stress–strain conditions is described in a number of reports based on geophysical borehole measurements [27,40,43]. The relatively low free-gas content (2.42 m3/t) compared with the values (2–12 m3/t) obtained in exploration boreholes from gas sampling is explained by the fact that, during current degassing, free gas is extracted mainly from natural macropores and macrofractures, as well as from technogenic fractures caused by mechanical impact on the seam and on the walls of mine workings.
Gas–core tests of vertical boreholes drilled into seam D6 gave the following ranges of component composition (%): H2, 0.01–30; O2, 0.3–6.0; N2, 1.3–42.0; CH4, 25.0–98.0; and CO2, 0.12–11.8.
For the friable, tectonically disturbed coals of seam D6, a substantial effect on the methane concentration in q3 (gas released after crushing) was observed. This may be associated with a significant increase in specific surface area in the microcracks of the coal surface layer (within the model, their length is taken to be equal to the layer thickness), as well as in the bulk phase of coal; this explanation is a hypothesis and requires experimental verification.
The general pattern of variation in reservoir gas pressure with depth is described by G.D. Lidin’s formula [42]:
where H1 is the depth of the pressure measurement (m); H0 is the depth of the upper boundary of the methane zone (m); and B and v are empirical coefficients determined from field observations and regional data. Pressure measurements in seam D6 at depths of 450–500 m gave values from 2 to 3.5 MPa.
P = B × (H1 − H0)ᵛ + P0,
Three zones of variation in gas permeability with depth are distinguished (see Figure 4) [32].
Figure 4.
Variation in the gas permeability of coal seams (k) and gas pressure (P) with mining depth (Hd). Authors’ visualization based on factual data and relationships reported in [32]; not reproduced from [32]. Legend: 1—hydrostatic pressure; 2—lithostatic (rock) pressure; 3—methane pressure in coal seams; 4—gas permeability of coal seams; I, II, III—pressure and permeability zones.
The relationship between reservoir pressure and gas permeability is described by the formula:
where k0 is the initial gas permeability; B is an empirical coefficient; and P is the gas pressure.
K = k0 e−BP
The gas permeability of seam K18 at depths of 400–500 m has been established to be within (0.6–0.9) × 10−2 mD [32].
The general pattern of variation in the gas permeability of coal seams is as follows:
- −
- In the first zone (zone I), gas permeability increases toward the surface (owing to weathering, unloading, and opening of fractures);
- −
- In the second zone (zone II), the gas pressure is lower than the lithostatic pressure of the overlying rocks; in this zone, gas permeability decreases with increasing gas pressure (the gas pressure compresses and closes the fractures);
- −
- In the third zone (zone III), gas permeability increases again owing to the predominant influence of the lithostatic rock pressure (reopening of microcracks under high stresses).
The gas content of the coal seams of the basin increases from the boundary of the weathering zone to a depth of 360–450 m, after which the gas-content curve flattens at greater depths. This flattening trend is due to the sorption capacity of coals of different composition, as well as to the presence of macropores and microcracks observed both within individual seams of one formation and between different formations as a whole.
3.4. Methane Diffusion in the Coal Seam
Gas transport in coal-bearing deposits occurs by diffusion and filtration [22,39,44]. According to the classification of gas-transport types in the coal–rock mass (developed at the A.A. Skochinsky Institute of Mining) using the IUPAC pore classification [45], sorption and surface diffusion occur in micropores < 2 nm, molecular and Knudsen diffusion occur in mesopores (2–50 nm), and free (viscous) diffusion combined with slow laminar filtration occurs in macropores larger than 50 nm.
Production experience at the mines of the Karaganda Basin, combined with laboratory studies, shows that with increasing depth of seams K10, K12, K18, K20, and D6, the gas pressure, degree of coalification, microporosity, and sorption capacity of coals increase, whereas the permeability of the coal seams decreases (Table 9, Figure 5). In particular, the thick seam D6 (5.2 m), the lower part of which consists of a one-meter layer of crushed coal with particle sizes from less than 1 to 13 mm and well-developed microporosity, has very low permeability, which creates conditions for the sorption accumulation of methane in this highly gas-bearing seam.
Figure 5.
Variation in the permeability of seam K10 with depth (data of A.K. Akimbekov and A.A. Makhov). Authors’ visualization based on factual data reported in [32]; not reproduced from [32].
A comparison of the gas permeability values of coal (Table 9) shows its negative relationship both with gas content (r ≈ −0.94 for the mean values of the permeability intervals) and with the depth of seam K10 (Figure 5) [32].
The dependence of gas permeability on the depth of seam K10 is described by the equation:
where H is the depth of seam K10 in the range from 400 to 800 m; K is the gas permeability, mD; and a = 40.385 mD and B = 0.0085 m−1 are empirical coefficients.
K = a e−BH,
3.5. Consistency Between the Variation in Surface-Layer Thickness and Spontaneous Combustion of Coal
The endogenous fire hazard is due to the propensity of coals for spontaneous combustion, a well-developed system of microcracks through which oxygen penetrates, heating of the coal mass by heat release during its oxidation, and the presence of coal dust and moisture in mine workings [46,47,48]. In expression (6), A(h) is taken as the characteristic self-ignition temperature at a distance h from the outer boundary of the surface layer, and A0 = T0 is taken as the self-ignition temperature of coal in the bulk phase. According to the Research Center “Ugol”, the self-ignition temperature of the basin coals varies widely; in the calculations of Table 11, a single value A0 = 887 K (614 °C) was adopted for all ranks so that the differences in A(h) between ranks are determined only by the surface-layer thickness. Table 11 gives the values of A(h) calculated from Equation (6) for coals of different rank of the Karaganda Basin.
Table 11.
Calculated characteristic self-ignition temperature A(h), K, in the surface layer of coals of different ranks at a distance h from the outer boundary of the layer (Equation (6)).
As follows from Table 11, within the surface layer, the calculated characteristic temperature A(h) increases with distance from the outer boundary (with increasing h) and approaches the bulk-phase value at h > 9d; i.e., according to the model, the thermal stability of coal matter directly at the surface is substantially lower than in the bulk. At the same h, the values of A(h) are higher for coals with a smaller layer thickness d, i.e., of higher rank. This is consistent with the known decrease in the propensity of coals for spontaneous combustion in the series from low-rank coals to anthracites, which is related to the degree of coalification, porosity and fracturing, moisture, and the content of oxygen-containing functional groups [47,49]. The variations in specific heat capacity, moisture, and carbon content follow the same trend (Table 12). At the same time, this consistency is a covariation: both d and the propensity for spontaneous combustion depend on coal rank; therefore, the calculated layer thickness cannot be regarded as the cause of the differences in spontaneous combustion. Spontaneous combustion is controlled by many interacting factors, including oxygen diffusion, moisture, pore structure, particle size, oxidation kinetics, and heat dissipation [48]; therefore, the surface-layer thickness by itself is not an indicator of spontaneous-combustion hazard. To establish whether, and to what extent, the calculated surface-layer characteristics contribute to the propensity for spontaneous combustion, experimental oxidation and self-heating tests are required on samples with independently characterized surface structure. The obtained estimates can be used as an additional indicator for ranking the highly gas-bearing seams K7, K10, K12, and D6 by endogenous fire hazard—together with, but not instead of, the regulatory classification criteria. It should also be noted that the list of hazardous seams is approved annually for the mines of the basin and may change depending on depth of occurrence, degree of tectonic influence, variability of seam thickness, and gas content.
In zones of tectonically crushed coal, as well as in coal seams composed of crushed coal (the lower bench of seam D6), one of the probable factors of increased gas content may be a sharp increase in the specific surface area of the surface layer of coal particles, which enhances the sorption properties with respect to methane, together with an increase in the amount of free gas in micropores and microcracks formed under natural stress–strain conditions, including during shear deformation of the surface layer and the bulk phase of the coal particle [21,26].
An important factor affecting the spontaneous combustion of coal is its specific heat capacity Csp (J/(kg · K)), which depends on coal rank, carbon content (C), in situ moisture W, and volatile-matter yield Vdaf. Table 12 gives the average values of these characteristics for Karaganda Basin coals.
Table 12.
Average values of Cc (%), W (%), Csp (J/(kg · K)), and Vdaf (%) for coals of the Karaganda Basin.
Table 12 shows that, as the degree of coalification increases, the surface-layer thickness of coal decreases, and the average values of natural moisture, specific heat capacity (Csp), and volatile-matter yield decrease. The decrease in layer thickness, which is consistent with the known trends of these characteristics for coals of different rank, is an additional characteristic of them. At the same time, the consistent variation in d with W, Csp, and Vdaf is due to their common dependence on coal rank and does not imply a functional relationship between them.
Natural factors contributing to the formation of outburst-prone zones include changes in the physico-mechanical properties of the coal seam. The natural predisposition to sudden coal-and-gas outbursts is associated primarily with the physico-mechanical properties of the coal–methane system, including, presumably, the influence of the coal surface layer [1,2].
4. Discussion
The results obtained form a basin-specific theoretical basis for studying how the characteristic scale of the surface layer varies across the metamorphic series of Karaganda Basin coals. The calculated decrease in surface-layer thickness from low-rank coals to anthracite is determined exclusively by the molar volume used in the model (Section 2.2), which, in turn, depends on the calculated molecular mass and density of coal. This trend is consistent with the structural changes expected to accompany progressive coalification. However, because the surface-layer thickness of the studied coal samples was calculated rather than measured directly, the result should be interpreted as a model-based characteristic scale rather than as a direct experimental observation.
The decrease in surface-layer thickness from long-flame coals (198.7 nm) to anthracites (151.5 nm), and, including brown coal and coals of individual formations, within the range of 214.2–146.0 nm (Section 2.3), is consistent with the progressive condensation of aromatic structures during metamorphism, leading to an increase in density and a decrease in molar volume. It should be emphasized that the dependence of d on molar volume is built into the model itself (Equation (7)) and is therefore not an independent confirmation of it; the only independent result is the agreement of the calculated trend with the known increase in the density and aromaticity of coals with increasing rank [3,50]. Taking into account the estimated uncertainty (±10–11%, Section 2.3), all adjacent members of the series are mutually consistent, whereas the difference between the groups of low- and high-rank coals is significant.
The observed consistency between the variations in surface-layer thickness, gas content, and permeability (Table 9) suggests that near-surface structural characteristics may be related to the gas-storage and filtration properties of coal; this pattern is generally consistent with studies of the dependence of pore structure and methane adsorption on coal rank in other coal basins. However, the available data do not allow the specific contribution of the calculated surface layer to methane sorption or permeability to be quantified. Establishing such a relationship requires direct measurements of specific surface area, pore-size distribution, sorption capacity, and gas diffusion coefficient.
The calculated dependence is consistent with the higher propensity of low-rank coals for spontaneous combustion described in the literature. However, the present model does not independently demonstrate that the number of calculated monolayers of the surface layer controls the oxidation rate or ignition threshold. Therefore, the observed relationship should be regarded as a hypothesis for further experimental verification.
It should be noted that the calculated surface-layer thickness of coal (Table 8) is two orders of magnitude greater than the values obtained for gold and silicon (1.7–2.0 nm, Section 2.2). This discrepancy is natural and reflects the fundamental difference between the objects: coal is a heterogeneous macroporous organic substance with a complex supramolecular structure, whereas gold and silicon are homogeneous crystalline solids with dense atomic packing. For coal, the molar volume (v = M/ρ), which determines the layer thickness according to Equations (7), (9) and (10), is 1–2 orders of magnitude higher owing to the low density and high molecular mass of the organic matter, which explains the corresponding increase in the calculated thickness d. This is consistent with the general concepts of the size effect for heterogeneous and organic materials, according to which solids with low density and high molar mass have a substantially larger characteristic surface-layer thickness than dense metallic or semiconductor crystals. Thus, the greater calculated thickness for coal is interpreted as a natural consequence of its low density and high molar mass rather than as a deviation from the general regularities of the size effect observed for other classes of materials, including structural materials, to which similar surface-layer calculations have recently been applied; accordingly, the coal surface layer is characterized in the present study as a mesoscale structural element rather than as a nanoscale element in the strict sense.
The increase in theoretical shear strength from long-flame coal to anthracite (Table 8) is consistent with the gradual increase in surface energy. It can be assumed that this pattern is relevant for assessing zones of increased gas-dynamic hazard, where high surface energy combined with a concentration of tectonic stresses may create conditions favorable for sudden coal-and-gas outbursts; however, this hypothesis requires verification by comparison with actual outburst data.
4.1. Comparison with Other Studies
A comparison of the obtained results with data from other studies is given in Table 13. The calculated decrease in d with increasing rank is qualitatively consistent with the experimentally established dependence of the heterogeneity of the nanopore–fracture system of coals on rank and facies conditions [3], as well as with the conclusion that CH4 adsorption by coals of different rank is jointly controlled by the functional groups of organic macerals and the pore structure [4]. The increased gas content of the tectonically disturbed lower bench of seam D6 is consistent with data on the well-developed porosity, increased sorption capacity, and low permeability of tectonically deformed coals [21,22,26]. The decrease in permeability with depth (Table 9, Figure 5) corresponds to the general pattern established for deep coal seams of other basins [39]. The calculated values of τt (4.4–9.0 MPa, Table 8) are 1.5–2 orders of magnitude lower than the estimate τ ≈ 0.1G = 140–260 MPa obtained from Equation (11) using the shear modulus of the Tentek and Dolinka formation coals (Table 6). Equation (11) characterizes the theoretical strength of a defect-free bulk phase, whereas Equation (12) characterizes the energy of separation of a surface layer of thickness d. Therefore, the obtained ratio is consistent with the concept of the surface layer as a weakened zone of coal matter (Equation (6)). In order of magnitude, τt corresponds to the compressive strength of the basin coals estimated from the Protodyakonov strength coefficient (σc ≈ 10f = 4.7–20 MPa for f = 0.47–2.0). The comparison refers to different formations and should be regarded as approximate. Independent data on the porosity and sorption properties of Karaganda Basin coals [43] and on the micromechanical properties of the coal matrix obtained by nanoindentation [20] provide a basis for quantitative verification of the proposed model.
Table 13.
Comparison of previous studies with the present work.
4.2. Practical Application of the Model
Because the calculated surface-layer thickness, surface energy, and shear strength are model-based estimates, their practical use at the present stage is limited to tasks that require a relative (ranking) rather than an absolute value of the parameter. In this capacity, the model can be used (1) for preliminary ranking of coal seams and areas by expected sorption and filtration properties in degassing planning—the calculated d is obtained from standard exploration data (elemental composition, density, coal rank) and requires no additional testing; (2) as an additional structural indicator in multiparameter schemes for predicting outburst and endogenous fire hazards—together with, but not instead of, regulatory indicators (gas content, gas pressure, coal strength, volatile-matter yield); and (3) for planning experiments—selecting samples and parameter ranges for which the model hypotheses are most sensitive to testing. Reliable use of the model in engineering calculations and hazard assessment is possible only after its calibration against direct measurements. For this purpose, the following sequence is proposed: measurement of the surface energy of coals (e.g., by inverse gas chromatography or from contact angles) and comparison with the calculation from (9); determination of specific surface area and pore-size distribution (low-temperature N2 and CO2 adsorption, small-angle X-ray scattering) and micromechanical properties (nanoindentation [20]); and comparison of the obtained data with the calculated d and introduction of a calibration coefficient of structural imperfection k. Until such calibration is performed, the results should be regarded as testable hypotheses rather than as design standards.
4.3. Limitations of the Study
The present study is based entirely on theoretical calculations combined with previously published laboratory, geological, geophysical, and production data for the Karaganda Coal Basin; no new direct measurements of surface energy, surface-layer thickness, or mechanical strength were performed. The substitution of the ignition temperature for the melting temperature in the surface-energy relationship (Section 2.2) is a modeling assumption rather than an experimentally confirmed equivalence; as shown in Section 2.2, it affects only σ and τt, but not d. The calculated layer thickness is sensitive to the adopted values of density and degree of aromaticity (total uncertainty ≈ ±11%, Section 2.3), and the input parameters of Equation (8) were taken from the literature data as averages for coal ranks. The calculated theoretical shear strength is an idealized estimate that does not account for natural coal defects, microcracks, cleats, and mineral inclusions. The identified relationships of surface-layer thickness with gas content, permeability, and self-ignition temperature are covariations observed in the basin data and do not by themselves establish cause-and-effect or mechanistic relationships. Because all data refer to a single coal basin, the applicability of the proposed model to other basins has not yet been demonstrated and requires separate verification.
5. Conclusions
- The physico-mathematical surface-layer model was applied to the entire metamorphic series of Karaganda Coal Basin coals. It is shown that, after substitution of the surface-energy relationship, the temperature cancels out of the expression for the layer thickness, and d = kL × υ (kL ≈ 0.17 nm · mol/cm3); i.e., the calculated layer thickness is determined only by the molar volume of the organic matter of coal, whereas the ignition temperature affects only σ and τt.
- The calculated surface-layer thickness decreases with increasing rank from 198.7 ± 19.1 nm (long-flame coals) to 151.5 ± 17.0 nm (anthracites), and the number of monolayers decreases from ≈552 to ≈421. The calculation uncertainty due to errors in density and degree of aromaticity is ±10–11%. All calculated values in Table 7, Table 8 and Table 12 (146.0–214.2 nm) are consistent between adjacent members of the series within this uncertainty, including the apparent deviations from monotonicity (OS and A, T and OS), whereas the difference between the groups of low- and high-rank coals is statistically significant.
- The theoretical shear strength of the surface layer calculated from Equation (12) increases from 4.4 to 9.0 MPa in the series from long-flame coals to anthracites. It is 1.5–2 orders of magnitude lower than the theoretical strength of the bulk phase (0.1G) and comparable to the strength of the basin coals estimated from the Protodyakonov strength coefficient, which is consistent with the concept of the surface layer as a weakened zone of coal matter.
- The calculated surface-layer scale covaries with gas content, reservoir pressure, permeability (for seam K10, the correlation coefficient between d and permeability is r ≈ 0.98 for n = 4), and the spontaneous-combustion characteristics of coals. These relationships are mediated by depth of occurrence and coal rank and are regarded as testable hypotheses rather than cause-and-effect relationships.
Recommendations. At the present stage, it is advisable to use the calculated surface-layer thickness as an additional structural indicator when ranking seams and areas for degassing planning, outburst-hazard prediction, and assessment of the propensity of coals for spontaneous combustion—together with, but not instead of, regulatory indicators. The results can be applied in design decision-making only after independent experimental verification (Section 4.3).
Directions for future research: (i) experimental determination of surface energy, specific surface area, and pore-size distribution (inverse gas chromatography, low-temperature N2/CO2 adsorption, small-angle scattering) for samples from the four areas of the basin and calibration of the model; (ii) verification of the calculated shear strength by nanoindentation and introduction of a structural imperfection coefficient (0 < k < 1) based on a combination of laboratory measurements and numerical modeling; (iii) oxidation and self-heating tests to verify the hypothesis of a relationship between surface-layer characteristics and the propensity of coals for spontaneous combustion; and (iv) extension of the model to other coal seams and basins and its separate verification.
Author Contributions
Conceptualization, V.P. and T.I.; methodology, V.P.; investigation, M.R., S.I. and G.D.; data curation, A.K. and M.U.; writing—original draft preparation, M.R.; writing—review and editing, V.P. and P.H.; supervision, V.P.; project administration, T.I.; funding acquisition, T.I. All authors have read and agreed to the published version of the manuscript.
Funding
This research was funded by the Science Committee of the Ministry of Science and Higher Education of the Republic of Kazakhstan, grant number AP26198307 “Investigation and Substantiation of Parameters for the Extraction of Coal Mine Methane from Technogenic Accumulations for Its Subsequent Beneficial Use without Disrupting the Ecological Balance” (Grant Agreement No. 309/25-27 GF dated 29 September 2025).
Institutional Review Board Statement
Not applicable.
Informed Consent Statement
Not applicable.
Data Availability Statement
The datasets generated and/or analyzed during the current study are available from the corresponding author upon reasonable request.
Acknowledgments
The authors are sincerely grateful to E.N. Filimonov, N.M. Zamaliyev, and D.R. Akhmatnurov for the opportunity to conduct research using the modern scientific equipment of the “Methane” Laboratory of Abylkas Saginov Karaganda Technical University.
Conflicts of Interest
The authors declare no conflicts of interest. The funders had no role in the design of the study; in the collection, analyses, or interpretation of data; in the writing of the manuscript; or in the decision to publish the results.
Appendix A
Table A1.
Input data for calculating the molecular mass M100 of coals of different ranks of the Saran site (Karaganda formation) using Equation (8).
References
- Portnov, V.; Mindubayev, A.; Golik, A.; Suleimenov, N.; Zakharov, A.; Madisheva, R.; Kolikov, K.; Imanbaeva, S. Risk assessment of sudden coal and gas outbursts based on 3D modeling of coal seams and integration of gas-dynamic and tectonic parameters. Fire 2025, 8, 234. [Google Scholar] [CrossRef] [Scilit]
- Ussenbekov, M.; Isabek, T.; Khussan, B.; Rabatuly, M.; Zhumabekova, A. Mining of Outburst Hazard Coal Seams in the Karaganda Basin; Textbook; Abylkas Saginov Karaganda Technical University Publishing House: Karaganda, Kazakhstan, 2024; 193p, ISBN 978-601-355-333-7. [Google Scholar]
- Xiao, C.; Han, D.; Zhang, J.; Chen, S.; Qin, Z.; Vandeginste, V. Effect of coal rank and coal facies on nanopore–fracture structure heterogeneity in middle-rank coal reservoirs. ACS Omega 2024, 9, 33279–33292. [Google Scholar] [CrossRef] [Scilit]
- Ni, X.; Zhang, T.; Yan, J.; Han, Y.; Zhang, J. The microscopic control mechanism of CH4 adsorption by the functional groups in organic macerals and pore structures in coal with different degrees of metamorphism. Chem. Eng. J. 2026, 529, 172837. [Google Scholar] [CrossRef] [Scilit]
- Gibbs, J.W. Thermodynamic Works; GITTL: Moscow, Russia; Leningrad, Russia, 1950. (In Russian) [Google Scholar]
- Gleiter, H. Nanostructured materials: Basic concepts and microstructure. Acta Mater. 2000, 48, 1–29. [Google Scholar] [CrossRef] [Scilit]
- Rusanov, A.I. Phase Equilibria and Surface Phenomena; Khimiya: Leningrad, Russia, 1967; 346p. (In Russian) [Google Scholar]
- Oura, K.; Lifshits, V.G.; Saranin, A.A.; Zotov, A.V.; Katayama, M. Introduction to Surface Physics; Nauka: Moscow, Russia, 2006; 490p. (In Russian) [Google Scholar]
- Gokhshtein, A.Y. Surface Tension of Solids and Adsorption; Nauka: Moscow, Russia, 1976; 256p. (In Russian) [Google Scholar]
- Balashov, O.Y. Prospects for studying coal nanostructure to assess outburst hazard of coal seams. Min. Inf. Anal. Bull. 2013, 6, 286–296. Available online: https://cyberleninka.ru/article/n/perspektivy-issledovaniya-nanostruktury-ugley-dlya-otsenki-vybrosoopasnosti-ugolnyh-plastov (accessed on 14 October 2026).
- Uvarov, N.F.; Boldyrev, V.V. Size effects in the chemistry of heterogeneous systems. Russ. Chem. Rev. 2001, 70, 307–329. [Google Scholar] [CrossRef] [Scilit]
- Guisbiers, G. Size-dependent materials properties toward a universal equation. Nanoscale Res. Lett. 2010, 5, 1132. [Google Scholar] [CrossRef] [Scilit]
- Rosen, M.J.; Kunjappu, J.T. Surfactants and Interfacial Phenomena, 4th ed.; John Wiley & Sons: Hoboken, NJ, USA, 2012. [Google Scholar] [CrossRef] [Scilit]
- Yurov, V.M.; Guchenko, S.A.; Laurinas, V.C. Thickness of the surface layer, surface energy, and atomic volume of an element. Phys. Chem. Asp. Study Clust. Nanostruct. Nanomater. 2018, 10, 691–699. [Google Scholar] [CrossRef] [Scilit]
- Yurov, V.M.; Eshchanov, A.N.; Kuketaev, A.T. Method for Measuring Surface Tension of Solids. K.Z. Patent No. 57,691, 15 December 2008. [Google Scholar]
- Yurov, V.M.; Goncharenko, V.I.; Oleshko, V.S.; Ryapukhin, A.V. Calculating the surface layer thickness and surface energy of aircraft materials. Inventions 2023, 8, 66. [Google Scholar] [CrossRef] [Scilit]
- Portnov, V.S.; Yurov, V.M.; Reva, N.V.; Maussymbayeva, A.D. Nanostructures in surface layers of coal substance. Bull. Taras Shevchenko Natl. Univ. Kyiv. Geol. 2021, 4, 54–61. [Google Scholar] [CrossRef] [Scilit]
- Yurov, V.M.; Makhanov, K.M.; Portnov, V.S. Nanostructures in the thin layer of coal substance. Phys. Chem. Asp. Study Clust. Nanostruct. Nanomater. 2020, 12, 746–757. [Google Scholar] [CrossRef] [Scilit]
- Maussymbayeva, A.D.; Yurov, V.M.; Portnov, V.S.; Rabatuly, M.; Rakhimova, G.M. Assessment of the influence of the surface layer of coals on gas-dynamic phenomena in the coal seam. Sci. Bull. Natl. Min. Univ. 2024, 2, 5–11. [Google Scholar] [CrossRef] [Scilit]
- Cai, Y.; Jia, D.; Liu, D.; Gamage, R.P.; Li, Q.; Zhou, Y.; Li, Z. Methane diffusion in coal matrix considering heterogeneity of micromechanical properties by nanoindentation. Int. J. Coal Geol. 2024, 287, 104518. [Google Scholar] [CrossRef] [Scilit]
- Cheng, Y.; Pan, Z. Reservoir properties of Chinese tectonic coal: A review. Fuel 2020, 260, 116350. [Google Scholar] [CrossRef] [Scilit]
- Wang, Z.; Cheng, Y.; Wang, L.; Zhou, H.; He, X.; Yi, M.; Xi, C. Characterization of pore structure and the gas diffusion properties of tectonic and intact coal: Implications for lost gas calculation. Process Saf. Environ. Prot. 2020, 135, 12–21. [Google Scholar] [CrossRef] [Scilit]
- Glukhan, I.V.; Serykh, V.I.; Gridina, N.M.; Kondrashenkov, I.I. Geological Map of Sary-Arka (Central Kazakhstan), Scale 1:500,000, Sheet M-43-V; Serykh, V.I., Ed.; Scientific-Research Laboratory K-879, Karaganda University of Business, Management and Law: Karaganda, Kazakhstan; JSC SCTB Granit (electronic version): Almaty, Kazakhstan, 2007. (In Russian) [Google Scholar]
- Kopobayeva, A.; Amangeldikyzy, A.; Blyalova, G.; Askarova, N. Mineralogical and geochemical features of coals and clay layers of the Karaganda coal basin. Minerals 2024, 14, 349. [Google Scholar] [CrossRef] [Scilit]
- GOST R ISO 18283-2010; Hard Coal and Coke—Manual Sampling. Standartinform: Moscow, Russia, 2013.
- Xu, X.; Meng, Z.; Wang, Y. Experimental comparisons of multiscale pore structures between primary and disturbed coals and their effects on adsorption and seepage of coalbed methane. J. Pet. Sci. Eng. 2019, 174, 704–715. [Google Scholar] [CrossRef] [Scilit]
- Mussin, R.A.; Nemova, N.A.; Akhmatnurov, D.R.; Zamaliyev, N.M.; Reshetnyakov, E.D.; Reznik, A.V. Justification of the prospects for developing gas-bearing sites in the Karaganda coal basin. Min. Sci. Technol. 2025, 10, 321–337. [Google Scholar] [CrossRef] [Scilit]
- Golitsyn, M.V.; Kozlova, L.E.; Kuznetsova, A.A. Metamorphism of Caustobioliths of the Karaganda Basin; Nauka: Moscow, Russia, 1970; 135p. (In Russian) [Google Scholar]
- Kenetayeva, A.A.; Usupayev, S.E.; Kryazheva, T.V.; Rabatuly, M.; Salkeyeva, A.K.; Sembayeva, G.N. Demethanization of coal seams in the Karaganda basin. IOP Conf. Ser. Earth Environ. Sci. 2021, 677, 042118. [Google Scholar] [CrossRef] [Scilit]
- Mussin, R.; Portnov, V.; Golik, A.; Zamaliyev, N.; Akhmatnurov, D.; Ganyukov, N.; Skrzypkowski, K.; Zagórski, K.; Efremova, S. Assessment of strength characteristics and structural heterogeneity of coal seams in the Karaganda basin by geophysical methods for enhancing mining safety. Mining 2026, 6, 21. [Google Scholar] [CrossRef] [Scilit]
- Langmuir, I. The adsorption of gases on plane surfaces of glass, mica and platinum. J. Am. Chem. Soc. 1918, 40, 1361–1403. [Google Scholar] [CrossRef] [Scilit]
- Filimonov, E.N.; Portnov, V.S.; Egorov, V.V.; Steflyuk, Y.Y.; Kenetaeva, A.A. Some Aspects of Studying the Gas Content of Seam K10 under the Conditions of the Abayskaya Mine of the Coal Department of ArcelorMittal Temirtau JSC: Monograph; Karaganda State Technical University Publishing: Karaganda, Kazakhstan, 2016; 98p, ISBN 978-601-296-571-1. (In Russian) [Google Scholar]
- Moskalenko, T.V.; Mikheev, V.A.; Vorsina, E.V. Mathematical model for calculating coal molecular mass. Mod. High Technol. 2018, 10, 82–85. (In Russian) [Google Scholar] [CrossRef] [Scilit]
- Prutton, M. Introduction to Surface Physics; Clarendon Press: Oxford, UK, 1994; 196p. [Google Scholar]
- Guo, J. X-Ray Nanoscience: Spectroscopy, Spectromicroscopy and Scattering Techniques; Wiley-VCH: Weinheim, Germany, 2010. [Google Scholar]
- Griffith, A.A. The theory of rupture. In Proceedings of the 1st International Congress for Applied Mechanics, Delft, The Netherlands; pp. 55–63.
- Meshkov, Y.Y. The concept of a critical density of energy in models of fracture of solids. Usp. Fiz. Met. 2001, 2, 7–50. [Google Scholar] [CrossRef] [Scilit]
- Moore, T.A. Coalbed methane: A review. Int. J. Coal Geol. 2012, 101, 36–81. [Google Scholar] [CrossRef] [Scilit]
- Song, L.; Qin, Y.; Tang, D.; Shen, J.; Wang, J.; Chen, S. A comprehensive review of deep coalbed methane and recent developments in China. Int. J. Coal Geol. 2023, 279, 104369. [Google Scholar] [CrossRef] [Scilit]
- Musin, R.; Rabatuly, M.; Zamaliev, N.; Akhmatnurov, D. Assessment of geological conditions and prospects for methane production in the Karaganda coal basin. Bull. D. Serikbayev EKTU 2025, 109, 80–90. [Google Scholar] [CrossRef] [Scilit]
- Kudryavtsev, A.N.; Grashina, S.P.; Bergman, I.V.; Baipakov, S.K.; Yakovenko, E.V.; Markova, V.E.; Vakhidov, S.; Butkovskaya, A.N.; Bondarev, V.E.; Umar-Khodzhaeva, N.S.; et al. Summary Report on the Fields of Mines No. 101, 104, 106, 107, 120, 121 and Mine Field No. 129/130 of the Saran Site of the Karaganda Basin (as of 1 January 1967). Volume I. Text; Karaganda Coal Geological Exploration Expedition, Central Kazakhstan Geological Administration, Ministry of Geology of the Kazakh SSR: Karaganda, Kazakhstan, 1967. [Google Scholar]
- Lidin, G.D. (Ed.) Gas Content of Coal Mines of the USSR. Effective Methods for Degassing Coal Seams at Great Depths; Nauka: Moscow, Russia, 1987; 198p. (In Russian) [Google Scholar]
- Safaei-Farouji, M.; Misch, D.; Sachsenhofer, R.F.; Kostoglou, N.; Gaus, G.; Bauersachs, T.; Junussov, M.; Fustic, M. CO2 utilization and sequestration potential in deep coal seams: A case study on Carboniferous coals from the Karaganda Basin, Kazakhstan. J. CO2 Util. 2025, 101, 103204. [Google Scholar] [CrossRef] [Scilit]
- Kalugina, N.A. Mutual influence of diffusion and filtration in the process of methane outflow from coal mass. Phys. Tech. High Press. 2010, 20, 141–149. (In Russian) [Google Scholar]
- Rouquerol, F.; Rouquerol, J.; Sing, K.S.W.; Llewellyn, P.; Maurin, G. Adsorption by Powders and Porous Solids: Principles, Methodology and Applications, 2nd ed.; Elsevier: Oxford, UK, 2014. [Google Scholar] [CrossRef] [Scilit]
- Golynskaya, F.A. Characteristics of the most effective factors of coal self-ignition in seams. Min. Inf. Anal. Bull. 2011, 2, 19–23. (In Russian) [Google Scholar]
- Wu, C.; Wang, G.; Song, T.; Xia, T.; Niu, Y.; Guo, F.; Hou, P.; Mukhammedrakhym, R. Prediction of coal spontaneous combustion temperature under variable moisture contents: A study based on the random forest model optimized by the sparrow search algorithm. Process Saf. Environ. Prot. 2026, 209, 108586. [Google Scholar] [CrossRef] [Scilit]
- Suleimenov, N.; Sattarova, G.; Sarsenbekov, N.; Zakharov, A.; Abdirashit, A. Recognition of stages of endogenous fire outbreak and development in coal mines. Appl. Sci. 2025, 15, 11114. [Google Scholar] [CrossRef] [Scilit]
- Miao, G.; Li, Z.; Yang, Y.; Liu, H. Insight into the formation mechanism of higher-molecular-weight gases during the spontaneous combustion of coal. Fuel 2024, 373, 132383. [Google Scholar] [CrossRef] [Scilit]
- Yu, S.; Bo, J.; Vandeginste, V.; Mathews, J.P. Deformation-related coalification: Significance for deformation within shallow crust. Int. J. Coal Geol. 2022, 256, 103999. [Google Scholar] [CrossRef] [Scilit]
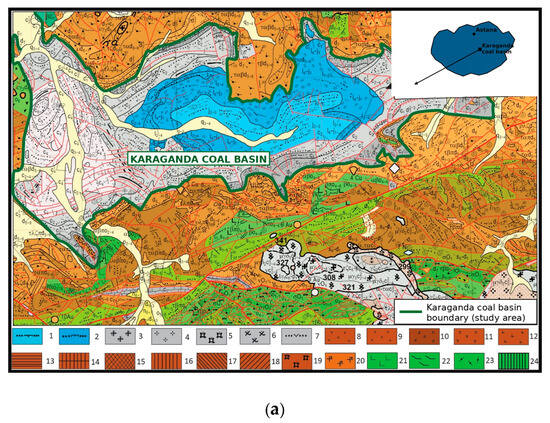
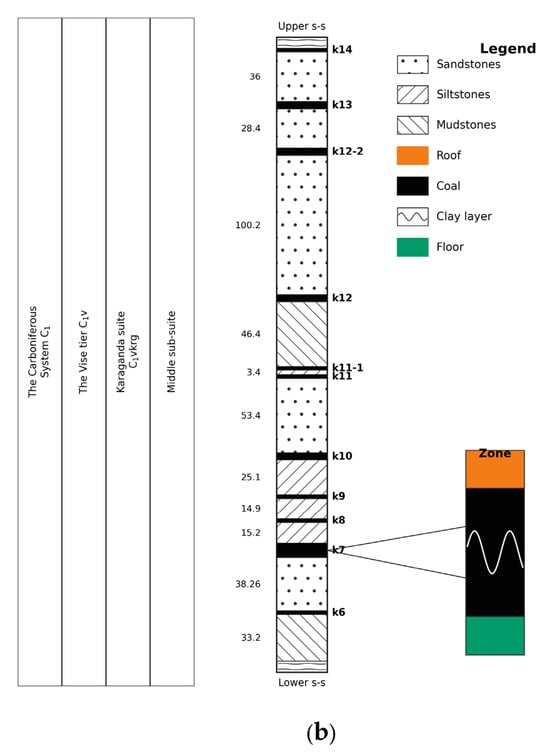
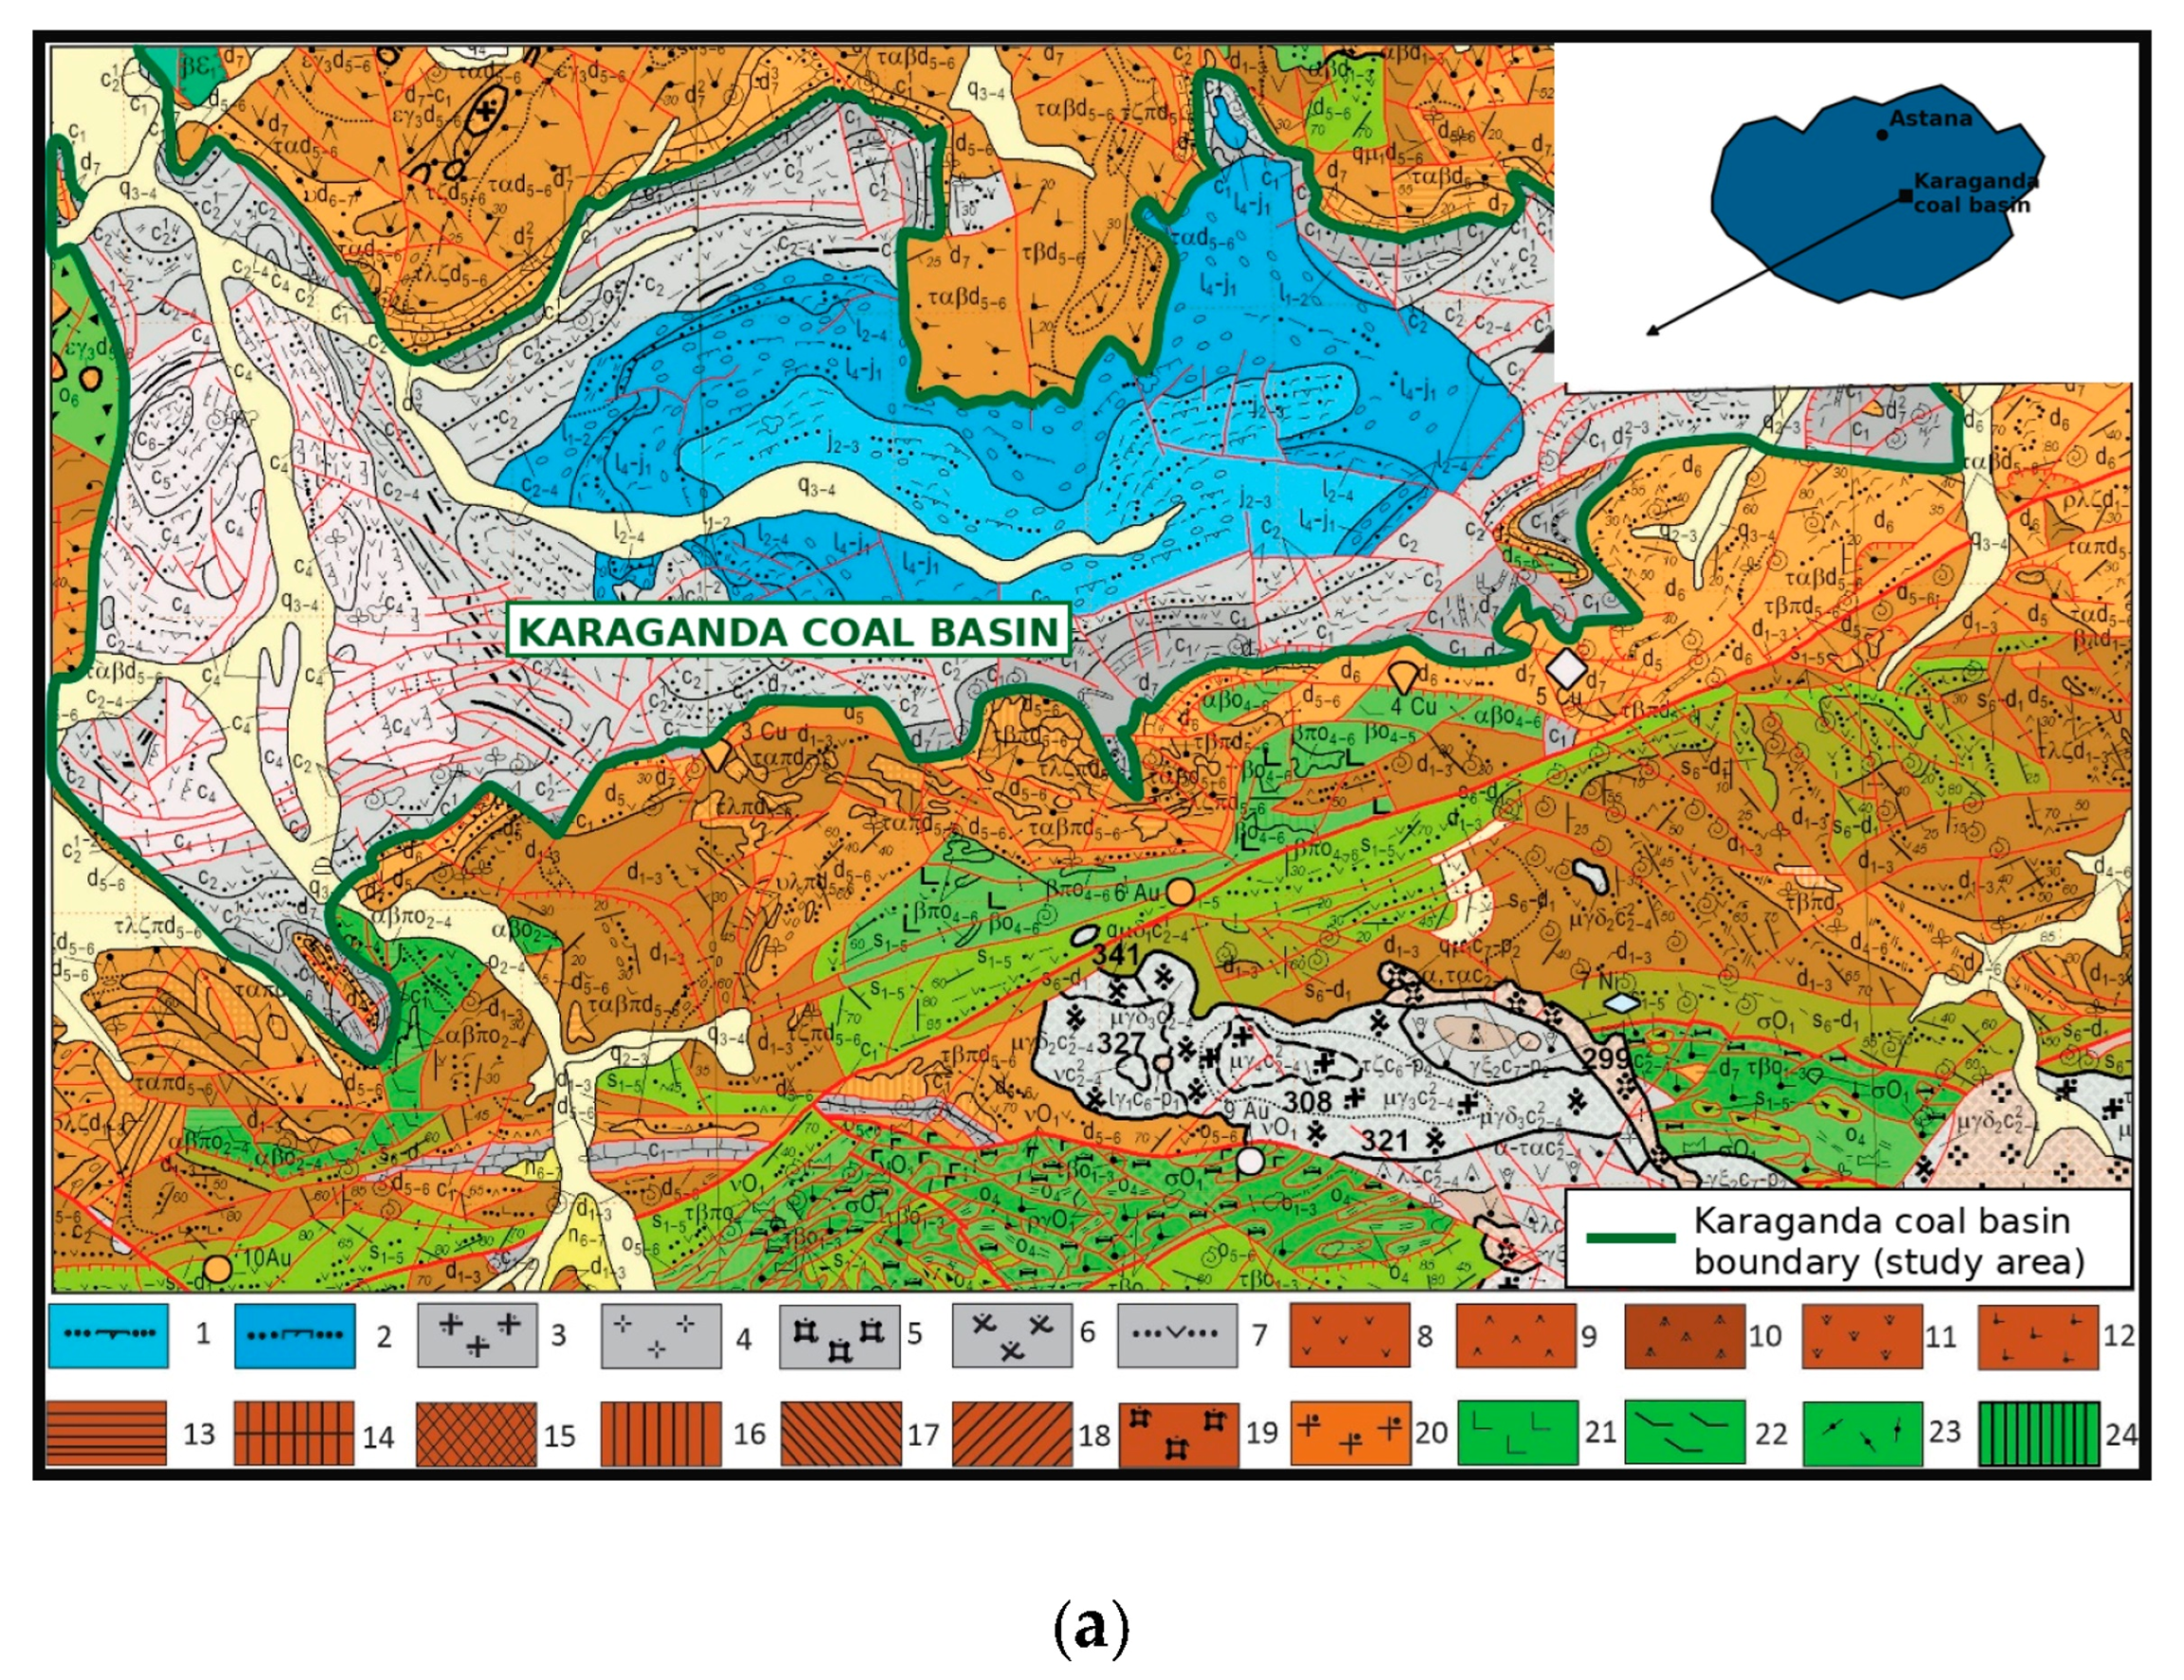
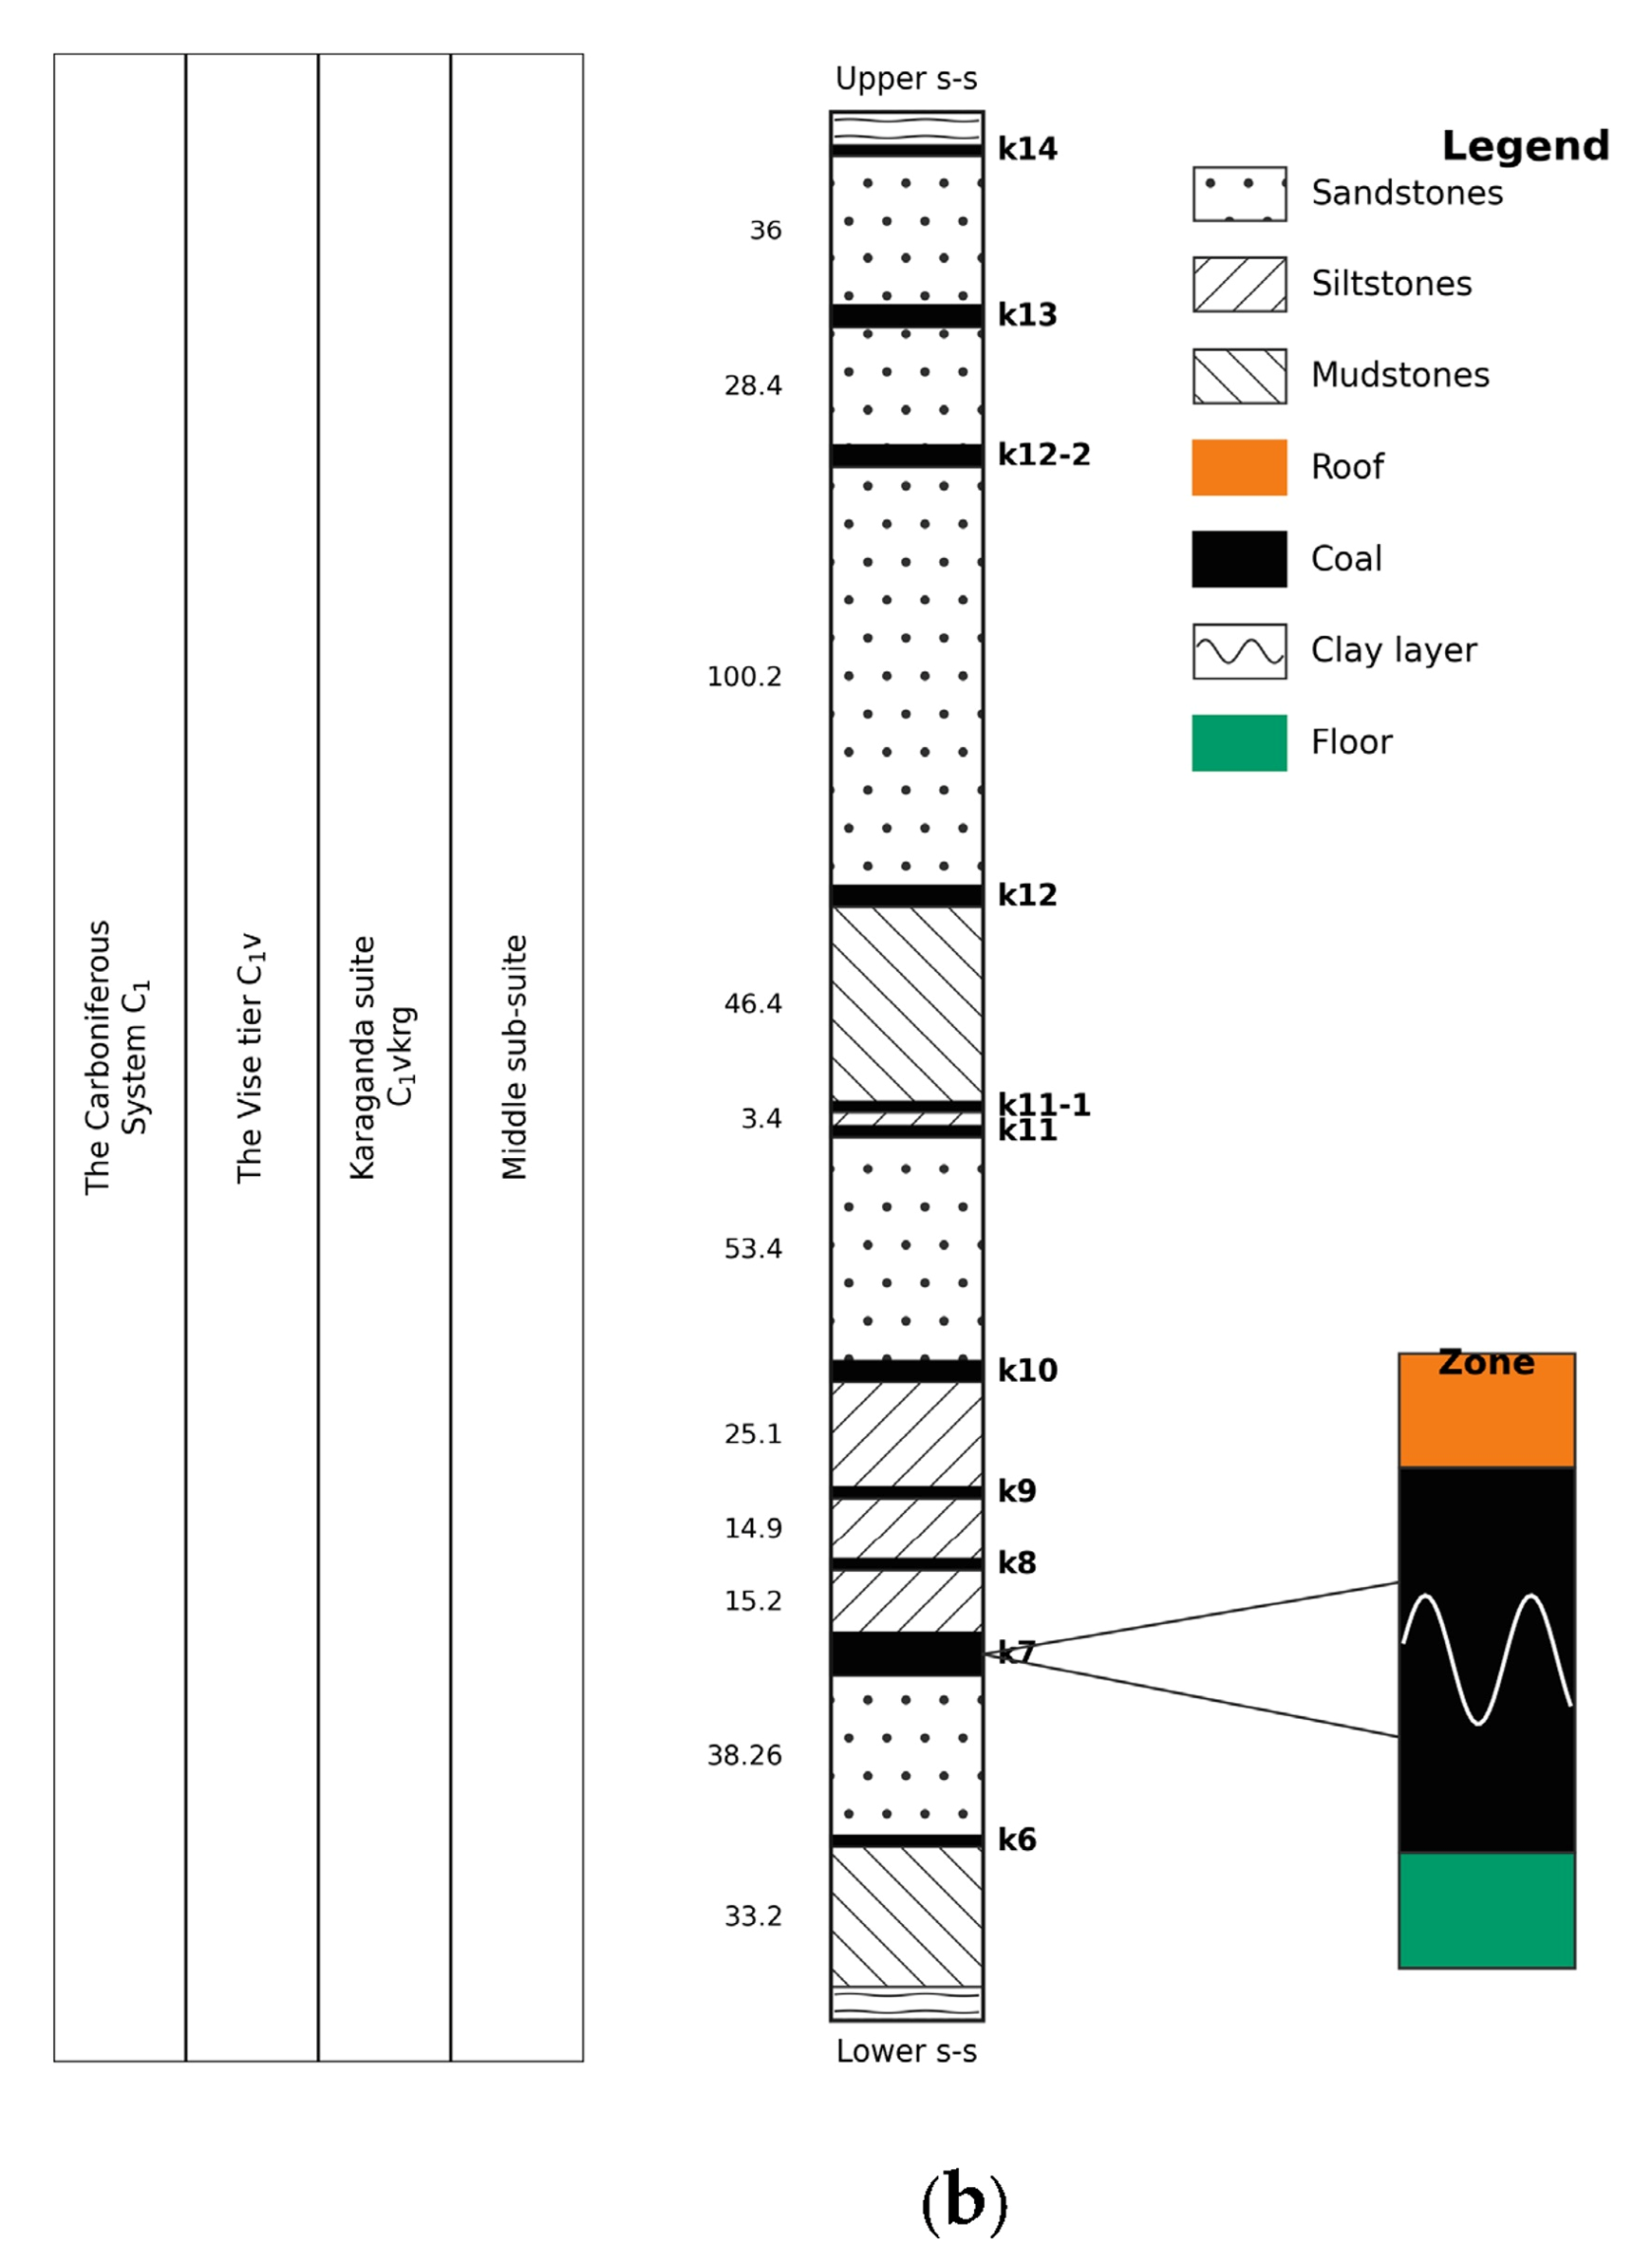
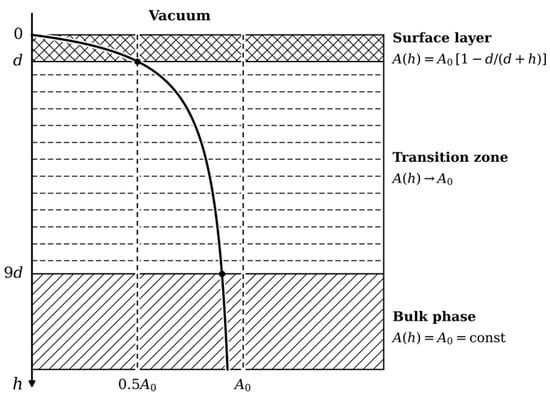
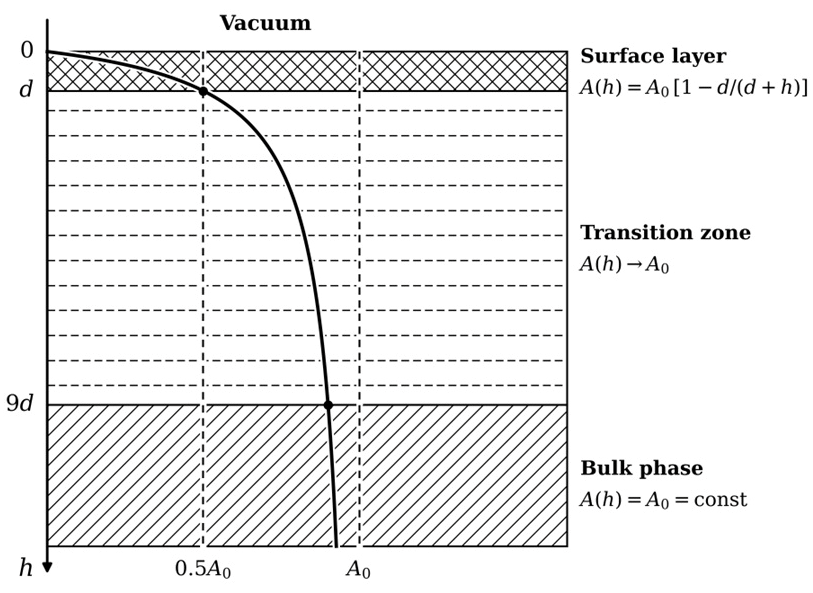
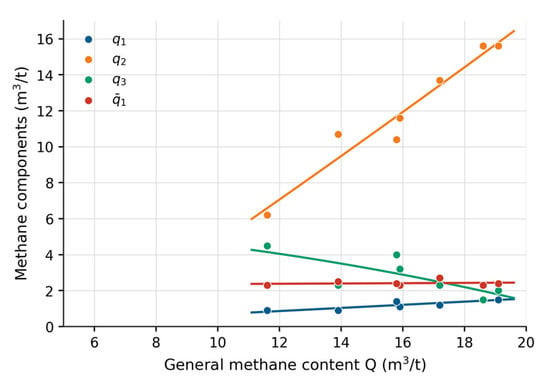
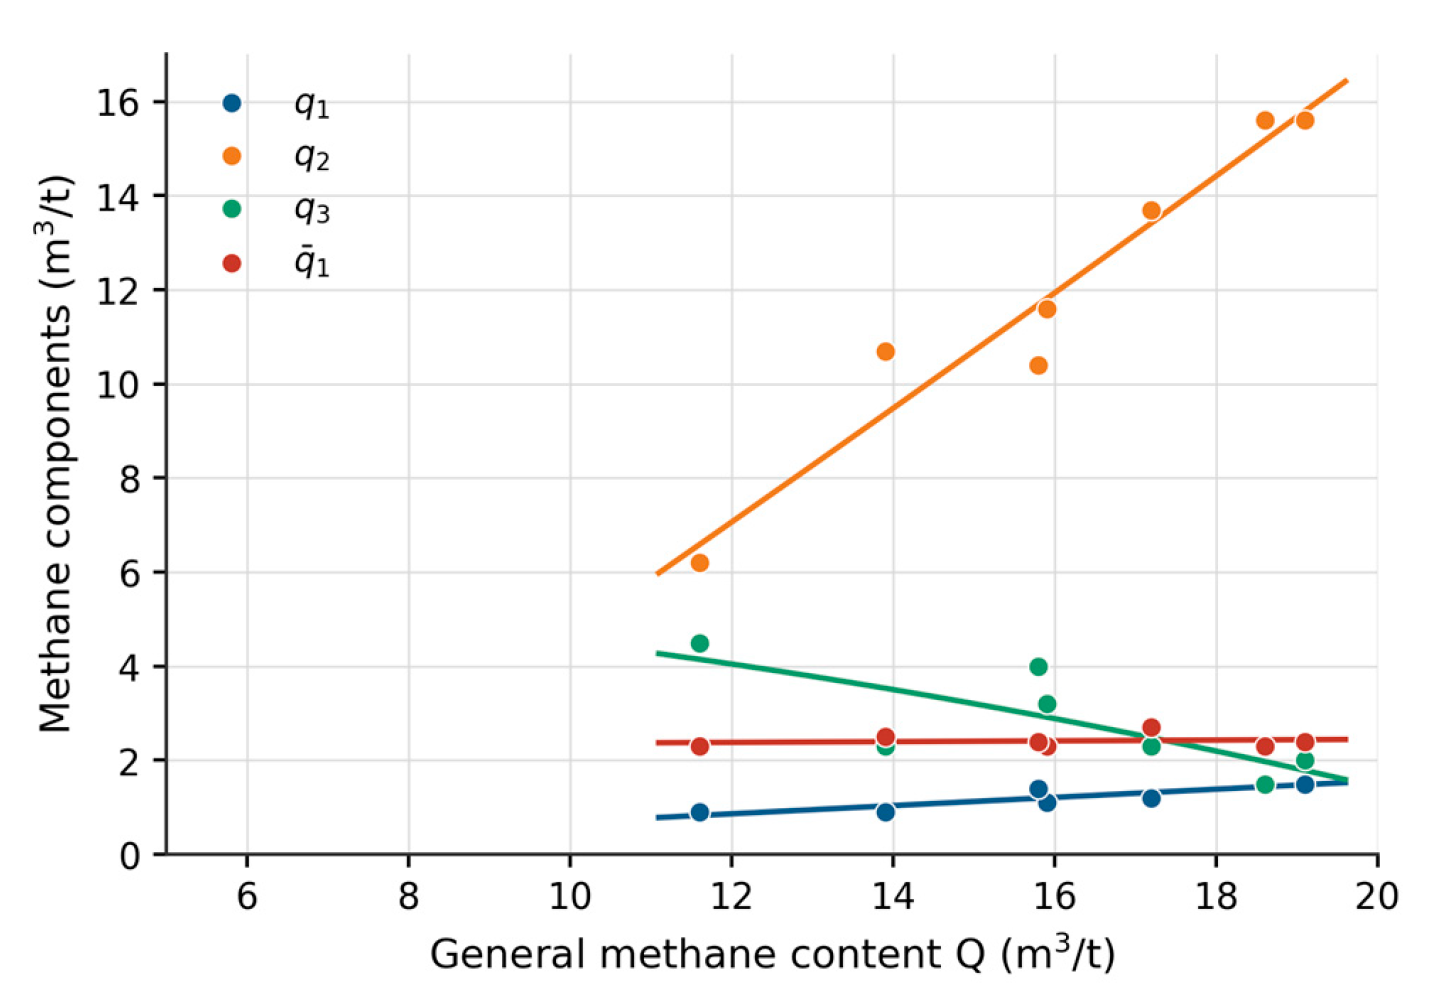
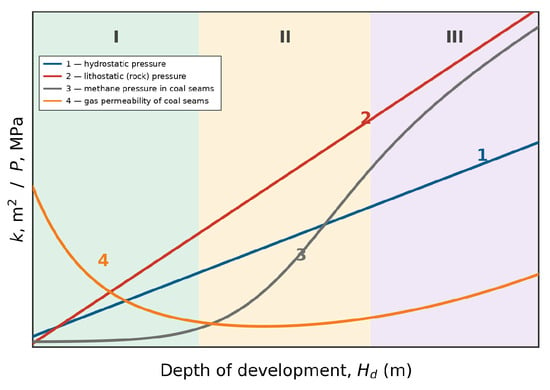
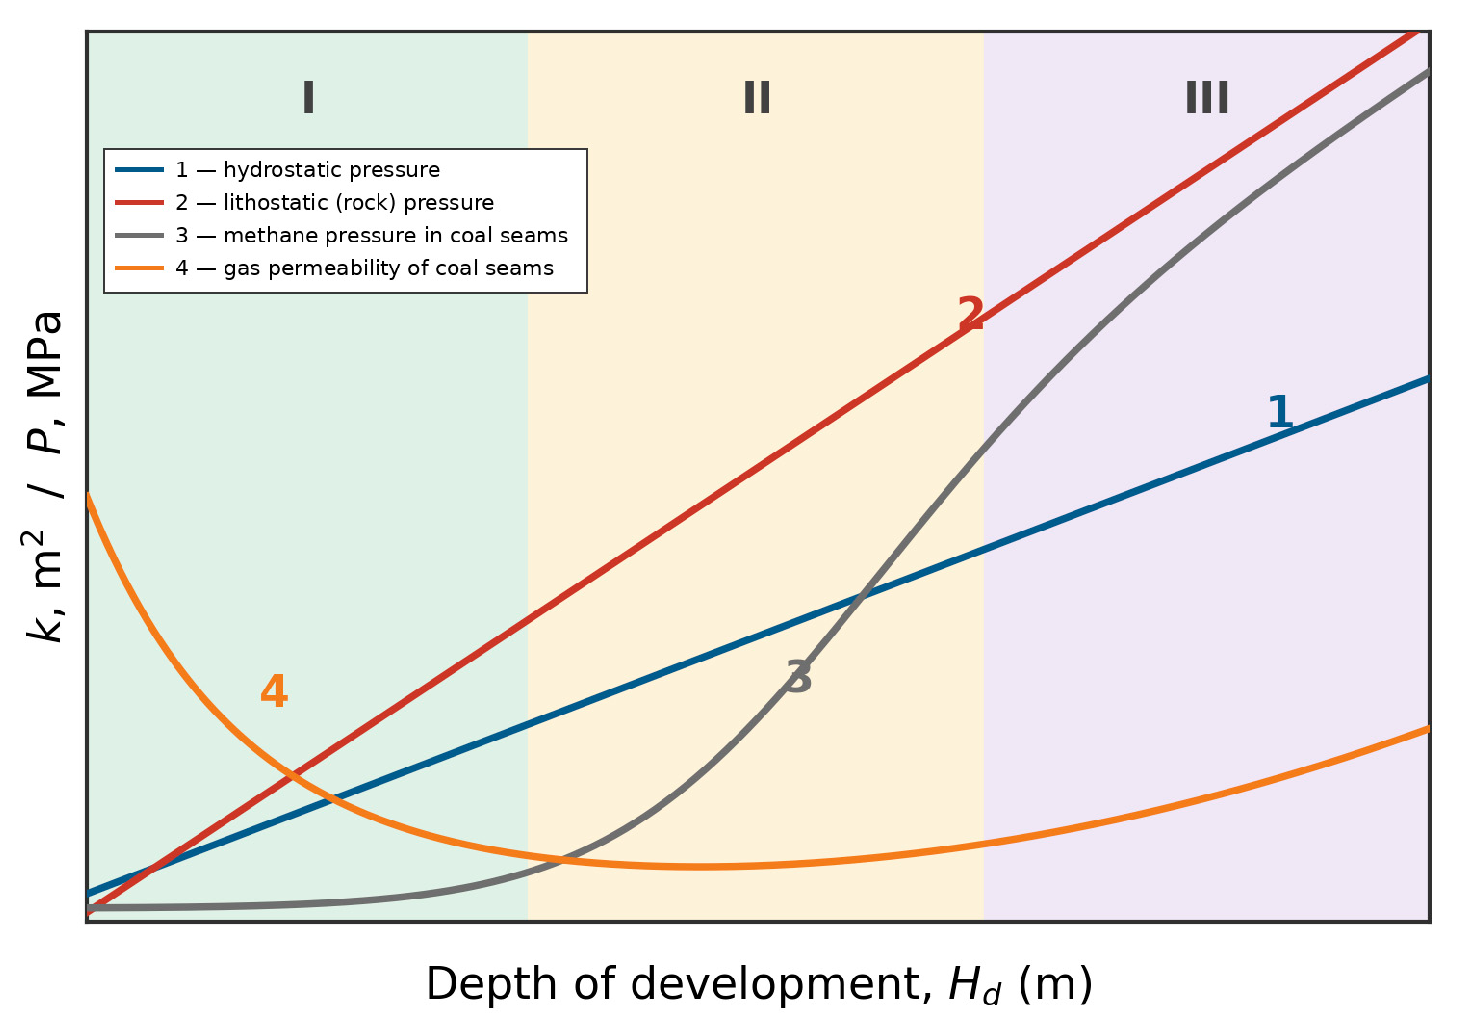
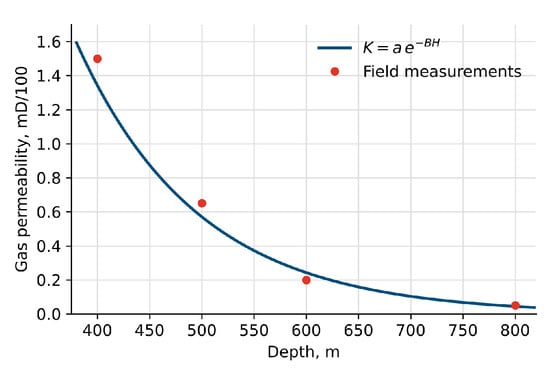
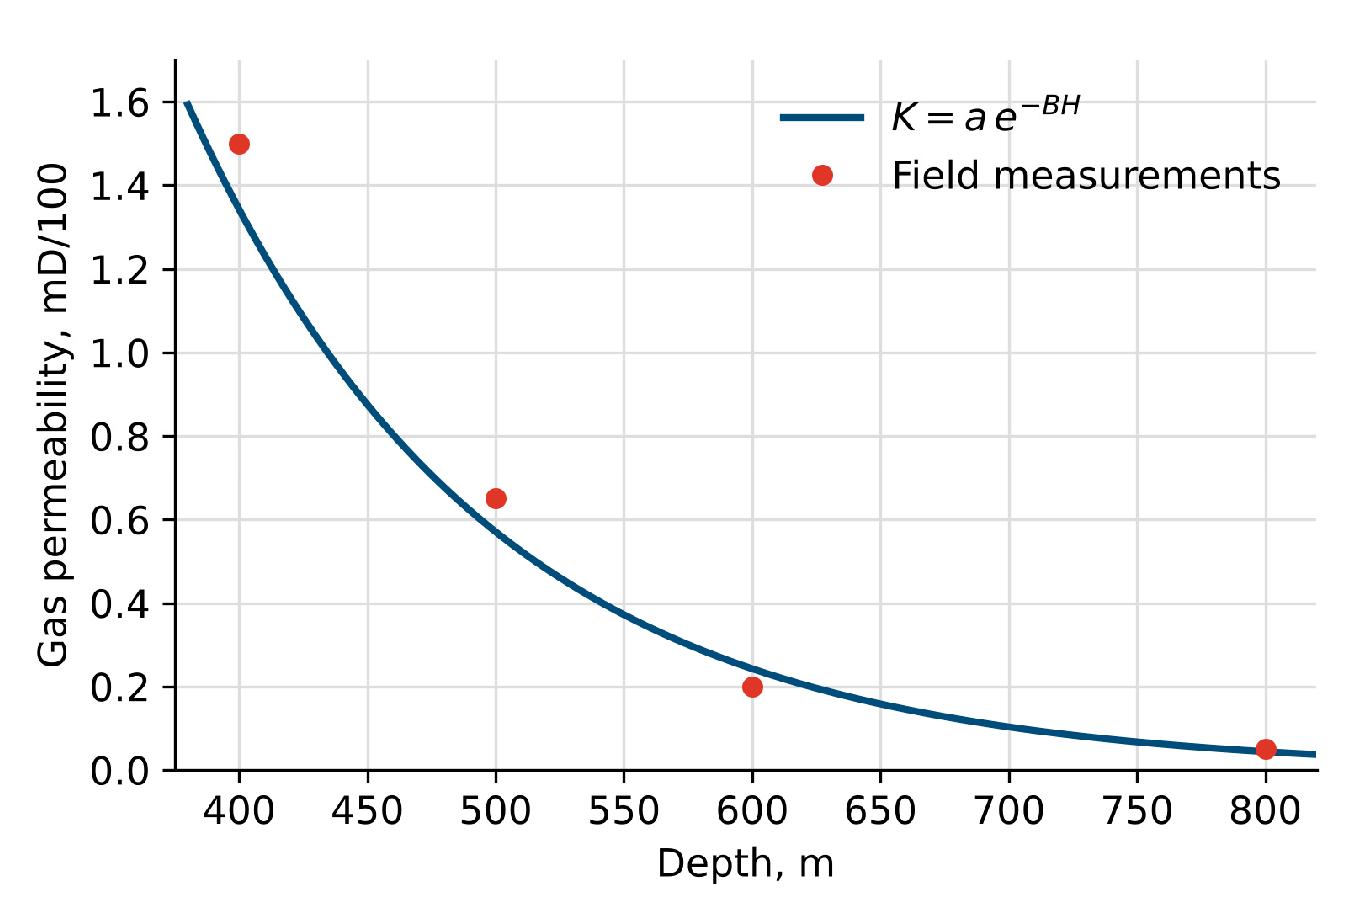

Disclaimer/Publisher’s Note: The statements, opinions and data contained in all publications are solely those of the individual author(s) and contributor(s) and not of MDPI and/or the editor(s). MDPI and/or the editor(s) disclaim responsibility for any injury to people or property resulting from any ideas, methods, instructions or products referred to in the content. |
© 2026 by the authors. Licensee MDPI, Basel, Switzerland. This article is an open access article distributed under the terms and conditions of the Creative Commons Attribution (CC BY) license.