


Abstract
Geopolitical risk is an increasingly important source of environmental uncertainty in resource-rich economies, where energy transitions depend on economic activity, energy-system composition, and foreign investment. This study examines these interrelated dynamics using annual data for Azerbaijan over 1996–2024 and an augmented autoregressive distributed lag (A-ARDL) bounds-testing framework. The approach extends conventional ARDL analysis by incorporating the F-independent statistic, enabling robust inference under uncertainty regarding the integration properties of the dependent variable. Linear and nonlinear unit-root tests confirm that all variables are integrated at either level or first difference, with none exhibiting I(2) integration, while a structural break in CO2 emissions is identified in 2009. The A-ARDL bounds test provides strong evidence of a stable long-run relationship among geopolitical risk, economic activity, hydropower generation, foreign direct investment, and environmental performance. Long-run estimates show that geopolitical risk is positively and significantly associated with CO2 emissions in the long run, with a one-standard-deviation increase in geopolitical risk associated with an approximately 8.1% rise in emissions. Conversely, the hydropower share exhibits the strongest negative long-run association with emissions: a one-percentage-point increase in its electricity share reduces emissions by approximately 2.8%, equivalent to an 8.6% reduction at one standard deviation. FDI is weakly negatively associated with emissions whereas economic activity has no significant long-run effect. The error-correction coefficient of −0.896 indicates rapid adjustment, with nearly 90% of disequilibrium corrected within one year. The findings underscore geopolitical exposure as an environmental risk and hydropower as a key resource-based mitigation channel for sustainable energy transitions.
1. Introduction
1.1. Background and Problem Statement
Global energy-related CO2 emissions reached a record 38.4 Gt in 2025, although their growth decelerated to approximately 0.4%, while renewable capacity additions reached 800 GW and renewables surpassed coal in global electricity generation for the first time in nearly a century, accounting for 33.8% compared with 33.0% for coal [1,2]. Despite these structural shifts, natural gas remained the largest contributor to the annual increase in emissions, highlighting the uneven and increasingly differentiated nature of the global energy transition, particularly across gas-intensive energy systems. This divergence has been reinforced by heightened geopolitical tensions since 2022, which have reconfigured energy-trade routes, intensified energy-security concerns, and strengthened the strategic role of hydrocarbon-exporting economies. Azerbaijan provides a particularly relevant case in this context, as it has simultaneously sought to strengthen its position as a strategic gas supplier to the European Union by approximately doubling gas deliveries by 2027 [3] while demonstrating climate-policy engagement through its hosting of COP29 in Baku in November 2024 and its emissions-reduction commitments [4]. Although the existing literature has extensively examined the growth–emissions nexus, geopolitical risk, foreign capital, and energy composition, these determinants have largely been investigated independently, producing heterogeneous findings regarding the direction and magnitude of their effects across countries and periods. For a hydrocarbon-exporting economy operating within a geopolitically sensitive environment, these factors are unlikely to function independently; therefore, identifying which of these forces dominates when economic growth, geopolitical risk, foreign capital, and energy structure are considered jointly is essential for understanding Azerbaijan’s decarbonisation trajectory and for informing energy-security and climate-policy strategies.
Decarbonisation has become the organising problem of contemporary environmental macroeconomics, and it is at its most intricate in hydrocarbon-dependent middle-income economies, where the forces driving emissions are economic, structural and geopolitical at the same time. That carbon dioxide (CO2) emissions rise with the scale of economic activity is among the most robust findings in the field: cross-country panel estimates spanning fifty-eight economies show that output expansion and energy use jointly and consistently push emissions upward [5], short-run evidence indicates that the carbon response depends on the rate of growth as well as on which sectors are doing the growing [6], and panel ARDL evidence for developing economies attributes a positive long-run influence to growth, industrialisation, energy use and urbanisation alike [7]. For an economy such as Azerbaijan, whose expansion has historically been anchored in oil and gas extraction and in gas-fired electricity generation, this scale channel is not a theoretical abstraction but the principal conduit linking macroeconomic performance to environmental outcomes.
Whether the relationship eventually reverses remains contested. The Environmental Kuznets Curve (EKC) hypothesis predicts that emissions fall once income passes a threshold, yet bias-corrected dynamic panel estimates show that the inverted-U pattern is far from universal and is highly sensitive to the country sample and to the estimator employed [8]. A systematic review of the decoupling evidence reaches a compatible verdict from a different direction, concluding that absolute decoupling of GDP from greenhouse gas emissions is rare, partial and seldom sustained [9]. The practical lesson for resource-rich transition economies is uncomfortable: emission reductions will not arrive automatically with rising income; they have to be engineered through changes in energy structure, investment composition and policy design.
Alongside this debate, environmental macroeconomics has widened its explanatory frame beyond the familiar income–energy–emissions triad to treat uncertainty as a first-order determinant of environmental performance. The construction by Caldara and Iacoviello of a consistent, high-frequency geopolitical risk (GPR) index built from newspaper coverage of war threats, terrorism and inter-state confrontation made systematic empirical treatment of this channel feasible, and renewable-energy investment in advanced economies has since been shown to respond measurably to geopolitical risk and policy uncertainty alongside income and urbanisation [10]. Applied work increasingly ties risk to environmental deterioration, finding that it raises carbon emissions and public health risk simultaneously [11] and that, in resource-rich economies specifically, risk and political globalisation together intensify degradation [12].
The empirical record, however, does not point in a single direction. Panel nonlinear estimates for the BRICS document asymmetric effects under which geopolitical risk can depress energy consumption and emissions in several member states [13], while bounds-testing evidence for Russia associates risk with the pace of energy transition rather than with a straightforward increase in emissions [14]. These divergences suggest that geopolitical risk works through several competing channels—energy-trade disruption, investment deferral, demand contraction and accelerated substitution—whose net effect is country-specific. For an energy exporter located in a strategically contested region, the sign and magnitude of the effect are therefore an empirical question rather than a settled one.
A third determinant concerns the technological composition of electricity supply, where hydropower deserves treatment as a distinct variable rather than as an undifferentiated slice of a renewable aggregate. Interfuel substitution evidence shows that hydroelectricity contributes materially to mitigation by displacing fossil fuels, an effect identified through the cost structure of fuel choice rather than through a reduced-form correlation [15]. Hydropower is nevertheless not unconditionally carbon-neutral: reservoir-level assessment of existing and planned facilities worldwide reveals wide heterogeneity in carbon intensity, driven by flooded biomass, climate zone and reservoir residence time [16]. Modelling hydropower separately therefore captures a substitution effect that an aggregate renewables proxy would conceal, while acknowledging that the technology’s own footprint is not zero.
The fourth determinant, foreign direct investment (FDI), remains theoretically ambiguous. Under the pollution-haven hypothesis, inward capital relocates emission-intensive production toward jurisdictions with weaker regulation, and bounds-testing evidence for Türkiye is consistent with that prediction [17]; under the technology-transfer or pollution-halo view, foreign capital imports cleaner processes and higher energy efficiency, and panel threshold estimates suggest the two channels dominate in different sub-periods rather than one prevailing universally [18]. Country-specific evidence for Azerbaijan is particularly telling, reporting a structural pattern in which FDI raised emissions before 2006 and reduced them thereafter [19]. The relationship is thus better described as dynamic and structurally contingent than as fixed in sign.
These four mechanisms converge with particular force in Azerbaijan. The country’s electricity system remains dominated by thermal gas-fired generation, which accounted for roughly 80% of installed capacity and 93% of output in 2024, while hydropower—the second-largest source—supplied about 16% of capacity and 6% of generation [20]. The configuration is long-standing, since the development trajectory of the oil and gas sector entrenched thermal generation as the backbone of domestic supply during the first post-independence decades [21]. Diversification has nonetheless been pursued deliberately, and scenario modelling of climate-related policy options indicates that meeting Azerbaijan’s Paris Agreement commitments requires substantial renewable deployment and efficiency improvement, with hydropower identified as the principal established domestic renewable asset [22].
Against this backdrop the national evidence base is informative but incomplete. Cointegration evidence rejects the EKC hypothesis for Azerbaijan and identifies a positive long-run elasticity of emissions with respect to growth [23], while ARDL evidence indicates that a larger renewable share, green finance and ESG-oriented lending reduce emissions [24]. What has not been examined is whether geopolitical risk exerts an independent influence on the country’s emissions trajectory, and whether hydropower generation delivers a measurable and separately identifiable mitigation effect once growth, risk and foreign capital are jointly controlled for. The closest available template comes from Türkiye, where hydroelectricity generation, financial development, geopolitical risk, income and FDI have been combined in a single emissions function [25]; no equivalent specification exists for Azerbaijan. That is the empirical problem addressed here.
The selection of economic activity, geopolitical risk, hydropower generation, and foreign direct investment (FDI) reflects Azerbaijan’s economic and energy structure, capturing the scale, geopolitical, energy-composition, and capital channels through which emissions may be shaped. Given the interdependence among these determinants, their joint estimation is essential to avoid omitted-variable bias and to identify their relative effects, while the absence of an integrated dynamic specification for Azerbaijan constitutes the empirical gap addressed by this study.
1.2. Research Objectives, Hypotheses and Contribution
The objective of this study is to estimate the short-run and long-run effects of geopolitical risk, economic activity, hydropower generation and foreign direct investment on carbon dioxide emissions in Azerbaijan over 1996–2024. The motivating proposition is that, in a hydrocarbon-based but transition-seeking economy, emissions outcomes are determined jointly by the scale of output, by exposure to external strategic uncertainty, by the composition of inward capital, and by the extent to which domestic low-carbon generation displaces thermal supply. Four testable hypotheses follow from the evidence surveyed in Section 2 and are evaluated directly against the estimates reported in Section 4.
H1.
Geopolitical risk exerts a statistically significant positive effect on carbon emissions in Azerbaijan in the long run, because sustained regional tension raises the cost of imported low-carbon technology, postpones transition-oriented capital formation and reinforces reliance on domestic thermal capacity.
H2.
Economic activity exerts a positive effect on carbon emissions, operating most visibly through short-run scale dynamics; its long-run significance is treated as an open question, since energy-mix and structural-break effects may absorb the income channel once they are modelled explicitly.
H3.
An increase in the hydropower share of electricity generation reduces carbon emissions in the long run through direct substitution away from gas-fired thermal generation.
H4.
Over the sample period as a whole, foreign direct investment is negatively associated with carbon emissions, reflecting a predominance of the technology-transfer channel over the pollution-haven channel in the average relationship.
The principal contribution of this study is substantive, providing the first joint assessment for Azerbaijan of the long-run relationships between emissions, geopolitical risk, technology-specific hydropower generation, economic activity, and FDI, with the A-ARDL framework serving solely as the estimation strategy. The findings support the transition-delay, economic scale, and hydropower displacement mechanisms, while providing only weak evidence for the FDI-based technology-transfer channel, thereby highlighting the differentiated roles of geopolitical conditions, economic activity, and energy composition in shaping Azerbaijan’s emissions dynamics.
2. Literature Review
2.1. Global Context
2.1.1. Geopolitical Risk, Uncertainty and Carbon Emissions
Since the geopolitical risk index became available in a form suitable for macroeconomic estimation, a substantial literature has accumulated on its environmental consequences, and much of it reports adverse effects. Sectoral marginal analysis for the BRICS shows that disaggregated energy use, income, geopolitical risk, energy transition and energy prices jointly shape the decarbonisation of the principal emitting sectors, so that risk is not a residual disturbance but an argument in the decarbonisation function itself [26]. Panel estimates for the same bloc find that geopolitical risk and economic policy uncertainty significantly impair environmental sustainability [27]. Recent work qualifies rather than contradicts this conclusion by asking whether risk is unambiguously harmful and identifying the clean-energy transition as the mechanism that moderates it [28]. The financial dimension has also been opened up: sectoral evidence from China demonstrates that green bonds, sovereign credit default swap spreads and geopolitical risk jointly determine environmental degradation across sectors [29], while evidence from the United States power sector shows that the emission-reducing capacity of clean energy is itself contingent on critical-mineral prices and geopolitical conditions [30]. Both findings point to the same underlying channel: risk operates on the cost and availability of transition inputs rather than on energy demand directly.
A competing strand identifies negative or asymmetric relationships. Pooled mean group evidence indicates that geopolitical risk lowers fossil-fuel and total energy consumption while raising renewable energy use, implying a compositional as well as a level effect on demand [31]. Because the sign of the aggregate effect then depends on which component dominates, attention has shifted toward transmission channels. Risk generates asymmetric disruptions to energy trade, with emerging economies markedly more exposed than advanced ones [32], and heightened international tension depresses FDI inflows into emerging markets [33]. Since energy trade and foreign capital are themselves emission determinants, geopolitical risk may operate indirectly as well as directly. Evidence that the interaction between energy security and environmental regulation shapes transition outcomes differently in high-income and middle-income countries reinforces this conditionality [34], and it implies that pooled estimates may conceal precisely the country-level heterogeneity that matters for policy.
Most directly relevant to the present design is the Turkish study introduced in Section 1, which estimates hydroelectricity generation, financial development, geopolitical risk, income and FDI within a single emissions function for a neighbouring economy exposed to the same regional risk environment. Its finding that geopolitical risk adds to environmental pressure while hydroelectricity relieves it establishes the comparative benchmark against which the Azerbaijani estimates are assessed in Section 5.
2.1.2. Economic Activity and the Growth–Emissions Nexus
The link between economic activity and carbon emissions is the most extensively documented association in environmental economics, and the studies cited in Section 1.1 establish its central tendency. What the wider literature adds is texture about where and how strongly the association holds. Determinants analyses for upper-middle-income economies—the group to which Azerbaijan belongs—identify income and energy consumption as the dominant drivers [35]. Sectoral evidence for the United States shows how macroeconomic conditions translate into industry-level carbon outcomes rather than affecting the aggregate uniformly [36], and evidence for selected Asian economies adds industrialisation and institutional quality to the set of significant determinants [37]. The mechanism also propagates internationally: export-driven analysis of China’s global trade expansion demonstrates how outward trade growth is transmitted into transport-sector emissions well beyond the producing economy [38].
Decomposition analysis clarifies why the association persists. Scale, composition and technique effects operate simultaneously, but the scale effect associated with growth, foreign investment, urbanisation and trade generally dominates the other two [39]. Index decomposition of greenhouse gases and air pollutants embodied in Chinese international trade quantifies the relative weight of the scale and structural components [40], and decomposition across 286 Chinese cities shows that industrial agglomeration and regional development programmes reshape the growth–emissions link without dissolving it [41].
The nonlinear formulation has attracted comparable attention, with mixed results that caution against assuming an inverted-U. Disaggregated analysis of Chinese industrial emissions finds EKC-type behaviour in some sectors but not in others [42], and country-level work on the growth–energy–trade–emissions nexus produces conditional rather than general nonlinearity [43]. Aggregate and disaggregate evidence for India identifies differentiated relationships across sectors [44]; cointegration evidence for China supports an EKC specification in some formulations [45], while complementary Chinese evidence emphasises the joint role of energy consumption and growth [46]. European evidence from Hungary tests the hypothesis explicitly and finds only conditional support [47], and heterogeneous-driver analysis across world regions shows that the income–emissions relationship differs systematically by regional development context [48]. On balance the evidence supports a positive long-run growth elasticity of emissions in fossil-fuel-dependent developing economies, with nonlinearity a possibility to be tested rather than assumed—which is how it is treated in H2.
2.1.3. Hydropower Generation as a Low-Carbon Transition Variable
Hydropower occupies a distinctive position in the transition literature: it is simultaneously the oldest large-scale renewable technology and the one whose carbon neutrality is most often qualified. On the mitigation side, regional evidence for Southeast Asia links hydropower consumption to measurable progress toward environmental sustainability and carbon neutrality [49], and evidence incorporating hydropower into the EKC framework indicates that it shifts the estimated income–emissions relationship rather than merely lowering its intercept [50]. Chinese evidence finds that hydroelectric and renewable generation significantly reduce emissions while supporting energy-efficiency objectives [51]. Two refinements matter for the present specification. Quantile mediation analysis for Taiwan demonstrates that the hydropower–growth–emissions relationship varies across the conditional distribution of emissions, implying state-dependent rather than uniform effects [52]; and daily-frequency disaggregated evidence for leading European countries confirms that the emission-reducing capacity of renewable electricity differs markedly by generation technology [53]. Recent daily-data evidence from high-emitting countries using kernel-regularised least squares makes the same point at the margin, showing that the emission impact of each generation source differs in both sign and magnitude [54]. Taken together, these three studies constitute the methodological case for modelling hydropower as its own variable rather than folding it into a renewable aggregate.
The qualifying literature is equally consequential. Life-cycle assessment shows that biogenic greenhouse gas emissions from reservoirs must be attributed explicitly rather than assumed to be zero [55], and comparative life-cycle assessment across generation technologies reveals limited comparability and substantial dispersion in reported footprints [56]. Evidence from sub-Saharan Africa situates hydropower within climate-finance and hydrological-variability constraints that affect output reliability and therefore mitigation performance [57]. These qualifications do not undermine the substitution argument, but they do bound its interpretation: what a generation-share variable identifies is displacement of thermal output, not the lifecycle neutrality of the displacing technology.
2.1.4. Foreign Direct Investment and Carbon Emissions
The competing pollution-haven and pollution-halo predictions were introduced in Section 1.1, and the literature has increasingly resolved the tension through nonlinearity rather than by declaring one channel dominant. Threshold regression evidence shows that the environmental effects of trade openness and foreign investment depend on the level at which these flows occur, so that the same inflow can be emission-increasing in one range and emission-reducing in another [58]. Evidence for transition economies specifically finds that financial and institutional development condition the environmental consequences of foreign capital, which implies that absorptive capacity, not the inflow itself, determines the sign [59]. The methodological implication is direct and shapes the estimator chosen here: if the relationship can switch sign across periods or structural breaks, static specifications risk averaging away economically meaningful heterogeneity, and dynamic frameworks that separate long-run equilibrium from short-run adjustment are to be preferred.
2.2. The Azerbaijani Context
2.2.1. Energy Structure, Emissions Setting and Transition Path
The structural features of Azerbaijan’s electricity system were outlined in Section 1.1; what the specialist literature adds is confirmation of their persistence and an account of the policy response. Regional electricity-trade modelling confirms the continuity of thermal dominance and a modest hydropower share through the 2010s, and situates the national system within a wider Trans-Asian network in which cross-border exchange remains limited [60]. On the policy side, empirical evidence employing a theory-consistent framework and Autometrics finds that both renewable energy and total factor productivity reduce emissions, supporting the feasibility of a strategy combining supply-side substitution with efficiency gains [61]. Comparative energy-security research places the country within the Caspian exporter group, where export-revenue dependence and transition imperatives pull in opposite directions [62], and sectoral techno-economic assessment of ground-source heat-pump alternatives to conventional district heating illustrates that decarbonisation options extend well beyond the power sector [63]. The combination of a fossil-dominated grid and an active transition agenda is precisely the setting in which the relative contributions of scale, substitution, capital composition and external risk become empirically separable.
2.2.2. Empirical Evidence on Emission Drivers in Azerbaijan
National evidence remains fragmented across variables and methods. The rejection of the EKC hypothesis and the positive long-run growth elasticity reported for Azerbaijan, together with the mitigating role of the renewable share and green finance instruments, were noted in Section 1.1. Comparative evidence for emerging economies including Azerbaijan finds that growth and trade openness raise emissions while renewable consumption mitigates them [64], and national evidence incorporating consumer-price dynamics alongside renewable consumption confirms the mitigating role of the renewable share while highlighting the sensitivity of the emissions path to domestic price conditions [65]. Evidence on foreign direct investment is thinner but analytically significant: the structural shift dated to 2006, under which FDI moved from raising emissions to reducing them, implies that any Azerbaijani emissions model omitting structural discontinuities risks producing a coefficient that is an artefact of averaging across sub-periods. It is on this basis that a break-augmented specification is adopted in Section 3.
Two determinants remain effectively unexamined in the national literature. First, no country-specific study has estimated the effect of geopolitical risk on carbon emissions, despite Azerbaijan’s location in a region marked by recurrent strategic tension, its dependence on export corridors, and the international evidence reviewed in Section 2.1.1 showing that risk transmits to emissions through energy-trade and investment channels. Second, although hydropower is consistently identified as the principal established renewable asset, no retrieved study isolates hydropower generation as a distinct explanatory variable in an emissions function; existing work relies on aggregate renewable indicators, which conflate hydropower with solar, wind and other sources whose grid roles, dispatch characteristics and substitution patterns differ materially.
2.2.3. Research Gap and Positioning of the Present Study
Bringing the two strands together allows the gap to be stated precisely. The international literature establishes that geopolitical risk, economic activity, hydropower generation and foreign direct investment are each plausible emission determinants, that their effects are frequently nonlinear or period-dependent, and that they interact through energy-trade and investment channels. The Azerbaijani literature establishes that growth and trade raise emissions, that renewable energy and productivity reduce them, and that the FDI effect has changed sign over time. What no study has done is estimate these four determinants jointly within a single dynamic specification for Azerbaijan; nor has any study introduced geopolitical risk or a technology-specific hydropower variable into the country’s emissions function at all.
3. Data and Methodology
3.1. Data and Variable Definitions
The empirical analysis uses annual time-series data for Azerbaijan covering 1996–2024, yielding 29 observations per variable. The window begins in 1996 because consistent post-independence national accounts and energy statistics become available from that year, and it is long enough to encompass the structural transformations a small, resource-dependent economy has undergone over three decades—the post-Soviet stabilisation of the late 1990s, the oil-boom expansion of the mid-2000s, the global financial crisis, and the post-2015 diversification effort.
The dependent variable is the natural logarithm of carbon dioxide emissions (LN_CO2). The underlying series—total CO2 emissions excluding land use, land-use change and forestry (LULUCF), measured in million tonnes of CO2-equivalent—is drawn from the World Bank’s World Development Indicators database (see the note to Table 1). Excluding LULUCF is deliberate: land-use fluxes are estimated with considerably greater uncertainty than combustion-based emissions and would introduce measurement noise unrelated to the energy-economy mechanisms under investigation.
Table 1.
Variable definitions, units and sources.
Geopolitical uncertainty is proxied by the benchmark global Geopolitical Risk Index (series GPR) of Caldara and Iacoviello [63], downloaded from the authors’ website (matteoiacoviello.com/gpr.htm, accessed on 20 August 2026). The monthly index is aggregated to annual frequency as the sum of the twelve monthly values; using the annual mean instead would rescale the coefficient by a factor of 12 without affecting its significance or the standardised effects reported below. A country-specific index is not available for Azerbaijan, which is not among the countries covered by the country-level GPR series. The global index is nevertheless appropriate for a small open economy whose export revenues, transit corridors and inward investment are exposed to global and regional security conditions, and it has the further advantage of being plausibly exogenous to Azerbaijan’s emissions. The index enters in levels so that its coefficient can be read as a semi-elasticity; a log specification yields an elasticity of 0.238 (p = 0.017), implying that a one-standard-deviation increase in ln(GPR) is associated with emissions about 7.2% higher, close to the 8.1% implied by the baseline (Table A1).
Economic activity is proxied by the natural logarithm of gross domestic product measured in current U.S. dollars (LN_GDP; WDI code NY.GDP.MKTP.CD). For an oil-exporting economy characterized by a managed exchange-rate regime and recurrent currency devaluations, however, this measure captures more than changes in real economic activity. In particular, dollar-denominated GDP is jointly influenced by domestic price dynamics, exchange-rate adjustments—including the substantial manat devaluations in 2015—and fluctuations in international hydrocarbon prices. Accordingly, the associated coefficient should be interpreted as reflecting the relationship between emissions and the economy’s dollar-denominated economic scale, rather than as an elasticity with respect to real output. To examine the sensitivity of the empirical findings to this measurement choice, we re-estimate the baseline specification using real GDP measured in constant 2015 U.S. dollars (NY.GDP.MKTP.KD). The corresponding estimates are reported in Table A1.
To capture the role of the energy mix, the model incorporates the share of hydroelectric power in total electricity generation (HY_EN), taken from the World Bank’s indicator on electricity production from hydroelectric sources as a percentage of the total. Using a share rather than an absolute generation volume is the appropriate specification here, because what matters for emissions is not how much hydroelectricity is produced but how much thermal generation it displaces. HY_EN enters as a percentage without transformation.
The influence of foreign capital is captured by net FDI inflows as a percentage of GDP (FDI; WDI code BX.KLT.DINV.WD.GD.ZS). The ratio is preferred to a dollar-denominated measure for three reasons. First, net inflows were negative in 2021 and 2022, so a logarithmic dollar series is undefined for these years. Second, the technology-transfer and pollution-haven channels depend on the weight of foreign capital in the economy rather than on its absolute value, and the ratio measures this intensity consistently over a period in which nominal GDP grew more than twentyfold. Third, scaling by GDP is standard practice in the FDI–emissions literature, which facilitates comparison with earlier evidence. GDP is the only variable in the model expressed in dollar terms, since GPR is an index and the hydropower share, like FDI, is a ratio.
The functional relationship underlying the analysis is written as
and in estimable stochastic form as
where D2009 is a post-break dummy equal to one for 2010–2024 and zero otherwise, capturing the regime that follows the structural change in emissions dated to 2009. Because LN_CO2 and LN_GDP are logarithmic while GPR, HY_EN and FDI are in levels, β2 is an elasticity whereas β1, β3 and β4 are semi-elasticities and are interpreted accordingly throughout.
3.2. Graphical Inspection of the Series
Before formal estimation it is useful to inspect how each series has behaved over time. Visual screening flags long-run trends, sharp fluctuations, candidate structural breaks and nonlinear movement at an early stage, well before any test is applied. Figure 1 plots LN_CO2, GPR, LN_GDP, HY_EN and FDI over 1996–2024. Because the variables are measured in different units, each series is presented in its own panel rather than overlaid on a common scale. The trajectories differ markedly, with pronounced swings clustered around the late 1990s, the mid-2000s and the 2008–2010 window. These patterns motivate the break-augmented and nonlinear unit-root tests applied below.
Figure 1.
Time-series dynamics of LN_CO2, GPR, LN_GDP, HY_EN and FDI, 1996–2024.
3.3. Descriptive Statistics
Table 2 reports the standard descriptive statistics. Two features deserve emphasis for interpretation later. First, GPR has a mean of 1213.7 with a standard deviation of 384.3, so a one-standard-deviation movement in risk is a large shift in absolute index points and its economic significance must be assessed accordingly. Second, FDI is the only variable whose Jarque–Bera statistic rejects normality (p = 0.0012), reflecting pronounced positive skewness (1.463) and excess kurtosis (4.596) generated by the exceptional inflow episode associated with the construction phase of the major export pipelines. The remaining series are consistent with normality at conventional levels.
Table 2.
Statistical overview of data variables.
3.4. Econometric Strategy
3.4.1. Unit-Root Testing
The stationarity properties of the variables were assessed first with the Augmented Dickey–Fuller (ADF) test [68] and the Phillips–Perron (PP) test, which corrects nonparametrically for serial correlation and heteroskedasticity in the disturbance process [69]. Because conventional tests are biased toward non-rejection when the data-generating process contains a structural break, three complementary procedures were added. The Zivot–Andrews test allows a single break in intercept and trend whose date is determined endogenously rather than imposed by the researcher [70]. The Hepsağ test accommodates structural change that unfolds smoothly rather than abruptly, which is the more plausible characterisation of an economy adjusting gradually to a commodity cycle [71]. The Sollis test detects asymmetric mean reversion of the exponential smooth-transition type, under which adjustment toward equilibrium differs in speed between positive and negative deviations [72]. Applying the five tests jointly serves a specific purpose: it establishes with confidence that no series is integrated of order two, which is the single condition that would invalidate the bounds-testing framework.
3.4.2. The Augmented ARDL Bounds Test
The long-run relationship was examined using the augmented autoregressive distributed lag (A-ARDL) approach. The conditional error-correction representation is
The standard bounds-testing procedure of Pesaran, Shin and Smith [73] infers a level relationship from two statistics: an F-test on the joint significance of all lagged levels (H0: δ1 = δ2 = δ3 = δ4 = δ5 = 0) and a t-test on the lagged dependent variable alone (H0: δ1 = 0), with critical values that bracket the I(0) and I(1) cases so that the regressors need not be pre-classified [69]. Because the asymptotic critical values are poorly approximated in small samples, the F-overall statistic is evaluated against the small-sample critical values tabulated by Narayan for n = 30 [74].
These two statistics alone, however, cannot exclude a degenerate outcome in which the null is rejected even though no genuine long-run relationship links the dependent variable to the regressors—a case that arises specifically when the dependent variable is I(0). McNown, Sam and Goh demonstrated the problem and proposed a bootstrap remedy [75], and Sam, McNown and Goh formalised the augmented procedure adopted here, which adds a third statistic—an F-test on the joint significance of the lagged levels of the explanatory variables alone (H0: δ2 = δ3 = δ4 = δ5 = 0)—and requires all three to reject before cointegration is declared [76]. This third test is what distinguishes A-ARDL from the conventional bounds test, and it is the reason the augmented procedure was chosen here: as Section 4.1 shows, the ADF and Zivot–Andrews tests disagree about whether LN_CO2 is I(0) or I(1), which is exactly the ambiguity the augmented test is designed to survive.
As a cross-check on the cointegrating rank, the system-based maximum-likelihood procedure of Johansen was considered alongside the single-equation results [77], and response-surface approximations were used where exact finite-sample distributions were required [78]. The optimal lag order was selected by the Akaike information criterion [79], which is preferred to the Schwarz criterion in samples of this size because its comparatively lighter penalty reduces the risk of under-parameterisation and residual autocorrelation.
3.4.3. Error Correction, Diagnostics and Stability
Once cointegration was established, the long-run coefficients and the short-run adjustment mechanism were estimated from the corresponding error-correction model, in which the error-correction term ECTt − 1 measures the proportion of disequilibrium eliminated within one year and is expected to be negative, significant, and bounded between zero and minus one; this two-step long-run/short-run separation is standard in dynamic energy–environment applications [80]. Model adequacy was assessed through the Breusch–Godfrey LM test for serial correlation, the Breusch–Pagan–Godfrey test for heteroskedasticity, the Jarque–Bera test for residual normality and the Ramsey RESET test for functional-form misspecification. Parameter constancy was examined using the cumulative sum (CUSUM) and cumulative sum of squares (CUSUMSQ) statistics [81].
The ARDL framework identifies long-run level relationships and short-run dynamics but does not by itself resolve endogeneity, and the estimates should be interpreted as conditional associations rather than causal effects. The degree of concern differs across regressors. Reverse causality is implausible for the global GPR index, which is constructed from international newspaper coverage and is not influenced by Azerbaijan’s emissions. Year-to-year variation in the hydropower share is driven largely by hydrological conditions, which are exogenous to economic decisions. However, because the share is defined relative to total generation, it rises mechanically when thermal output falls for reasons unrelated to hydropower, so part of the estimated association may reflect changes in thermal generation rather than hydroelectric displacement alone. GDP and FDI may be jointly determined with emissions, and their coefficients are interpreted with corresponding caution.
4. Empirical Results
4.1. Unit-Root Test Results
Table 3 reports the ADF and PP results across three deterministic specifications. In levels the picture is mixed: GPR is stationary only marginally and only under the constant specification, FDI rejects the unit-root null under ADF but not under PP, and LN_CO2, LN_GDP and HY_EN behave as non-stationary processes under most specifications. After first differencing, every series rejects the unit-root null, in most cases at the 1% level. The mixture of I(0) and I(1) behaviour, coupled with the uniform absence of a second unit root, satisfies the necessary condition for bounds testing.
Table 3.
ADF and PP unit-root test results.
Because conventional tests lose power when a break is present, the Zivot–Andrews test was applied next (Table 4). The break dates it identifies are economically interpretable rather than arbitrary. The 2009 break in LN_CO2 coincides with the aftermath of the global financial crisis and the 2008–2009 oil-price collapse, and with the exceptionally high hydropower output of 2010; emissions reached their sample minimum in 2010 and followed a sustained upward path thereafter. Once these breaks are accommodated, LN_CO2 and FDI are stationary at level, while GPR, LN_GDP and HY_EN retain a unit root. The Zivot–Andrews test is applied in its Model C form, which allows for a simultaneous shift in the intercept and the trend; the break date is chosen by minimising the unit-root t-statistic over the central 70% of the sample (15% trimming), and the lag length is selected by [AIC] (zero lags for LN_CO2).
Table 4.
Zivot–Andrews structural-break unit-root test results.
This divergence is not a nuisance result to be reconciled away; it is the substantive justification for the estimator adopted below. When a series is I(1) under ADF but I(0) once an endogenous break is admitted, the order of integration of the dependent variable is genuinely ambiguous, and the standard F-bounds test can no longer be relied upon to distinguish a true level relationship from a degenerate one.
To allow for structural change that unfolds gradually rather than as a single discrete shift, the Hepsağ test was applied as a further check (Table 5). The transition locations it recovers—expressed as a fraction of the sample and converted to approximate calendar years—cluster in the middle of the sample for all five series, broadly corroborating the Zivot–Andrews dating while suggesting that the adjustment was smooth rather than instantaneous.
Table 5.
Hepsağ nonlinear smooth structural-break unit-root test results.
Finally, the Sollis test was used to detect asymmetric, nonlinear mean reversion (Table 6). It identifies nonlinear stationarity in GPR and FDI—the two series whose dynamics are driven by discrete external events rather than by gradual domestic accumulation—while LN_CO2, LN_GDP and HY_EN continue to behave as unit-root processes.
Table 6.
Sollis nonlinear unit-root test results.
Taken as a whole, the five tests deliver a consistent verdict on the one question that matters for the estimator: none of the variables is integrated of order two. The series instead represent a mixture of I(0) and I(1) processes whose classification is sensitive to the treatment of structural change—the configuration for which the A-ARDL procedure is specifically designed.
4.2. A-ARDL Cointegration Results
Allowing a maximum of two lags, 162 candidate specifications were estimated and ARDL(1,2,2,2,0) was selected by the Akaike information criterion. The D2009 dummy identified in Section 4.1 was retained in the conditional model. After allowing for two lags, the effective estimation sample covers 1998–2024 (n = 27). The selected model contains 13 estimated parameters (including the intercept and the break dummy), leaving 14 residual degrees of freedom. Because this ratio is modest, we verified that the lag structure is not an artefact of the information criterion: the Schwarz (Bayesian) information criterion, which penalises additional parameters more heavily, selects the same ARDL(1,2,2,2,0) specification from the 162 candidates.
Because the break date estimated by unit-root tests is subject to sampling uncertainty of at least one period, the onset of the post-break regime in the ARDL model was examined over the window 2008–2011. A dummy beginning in 2010 yields the best fit (AIC = −3.525, compared with −3.177 for a dummy beginning in 2009), which is consistent with 2009–2010 being a transition period in which emissions fell to their sample minimum. The geopolitical-risk and hydropower coefficients are insensitive to this choice (Table A1).
The F-overall statistic equals 5.4210. Compared against the Narayan small-sample critical values for n = 30, k = 4 and Case III (unrestricted intercept, no trend), where the 5% bounds are 3.354 and 4.774, the statistic exceeds the upper bound and the null of no long-run relationship is rejected. The t-dependent statistic equals −4.6869; against the Case III t-bounds of −3.43 and −4.60 at the 1% level, it is more negative than the I(1) bound, so the null concerning the lagged level of the dependent variable is also rejected. The decisive test is the third. The F-independent statistic equals 6.3492 and is compared with the Case III critical values of Sam, McNown and Goh, whose 5% bounds are 2.80 and 4.70; the computed value exceeds the upper bound, rejecting the joint insignificance of the lagged levels of the explanatory variables. Since all three statistics reject, the possibility of a degenerate outcome is excluded and a genuine cointegrating relationship among the five variables is confirmed (Table 7).
Table 7.
A-ARDL cointegration test results.
4.3. Long-Run and Short-Run Estimates
4.3.1. Long-Run Coefficients
Table 8 reports the long-run estimates. Because LN_CO2 is logarithmic while GPR, HY_EN and FDI enter in levels, each coefficient is a semi-elasticity and is read as the percentage change in emissions associated with a one-unit change in the regressor.
Table 8.
Long-run coefficients.
Geopolitical risk carries a positive coefficient significant at the 1% level. A one-point rise in the GPR index raises long-run CO2 emissions by approximately 0.020%. Because a single index point is a small movement, the economically meaningful comparison is a one-standard-deviation increase of 384 points, which corresponds to an increase in emissions of roughly 8.1%. Sustained geopolitical tension is therefore not a marginal disturbance to Azerbaijan’s emissions path but a first-order determinant of it.
The hydropower share carries a negative coefficient significant at the 1% level and is the strongest effect in the system. A one-percentage-point increase in the share of hydroelectricity in total generation lowers long-run emissions by approximately 2.8%; a one-standard-deviation increase of 3.2 percentage points implies a reduction of roughly 8.6%. Given that hydropower supplies only about 6% of generation, the estimate indicates that the marginal displacement of gas-fired output is highly emission-productive in a grid where the marginal thermal unit is the alternative.
Foreign direct investment enters with a negative coefficient significant at the 10% level. A one-percentage-point increase in the FDI-to-GDP ratio is associated with an approximately 0.28% reduction in long-run emissions; scaled by its standard deviation of 15.2 percentage points, the implied effect is about −4.2%. The sign is consistent with the technology-transfer interpretation and with the post-2006 configuration documented for Azerbaijan in Section 2.2.2, though the 10% significance level counsels interpretive caution.
The coefficient on LN_GDP is negative but statistically indistinguishable from zero (p = 0.9173). The specification therefore provides no evidence of a direct long-run effect of aggregate output on emissions once risk, energy mix, capital inflows and the 2009 break are jointly controlled for.
Table A1 reports the long-run coefficients under alternative lag structures, functional forms and deterministic specifications. The negative association between the hydropower share and emissions is significant in every specification. The positive geopolitical-risk coefficient is stable in magnitude (0.00015–0.00030) and significant in all specifications that retain its second lag, but loses significance when the lag order is restricted to one, consistent with the delayed transmission documented in Section 4.3.2. The FDI coefficient is consistently negative but significant only in the baseline and one alternative specification, and the output coefficient is insignificant in all specifications that include the break dummy. These results support the robustness of the GPR and hydropower findings and confirm that the FDI result should be read as indicative.
4.3.2. Short-Run Dynamics and Error Correction
Table 9 reports the error-correction estimates. The ECT(−1) coefficient equals −0.8962 and is significant at the 1% level. Its negative sign and magnitude below unity confirm convergence: approximately 89.6% of any deviation from long-run equilibrium is eliminated within the following year, implying an adjustment half-life of well under twelve months. Such rapid correction is plausible for an economy whose emissions are generated overwhelmingly by a single, centrally dispatched thermal fleet, where the physical adjustment margin is fuel throughput rather than capital stock.
Table 9.
Short-run (error-correction) estimates.
Three features of the short-run dynamics deserve comment. First, the sign of the geopolitical-risk effect reverses at short horizons: the contemporaneous change is insignificant, while the one-period lag is negative and significant at the 1% level. An escalation in risk therefore depresses emissions in the year that follows—the demand-contraction channel, operating through deferred investment, weaker industrial activity and reduced energy throughput—before the delayed-transition channel asserts itself and turns the long-run effect positive. Second, economic activity behaves in the opposite manner: the contemporaneous change is insignificant but its lag is positive and significant at the 5% level, so output growth raises emissions with a one-year delay, consistent with the lag between capacity utilisation and realised fuel consumption. Third, the hydropower share exerts a strong negative contemporaneous effect, partially reversed by a positive coefficient on its lag; the pattern is characteristic of hydrological mean reversion, in which an exceptionally wet year displaces thermal generation immediately and is followed by partial recovery of thermal output in the subsequent year. The D2009 dummy is positive and significant at the 1% level, confirming that the post-crisis structural shift is an essential component of the short-run specification.
4.4. Diagnostic and Stability Tests
Table 10 reports the residual diagnostics. The Breusch–Godfrey LM test finds no serial correlation up to the second lag; the Breusch–Pagan–Godfrey test does not reject homoskedasticity; the Jarque–Bera statistic does not reject residual normality; and the Ramsey RESET test finds no evidence of functional-form misspecification. On all four criteria the model is well specified.
Table 10.
Residual diagnostic tests.
Parameter constancy was assessed with the CUSUM and CUSUMSQ statistics, plotted in Figure 2. Both remain inside the 5% critical bounds across the whole sample, indicating that the estimated coefficients are stable over time and that the inclusion of D2009 has adequately absorbed the structural discontinuity identified in Section 4.1. Taken together with the residual diagnostics, the stability evidence supports the econometric reliability of the estimated A-ARDL model.
Figure 2.
CUSUM and CUSUMSQ parameter-stability tests.
4.5. Hypothesis Assessment
The estimates permit a direct verdict on the four hypotheses. H1 is supported: geopolitical risk raises long-run emissions significantly, and the short-run reversal identified in Section 4.3.2 refines rather than contradicts the hypothesis by revealing the competing channels behind the net effect. H2 is partially supported: economic activity raises emissions with a one-year lag in the short run, as anticipated, but exerts no significant long-run effect, indicating that the income channel is absorbed by the energy-mix and structural-break terms once these are modelled explicitly. H3 is supported, and emphatically so: hydropower carries the largest and most precisely estimated mitigating coefficient in the system. H4 receives weak support: the average long-run FDI coefficient is negative and significant at the 10% level in the baseline model, but it is not robust across alternative specifications (Table A1). A split-sample test does not reject equality of the pre- and post-2006 FDI coefficients (p = 0.98), although with only eight pre-2006 observations in the estimation sample the test has limited power. The results therefore do not allow us to determine whether the FDI–emissions relationship changed after 2006.
5. Discussion
5.1. Geopolitical Risk as an Environmental Cost
The central result of this study is that geopolitical risk raises Azerbaijan’s carbon emissions in the long run while depressing them temporarily in the short run. This two-sided pattern is more informative than either effect taken alone, and it helps explain why the international literature has struggled to agree on a sign. Studies reporting an emission-increasing effect and studies reporting an emission-reducing one may both be correct, but at different horizons. Evidence for emerging economies finds that policy uncertainty and geopolitical risk together degrade environmental quality [82], and the United Kingdom evidence shows that economic policy uncertainty suppresses energy consumption and emissions in the near term precisely because it postpones activity [83]. The Azerbaijani estimates reconcile these positions: the negative one-year lag reflects contraction, and the positive long-run coefficient reflects what contraction leaves behind—a transition postponed.
The mechanism deserves to be stated plainly, because it carries a policy implication that a purely statistical reading would miss. Low-carbon capacity in a small, import-dependent economy is embodied in equipment that must be financed, procured and installed under multi-year contracts. Elevated regional tension raises the risk premium on exactly those contracts, while the thermal alternative requires no new commitment at all, since the capital is already in place and the fuel is domestic. Risk therefore does not raise emissions by increasing energy demand; it raises them by making the carbon-intensive option the path of least resistance. United States evidence pointing the same way finds that geopolitical risk retards renewable deployment rather than stimulating fossil consumption [84], and sectoral evidence from the American power system shows that the emission-reducing capacity of clean energy is itself contingent on critical-mineral prices and geopolitical conditions. That the same asymmetry appears in a hydrocarbon exporter as in a large net importer suggests the channel operates through the technology supply chain rather than through the trade balance.
The comparison with Türkiye is especially instructive, since Saadaoui and colleagues [21] estimate a closely analogous specification—hydroelectricity, financial development, geopolitical risk, income and FDI—for a neighbouring economy in the same risk environment. Their finding that geopolitical risk adds to environmental pressure while hydroelectricity relieves it is reproduced here in direction, but the Azerbaijani magnitudes are larger relative to the size of the energy system. The most plausible explanation is structural: Türkiye’s generation mix is considerably more diversified, so the marginal unit displaced by an additional unit of hydroelectricity is not always thermal, whereas in Azerbaijan it almost always is. Grid composition, in other words, conditions the size of the coefficient, which is an argument for country-level rather than pooled estimation of these relationships.
5.2. The Hydropower Coefficient and the Non-Result on Output
That hydropower is the most powerful mitigating variable in the system, despite supplying only about 6% of generation, is at first sight surprising. The explanation lies in the counterfactual. In a grid where roughly 93% of electricity is produced from natural gas, every additional percentage point of hydroelectric share displaces gas-fired output almost one-for-one, so the emission saving per unit is close to its theoretical maximum. This is why aggregate renewable indicators can understate the mitigation available from a specific technology: they average across sources whose dispatch characteristics and displacement patterns differ. Daily-frequency evidence from high-emitting countries makes the same point using kernel-regularised least squares, showing that the marginal emission impact varies substantially by generation source, and the disaggregated European evidence reaches a parallel conclusion. Prior Azerbaijani work using aggregate renewable shares was therefore correct in sign but could not identify where within the renewable portfolio the mitigation was concentrated.
The insignificant long-run coefficient on output requires careful interpretation, because it appears to contradict the well-established positive elasticity reported for Azerbaijan by Mikayilov and colleagues [19]. Fourth, the output measures differ: the earlier study uses real output, whereas the baseline specification here uses nominal dollar GDP, whose post-2014 contraction reflects currency devaluation rather than a fall in physical activity. Second, the 2009 break captures a discrete upward shift in the conditional level of emissions after 2009, during a period in which dollar-denominated GDP stagnated and then contracted with the 2015 devaluations while emissions continued to rise. A specification without the break would load this divergence onto the income term; indeed, when the dummy is omitted, the output coefficient becomes positive and significant (0.043, p = 0.036; Table A1). Third, and most substantively, the short-run results show that output does raise emissions with a one-year lag; what the long-run non-result indicates is not the absence of a scale effect but its absorption into the structural composition of the energy system. Comparable evidence that renewable electricity and natural-resource endowments jointly mediate the growth–emissions relationship supports this reading [85], as does the broader finding that decoupling, where it appears, is a compositional rather than an income phenomenon. The result should therefore be reported as evidence that Azerbaijan’s emissions trajectory is governed more by what generates its electricity than by how fast its economy grows—a conclusion with more optimistic policy content than a large positive elasticity would carry.
5.3. Foreign Direct Investment and the Post-2006 Configuration
The negative and marginally significant FDI coefficient supports the technology-transfer reading over the pollution-haven one, and it extends the structural shift documented for Azerbaijan by Mukhtarov and colleagues [15], who date the reversal to 2006. The Turkish comparison is again useful: Saadaoui and colleagues report a different FDI sign for Türkiye, and the divergence is best explained by composition rather than by contradiction. Azerbaijani inflows after the completion of the pipeline construction cycle shifted away from extraction toward services, telecommunications and, more recently, renewable generation, whereas Turkish inflows remained more heavily weighted toward manufacturing. Evidence from France showing that FDI reduces emissions where it is accompanied by energy innovation and financial development is consistent with this interpretation [86], and Azerbaijani evidence on the financial development–renewable energy nexus indicates that the domestic financial channel through which such capital is intermediated has itself been strengthening [87]. The weaker significance of the coefficient, however, is a genuine limitation: FDI is the most volatile series in the sample, with the only rejection of normality in Table 2, and a single extreme inflow episode inflates its variance. The result is best read as directional evidence rather than as a precise elasticity.
6. Conclusions
This study estimated the effects of geopolitical risk, economic activity, hydropower generation and foreign direct investment on carbon dioxide emissions in Azerbaijan over 1996–2024 using the augmented ARDL bounds-testing procedure. Five unit-root tests established that no series is I(2) while disagreeing about the order of integration of emissions once a structural break in 2009 is admitted—the precise ambiguity for which the augmented procedure was designed. All three A-ARDL statistics confirmed cointegration. In the long run, geopolitical risk raises emissions, the hydropower share reduces them substantially, foreign direct investment reduces them modestly, and aggregate output has no significant direct effect. In the short run the signs on risk and output reverse and lag respectively, and roughly nine-tenths of any disequilibrium is corrected within a year.
The policy implications should be interpreted as evidence-consistent directions rather than causal or quantified predictions, given the associational nature of the estimates and the potential endogeneity and omitted-variable interactions among emissions, output, FDI, and the electricity mix. Three policy implications follow. First, because the marginal emission saving from hydroelectric displacement is large in a gas-dominated grid, capacity additions in low-carbon generation should be evaluated against the thermal unit they actually displace rather than against an average grid factor; the same investment yields a larger carbon return in Azerbaijan than the country’s modest renewable share would suggest. Second, geopolitical risk should be treated as a climate-policy variable and not merely as a macroeconomic one. If elevated risk raises emissions primarily by deferring low-carbon capital formation, then instruments that insulate transition investment from risk premia—long-tenor concessional finance, sovereign guarantees, procurement contracts with price certainty, and diversification of technology supply chains—are climate instruments in substance even when they are not labelled as such. Third, because the long-run income coefficient is statistically indistinguishable from zero while the energy-mix coefficient is large and precise, decarbonisation in Azerbaijan need not be framed as a constraint on growth; the effective margin is compositional.
Several limitations qualify these conclusions and mark out the research agenda. The sample of 29 annual observations, though adequate for bounds testing, restricts the number of regressors that can be entered and precludes reliable estimation of interaction terms; higher-frequency or sector-disaggregated data would allow the risk–transition channel to be identified directly rather than inferred from the sign reversal between horizons. The linear specification does not test for asymmetry in the geopolitical-risk effect, which the short-run and long-run divergence suggests may be present; a nonlinear ARDL treatment separating positive from negative risk shocks would be a natural extension. The hydropower coefficient captures the association between emissions and electricity-supply composition rather than the causal effect of additional hydropower capacity, so recommendations to expand non-thermal generation should be interpreted in light of its potential displacement effect. The negative FDI coefficient is statistically weak and not robust across specifications, meaning that its consistency with technology transfer should be viewed as suggestive rather than conclusive, with cleaner FDI policies warranting further firm-level investigation.
Finally, the global index is constructed from international newspaper coverage, it may not fully capture regional episodes of particular relevance to Azerbaijan. The analysis treats geopolitical risk as exogenous to Azerbaijan, which is defensible for a small economy facing a globally constructed index but would not hold in a regional specification where the country’s own energy-transit role influences the risk environment. Future research could extend this analysis by employing nonlinear and higher-frequency approaches to capture asymmetric geopolitical shocks, sector-specific transmission channels, and heterogeneous FDI effects, while comparative panel evidence from Caspian and other hydrocarbon-exporting economies could further assess the generalisability and endogeneity of the findings.
Author Contributions
Conceptualization, G.G. and R.H.; methodology, G.G.; software, G.G.; validation, A.E., E.J., F.A. and I.O.; formal analysis, R.H.; investigation, G.G. and R.H.; resources, G.G.; data curation, G.G. and R.H.; writing—original draft preparation, G.G. and R.H.; writing—review and editing, A.E., E.J., F.A. and I.O.; visualization, G.G. and R.H.; supervision, A.E., E.J., F.A. and I.O.; project administration, G.G. and R.H.; funding acquisition, A.E., E.J., F.A. and I.O. All authors have read and agreed to the published version of the manuscript.
Funding
This research received no external funding.
Data Availability Statement
The data used in this study are publicly available from the sources cited in the article and can be accessed upon reasonable request from the corresponding author.
Conflicts of Interest
The author declares no conflict of interest.
Appendix A
According to the Table A1, the negative long-run association between the hydropower share and CO2 emissions is statistically significant and of similar magnitude across all ten specifications. The positive geopolitical-risk coefficient remains stable in size and significant whenever its second lag is retained, which confirms the robustness of the two central findings. By contrast, the FDI coefficient is consistently negative but significant in only two specifications, and the output coefficient is insignificant in every specification that controls for the structural break, so these two results should be regarded as indicative rather than conclusive.
Table A1.
Robustness of the long-run coefficients to alternative lag structures, functional forms and deterministic specifications (dependent variable: LN_CO2; effective sample 1998–2024, n = 27).
References
- International Energy Agency. Global Energy Review 2026; IEA: Singapore, 2026; Available online: https://www.iea.org/reports/global-energy-review-2026 (accessed on 15 August 2026).
- Ember. Global Electricity Review 2026; Ember: London, UK, 2026; Available online: https://ember-energy.org/latest-insights/global-electricity-review-2026/ (accessed on 26 August 2026).
- European Commission. EU and Azerbaijan Enhance Bilateral Relations, Including Energy Cooperation; Press release IP/22/4550; European Commission: Brussels, Belgium, 2022; Available online: https://enlargement.ec.europa.eu/news/eu-and-azerbaijan-enhance-bilateral-relations-including-energy-cooperation-2022-07-18_en (accessed on 27 July 2026).
- Republic of Azerbaijan. Azerbaijan’s Nationally Determined Contribution 3.0; United Nations Framework Convention on Climate Change: New York, NY, USA, 2025; Available online: https://unfccc.int/sites/default/files/2025-11/NDC%203.0%20Report_Azerbaijan.pdf (accessed on 10 July 2026).
- Saidi, S.; Hammami, H. An econometric study of the impact of economic growth and energy use on carbon emissions: Panel data evidence from fifty eight countries. Renew. Sustain. Energy Rev. 2016, 59, 1101–1110. [Google Scholar] [CrossRef] [Scilit]
- Burke, P.J.; Shahiduzzaman, M.; Stern, D.I. Carbon dioxide emissions in the short run: The rate and sources of economic growth matter. Glob. Environ. Change 2015, 33, 109–121. [Google Scholar] [CrossRef] [Scilit]
- Sikder, M.; Wang, C.; Yao, X.; Dou, X. The integrated impact of GDP growth, industrialization, energy use, and urbanization on CO2 emissions in developing countries: Evidence from the panel ARDL approach. Sci. Total Environ. 2022, 837, 155795. [Google Scholar] [CrossRef] [Scilit]
- Guliyev, H.; Seyfullayev, I. Is the environmental Kuznets curve hypothesis valid for all countries? Fresh insights from bias-corrected dynamic panel data models. J. Environ. Manag. 2025, 393, 126960. [Google Scholar] [CrossRef] [Scilit]
- Wiedenhofer, D.; Virág, D.; Kalt, G.; Haberl, H. A systematic review of the evidence on decoupling of GDP, resource use and GHG emissions, part I: Bibliometric and conceptual mapping. Environ. Res. Lett. 2020, 15, 063002. [Google Scholar] [CrossRef] [Scilit]
- Pata, U.K.; Alola, A.A.; Erdogan, S.; Kartal, M.T. The influence of income, economic policy uncertainty, geopolitical risk, and urbanization on renewable energy investments in G7 countries. Energy Econ. 2023, 128, 107172. [Google Scholar] [CrossRef] [Scilit]
- Paramati, S.R.; Safiullah, M.; Soytas, U. Does geopolitical risk increase carbon emissions and public health risk? Energy Econ. 2025, 146, 108235. [Google Scholar] [CrossRef] [Scilit]
- Feng, Y.; Sabir, S.A.; Quddus, A.; Abbas, S. Do the grey clouds of geopolitical risk and political globalization exacerbate environmental degradation? Evidence from resource-rich countries. Resour. Policy 2024, 89, 104533. [Google Scholar] [CrossRef] [Scilit]
- Zhao, W.; Zhong, R.; Sohail, S.; Ullah, S. Geopolitical risks, energy consumption, and CO2 emissions in BRICS: An asymmetric analysis. Environ. Sci. Pollut. Res. 2021, 28, 39668–39679. [Google Scholar] [CrossRef] [Scilit]
- Rasoulinezhad, E.; Taghizadeh-Hesary, F.; Sung, J.; Panthamit, N. Geopolitical risk and energy transition in Russia: Evidence from ARDL bounds testing method. Sustainability 2020, 12, 2689. [Google Scholar] [CrossRef] [Scilit]
- Bello, M.O.; Solarin, S.A.; Yuen, Y.Y. Interfuel substitution, hydroelectricity consumption and CO2 emissions mitigation in Malaysia: Evidence from a transcendental logarithm (trans-log) cost function framework. Environ. Sci. Pollut. Res. 2020, 27, 18908–18922. [Google Scholar] [CrossRef] [Scilit]
- Li, M.; He, N. Carbon intensity of global existing and future hydropower reservoirs. Renew. Sustain. Energy Rev. 2022, 162, 112433. [Google Scholar] [CrossRef] [Scilit]
- Seker, F.; Ertuğrul, H.M.; Çetin, M. The impact of foreign direct investment on environmental quality: A bounds testing and causality analysis for Turkey. Renew. Sustain. Energy Rev. 2015, 52, 347–356. [Google Scholar] [CrossRef] [Scilit]
- Zhao, J. Exploring the nonlinear dynamic relationship between foreign direct investment, renewable energy consumption, economic growth, and carbon emissions: A panel threshold VAR analysis approach. SAGE Open 2025, 15, 21582440251. [Google Scholar] [CrossRef] [Scilit]
- Mukhtarov, S.; Aliyev, S.; Mikayilov, J.I.; Rzayev, A. The FDI–CO2 nexus from the sustainable development perspective: The case of Azerbaijan. Int. J. Sustain. Dev. World Ecol. 2021, 28, 246–254. [Google Scholar] [CrossRef] [Scilit]
- Maharramli, S.; Nasirov, S.; Budría, S. Electricity tariff reforms and household price elasticity in Azerbaijan: Key policy implications. Energy Policy 2026, 198, 115337. [Google Scholar] [CrossRef] [Scilit]
- Ciarreta, A.; Nasirov, S. Development trends in the Azerbaijan oil and gas sector: Achievements and challenges. Energy Policy 2012, 40, 431–439. [Google Scholar] [CrossRef] [Scilit]
- Felver, T.B. How can Azerbaijan meet its Paris Agreement commitments: Assessing the effectiveness of climate change-related energy policy options using LEAP modeling. Heliyon 2020, 6, e04697. [Google Scholar] [CrossRef] [Scilit]
- Mikayilov, J.I.; Galeotti, M.; Hasanov, F.J. The impact of economic growth on CO2 emissions in Azerbaijan. J. Clean. Prod. 2018, 197, 1558–1572. [Google Scholar] [CrossRef] [Scilit]
- Musayev, A.; Orjonikidze, T.; Mehdiyev, V. Green finance and environmental sustainability: An empirical evaluation of financial instruments in the Azerbaijani economy. J. Appl. Econ. Sci. 2026, 21, 55–72. [Google Scholar] [CrossRef] [Scilit]
- Saadaoui, H.; Dogan, M.; Omri, E. The impacts of hydroelectricity generation, financial development, geopolitical risk, income, and foreign direct investment on carbon emissions in Turkey. Environ. Econ. Policy Stud. 2024, 26, 239–261. [Google Scholar] [CrossRef] [Scilit]
- Kartal, M.T.; Taşkın, D.; Kılıç Depren, S.; Sarioglu, M. Analysis of disaggregated level energy use, income, geopolitical risk, energy transition, and energy price impact on decarbonization of main sectors in BRICS countries by marginal analysis. Energy Environ. 2026, 37, 4530–4563. [Google Scholar] [CrossRef] [Scilit]
- Li, H.; Sibt-e-Ali, M.S.E.; Ayub, B.; Ullah, I. Analysing the impact of geopolitical risk and economic policy uncertainty on the environmental sustainability: Evidence from BRICS countries. Environ. Sci. Pollut. Res. 2024, 31, 46148–46162. [Google Scholar] [CrossRef] [Scilit]
- Xin, C.; Khan, I.; Hassan, H.; Zafar, M.W. Is geopolitical risk truly harmful to sustainable development? The role of the clean energy transition. Sustain. Dev. 2026. Early View. [Google Scholar] [CrossRef] [Scilit]
- Kartal, M.T.; Pata, U.K.; Depren, Ö.; Ayhan, F. Effect of green bond, credit default swap, and geopolitical risk on environmental degradation: Sectoral evidence from China. Soc. Sci. Humanit. Open 2026, 14, 103230. [Google Scholar] [CrossRef] [Scilit]
- Kartal, M.T.; Mukhtarov, S.; Taşkın, D.; Kılıç Depren, S.; Ayhan, F.; Gafarli, G. Relationship between clean energy utilization and CO2 emissions under impact of critical mineral prices and geopolitical risk: Evidence from the USA’s power sector. Energy Convers. Manag. X 2026, 29, 102096. [Google Scholar] [CrossRef] [Scilit]
- Tabash, M.I.; Farooq, U.; Al-Faryan, M.A.S.; Wong, W.-K. Effect of geopolitical risk on energy consumption policy: New empirical evidence from BRICS. Heliyon 2024, 10, e38049. [Google Scholar] [CrossRef] [Scilit]
- Zehri, C.; Alsadan, A.; Saleh Ben Ammar, L. Asymmetric impacts of geopolitical risks on energy trade: Divergent vulnerabilities in emerging vs. advanced economies. J. Econ. Asymmetries 2025, 32, e00427. [Google Scholar] [CrossRef] [Scilit]
- Liu, L.; Gozgor, G.; Mahalik, M.K.; Pal, S. The impact of the US–China tensions on FDI dynamics in emerging economies. Financ. Res. Lett. 2025, 82, 107255. [Google Scholar] [CrossRef] [Scilit]
- Lin, K.; Ghosh, S.; Abbas, S.; Doğan, B. Heterogenous impact of energy security and environmental regulations on energy transition: Exploring the disparity between high-income and middle-income countries. Renew. Energy 2024, 237, 121610. [Google Scholar] [CrossRef] [Scilit]
- Mujtaba, A.; Jena, P.K.; Mukhopadhyay, D. Determinants of CO2 emissions in upper middle-income group countries: An empirical investigation. Environ. Sci. Pollut. Res. 2020, 27, 37745–37759. [Google Scholar] [CrossRef] [Scilit]
- Sime, M.B.; Lahmiri, S. The effect of macroeconomic factors on carbon emissions in the USA: A statistical analysis by industry sector. Sustainability 2026, 18, 4745. [Google Scholar] [CrossRef] [Scilit]
- Ray, S.; Aditya, I.; Pal, M.K. The influence of energy consumption, economic growth, industrialisation and corruption on carbon dioxide emissions: Evidence from selected Asian economies. In The Impact of Environmental Emissions and Aggregate Economic Activity on Industry; Emerald: Bingley, UK, 2023; pp. 113–130. [Google Scholar] [CrossRef] [Scilit]
- Gachayev, S.; Liu, B.; Hasanov, R.I.; Gligorić, D.; Rajković, S.; Dmitrović, V.; Mikerević, D. How China’s global trade expansion shapes transport-sector CO2 emissions: An export-driven analytical perspective. Sustainability 2026, 18, 2192. [Google Scholar] [CrossRef] [Scilit]
- Liobikienė, G.; Butkus, M. Scale, composition, and technique effects through which the economic growth, foreign direct investment, urbanization, and trade affect greenhouse gas emissions. Renew. Energy 2019, 132, 1310–1322. [Google Scholar] [CrossRef] [Scilit]
- Liu, Z.; Mao, X.; Song, P. GHGs and air pollutants embodied in China’s international trade: Temporal and spatial index decomposition analysis. PLoS ONE 2017, 12, e0176089. [Google Scholar] [CrossRef] [Scilit]
- Wu, J.; Xu, H.; Tang, K. Industrial agglomeration, CO2 emissions and regional development programs: A decomposition analysis based on 286 Chinese cities. Energy 2021, 225, 120239. [Google Scholar] [CrossRef] [Scilit]
- Wang, Y.; Zhang, C.; Lu, A.; Zhu, X. A disaggregated analysis of the environmental Kuznets curve for industrial CO2 emissions in China. Appl. Energy 2017, 190, 172–180. [Google Scholar] [CrossRef] [Scilit]
- Liu, J.; Li, Z.; Dong, C.; Sriboonchitta, S. The impact of economic growth, energy consumption and trade openness on carbon emissions: An empirical analysis in China. In Integrated Uncertainty in Knowledge Modelling and Decision Making; Lecture Notes in Computer Science; Springer: Cham, Switzerland, 2019; pp. 241–252. [Google Scholar] [CrossRef] [Scilit]
- Ahmad, A.; Zhao, Y.; Shahbaz, M.; Liu, Y. Carbon emissions, energy consumption and economic growth: An aggregate and disaggregate analysis of the Indian economy. Energy Policy 2016, 96, 131–143. [Google Scholar] [CrossRef] [Scilit]
- Jalil, A.; Mahmud, S.F. Environment Kuznets curve for CO2 emissions: A cointegration analysis for China. Energy Policy 2009, 37, 5167–5172. [Google Scholar] [CrossRef] [Scilit]
- Gessesse, A.T.; He, G. Analysis of carbon dioxide emissions, energy consumption, and economic growth in China. Agric. Econ. 2020, 66, 183–192. [Google Scholar] [CrossRef] [Scilit]
- Németh-Durkó, E. Economic growth and carbon emissions: Investigating the environmental Kuznets curve hypothesis. Stat. Szle. 2020, 98, 1366–1388. [Google Scholar] [CrossRef] [Scilit]
- Wang, X.; Bilal, R.; Ur Rehman, J.U. Economic development and carbon emissions across world regions: Exploring heterogeneous drivers. J. Environ. Manag. 2025, 395, 128048. [Google Scholar] [CrossRef] [Scilit]
- Idroes, G.M.; Hafizah, I.; Hartono, D.; Idroes, R. Investigating hydropower energy consumption’s effect on Southeast Asia’s path to achieving environmental sustainability and carbon neutrality. Carbon Res. 2025, 4, 61. [Google Scholar] [CrossRef] [Scilit]
- Sinaga, O.; Alaeddin, O.; Jabarullah, N.H. The impact of hydropower energy on the environmental Kuznets curve in Malaysia. Int. J. Energy Econ. Policy 2019, 9, 308–315. [Google Scholar] [CrossRef] [Scilit]
- Xiaosan, Z.; Qingquan, J.; Khattak, S.I.; Rahman, R. Achieving sustainability and energy efficiency goals: Assessing the impact of hydroelectric and renewable electricity generation on carbon dioxide emission in China. Energy Policy 2021, 155, 112332. [Google Scholar] [CrossRef] [Scilit]
- Hsu, T.-K.; Yeh, Y.-S.; Granmo, A. Using quantile mediation analysis to explore relationships among hydropower energy consumption, economic growth, and carbon dioxide emissions in Taiwan. Processes 2023, 11, 621. [Google Scholar] [CrossRef] [Scilit]
- Kartal, M.T.; Pata, U.K.; Alola, A.A. Renewable electricity generation and carbon emissions in leading European countries: Daily-based disaggregate evidence by nonlinear approaches. Energy Strategy Rev. 2024, 56, 101300. [Google Scholar] [CrossRef] [Scilit]
- Kartal, M.T.; Gafarli, G.; Depren, Ö.; Ayhan, F. Investigation of the marginal impact of electricity generation sources on CO2 emissions in highly emitting countries by daily data and KRLS approach. Sci. Rep. 2026, 16, 1–18. [Google Scholar] [CrossRef] [Scilit]
- Hertwich, E.G. Addressing biogenic greenhouse gas emissions from hydropower in LCA. Environ. Sci. Technol. 2013, 47, 9604–9611. [Google Scholar] [CrossRef] [Scilit]
- Turconi, R.; Boldrin, A.; Astrup, T. Life cycle assessment (LCA) of electricity generation technologies: Overview, comparability and limitations. Renew. Sustain. Energy Rev. 2013, 28, 555–565. [Google Scholar] [CrossRef] [Scilit]
- Amos, A.T.; Mensah, C. Hydropower and the era of climate change and carbon financing: The case from sub-Saharan Africa. In Sustainable Hydropower in West Africa: Planning, Operation, and Challenges; Elsevier: Amsterdam, The Netherlands, 2018; pp. 27–38. [Google Scholar] [CrossRef] [Scilit]
- Derindag, O.F.; Maydybura, A.; Kalra, A.; Chang, B.H. Carbon emissions and the rising effect of trade openness and foreign direct investment: Evidence from a threshold regression model. Heliyon 2023, 9, e17448. [Google Scholar] [CrossRef] [Scilit]
- Tamazian, A.; Rao, B.B. Do economic, financial and institutional developments matter for environmental degradation? Evidence from transitional economies. Energy Econ. 2010, 32, 137–145. [Google Scholar] [CrossRef] [Scilit]
- Purvins, A.; Gerbelová, H.; Sereno, L.; Minnebo, P. Social welfare impact from enhanced Trans-Asian electricity trade. Energy 2021, 215, 119106. [Google Scholar] [CrossRef] [Scilit]
- Hasanov, F.J.; Mukhtarov, S.; Suleymanov, E. The role of renewable energy and total factor productivity in reducing CO2 emissions in Azerbaijan: Fresh insights from a new theoretical framework coupled with Autometrics. Energy Strategy Rev. 2023, 47, 101079. [Google Scholar] [CrossRef] [Scilit]
- Karatayev, M.; Hall, S. Establishing and comparing energy security trends in resource-rich exporting nations (Russia and the Caspian Sea region). Resour. Policy 2020, 68, 101746. [Google Scholar] [CrossRef] [Scilit]
- Jafarli, O.; Babayeva, S.; Ahmadova, J. Techno-economic and environmental assessment of replacing conventional district heating systems with horizontal and vertical ground source heat pumps in Azerbaijan. Results Eng. 2026, 29, 112689. [Google Scholar] [CrossRef] [Scilit]
- Azizov, M.; Boulanouar, A.Z.; Sadili, Y.; Alhashmi, A.H.J. Climate action and economic growth: Toward sustainable development in emerging economies. Mater. Res. Proc. 2026, 58, 1123–1132. [Google Scholar] [CrossRef] [Scilit]
- Abishli, L.V.; Cebrayilov, I.I.; Gafarli, G.N.; Dadashov, E.R. Assessment of the impact of consumer price index and renewable energy consumption on CO2 emissions in Azerbaijan. Univ. Soc. 2024, 16, 219–231. [Google Scholar]
- World Bank. World Development Indicators; The World Bank Group: Washington, DC, USA, 2025; Available online: https://databank.worldbank.org/source/world-development-indicators (accessed on 15 August 2025).
- Caldara, D.; Iacoviello, M. Measuring geopolitical risk. Am. Econ. Rev. 2022, 112, 1194–1225. [Google Scholar] [CrossRef] [Scilit]
- Dickey, D.A.; Fuller, W.A. Distribution of the estimators for autoregressive time series with a unit root. J. Am. Stat. Assoc. 1979, 74, 427–431. [Google Scholar] [CrossRef] [Scilit]
- Phillips, P.C.B.; Perron, P. Testing for a unit root in time series regression. Biometrika 1988, 75, 335–346. [Google Scholar] [CrossRef]
- Zivot, E.; Andrews, D.W.K. Further evidence on the great crash, the oil-price shock, and the unit-root hypothesis. J. Bus. Econ. Stat. 1992, 10, 251–270. [Google Scholar] [CrossRef] [Scilit]
- Hepsağ, A. A unit root test based on smooth transitions and nonlinear adjustment. Commun. Stat. Simul. Comput. 2021, 50, 625–632. [Google Scholar] [CrossRef] [Scilit]
- Sollis, R. A simple unit root test against asymmetric STAR nonlinearity with an application to real exchange rates in Nordic countries. Econ. Model. 2009, 26, 118–125. [Google Scholar] [CrossRef] [Scilit]
- Pesaran, M.H.; Shin, Y.; Smith, R.J. Bounds testing approaches to the analysis of level relationships. J. Appl. Econom. 2001, 16, 289–326. [Google Scholar] [CrossRef] [Scilit]
- Narayan, P.K. The saving and investment nexus for China: Evidence from cointegration tests. Appl. Econ. 2005, 37, 1979–1990. [Google Scholar] [CrossRef] [Scilit]
- McNown, R.; Sam, C.Y.; Goh, S.K. Bootstrapping the autoregressive distributed lag test for cointegration. Appl. Econ. 2018, 50, 1509–1521. [Google Scholar] [CrossRef] [Scilit]
- Sam, C.Y.; McNown, R.; Goh, S.K. An augmented autoregressive distributed lag bounds test for cointegration. Econ. Model. 2019, 80, 130–141. [Google Scholar] [CrossRef] [Scilit]
- Johansen, S. Statistical analysis of cointegration vectors. J. Econ. Dyn. Control 1988, 12, 231–254. [Google Scholar] [CrossRef] [Scilit]
- MacKinnon, J.G. Numerical distribution functions for unit root and cointegration tests. J. Appl. Econom. 1996, 11, 601–618. [Google Scholar] [CrossRef] [Scilit]
- Akaike, H. A new look at the statistical model identification. IEEE Trans. Autom. Control 1974, 19, 716–723. [Google Scholar] [CrossRef] [Scilit]
- Yu, T.; Chen, X.; Liu, X.; Deng, X. Dynamic relationship between renewable energy, economic development, and energy security based on SVAR and ARDL-ECM models: Evidence from China. Appl. Energy 2025, 399, 126886. [Google Scholar] [CrossRef] [Scilit]
- Brown, R.L.; Durbin, J.; Evans, J.M. Techniques for testing the constancy of regression relationships over time. J. R. Stat. Soc. Ser. B 1975, 37, 149–163. [Google Scholar] [CrossRef] [Scilit]
- Anser, M.K.; Syed, Q.R.; Lean, H.H.; Alola, A.A.; Ahmad, M. Do economic policy uncertainty and geopolitical risk lead to environmental degradation? Evidence from emerging economies. Sustainability 2021, 13, 5866. [Google Scholar] [CrossRef] [Scilit]
- Adedoyin, F.F.; Zakari, A. Energy consumption, economic expansion, and CO2 emission in the UK: The role of economic policy uncertainty. Sci. Total Environ. 2020, 738, 140014. [Google Scholar] [CrossRef] [Scilit]
- Sweidan, O.D. The geopolitical risk effect on the US renewable energy deployment. J. Clean. Prod. 2021, 293, 126189. [Google Scholar] [CrossRef] [Scilit]
- Balsalobre-Lorente, D.; Shahbaz, M.; Roubaud, D.; Farhani, S. How economic growth, renewable electricity and natural resources contribute to CO2 emissions? Energy Policy 2018, 113, 356–367. [Google Scholar] [CrossRef] [Scilit]
- Shahbaz, M.; Nasir, M.A.; Roubaud, D. Environmental degradation in France: The effects of FDI, financial development, and energy innovations. Energy Econ. 2018, 74, 843–857. [Google Scholar] [CrossRef] [Scilit]
- Mukhtarov, S.; Humbatova, S.; Hajiyev, N.G.; Aliyev, S. The financial development–renewable energy consumption nexus in the case of Azerbaijan. Energies 2020, 13, 6265. [Google Scholar] [CrossRef] [Scilit]
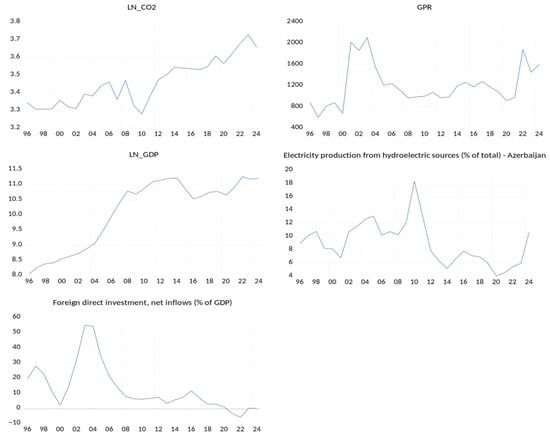
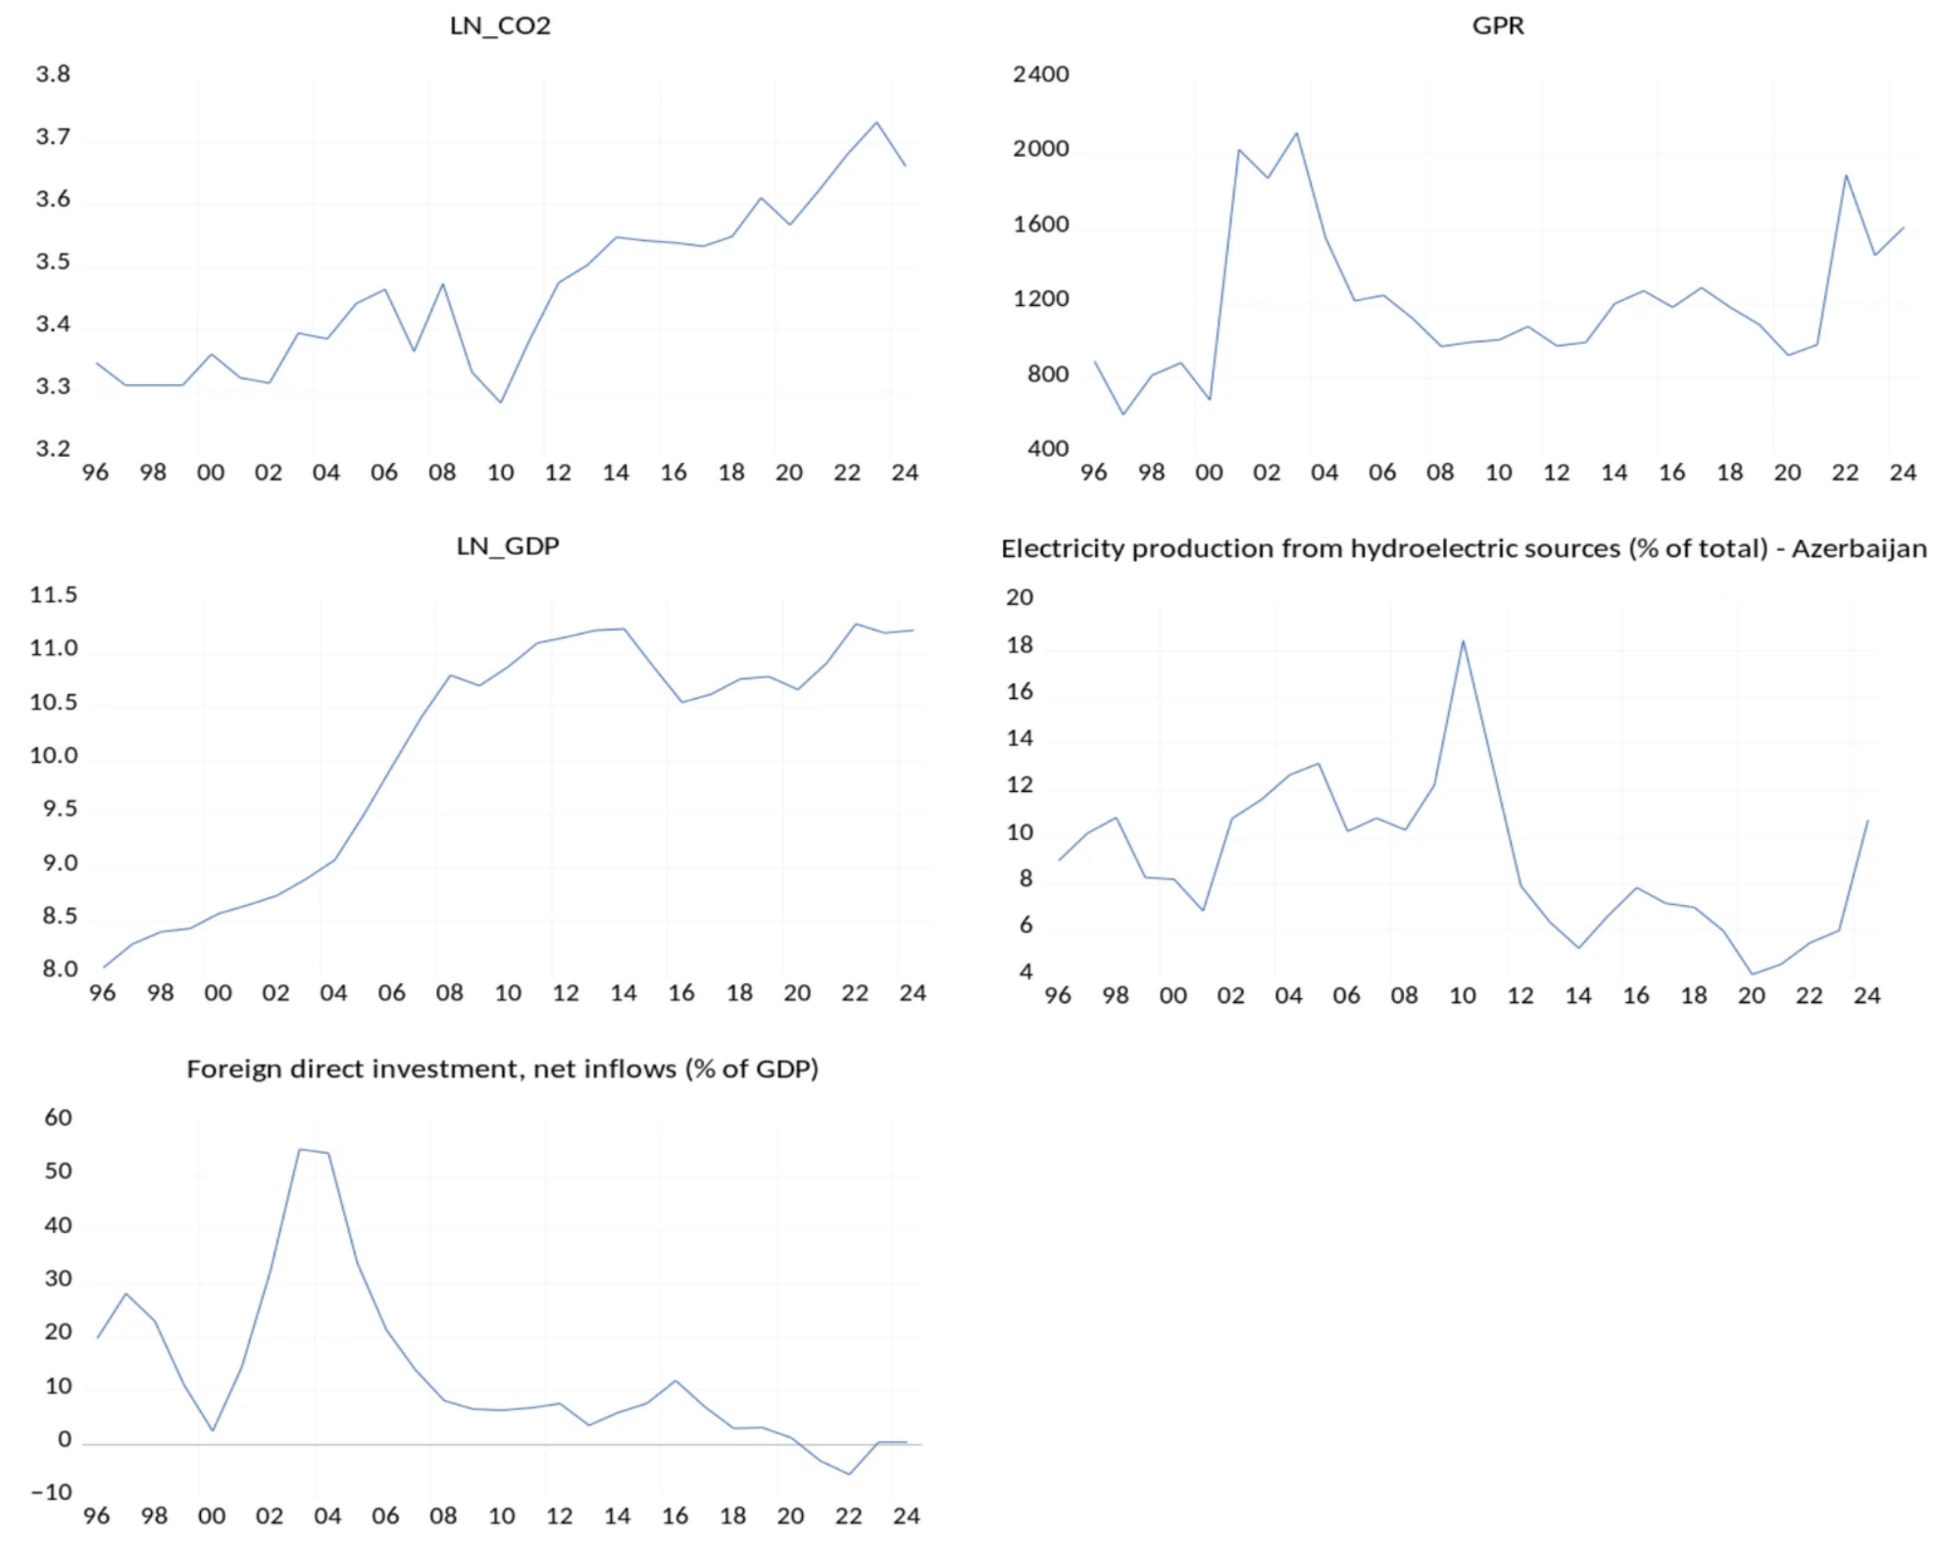
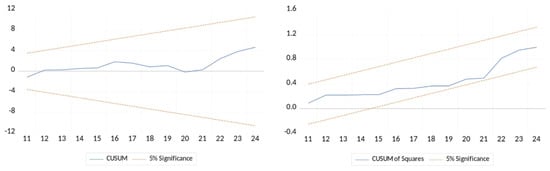
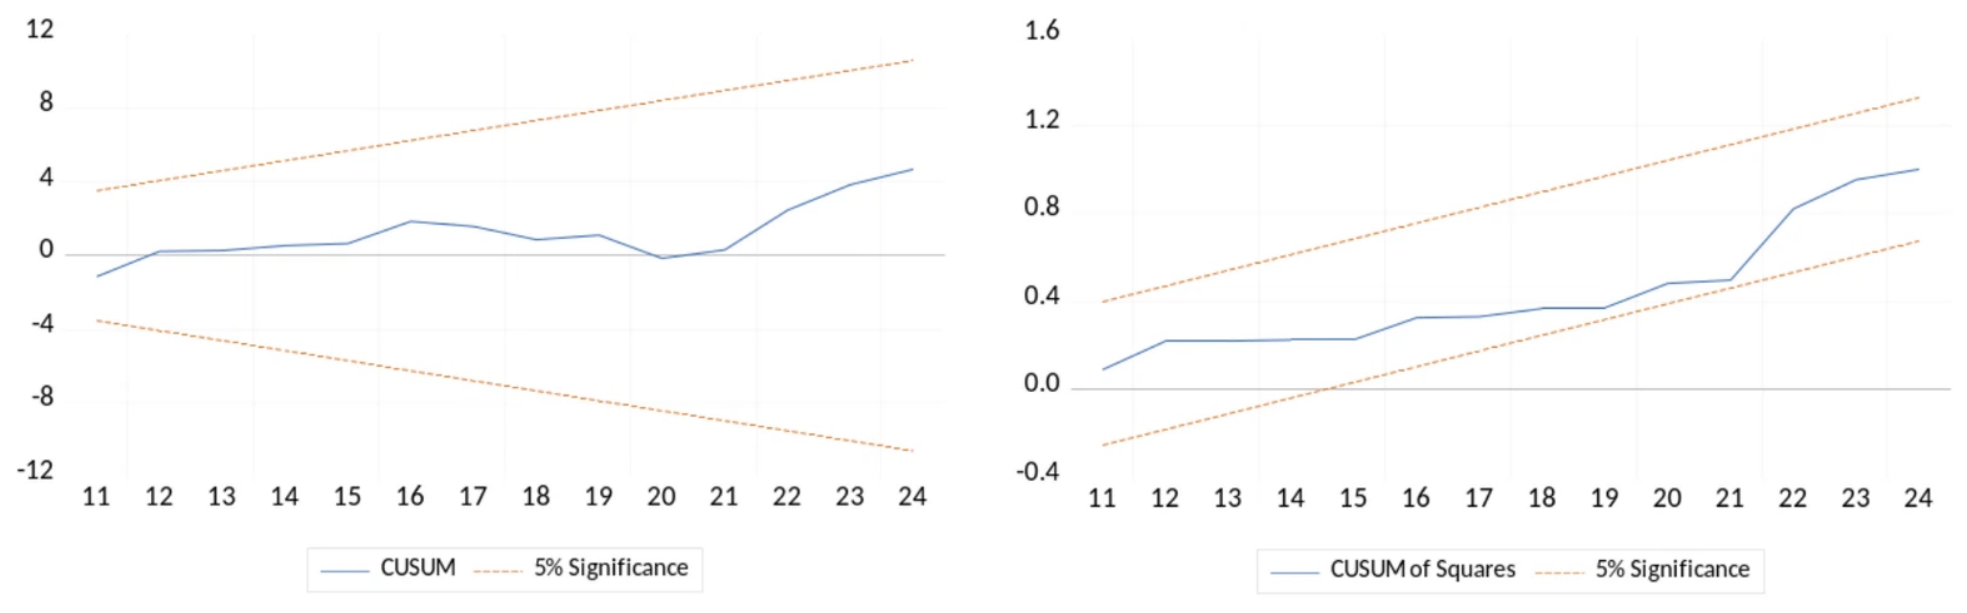

Disclaimer/Publisher’s Note: The statements, opinions and data contained in all publications are solely those of the individual author(s) and contributor(s) and not of MDPI and/or the editor(s). MDPI and/or the editor(s) disclaim responsibility for any injury to people or property resulting from any ideas, methods, instructions or products referred to in the content. |
© 2026 by the authors. Licensee MDPI, Basel, Switzerland. This article is an open access article distributed under the terms and conditions of the Creative Commons Attribution (CC BY) license.