


Highlights
Please indicate how your work links to systems science via your contributions to systems practice, theory, and/or methodology.
- Integrates scale, industrial restructuring, innovation–technological, and spatial–territorial effects to explain how the carbon effects of new-type infrastructure vary across development stages and regions.
- Examines new-type infrastructure as a spatially interconnected system, showing that its carbon effects depend on both regional development conditions and cross-regional linkages.
What are the main findings and/or the implications of the main findings?
- The development level of new-type infrastructure exhibits an inverted U-shaped relationship with carbon emissions, with industrial structure rationalization and green technological innovation acting as mediating channels.
- Spatial spillovers highlight the need for cross-regional coordination, while scenario comparisons underscore the need to align new-type infrastructure expansion with stronger green-transition efforts.
Abstract
New-type infrastructure (NI) may increase carbon emissions through scale expansion while reducing them through technological progress, but systematic empirical testing of these competing effects remains limited. Using panel data for 30 Chinese provinces from 2013 to 2024, this study examines the nonlinear effects of NI on carbon emissions within a two-way fixed-effects framework, and employs the system generalized method of moments (GMM) and instrumental variable approaches to address potential endogeneity arising from dynamic panel bias, omitted variables, and other sources. We then examine industrial structure rationalization and green technological innovation as mediating variables, estimate spatial dependence with a spatial Durbin model, and combine particle swarm optimization–support vector machine (PSO-SVM) forecasting with alternative scenario assumptions. The evidence supports an inverted U-shaped association between NI and carbon emissions. Both mediating variables are significant, but the nonlinear relationship is found only in the central and western regions; it is not significant in the eastern or northeastern regions. NI also has significant cross-regional spatial spillover effects. Across the four scenarios, emissions ultimately decline, the green-transition scenario reaches the earliest and lowest peak, and rapid NI development produces greater pressure in the near term. These results characterize NI as a stage-dependent and spatially connected driver of emissions and support differentiated regional implementation of the Digital China and Beautiful China strategies.
1. Introduction
China’s expansion of 5G networks, big-data facilities, artificial intelligence, and the industrial Internet has made NI a central component of digital transformation. Its environmental implications, however, cannot be inferred from its growth benefits alone. The investment in NI is being scaled up while China seeks to peak carbon emissions before 2030 and achieve carbon neutrality before 2060. This raises two questions: how can new drivers of economic growth be reconciled with ecological constraints, and can innovation-driven growth be accompanied by environmental improvements? A systematic assessment of the carbon-emission effects of NI is therefore not only a test of whether digital economic development follows an environmental Kuznets curve (EKC)-type pathway, but also an exploration of whether technology-enabled efficiency gains can overcome the rebound effects implied by the Jevons paradox. More broadly, this issue is closely related to the coordination between China’s Digital China and Beautiful China strategies.
NI is organized around three broad categories: information, converged, and innovation infrastructure [1]. These categories are underpinned by digital networks and technologies that facilitate digital transformation, intelligent upgrading, and integrated innovation. NI thus differs from conventional infrastructure not simply in the assets being built, but in how it reshapes information flows, factor allocation, and the operation of existing physical systems. While conventional transportation and energy infrastructure are typically organized around expanding physical mobility, carrying capacity, or energy delivery, NI places greater emphasis on information-network capabilities and the digital integration of existing production and infrastructure systems. These digitally enabled functions introduce sensing, computation, connectivity, and real-time coordination into infrastructure operation and production [2]. The effects of these digital capabilities are not generated by hardware investment alone but also depend on their integration with complementary organizational and production processes [3]. This suggests that NI should be treated not merely as an additional stock of physical capital, but as a multidimensional infrastructure system in which digital connectivity, digital–physical integration, and innovation-support capacity can alter the productivity and allocation of conventional production factors.
Given the multidimensional nature of NI, its carbon implications are theoretically ambiguous and may vary across stages of NI development. These forces can be examined through four interrelated effects: the scale effect, industrial restructuring effect, innovation–technological effect, and spatial–territorial effect. First, the scale effect is mainly associated with building and operating data-intensive infrastructure. Data centers and related facilities directly increase electricity consumption. Meanwhile, efficiency improvements and lower service costs may encourage greater demand for data traffic and computing services. This expansion can offset part of the initial energy savings through rebound effects [4,5,6]. Second, the industrial restructuring effect arises when digital technologies are integrated into the production and management activities of conventional industries. This integration can improve resource allocation and encourage production factors to move toward more technology- and knowledge-intensive activities. It may consequently facilitate a gradual shift away from energy-intensive production [7]. Third, the innovation–technological effect is reflected primarily in the development and application of green technologies. NI can improve access to information, accelerate the diffusion of knowledge, and reduce barriers to innovation. These changes create more favorable conditions for green technological innovation and its adoption in production [8]. Fourth, the spatial–territorial effect stems from the ability of digital connectivity to reduce geographical constraints on information exchange and interregional coordination. Stronger connectivity can reshape the spatial organization of firms, industries, and supply chains. Consequently, changes in energy use and carbon emissions associated with NI may extend from one region to other economically connected regions [9]. The net carbon consequence of NI thus depends on the changing balance among these four effects. At early stages of NI development, infrastructure expansion, electricity demand, and rebound effects may exert upward pressure on emissions. As NI becomes more deeply integrated into economic activities, industrial restructuring and green technological innovation may exert stronger emission-reducing effects. Spatial–territorial interactions may further cause these effects to differ across regions. The evolving balance among these four effects therefore provides a theoretical basis for the nonlinear and regionally heterogeneous nature of NI’s carbon effects.
The relative strength of these four effects is also likely to vary across regions in China because of differences in the development stage, industrial structure, energy conditions, and institutional environment, resulting in spatially differentiated carbon-emission implications of NI. Ignoring this complexity may result in resource misallocation. Meanwhile, traditional econometric models have limitations in capturing the nonlinear dynamics of such complex systems, whereas purely data-driven forecasting approaches often lack support from economic mechanisms. Accordingly, this calls for an integrated approach that combines economic-mechanism validation with intelligent algorithm-driven optimization.
Motivated by these considerations, this study addresses two interrelated research questions. First, how has NI affected regional carbon emissions over the study period? Does this effect conform to the expectations of the EKC framework, and does it exhibit spatial heterogeneity? Second, how can a forecasting framework that integrates scenario analysis with intelligent algorithms be developed to simulate the differentiated impacts of NI on future carbon-emission trajectories under alternative scenarios? By addressing these questions, this study provides an empirical basis for aligning NI construction with China’s dual carbon goals.
2. Literature Review
2.1. Studies on the Effects of New-Type Infrastructure Construction
The expanding role of NI in the digital economy, together with its wide-ranging externalities, has generated increasing academic interest. Existing studies have mainly examined its impacts from two perspectives: macroeconomic growth and firm development. At the macroeconomic level, prior research has shown that NI can promote economic growth by improving total factor productivity and facilitating industrial structure rationalization [10,11]. Firm-level studies have focused on how NI improves production processes and facilitates knowledge diffusion [12,13]. Although existing research has examined the multidimensional effects of NI construction, its environmental consequences, particularly its impact on carbon emissions, remain insufficiently explored.
Existing evidence on the environmental consequences of NI remains mixed. Wei and Yin [14] exploit the Broadband China pilot as a quasi-natural experiment and, using data for 285 Chinese cities from 2008 to 2019, report that broadband infrastructure contributes to lower urban carbon emissions. By contrast, the expansion of energy-intensive digital facilities, especially data centers, can substantially increase electricity demand [4]. Peng et al. [5] further show that digital development may raise electricity consumption because efficiency improvements are partly offset by rebound effects. More recent studies have moved beyond uniform linear effects and emphasize possible nonlinearities and regional differences. Liu et al. [15], based on provincial data for 2011–2020, proxy NI by new-infrastructure capital stock and find an inverted U-shaped association with regional carbon intensity. Using a multidimensional NI index for 280 Chinese cities during 2011–2019, Liu et al. [16] document nonlinear, heterogeneous, and spatial effects on total factor carbon productivity. Taken together, the empirical evidence remains inconclusive, partly because existing studies differ substantially in spatial scale, sample period, NI measurement, environmental outcomes, and econometric specification.
The measurement of NI also varies across the literature. Some studies use policy interventions or individual digital-infrastructure indicators as proxies, whereas others construct composite indices to reflect its multidimensional nature. Among the latter, several studies organize NI around information infrastructure, converged infrastructure, and innovation infrastructure, although their specific indicators and aggregation procedures differ. Wu et al. [17] combine physical and digital indicators to characterize the three dimensions. Chang et al. [18] use investment-based indicators and incorporate the coupling between conventional- and new-infrastructure-related investment in measuring converged infrastructure. Gu and Liao [19] similarly construct a provincial multidimensional NI index that captures information-network development, digital–physical infrastructure integration, and innovation-support capacity, with the underlying indicators aggregated using the entropy-weighting method.
Studies of conventional infrastructure have identified industrial restructuring and technological change as important channels linking infrastructure development to environmental performance [20,21]. Recent research on NI reports broadly similar pathways. Liu et al. [15], for example, identify industrial structure optimization and technological progress as potential channels through which NI affects carbon performance. Evidence from the digital-infrastructure literature, which examines a central component of NI, suggests that industrial upgrading and green technological innovation are important in explaining changes in carbon emissions and broader environmental performance [7,8]. Although these broad channels overlap with those discussed in the conventional infrastructure literature, NI relies more heavily on digital connectivity, information sharing, and the integration of digital technologies with existing production systems.
Beyond these transmission pathways, a further strand of the literature examines the spatial spillovers of NI. Chang et al. [18], using a spatial Durbin model for Chinese cities, find that NI improves total factor carbon productivity both locally and in spatially connected areas. Liu et al. [16] likewise identify positive spillover effects of NI on nearby cities. In contrast, Liu et al. [15] find that, although carbon intensity exhibits spatial dependence, the spatial spillover effect of NI itself is not statistically significant. Differences in environmental indicators and spatial scale may account for part of this divergence.
Overall, existing studies have substantially advanced understanding of the environmental implications of NI, while empirical findings remain mixed regarding its nonlinear carbon effects and spatial spillovers. Existing research has also identified several potential transmission pathways, providing a basis for further examining the roles of industrial structure rationalization and green technological innovation. Accordingly, this study considers nonlinear relationships, potential transmission pathways, regional heterogeneity, and spatial dependence within a unified empirical framework.
2.2. Studies on the Effects of Related Factors on Carbon Emissions and Their Forecasting
Population [22], economic growth [23], technological innovation [24], urbanization [25], environmental policy [26], and industrial development [27] are established determinants of carbon emissions. These studies have provided an important basis for identifying the socioeconomic drivers of carbon emissions. More recently, scholars have begun to investigate the carbon consequences of NI. This evidence is still dominated by retrospective empirical analysis, with relatively little attention to forward-looking prediction.
Carbon-emission forecasting methods have evolved from traditional factor-decomposition approaches, such as the Kaya identity, and econometric models, such as the STIRPAT model, to a wide range of machine-learning methods. Traditional econometric and decomposition approaches offer relatively transparent parameter interpretation. They are useful for analyzing relationships among emission drivers, but their predefined functional forms may limit their ability to capture complex nonlinear patterns. Machine-learning methods, including neural networks, random forests, and support vector machines, have been applied to carbon-emission forecasting due to their flexibility in modeling complex nonlinear relationships [28]. These methods nevertheless differ in their data requirements, model complexity, and generalization performance. Neural networks have strong nonlinear approximation capabilities, but their predictive performance can be sensitive to network architecture, training samples, and parameter settings, and they may be prone to overfitting when data are limited [29]. Random forests can effectively capture nonlinearities and interactions with relatively few distributional assumptions. Still, their ensemble structure reduces model interpretability, while predictive performance remains dependent on sample characteristics and hyperparameter settings [30,31]. The support vector machine (SVM), based on structural risk minimization and kernel mapping, can achieve good generalization while controlling model complexity, making it suitable for nonlinear forecasting with relatively limited samples [32,33]. However, its forecasting performance is sensitive to the selection of kernel and penalty parameters. Particle swarm optimization (PSO) can therefore be introduced to optimize model parameters and improve predictive performance. For example, Chu and Zhao [34] develop a PSO-SVR model for building carbon-emissions prediction and show that PSO-based parameter optimization improves the model’s forecasting accuracy, generalization ability, and robustness. While such optimization enhances predictive performance, point forecasting alone provides limited information about how future carbon-emission trajectories may vary under alternative development conditions. This further highlights the value of incorporating scenario analysis into forecasting.
Scenario analysis provides a useful means of extending data-driven forecasts from a single projected trajectory to alternative development pathways. Rather than assuming a deterministic future, it allows key socioeconomic, technological, and policy drivers to vary under plausible assumptions, thereby revealing how different development conditions may shape future carbon-emission trajectories [35]. Several studies have begun to combine scenario settings with quantitative forecasting models. For example, Niu et al. [29] integrate an improved neural network with strengthened-policy and market-oriented allocation scenarios to forecast China’s future carbon-emission trajectories. Similarly, Zheng and Shuang [36] integrate an interpretable hybrid machine-learning model with multidimensional scenarios to assess China’s carbon-peaking and carbon-neutrality pathways. These studies demonstrate the value of linking predictive models with alternative development assumptions. However, existing applications have mainly focused on broad socioeconomic and energy-related drivers, whereas the implications of alternative NI development trajectories for future carbon emissions remain underexplored.
Taken together, existing studies provide an important methodological basis for carbon-emission forecasting, but forward-looking assessments of carbon outcomes under alternative NI development trajectories remain relatively limited. To address this gap, this study combines econometric analysis, machine-learning forecasting, and scenario analysis; compares the predictive performance of alternative machine-learning models; and further applies PSO-SVM to assess future carbon-emission patterns under different NI development scenarios.
3. Theoretical Analysis and Research Hypotheses
3.1. Direct Impact of New-Type Infrastructure on Carbon Emissions
The EKC provides a stage-dependent framework for understanding how environmental outcomes evolve with economic development. As an economy develops, the relative strength of scale, composition, and technique effects may shift across different stages of development [37,38]. These effects are not fixed but may vary with institutional conditions, technological progress, and the specific stage of development [39]. Drawing on this stage-dependent logic, this study examines how the balance between emission-increasing and emission-reducing mechanisms evolves across stages of NI development. Understanding this changing balance requires us to consider the distinctive characteristics of NI. While conventional infrastructure is primarily oriented toward expanding physical capital and carrying capacity, NI places greater emphasis on digital connectivity, data processing, and the integration of digital technologies with existing production and infrastructure systems. These distinctive features shape the relative strength of emission-increasing and emission-reducing mechanisms as NI development proceeds.
Given these distinctive features, the net carbon effect of NI is unlikely to be uniform across its development trajectory. At relatively low levels of NI development, emission-increasing mechanisms are likely to dominate. The rapid deployment of 5G networks, data centers, computing facilities, and digitally upgraded conventional infrastructure requires substantial equipment investment. It raises operational electricity demand, particularly before complementary organizational and industrial adjustments are fully realized [40,41]. At the same time, although improvements in computing and network efficiency can reduce energy use per unit of digital service, expanded applications and lower service costs may stimulate additional data traffic, computation, and digitally enabled output. The resulting rebound effect can offset part of the efficiency gains [42]. At this stage, infrastructure deployment, rising ICT electricity demand, and rebound effects may collectively contribute to upward pressure on carbon emissions.
As NI develops and becomes more deeply integrated into economic activity, digitally enabled efficiency and restructuring mechanisms may strengthen. High-speed connectivity, cloud computing, the Internet of Things, and artificial intelligence can reduce information asymmetry and coordination costs, improve real-time monitoring and resource matching, and thereby enhance the allocation efficiency and productivity of conventional production factors [2,43,44]. Digital connectivity may also reshape the geographical organization of production and supply chains [45]. Digitally enabled innovation and intelligent management can improve energy efficiency and facilitate cleaner technological change [46]. Because these benefits depend on complementary organizational, industrial, and energy-system adjustments, they may take time to materialize.
Whether NI raises or lowers emissions is determined by the balance between its emission-increasing and emission-reducing mechanisms. During the expansion stage, infrastructure deployment, operational ICT electricity demand, and rebound effects may dominate. As digital networks mature and become more deeply embedded in production and innovation systems, resource-allocation, structural, and technological-efficiency effects may become progressively stronger. The gradual change in this balance implies that the NI–emissions relationship may take an inverted U-shaped form. Accordingly, the following hypothesis is proposed:
H1.
NI development has an inverted U-shaped relationship with carbon emissions, with emissions increasing during the early stage of NI development and decreasing after the turning point.
3.2. Indirect Impact of New-Type Infrastructure on Carbon Emissions
- (1)
- Structural effect
NI development can promote rationalization of industrial structure. By transforming data into a key productive factor, NI reshapes the technological conditions for industrial development. Technologies such as 5G, the industrial Internet, and cloud computing make information easier to obtain and use, helping traditional firms digitalize production and management [15]. At the same time, NI reduces factor-allocation frictions and encourages cross-sectoral mobility of labor, capital, and other production factors. This, in turn, improves the alignment between industrial output and employment structure, thereby promoting rationalization of industrial structure [47,48].
Industrial structure rationalization also affects carbon emissions. In the scale–composition–technique framework, sectoral reallocation changes how energy and resources are used [38]. The composition effect operates through changes in the sectoral allocation of output and production factors. It can enable effective production to expand before the associated efficiency gains dominate. However, improved inter-sectoral coordination can also facilitate production expansion and increase energy demand before the resulting efficiency gains are fully realized. This possibility accords with Hu et al. [49], who document that industrial structure rationalization can increase carbon emissions in the short run. Hence, the sign and magnitude of the carbon effect depend on the balance between efficiency improvement and production expansion [50]. NI can therefore influence emissions through its effect on industrial structure rationalization. Accordingly, the following hypothesis is proposed:
H2.
Industrial structure rationalization mediates the relationship between NI construction and carbon emissions.
- (2)
- Technological effect
Innovation ecosystem theory regards new-generation information infrastructure as a platform supporting innovation activity in the digital economy [51]. Li et al. [52] argue that NI supplies computing capacity and data resources for green R&D and uses intelligent tools to improve research efficiency. Cloud computing and artificial intelligence increase analytical capacity, allowing resources and production processes to be optimized more accurately. Real-time emission data generated through the Internet of Things and big-data systems can also inform the improvement of emission-reduction technologies. Liu et al. [53] further show that digitally connected networks facilitate knowledge exchange and joint R&D among firms, universities, and research institutes, thereby accelerating green-technology development.
Green technological innovation is an important driver of the low-carbon transition. The induced-technological-change perspective implies that carbon constraints redirect innovative effort toward energy-saving and emission-reducing solutions. Consistent with Yuan et al. [54], this effect can arise in two ways: efficiency improvement and energy substitution. The efficiency improvement pathway operates by improving energy-use efficiency through process optimization and equipment upgrading, thereby reducing carbon intensity. The energy substitution pathway promotes renewable energy and energy storage technologies, facilitating a cleaner energy structure. Accordingly, the following hypothesis is proposed:
H3.
Green technological innovation mediates the relationship between NI construction and carbon emissions.
3.3. Spatial Spillover Effect of New-Type Infrastructure on Carbon Emissions
The spatial configuration and networked characteristics of NI may allow its carbon effects to extend beyond administrative boundaries and generate spillovers in neighboring and spatially connected regions. New economic geography emphasizes that reductions in spatial frictions, greater factor mobility, and stronger interregional economic linkages can generate agglomeration and diffusion across regions [55]. By strengthening digital connections and lowering geographical barriers to information transmission, NI can increase cross-regional flows of knowledge, technology, production factors, and economic activity. These characteristics provide a theoretical basis for spatial spillover effects of NI on carbon emissions.
Several mechanisms may underlie the spatial spillover effects of NI on carbon emissions. First, knowledge spillovers and technological diffusion can transmit low-carbon technologies and production practices across regions. Lower communication and collaboration costs allow green technologies, production knowledge, and low-carbon practices to spread more rapidly among digitally connected regions [56,57]. Second, industrial-chain linkages can transmit changes in production organization and industrial structure across regions. Coordination across upstream and downstream sectors also supports the interregional movement of capital, labor, intermediate goods, and producer services. Because regional production systems are connected through supply chains, changes in production structure and resource use associated with NI development in one region may consequently be reflected in the carbon performance of economically connected regions [58,59]. Third, demonstration effects and policy diffusion can reinforce cross-regional low-carbon linkages. Digital platforms increase the visibility and transferability of environmental information, governance experience, and low-carbon practices, facilitating learning and policy diffusion among local governments and thereby extending their environmental implications across administrative boundaries [60,61].
Taken together, the networked nature of NI enables its carbon effects to spread across regions through knowledge and technology diffusion, industrial-chain linkages, and demonstration and policy diffusion. Accordingly, the following hypothesis is proposed:
H4.
NI construction has a spatial spillover effect on carbon emissions in spatially connected regions.
Based on the above theoretical analysis and research hypotheses, the conceptual framework of this study is summarized in Figure 1.
Figure 1.
Conceptual framework for the theoretical analysis.
4. Methodology
4.1. Model Specification
4.1.1. Two-Way Fixed-Effects Model
Using panel data for 30 Chinese provincial-level regions from 2013 to 2024, this study estimates a two-way fixed-effects model with province and year effects:
where represents the logarithm of CO2 emissions in province in year . is the level of NI construction in province in year . In addition, the squared term of NI construction, , is included to test for a possible inverted U-shaped relationship between NI and carbon emissions. denotes the control variables, and represents the corresponding coefficient. and represent province fixed effects and year fixed effects, respectively. is the random error term. is the constant term, while and are the coefficients of and , respectively.
4.1.2. Mediation Effect Model
To examine the indirect mechanisms through which NI construction affects carbon emissions, the following models are constructed to test whether industrial structure rationalization and green technological innovation exert mediating effects.
where denotes the mediating variable, represented by IS and GTI, respectively. and are the random error terms in Equations (2) and (3), respectively. and are the constant terms.
4.1.3. Spatial Durbin Model
Since carbon emissions and NI-related activities are not restricted to individual provinces, spatial dependence may exist across provincial boundaries. To capture such spatial relationships, this study employs the spatial Durbin model (SDM). By including spatial lags of both the dependent and explanatory variables, the SDM permits assessment of cross-regional spillover effects [62]:
where denotes the spatial weight matrix, is the spatial autoregressive coefficient, and denote the spatially lagged terms of NI and its squared term, and represents the spatial lags of the control variables. Following previous provincial-level spatial studies, this study adopts an economic–geographic nested weight matrix to capture both geographical proximity and economic similarity across provinces [63,64].
4.2. Definition of Variables
4.2.1. Dependent Variable
The dependent variable is carbon dioxide emissions. Fossil CO2 emissions are used to represent regional carbon emissions because emissions from fossil-fuel use and industrial processes constitute the dominant source of anthropogenic CO2 emissions and are closely associated with energy consumption, industrial production, transportation, and other socioeconomic activities [65]. Provincial fossil CO2 emissions are obtained from the subnational dataset of the Emissions Database for Global Atmospheric Research (EDGAR) [66]. EDGAR provides consistently compiled annual emission estimates at the provincial level, thereby enabling the construction of a continuous provincial panel covering the study period from 2013 to 2024. To reduce heteroscedasticity and smooth fluctuations in the data, provincial fossil CO2 emissions are log-transformed and denoted as lnCE.
4.2.2. Core Independent Variable
The core independent variable is the level of NI construction, denoted as NI. Following the three-dimensional classification adopted by Chang et al. [18] and consistent with the official classification of NI in China [1], NI is measured across three dimensions: information infrastructure, converged infrastructure, and innovation infrastructure. These dimensions are treated as functionally distinct but complementary components of the NI system. Information infrastructure captures digital connectivity, network capacity, and information-service accessibility; converged infrastructure captures the digital and intelligent upgrading of conventional physical infrastructure; and innovation infrastructure consists of research, incubation, and technology-transfer platforms that facilitate scientific inquiry and technological advancement.
Information infrastructure is measured using seven indicators that capture communication capacity, network connectivity, information-service accessibility, and the application of information technologies [67,68]. The measurement includes fixed-telephone subscribers, mobile-exchange capacity, websites per 100 enterprises, Internet penetration, cable radio and television subscribers, computers per 100 households, and long-distance optical-cable length. Fixed-line subscriptions and mobile-exchange capacity describe the reach and capacity of communication networks. Internet penetration and cable subscriptions indicate access to information services, whereas enterprise websites and household computers describe technology use by firms and residents. Long-distance optical-cable length measures the physical backbone available for regional information transmission.
Converged infrastructure reflects the digital upgrade of traditional infrastructure, particularly in transport. Although converged infrastructure also includes areas such as smart energy, comparable province-level data for these components are fragmented. Due to the availability of province-level data and the need for interprovincial and intertemporal comparability, this study therefore focuses on transportation infrastructure, for which relatively consistent data are available.
Because directly available statistical data on investment in and the development level of converged infrastructure are limited, we follow Wu et al. [17] and measure converged infrastructure by multiplying the scale of traditional transportation infrastructure by an integration coefficient. Traditional transportation infrastructure is proxied by the total mileage of highways, railways and public buses/trolleybuses. The integration coefficient is measured using the coupling intensity of fixed-asset investment across sectors associated with both NI and traditional infrastructure [19]. The coefficient characterizes the degree of integration between digital technologies and conventional physical infrastructure, that is, the extent to which conventional infrastructure has undergone digital and intelligent upgrading. A closer match in the relative scale of the two types of fixed-asset investment yields a higher , indicating more favorable conditions for the digital empowerment of conventional infrastructure. Conventional-infrastructure-related investment includes investment in energy and utility supply, transportation and postal services, and water conservancy and public-facility management, whereas new-infrastructure-related investment includes investment in information technology services, scientific research and technical services, and health and social work [18]. The integration coefficient is calculated as follows:
where and denote conventional-infrastructure-related and new-infrastructure-related fixed-asset investment for province in year . Further details on the construction of , and the implementation of the integration coefficient are provided in Section S1 of the Supplementary Materials.
Innovation infrastructure refers to facilities that support scientific research, technological development, and product R&D [19]. This dimension is measured by the site area of national university science parks, the number of national-level technology business incubators, and the number of national technology transfer institutions. These indicators capture the physical capacity of university-based innovation platforms, enterprise incubation and support, and technology-transfer capacity, respectively.
Indicators from these dimensions are aggregated with the entropy-weight method [69]. Let denote the original value of indicator for province in year . Because all indicators are positively oriented, they are first normalized using the min–max transformation:
The proportional contribution of each province–year observation to indicator is calculated as:
And the entropy value of indicator is:
The entropy weight of indicator is then calculated as:
The composite NI index is obtained as:
In this study, and denote the numbers of provinces and years, respectively. All province–year observations over 2013–2024 are pooled when normalization and entropy weighting are performed. A single set of indicator weights is calculated from the complete panel and then held constant across provinces and years. Therefore, cross-sectional and temporal variation in the NI index is not mechanically generated by province-specific or year-specific reweighting. The weights of each indicator are reported in Table S2 of the Supplementary Materials.
4.2.3. Mediating Variables
The mediating variables in this study are industrial structure rationalization (IS) and green technological innovation (GTI). IS is measured using the Theil index [49,70]. The Theil index simultaneously considers the distribution of output and employment across the primary, secondary, and tertiary industries and therefore reflects the coordination of resource allocation among industries. It is calculated as follows:
where denotes the primary, secondary, and tertiary industries, respectively. indicates the value added of industry in province in year , while denotes the total regional output. List denotes employment in industry , and denotes total employment in province in year . A smaller Theil index indicates smaller disparities in labor productivity across industries and a more coordinated allocation of output and employment, corresponding to a higher degree of industrial structure rationalization.
GTI is measured by the per capita number of green invention patents granted [71]. Compared with patent applications, granted invention patents better reflect realized technological innovation outcomes that have passed the patent examination process, while focusing on invention patents helps capture relatively substantive green technological innovation. This per capita measure helps reduce the potential influence of regional-scale differences, such as variations in population size and innovation capacity.
4.2.4. Control Variables
This study also controls for observable provincial characteristics associated with carbon emissions. First, the economic development level (lnPGDP) is proxied by the logarithm of GDP per capita. According to the EKC hypothesis, economic development may have a nonlinear relationship with environmental quality. Its effects on carbon emissions may also vary across development stages. Therefore, this variable is included as a control [37]. Second, foreign direct investment (lnFDI) is proxied by the natural logarithm of one plus foreign registered capital. FDI may affect carbon emissions in two opposite ways. Its production-expansion effect may raise energy use and associated emissions. On the other hand, it may reduce emissions by introducing advanced technologies and management practices that improve energy-use efficiency [72]. Third, energy consumption structure (ECS) is proxied by coal consumption intensity, defined as total coal consumption per unit of GDP [73]. A higher value indicates greater dependence on coal in generating economic output and is therefore generally associated with higher carbon emissions. Fourth, environmental regulation intensity (lnER) is proxied by the natural logarithm of completed investment in industrial waste-gas treatment projects [74]. This indicator reflects regional efforts and resource inputs devoted to industrial air-pollution control. Stronger environmental governance may constrain pollution-intensive production and encourage cleaner production and technological improvement, thereby affecting carbon emissions. Fifth, population size (lnPS) is proxied by the natural logarithm of the year-end resident population. A larger population can increase consumer demand and energy use, thereby placing upward pressure on emissions [75]. Sixth, energy production structure (EPS) is proxied by the share of thermal power generation in total electricity generation [76]. A higher thermal power share indicates greater reliance on fossil-fuel-based electricity generation and is therefore likely to increase the carbon intensity of regional energy supply. Seventh, urbanization (lnUR) is proxied by the natural logarithm of built-up area [77]. Growth in built-up land changes construction activity, transport demand, and the spatial organization of economic activity, with corresponding effects on regional energy use and emissions. Finally, the industrial development level (lnIR) is proxied by the natural logarithm of per capita industrial value added [78]. Greater industrial output can raise emissions through additional energy demand, although efficiency and technological improvements may partly counteract this effect.
4.3. Impact Prediction Methods
4.3.1. Scenario Design
Scenario analysis is an analytical tool that outlines several possible future situations to evaluate how a system may evolve under different development pathways and the potential impacts of these changes [35]. Scenario analysis can provide decision-makers with multiple perspectives on potential outcomes. This study takes 2024 as the common starting point and projects future carbon-emission trajectories over 2025–2035 under different scenario assumptions. Based on different combinations of NI development and low-carbon transition, four scenarios are constructed: S1 (baseline), S2 (rapid NI development), S3 (green transition), and S4 (coordinated development). S1 represents the continuation of the baseline development path, S2 emphasizes faster NI development, S3 emphasizes a stronger low-carbon transition, and S4 combines faster NI development with a strengthened low-carbon transition. The scenario assumptions are specified with reference to historical provincial trends, external predictions, and relevant policy targets.
The NI trajectories are calibrated from the empirical distribution of annual changes in the NI index across the 30 provinces during 2013–2024. Specifically, S1 and S3 adopt the median (P50) annual increment, S2 adopts the 75th percentile (P75), and S4 adopts the arithmetic mean of P50 and P75. These parameters represent annual changes in NI index points rather than percentage growth rates. The remaining variables are calibrated according to their respective economic or policy bases. For the remaining predictor variables, the economic development level is specified with reference to recent national statistics, the International Monetary Fund (IMF) medium-term economic outlook, and projected population changes, while population size follows the medium-variant prediction of the United Nations World Population Prospects 2024. Foreign direct investment and urbanization follow recent provincial trends, while industrial development follows a moderate long-term growth path based on recent national industrial performance. Energy consumption structure, energy production structure, and environmental regulation intensity differ across scenarios based on historical trends and relevant policy directions. The scenario analysis does not assign independent exogenous trajectories to industrial structure rationalization and green technological innovation because the empirical framework treats them as mediating outcomes rather than external scenario drivers. Table 1 summarizes the main scenario settings, while Table S1 of the Supplementary Materials provides the numerical parameters and detailed setting procedures.
Table 1.
Scenario settings and basis.
4.3.2. PSO-SVM Prediction Model
Because the sample size is limited and a complex nonlinear relationship may link NI construction to carbon emissions, the SVM is selected as the basic modeling method. Built on the principle of structural risk minimization, the SVM demonstrates strong generalization performance for handling small samples and nonlinear tasks [79]. In addition, PSO is incorporated to identify suitable parameter settings and further enhance forecasting accuracy. On this basis, the PSO-SVM forecasting framework is established.
Figure 2 summarizes the workflow. After the swarm is initialized with the swarm size, particle positions, and velocities, each candidate parameter set is used to train the SVM and is evaluated using a fitness function. Particle positions and velocities are updated from personal and global best solutions until the termination criterion is met.
Figure 2.
Construction of the PSO-SVM model and prediction procedure.
- (1)
- Support vector machine (SVM) model
The SVM can handle small-sample and nonlinear problems through structural risk minimization and kernel mapping. Support vector regression (SVR) is an extension of the SVM for regression tasks. By introducing an ε-insensitive loss function and slack variables, SVR reduces fitting errors while controlling model complexity. Given a training sample set, the optimization objective of SVR is specified as follows:
where represents the regularization term that helps limit model complexity. is the penalty parameter. and are slack variables, representing the degree to which sample points deviate above and below the ε-tube, respectively. ε defines the width of the insensitive tube.
Because carbon-emissions prediction often exhibits strong nonlinearity, linear SVR may fail to achieve the required prediction accuracy. Therefore, SVR introduces the kernel function to transform the input data into a high-dimensional feature space. With the kernel function, the regression function is as follows:
where and are Lagrange multipliers. is the kernel function, and is the bias term. This study selects the radial basis function (RBF) as the kernel function:
where is the kernel parameter used to control the effective range of the kernel function. The RBF kernel function has strong nonlinear fitting capacity and has relatively simple parameterization. It is therefore suitable for the complex nonlinear relationships involved in carbon-emissions prediction.
- (2)
- Particle swarm optimization (PSO) algorithm
PSO is used to optimize the SVR penalty parameter , the RBF kernel parameter , and the insensitive-loss parameter , thereby reducing the dependence of model performance on manually specified hyperparameters. As a global optimization algorithm based on swarm intelligence, PSO simulates the iterative movement of particles in the solution space. It uses the information-sharing mechanism between each particle’s best historical solution and the swarm’s global best solution to guide the search direction. In this way, PSO can efficiently approximate the global optimum in a complex nonlinear space [80]. The update equations are as follows:
where denotes the velocity of particle at time and determines its direction and step size. denotes the position of particle at time . denotes the best historical position of particle . denotes the global best position. and are two random numbers. and are acceleration parameters that regulate the movement of particles toward the personal and global optima. is the inertia weight. It reflects how much the updated particle velocity depends on the preceding velocity. This helps prevent particles from relying too heavily on the existing search direction and becoming trapped in a local optimum.
4.4. Data Collection
Considering data availability, this study uses panel data for 30 Chinese provincial-level regions from 2013 to 2024, excluding Hong Kong, Macao, Taiwan, and Tibet. The data are obtained from the China Statistical Yearbook, the China Urban Statistical Yearbook, the China Urban Construction Statistical Yearbook, the China Energy Statistical Yearbook, the China Torch Statistical Yearbook, and provincial statistical yearbooks. A small number of missing observations are filled using linear interpolation.
5. Results
5.1. Descriptive Statistics
Table 2 reports the descriptive statistics of the variables. Carbon emissions vary considerably across the sample, with lnCE ranging from 17.6684 to 20.8824, indicating that the provincial observations cover markedly different carbon-emission levels rather than clustering around a common baseline. The NI index has a mean of 0.2230 and ranges from 0.0415 to 0.6104. Its distribution toward the lower part of the observed range suggests that, although new infrastructure has developed across provinces, relatively high levels are concentrated in a smaller group of provincial observations. This pattern reflects differences in NI development levels across provinces. The mediating variables provide further information on provincial development conditions. The IS ranges from 0.0110 to 0.5329, indicating substantial differences in the degree of industrial structure rationalization across provinces. Lower IS values indicate better coordination between the sectoral output structure and employment structure, whereas higher IS values suggest that some provinces still exhibit relatively pronounced mismatches between sectoral output and employment structures. The standard deviation of GTI (0.6530) is substantially larger than its mean (0.3177), while the maximum value (6.8369) is far above the mean, suggesting pronounced cross-provincial disparities and a strongly right-skewed distribution of green technological innovation. A relatively small number of provinces exhibit high levels of GTI, whereas most remain at comparatively low levels, indicating substantial regional disparities in green innovation capacity. In addition, the control variables further capture differences in provincial economic development, environmental regulation, population concentration, energy production and consumption structures, urbanization, and industrial development. Such variation provides a substantive empirical basis for examining both the average effect of NI on carbon emissions and the differences in this relationship across provincial development conditions.
Table 2.
Descriptive statistics of the variables.
5.2. Benchmark Regression Analysis
The baseline estimates appear in Table 3. Column (1) gives an NI coefficient of −0.0433 that is not statistically significant. After NI2 is added in column (2), the NI and NI2 coefficients are 1.5543 and −2.4274, and both are statistically significant, providing preliminary evidence of an inverted-U pattern.
Table 3.
Benchmark regression results.
Over the observed NI range, the Sasabuchi–Lind–Mehlum test confirms an inverted-U relationship: the lower-bound slope is 1.3531 (p < 0.01), the upper-bound slope is −1.4091 (p < 0.05), and the null is rejected at the 5% level (Table 4A,B). The turning point is 0.3202 within the observed range of 0.0415–0.6104, and its 95% Fieller interval [0.1869, 0.5121] also lies wholly within that range. H1 is therefore supported.
Table 4.
(A). Test for the existence of an inverted U-shaped relationship between NI and carbon emissions. (B). Overall test of the inverted U-shaped relationship between NI and carbon emissions.
5.3. Endogeneity Test
5.3.1. Instrumental-Variable Estimation
Endogeneity may arise from three sources. First, carbon emissions may in turn influence NI investment decisions, leading to reverse causality. Second, omitted policy, institutional, or other unobserved factors may cause omitted-variable bias. Third, measurement error in the NI index may bias estimates. To address potential endogeneity concerns, following the historical-exposure interaction approach of Nunn and Qian [81] and its subsequent applications to digital development [82,83], this study employs a fixed-effects two-stage least squares (FE-2SLS) approach and constructs two instrumental variables as follows:
where denotes the number of fixed telephones per 100 persons in 1984, denotes the total telecommunications business volume in 2000, and both are standardized across provinces. The two historical base years capture regional communication conditions at different stages of technological development. The year 1984 reflects communication infrastructure formed during the fixed-telephone era, whereas 2000 represents communication conditions at an early stage of Internet and modern telecommunications expansion. Both years substantially predate the study period and the large-scale development of NI. Their historical communication conditions are therefore unlikely to directly determine carbon emissions during the sample period, while they may remain related to subsequent digital-infrastructure development through infrastructure accumulation and technological path dependence. This temporal separation and path-dependence logic provide a basis for the relevance and exogeneity of the historical components of the instruments. and denote the lagged growth shocks in postal and telecommunications business and mobile Internet users, respectively, calculated using the other 29 sample provinces. Previous studies further support this relevance by linking historical communication infrastructure to the subsequent diffusion of Internet and digital technologies [82,83]. Chen et al. [84] similarly construct an instrument by interacting provincial telecommunications business volume in 2000 with lagged mobile Internet users. Both NI and NI2 are treated as endogenous regressors and are jointly instrumented by IV1 and IV2.
The Sanderson–Windmeijer conditional first-stage F statistics for NI and NI2 are 28.50 and 27.05, and the Kleibergen–Paap rk LM statistic rejects underidentification (p = 0.0317). Because two excluded instruments correspond to the two endogenous regressors, the model is exactly identified, and the Hansen J test is inapplicable. The IV estimates retain a positive NI coefficient and a negative NI2 coefficient (Table 5), reducing concern that the benchmark pattern is driven solely by endogeneity.
Table 5.
Instrumental-variable FE-2SLS estimates.
5.3.2. System GMM Estimation
Although FE-2SLS estimation addresses potential reverse causality using external instruments, carbon emissions may exhibit dynamic dependence that the static panel specification cannot capture. Therefore, a two-step System GMM estimator is further employed as a complementary endogeneity test. The model is as follows:
System GMM combines equations in first differences and levels and uses lagged variables as internal instruments in dynamic panel estimation [85]. In this study, lnCE, lnPGDP, ECS, and lnPS are instrumented internally using their second-order lags. NI, NI2, lnFDI, lnER, lnIR, EPS, and the year dummies are entered as standard instruments. To control the number of instruments, only second-order lags are used to construct the internal instruments, and the instrument matrix is collapsed. This specification yields 25 instruments, fewer than the 30 provinces in the sample, thereby reducing the risk of instrument proliferation [86].
Table 6 reports the System GMM results. The coefficient of the lagged dependent variable is positive and significant, indicating clear temporal dependence in carbon emissions. NI remains significantly positive, while NI2 remains significantly negative. The AR(1) is significant, whereas the AR(2) is not significant (p = 0.7312), indicating no evidence of second-order serial correlation. The Hansen test yields a p-value of 0.4856, and the Difference-in-Hansen test for the tested GMM instrument subset yields a p-value of 0.313; neither test rejects instrument validity. Overall, these results support the System GMM specification and confirm that the nonlinear relationship remains after considering the dynamic behavior of carbon emissions.
Table 6.
System GMM estimates and diagnostic tests.
5.4. Robustness Tests
5.4.1. Alternative Measurement of NI
The benchmark NI index uses the entropy-weighted method, so we assess whether the aggregation rule influences the estimates. For the PCA-based NI index, Table 7 shows that the PCA-based linear term is positive and the squared term negative. The nonlinear pattern is therefore retained when the index construction method changes.
Table 7.
Robustness test using an alternative measure of NI.
5.4.2. Further Robustness Tests
Several additional robustness checks are conducted. First, the dependent variable is redefined as the logarithm of carbon emissions per capita. Second, the dependent variable, NI, and all controls are Winsorized at the 1% tails, and NI2 is recalculated accordingly. Third, the four centrally administered municipalities of Beijing, Tianjin, Shanghai, and Chongqing are excluded to account for their distinctive administrative status. Fourth, the 2013 observations are excluded from the sample. Fifth, NI and NI2 are lagged by one period. Across the specifications in Table 8, the signs and statistical pattern of NI and NI2 still match the benchmark estimates.
Table 8.
Further robustness test results.
5.5. Heterogeneity Analysis
To examine regional heterogeneity, the sample is divided into eastern, central, western, and northeastern regions according to the regional classification of the National Bureau of Statistics of China (NBS) [87], as shown in Table 9. Table 10 reports regional heterogeneity analysis results. For central China, the linear term is positive, and the squared term is negative. A similar inverted-U pattern is observed in the western region. By contrast, neither NI nor NI2 is statistically significant in eastern and northeastern China. In Table 11a, a joint Wald test further rejects the null hypothesis that the coefficients of NI and NI2 are equal across the four regions (F = 12.21, p < 0.001), providing statistical evidence of regional heterogeneity.
Table 9.
Regional classification.
Table 10.
Regional heterogeneity analysis.
Table 11.
(a) Joint Wald test for regional heterogeneity. (b) Estimated regional turning points and observed NI ranges.
The turning points are 0.1805 for central China and 0.2466 for western China, and both lie within their respective observed NI ranges (Table 11b). The mean NI level in central China is 0.2271, which has already exceeded its estimated turning point, whereas the mean NI level in western China is 0.1481, still below its turning point. Evaluated at these means, a 10% rise in NI corresponds to a 0.92% decline in central-region emissions (p = 0.003). In the western region, the corresponding estimated change is a 1.46% increase and is not statistically significant (p = 0.222). The corresponding estimated changes are approximately 0.15% in eastern China and 1.56% in northeastern China. These results show that regional heterogeneity is reflected not only in coefficient significance, but also in the stage of NI development.
Differences in industrial composition, energy endowments, and NI maturity may account for the regional pattern. In the central region, the strong manufacturing base, particularly in equipment manufacturing and related industries, provides considerable scope for NI to improve production efficiency through digitalization and intelligent upgrading. As the average NI level has already exceeded the estimated turning point, these efficiency gains are increasingly reflected in emission reduction. In the western region, resource-based industries remain important in many provinces despite abundant renewable-energy resources. The expansion of data centers, communication networks, and other NI-related activities increases electricity demand, while the efficiency gains from the digital transformation of traditional industries are realized more slowly. As a result, additional energy demand still outweighs these efficiency gains, helping to explain why the western region remains on the rising segment of the estimated inverted U-shaped relationship. In the eastern region, advanced manufacturing and digital industries are more concentrated, and NI development is relatively mature. The insignificant relationship therefore suggests that further increases in NI scale generate limited additional carbon effects, with its contribution increasingly depending on deeper integration with production and more efficient use. Northeastern China retains a comparatively large concentration of industries in equipment manufacturing, energy production, and raw-material processing. Its established industrial and energy structure can limit how much NI translates into carbon-efficiency improvements.
5.6. Mechanism Analysis
Table 12 reports the mediation analysis, with column (1) retaining the benchmark results, columns (2)–(3) examining the mediating role of industrial structure rationalization, and columns (4)–(5) examining that of green technological innovation.
Table 12.
Mechanism analysis results.
- (1)
- Industrial structure rationalization
Column (2) shows that NI has a significantly negative coefficient, and NI2 is significantly positive. Since a lower IS value indicates a more rational industrial structure, this pattern implies that industrial structure rationalization initially improves but subsequently deteriorates as NI development increases. At relatively low levels of NI, enhanced inter-industry information connectivity and more efficient factor mobility can reduce resource misallocation and coordination costs, thereby lowering IS and improving structural rationalization. Beyond a certain level of NI development, however, excessive NI expansion may lead to an increasing concentration of digital capital and other resources in high-technology and digitally intensive industries. Traditional industries may simultaneously face greater technological barriers and crowding-out effects, which can widen inter-industry development disparities and increase the difficulty of coordinating output and employment across sectors. As a result, IS rises, indicating a deterioration in industrial structure rationalization.
After incorporating IS, its coefficient in column (3) is significantly negative. This implies that higher IS is related to lower total carbon emissions. The Theil index captures the coordination between sectoral output and employment rather than whether production shifts toward low-carbon sectors. A lower index may therefore reflect reduced factor misallocation and improved production coordination, which can increase production efficiency but also support output expansion and higher energy demand. Because the dependent variable is total carbon emissions, the scale effect associated with expanded economic activity may outweigh the emission-reduction effect of improved efficiency.
Combining this result with column (2) further clarifies the mediating pattern. At relatively low levels of NI, NI reduces the Theil index and improves industrial structure rationalization. Because a lower Theil index is associated with higher total carbon emissions, this pathway generates an emission-increasing indirect effect. Beyond the turning point, however, further NI development is associated with a higher Theil-based IS index and weaker industrial structure rationalization. Given the negative association between IS and lnCE, the estimated indirect effect through IS correspondingly changes from positive to negative. Therefore, industrial structure rationalization contributes to the nonlinear carbon-emission effect of NI through a stage-dependent mediating process. This evidence supports H2.
- (2)
- Green technological innovation
Columns (4) and (5) report the results for GTI. Column (4) shows that the coefficient of NI is significantly negative, whereas that of NI2 is significantly positive. At relatively low levels of NI development, resource crowding out may inhibit green technological innovation, as substantial investment in NI construction can compete with R&D activities for capital and other innovation resources. However, as NI development advances, improved digital connectivity, knowledge diffusion, and technological accumulation can gradually strengthen the supporting conditions for green innovation.
In column (5), GTI has a coefficient of −0.3043. Meanwhile, the coefficients of NI and NI2 remain significantly positive and negative, respectively, after including GTI. Taken together, the results suggest that the mediating pattern through GTI varies across stages of NI development. At relatively low levels of NI, further increases in NI are associated with declining GTI, which is in turn associated with higher carbon emissions. Beyond the turning point, further increases in NI are associated with rising GTI, which is associated with lower carbon emissions. Thus, GTI provides a mediating mechanism consistent with the nonlinear carbon-emission effect of NI, supporting H3.
To further evaluate the statistical significance of the indirect effects, Monte Carlo simulations with 20,000 replications are conducted. This simulation-based approach avoids relying on the normality assumption for the product of coefficients and has been widely used to evaluate indirect effects in mediation analysis [88]. The 90% percentile confidence intervals for the indirect effects of NI and NI2 through IS are [0.0943, 0.5851] and [−0.5049, −0.1103], respectively (Table 13). For GTI, the corresponding intervals are [0.0293, 0.6882] and [−0.9753, −0.0465]. All four intervals exclude zero, providing further evidence that IS and GTI mediate the relationship at the 10% significance level.
Table 13.
Monte Carlo confidence intervals for indirect effects.
In order to further address the potential contemporaneous determination of the mediators and carbon emissions, Table 14 replaces contemporaneous IS and GTI with their one-period-lagged values. The coefficients of ISt−1 and GTIt−1 remain significantly negative, while the signs of NI and NI2 are consistent with the contemporaneous estimates. The identified relationships are not solely driven by contemporaneous co-movement. The consistency of these estimates provides additional support for the mechanism results when temporal ordering is taken into account. Together with the Monte Carlo tests, these findings further support the mediating roles of IS and GTI in the nonlinear relationship between NI and carbon emissions.
Table 14.
Lagged-mediator robustness test.
5.7. Spatial Spillover Effects
To examine whether the carbon-emission effects of NI extend beyond provincial boundaries, the SDM is estimated using the economic–geographic nested weight matrix. As shown in Table 15, the coefficients and are 1.5916 and −2.5599. This shows that the inverted U-shaped relationship remains after spatial interactions are incorporated. The coefficients of the spatially lagged terms W × NI and W × NI2 are significantly positive and negative, respectively, suggesting that changes in NI development are associated with local carbon emissions and carbon emissions in connected provinces. During the early stage of NI development, its expansion is associated with higher carbon emissions in spatially connected provinces, possibly because the construction and operation of NI increase demand for electricity, equipment, and intermediate inputs supplied through interprovincial production and energy networks. As NI development advances, stronger digital connectivity and technological diffusion can improve cross-regional resource allocation and production coordination, gradually strengthening the emission-reduction effect across provincial boundaries.
Table 15.
Spatial Durbin model estimation results.
In Table 16, the direct effects of NI and NI2 are 1.5753 and −2.5396, while the corresponding indirect effects are 3.5455 and −4.4284, all of which are statistically significant. The total effects show the same positive linear and negative quadratic pattern. NI’s influence on carbon emissions is not confined to the local province, as its indirect effect shows a similar nonlinear pattern across regions. This evidence is consistent with H4. The corresponding turning points for the direct and indirect effects are approximately 0.310 and 0.400. The higher threshold associated with the indirect effect means that the cross-regional influence of NI shifts from emission-increasing to emission-reducing only at a more advanced stage of NI development than its local influence does. This suggests that the benefits of improved efficiency and technological progress may emerge first within the province and require a higher level of NI development before being transmitted more broadly through interregional economic linkages.
Table 16.
Direct, indirect, and total effects from the spatial Durbin model.
5.8. Prediction of Carbon Emissions Under Different Scenarios
Given the relatively short time span of the provincial panel data, a time-ordered expanding-window validation strategy was adopted to make efficient use of the available observations while preserving the temporal data structure. The model was first trained using data from 2013–2018 and validated using data from 2019. The training sample was then expanded to 2013–2019 and 2013–2020, with 2020 and 2021 used as the corresponding validation years. After hyperparameter selection, the model was trained on 2013–2021 and evaluated using 2022–2024 as an independent test period. This procedure corresponds to three-fold rolling-origin cross-validation with an expanding training window. For hyperparameter optimization, the search ranges were set to , , and . The optimization was conducted in logarithmic parameter space using 32 particles and a maximum of 60 iterations, with the mean validation root mean square error (RMSE) across the rolling-validation folds used as the fitness function. Under these settings, PSO identified the optimal parameter combination of , , and .
Table 17 compares PSO-SVR with conventional SVR, Random Forest, and multilayer perceptron (MLP). PSO-SVR achieved the lowest RMSE in both expanding-window validation (0.1142) and the independent test (0.1239), compared with 0.2049 and 0.2339 for SVR, 0.1924 and 0.2002 for Random Forest, and 0.3042 and 0.2724 for MLP, respectively. It also obtained the highest R2 values of 0.9761 and 0.9725. These results indicate comparatively strong out-of-sample predictive performance and support the use of PSO-SVR for the subsequent scenario prediction.
Table 17.
Predictive performance of alternative forecasting models.
As shown in Figure 3, aggregate carbon emissions across the 30 sampled provinces eventually decline under all four scenarios, although the timing and magnitude of the emission peak differ substantially. The contrast between S1 (baseline) and S2 (rapid NI development) is particularly informative. Compared with S1, faster NI development under S2 creates greater near-term carbon pressure and higher emissions in the early years of the prediction period. Thereafter, the gap between the two scenarios gradually narrows, and emissions under S2 eventually fall below those under S1. This comparison indicates that accelerating NI development increases near-term carbon pressure but delivers greater emission-reduction benefits over the medium and long term. These results suggest that advancing NI development can unlock greater long-term carbon-mitigation potential, although its near-term emission pressure should also be considered.
Figure 3.
Predicted carbon emissions under different new-type infrastructure construction scenarios.
A different pattern emerges under S3 (green transition). Faster improvements in energy consumption structure, energy production structure, and environmental regulation lead to an earlier and lower emission peak, with emissions remaining below the other scenarios thereafter. Faster declines in coal consumption intensity and in the thermal-power share reduce the carbon intensity of energy supply, allowing the additional energy demand associated with economic and digital development to be met with lower emissions. The results indicate that strengthening the energy system’s low-carbon transition can produce substantial emission reductions over the prediction period.
S4 (coordinated development) reflects the trade-off between accelerating NI development and advancing the low-carbon transition. Faster NI expansion supports digitalization and infrastructure upgrading but also increases investment, equipment deployment, and electricity demand, creating additional near-term carbon pressure. Improvements in the energy system and environmental governance offset part of this pressure and promote a subsequent decline in emissions. As a result, emissions under S4 remain higher than under S3, which places greater emphasis on emission reduction. This suggests that faster NI development may entail short-term carbon costs, and realizing its benefits while containing emissions requires continued progress in energy decarbonization and environmental governance.
6. Discussion
6.1. Discussion of the Results
By jointly considering nonlinear effects, mediating mechanisms, regional and spatial heterogeneity, and forward-looking scenarios, the findings provide a more differentiated explanation of why the carbon consequences of NI vary across development stages and regional contexts.
- (i)
- This study confirms a robust inverted U-shaped relationship between NI construction and carbon emissions. Liu et al. [15] report similar nonlinear effects for NI and regional carbon intensity. Other studies have reported either positive or negative effects. Tang and Yang [89] find that digital infrastructure increases total emissions and carbon intensity, whereas Peng et al. [90] show a carbon-reduction effect. These studies focus mainly on narrower forms of digital infrastructure, while the present study measures NI more broadly through information, converged, and innovation infrastructure and explicitly considers nonlinearity. Studies using efficiency-oriented carbon indicators also reach different conclusions. Chang et al. [18] and Liu et al. [16] find that NI improves total factor carbon productivity. This difference is partly related to the dependent variable, as higher carbon productivity can coexist with rising total emissions when economic output expands. Overall, differences in infrastructure measurement, carbon indicators, and model specification help explain the mixed findings in previous studies.
- (ii)
- The mechanism analysis further reveals that the transmission of NI effects is not uniformly emission-reducing. This is particularly evident for industrial structure. Previous studies generally associate digital infrastructure with lower carbon intensity through industrial upgrading or structural optimization [57,90], whereas the industrial-structure pathway identified here is nonlinear. One important reason is that the present Theil index measures industrial structure rationalization rather than structural upgrading toward less carbon-intensive sectors. Improved coordination between output and factor allocation can reduce misallocation and expand effective production, which may increase total emissions even when production becomes more efficient. Thus, the result does not necessarily contradict studies based on carbon intensity or industrial upgrading, but instead highlights the distinction between structural rationalization, structural upgrading, and their effects on total carbon emissions. Green technological innovation also exhibits a nonlinear indirect effect, suggesting that its emission-reduction role becomes more evident only after NI reaches a sufficient level of development. This is broadly consistent with studies identifying green innovation as an important pathway linking digital infrastructure and carbon mitigation [91].
- (iii)
- The regional heterogeneity analysis shows that the inverted U-shaped relationship between NI and carbon emissions is significant in central and western China, but not in eastern and northeastern China. This finding is not fully consistent with some existing studies. Zheng et al. [92] found that the nonlinear relationship between digitalization and carbon emissions was more pronounced in eastern cities, whereas Zhang et al. [57] reported greater reductions in carbon intensity associated with digital infrastructure in eastern and central cities. These differences may arise from differences in the scope of measurement. Existing studies have largely focused on broader measures of digitalization or digital infrastructure, whereas the NI index used in this study encompasses three dimensions: information infrastructure, converged infrastructure, and innovation infrastructure, whose development stages and effects differ across regions. In eastern China, digital infrastructure developed relatively early and has reached a comparatively high level of penetration, meaning that further NI expansion may generate weaker marginal carbon effects and a less pronounced nonlinear relationship. In northeastern China, by contrast, the continued importance of traditional manufacturing and resource-based industries may constrain the extent to which NI development is translated into improvements in carbon efficiency, which may also contribute to the insignificant nonlinear relationship. In addition, the regional estimates further reveal the underlying logic behind the differentiated carbon effects of NI expansion across regions in China. Under the inverted U-shaped relationship, the carbon effect of NI depends on the position of a region’s NI level relative to the turning point. The mean NI level in central China has already exceeded the NI level corresponding to the peak of the inverted U-shaped curve, indicating that further NI development will lead to emission reductions. The mean NI level in western China remains below the turning point; therefore, further NI development still exhibits an emission-increasing effect. In eastern and northeastern China, the nonlinear relationship is not statistically significant, indicating that NI expansion does not exhibit the same stage-dependent carbon response as in central and western China.
- (iv)
- The spatial analysis shows that the carbon effects of NI also extend to spatially connected regions, consistent with previous evidence on the cross-regional carbon effects of digital development [93,94]. The turning point of the indirect effect is higher than that of the direct effect, indicating that the spillover effect shifts from emission-increasing to emission-reducing only at a higher level of NI development than the local effect. In practice, this means that a province may already experience local emission reductions while connected regions still face additional carbon pressure. Therefore, evaluating NI policy solely on local outcomes may overstate its overall regional benefits, and NI planning should account for cross-provincial linkages and differences in development stages. Beyond these spatial effects, the scenario analysis further examines how carbon emissions may evolve under different NI development and low-carbon transition pathways. The scenario analysis provides a forward-looking perspective: rapid NI development creates greater near-term carbon pressure but lower emissions later in the prediction period, while the green-transition scenario achieves the earliest and lowest emission peak. The coordinated-development scenario further reflects the trade-off between accelerating NI development and advancing the low-carbon transition. These results align with broader ICT research showing that digitalization’s carbon-reduction potential depends on whether efficiency gains outweigh additional energy demand and rebound effects [95,96].
6.2. Theoretical Contributions
- (i)
- This study extends the stage-dependent logic of the EKC from the conventional economic growth–environment relationship to the environmental consequences of new-type infrastructure development. Existing EKC research has primarily examined how environmental quality changes with economic development, while relatively limited attention has been paid to whether the environmental effects of specific types of infrastructure also vary across development stages. By conceptualizing the carbon effects of NI as the outcome of a changing balance among scale expansion, energy demand, efficiency gains, and technological progress, this study extends the EKC perspective to digital-oriented infrastructure.
- (ii)
- This study moves beyond the conventional view of NI as a single technological input and deepens the theoretical understanding of the mechanisms through which NI affects carbon emissions. IS and GTI are incorporated into a stage-dependent mechanism framework, recognizing that these mediating mechanisms may operate differently at different levels of NI development. This perspective helps explain why the structural and technological benefits associated with NI may emerge progressively rather than immediately with infrastructure expansion, thereby enriching the theoretical understanding of how NI influences carbon emissions.
- (iii)
- This study extends the analysis of NI’s carbon effects from an isolated regional perspective to a spatially interconnected framework. By incorporating regional heterogeneity and spatial interdependence into an integrated analytical framework, this study emphasizes that the environmental effects of NI depend on local development conditions and cross-regional linkages in information, technology, production, and energy systems. This spatial perspective provides a basis for understanding why the carbon effects of NI vary across regions and extend beyond administrative boundaries.
6.3. Management Implications
The findings have management implications for effectively addressing the environmental impacts of NI construction and for promoting a coordinated transition toward digitalization and green development.
- (i)
- Given the inverted U-shaped effect of NI construction on carbon emissions in China, which first increases and then reduces emissions, policymakers should dynamically adjust their policy priorities according to the development stage of NI. Before the turning point, policy efforts should focus on energy-consumption constraints and green access standards to prevent excessive emissions growth. After the turning point, attention should shift toward consolidating emission-reduction outcomes and releasing green dividends through technological spillovers and structural optimization.
- (ii)
- Regional NI strategies should reflect differences in the development stage and industrial–energy conditions. In central China, the focus should be on converting existing NI capacity into productivity and efficiency gains. In the western region, NI expansion should be coordinated with energy restructuring and the low-carbon upgrading of resource-intensive industries. In northeast China, NI should be used more actively to support the digital and low-carbon transformation of traditional industries, improving the efficiency of existing industrial capacity rather than reinforcing carbon-intensive development paths. In the more mature eastern region, policy should focus on system integration, utilization efficiency, and deeper decarbonization rather than continued scale expansion.
- (iii)
- NI planning should be coordinated with industrial restructuring, green technological innovation, and the low-carbon transition of the energy system. The mediation results show that IS and GTI are important channels. NI investment should therefore be accompanied by measures that facilitate the reallocation of resources toward more efficient and lower-carbon activities and strengthen incentives for green R&D and technology diffusion. Meanwhile, the scenario results indicate that these benefits are more likely to materialize when the supporting energy system becomes cleaner, particularly for electricity-intensive digital infrastructure. Coordinating NI development with industrial, innovation, and energy-transition policies can therefore reduce the risk that infrastructure expansion outpaces the structural and technological changes required for carbon mitigation.
- (iv)
- Carbon governance for NI should extend beyond provincial administrative boundaries. The carbon consequences of NI development can extend across regions through electricity flows, industrial linkages, and technology diffusion. Major NI projects should therefore be evaluated from both local and interregional perspectives to account for their potential cross-regional carbon effects. Strengthening cross-regional coordination can better align NI investment with broader carbon-mitigation objectives.
7. Conclusions
Using observations for 30 Chinese provincial-level regions over 2013–2024, the analysis evaluates the nonlinear, mediating, regional, spatial, and prospective carbon consequences of NI construction. The main findings are as follows. (i) NI construction has a significant inverted U-shaped relationship with carbon emissions and reaches its turning point at 0.320. (ii) Industrial structure rationalization and green technological innovation both mediate this nonlinear relationship, although their effects are stage-dependent rather than uniformly emission-reducing. (iii) The effect of NI construction on carbon emissions exhibits significant regional heterogeneity. In central and western China, NI construction has an inverted U-shaped effect on carbon emissions, whereas this nonlinear effect is not significant in the eastern and northeastern regions. (iv) The spatial Durbin model reveals significant nonlinear spatial spillover effects of NI on carbon emissions. The local effect of NI shifts from emission-increasing to emission-reducing at a lower level of NI development than its spillover effect on spatially connected regions. (v) Scenario predictions indicate that carbon emissions eventually decline under all four scenarios. The green-transition scenario reaches the earliest and lowest emission peak, whereas the rapid-NI-development scenario generates greater near-term carbon pressure.
Although this study reports several meaningful findings, some limitations remain and should be further addressed in future research. First, although the FE-2SLS and System GMM estimations help to alleviate concerns about reverse causality and omitted-variable bias to some extent, they cannot completely rule out time-varying confounding factors or establish unambiguous causal identification. The mediation analysis focuses primarily on two mediating variables, industrial structure rationalization and green technological innovation, and its estimates should not be interpreted as a complete validation of causal mechanisms. Future research could exploit policy shocks or quasi-natural experiments related to innovation or digital strategies to strengthen causal identification, and adopt more rigorous causal mediation designs to examine other potential transmission channels, such as energy-efficiency improvement, market-based resource allocation, and green finance development. Second, the analysis relies on province-level panel observations for China, which may overlook spatial variations within individual provinces. Extending the analysis to finer geographic units, such as cities or counties, and applying multi-scale spatial approaches could help reveal more localized patterns of carbon-emission transmission beyond the interprovincial spillovers captured by the SDM. Third, the scenario analysis is constrained by the availability of historically consistent provincial-level predictors. Key factors such as electricity carbon intensity, data-center energy efficiency, energy price dynamics, explicit industrial restructuring policies, and discrete climate policy shocks are not separately modeled. Future research could incorporate these factors with extended time-series data to more comprehensively characterize transition pathways and more systematically quantify prediction uncertainties.
Supplementary Materials
The following supporting information can be downloaded at: https://www.mdpi.com/article/10.3390/systems14091169/s1, Table S1. Numerical parameter settings for the four scenarios. Table S2. Indicators and weights of new infrastructure. Section S1. Calculation of the integration coefficient and converged infrastructure.
Author Contributions
Conceptualization, M.C. (Mengdie Chen), M.C. (Min Cheng) and X.W.; Methodology, M.C. (Mengdie Chen); Validation, M.C. (Mengdie Chen), M.C. (Min Cheng) and F.W.; Formal Analysis, X.W.; Investigation, M.C. (Min Cheng) and X.W.; Resources, M.C. (Mengdie Chen) and M.C. (Min Cheng); Data Curation, M.C. (Mengdie Chen), M.C. (Min Cheng) and X.W.; Writing—Original Draft Preparation, M.C. (Mengdie Chen) and X.W.; Writing—Review and Editing, M.C. (Mengdie Chen), M.C. (Min Cheng) and F.W.; Visualization, M.C. (Mengdie Chen) and X.W.; Supervision, M.C. (Min Cheng) and F.W.; Project Administration, M.C. (Min Cheng). All authors have read and agreed to the published version of the manuscript.
Funding
This work was supported by the National Social Science Fund of China under Grant No. 22BJY232.
Institutional Review Board Statement
Not applicable.
Informed Consent Statement
Not applicable.
Data Availability Statement
Data generated or analyzed during this study are available from the corresponding author upon reasonable request.
Conflicts of Interest
The authors declare no conflicts of interest.
References
- National Development and Reform Commission of China. What Does New-Type Infrastructure Mainly Include, and What Are the Next Plans for Supporting Its Development? 2020. Available online: https://www.ndrc.gov.cn/fggz/fgzy/shgqhy/202004/t20200427_1226808.html (accessed on 13 August 2026).
- Goldfarb, A.; Tucker, C. Digital economics. J. Econ. Lit. 2019, 57, 3–43. [Google Scholar] [CrossRef] [Scilit]
- Brynjolfsson, E.; Hitt, L.M. Beyond computation: Information technology, organizational transformation and business performance. J. Econ. Perspect. 2000, 14, 23–48. [Google Scholar] [CrossRef] [Scilit]
- Masanet, E.; Shehabi, A.; Lei, N.; Smith, S.; Koomey, J. Recalibrating global data center energy-use estimates. Science 2020, 367, 984–986. [Google Scholar] [CrossRef] [Scilit] [PubMed]
- Peng, H.; Zhang, Y.; Liu, J. The energy rebound effect of digital development: Evidence from 285 cities in China. Energy 2023, 270, 126837. [Google Scholar] [CrossRef] [Scilit]
- Peng, H.; Qin, X. Digitalization as a trigger for a rebound effect of electricity use. Energy 2024, 300, 131585. [Google Scholar] [CrossRef] [Scilit]
- Ren, H.; Zhou, J.; Yu, Y.; Ye, M. Carbon emission reduction effects of digital infrastructure construction development: The broadband China strategy as a quasi-natural experiment. Front. Environ. Sci. 2025, 13, 1510118. [Google Scholar] [CrossRef] [Scilit]
- Du, Y.; Li, M. Research on the impact of digital infrastructure construction on enterprise carbon emissions. Sci. Rep. 2025, 15, 29989, Correction in Sci. Rep. 2025, 15, 35583. [Google Scholar] [CrossRef] [Scilit] [PubMed]
- Fang, H.; Iqbal, K. Information and communication technology, upgrading of industrial structure and spatial spillover effect. Sci. Rep. 2025, 15, 18340. [Google Scholar] [CrossRef] [Scilit] [PubMed]
- Czernich, N.; Falck, O.; Kretschmer, T.; Woessmann, L. Broadband infrastructure and economic growth. Econ. J. 2011, 121, 505–532. [Google Scholar] [CrossRef] [Scilit]
- Niebel, T. ICT and economic growth—Comparing developing, emerging and developed countries. World Dev. 2018, 104, 197–211. [Google Scholar] [CrossRef] [Scilit]
- Mitra, A.; Sharma, C.; Véganzonès-Varoudakis, M.-A. Infrastructure, information & communication technology and firms’ productive performance of the Indian manufacturing. J. Policy Model. 2016, 38, 353–371. [Google Scholar] [CrossRef] [Scilit]
- Roller, L.H.; Waverman, L. Telecommunications infrastructure and economic development: A simultaneous approach. Am. Econ. Rev. 2001, 91, 909–923. [Google Scholar] [CrossRef] [Scilit]
- Wei, M.; Yin, X. Broadband infrastructure and urban carbon emissions: Quasi-experimental evidence from China. Urban Clim. 2024, 54, 101863. [Google Scholar] [CrossRef] [Scilit]
- Liu, B.; Nie, B.; Wang, Y.; Han, X.; Li, Y. Does new infrastructure affect regional carbon intensity? Empirical evidence from China. Sustainability 2023, 15, 16842. [Google Scholar] [CrossRef] [Scilit]
- Liu, Y.; Wang, Y.; Yan, B.; Zhang, H. The impact of new infrastructure development on urban total factor carbon productivity-empirical evidence based on Chinese cities. Front. Environ. Sci. 2024, 12, 1432534. [Google Scholar] [CrossRef] [Scilit]
- Wu, X.; Huang, X.; Zhong, P. Measurement and coupling mechanism of the coupling and coordinated development of new infrastructure construction and strategic emerging industries. Sci. Geogr. Sin. 2021, 41, 1969–1979. (In Chinese) [Google Scholar] [CrossRef]
- Chang, X.; Li, J.; Zheng, Q. Does new-type infrastructure improve total factor carbon productivity? Experimental evidence from China. J. Clean. Prod. 2024, 460, 142620. [Google Scholar] [CrossRef] [Scilit]
- Gu, B.; Liao, L. Measurement and spatial-temporal pattern evolution of the coupling and coordination level between new infrastructure investment and technological innovation capability. Sci. Technol. Prog. Policy 2023, 40, 60–70. (In Chinese) [Google Scholar] [CrossRef]
- Su, W.; Li, X.; Zhang, Y.; Zhang, Q.; Wang, T.; Magdziarczyk, M.; Smolinski, A. High-speed rail, technological improvement, and carbon emission efficiency. Transp. Res. Part D Transp. Environ. 2025, 142, 104685. [Google Scholar] [CrossRef] [Scilit]
- Zhu, J.; Guo, H. Does the development of high-speed rail benefit carbon emissions reduction? Transp. Policy 2025, 172, 103758. [Google Scholar] [CrossRef] [Scilit]
- Li, J.; Li, S. Study on the impact of population migration on transport carbon emissions. Transp. Policy 2026, 178, 103957. [Google Scholar] [CrossRef] [Scilit]
- Ibrahiem, D.M. Do technological innovations and financial development improve environmental quality in Egypt? Environ. Sci. Pollut. Res. 2020, 27, 10869–10881. [Google Scholar] [CrossRef] [Scilit] [PubMed]
- Guo, Y.; Li, X.; Li, S. Green technology innovation and carbon emission performance of the middle reaches of the Yangtze River urban agglomeration: Mechanism and spatio-temporal evolution. Energies 2024, 17, 5274. [Google Scholar] [CrossRef] [Scilit]
- Wang, W.; Liu, L.; Liao, H.; Wei, Y. Impacts of urbanization on carbon emissions: An empirical analysis from OECD countries. Energy Policy 2021, 151, 112171. [Google Scholar] [CrossRef] [Scilit]
- Ai, H.; Tan, X.; Zhou, S.; Zhou, Y.; Xing, H. The impact of environmental regulation on carbon emissions: Evidence from China. Econ. Anal. Policy 2023, 80, 1067–1079. [Google Scholar] [CrossRef] [Scilit]
- Zhang, C.; Fang, J.; Ge, S.; Sun, G. Research on the impact of enterprise digital transformation on carbon emissions in the manufacturing industry. Int. Rev. Econ. Financ. 2024, 92, 211–227. [Google Scholar] [CrossRef] [Scilit]
- Zhao, B.; Yang, W. Carbon emissions forecasting based on a new hybrid model under carbon reduction target: A case study of eastern region in China. J. Clean. Prod. 2025, 494, 144957. [Google Scholar] [CrossRef] [Scilit]
- Niu, D.; Wang, K.; Wu, J.; Sun, L.; Liang, Y.; Xu, X.; Yang, X. Can China achieve its 2030 carbon emissions commitment? Scenario analysis based on an improved general regression neural network. J. Clean. Prod. 2020, 243, 118558. [Google Scholar] [CrossRef] [Scilit]
- Breiman, L. Random Forests. Mach. Learn. 2001, 45, 5–32. [Google Scholar] [CrossRef] [Scilit]
- Ding, Y.; Li, Y.; Zheng, H.; Mei, M.; Liu, N. A graph-factor-based random forest model for assessing and predicting carbon emission patterns—Pearl River Delta urban agglomeration. J. Clean. Prod. 2024, 469, 143220. [Google Scholar] [CrossRef] [Scilit]
- Cortes, C.; Vapnik, V. Support-vector networks. Mach. Learn. 1995, 20, 273–297. [Google Scholar] [CrossRef] [Scilit]
- Yan, Y.; Feng, H.; Song, J.; Zhang, S.; Zhang, S.; He, Q. A data decomposition and end-to-end optimization-based monthly carbon emission intensity of electricity forecasting method. Int. Trans. Electr. Energy Syst. 2025, 2025, 9159507. [Google Scholar] [CrossRef] [Scilit]
- Chu, X.; Zhao, R. A building carbon emission prediction model by PSO-SVR method under multi-criteria evaluation. J. Intell. Fuzzy Syst. 2021, 41, 7473–7484. [Google Scholar] [CrossRef] [Scilit]
- Duinker, P.N.; Greig, L.A. Scenario analysis in environmental impact assessment: Improving explorations of the future. Environ. Impact Assess. Rev. 2007, 27, 206–219. [Google Scholar] [CrossRef] [Scilit]
- Zheng, Z.; Shuang, Q. Scenario analysis under climate extreme of carbon peaking and neutrality in China: A hybrid interpretable machine learning model prediction. J. Clean. Prod. 2025, 495, 145086. [Google Scholar] [CrossRef] [Scilit]
- Dinda, S. Environmental Kuznets curve hypothesis: A survey. Ecol. Econ. 2004, 49, 431–455. [Google Scholar] [CrossRef] [Scilit]
- Grossman, G.M.; Krueger, A.B. Environmental Impacts of a North American Free Trade Agreement; NBER Working Paper No. 3914; National Bureau of Economic Research: Cambridge, MA, USA, 1991. [Google Scholar] [CrossRef] [Scilit]
- Arrow, K.; Bolin, B.; Costanza, R.; Dasgupta, P.; Folke, C.; Holling, C.S.; Jansson, B.-O.; Levin, S.; Mäler, K.-G.; Perrings, C.; et al. Economic growth, carrying capacity, and the environment. Ecol. Econ. 1995, 15, 91–95. [Google Scholar] [CrossRef] [Scilit]
- Guo, J.; Wang, L.; Zhou, W.; Wei, C. Powering green digitalization: Evidence from 5G network infrastructure in China. Resour. Conserv. Recycl. 2022, 182, 106286. [Google Scholar] [CrossRef] [Scilit]
- Han, T.; Wang, Y.; Mi, Z.; Han, K.; Tian, J.; Wei, Y. Designing and regulating clean energy data centres. Nat. Rev. Clean Technol. 2025, 1, 373–374. [Google Scholar] [CrossRef] [Scilit]
- Huang, C.; Lin, B. The impact of digital economy on energy rebound effect in China: A stochastic energy demand frontier approach. Energy Policy 2025, 196, 114418. [Google Scholar] [CrossRef] [Scilit]
- Meng, S.; Xu, X. Can digital infrastructure improve corporate productivity? Evidence from a quasi-natural experiment in China. Econ. Anal. Policy 2025, 85, 1867–1884. [Google Scholar] [CrossRef] [Scilit]
- Nie, C.; Xie, L.; Feng, Y. The digital path to carbon neutrality: Examining the carbon abatement effect of digital place-based policy in China. Energy Econ. 2025, 147, 108537. [Google Scholar] [CrossRef] [Scilit]
- Ji, J.; Wang, Y. The impact of digital infrastructure on the geographical supply chain layout of firms—Evidence from Chinese microdata. China Econ. Rev. 2024, 87, 102249. [Google Scholar] [CrossRef] [Scilit]
- Yin, Z.; Fan, R.; Wang, Y.; Yang, L. Sustainable digital infrastructure and firm-level energy consumption: Evidence from China’s manufacturing sector. Energy 2026, 356, 141277. [Google Scholar] [CrossRef] [Scilit]
- Gong, M.; Zeng, Y.; Zhang, F. New infrastructure, optimization of resource allocation and upgrading of industrial structure. Financ. Res. Lett. 2023, 54, 103754. [Google Scholar] [CrossRef] [Scilit]
- Wu, W.; Ji, Z.; Liang, H. The Impact of new infrastructure construction on optimization and upgrading of industrial structure. Buildings 2023, 13, 2580. [Google Scholar] [CrossRef] [Scilit]
- Hu, L.; Yuan, W.; Jiang, J.; Ma, T.; Zhu, S. Asymmetric effects of industrial structure rationalization on carbon emissions: Evidence from thirty Chinese provinces. J. Clean. Prod. 2023, 428, 139347. [Google Scholar] [CrossRef] [Scilit]
- Tao, M.; Poletti, S.; Wen, L.; Sheng, M.S. Modelling the role of industrial structure adjustment on China’s energy efficiency: Insights from technology innovation. J. Clean. Prod. 2024, 441, 140861. [Google Scholar] [CrossRef] [Scilit]
- Adner, R. Match your innovation strategy to your innovation ecosystem. Harv. Bus. Rev. 2006, 84, 98–107. [Google Scholar] [PubMed]
- Li, W.; Cui, W.; Yi, P. Digital economy evaluation, regional differences and spatio-temporal evolution: Case study of Yangtze River economic belt in China. Sustain. Cities Soc. 2024, 113, 105685. [Google Scholar] [CrossRef] [Scilit]
- Liu, J.; Meng, X.; Xia, Q. Information infrastructure and corporate green innovation quality incentive. Heliyon 2024, 10, e30784. [Google Scholar] [CrossRef] [Scilit] [PubMed]
- Yuan, B.; Li, C.; Yin, H.; Zeng, M. Green innovation and China’s CO2 emissions—The moderating effect of institutional quality. J. Environ. Plan. Manag. 2022, 65, 877–906. [Google Scholar] [CrossRef] [Scilit]
- Krugman, P. Increasing returns and economic geography. J. Polit. Econ. 1991, 99, 483–499. [Google Scholar] [CrossRef] [Scilit] [PubMed]
- Liu, J.; Yu, Q.; Chen, Y.; Liu, J. The impact of digital technology development on carbon emissions: A spatial effect analysis for China. Resour. Conserv. Recycl. 2022, 185, 106445. [Google Scholar] [CrossRef] [Scilit]
- Zhang, W.; Fan, H.; Zhao, Q. Seeing green: How does digital infrastructure affect carbon emission intensity? Energy Econ. 2023, 127, 107085. [Google Scholar] [CrossRef] [Scilit]
- Niu, X.; Ma, Z.; Ma, W.; Yang, J.; Mao, T. The spatial spillover effects and equity of carbon emissions of digital economy in China. J. Clean. Prod. 2024, 434, 139885. [Google Scholar] [CrossRef] [Scilit]
- Xu, Q.; Zhong, M.; Cao, M. Does digital investment affect carbon efficiency? Spatial effect and mechanism discussion. Sci. Total Environ. 2022, 827, 154321. [Google Scholar] [CrossRef] [Scilit] [PubMed]
- Luo, X.; Lin, G.; Wan, Q.; Jin, G. Inspiration or perspiration: Diffusion of China’s low-carbon city pilot policies nationwide. J. Clean. Prod. 2023, 428, 139291. [Google Scholar] [CrossRef] [Scilit]
- Zhao, X.; Lu, S.; Yuan, S. How does the digitization of government environmental governance affect environmental pollution? Spatial and threshold effects. J. Clean. Prod. 2023, 415, 137670. [Google Scholar] [CrossRef] [Scilit]
- Elhorst, J.P. Applied Spatial Econometrics: Raising the Bar. Spat. Econ. Anal. 2010, 5, 9–28. [Google Scholar] [CrossRef] [Scilit]
- Lou, L.; Wang, H.; Zhong, S. Effects of innovation efficiency of high-tech industries on CO2 emissions in China: A spatial Durbin econometric analysis. PLoS ONE 2022, 17, e0264017. [Google Scholar] [CrossRef] [Scilit] [PubMed]
- Wang, S.; Zhu, J.; Wang, L.; Zhong, S. The inhibitory effect of agricultural fiscal expenditure on agricultural green total factor productivity. Sci. Rep. 2022, 12, 20933. [Google Scholar] [CrossRef] [Scilit] [PubMed]
- Friedlingstein, P.; O’Sullivan, M.; Jones, M.W.; Andrew, R.M.; Hauck, J.; Landschützer, P.; Le Quéré, C.; Li, H.; Luijkx, I.T.; Olsen, A.; et al. Global carbon budget 2024. Earth Syst. Sci. Data 2025, 17, 965–1039. [Google Scholar] [CrossRef] [Scilit]
- Crippa, M.; Guizzardi, D.; Pagani, F.; Schiavina, M.; Melchiorri, M.; Pisoni, E.; Graziosi, F.; Muntean, M.; Maes, J.; Dijkstra, L.; et al. Insights into the spatial distribution of global, national, and subnational greenhouse gas emissions in the Emissions Database for Global Atmospheric Research (EDGAR v8.0). Earth Syst. Sci. Data 2024, 16, 2811–2830. [Google Scholar] [CrossRef] [Scilit]
- Fan, H.; Wu, T. New digital infrastructure, digital capacity and total factor productivity. Res. Econ. Manag. 2022, 43, 3–22. (In Chinese) [Google Scholar] [CrossRef]
- Zhao, X. Research on the technology innovation effect of new digital infrastructure. Stat. Res. 2022, 39, 80–92. (In Chinese) [Google Scholar] [CrossRef]
- Wen, H.; Liu, Y.; Zhou, F. New-type infrastructure and urban economic resilience: Evidence from China. Int. Rev. Econ. Financ. 2024, 96, 103560. [Google Scholar] [CrossRef] [Scilit]
- Ma, D.; Zhou, K.; Xu, J.; Qian, Y. Industrial structure upgrading, population aging and migration: An empirical study based on Chinese provincial panel data. PLoS ONE 2023, 18, e0291718. [Google Scholar] [CrossRef] [Scilit] [PubMed]
- Liu, Y.; Jiang, H.; Cui, J. Exploring how green location-oriented industrial policies promote urban energy efficiency: Evidence from national eco-industrial demonstration parks in China. Sci. Rep. 2025, 15, 42535. [Google Scholar] [CrossRef] [Scilit] [PubMed]
- Chang, R.; Wang, B.; Zhang, Y.; Zhao, L. Foreign Direct Investment and Air Pollution: Re-Estimating the “Pollution Haven Hypothesis” in China. Sustainability 2022, 14, 13759. [Google Scholar] [CrossRef] [Scilit]
- Zhou, Z.; Ma, X.; Zhang, S.; Guo, C.; Liu, X.; Zhang, L.; Xie, Y. Equity-based carbon neutral plan induces cross-regional coal leakage and industrial relocation. iScience 2024, 27, 109079. [Google Scholar] [CrossRef] [Scilit] [PubMed]
- Li, X.; Deng, G. Research on the effect of an environmental protection tax policy on haze control in China—Empirical analysis based on provincial panel data. Sustainability 2022, 14, 41. [Google Scholar] [CrossRef] [Scilit]
- Wen, F.; Sun, Z.; Luo, Y. Population structure and local carbon emission reduction: Evidence from Guangdong, China. Sustainability 2023, 15, 4079. [Google Scholar] [CrossRef] [Scilit]
- Jiang, L.; Wang, Z.; Jiang, Y.; Wang, K.; Cheng, L. Spatial spillovers and nonlinear drivers of water-supply carbon emissions in China. Environ. Sci. Ecotechnol. 2026, 29, 100665. [Google Scholar] [CrossRef] [Scilit] [PubMed]
- Wang, Y.; Yuan, Y.; Qian, X.; Chi, Y. The impact of China’s digital economy industry development and its structural indicators on carbon emission intensity. Front. Environ. Sci. 2024, 12, 1438927, Correction in Front. Environ. Sci. 2025, 13, 1578221. [Google Scholar] [CrossRef] [Scilit]
- Yan, X.; Sun, T. Artificial intelligence development and carbon emission intensity: Evidence from industrial robot application. Sustainability 2025, 17, 3867. [Google Scholar] [CrossRef] [Scilit]
- Safavi, H.R.; Esmikhani, M. Conjunctive use of surface water and groundwater: Application of support vector machines (SVMs) and genetic algorithms. Water Resour. Manag. 2013, 27, 2623–2644. [Google Scholar] [CrossRef] [Scilit]
- Kennedy, J.; Eberhart, R. Particle swarm optimization. In Proceedings of ICNN’95—International Conference on Neural Networks; IEEE: Piscataway, NJ, USA, 1995; Volume 4, pp. 1942–1948. [Google Scholar] [CrossRef] [Scilit]
- Nunn, N.; Qian, N. US Food aid and civil conflict. Am. Econ. Rev. 2014, 104, 1630–1666. [Google Scholar] [CrossRef] [Scilit]
- Lin, B.; Ma, R. How does internet development affect green technology innovation in China? J. Glob. Inf. Manag. 2022, 30, 1–21. [Google Scholar] [CrossRef] [Scilit]
- Zhong, S.; Zhang, X.; Zhang, L.; Zhao, C. How does digital economy influence urban common prosperity? Evidence from China’s demonstration area for common prosperity. Int. Rev. Econ. Financ. 2025, 104, 104629. [Google Scholar] [CrossRef] [Scilit]
- Chen, X.; Zhou, M.; Zhang, C.; Ling, X.; Zhang, Y. Can digital economy promote innovation of the tourism industry? Empirical evidence from China. Sage Open 2025, 15, 21582440251342881. [Google Scholar] [CrossRef] [Scilit]
- Blundell, R.; Bond, S. Initial conditions and moment restrictions in dynamic panel data models. J. Econom. 1998, 87, 115–143. [Google Scholar] [CrossRef] [Scilit]
- Roodman, D. A note on the theme of too many instruments. Oxf. Bull. Econ. Stat. 2009, 71, 135–158. [Google Scholar] [CrossRef] [Scilit]
- Ma, Y.; Fang, Y.; Liu, J. Research on distribution dynamics, regional differences, and convergence of development for digital innovation ecosystem. Ann. Reg. Sci. 2024, 73, 1839–1863. [Google Scholar] [CrossRef] [Scilit]
- Zhang, Z.; He, W.; Park, T.-Y.; Xing, Z.; Wu, X. The effects of between-group pay dispersion. Acad. Manag. J. 2023, 66, 1860–1895. [Google Scholar] [CrossRef] [Scilit]
- Tang, K.; Yang, G. Does digital infrastructure cut carbon emissions in Chinese cities? Sustain. Prod. Consum. 2023, 35, 431–443. [Google Scholar] [CrossRef] [Scilit]
- Peng, H.; Ling, K.; Zhang, Y. The carbon emission reduction effect of digital infrastructure development: Evidence from the broadband China policy. J. Clean. Prod. 2024, 434, 140060. [Google Scholar] [CrossRef] [Scilit]
- Cheng, Y.; Zhang, Y.; Wang, J.; Jiang, J. The impact of the urban digital economy on China’s carbon intensity: Spatial spillover and mediating effect. Resour. Conserv. Recycl. 2023, 189, 106762. [Google Scholar] [CrossRef] [Scilit]
- Zheng, R.; Wu, G.; Cheng, Y.; Liu, H.; Wang, Y.; Wang, X. How does digitalization drive carbon emissions? The inverted U-shaped effect in China. Environ. Impact Assess. Rev. 2023, 102, 107203. [Google Scholar] [CrossRef] [Scilit]
- Li, Z.; Wang, J. The dynamic impact of digital economy on carbon emission reduction: Evidence city-level empirical data in China. J. Clean. Prod. 2022, 351, 131570. [Google Scholar] [CrossRef] [Scilit]
- Yi, M.; Liu, Y.; Sheng, M.S.; Wen, L. Effects of digital economy on carbon emission reduction: New evidence from China. Energy Policy 2022, 171, 113271. [Google Scholar] [CrossRef] [Scilit]
- Bieser, J.C.T.; Hintemann, R.; Hilty, L.M.; Beucker, S. A review of assessments of the greenhouse gas footprint and abatement potential of information and communication technology. Environ. Impact Assess. Rev. 2023, 99, 107033. [Google Scholar] [CrossRef] [Scilit]
- Lange, S.; Pohl, J.; Santarius, T. Digitalization and energy consumption. Does ICT reduce energy demand? Ecol. Econ. 2020, 176, 106760. [Google Scholar] [CrossRef] [Scilit]
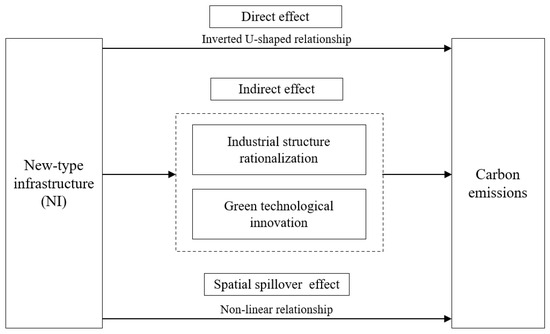
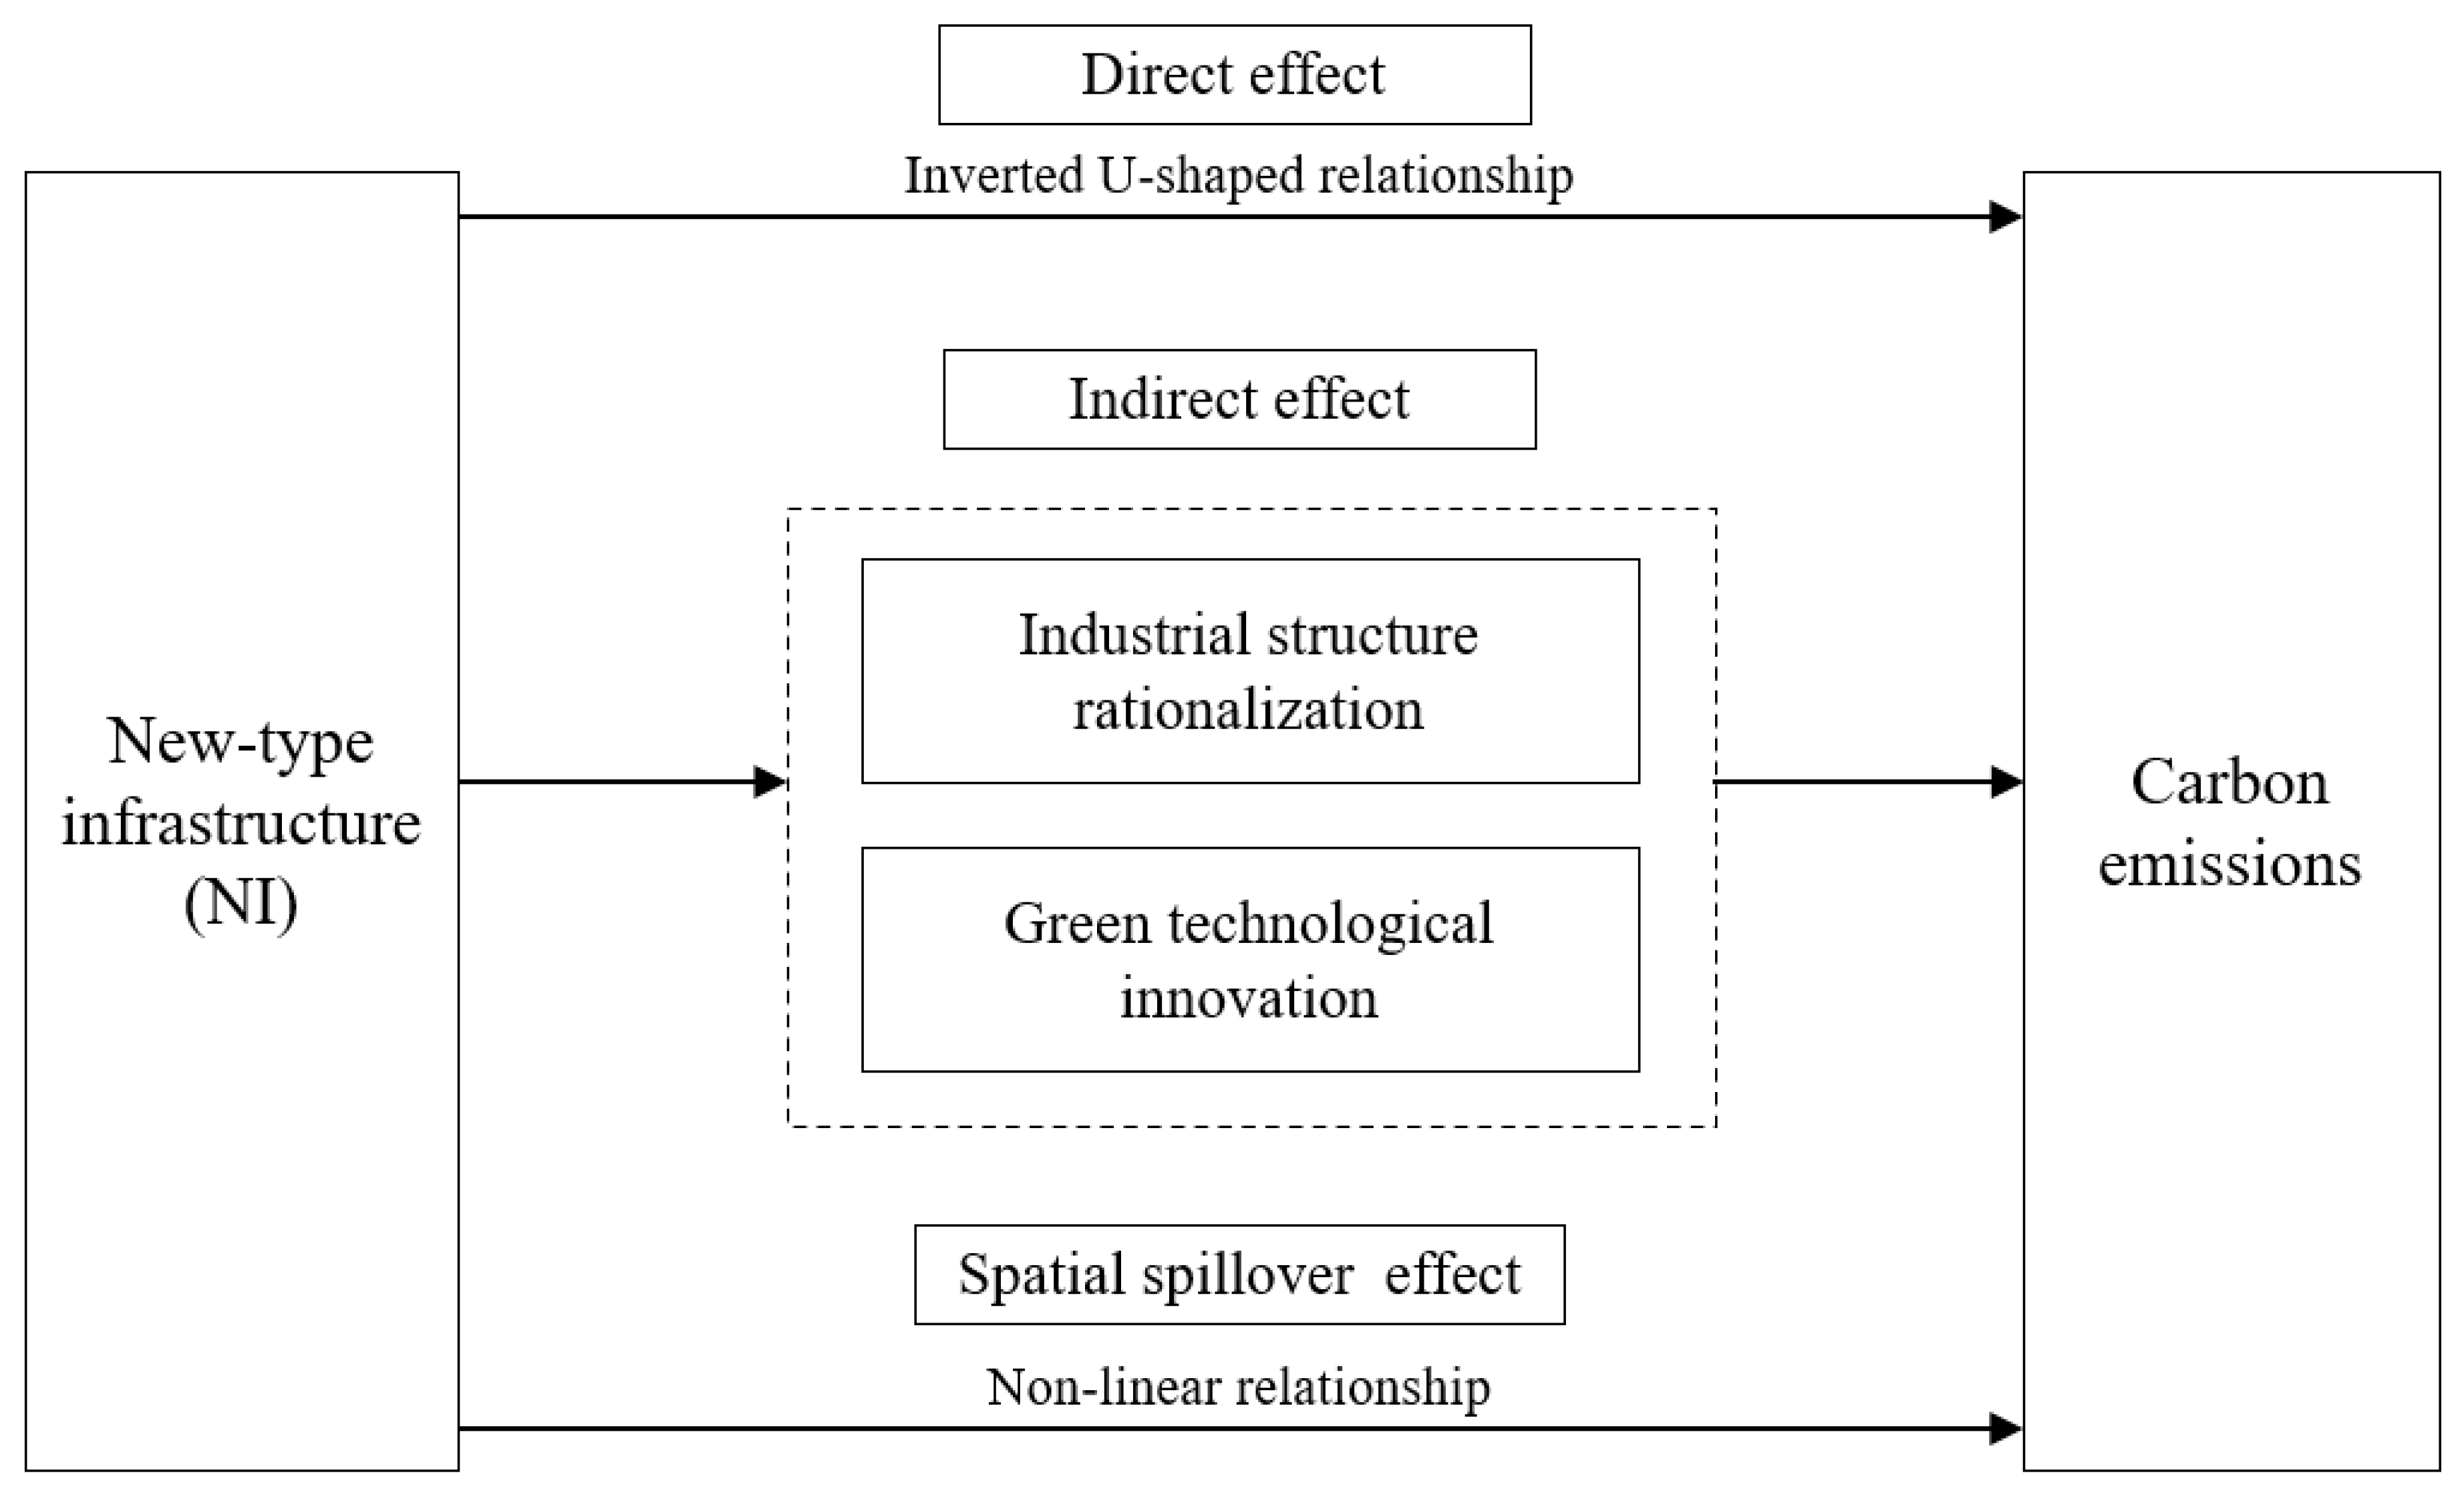
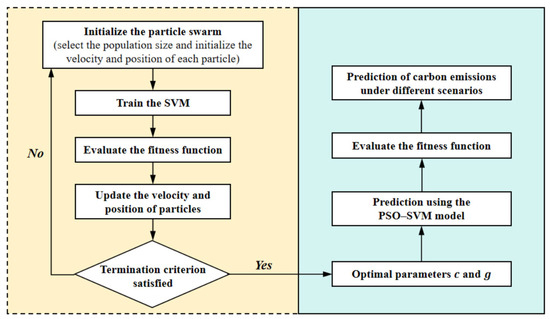
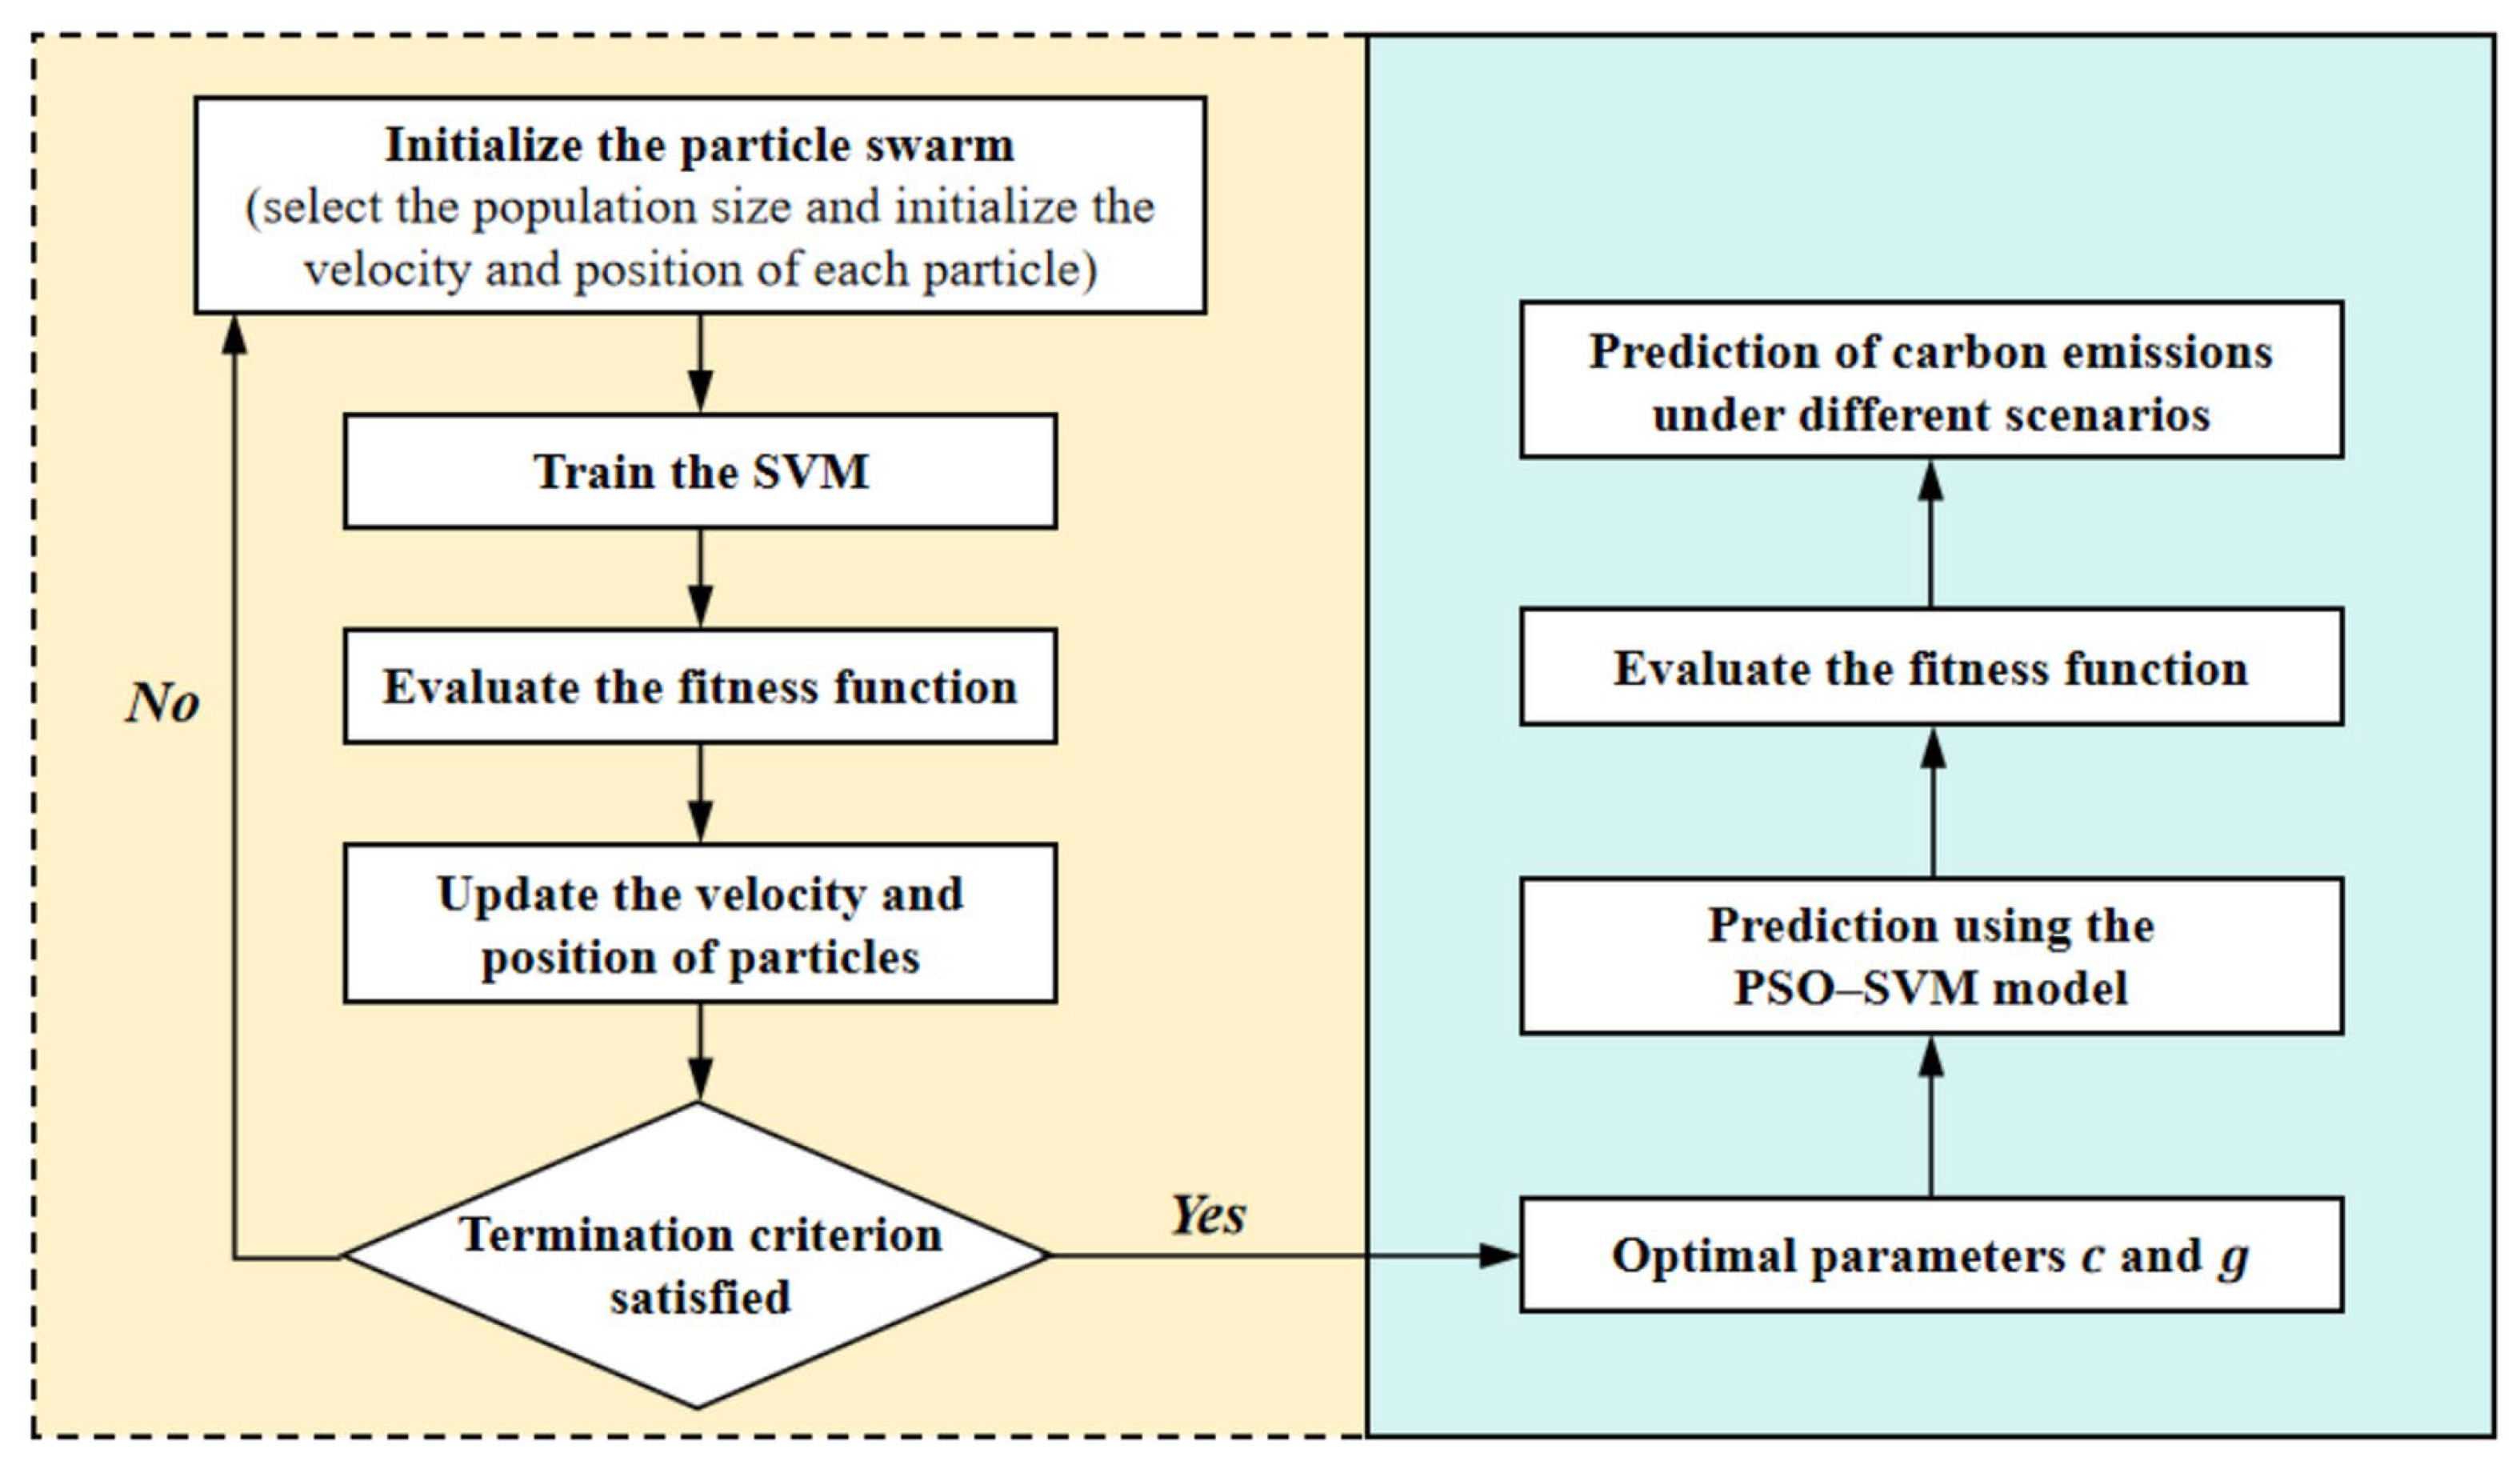
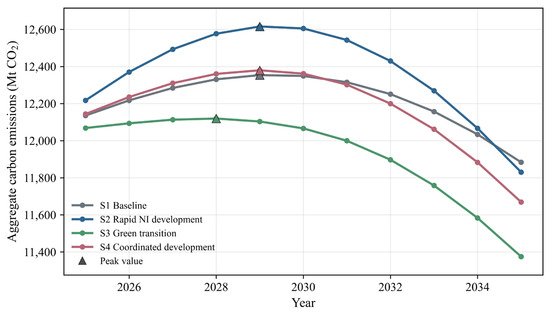
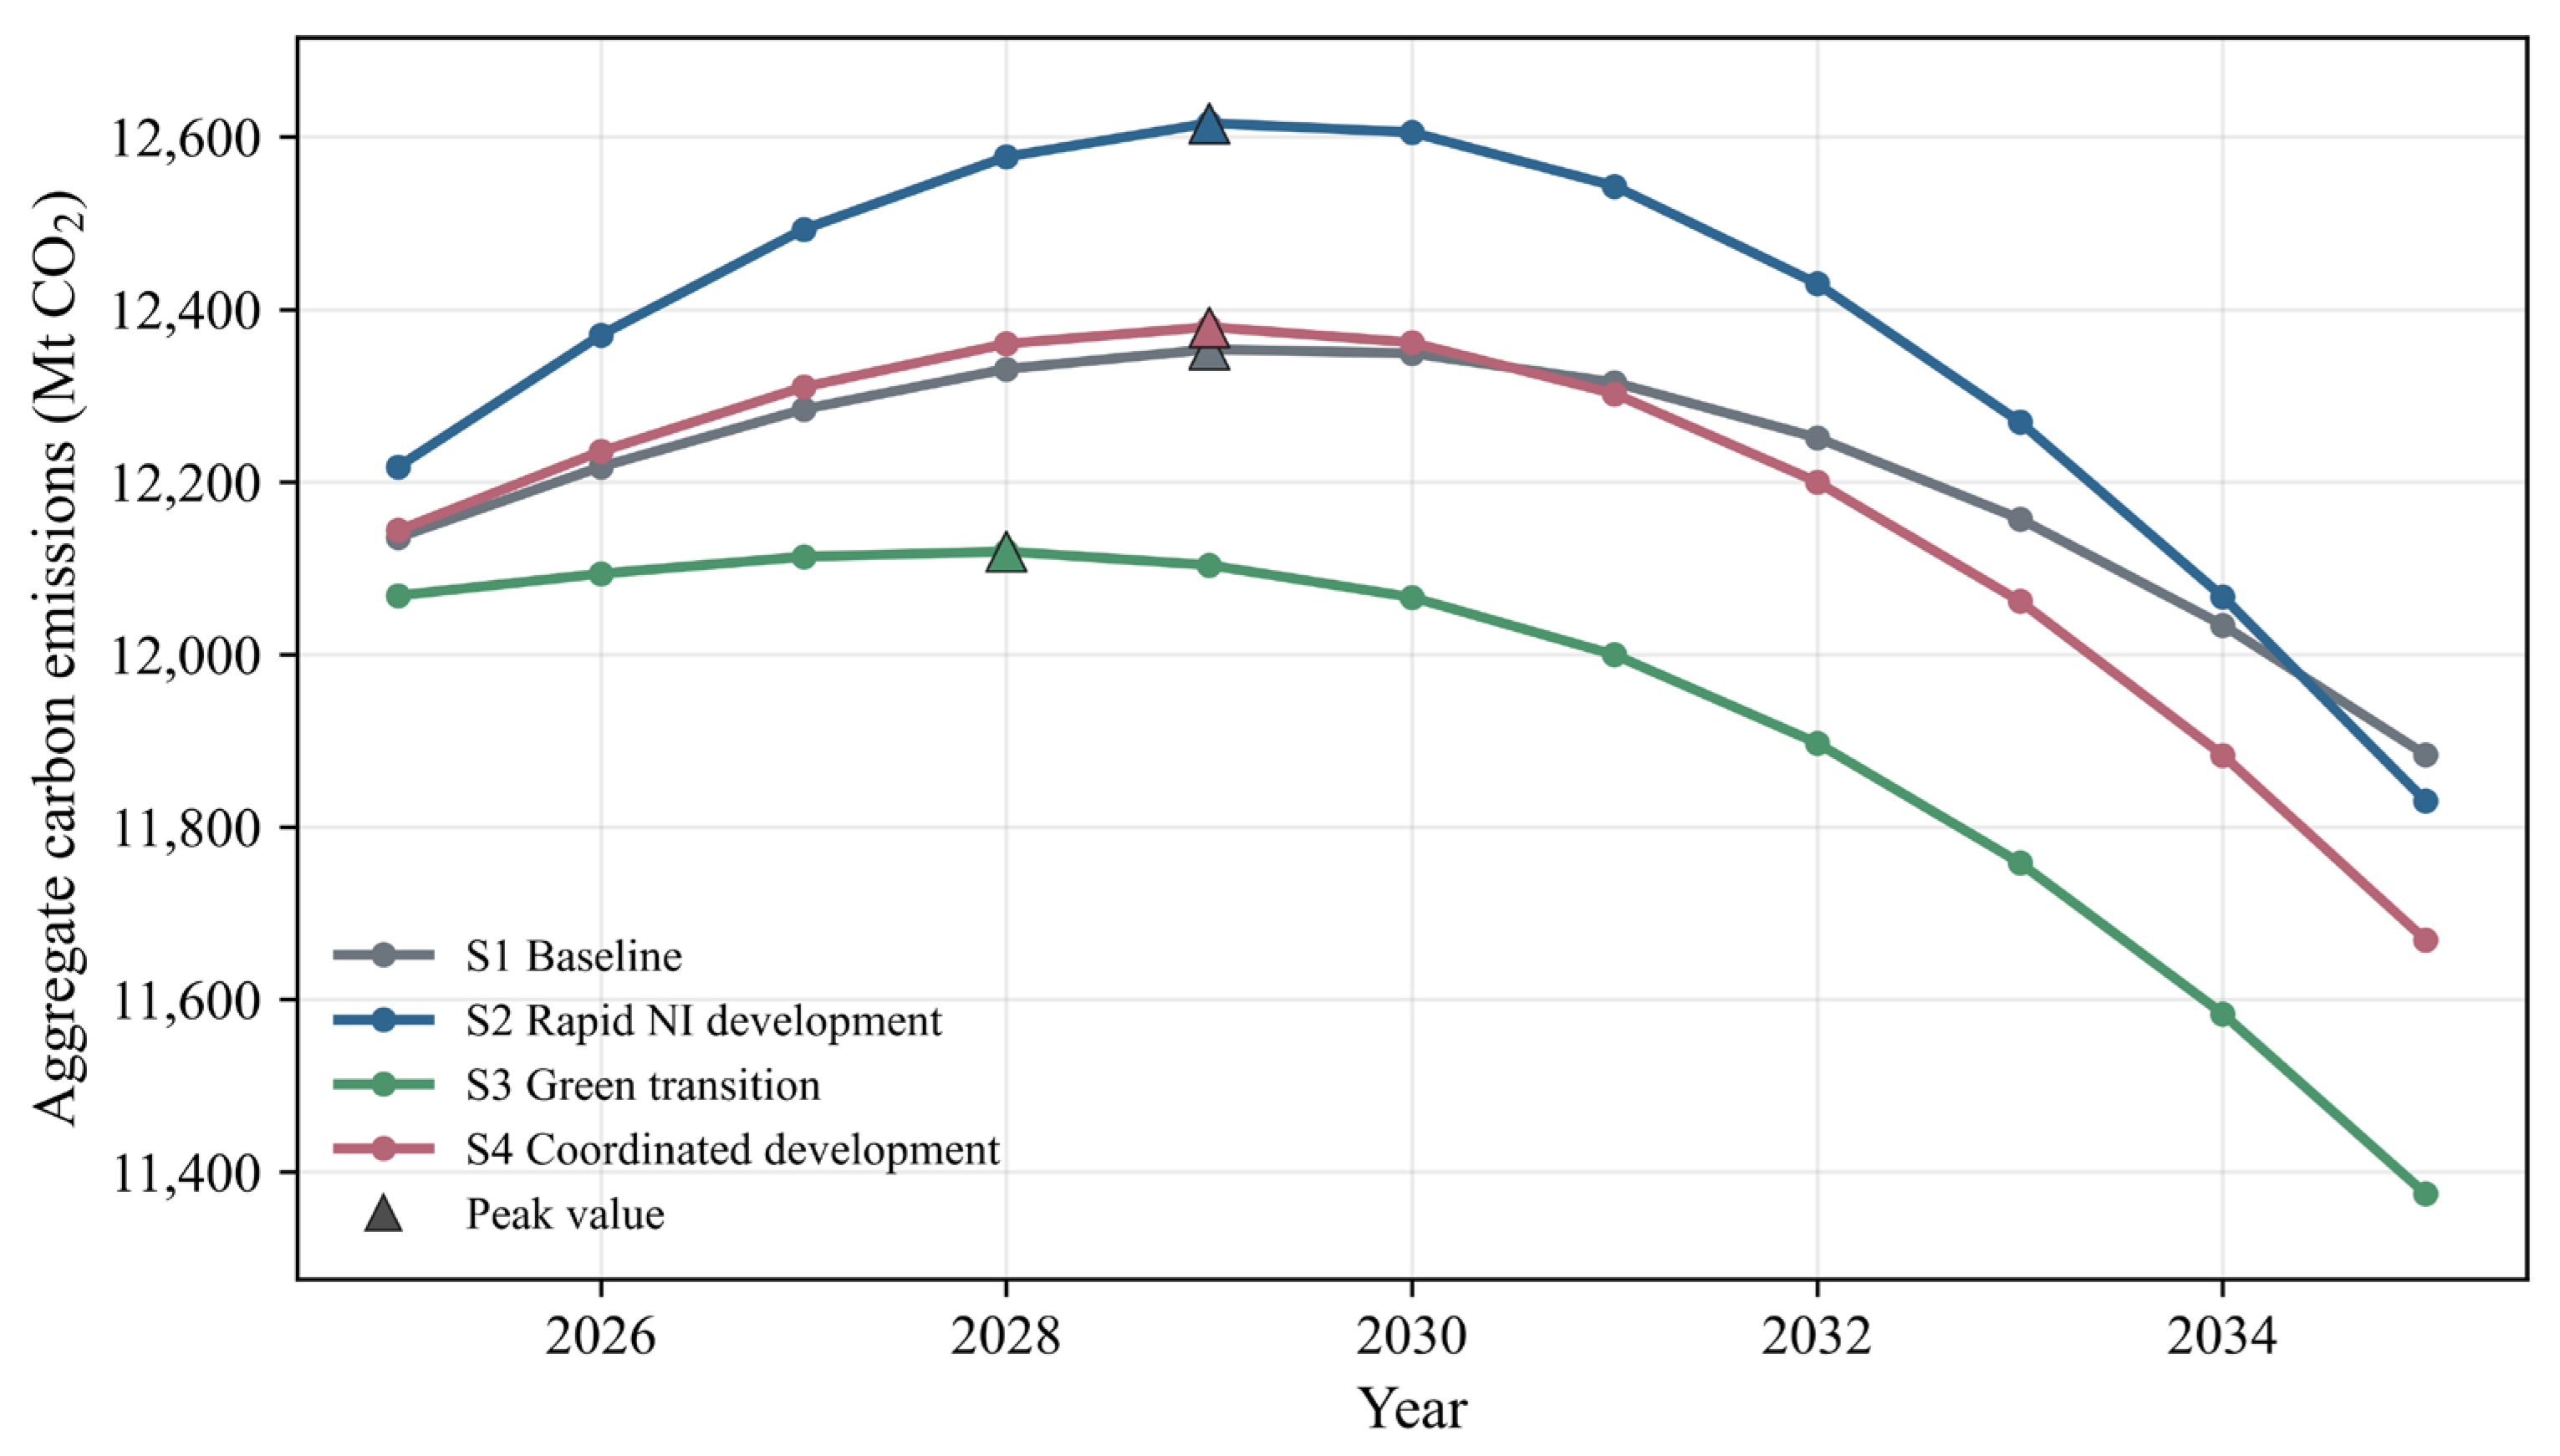

Disclaimer/Publisher’s Note: The statements, opinions and data contained in all publications are solely those of the individual author(s) and contributor(s) and not of MDPI and/or the editor(s). MDPI and/or the editor(s) disclaim responsibility for any injury to people or property resulting from any ideas, methods, instructions or products referred to in the content. |
© 2026 by the authors. Licensee MDPI, Basel, Switzerland. This article is an open access article distributed under the terms and conditions of the Creative Commons Attribution (CC BY) license.