1. Introduction
Global value chains (GVCs) shape how firms organize and coordinate production activities across borders [
1,
2]. For firms in developing and emerging economies, GVC participation can also provide access to new markets, external knowledge, and opportunities to build production and technological capabilities [
3,
4,
5]. Yet participation in a GVC does not automatically mean that a firm learns or upgrades. GVC relationships can create opportunities for knowledge transfer while also limiting the functions, technologies, and market activities controlled by supplier firms [
2,
6,
7]. Upgrading is therefore important for understanding firm-level outcomes. The GVC literature commonly distinguishes Product, Process, Functional, and inter-sectoral or Value-chain upgrading [
3,
8]. These forms do not necessarily follow a universal ladder and can involve different patterns of capability improvement, repositioning, or even downgrading [
8,
9].
Previous research has developed along three related lines. First, studies of GVC participation, embeddedness, and interfirm learning examine how external relationships are associated with knowledge transfer and upgrading [
4,
5,
6,
10,
11]. Second, studies of upgrading examine links with competitiveness, innovation, productivity, and survival [
12,
13,
14,
15,
16,
17]. Third, other studies link GVC participation or position directly to firm outcomes [
18,
19]. These streams are often studied separately. As a result, we know less about how capability upgrading connects learning-oriented GVC participation with different dimensions of firm performance, and whether this relationship is mainly indirect rather than direct.
A second issue concerns the content of participation. Some firms take part in GVCs mainly through transactions, whereas others place greater emphasis on technology transfer and technical cooperation. We call the latter Learning-Oriented GVC Participation. The term is intentionally narrow: it describes the firm’s emphasis on capability-oriented interaction, not the amount of knowledge actually acquired or its absorptive capacity. The learning opportunities linked to such relationships may also depend on governance, power, knowledge complexity, ownership, and prior GVC position [
6,
7], none of which are directly measured in this study.
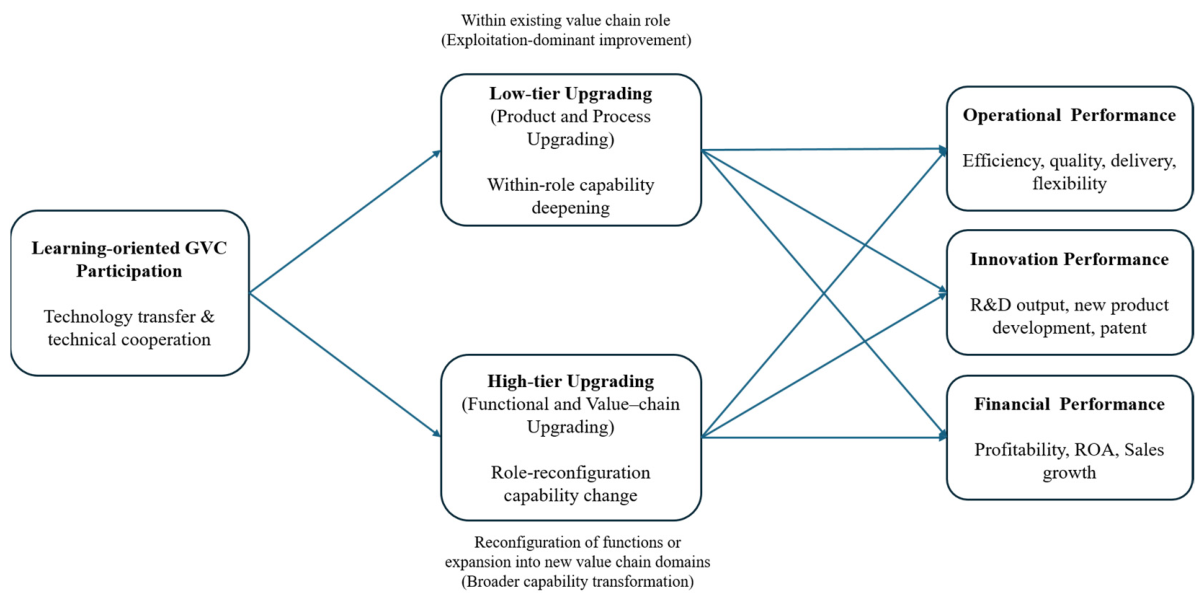
A third issue is how to organize the four established upgrading categories. Product and Process upgrading often improve capabilities while the firm’s basic production and exchange role remains relatively stable. Functional and Value-chain upgrading involve broader changes in the functions a firm performs or the markets and value-chain domains in which it operates [
3,
9,
20]. Related research also connects upgrading with exploitation and exploration [
21]. However, this does not mean that Product/Process upgrading is less valuable, easier, or always comes before Functional/Value-chain upgrading. We therefore group the four dimensions by the extent of role change: within-role upgrading (the Low-tier analytical grouping) combines Product and Process upgrading, while role-reconfiguring upgrading (the High-tier analytical grouping) combines Functional and Value-chain upgrading. The four dimensions remain distinct, and the Low/High labels do not imply a universal hierarchy.
China provides a useful setting for studying these relationships. Chinese manufacturing firms are deeply involved in international production networks and have been widely studied in relation to technology transfer, GVC embeddedness, digital transformation, human capital, upgrading, and survival [
12,
13,
14,
15,
18,
19,
22,
23,
24,
25,
26,
27]. This study focuses mainly on electrical/electronics, information and communication technology (ICT), and semiconductor manufacturers in the Yangtze River Delta and Pearl River Delta. The analysis therefore examines firm-level relationships within an important manufacturing context while limiting its claims to the variables directly observed in the study.
Against this background, the study asks three questions. First, how is Learning-Oriented GVC Participation associated with within-role and role-reconfiguring upgrading? Second, how are these two theory-driven analytical groupings associated with Operational, Innovation, and Financial Performance? Third, to what extent is Learning-Oriented GVC Participation indirectly associated with these performance outcomes through within-role and role-reconfiguring upgrading considered jointly?
The study makes three contributions. First, it focuses on the quality of GVC participation by examining firms’ emphasis on technology transfer and technical cooperation, rather than participation alone. Second, it links the four established upgrading categories through a simple distinction between within-role improvement and broader role change while keeping the four categories conceptually distinct. Third, it brings the participation-upgrading and upgrading-performance literatures together in one firm-level framework covering Operational, Innovation, and Financial Performance. The results show that the combined indirect relationship through upgrading is more consistent than many individual upgrading-performance paths. This suggests that the performance relevance of Learning-Oriented GVC Participation is better understood through the combined pattern of capability upgrading than through a direct participation-performance relationship. From a systems perspective, the study highlights the connections among participation, several forms of upgrading, and different performance outcomes without claiming feedback or dynamic change that cannot be observed with cross-sectional data.
3. Materials and Methods
3.1. Sample and Data Collection
The study uses a firm-level survey of Chinese manufacturing firms conducted in June 2024. The fieldwork targeted firms in the Yangtze River Delta and Pearl River Delta that were engaged in GVC-related activities. Of 300 questionnaires distributed, 258 were returned, yielding a response rate of 86.0%. Eight incomplete questionnaires were removed, leaving 250 complete responses. Measurement items were drawn from established English-language studies, translated and adapted into Korean, and then translated into Chinese for administration. Most substantive items used seven-point Likert-type scales.
The fieldwork was coordinated locally in China; because detailed historical records of respondent verification and vendor-level screening are no longer available, only procedures supported by the surviving documentation are reported. Response-quality screening of the complete dataset is described in
Section 3.2.
After response-quality screening, the primary analytical sample consists of 222 firms. Respondents held managerial or executive positions, and the sample was concentrated in electrical/electronics, ICT-related, and semiconductor manufacturing. Most firms were located in the Yangtze River Delta, with the remainder in the Pearl River Delta. Detailed respondent and firm characteristics are reported in the
Supplementary Materials.
Participation was voluntary. Respondents were informed of the academic purpose of the study, and that individual firm information would be treated confidentially. No personally identifying or sensitive personal information was included in the analytical dataset.
3.2. Response-Quality Screening
Response quality was assessed across all 44 substantive survey variables available for the 250 complete responses. Twenty-eight respondents selected exactly the same response value across all 44 variables, while 35 cases had a within-respondent standard deviation of 0.25 or less. Complete invariance across a heterogeneous item set is an extreme form of response invariability or straight-lining and is commonly treated as an indicator of careless or insufficient-effort responding [
29,
30].
The primary analysis excludes the 28 completely invariant response patterns, yielding N = 222. Complete invariance across all substantive variables provides a clear response-quality concern. By contrast, the broader SD ≤ 0.25 rule additionally excludes seven respondents whose answers are highly concentrated but not completely invariant and may therefore remove genuinely consistent respondents. The N = 215 sample is consequently used as a stringent sensitivity specification rather than as the primary sample. All focal PLSc paths are also estimated in the full N = 250 sample as an additional benchmark.
3.3. Measures and Operationalization
3.3.1. Learning-Oriented GVC Participation
Learning-Oriented GVC Participation was measured with two items: emphasis on technology transfer and emphasis on developing core technologies through technical cooperation. The measure reflects the firm’s reported emphasis on capability-oriented interaction rather than actual learning or absorptive capacity. Cronbach’s alpha in the N = 222 sample is 0.897.
3.3.2. GVC Upgrading
The upgrading instrument contains four first-order dimensions. Product upgrading was measured with four items on new product/service development, revenue from new products, competitive imitation, and speed of new product introduction. Process upgrading used four items on new processes, technologies and equipment, process efficiency, and process novelty. Functional upgrading used four items on R&D capability, advanced technologies, design capability, and core capabilities. Value-chain upgrading used three items on expansion into other industries, movement beyond the existing production/transaction domain toward higher-value-added activities, and the search for future business partners in new domains. The four dimensions follow the GVC upgrading literature [
3,
20], with the exploitation/reconfiguration interpretation informed by related industrial-upgrading research [
21].
In the PLSc model, Product, Process, Functional, and Value-chain upgrading are modeled as distinct first-order common factors. Product and Process form the within-role (Low-tier) analytical composite, representing within-role capability deepening. Functional and Value chain form the role-reconfiguring (High tier) analytical composite, representing broader role change. These are theory-driven higher-order analytical groupings rather than a latent or empirically validated hierarchy. For compactness, the statistical tables and figures retain the labels Low tier and High tier.
3.3.3. Performance Outcomes
Performance was measured in three domains. Operational Performance used four items covering quality/performance relative to cost compared with competitors, price competitiveness, on-time delivery, and manufacturing flexibility. Innovation Performance used two items covering the frequency of new technology or new-product introduction and intellectual-property performance relative to industry peers. Financial Performance used three items covering improvements in ROA, ROI, and ROS. Cronbach’s alpha values were 0.932, 0.945, and 0.891, respectively, in the N = 222 sample.
3.3.4. Supplementary Variables and Controls
Environmental Uncertainty was measured, with nine items covering demand, customer preferences, new product speed, technological change, competitors, competitive intensity, supplier problems, and regulation/public policy (alpha = 0.888 in N = 222). It was used only in a supplementary boundary-condition analysis. Transaction-Oriented Participation was measured with one item on emphasis on simple transactions for revenue generation and was used only in a supplementary comparison.
Capital size, export ratio, and firm age are included as baseline controls in the primary structural model. An expanded-control sensitivity specification additionally includes industry, region, and employee-size category dummies.
3.4. Analytical Strategy
The primary structural analysis uses consistent partial least-squares structural equation modeling (PLSc) in R (version 4.5.2) with the cSEM package (version 0.6.1). PLSc corrects for attenuation when common-factor constructs are estimated in a composite-based structural equation modeling (SEM) framework [
31,
32]. PLSc was selected because the model combines common-factor constructs with higher-order analytical composites within a composite-based SEM framework [
31,
32,
33,
34]. Learning-Oriented GVC Participation, Product, Process, Functional, Value-chain, Operational Performance, and Financial Performance are specified as common factors. The within-role and role-reconfiguring analytical groupings are second-order composites estimated with a disjoint two-stage approach. Innovation Performance is represented by the mean of its two items. When QPER4 and QPER5 were instead specified as an unconstrained two-indicator latent factor in the covariance-based model, the residual variance of QPER5 converged to approximately zero, producing a Heywood-type boundary solution rather than a stable interior solution. Because resolving a two-indicator factor would require additional identifying constraints, such as equality constraints on loadings or residual variances, that are not imposed on the other multi-item common-factor constructs, we retained the transparent two-item mean score. The two items show high internal consistency (alpha = 0.945; inter-item r = 0.900).
The PLSc model uses the PLS-PM path-weighting scheme and 5000 bootstrap resamples. We report path coefficients, bootstrap standard errors, p-values, percentile confidence intervals, and specific and total indirect associations. For focal direct paths, p-values and percentile confidence intervals are considered together; if they lead to different conclusions, the path is treated as inference-sensitive rather than as robustly supported. Indirect associations are evaluated with percentile bootstrap confidence intervals because their distributions may be asymmetric. For the N = 215 stringent-sample and N = 222 expanded-control analyses, inadmissible bootstrap draws are replaced until 5000 valid resamples are obtained. The full analysis code documents construct types, controls, dummy coding, and bootstrap procedures.
As a robustness check, the same structural relationships are also estimated with covariance-based SEM in lavaan (version 0.6-21) using robust maximum likelihood (MLR) [
35], following recent recommendations to compare complementary SEM estimators [
34]. The model includes Learning-Oriented GVC Participation, the four upgrading factors, the within-role (Low-tier) and role-reconfiguring (High-tier) analytical groupings, Operational Performance, and Financial Performance within the same structural framework. Innovation Performance remains represented by its two-item score rather than by an additionally constrained two-indicator latent factor. The same baseline controls and direct Learning-Oriented GVC Participation-to-performance paths are retained.
Because all focal variables came from the same respondent in one survey wave, common-method variance cannot be ruled out. Confidentiality assurances and neutral response instructions were used during data collection. In the
N = 222 sample, the first unrotated factor explains 43.19% of the variance, and differentiated factor models fit much better than a one-factor model. These checks are descriptive and do not show that common-method bias is absent. The questionnaire did not include an unrelated marker variable, so no marker-variable adjustment was possible. This limitation is discussed further in
Section 5.4.
4. Results
4.1. Descriptive Statistics and Measurement Evaluation
Table 1 reports descriptive statistics and correlations for the core constructs in the
N = 222 sample. Learning-Oriented GVC Participation is strongly correlated with both upgrading scopes, and the two upgrading scopes are also closely related. Operational and Innovation Performance are strongly correlated as well, but they are kept separate because their items represent different performance domains.
Internal consistency is high across the retained measurement domains. The PLSc common-factor loadings range from 0.707 to 0.983, and composite reliability and AVE exceed conventional benchmarks for each first-order common factor. Innovation Performance is treated as a two-item composite, with alpha = 0.945 and an inter-item correlation of 0.900.
Table 2 summarizes the measurement results.
The upgrading measurement structure was examined with robust MLR CFA. The four correlated first-order factors provide the best item-level fit (CFI = 0.933, TLI = 0.916, RMSEA = 0.104, SRMR = 0.075). The two-group higher-order analytical model is only slightly weaker on CFI and TLI (CFI = 0.930, TLI = 0.913, RMSEA = 0.106, SRMR = 0.075), although its RMSEA remains higher than desirable. This means that the four upgrading dimensions retain some distinct variance that is not fully captured by the two-group higher-order structure. We therefore treat the four first-order dimensions as the main measurement representation and use within-role (Low tier) and role-reconfiguring (High tier) as theory-driven analytical groupings rather than as an empirically validated hierarchical structure.
Table 3 summarizes the comparison of these alternative upgrading measurement representations.
The second-order PLSc loadings are strong: Product = 0.947 and Process = 0.974 on the within-role (Low tier) analytical composite; Functional = 0.918 and Value chain = 0.999 on the role-reconfiguring (High tier) analytical composite. The corresponding weights are 0.428 (p = 0.017) and 0.611 (p < 0.001) for Product and Process, and 0.087 (p = 0.795) and 0.921 (p = 0.003) for Functional and Value chain. Functional upgrading therefore loads strongly on the role-reconfiguring composite but adds little unique weight after Value-chain upgrading is taken into account, indicating substantial shared variance between the two components. In relative-weight terms, the role-reconfiguring composite is therefore driven predominantly by Value-chain upgrading in the present sample. This does not imply that Functional upgrading is substantively unimportant: its loading of 0.918 indicates a strong association with the broader grouping, but little incremental contribution once the shared variance with Value-chain upgrading is considered.
The HTMT value for the within-role/role-reconfiguring item groupings is 0.881, with a 5000-resample percentile 95% CI of [0.817, 0.936] [
36]. This shows that the two upgrading scopes are closely related rather than clearly separated. The result further supports treating the four first-order dimensions as primary and the within-role (Low-tier) and role-reconfiguring (High-tier) representations as theory-driven analytical groupings.
4.2. Primary PLSc Structural Results
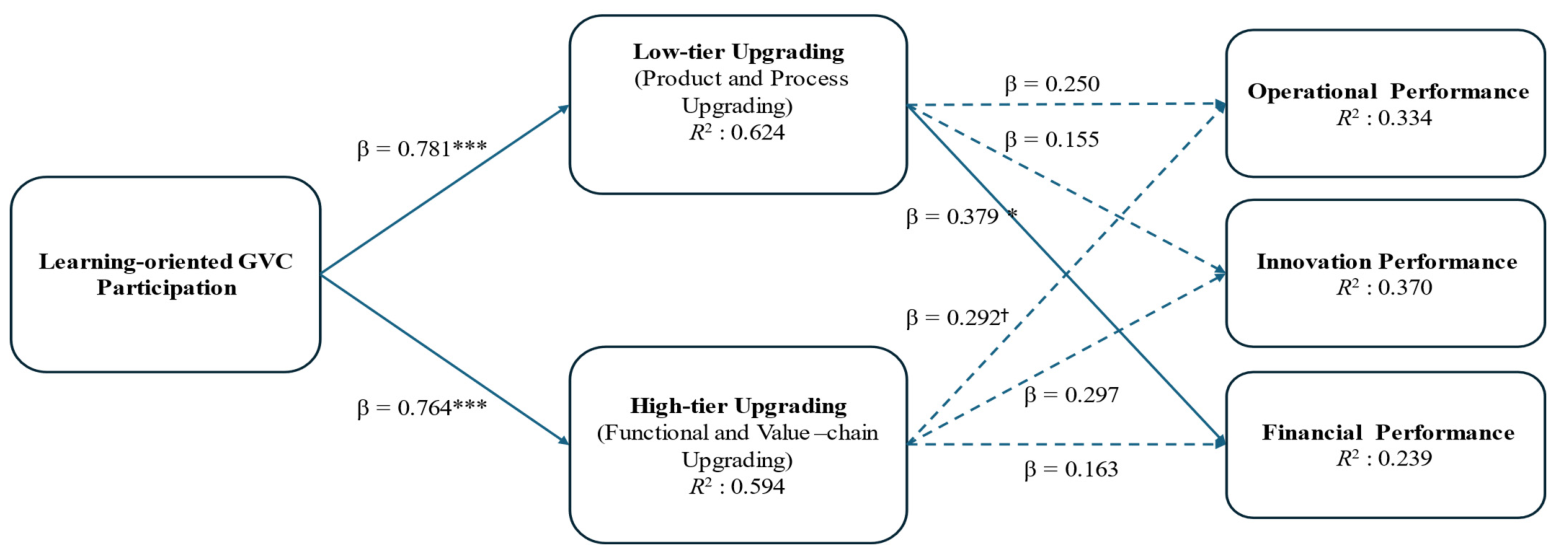
Table 4 reports the primary PLSc structural model, including the baseline controls. Learning-Oriented GVC Participation is strongly and positively associated with within-role (Low tier) upgrading (β = 0.781,
p < 0.001, 95% percentile CI [0.693, 0.862]) and role-reconfiguring (High-tier) upgrading (β = 0.764,
p < 0.001, 95% CI [0.672, 0.846]), supporting H1a and H1b. By contrast, its direct associations with Operational Performance (β = 0.055,
p = 0.637), Innovation Performance (β = 0.188,
p = 0.126), and Financial Performance (β = −0.074,
p = 0.571) are all nonsignificant.
The scope-specific upgrading–performance coefficients are less stable and generally weaker. Within-role upgrading is not significantly associated with Operational Performance (β = 0.250,
p = 0.149) or Innovation Performance (β = 0.155,
p = 0.402), but it is positively associated with Financial Performance (β = 0.379,
p = 0.040, 95% CI [0.010, 0.746]), supporting H2e in the primary PLSc model. Two coefficients in
Table 4 require closer inspection because their significance depends on the inferential summary used. Among the focal paths, the role-reconfiguring (High-tier) → Operational Performance path is positive (β = 0.292), but the bootstrap-SE-based
p-value is 0.078, whereas the 95% percentile interval excludes zero [0.033, 0.697]. H2b is therefore classified as not robustly supported. Role-reconfiguring upgrading is not significantly associated with Innovation Performance (β = 0.297,
p = 0.100, 95% CI [−0.040, 0.671]) or Financial Performance (β = 0.163,
p = 0.368, 95% CI [−0.162, 0.568]). Accordingly, H2a, H2c, H2d, and H2f are not supported. These results do not indicate that either upgrading scope is generally superior to the other.
The primary PLSc structural results are summarized in
Figure 2.
Figure 2.
Results of the primary PLSc structural model (
N = 222). Note. R
2 values for endogenous constructs are reported. Solid arrows denote focal paths with
p < 0.05 and a 95% percentile CI excluding zero; dashed arrows denote paths not meeting this criterion. † denotes an inference-sensitive path for which the bootstrap-SE
p-value and percentile 95% CI yield different conclusions. *
p < 0.05; ***
p < 0.001. Direct Learning-Oriented GVC Participation-to-performance paths and controls are omitted for visual clarity and are reported in
Table 4. Total indirect associations are reported in
Table 5.
Figure 2.
Results of the primary PLSc structural model (
N = 222). Note. R
2 values for endogenous constructs are reported. Solid arrows denote focal paths with
p < 0.05 and a 95% percentile CI excluding zero; dashed arrows denote paths not meeting this criterion. † denotes an inference-sensitive path for which the bootstrap-SE
p-value and percentile 95% CI yield different conclusions. *
p < 0.05; ***
p < 0.001. Direct Learning-Oriented GVC Participation-to-performance paths and controls are omitted for visual clarity and are reported in
Table 4. Total indirect associations are reported in
Table 5.
Table 5.
PLSc Specific and Total Indirect Effects (Bootstrap = 5000).
Table 5.
PLSc Specific and Total Indirect Effects (Bootstrap = 5000).
| Outcome | Indirect Path | Point Estimate | 95% Percentile CI | Inference |
|---|
| Operational | Learning → Low-tier → Outcome | 0.195 | [−0.099, 0.447] | CI includes zero |
| Operational | Learning → High-tier → Outcome | 0.223 | [0.025, 0.547] | CI excludes zero |
| Operational | Total indirect | 0.418 | [0.250, 0.635] | CI excludes zero |
| Innovation | Learning → Low-tier → Outcome | 0.121 | [−0.171, 0.404] | CI includes zero |
| Innovation | Learning → High-tier → Outcome | 0.227 | [−0.030, 0.531] | CI includes zero |
| Innovation | Total indirect | 0.348 | [0.161, 0.543] | CI excludes zero |
| Financial | Learning → Low-tier → Outcome | 0.296 | [0.007, 0.599] | CI excludes zero |
| Financial | Learning → High-tier → Outcome | 0.125 | [−0.126, 0.448] | CI includes zero |
| Financial | Total indirect | 0.421 | [0.241, 0.638] | CI excludes zero |
4.3. Indirect Associations Through Upgrading
Indirect associations were evaluated using the same 5000 PLSc bootstrap resamples. Because indirect effects are products of structural coefficients, and their sampling distributions may be asymmetric, inference was based on percentile bootstrap confidence intervals. The total indirect association between Learning-Oriented GVC Participation and Operational Performance through within-role and role-reconfiguring upgrading considered jointly is 0.418, with a 95% percentile CI of [0.250, 0.635]. The corresponding total indirect associations are 0.348 for Innovation Performance, 95% CI [0.161, 0.543], and 0.421 for Financial Performance, 95% CI [0.241, 0.638]. Because all three intervals exclude zero, H3a–H3c are supported in the primary PLSc bootstrap analysis.
The specific indirect patterns are less consistent. For Operational Performance, the within-role specific indirect interval includes zero, whereas the role-reconfiguring specific indirect interval excludes zero. Given the inference sensitivity of the corresponding role-reconfiguring (High-tier) → Operational Performance path reported in
Section 4.2, the latter component-specific result is interpreted cautiously. For Innovation Performance, neither specific indirect interval excludes zero even though the combined indirect association is significant. For Financial Performance, the within-role specific indirect interval excludes zero, whereas the role-reconfiguring interval does not. Overall, the combined indirect associations are more consistent than the component-specific indirect patterns.
4.4. Supplementary Boundary-Condition and Participation-Mode Analyses
Environmental uncertainty was examined as a supplementary boundary condition using standardized construct scores and baseline controls. The interaction between Learning-Oriented GVC Participation and Environmental Uncertainty was nonsignificant for both within-role upgrading (β = −0.018, p = 0.651) and role-reconfiguring upgrading (β = 0.059, p = 0.179). Environmental Uncertainty nevertheless showed positive independent associations with within-role upgrading (β = 0.353, p < 0.001) and role-reconfiguring upgrading (β = 0.175, p = 0.003).
A second supplementary analysis compared Learning-Oriented GVC Participation with the single-item Transaction-Oriented Participation measure. When both participation indicators were entered simultaneously with the baseline controls, Transaction-Oriented Participation was not significantly associated with within-role upgrading (β = 0.042, p = 0.550) or role-reconfiguring upgrading (β = −0.073, p = 0.316), whereas Learning-Oriented GVC Participation remained positively associated with both upgrading scopes. The two participation indicators were highly correlated (r = 0.743), and the transaction-oriented construct was represented by a single item. Accordingly, this comparison is interpreted only as an incremental-explanatory-power diagnostic rather than as evidence that transactional participation is generally unimportant.
4.5. Robustness and Sensitivity Analyses
Response-quality sensitivity analyses show that the focal PLSc coefficients change only modestly across the full
N = 250 sample, the
N = 222 primary sample, and the more stringent
N = 215 sample. Learning-Oriented GVC Participation remains strongly associated with both within-role (Low tier) and role-reconfiguring (High tier) upgrading in all three samples, and the signs and relative magnitudes of the upgrading–performance coefficients remain similar. Across the focal paths, the largest absolute deviation from the
N = 222 estimate is 0.044.
Table 6 reports the corresponding coefficients.
An expanded-control specification additionally includes industry, region, and employee-size indicators. The focal coefficient estimates remain close to those of the baseline model. Learning-Oriented GVC Participation remains strongly associated with both within-role (Low-tier) and role-reconfiguring (High-tier) upgrading, whereas the individual upgrading–performance paths are generally nonsignificant under the expanded-control specification. The combined indirect associations nevertheless remain different from zero. Under the
N = 215 stringent response-quality specification, the total indirect associations are 0.405 for Operational Performance (95% percentile CI [0.231, 0.626]), 0.341 for Innovation Performance (95% CI [0.152, 0.546]), and 0.405 for Financial Performance (95% CI [0.224, 0.641]). Under the
N = 222 expanded-control specification, the corresponding estimates are 0.468 (95% CI [0.279, 0.724]), 0.370 (95% CI [0.166, 0.608]), and 0.452 (95% CI [0.254, 0.712]). Complete expanded-control estimates, including bootstrap standard errors,
p-values, percentile confidence intervals, and all control coefficients, are reported in
Supplementary Table S9; indirect-effect sensitivity results are reported in
Supplementary Table S10.
A covariance-based SEM robustness model provides a complementary assessment under an alternative estimator. Model fit is chi-square(317) = 626.30, CFI = 0.924, TLI = 0.910, RMSEA = 0.075, and SRMR = 0.064. Learning-Oriented GVC Participation remains strongly associated with within-role upgrading (β = 0.802, p < 0.001) and role-reconfiguring upgrading (β = 0.795, p < 0.001), whereas its direct associations with Operational, Innovation, and Financial Performance remain nonsignificant. In contrast, the individual within-role and role-reconfiguring upgrading–performance coefficients are nonsignificant under this estimator. Thus, the covariance-based model reproduces the strong participation–upgrading associations and the absence of direct Learning-Oriented GVC Participation-to-performance associations, while the scope-specific upgrading–performance coefficients remain estimator-sensitive.
4.6. Summary of Hypothesis Testing
Table 7 summarizes the hypothesis tests from the primary PLSc analysis. The two participation–upgrading hypotheses are clearly supported. Evidence for the scope-specific upgrading–performance hypotheses is substantially weaker: only H2e is supported under the primary PLSc specification, while H2b is inference-sensitive. By contrast, all three hypotheses concerning the combined indirect association through the two upgrading scopes are supported and remain stable across the PLSc response-quality and expanded-control sensitivity analyses.
5. Discussion and Conclusions
5.1. Discussion of Findings
The main result is straightforward. Learning-Oriented GVC Participation is strongly associated with both within-role (Low tier) and role-reconfiguring (High tier) upgrading, but it has no significant direct association with Operational, Innovation, or Financial Performance. At the same time, the combined indirect associations through the two upgrading scopes are positive for all three outcomes and remain different from zero in the stricter response-quality and expanded-control analyses. This pattern suggests that internal capability upgrading is important for understanding how learning-oriented GVC participation is related to firm performance.
The absence of direct performance associations also helps separate participation from capability. Learning-Oriented GVC Participation captures a firm’s emphasis on technology transfer and technical cooperation. That is different from actually changing what the firm can produce, how it organizes production, which functions it performs, or which value-chain and market activities it enters. Upgrading captures these internal capability changes more directly. The results are therefore consistent with the view that the performance relevance of learning-oriented participation is better understood together with internal upgrading than as a direct participation–performance relationship.
This interpretation is not a claim of causal sequence. Participation, upgrading, and performance were measured in the same survey wave, so reverse ordering is possible. In this paper, capability transformation denotes the conceptual distinction between capability-oriented external engagement and internal upgrading; the data do not show that external knowledge first produced upgrading and then produced performance.
The individual upgrading-performance paths are weaker and more sensitive to the estimation method. This is not surprising because Product and Process upgrading can occur together with Functional and Value-chain upgrading, and the two higher-order groupings are empirically close. Their unique coefficients therefore reflect each scope after accounting for substantial shared variance. The more consistent combined indirect results suggest that the different forms of upgrading may be better understood as a connected pattern of capability change than as competing routes in which one scope is generally superior.
The supplementary comparison with Transaction-Oriented Participation also points to the importance of what firms emphasize in their GVC relationships. The single-item transaction measure adds no significant association with either upgrading scope once Learning-Oriented GVC Participation is included. Because this comparison uses only one transaction item and the two participation measures are highly correlated, the result should be treated as suggestive rather than as evidence that transactional participation is unimportant.
Environmental Uncertainty shows a different pattern. It is positively associated with both upgrading scopes, but it does not significantly change the relationship between Learning-Oriented GVC Participation and upgrading. One possible explanation is that firms report more capability adjustment under uncertain conditions while the learning-upgrading relationship remains relatively similar across uncertainty levels. Another possibility is that market, technological, competitive, supply, and regulatory uncertainty work differently and partly offset one another when combined into one measure.
5.2. Theoretical Implications
First, the study clarifies what Learning-Oriented GVC Participation means. It does not measure how much knowledge a firm actually acquires, its absorptive capacity, or knowledge provided by a lead firm. Instead, it captures the firm’s emphasis on technology transfer and technical cooperation. This shifts attention from GVC participation alone to the capability-related content of the relationship [
4,
6,
11].
Second, the study treats within-role and role-reconfiguring upgrading as analytical groupings based on the extent of role change, not as steps in a fixed upgrading ladder. Product and Process upgrading mainly deepen capabilities within an existing GVC role, while Functional and Value-chain upgrading involve broader changes in the functions performed or the domains in which the firm operates. The distinction does not imply differences in value, difficulty, superiority, or sequence [
7,
8,
9]. The measurement results also support keeping the four first-order dimensions conceptually distinct while using within-role/role-reconfiguring as a broader analytical grouping.
Third, the study brings the participation-upgrading and upgrading-performance arguments into one framework. The combined indirect associations through within-role and role-reconfiguring upgrading remain different from zero in the primary PLSc model, the stricter response-quality analysis, and the expanded-control analysis, while the individual upgrading-performance paths are less stable across estimators and control specifications. The key implication is therefore not that one upgrading scope independently drives a specific outcome, but that learning-oriented participation is related to performance through the combined pattern of capability upgrading.
This also provides a system-informed contribution. Instead of treating participation, upgrading, and performance as separate one-to-one relationships, the study shows that they are closely connected within the same framework. The data do not test feedback loops, emergence, or multilevel adaptation. The systems perspective here is therefore limited to showing the interdependence among participation, several forms of upgrading, and different performance outcomes.
5.3. Implications for Firms, Policymakers, and GVC Lead Firms
For participating firms, the findings suggest that the content of GVC relationships matters alongside participation itself. Firms should consider whether these relationships involve technology transfer and technical cooperation rather than looking only at transaction volume or market access. They should also consider how such relationships are accompanied by internal improvements in products, processes, organizational functions, and value-chain activities. The results do not support a universal sequence from within-role to role-reconfiguring upgrading. The two scopes are better viewed as distinct but related parts of a firm’s upgrading efforts.
For policymakers and industrial-support institutions, the findings suggest that GVC programs should look beyond export entry or transaction growth and pay attention to capability building. Supplier-development programs, technology-extension services, joint R&D support, technical training, and cross-organizational collaboration may help firms make better use of technology-transfer and technical-cooperation opportunities. Program evaluation could also track Product, Process, Functional, and Value-chain upgrading in addition to export and financial outcomes. Because the evidence is cross-sectional, these recommendations should be read as implications consistent with the observed relationships rather than as proven causal effects of particular policies.
For GVC lead firms, the findings suggest value in adding capability-development activities to supplier relationships rather than focusing only on price, quality, and delivery. Technical assistance, supplier training, joint problem solving, engineering collaboration, and co-development are possible ways to do this. Supplier-development programs also need not assume one linear upgrading path, because firms may differ in whether they need deeper Product/Process capabilities or broader Functional and Value-chain change. Because lead-firm behavior was not directly measured, these points are theory-based extensions of the firm-level findings rather than direct evidence about lead-firm practices.
5.4. Limitations and Future Research
This study has several limitations. First, all focal variables were reported by the same respondent in one survey wave using similar response formats and overlapping reference periods. The design cannot establish causal order, and reverse causality is possible: firms with stronger capabilities or better performance may also be more likely to form technology-transfer and technical-cooperation relationships. Common-rater, common-format, and common-timing effects may also inflate the observed relationships. Harman-type and factor-structure checks do not remove this concern. Future studies should use longitudinal data, multiple informants, archival outcomes, or stronger identification designs where feasible.
Second, several measures could be improved. Learning-Oriented GVC Participation uses two items and does not directly measure realized knowledge transfer or absorptive capacity. Transaction-Oriented Participation uses one item and is included only as a supplementary comparison. Innovation Performance uses a two-item score because an unconstrained two-indicator latent specification yielded a Heywood-type boundary solution in which the QPER5 residual variance converged to approximately zero. Unlike the other common-factor constructs, which have three or four indicators and can be estimated without comparable equality constraints, a two-indicator factor would require additional identifying restrictions. We therefore used the mean of the two highly consistent innovation items rather than imposing constraints unique to that outcome. The four first-order upgrading dimensions also provide a clearer measurement structure than the broader within-role/role-reconfiguring grouping. Future research should use richer multi-item measures and test alternative ways of organizing upgrading across industries and countries.
Third, the historical fieldwork records do not allow a full reconstruction of recruitment and vendor-level screening procedures. The primary analysis excludes 28 completely invariant response patterns, and the stricter N = 215 sample is used as a sensitivity check. These analytical checks cannot replace prospectively documented fieldwork safeguards. Future surveys should document recruitment and respondent-verification procedures in advance and set response-quality rules before outcome analysis.
Fourth, the sample is concentrated in coastal Chinese electrical/electronics, ICT, and semiconductor manufacturing. The study does not directly measure lead-firm governance, bargaining asymmetry, ownership, knowledge complexity, or the firm’s exact GVC position. The findings should therefore be generalized cautiously beyond similar firms. Future studies should test the model in inland regions, traditional manufacturing industries, and other Asian and emerging economies, ideally with direct measures of governance and value-chain position [
7,
19,
26].
Fifth, Environmental Uncertainty combines technological, market, competitive, supply, and regulatory uncertainty in one measure. The nonsignificant interactions may mean that the observed learning–upgrading relationship is relatively similar across uncertainty levels, or that different types of uncertainty work in different directions and offset one another. Future studies should separate these sources of uncertainty and test more specific contingency arguments.
5.5. Conclusions
This study examines how Learning-Oriented GVC Participation is associated with capability upgrading and firm performance among Chinese manufacturing firms. Three conclusions stand out. First, firms that place greater emphasis on technology transfer and technical cooperation also report stronger within-role and role-reconfiguring upgrading. Second, Learning-Oriented GVC Participation has no significant direct association with Operational, Innovation, or Financial Performance. Third, the combined indirect associations through the two upgrading scopes are positive for all three outcomes and remain different from zero in the stricter response-quality and expanded-control analyses, while many individual upgrading-performance paths are weak or sensitive to the estimation method and control specification.
The findings favor a configuration-based interpretation of capability upgrading rather than a simple hierarchical or direct causal account. The performance relevance of Learning-Oriented GVC Participation is better understood through the combined pattern of upgrading than through a direct participation-performance relationship. From a systems perspective, participation, multiple forms of upgrading, and performance are connected, although the cross-sectional design cannot establish temporal feedback or dynamic system change.