


Highlights
Please indicate how your work links to systems science via your contributions to systems practice, theory, and/or methodology.
- •
- The socio-technical framework treats household motivation, platform use, and institutional responsiveness as interacting system components.
- •
- For systems practice, evaluation separates registration, repeated use, and user evaluation instead of treating enrollment as system performance.
What are the main findings and/or the implications of the main findings?
- •
- A one-SD increase in composite participation motivation is associated with a 0.17-SD increase in perceived platform performance within households.
- •
- Registered low-frequency users rate the platform 0.30 SD below high-frequency users; account counts alone are an incomplete system-performance metric.
Abstract
Registration targets can be met even when citizens seldom return to a rural digital platform. This study interprets the registration-use gap as a possible behavioral manifestation of a formal participation trap. Use frequency captures engagement depth rather than citizens’ voice or influence over platform decisions and services. The analysis uses a balanced panel of 336 rural households in Yantai, China, observed in 2023 and 2024, to relate household motivation and digital capability to platform use and perceived performance. Household fixed-effects estimates associate a one-standard-deviation increase in composite participation motivation with a 0.17-standard-deviation increase in perceived platform performance. Registered low-frequency users rate the platform 0.30 standard deviations lower than registered high-frequency users; neither registered group differs significantly from unregistered households. An all-category frequency gradient, covariate-balanced comparisons, and sensitivity analyses preserve the behavioral ordering. Because participation and evaluation may evolve jointly, the estimates are associational. Registration, repeated use, and user feedback should therefore be assessed separately. The numerical estimates are bound to the analytic panel; the analytically transferable contribution is a testable systems proposition that registration coverage is not a sufficient indicator of sustained engagement or user feedback.
1. Introduction
Registration records access to a digital-governance system, but enrollment does not show whether citizens return, complete a task, or receive a useful response. In the Yantai panel, 79.9% of household–year observations are registered, while mean participation frequency falls from 3.443 in 2023 to 2.795 in 2024. This divergence raises a systems question: when does nominal inclusion fail to develop into sustained engagement and useful feedback?
Classical participation research distinguishes nominal inclusion from participation that gives citizens voice or influence. Arnstein separates tokenistic participation from citizen power [1]. White distinguishes nominal participation, which may serve inclusion and display, from representative and transformative participation that provides voice or empowerment [2]. In rural development, pretty places passive and consultative participation below interactive participation and self-mobilization [3]. Following these distinctions, formal participation is understood here as nominal or procedural inclusion that does not by itself ensure sustained engagement, voice, or influence. Substantive participation entails meaningful engagement through which citizens can express needs and affect service processes or outcomes. The survey does not observe voice or influence directly; it examines the narrower registration-use gap as one possible behavioral manifestation of this distinction.
A rural digital-governance platform is a socio-technical system rather than a stand-alone technical artifact. Its performance emerges from interactions among household users, the platform interface, and the local organizations that mobilize participation and respond to citizen demands [4,5,6,7]. The system boundary used here therefore spans three linked subsystems: households supply motivation and capability, the platform converts access into opportunities for interaction, and implementing organizations determine whether interaction generates information or service feedback.
Within the household subsystem, access becomes repeated use only when citizens are both able and willing to engage. Digital-inequality research distinguishes access, skills, differentiated use, and realized outcomes [8,9,10,11]. Rural settings can intensify these constraints because connectivity, skills, and locally relevant support are unevenly distributed [12], potentially reproducing inequalities familiar from community participation [13,14]. Motivation is a second state variable. The theory of planned behavior and self-determination theory link sustained action to perceived value, norms, perceived control, and autonomous endorsement [15,16,17,18].
The institutional subsystem shapes both participation incentives and the feedback citizens receive. Registration is easy to observe and reward, while repeat use, deliberation quality, problem resolution, and citizen learning are harder to measure. Performance systems can redirect effort toward what is counted [19], and digital encounters can impose learning, compliance, and psychological costs through opaque or unresponsive processes [20,21,22,23]. Classical expectancy-disconfirmation research shows that evaluations depend on the gap between prior expectations and realized service experience [24,25,26]. E-government studies likewise link trustworthiness and perceived responsiveness to citizen use and confidence in government [27,28].
Chinese-language research provides a directly relevant institutional account. Studies of digital-governance formalism describe target-driven implementation, documentary compliance, and the displacement of substantive governance by visible digital outputs [29]. Work on ‘digital suspension’ shows how platforms may remain detached from frontline work, citizen needs, and local governance processes [30,31]. These studies mainly examine state organizations, cadre behavior, and implementation incentives. By contrast, research on Tencent’s WeCounty platform shows how sustained interaction can support a locally embedded digital public sphere [32]. The present study shifts the unit of analysis to households and measures the alignment among registration, use frequency, and user feedback. It therefore complements, rather than relabels, state-centered accounts of digital formalism.
Recent systems research connects rural digital governance to social participation and shows that technological and organizational cues operate differently across governance settings [33,34]. Related work documents the organizational complexity of public-sector digital transformation, the institutional mechanisms of rural digital governance, and links between participation and political trust [7,35,36]. What remains unresolved is how registration, behavioral depth, and user feedback align within the same household-platform-institution system. Existing accounts rarely separate the stock of registered users from the process through which those users become active participants.
The analysis uses a balanced panel of 336 rural households observed in 2023 and 2024 in Yantai, Shandong Province. A participation-choice model maps the system into measurable components: registration captures access, participation frequency captures behavioral depth, and perceived platform performance captures user feedback. Household fixed effects remove stable household differences, while a common year shift and estimable time-varying covariates enter the preferred specification. Three-group contrasts distinguish unregistered, registered low-frequency, and registered high-frequency observations. Entropy balancing, a two-step decomposition, a heteroskedasticity-based instrumental-variable sensitivity analysis, and a coefficient-stability analysis under proportional selection provide supporting evidence rather than substitutes for exogenous variation.
Three findings organize the empirical contribution. First, within-household increases in composite participation motivation are positively associated with perceived platform performance. Second, registered low-frequency observations evaluate the platform 0.301 standard deviations below registered high-frequency observations, although neither category differs significantly from unregistered observations in the fixed-effects model. Third, participation frequency is consistent with part of the contemporaneous motivation–performance relationship, while contextual moderation remains suggestive. These numerical estimates characterize relationships within the analytic panel and are not population estimates for rural Yantai or China. The analytically transferable contribution is a testable systems proposition: coverage, behavioral process, and user feedback are distinct states, so registration rates alone are an insufficient indicator of system performance. The observed pattern is interpreted as a possible behavioral manifestation of a formal participation trap, not as a direct measure of the classical concept or an estimated causal penalty from registration.
Section 2 defines the system boundary and develops the participation-choice model. Section 3 maps the system constructs to the Yantai panel and explains the empirical design. Section 4 reports the within-household, categorical, contextual, and sensitivity results. Section 5 interprets the findings as feedback and coordination problems in a socio-technical governance system. Section 6 concludes.
2. Rural Digital Governance as a Socio-Technical System: Model and Hypotheses
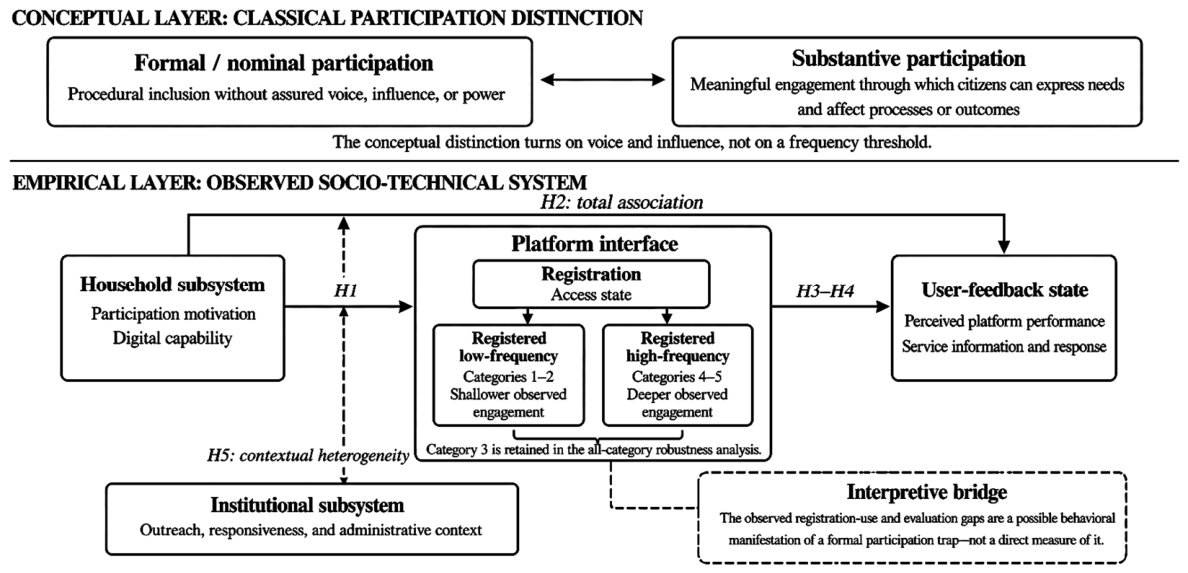
Figure 1 defines the analytical boundary of the rural digital-governance system. The household subsystem contains participation motivation and digital capability; the platform interface contains registration and behavioral depth; and the institutional subsystem supplies outreach and responsiveness. Perceived platform performance is modeled as user feedback generated by the interaction of these components. Registration is therefore an access state, frequency is a behavioral process, and perceived performance is a feedback signal. The model is deliberately stylized: it organizes the hypotheses and clarifies the distinction among nominal inclusion, observed engagement, and substantive participation, but it does not convert the two-wave observational design into a causal or fully dynamic systems analysis [4,5].
Figure 1.
Conceptual and empirical framework and hypothesis logic.
2.1. System Boundary and Household Participation Choice
Within the household subsystem, farmer i chooses a participation depth e_i in [0, e-bar]. Participation depth is the frequency or intensity with which the household uses the platform to obtain information, communicate demands, or monitor village affairs. The decision links household motivation and capability to the behavioral process observed at the platform interface.
Participation yields a governance benefit , where denotes institutional responsiveness, i.e., the probability that the platform substantively addresses articulated demands:
Participation also entails a convex cost, . The cost parameter is lower for households with greater digital capability. Institutional responsiveness enters the benefit function through g(e_i, gamma); we assume g(e_i, 0) = 0 and partial g/partial gamma > 0. Subsequent equations suppress gamma to keep the notation compact.
The farmer chooses to maximize net utility. The first-order condition is . Applying the Implicit Function Theorem to this condition yields the comparative static of optimal participation depth with respect to motive:
Since g′ > 0, g″ < 0, and the cost parameter is positive, both the numerator and denominator in Equation (3) are positive, so ; by analogous reasoning, . Stronger participation motivation therefore raises the chosen engagement depth, while digital capability raises engagement by lowering marginal participation costs. This yields the first hypothesis.
Hypothesis H1.
Within-household increases in composite participation motivation are positively associated with increases in participation frequency.
2.2. Behavioral Link and User Feedback
Perceived platform performance is the user-feedback component of the system. It is not determined by motives alone: households form evaluations through direct appraisal, behavioral engagement, service feedback, and comparisons between realized responsiveness and prior expectations.
Equation (4) combines three channels. The direct appraisal component (η > 0) allows motivation to shape evaluations at a common engagement depth. The information-feedback component (λ > 0) captures benefits obtained through deeper use. The expectancy-disconfirmation component (μ > 0) compares realized responsiveness with the household’s reference point. Users who receive meaningful service feedback can update expectations through experience, , whereas registrants whose participation remains nominal may enter with expectations raised by promotion, , where . Evaluations improve when realized platform responsiveness exceeds the reference point and deteriorate when it falls short.
Substituting into Equation (4) and differentiating with respect to motive:
Hypothesis H2.
Within-household increases in composite participation motivation are positively associated with increases in perceived platform performance.
Hypothesis H3.
Participation frequency accounts statistically for part of the contemporaneous within-household association between composite motivation and perceived platform performance.
2.3. The Formal Participation Trap as System Misalignment
A socio-technical system becomes misaligned when the access subsystem expands more quickly than the behavioral and feedback processes that give access practical value. Registration campaigns can therefore produce accounts without repeated use. In the classical literature, however, the difference between nominal and substantive participation turns on voice, influence, and power rather than on a frequency threshold [1,2,3]. The model therefore treats the two observed registered states as indicators of engagement depth; it does not equate them with the classical concepts.
For the model, S denotes the higher-frequency registered state, with and experience-calibrated expectations . F denotes the lower-frequency registered state, with and potentially elevated expectations
. These states operationalize engagement depth only. They do not define formal or substantive participation, and the data do not observe autonomy, voice, influence, coercion, or the expectation premium.
Users in state S choose a positive engagement depth, , and can observe service feedback. Users in state F have minimal behavioral depth, , and may nevertheless hold expectations raised by registration or official promotion. Substituting these states into Equation (4) produces a relative evaluation gap:
Thus whenever deeper engagement yields information or service value. Expectation inflation amplifies the gap but is not required: even with , users in state S may receive feedback unavailable to users in state F. The prediction is relative; the model does not require either observed group to differ completely from unregistered households.
Equation (6) defines an internal evaluation gap between registered high-frequency and registered low-frequency users. The gap widens when institutional responsiveness makes repeated use informative, when engagement produces service value, or when registration raises expectations that low-frequency experience does not confirm. We interpret this gap as one possible behavioral manifestation of a formal participation trap. The equation does not define formal participation itself and does not impose a causal registration penalty.
Hypothesis H4.
Registered low-frequency observations report lower perceived platform performance than registered high-frequency observations.
2.4. Contextual and Household-Level Heterogeneity
Finally, consider whether the marginal performance effect of motives varies with farmer characteristics. From Equation (5), the marginal performance effect of motive is . Examining how this varies with digital capability d_i reveals two forces operating in opposite directions. On one hand, farmers with higher digital capability have a lower cost coefficient κi, which by Equation (3) implies a larger , a positive heterogeneity. On the other hand, diminishing marginal returns (g″ < 0) compress the incremental benefit for those already participating at high levels, a negative heterogeneity. Because these two force points in opposite directions, the sign of net heterogeneity cannot be determined a priori from theory alone; empirical data must adjudicate. This logic suggests the following.
Hypothesis H5.
The motivation–performance association varies with the county registration environment and with education, digital capability, age, cadre status, or registration status.
3. Materials and Methods
3.1. Data Source and Panel Sample
Yantai is used as a theoretically informative setting rather than as a statistically representative miniature of rural China. The panel spans nine county-level units and permits examination of access, use, and feedback under differing local registration environments. This within-setting administrative variation is relevant to the systems question, but it is not treated as evidence of population representativeness because the retained materials do not document how households were selected or distributed across the county-level units.
The source survey followed rural households in Yantai, Shandong Province, in 2023 and 2024. The analytic file contains a balanced panel of 336 households and 672 household–year observations. The Stata script verifies a unique household–year record for every observation and exactly two observations per household. Registration was recorded for 268 households in 2023 and 269 in 2024. The balanced file eliminates attrition between the two retained waves. It does not resolve selection before the analytic panel was formed: the available materials do not report sampling strata, roster coverage, household replacement rules, gross invitations, refusals, or wave-specific response rates. These quantities cannot be reconstructed from the analysis file.
The original study states that households were drawn from village rosters across several county-level units in Yantai and that the same households were followed across waves. The Supplementary Materials contain neither sampling weights nor the population frame. Village-cadre households account for 78.9% of household–year observations, so the panel is markedly cadre-heavy. A defensible comparison with the rural Yantai population is not possible because the retained materials do not provide the sampling-frame distribution or labels for all demographic codes. These omissions prevent statistical generalization of prevalence, means, or coefficient magnitudes to rural Yantai or China. They do not remove the panel’s value for examining whether access, behavioral engagement, and user feedback can become misaligned within observed households; Section 5.5 defines the bounded relational evidence and the conditions for analytical transferability.
3.2. Measures and System Indicators
Perceived platform performance. The outcome is the arithmetic mean of three survey items (performance, perf2, and perf3) concerning overall platform evaluation, perceived administrative efficiency, and service quality. The composite ranges from 1 to 5 in the analytic data. It is a user-reported evaluation, not an objective measure of administrative output or problem resolution. The regression outcome is standardized across the pooled two-wave sample.
Composite participation motivation. The imported variable motivation is a normalized composite ranging from approximately 0.04 to 0.89. The source questionnaire combines items about personal value and enjoyment with items about respected villagers, neighbors, village committees, and government encouragement. The measure therefore blends autonomous motivation, subjective norms, and controlled encouragement. It should not be interpreted as a pure intrinsic-motivation scale. The regression predictor is standardized across the pooled sample.
Participation frequency. Behavioral depth is measured on a five-category frequency scale from 1 to 5. The variable is standardized in the main regressions. For a sharp descriptive contrast, unregistered observations are coded separately; registered observations in categories 1–2 form the low-frequency registered group, and registered observations in categories 4–5 form the high-frequency registered group. These groups proxy shallower and deeper observed engagement; they do not define formal and substantive participation in the classical sense, which would require measures of voice, influence, and service responsiveness. Category 3 is excluded from this contrast, removing 169 of 672 observations (25.1%). The cutoffs are an analytic convention, not a naturally identified threshold. The five-category trend among all 537 registered observations retains category 3 and provides the main cutoff-robustness check.
Digital capability and household characteristics. Digital capability is the mean of three survey variables (cap1, cap2, and cap3) and ranges from 0.33 to 5. The models also reference gender, education category, village-cadre status, and age category. The supplied do-file codes gender as 1–2, education as 1–4, cadre status as 0–1, and age as 2–5. The codebook retained with the Supplementary Materials does not identify the labels attached to the two gender codes or the substantive cut points for the ordinal age and education categories. Cadre status and registration are binary indicators, with 1 denoting yes. Most demographic variables are time invariant and are absorbed by household fixed effects.
Administrative-push proxy. For each county–year, the script calculates the registration rate excluding the focal household and standardizes that leave-one-out rate. This construction avoids mechanical inclusion of the focal household in its own contextual measure. It does not, however, isolate administrative pressure from peer behavior, platform quality, or county–year shocks.
3.3. Empirical Strategy
The primary specification relates standardized perceived platform performance to standardized composite participation motivation, household fixed effects, a common 2024 shift, time-varying digital capability, and cadre status. Standard errors are robust to within-household dependence. The estimating equation is:
where Pit is standardized perceived platform performance, Mit is standardized composite participation motivation, Xit contains the estimable time-varying covariates, μ denotes household fixed effects, and λ denotes the common year effect. With two waves, β is identified by the covariance between within-household changes in motivation and performance after the common year shift and covariate changes are removed.
The source script labels one model “full controls,” but gender, education, age, and age squared are absorbed because they do not vary within households. Cadre status is estimated where it changes over time and is reported in the preferred specification. The paper describes the estimable adjustment set directly rather than implying that absorbed variables provide additional within-household adjustment.
The three-group model includes household and year fixed effects, composite motivation, and digital capability. It is estimated on 503 observations from 314 households because frequency-3 registered observations are omitted and some households contribute only one classified wave. The coefficient comparing the low- and high-frequency registered groups is a within-household conditional contrast for households providing relevant variation; it is not an average causal effect of registration or a direct test of substantive citizen influence.
Entropy balancing [37] is used only for 2024 cross-sectional comparisons. Control observations are reweighted to match treated observations on covariate means for gender, age, education, cadre status, and digital capability. The log reports convergence and near-equality of weighted means. It does not report effective sample size, maximum weights, or complete overlap diagnostics; cadre status is omitted from two comparisons because of collinearity. Moreover, digital capability is measured contemporaneously in 2024. The weighted estimates are accordingly labeled covariate-balanced associations.
The two-step decomposition first regresses standardized frequency on standardized motivation with household fixed effects and then regresses standardized perceived performance on both variables. The product of the two coefficients is bootstrapped 500 times by household cluster. Year fixed effects are not included in these equations. The product describes a contemporaneous statistical decomposition and does not establish temporal mediation.
Sensitivity analyses use two distinct approaches [38,39]. The first is a heteroskedasticity-based instrumental-variable analysis following Lewbel: instruments are generated from model heteroskedasticity and included exogenous variables. Its validity depends on heteroskedasticity and orthogonality conditions that a strong first stage cannot establish. The second is Oster’s coefficient-stability analysis under proportional selection, which assesses how selection on unobservables would need to compare with selection on observables to explain the estimate. Applications to a Chinese household panel and to rural household satisfaction illustrate the use of these methods in related survey settings [40,41]. Here, both analyses remain assumption-dependent diagnostics rather than sources of design-based identification.
3.4. Descriptive Statistics
Table 1 summarizes the measurement scales and pooled sample distribution. Mean perceived performance declined from 2.984 in 2023 to 2.851 in 2024. Mean participation frequency declined from 3.443 to 2.795, while mean motivation changed little (0.400 to 0.393). Across both waves, the categorical groups contain 135 unregistered, 173 low-frequency registered, and 195 high-frequency registered observations; 169 registered category-3 observations are excluded only from the sharp group contrast.
Table 1.
Descriptive statistics.
4. Results
4.1. Within-Household Motivation–Performance Association
As shown in Table 2, the pooled association is 0.230 SD. Household and year fixed effects reduce the coefficient to 0.185 SD (SE = 0.056, p = 0.001). The preferred specification adds time-varying digital capability and cadre status and yields 0.170 SD (SE = 0.046, p < 0.001). A one-SD within-household increase in composite motivation is therefore associated with a 0.170-SD increase in perceived platform performance. The estimate supports H2 as an association, not as a causal effect.
Table 2.
Baseline association between composite participation motivation and perceived platform performance.
The specification including participation frequency reduces the motivation coefficient to 0.143 SD. Frequency itself is not statistically significant in this year-adjusted model at 5% (p = 0.120). Because frequency may lie on the pathway from motivation to evaluation and may also respond to platform performance, this column is not treated as the preferred total-association specification.
4.2. Observed Registration-Frequency States
As shown in Table 3, registered low-frequency observations are evaluated 0.301 SD lower than registered high-frequency observations (SE = 0.132, p = 0.023), supporting H4 as a conditional within-household contrast. Neither registered category differs significantly from unregistered observations. The detected result is therefore a low–high-frequency evaluation gap among registered households, not a direct measure of the classical formal-substantive distinction or an absolute penalty caused by registration.
Table 3.
Three-group household fixed-effects comparison.
The sample composition also matters. Because 169 middle-frequency observations are omitted from the three-group contrast and the fixed-effects model relies on households with useful within variation, that contrast does not describe every registered household. The five-category trend uses all 537 registered household–year observations, including the 169 category-3 cases. Perceived performance rises by 0.204 SD per one-category increase in frequency (SE = 0.048, p < 0.001). This result shows that the reported ordering is not created solely by dropping the middle category, although the linear trend remains observational.
4.3. Entropy-Balanced 2024 Comparisons
As shown in Table 4, the entropy-balanced 2024 comparisons show the same ordering. Registered low-frequency users evaluate the platform less favorably than registered high-frequency users, and the contrast remains precise after regression adjustment. Low-frequency users also report lower evaluations than unregistered respondents, whereas high-frequency users do not differ significantly from the unregistered group. Because participation group, covariates, and performance are measured contemporaneously, these estimates are supporting cross-sectional associations rather than treatment effects.
These estimates are secondary evidence. Participation group, digital capability, and perceived performance are measured contemporaneously, and unmeasured selection may remain after mean balancing. In addition, the absence of reported effective sample sizes prevents a full assessment of weight concentration. The results strengthen the descriptive evidence for a low–high-frequency evaluation gap but cannot identify the effect of being induced to register or the influence citizens exercise through the platform.
Table 4.
Entropy-balanced cross-sectional associations in 2024.
4.4. Contemporaneous Two-Step Decomposition
As shown in Table 5, composite motivation is positively associated with participation frequency within households, supporting H1. Frequency is also positively associated with perceived performance conditional on motivation, and the positive bootstrapped coefficient product is consistent with H3 in its limited statistical sense. Because the two equations omit the year indicator used in the preferred performance model, the product is reported as a specification-specific contemporaneous decomposition; no mediated proportion is claimed.
Table 5.
Household fixed-effects two-step decomposition.
4.5. Administrative Context and Heterogeneity
As shown in Table 6, the interaction with the leave-one-out county registration rate is negative. Household-clustered inference gives p = 0.043, while clustering at the contextual level gives p = 0.081 with only nine counties. The contextual inference is more relevant because the moderator varies at the county–year level, although few-cluster uncertainty remains. The result is therefore suggestive evidence that the motivation–performance slope is weaker where registration is more prevalent.
Table 6.
Administrative-push interaction and exploratory heterogeneity.
None of the five household-level interaction terms is statistically detectable. The estimates do not establish homogeneity, inclusiveness, or the absence of capability barriers. They show only that this two-wave sample does not estimate the tested slope differences precisely enough to reject zero.
4.6. Sensitivity and Robustness Checks
As shown in Table 7, the coefficient from the heteroskedasticity-based instrumental-variable analysis is close to the fixed-effects estimate.
Table 7.
Sensitivity analyses.
The first-stage statistic is large, while the Hansen and DWH tests do not reject at 5%. These diagnostics address instrument relevance and testable implications, not the core orthogonality condition. The high-dimensional first stage also makes the magnitude of the F statistic a poor standalone credibility claim.
The coefficient-stability analysis under proportional selection yields delta values indicating stability within the assumed selection model. The calculation does not show that omitted-variable bias is impossible, especially because most demographic controls are absorbed by household fixed effects and the remaining threats are time-varying. Together, the two exercises show only that the main coefficient is not mechanically fragile to these particular diagnostics.
Table 8 shows that the sign of the motivation association is positive across the reported checks. The smaller non-switcher sample produces a larger estimate but changes the identifying sample substantially. The county-indicator model controls geographic averages without removing stable household heterogeneity and is therefore not equivalent to the main model.
Table 8.
Additional robustness and descriptive checks.
The results also report a Harman first-factor share of 43.09%. This conventional diagnostic cannot rule out common-method variance. Household fixed effects remove stable response styles, but time-varying mood, consistency motives, and shared measurement context remain possible. A permutation exercise for the entropy-balanced contrast holds the original balancing weights fixed after treatment reassignment; because the weights are treatment-specific, its p-value is not used as confirmatory evidence. A contemporaneous SEM permutation likewise estimates a different quantity from the fixed-effects decomposition and does not establish temporal mediation.
5. Discussion
The estimates identify a coordination problem inside the rural digital-governance system. Coverage, behavioral depth, and user feedback do not move as a single performance dimension. Within households, participation orientation moves with platform evaluation, while low-frequency registered observations evaluate the platform less favorably than high-frequency registered observations. These patterns do not show that motivation causes better governance or that registration harms citizens. They show that a platform can achieve nominal reach without aligning the behavioral and feedback processes that would support substantive participation.
5.1. User Feedback and the Motivation–Performance Association
The within-household estimate captures one link in the system rather than an overall measure of system performance. A one-standard-deviation increase in composite motivation is associated with a 0.170-standard-deviation increase in perceived performance (Table 2). Household fixed effects remove stable differences in optimism, status, digital familiarity, and other persistent traits, and the estimate changes little when time-varying digital capability and cadre status enter the model. The association is therefore not generated only by comparing persistently engaged households with persistently disengaged ones. Its moderate size nevertheless leaves substantial variation to platform quality, service encounters, and household-specific shocks.
The content of the motivation index limits the behavioral interpretation. The measure combines personal value and enjoyment with social norms, village-committee influence, and government encouragement. It is best understood as a broad participation orientation rather than intrinsic motivation. This distinction follows from theories that separate attitudes, perceived control, and social pressure from autonomously endorsed action [15,16,18]. Variation in the index may reflect expected platform returns, conformity to local norms, or official mobilization as well as personal interest. A policy that raises external encouragement need not reproduce the association estimated from the composite.
The coefficient is a descriptive equilibrium relationship, not a policy elasticity or an identified feedback effect. Better service can raise both motivation and performance evaluations; a change in village leadership can move both variables; and a favorable household shock can alter both willingness to participate and the propensity to rate the platform positively. With two periods, the fixed-effects estimate summarizes the conditional covariance of household-level changes after removing a common year shift. This moment rules out explanations based only on stable household sorting, but it cannot identify the direction or timing of the system feedback.
5.2. The Formal Participation Trap as System Misalignment
The comparison between registered low- and high-frequency observations reveals the paper’s clearest system misalignment. Low-frequency observations evaluate the platform 0.301 standard deviations below high-frequency observations (Table 3), a gap about 1.8 times the magnitude of the main one-standard-deviation motivation association. Yet neither registered group differs significantly from unregistered observations in the household fixed-effects model. This registration–engagement gap is consistent with one behavioral manifestation of a formal participation trap. It is not a direct measure of citizen influence or an estimated penalty from registration itself.
Reverse causality is the main identification concern for the low–high-frequency ordering. Repeated use may produce information, successful service encounters, or feedback from officials, but service experience can also determine subsequent use: dissatisfied households may stop using the platform, while satisfied households return. Registration may raise expectations that low-frequency users never see confirmed, as in expectancy-disconfirmation models [24,25,26]. Unobserved needs, recent service encounters, and local platform quality can affect both frequency and evaluations. The two-wave survey does not identify the direction or timing of these channels.
The decomposition narrows, but does not resolve, this ambiguity. Motivation predicts frequency within households, frequency predicts performance conditional on motivation, and their coefficient product is 0.0438 (Table 5). These equations are contemporaneous and omit the common year effect used in the preferred performance specification. The product is therefore consistent with behavioral engagement linking motivation and evaluation, but it cannot distinguish learning from reverse causality or a common shock. The entropy-balanced 2024 comparisons provide an additional ordering check, not a solution to the timing problem: observed covariates are balanced, but participation status and performance remain jointly determined.
Participation frequency should also not be treated as a welfare measure. More logins may represent useful interaction, but they can also reflect repeated attempts to complete an unresolved task. Low use may indicate disengagement, or simply low need and a preference for an effective offline channel. The positive frequency-bin gradient among registered households reduces dependence on the low/high cutoff, but it does not convert activity into value. The relevant outcome for policy is successful exchange between citizen and state, of which frequency is only an intermediate indicator.
5.3. Performance Metrics, Organizational Response, and System Alignment
Registration is attractive to implementing agencies because it is easy to observe, aggregate, and assign to administrative units. Service quality, useful deliberation, and problem resolution are harder to verify. When performance systems reward the observable margin, effort can shift toward account creation and away from the organizational work that makes an account useful [19]. Digital interfaces can also shift learning, compliance, and psychological costs onto citizens [20,21,23]. The registration–engagement gap is consistent with this coordination problem, although the survey does not observe official targets, staff effort, workflow capacity, or sanctions directly.
The county registration-rate interaction offers only provisional evidence on this interpretation. The estimated interaction is −0.078; household-clustered inference gives p = 0.043, whereas clustering at the county level gives p = 0.081 with nine clusters (Table 6). The latter comparison is more relevant because the moderator varies at the county–year level, and nine clusters provide weak asymptotic support. The result is consistent with a weaker motivation–performance relationship where registration is more prevalent, but it does not identify administrative pressure, coercion, or motivation crowd-out.
County-level performance assessment should separate reach, use, and service completion. Registration rates can remain a coverage indicator, but they should be reported alongside unique active users, completed requests, response times, resolution rates, and post-service evaluations. Targets should not reward repeat logins in isolation, and audits should retain offline completion so that digitalization does not hide displacement of administrative burden.
Village-level mobilization should focus on why registered households do not return. Short in-person demonstrations, assisted service sessions, and follow-up on unresolved requests can distinguish lack of skill from lack of need or dissatisfaction. Village staff should record reasons for non-use rather than rely on compulsory sign-ins or screenshot-based proof of activity. Because the present estimates are associational, these practices should be piloted and evaluated rather than treated as effects identified by this study.
Platform operators should make the service path visible: plain-language navigation, accessible help, request-status tracking, named response windows, and an escalation route for unresolved cases. Demand-side outreach is unlikely to improve feedback if the back office cannot respond. The design problem is therefore joint: household capability, interface usability, organizational routines, and feedback channels must operate together [4,5,7].
5.4. Relation to Prior Evidence
The results are consistent with Chinese accounts that visible digital outputs can diverge from substantive governance work [29,30,31], but the unit of analysis differs. Those studies locate formalism mainly in organizational incentives and cadre implementation, whereas the present evidence identifies a household-level gap among registered users. The data do not observe targets or tokenistic official behavior, so the household pattern should not be treated as direct proof of state-centered digital formalism. Zhou’s account of an embedded rural digital public sphere [32] provides a useful contrast: participation can be substantive when online interaction is connected to local relationships and collective action.
The positive association between use frequency and evaluation also fits expectancy-disconfirmation research, in which service experience updates satisfaction [24,25,26], and e-government studies linking trustworthiness and responsiveness to use and trust [27,28]. The study differs from work that treats the digital divide as a clear source of heterogeneous outcomes. None of the education, capability, or age interactions is statistically detectable, but the estimates are imprecise and the panel is small. This null finding therefore does not contradict evidence that digital inequalities extend from access to use and outcomes [9,10,11,12]; it shows that the present design cannot estimate those subgroup differences precisely.
Taken together, the comparison locates the contribution more precisely. Prior accounts emphasize organizational incentives, visible outputs, and cadre implementation, whereas the present panel operationalizes formal reach, behavioral depth, and user feedback at the household level. The paper does not show that registration programs generally fail or that rural users are uniformly excluded. It documents an internal alignment problem in one cadre-heavy Yantai panel and provides household-level empirical grounding for a systems proposition that future representative and comparative studies can test: formal enrollment need not coincide with sustained engagement or favorable feedback.
5.5. Scope of Inference and Knowledge Contribution
Three levels of inference should be separated. First, the study does not estimate population prevalence, population means, or average population effects for rural Yantai or China. Second, it estimates conditional relationships within the analytic panel. Household fixed effects remove stable household differences, but the resulting coefficients remain associational and may reflect time-varying confounding. Third, analytical transferability concerns the systems proposition rather than the numerical coefficients: in settings where rural digital-platform enrollment is promoted administratively but continued use and service feedback remain uneven, access, behavioral engagement, and feedback may diverge and should be measured separately.
This contribution is more than a demographic description of 336 households, but it is narrower than a population claim. A nonrepresentative case cannot establish how common an alignment problem is; it can document that formal reach does not by itself ensure sustained engagement or favorable feedback and can specify observable relationships for replication. Yantai therefore functions as a theory-informing case, not as a microcosm of China or developing Asia. Transfer to other settings depends on institutional similarity and should be evaluated through representative samples, comparative case designs, and stronger temporal or experimental identification.
5.6. Limitations
First, external validity is limited. The survey covers 336 households in Yantai over two years, the sampling frame and response rates are unavailable, no sampling weights are retained, and village-cadre households account for 78.9% of observations. The results therefore characterize the analytic panel rather than the rural Yantai or Chinese population. The absence of complete category labels also prevents a valid demographic benchmark against official population tabulations.
Second, the two-wave observational design cannot establish temporal order among motivation, use, and evaluation; reverse causality and time-varying common shocks remain plausible. Motivation and performance are self-reported in the same survey, category 3 is omitted from the sharp low/high contrast, and the county-level interaction rests on nine clusters. Third, the data do not contain platform logs, objective resolution outcomes, measures of citizen voice or influence, official performance targets, or staff behavior. The observed registration-use gap is therefore consistent with, but does not directly measure, a formal participation trap; nor does it prove coercion, administrative intent, or a causal welfare loss.
5.7. Implications for System Design and Future Identification
A decisive next design would impose temporal order on the motivation–behavior–feedback sequence. Researchers could measure participation orientation before a fixed engagement window, record logins, requests, and completed transactions during that window, and measure perceived performance afterward. Linking these observations to response times and case resolution would separate activity from successful service and reveal whether service experience updates subsequent motivation.
A factorial field experiment could vary three system components separately: outreach content that changes perceived value, usability assistance that lowers participation costs, and a service-level guarantee that raises expected responsiveness. Randomizing these components across a sufficiently large number of villages or counties would test whether household motivation and organizational capacity are complements. A phased design with several pre- and post-intervention waves would also permit dynamic effects and pre-trend checks that two survey waves cannot provide.
A full system evaluation should retain digital and offline channels within the same analytical boundary. Completed tasks, time costs, repeat contacts, unresolved cases, citizen voice, influence over service decisions, and trust should be measured alongside usage. These outcomes would show whether digital engagement creates value, shifts transactions from an offline channel, or imposes new burdens on citizens with lower capability. Such a design could test the broader classical distinction between nominal and substantive participation rather than relying on the observed registration-use gap alone.
6. Conclusions
Rural digital governance should be evaluated as a socio-technical system, not as a registry of accounts. In the balanced Yantai panel, a one-standard-deviation within-household increase in composite participation motivation is associated with a 0.170-standard-deviation increase in perceived platform performance. Registered low-frequency observations evaluate the platform 0.301 standard deviations below registered high-frequency observations, while neither registered category differs statistically from unregistered observations in the fixed-effects comparison.
These findings document a gap among access, behavioral process, and user feedback. Registration can expand the access state without producing repeated interaction, service learning, or favorable evaluations. Drawing on classic participation theory, the paper interprets this pattern as one possible manifestation of a formal participation trap, but the evidence does not directly measure citizens’ voice or influence. It also does not identify a causal penalty from registration or imply that more frequent use always increases welfare. Account counts remain an insufficient statistic for system performance because they combine citizens who engage repeatedly with citizens whose participation ends at enrollment.
The practical implication is to monitor the complete service sequence. Administrators should pair coverage indicators with active use, completed requests, response times, resolution rates, post-service evaluation, and the availability of effective offline channels. Outreach that raises participation demand should be matched by organizational capacity to respond. Otherwise, the system can increase recorded reach and citizen expectations without increasing the value citizens receive.
The numerical estimates remain bounded by two waves of observational, largely self-reported data from 336 Yantai households and should not be read as population prevalence or average effects for rural Yantai or China. The broader contribution is a testable systems proposition rather than a generalized coefficient: deployment, sustained engagement, and user feedback are separate states, and registration coverage alone is an insufficient indicator of whether a rural digital-governance system is functioning effectively. Transfer beyond the panel concerns this proposition under comparable institutional conditions, not the magnitude of the reported associations. Temporally ordered surveys linked to platform logs, representative comparative samples, and exogenous variation in outreach, usability support, or service responsiveness are required to test its scope and identify the recursive mechanisms.
Supplementary Materials
The following supporting information can be downloaded at: https://www.mdpi.com/article/10.3390/systems14091106/s1. The Supplementary Materials include the final Stata do-file and execution log.
Author Contributions
Conceptualization, Y.S.; Methodology, Y.S.; Software, X.J.; Formal analysis, X.J.; Investigation, X.J.; Data curation, X.J.; Writing—original draft, X.J.; Supervision, Y.S.; Project administration, Y.S. and Y.Z.; Funding acquisition, Y.Z. All authors have read and agreed to the published version of the manuscript.
Funding
This research was funded by the National Social Science Foundation of China Post-project Funding, grant number 24FJYB056, and the Jiangsu Provincial Social Science Foundation Key Project, grant number 23EYA005.
Institutional Review Board Statement
The Academic Committee of Nanjing Forestry University issued an exemption determination dated 20 August 2024 for this non-interventional social science survey, concluding that formal ethical approval was not required.
Informed Consent Statement
Written informed consent for participation was obtained from all participants. Participation was voluntary.
Data Availability Statement
The analytic data are available from the corresponding author subject to ethical and confidentiality restrictions. The final Stata do-file and execution log are available as Supplementary Materials.
Acknowledgments
During the preparation of this manuscript, the authors used Kimi K3 for language editing, structural revision, and formatting. The authors reviewed and edited all output and take full responsibility for the content of the publication.
Conflicts of Interest
The authors declare no conflicts of interest. The funders had no role in the design of the study; in the collection, analyses, or interpretation of data; in the writing of the manuscript; or in the decision to publish the results.
References
- Arnstein, S.R. A ladder of citizen participation. J. Am. Inst. Plan. 1969, 35, 216–224. [Google Scholar] [CrossRef] [Scilit]
- White, S.C. Depoliticising development: The uses and abuses of participation. Dev. Pract. 1996, 6, 6–15. [Google Scholar] [CrossRef] [Scilit]
- Pretty, J.N. Participatory learning for sustainable agriculture. World Dev. 1995, 23, 1247–1263. [Google Scholar] [CrossRef] [Scilit]
- Fountain, J.E. Building the Virtual State: Information Technology and Institutional Change; Brookings Institution Press: Washington, DC, USA, 2001. [Google Scholar]
- Orlikowski, W.J. The duality of technology: Rethinking the concept of technology in organizations. Organ. Sci. 1992, 3, 398–427. [Google Scholar] [CrossRef] [Scilit]
- Leonardi, P.M.; Barley, S.R. What’s under construction here? Social action, materiality, and power in constructivist studies of technology and organizing. Acad. Manag. Ann. 2010, 4, 1–51. [Google Scholar] [CrossRef]
- Haug, N.; Dan, S.; Mergel, I. Digitally-induced change in the public sector: A systematic review and research agenda. Public Manag. Rev. 2024, 26, 1963–1987. [Google Scholar] [CrossRef] [Scilit]
- Hargittai, E. Second-level digital divide: Differences in people’s online skills. First Monday 2002, 7. [Google Scholar] [CrossRef] [Scilit]
- van Deursen, A.J.A.M.; Helsper, E.J. The third-level digital divide: Who benefits most from being online? In Communication and Information Technologies Annual: Digital Distinctions and Inequalities; Robinson, L., Cotten, S.R., Schulz, J., Hale, T.M., Williams, A., Eds.; Emerald Group Publishing: Bingley, UK, 2015; Volume 10, pp. 29–52. [Google Scholar] [CrossRef] [Scilit]
- van Deursen, A.J.A.M.; Helsper, E.J.; Eynon, R.; van Dijk, J.A.G.M. The compoundness and sequentiality of digital inequality. Int. J. Commun. 2017, 11, 452–473. [Google Scholar]
- Lythreatis, S.; Singh, S.K.; El-Kassar, A.-N. The digital divide: A review and future research agenda. Technol. Forecast. Soc. Chang. 2022, 175, 121359. [Google Scholar] [CrossRef] [Scilit]
- Salemink, K.; Strijker, D.; Bosworth, G. Rural development in the digital age: A systematic literature review on unequal ICT availability, adoption, and use in rural areas. J. Rural Stud. 2017, 54, 360–371. [Google Scholar] [CrossRef] [Scilit]
- Dasgupta, A.; Beard, V.A. Community driven development, collective action and elite capture in Indonesia. Dev. Chang. 2007, 38, 229–249. [Google Scholar] [CrossRef] [Scilit]
- Mansuri, G.; Rao, V. Localizing Development: Does Participation Work? World Bank: Washington, DC, USA, 2013. [Google Scholar] [CrossRef] [Scilit]
- Ajzen, I. The theory of planned behavior. Organ. Behav. Hum. Decis. Process. 1991, 50, 179–211. [Google Scholar] [CrossRef] [Scilit]
- Deci, E.L.; Ryan, R.M. The ‘what’ and ‘why’ of goal pursuits: Human needs and the self-determination of behavior. Psychol. Inq. 2000, 11, 227–268. [Google Scholar] [CrossRef] [Scilit]
- Ryan, R.M.; Deci, E.L. Self-determination theory and the facilitation of intrinsic motivation, social development, and well-being. Am. Psychol. 2000, 55, 68–78. [Google Scholar] [CrossRef] [PubMed]
- Sok, J.; Borges, J.R.; Schmidt, P.; Ajzen, I. Farmer behaviour as reasoned action: A critical review of research with the theory of planned behaviour. J. Agric. Econ. 2021, 72, 388–412. [Google Scholar] [CrossRef] [Scilit]
- Bevan, G.; Hood, C. What’s measured is what matters: Targets and gaming in the English public health care system. Public Adm. 2006, 84, 517–538. [Google Scholar] [CrossRef] [Scilit]
- Moynihan, D.; Herd, P.; Harvey, H. Administrative burden: Learning, psychological, and compliance costs in citizen-state interactions. J. Public Adm. Res. Theory 2015, 25, 43–69. [Google Scholar] [CrossRef] [Scilit]
- Herd, P.; Moynihan, D.P. Administrative Burden: Policymaking by Other Means; Russell Sage Foundation: New York, NY, USA, 2018. [Google Scholar]
- Peeters, R.; Widlak, A. The digital cage: Administrative exclusion through information architecture-The case of the Dutch civil registry’s master data management system. Gov. Inf. Q. 2018, 35, 175–183. [Google Scholar] [CrossRef] [Scilit]
- Peeters, R. Digital administrative burdens: An agenda for analyzing the citizen experience of digital bureaucratic encounters. Perspect. Public Manag. Gov. 2023, 6, 7–13. [Google Scholar] [CrossRef]
- Oliver, R.L. A cognitive model of the antecedents and consequences of satisfaction decisions. J. Mark. Res. 1980, 17, 460–469. [Google Scholar] [CrossRef] [Scilit]
- Morgeson, F.V., III. Expectations, disconfirmation, and citizen satisfaction with the US federal government: Testing and expanding the model. J. Public Adm. Res. Theory 2013, 23, 289–305. [Google Scholar] [CrossRef] [Scilit]
- Zhang, J.; Chen, W.; Petrovsky, N.; Walker, R.M. The expectancy-disconfirmation model and citizen satisfaction with public services: A meta-analysis and an agenda for best practice. Public Adm. Rev. 2022, 82, 147–159. [Google Scholar] [CrossRef] [Scilit]
- Tolbert, C.J.; Mossberger, K. The effects of e-government on trust and confidence in government. Public Adm. Rev. 2006, 66, 354–369. [Google Scholar] [CrossRef] [Scilit]
- Carter, L.; Bélanger, F. The utilization of e-government services: Citizen trust, innovation and acceptance factors. Inf. Syst. J. 2005, 15, 5–25. [Google Scholar] [CrossRef] [Scilit]
- Dong, S.; Dong, X. Patchwork coping bias in technology implementation: The logic of digital-governance formalism. Chin. Public Adm. 2022, 6, 66–73. (In Chinese) [Google Scholar]
- Yu, S.; Ou, X.; Luo, L. Digital suspension in grassroots governance: Connotation representation, formation mechanism, and dissolution strategies. J. Hohai Univ. (Philos. Soc. Sci.) 2024, 26, 79–88. (In Chinese) [Google Scholar] [CrossRef]
- Wang, Y. Manifestations of ‘digital suspension’ in rural governance and paths for resolution. Jiangsu Soc. Sci. 2024, 6, 130–139. (In Chinese) [Google Scholar]
- Zhou, M. Reproduction of the rural digital public sphere: A practical examination of Tencent’s WeCounty platform governance. Journal. Commun. Rev. 2024, 77, 70–81. (In Chinese) [Google Scholar] [CrossRef]
- Zhang, M.; Huo, Z. Digital governance in rural China and social participation deprivation among rural households: The mediating role of public service access and the moderating effect of digital exclusion. Systems 2026, 14, 96. [Google Scholar] [CrossRef] [Scilit]
- Myeong, S. Perceiving digital citizen participation: A comparative socio-technical systems analysis of government officials in South Korea and Indonesia. Systems 2026, 14, 441. [Google Scholar] [CrossRef] [Scilit]
- Liao, F.; Zheng, Y.; Yang, D. Digital transformation in rural governance: Unraveling the micro-mechanisms and the role of government subsidies. Humanit. Soc. Sci. Commun. 2025, 12, 1423. [Google Scholar] [CrossRef] [Scilit]
- Wang, J.; Liu, K.; Yuan, R.; Kuang, X.; Qiu, H. Impact of participation in rural digital governance on grassroots political trust among high-quality farmers: Analysis using survey data from 899 high-quality farmers in Jiangxi Province. Front. Sustain. Food Syst. 2025, 9, 1543354. [Google Scholar] [CrossRef] [Scilit]
- Hainmueller, J. Entropy balancing for causal effects: A multivariate reweighting method to produce balanced samples in observational studies. Political Anal. 2012, 20, 25–46. [Google Scholar] [CrossRef] [Scilit]
- Lewbel, A. Using heteroscedasticity to identify and estimate mismeasured and endogenous regressor models. J. Bus. Econ. Stat. 2012, 30, 67–80. [Google Scholar] [CrossRef] [Scilit]
- Oster, E. Unobservable selection and coefficient stability: Theory and evidence. J. Bus. Econ. Stat. 2019, 37, 187–204. [Google Scholar] [CrossRef] [Scilit]
- Zhang, T. Measuring following behaviour in gift giving by utility function: Statistical model and empirical evidence from China. Humanit. Soc. Sci. Commun. 2022, 9, 190. [Google Scholar] [CrossRef] [Scilit]
- Atsebi, J.-M.B.; Ferrer-i-Carbonell, A. Relative deprivation in Tanzania: Relative concerns and empathy. J. Econ. Behav. Organ. 2022, 198, 389–408. [Google Scholar] [CrossRef] [Scilit]

Disclaimer/Publisher’s Note: The statements, opinions and data contained in all publications are solely those of the individual author(s) and contributor(s) and not of MDPI and/or the editor(s). MDPI and/or the editor(s) disclaim responsibility for any injury to people or property resulting from any ideas, methods, instructions or products referred to in the content. |
© 2026 by the authors. Licensee MDPI, Basel, Switzerland. This article is an open access article distributed under the terms and conditions of the Creative Commons Attribution (CC BY) license.