


Abstract
Based on panel data from 30 Chinese provinces (2008–2022), this study employs fixed-effects, spatial econometric, and moderation effect models to analyze how logistics transport structure adjustment affects carbon emissions. The findings reveal that: (1) Carbon emissions from the logistics industry show a fluctuating upward trend, with a spatial pattern of “higher in the south and lower in the north”; economically developed provinces and major transportation hubs exhibit higher emission levels. (2) The increasing share of railway transport has a more pronounced effect on carbon reduction in provinces with higher industrialization levels. (3) Transport restructuring generates negative spatial spillover effects whereas railway substitution reduces emissions both locally and in neighboring regions, though with regional heterogeneity: most effective in eastern China, weaker in western China, and insignificant in central China. These findings support developing differentiated, regionally coordinated low-carbon logistics policies.
1. Introduction
In recent years, global energy consumption has shown a significant upward trend, making controlling and reducing carbon dioxide emissions a major challenge for the global environment (Cao et al., 2019) [1]. Against the backdrop of the “Dual Carbon Goals,” (i.e., achieving carbon peak by 2030 and carbon neutrality by 2060), the accelerated global transition towards green and low-carbon development has become an irreversible trend (Liu and Ma, 2025) [2]. Alongside the continuous growth of China’s economic aggregate, derived logistics and transport demand is also rapidly increasing. However, China’s logistics and transport sector still primarily relies on fossil fuel consumption, which will further increase the difficulty of controlling the sector’s total carbon emissions. Without effective and sustainable emission reduction pathways and policies, the growth rate of carbon emissions in the logistics and transport sector may exceed that of other end-use sectors, potentially making it the largest contributor to overall societal carbon emissions. Therefore, under the “Dual Carbon” goals, the pressure for emission reduction faced by the logistics and transport sector will be greater and more arduous compared to other sectors, in order to achieve carbon emission intensity and total carbon control. Consequently, understanding how to promote deep emission reductions in the logistics and transport sector holds significant theoretical and practical importance for society’s achievement of carbon peaking and carbon neutrality.
From the perspective of logistics transport structure, China’s logistics and transport sector mainly comprises four modes: road, railway, waterway, and air transport. Currently, road transport accounts for 71% and 74% of passenger and freight volume in China, respectively. Thus, China’s logistics transport structure is dominated by road transport, which is characterized by high energy consumption and high carbon emissions, making it the primary source of carbon emissions in the logistics and transport sector. The persistently high total carbon emissions resulting from this unreasonable transport structure pose a major challenge for the logistics and transport industry in achieving carbon reduction and green development. Based on this, since 2021, the Chinese government has issued a series of policies and plans to assist the logistics and transport sector in achieving carbon reduction. For instance, documents such as the Notice on Organizing the Application for the Fourth Batch of Multimodal Transport Demonstration Projects, the “14th Five-Year” Plan for Green Transportation, the Action Plan for Promoting Multimodal Transport Development and Optimizing Transport Structure Adjustment (2021–2025), and the State Council of China Notice on Issuing the Action Plan for Carbon Peaking Before 2030 all require “optimizing and adjusting the logistics transport structure, accelerating the formation of green and low-carbon transport modes, and ensuring that carbon emission growth in the transport sector remains within a reasonable range.” Therefore, a key pathway for the logistics and transport sector to achieve deep carbon reduction and ensure emissions stay within a reasonable range is to accelerate the adjustment and optimization of the logistics transport structure, thereby effectively controlling both the total volume and intensity of carbon emissions.
Amid the increasing carbon emissions from the logistics industry, adjusting its transport structure to reduce emissions is crucial. Consequently, the impact of logistics industry transport structure adjustment on carbon emissions has garnered significant attention from academia, government, and the public. However, although scholars have measured logistics transport structure and carbon emissions, most research focuses on micro-level and enterprise-level analyses involving technological improvements, model construction, and policy recommendations, or emphasizes case studies of specific modes (Nocera et al., 2018; Sittivijan, 2009) [3,4]. There is a lack of macro-level quantitative characterization of the spatiotemporal evolution characteristics of logistics transport structure and carbon emissions, failing to reveal their dynamic patterns. Furthermore, regarding the impact of transport structure adjustment on logistics carbon emissions, existing studies mostly concentrate on macro-mechanisms or policy simulations (Huang and Ling, 2021; Wu et al., 2021) [5,6]. However, the logistics industry exhibits typical network and cross-regional characteristics; its environmental impact is not confined within administrative boundaries. Optimization policies in one region could potentially generate spatial spillover effects on neighboring areas through channels such as policy imitation and technology diffusion, thereby reshaping the regional carbon emission landscape. Existing literature predominantly focuses on analyzing direct emission reduction effects within local areas, generally overlooking this potential and crucial spatial linkage mechanism. This leads to potential biases in assessing the carbon reduction effects of logistics transport structure adjustment and hampers the formulation of regionally coordinated governance policies. To address this research gap, this paper incorporates spatial factors into the analytical framework, constructs a spatial econometric model, and empirically tests the spatial spillover effects of logistics transport structure adjustment on carbon emission intensity, aiming to provide more comprehensive empirical evidence and decision-making references for cross-regional collaborative emission reduction.
Secondly, as the logistics industry is a derived industry from manufacturing and handles the transportation of a large volume of industrial products, if a region has a large industrial scale and relies more heavily on road transport for industrial shipments, it will increase the total carbon emissions of both the logistics industry and the region. Conversely, if a region possesses strong railway transport capacity and a high share of railway transport, it can effectively reduce the demand for road transport for bulk industrial products, thereby lowering the carbon emissions associated with industrial scale expansion and also reducing logistics industry carbon emissions. However, existing studies have failed to incorporate the important socio-economic factor of industrialization level as a moderating variable into the “structure-emission” impact framework, neglecting its indirect impact on carbon emissions against the backdrop of regional development disparities. This hinders a scientifically sound investigation into the effect of logistics industry transport structure adjustment on logistics industry carbon emissions.
Based on this, this study focuses on the following two core questions: First, to analyze the temporal evolution patterns and spatial differentiation characteristics of China’s logistics industry transport structure and carbon emissions; Second, to investigate the impact mechanism of logistics industry transport structure adjustment on carbon emissions, the moderating roles of industrialization level and labor force size in this process, and whether there exist significant spatial spillover effects.
Based on the above questions, the research objectives of this paper are as follows: (1) To measure the logistics industry transport structure and carbon emission levels respectively, revealing their temporal evolution and spatial differentiation characteristics. (2) To construct a panel data model (i.e., a model that simultaneously utilizes time-series and cross-provincial cross-sectional data to analyze the relationships among variables, used to reveal the average effects of transport structure adjustment on carbon emissions) and a spatial econometric model, in order to investigate the impact mechanism and spatial effects of logistics industry transport structure adjustment on its carbon emissions. Furthermore, industrialization level and labor force size are introduced as moderating variables to verify their roles in the pathway through which logistics transport structure adjustment affects carbon emissions.
The remainder of this paper is organized as follows: Section 2 provides the literature review. Section 3 details the measurement of logistics transport structure and carbon emissions. Section 4 presents the empirical research design. Section 5 analyzes the empirical results. Section 6 is the discussion. Section 7 concludes with findings and policy implications.
2. Literature Review
Aligning with the purpose and theme of this study and considering relevant domestic and international literature, existing research primarily focuses on three main aspects: the logistics industry transport structure, logistics industry carbon emissions, and the impact of logistics transport structure adjustment on carbon emissions. The details are as follows:
2.1. Research on Logistics Industry Transport Structure
In studies optimizing the logistics industry transport structure, scholars have explored its relationship with low-carbon development from multiple perspectives. Early research focused on transport mode optimization and technology application. Nocera et al. (2018) [3], based on European data calculations, pointed out that adjusting the road-rail transport ratio can significantly save social costs, highlighting the importance of policy intervention. Sittivijan (2009) [4] and Go et al. (2010) [7] started from enterprise micro-level decisions; the former emphasized the need to comprehensively consider factors like freight volume, routes, and inventory to improve model accuracy, while the latter, based on industrial data, found that shippers prefer the direct delivery mode using small trucks.
Subsequent research gradually focused on the low-carbon benefits of multimodal transport and railways. Liu et al. (2017) [8] used a system dynamics model to verify the positive role of “shifting from road to rail” in enhancing the sustainability of intercity freight. Chang et al. (2010) [9] internalized external costs, demonstrating that this mechanism can incentivize the choice of low-carbon modes. Dong and Li (2025) [10] further pointed out that although railways have limitations in flexibility, their economies of scale still offer cost advantages under fixed distribution strategies.
In recent years, research has delved deeper into supply chain coordination and policy instruments. Zhao et al. (2022) [11] proposed that the core of transport structure optimization lies in achieving the match between transport capacity and macro-economic and social demand. Bugge et al. (2022) [12] confirmed that policies such as fiscal subsidies and green credit can effectively promote corporate low-carbon transition. Both Jackson et al. (2023) [13] and De et al. (2023) [14] emphasized the value of multimodal transport in reducing costs and dependencies. Dong and Li (2025) [10], from the perspective of contract theory, found that even simple price contracts combined with transport mode switching options can increase the use of green transport. Recent research also focuses on algorithmic support and carbon cost impacts. For instance, Hrušovský et al. (2024) [15] developed an integrated method for railway fleet planning, Eschmann et al. (2025) [16] noted that internalizing carbon costs would lead to significant cost increases for sea and air freight, thereby affecting structural choices. Ping et al. (2024) [17] utilized big data to build route optimization models to reduce empty loads and energy consumption.
2.2. Research on Logistics Industry Carbon Emissions
In the field of logistics industry carbon emissions research, scholars have extensively discussed dimensions such as emission sources, measurement methods, and emission reduction pathways. Early studies primarily focused on identifying key emission links. McKinnon et al. (2009) [18] pointed out that logistics carbon emissions are concentrated in transport, warehousing, distribution, and packaging processes, with transport accounting for the highest proportion. Piecyk et al. (2010) [19] further found that with the development of e-commerce, emissions from urban last-mile delivery grew significantly. McKinnon et al. (2015) [20] identified road freight, especially heavy-duty diesel trucks, as the primary source of emissions, accounting for over 70%. Simultaneously, direct and indirect emissions from the packaging stage also gained attention (Pålsson et al., 2013) [21], indicating a gradual shift in research perspective from single transport to systematic, whole-chain approaches.
Regarding measurement methods, research gradually introduced more comprehensive evaluation tools. Cui et al. (2017) [22], when analyzing the impact of economic factors on emissions, pointed out that economic growth increases logistics emissions, but structural optimization and technological improvements can have mitigating effects. De and Giri (2020) [23] incorporated carbon policies into closed-loop supply chain route optimization using a mixed-integer nonlinear programming model. Huang and Ling (2021) [5] used system dynamics and input-output models to predict long-term emissions under different structural scenarios. Dubisz et al. (2022) [24] applied Life Cycle Assessment (LCA) to comprehensively evaluate the full lifecycle emissions of transport vehicles. In recent years, Raihan and Tuspekova (2022) [25] emphasized the close link between the logistics industry and heavy manufacturing in terms of carbon emissions. Li et al. (2022) [26] and Zhang et al. (2020) [27] focused on the role of carbon taxes, carbon trading, and other policies in promoting technological upgrades and electrification. Dan and Liu (2024) [28] focused on the role of scheduling and route optimization in reducing empty driving and emissions, while Zheng et al. (2024) [29] pointed out that direct measurement methods based on fuel consumption and emission factors, although accurate, still face limitations in data availability. Furthermore, Wang et al. (2024) [30] began combining vehicle operation data with machine learning methods to estimate fuel consumption and carbon dioxide emissions.
2.3. Research on the Impact of Logistics Transport Structure Adjustment on Carbon Emissions
Research on the impact mechanism of logistics industry transport structure adjustment on carbon emissions has gained widespread attention. Existing research primarily explores pathways such as transport mode substitution, technological and operational optimization, and policy guidance. Huang and Ling (2021) [5], Wu et al. (2021) [6], Lin and Wang (2021) [31] further emphasized the substitution effect of multimodal transport and low-carbon modes like railway and waterway transport on high-carbon road transport, arguing that structural optimization can significantly reduce energy consumption and emissions. Albalate et al. (2024) [32] also pointed out that increasing the proportion of low-carbon transport is a key pathway for achieving overall emission reduction. Recent research, such as Fontaine et al. (2023) [33], based on a system dynamics simulation of the Indian scenario, found that imposing a carbon tax on road transport could promote a low-carbon shift in freight modes, potentially achieving a 37% reduction in carbon emissions and a 4% reduction in logistics costs by 2042 under a rapid transition scenario.
2.4. Research Gaps
By reviewing and summarizing extant research findings, the following gaps are identified:
In the research on logistics transport structure and logistics carbon emissions, extant studies have laid an important foundation for identifying emission sources, developing measurement methods, and exploring reduction strategies. However, the analysis mostly concentrates on the micro-enterprise level, such as technological improvements and model construction, or is confined to case studies of specific transport modes. There is a lack of systematic quantification of the spatiotemporal evolution of logistics transport structure and carbon emissions from a macro perspective. This shortcoming makes it difficult to reveal their dynamic evolution patterns and underlying regional disparities, limiting the summarization of macro-level regularities.
Regarding the impact of logistics transport structure adjustment on logistics carbon emissions, existing research clearly reveals the inhibitory effect of adjustment through pathways like mode substitution, technological and management innovation, and policy incentives, providing important references for theoretical mechanism discussion and policy formulation. However, existing studies mostly focus on policy simulation and qualitative analysis, lacking empirical research, and fail to adequately incorporate the spatial spillover effects of the logistics industry. This leads to proposed policies lacking a scientific basis, limits the assessment of emission reduction effects, and hampers effective support for regional coordinated governance. In practice, accurately assessing the regional synergistic emission reduction potential of logistics transport structure adjustment and studying its spatial spillover effects on carbon emission intensity can provide a quantitative basis for formulating scientific regional environmental regulation policies.
Furthermore, industrialization level and labor force size significantly influence logistics transport structure adjustment. Existing research has failed to fully incorporate the spatial spillover effects of the logistics industry and has neglected the role channels and mechanism analysis of these two variables. Consequently, existing studies struggle to comprehensively reveal the internal mechanism through which transport structure adjustment affects carbon emissions, potentially weakening the scientific validity and policy implications of related conclusions.
Based on this, and building upon existing domestic and international research, this paper makes the following extensions: (1) Measure the logistics industry transport structure and carbon emission levels respectively, revealing their temporal evolution and spatial differentiation characteristics. (2) Use panel data models and spatial econometric models to investigate the impact mechanism and spatial effects of logistics transport structure adjustment on logistics carbon emissions, and introduce industrialization level and labor force size as moderating variables to verify their roles in the pathway through which transport structure adjustment affects carbon emissions.
3. Measurement of Logistics Industry Transport Structure and Carbon Emissions
3.1. Research Methods
This study aims to analyze the spatio-temporal evolution characteristics of China’s logistics industry transport structure and carbon emissions. Based on data availability and representativeness, the logistics industry transport structure is defined as the ratio of railway turnover volume to road transport turnover volume. The carbon emission calculation adopts the “top-down” method recommended by the IPCC Guidelines for National Greenhouse Gas Inventories.
3.1.1. Measurement of Logistics Industry Transport Structure
The data used in this paper are sourced from the China Energy Statistical Yearbook and the China Statistical Yearbook of various years, ensuring authenticity and validity. Regarding the selection of transport modes, a scientific screening was conducted based on the following considerations: Firstly, pipeline transport was excluded due to its specific transport objects (mainly oil and gas resources) and fixed routes, lacking comparability with other modes. Secondly, although waterway and air transport play important roles in specific regions and sectors, their share in the total national passenger and freight transport volume is relatively small (according to 2022 statistics, the combined share of waterway and air transport is less than 15%), and their network coverage is relatively limited.
As shown in Figure 1, in 2022, the shares of fixed asset investment in the four transport modes—railway, road, waterway, and air—were 18.4% for railway and 74% for road. Considering the dominant position of railway and road transport in China’s comprehensive transport system (combined share exceeding 80%) and their primary role in transport structure optimization, this study ultimately selects railway and road transport, the two most representative modes, as the research subjects.
Figure 1.
Share of Fixed Asset Investment by Transport Mode in China (2022).
Data source: 2022 Statistical Bulletin on Transport Development
The logistics industry transport structure data are represented by the ratio of railway transport turnover volume to road transport turnover volume. Here, turnover volume refers to the comprehensive turnover volume integrating passenger and freight transport, calculated using the formula (Ouyang et al., 2014) [34]:
Turnover Volume = Freight Turnover Volume + Passenger Turnover Volume × Passenger-Freight Conversion Coefficient.
In accordance with the standard norms of China’s statistical system—specifically the conversion method based on the number of vehicle seats—the passenger-to-freight conversion coefficient for road transport turnover volume is 0.1, and for railway transport turnover volume, it is 1. This ensures the accuracy and comparability of the transport structure indicator.
3.1.2. Measurement of Logistics Industry Carbon Emissions
The IPCC Guidelines for National Greenhouse Gas Inventories (hereinafter referred to as the Guidelines) provide an internationally recognized and authoritative method for estimating carbon emissions—the “top-down” estimation method. Its calculation formula is as follows (1):
In the above formula, represents the carbon emissions; represents the final energy consumption of the -th energy type; represents the standard coal conversion coefficient of the -th energy type; represents the carbon emission coefficient of the -th energy type.
When estimating the carbon emissions of the logistics industry for each province (autonomous region or municipality directly under the central government), it is first necessary to calculate the carbon dioxide emission coefficient for each energy type. This calculation process is primarily based on the chemical reaction equations of energy combustion, combined with key parameters such as the net calorific value and carbon oxidation rate of each energy type, to determine the carbon emission factor for each energy type through scientific calculation methods. Specifically, the calculation of the carbon emission coefficient needs to consider factors including the carbon content of the energy, combustion efficiency, and losses during energy conversion, thereby ensuring the accuracy and reliability of the calculation results and providing basic data support for the subsequent precise estimation of carbon emissions. The specific calculation method is shown in Equation (2).
In the above formula, represents the carbon emission conversion coefficient of the -th energy type; represents the average net calorific value of the -th energy type; represents the carbon content per unit calorific value of the -th energy type; represents the carbon oxidation rate of the -th energy type.
Carbon content is a key parameter measuring the mass proportion of carbon elements in fossil energy, and its value directly affects the accuracy of carbon emission measurement. During the complete combustion of fossil fuels, over 99% of carbon elements are oxidized into carbon dioxide; therefore, the default oxidation rate for carbon elements is typically set at 100% in practical calculations. However, considering the phenomenon of incomplete combustion in actual processes, the Provincial Greenhouse Gas Inventory Compilation Guide (Trial), issued in May 2011, scientifically revised the oxidation rates for fossil fuels. This study adopts the updated oxidation rate data from this guide to enhance the accuracy of the measurement results. According to the Guide, calculating carbon emissions requires data on fuel consumption by source category and carbon emission factors. In measuring the carbon emissions of China’s transport sector, this study strictly follows this method and adjusts relevant parameters based on actual conditions to improve the accuracy of the estimation. The specific calculation formula is:
where represents the total carbon emissions generated during the logistics transport process, represents each type of energy, is the consumption amount of the -th energy type, is the carbon emission factor of the -th energy type, is the average net calorific value of the -th energy type, is the carbon content per unit heat of the -th energy type, is the oxidation rate of the -th energy type during consumption (as shown in Table 1), is the conversion factor for carbon oxidation to carbon dioxide.
Table 1.
Carbon Emission Coefficients of Major Energy Types.
3.2. Measurement Results
3.2.1. Results of Logistics Industry Transport Structure
Based on the aforementioned measurement methodology, the turnover volume of the logistics industry from 2008 to 2022 was calculated. As shown in Figure 2, it can be observed that during the sample observation period, the logistics industry turnover volume (including railway transport turnover volume, road transport turnover volume, and total turnover volume) exhibited a fluctuating upward trend. This growth is primarily attributed to sustained economic growth, improved infrastructure, and policy support. The expansion of economic scale (China’s GDP increased from 31.4 trillion yuan in 2008 to 121 trillion yuan in 2022) and the rise of e-commerce and consumption upgrades drove the demand for road transport, while the transportation of bulk commodities promoted the growth of railway transport turnover volume. Simultaneously, the expansion of railway and road networks (high-speed rail mileage exceeding 40,000 km and expressway mileage reaching 177,000 km) and technological advancements (application of the Internet of Things and big data) enhanced transport efficiency. Furthermore, Chinese national policies (such as the “shift from road to rail” (gong zhuan tie) and multimodal transport) optimized the transport structure, further contributing to the increase in overall turnover volume. In the future, with the advancement of the “Dual Carbon” goals, the transport structure of the logistics industry will continue to be optimized, and efficiency will be persistently enhanced.
Figure 2.
Logistics Industry Turnover Volume in China (2008–2022).
At the national level, China’s population flow in recent years has shown a clear trend of agglomeration towards economically developed regions. According to data from the National Bureau of Statistics, the net population inflow into major urban agglomerations such as the Yangtze River Delta, Pearl River Delta, and Beijing-Tianjin-Hebei region has kept rising. In 2020, the resident population of these three major urban agglomerations accounted for 18.1% of the national total. This evolution in population distribution directly influences the choice of transport modes. In the field of short-distance transport, road transport dominates due to its strong flexibility, door-to-door service, and high timeliness. As shown in Figure 3, over the past 15 years, the share of road transport within the transport system has exhibited a fluctuating upward trend.
Figure 3.
Proportion of Railway and Road Transport Turnover Volume (2008–2022).
3.2.2. Measurement Results of Logistics Industry Carbon Emissions
This study selects the carbon emissions of the logistics industry from 2008 to 2022, a total of 15 years, as the research object, systematically analyzing the energy use challenges and environmental impacts faced by the industry during its development over the past 15 years.
As shown in Figure 4, carbon emissions from the logistics industry exhibited a fluctuating growth trend between 2008 and 2022. Excessive energy consumption not only exacerbates the depletion of natural resources but also leads to the emission of large amounts of gaseous waste, consequently increasing the concentration of fine particulate matter (PM2.5) in the atmosphere. This is detrimental to ecological environmental protection and also poses a serious threat to human health.
Figure 4.
Logistics Industry Energy Consumption (2008–2022).
As shown in Figure 5, the national carbon emissions from the logistics industry overall displayed a trend of “initial rapid increase, followed by stabilization and a slight decline.” The emissions increased from 235 million tons of standard coal equivalent in 2008 to a peak of 378 million tons in 2019. Subsequently, influenced by factors such as the COVID-19 pandemic, the “Dual Carbon” policy, and improvements in transport efficiency, emissions decreased to 333 million tons in 2022. This indicates that while the pressure for carbon emission reduction in the logistics industry is immense, initial results from management and control are beginning to show.
Figure 5.
Logistics Industry Carbon Emissions (2008–2022).
3.2.3. Analysis of Spatio-Temporal Evolution and Regional Differences
This study utilizes ARCGIS 10.8 visualization software to intuitively reflect the evolution characteristics of the ratio of railway-to-road transport turnover volume and logistics industry carbon emissions in China for the years 2008, 2013, 2018, and 2022.
(1) Analysis of the Spatio-temporal Evolution of Logistics Industry Transport Structure
In the figures below, a darker color indicates a higher ratio of railway-to-road transport turnover volume, signifying that railway transport holds a dominant position in the logistics industry transport structure.
As shown in Figure 6, Figure 7, Figure 8 and Figure 9, the intensity of the map colors indicates the degree of the measured variable. It can be observed that the spatial differentiation of the transport structure (railway-to-road ratio) is significant, presenting an overall pattern of “high in the northwest and low in the southeast”. Specifically, road transport dominates in East China and South China, while the share of railway transport is relatively higher in Northwest China and Northeast China. During this period, the national ratio showed an overall declining trend, particularly in plains provinces such as Tianjin, Shanghai, and Liaoning, where the share of convenient and flexible road transport increased significantly alongside the improvement of the road network. Conversely, in provinces like Qinghai, Xinjiang, and Hainan, constrained by specific geographical and climatic conditions (e.g., high altitude, vast territory, or being separated by sea), which lead to high costs or limited efficiency for road transport, the share of railway transport instead increased.
Figure 6.
Ratio of Railway to Road. Transport Turnover Volume (2008).
Figure 7.
Ratio of Railway to Road Transport Turnover Volume (2013).
Figure 8.
Ratio of Railway to Road. Transport Turnover Volume (2018).
Figure 9.
Ratio of Railway to Road. Transport Turnover Volume (2022).
These spatio-temporal differentiation characteristics reveal that geographical conditions are a key factor shaping regional transport structures. Future policy formulation must be tailored to local conditions and fully consider local endowments to achieve the optimal configuration of overall efficiency and sustainability for the logistics system.
Table 2 classifies the logistics industry transport structure for 2008 and 2022 into seven levels. The classification is primarily based on the relative proportion of railway transport to road transport within the logistics industry transport structure. From the Railway-Dominant Zone to the Road-Dominant Zone, the proportion of railway transport gradually decreases, while the proportion of road transport gradually increases. This classification reflects the differences in logistics transport structures across regions and simultaneously embodies the varying characteristics of regional economic development levels, geographical conditions, resource distribution, and infrastructure development.
Table 2.
Classification of Logistics Industry Transport Structure by Province.
As indicated in Table 2, China’s logistics industry transport structure can be categorized into railway-dependent regions and road-dominant regions:
Railway-dependent regions: Examples include Beijing, Qinghai, Shanxi, and Inner Mongolia. These areas are either resource-based provinces where railways hold a significant advantage in long-distance bulk cargo transport, or their road development is constrained by geographical conditions (e.g., the Qinghai–Tibet Plateau).
Road-dominant regions: These are primarily concentrated in economically developed provinces such as those in the Yangtze River Delta and Pearl River Delta (e.g., Shanghai, Jiangsu, Zhejiang). These regions feature high urbanization levels and dense road networks, making road transport more suitable for high-frequency, short-haul logistics demands.
(2) Analysis of the Spatio-temporal Evolution of Logistics Industry Carbon Emissions
As shown in Table 3:
Table 3.
Carbon Emissions of the Logistics Industry by Province in China (10,000 tons).
Table 3 displays the changes in carbon emissions from the logistics industry across Chinese provinces from 2008 to 2022. Analysis of the data in the table reveals that most provinces exhibited an upward trend in logistics carbon emissions between 2008 and 2018. For instance, Guangdong Province increased from 68.41 million tons in 2008 to 102.72 million tons in 2018, and Henan Province grew from 21.19 million tons to 45.82 million tons. This indicates that as the economy develops, increasing logistics demand leads to a corresponding rise in carbon emissions. Carbon emissions are generally higher in economically developed eastern coastal provinces (e.g., Guangdong, Jiangsu, Zhejiang, Shanghai). These regions have high economic activity and substantial logistics demand, with Guangdong’s emissions reaching 102.72 million tons in 2018, ranking among the highest nationally. Emissions in central and western regions are relatively lower but showed a clear growth trend. For example, provinces like Henan, Hubei, and Hunan experienced significant emission growth between 2008 and 2018, likely linked to their rapid economic development and continuous infrastructure improvement. Emissions in provinces like Qinghai, Ningxia, and Xinjiang remain relatively low and grew more slowly. These less economically developed areas have smaller logistics demands, resulting in lower emissions. Most provinces reached their peak emissions around 2018, followed by a decrease by 2022. For example, developed provinces like Guangdong, Jiangsu, and Zhejiang saw emissions decline in 2022 after peaking in 2018. The result likely relates to China’s strengthened environmental policies post-2018, promoting green logistics and the application of new energy vehicles. This shift reflects the effectiveness of China’s environmental policies, the application of green logistics technologies, and adjustments in the energy structure. In the future, with the advancement of carbon neutrality goals, carbon emissions across provinces are expected to decline further, and regional disparities are likely to gradually narrow.
Table 4 classifies the carbon emissions of the logistics industry into seven levels. This classification is primarily based on the numerical range of carbon emissions for each province in 2008 and 2022, as well as their relative position nationwide. Provinces in the Ultra-High and High Emission Zones are relatively economically developed with substantial logistics demand, resulting in carbon emissions significantly higher than other regions. Conversely, provinces in the Low and Ultra-Low Emission Zones have relatively smaller economic scales and lower logistics demand, leading to correspondingly lower carbon emissions. Change Trends: From 2008 to 2022, the emission levels of some provinces changed. For instance, Beijing decreased from the Medium-High Emission Zone to the Medium-Low Emission Zone, while Anhui increased from the Medium-Low Emission Zone to the Ultra-High Emission Zone. These changes reflect differences in economic development, policy implementation, and environmental protection measures across provinces.
Table 4.
Classification of Logistics Industry Carbon Emission Levels by Province in China.
As shown in Figure 10, Figure 11, Figure 12 and Figure 13, from 2008 to 2022, economically developed provinces such as Guangdong, Jiangsu, and Shandong exhibited relatively higher carbon emissions. These provinces possess strong economic capabilities and concentrate a large amount of industrial, commercial, and consumption activities. These economic activities generate substantial demand for logistics and transport, thereby driving the increase in carbon emissions from the logistics industry. Furthermore, provinces serving as national transportation hubs, like Hubei and Henan, also showed relatively high carbon emissions. These provinces bear the critical function of national cargo distribution, characterized by frequent goods flow and large-scale transport operations, which further intensifies carbon emission growth.
Figure 10.
Logistics Industry Carbon Emissions (2008).
Figure 11.
Logistics Industry Carbon Emissions (2013).
Figure 12.
Logistics Industry Carbon Emissions (2018).
Figure 13.
Logistics Industry Carbon Emissions (2022).
From a spatial distribution perspective, between 2008 and 2022, China’s logistics industry carbon emissions displayed a noticeable southward shift. This phenomenon is closely related to the imbalance in China’s regional economic development. Southeastern coastal provinces, leveraging their advantageous geographical locations and policy support, have experienced significantly faster economic growth compared to other provinces. Particularly in provinces like Guangdong, Zhejiang, and Jiangsu, logistics transport demand has risen rapidly alongside increased economic activity, leading to marked growth in carbon emissions. In contrast, northern provinces have experienced relatively slower economic growth, resulting in more stable growth in logistics transport demand and a correspondingly lower growth rate in carbon emissions. These regional disparities not only reflect changes in the spatial distribution of energy consumption and carbon emissions within China’s logistics industry but also reveal the close correlation between economic development levels and carbon emissions.
Further analysis indicates that changes in the regional distribution of carbon emissions are also influenced by the construction of transport infrastructure and the optimization of the energy structure. Southeastern coastal provinces have invested heavily in building logistics and transport networks. The improvement of infrastructure such as roads, railways, and ports facilitates logistics and transport but also increases energy consumption and carbon emission pressure. Meanwhile, northern provinces have made some progress in adjusting their energy structure, for instance, by promoting clean energy and optimizing transport modes, which has to some extent mitigated the growth rate of carbon emissions. Overall, logistics industry carbon emissions exhibit spatial characteristics highly coupled with the level of economic development.
4. Empirical Research Design
4.1. Mechanism Analysis
4.1.1. Mechanism Analysis of the Moderating Effect of Logistics Industry Transport Structure on Logistics Industry Carbon Emissions
This study focuses on two logistics transport modes: road and railway. Road transport primarily relies on diesel or gasoline engines, resulting in higher carbon emissions per unit of cargo. In contrast, although railway transport is less flexible, its carbon emissions per unit are significantly lower. Therefore, rationally adjusting the transport structure can effectively influence energy consumption and carbon emission levels.
From an economic cost perspective, road transport has lower direct costs in short-haul scenarios. However, with rising fuel prices and increasingly stringent environmental policies, this cost advantage is diminishing. Reducing railway transport costs through policy and technological innovation can guide more entities towards low-carbon modes. Regarding timeliness, the expansion of high-speed rail and urban rail networks has substantially improved the timeliness of railway transport, enabling it to meet enterprise demands for transport time, thereby contributing to carbon emission reduction. In terms of convenience and comfort, the continuous improvement of urban public transport systems and the gradual adoption of smart transportation technologies have significantly enhanced the public transport experience. Concerning safety, railways and public transport offer higher safety levels; enhancing their reliability can further promote green travel. Furthermore, the transport efficiency of the logistics industry is also influenced by the micro-level working environment of the labor force. In road transport, the operational status of drivers (e.g., thermal comfort and fatigue levels) affects driving behavior and operational efficiency, thereby indirectly impacting energy consumption [35]. Existing studies have shown that thermal discomfort warning systems based on skin temperature monitoring can identify changes in driving status and optimize operational performance. Therefore, improving working conditions from the perspective of “driver–vehicle–environment” synergy can help further enhance the energy-saving and emission reduction effects of transport structure optimization. In summary, promoting a shift in the transport structure towards railways and developing efficient, low-carbon public transport systems are crucial pathways for achieving emission reduction in the logistics industry.
Technological progress driven by industrialization provides key support for the green transformation of transportation. Technological innovation has spawned low-carbon transport vehicles like electric trucks and hydrogen fuel cell vehicles, significantly reducing carbon emissions and operational costs. Hydrogen energy technology, in particular, offers a feasible path to overcome range limitations for long-distance freight transport. Simultaneously, industrialization fosters the development of multimodal transport systems. By rationally combining railway, waterway, and road transport, overall carbon emissions are substantially reduced. For instance, rail–water intermodal transport can reduce carbon emissions by over 40% compared to road-only transport.
A larger labor force size implies active employment and production (e.g., high factory utilization, large e-commerce order volumes), which generates demand for “large-volume, long-distance” railway transport. If the scale shrinks, leading to weakened production and consumption demand, the transport structure tends to shift towards “small-batch, short-radius” road transport, adapting to the reduced freight volume. Therefore, a larger labor force size enhances the carbon reduction effect of increasing the share of railway transport in the logistics industry, whereas a smaller labor force size, leading to an increased share of road transport, raises carbon emissions.
This study proposes Hypothesis 1:
H1a:
In provinces with higher levels of industrialization, the upward adjustment of the logistics industry transport structure has a stronger effect on reducing carbon emissions. That is, in provinces with higher industrialization levels, the increase in the railway-to-road transport turnover volume ratio is more pronounced, leading to a stronger effect on carbon emission reduction.
H1b:
In provinces with larger labor force populations, the upward adjustment of the logistics industry transport structure has a stronger effect on reducing carbon emissions. That is, in provinces with larger labor force populations, the increase in the railway-to-road transport turnover volume ratio is more pronounced, leading to a stronger effect on carbon emission reduction.
4.1.2. Mechanism Analysis of the Spatial Effects of Logistics Transport Structure on Carbon Emissions
The logistics industry inherently constitutes a highly integrated spatial network system, where different regions are closely interconnected through transportation infrastructure, freight flows, and information flows. Consequently, the economic activities and environmental pollution (e.g., carbon emissions) of one region do not exist in isolation but exhibit significant spatial dependence. As the core framework of this system, changes in the logistics industry’s transport structure inevitably propagate through the network to surrounding areas, generating spatial spillover effects.
The essence of logistics transport structure adjustment is shifting freight transport from high-carbon road transport to lower-carbon railway transport. In terms of energy efficiency, the carbon emissions per unit of transport volume for railways are far lower than those for roads. When a region (the local area) successfully implements a “shift from road to rail,” the direct effect is a reduction in transport carbon emissions within the local scope. More importantly, this mode shift reshapes the regional logistics network: goods tend to be transported over long distances and across regions via railway for trunk-line movement, followed by optimized road feeder distribution around the destination. This process decomposes the originally entire-journey road transport undertaken by heavy trucks traversing multiple administrative regions into a combined model of “low-carbon trunk line + efficient feeder line.” Consequently, it not only reduces local carbon emissions but also exerts a suppressive effect on the carbon emissions of surrounding areas through which the freight flows.
Negative (i.e., emission-reducing) spillovers are primarily achieved through two mechanisms. First, the Network Synergy Emission Reduction Effect: An increase in the share of local railway transport strengthens its hub status within the regional freight network and promotes the development of multimodal transport models, such as “rail–road intermodal transport.” This enables surrounding regions to access the low-carbon transport backbone network more easily, sharing green transport capacity, thereby reducing their reliance on long-distance road transport and optimizing the carbon efficiency of the regional logistics network as a whole. Second, the Traffic Pressure Alleviation Effect: Railways divert cross-regional trunk line freight flows, directly reducing the number of heavy trucks passing through multiple areas. This not only reduces carbon emissions along the trunk roads but also alleviates congestion at key transport nodes in surrounding areas, reducing the additional fuel consumption and emissions caused by congestion.
Integrating the above theories, the emission reduction benefits of locally promoting a transport structure adjustment that substitutes railway for road are not confined to the local area. Instead, through the integrated logistics network, it radiates and drives closely connected neighboring regions, enabling collective carbon emission reduction.
Based on this, this study proposes Hypothesis 2:
H2:
The impact of logistics industry transport structure adjustment on carbon emissions exhibits a negative spatial spillover effect. That is, a higher degree of railway substitution for road transport contributes more to reducing carbon emissions both locally and in surrounding areas.
4.2. Model Construction and Data Sources
4.2.1. Panel Data Model Construction
To better examine the direct impact of logistics industry transport structure adjustment on carbon emissions, the following regression model is constructed:
To investigate the interactive effects of industrialization level and labor force population, interaction terms between these two variables and the logistics industry transport structure adjustment are introduced into Model (4). This aims to examine their moderating role in the relationship between logistics transport structure adjustment and carbon emissions. Thus, Models (5) and (6) are constructed as follows:
In Equations (4)–(6): represents the carbon emissions of the logistics industry for province (municipality, autonomous region) in year , represents the ratio of railway transport turnover volume to road transport turnover volume, denoting the core explanatory variable, namely the logistics industry transport structure, represents the coefficient capturing the impact of on the explained variable, and represent the moderating variables, represents the coefficient capturing the impact of the moderating variables on the explained variable, is a vector composed of control variables, represents the coefficient capturing the impact of on the explained variable, and denote the potential fixed effects or random effects in the model, represents the random error term of the model.
4.2.2. Spatial Weight Matrix Specification
Compared with traditional econometrics, a distinctive feature of spatial econometrics is the need to introduce a spatial weight matrix to quantitatively measure the spatial dependence and heterogeneity of the model variables.
The spatial weight matrix is generally denoted as , and its specific form is an square matrix, where is the number of study regions. The element in the matrix represents the strength of spatial association between region and region . Its values follow the basic principle: when , ; when , the value of depends on the chosen spatial association criterion. The specific formula for the spatial weight matrix is as follows:
Next, the two types of spatial weight matrices used in this study are introduced:
(1) 0–1 Contiguity Matrix. Suppose there are five cities, denoted as A, B, C, D, and E, with the following neighborhood relationships:
(1) A is adjacent to B and C;
(2) B is adjacent to A, C, and D;
(3) C is adjacent to A, B, and D;
(4) D is adjacent to B, C, and E;
(5) E is adjacent to D.
Then, the 0–1 contiguity matrix can be expressed as:
It can be further simplified as:
(2) Spatial Geographical Distance Weight Matrix.
Although the 0–1 contiguity matrix provides an intuitive and convenient method for specifying the spatial weight matrix, some scholars remain cautious about its use. They argue that relying solely on geographical contiguity to determine the spatial weight matrix may not fully and accurately capture the complex relationships between regions. In the real world, interactions between regions may not be limited to direct contiguity but may also be influenced by various factors such as economic, social, and cultural conditions. Therefore, drawing on the perspective of scholars such as Jiang Zhuqing et al. [36], this study adopts the geographical distance between provinces as the basis for measuring the spatial matrix. Based on this measure, we further introduce an inverse distance spatial geographical distance weight matrix as the spatial geographical distance weight matrix employed in this study. Its core principle is that spatial correlation decreases as distance increases, and row standardization is applied. The formula is as follows:
4.2.3. Spatial Econometric Model Specification
Spatial econometric models are primarily used to analyze geographical or spatial data in econometrics. They represent a type of regional science model used to study and statistically analyze different spatial characteristics. Three commonly used spatial econometric models are: the Spatial Lag Model (SAR), the Spatial Error Model (SEM), and the Spatial Durbin Model (SDM).
1. Spatial Lag Model (SAR),The formula is as follows:
2. Spatial Error Model (SEM)
The formula is as follows:
3. Spatial Durbin Model (SDM)
The formula is as follows:
In the equations above: is the constant term, is the regression coefficient of the explanatory variable on the explained variable . is the spatial lag coefficient of the explained variable, is the spatial weight matrix reflecting spatial relationships, is the spatial lag term of the explained variable, denotes the spatial lag term of the explanatory variable, represents the coefficient of the spatial lag term of the explanatory variable, denotes the spatial error autocorrelation coefficient, represents the spatially autocorrelated error term, is the random error term, assumed to follow a normal distribution.
4.2.4. Variable Description and Data Sources
This study selects 31 provinces in China from 2008 to 2022 as the research sample. The data are sourced from the China Energy Statistical Yearbook, China Statistical Yearbook, and the Statistical Bulletin on Transport Development. Variable definitions and measurement methods are presented in Table 5.
Table 5.
Variable Definitions and Measurement Methods.
5. Analysis of Empirical Results
5.1. Analysis of Standard Panel Regression Results
5.1.1. Analysis of Baseline Regression Results for the National Sample
As shown in column (1) of Table 6, the upward adjustment of the logistics industry transport structure (measured by the railway-to-road transport turnover volume ratio) has a significantly negative impact on carbon emissions. After progressively adding control variables, the coefficient of the core explanatory variable remains significantly negative at the 1% level, changing from −0.052 to −0.036. This indicates that an increase in the share of railway transport can effectively reduce carbon emissions. Regarding the control variables, the technological innovation level, financial agglomeration, electricity consumption within the energy structure, and labor force size all show a significant positive correlation with carbon emissions at the 1% level. This suggests they may contribute to emission growth by promoting the expansion of transport scale or increasing energy consumption. On the other hand, technology market development and industrialization level exhibit a significant inhibitory effect on carbon emissions, indicating that the promotion of low-carbon technologies and industrial structure upgrading contribute to emission reduction in the logistics sector.
Table 6.
Baseline Regression Results.
5.1.2. Analysis of Baseline Regression Results for Regional Samples
As shown in Table 7, the impact of upward adjustment in the logistics industry transport structure on carbon emissions exhibits significant regional heterogeneity. In both the eastern and western regions, this variable is significantly negative at the 1% level, with coefficients of −0.055 and −0.034 respectively, indicating that increasing the share of railway transport contributes to emission reduction.
Table 7.
Baseline Regression Results for Regional Samples.
In the analysis of the effectiveness of transport structure adjustment in the central region, we find that the coefficient of transport structure adjustment appears positive, which deviates from theoretical expectations. On the one hand, the central region possesses a relatively strong foundation for waterway transport. For example, in provinces such as Hubei, Hunan, and Jiangxi, the proportion of waterway freight is relatively high, making them more sensitive to carbon emissions compared to increases in railway transport. This regional difference in transport structure leads to an insignificant, or even a short-term positive, effect of simply increasing the share of railway transport on carbon emission reduction. This finding is consistent with existing studies, indicating that the impact of transport structure adjustment on carbon emissions in the central region exhibits significant regional heterogeneity [37].
On the other hand, even when a “shift from road to rail” occurs, constraints related to transshipment efficiency between railway and other transport modes, intermodal connectivity, and node operation efficiency make it difficult to compensate for the increased energy consumption caused by overall rising transport demand in the short term. This suggests that optimizing the transport structure in the central region requires a comprehensive consideration of regional transport network layout, intermodal efficiency, and transport demand matching, rather than relying solely on increasing the share of railway transport. This finding implies that policymakers promoting the “shift from road to rail” should adopt differentiated strategies tailored to the transport characteristics and logistics network differences in various regions to achieve more effective carbon emission reduction targets.
The eastern region, characterized by a developed economy, significant clustering effects, and high urbanization levels, has concentrated transport demand, which lays the foundation for building efficient logistics networks and implementing route optimization. Simultaneously, advanced infrastructure and innovation capabilities provide support for green logistics. The western region benefits from significant improvements in transportation infrastructure, especially the railway network, coupled with policy support and the promotion of clean transport vehicles, as well as adjustments in industrial layout that shorten transport distances, collectively contributing to emission reduction benefits. The positive estimated coefficient in the central region may stem from efficiencies not yet being fully realized during the transition of transport modes, where additional energy consumption is incurred in processes such as loading, unloading, and transshipment. The results indicate that the impact of logistics industry transport structure adjustment on carbon emissions in China exhibits significant regional differences.
5.1.3. Analysis of Moderating Effects Results
Building upon the preceding analysis, this study further introduces interaction terms between industrialization level, labor force size, and the upward adjustment of transport structure to examine their moderating roles in the relationship between logistics transport structure adjustment and carbon emissions. Table 8 reports the regression results, where column (1) presents the baseline regression, and columns (2) and (3) present the estimates after incorporating the interaction terms with industrialization level and labor force size, respectively. After including the industrialization level interaction term, the upward adjustment of transport structure still exhibits a significantly negative impact on carbon emissions, and the absolute value of the coefficient increases noticeably compared to the baseline. This indicates that the industrialization level strengthens the emission reduction effect of increasing the railway transport share. This may stem from the comprehensive improvement in infrastructure and management levels during the industrialization process, which promotes the efficiency of multimodal transport and the development of green and intelligent technologies. However, differences in industrialization stages and economic structures across provinces may lead to heterogeneity in this moderating effect. Conversely, after including the labor force size interaction term, the coefficient of the core explanatory variable turns from negative to positive. This suggests that the growth in labor force size weakens the emission reduction effect of transport structure optimization, and may even contribute to increased carbon emissions overall. This phenomenon could be attributed to the increased scale of transportation activities and rising residential energy consumption driven by labor force growth offset the green benefits derived from adjusting the transport mode structure. Thus, Hypothesis H1a is verified, while Hypothesis H1b is not supported.
Table 8.
Regression Results of Moderating Effects.
5.1.4. Endogeneity Test
To test for potential endogeneity caused by reverse causality, this study employs the Durbin–Wu–Hausman test. As shown in Table 9, the one-period lagged logistics industry transport structure (L.tran) is used as an instrumental variable, and a two-stage least squares (2SLS) estimation is conducted within a panel data model with individual fixed effects. The first-stage regression shows that the coefficient of L.tran is 0.7955 (t = 27.00, p < 0.001), and the F-statistic is 130.77, indicating that the instrumental variable is valid. The Hausman test result shows χ2(7) = 0.47, p = 0.9996, failing to reject the null hypothesis that the transport structure is exogenous. Therefore, there is no significant endogeneity problem for the core explanatory variable in this study. It should be noted that, due to high collinearity between the lagged variable and the contemporaneous variable under two-way fixed effects, this test only controls for individual fixed effects; adding time fixed effects would not alter the exogeneity conclusion. In summary, the core findings of this study pass the endogeneity test.
Table 9.
Endogeneity Test Results.
5.1.5. Robustness Test Based on Winsorized Data
To examine the robustness of the findings, the data were winsorized at the 1% level to mitigate the influence of outliers. As shown in Table 10, the coefficient for logistics industry transport structure adjustment in the national sample is −0.038, which remains significant at the 1% level and closely aligns with the baseline regression result (−0.036). This further supports the negative impact of transport structure optimization on carbon emission reduction. The estimation results for the eastern, central, and western regions are also consistent with the baseline regressions, indicating that the aforementioned conclusions demonstrate good robustness.
Table 10.
Robustness Test Results.
5.2. Exploratory Spatial Data Analysis Results
The Global Moran’s I index and Local Moran’s I index, combined with a spatial geographical distance weight matrix, were employed to test the degree of spatial association of carbon emissions from China’s logistics industry. Specifically, this study calculated the Global Moran’s I index for the explained variable during the period 2008–2022 and plotted Local Moran’s I index scatter plots for the years 2008 and 2022 to reveal the spatio-temporal evolution characteristics of spatial association.
5.2.1. Global Spatial Dependence Test
This study adopts the Global Spatial Autocorrelation Index (Global Moran’s I) to measure the spatial correlation and differentiation characteristics of carbon emissions from China’s logistics industry transport. This index can reflect the overall spatial agglomeration or dispersion trend of the research object. Its calculation formula is as follows:
In the formula above: is the total number of provinces. and represent the carbon emission intensity of the logistics industry for province and province in year , respectively, is the average carbon emission intensity of the logistics industry across all provinces. is the spatial weight matrix, obtained using the contiguity-based spatial weight matrix method. Neighbors are defined based on shared boundaries: if province and province share a common border , then , otherwise, .
The results in Table 11 show that under the spatial geographical distance weight matrix, the Global Moran’s I index for China’s logistics industry carbon emissions from 2008 to 2022 is consistently positive. Furthermore, it passed the significance test at the 10% level in the most recent three years, indicating significant spatial agglomeration of carbon emissions at the provincial level. During the same period, the index exhibited a fluctuating upward trend, reflecting a gradual strengthening of the spatial agglomeration and regional interdependence of logistics industry carbon emissions.
Table 11.
Moran’s I Values for Logistics Industry Carbon Emissions under the Spatial Geographical Distance Weight Matrix (2008–2022).
5.2.2. Local Spatial Dependence Test
This study employs local spatial statistics to measure the spatial heterogeneity of carbon emission intensity across Chinese provinces. For a specific provincial spatial unit , the formula is as follows:
This study classifies the spatial association patterns of logistics industry carbon emissions across Chinese provinces for 2008 and 2022 into four types. Provinces located in the first quadrant belong to the High-High (H-H) agglomeration area, where both the province itself and its neighbors exhibit high carbon emissions, forming a high-emission cluster. The third quadrant represents the Low-Low (L-L) agglomeration area, where both the province and its neighbors have low emissions, reflecting regionally coordinated low-carbon development. These two types demonstrate significant positive spatial autocorrelation. The second quadrant is the Low-High (L-H) outlier area, where a province itself has low emissions but is surrounded by neighbors with high emissions. This pattern may stem from stricter local emission reduction policies or differentiated industrial structures. The fourth quadrant is the High-Low (H-L) outlier area, where a province itself has high emissions but is surrounded by neighbors with low emissions. This suggests potential lagging progress in industrial transformation or energy structure adjustment within the province, exhibiting characteristics of spatial heterogeneity. As seen in Table 12, the spatial types of some provinces remain consistently stable. For instance, Shanghai, Jiangsu, and Zhejiang persistently remain in the H-H type, while northwestern provinces like Shaanxi and Gansu consistently fall into the L-L type. This further confirms the robust existence of “High-High” and “Low-Low” agglomeration phenomena in China’s logistics industry carbon emissions, demonstrating strong positive spatial autocorrelation. Therefore, employing spatial econometric models can effectively capture this spatial dependence and heterogeneity, confirming the methodological rationality and scientific soundness of the approach.
Table 12.
Spatial Clustering Pattern of Logistics Industry Carbon Emissions Based on Geographical Distance Weight Matrix (2008 and 2022).
5.3. Analysis of Spatial Effects for the National Sample
5.3.1. Spatial Econometric Model Tests
According to Table 13, the LM-error test is statistically insignificant, while the LM-lag test is significant at the 1% level, indicating the presence of spatial autocorrelation and supporting the use of the Spatial Lag Model (SAR). Furthermore, since the number of cross-sectional units (N = 30) exceeds the time span (T = 15), and the Hausman test result is significant at the 1% level (statistic = 18.75), the null hypothesis of random effects is rejected. Consequently, this study ultimately selects the Spatial Lag Model (SAR) with two-way fixed effects to analyze the spatial impact of logistics industry transport structure adjustment on carbon emissions.
Table 13.
Lagrange Multiplier (LM) Test Results (Geographic Distance Matrix).
5.3.2. Baseline Model Estimation Results
Based on the two-way fixed effects SAR model and multi-dimensional comparisons (Table 14), the AIC values under different settings are: random effects (−1270.86), individual fixed effects (−1463.82), time fixed effects (−853.51), and two-way fixed effects (−1502.64). According to the Akaike Information Criterion (AIC) minimization principle, the two-way fixed effects spatial lag model was ultimately selected. The model estimation results show that the coefficient for the upward adjustment of the logistics industry transport structure is −0.025 and is significantly negative at the 5% level. This indicates that a 1% increase in the railway-to-road turnover volume ratio leads to a significant 2.5% reduction in logistics industry carbon emissions. This effect is primarily attributed to the advantages of railway transport in economies of scale, cost-effectiveness, and government infrastructure investments, which encourage a shift in freight from road to rail, thereby effectively reducing carbon emissions. Hypothesis H2 is thus validated.
Table 14.
Spatial Panel Data Regression Results Based on the Spatial Geographical Distance Weight Matrix.
5.3.3. Robustness Test Using an Alternative Spatial Weight Matrix
To mitigate the potential influence of subjectivity in selecting the spatial weight matrix, this study employs a 0–1 contiguity matrix to conduct robustness tests on the estimation model based on the spatial geographical distance weight matrix. The specific testing procedure is shown in Table 15. As can be seen from Table 15, using the 0–1 contiguity matrix and still applying the Spatial Lag Model (SAR).
Table 15.
Lagrange Multiplier (LM) Test Results (Contiguity Matrix).
The estimation results of the Spatial Lag Model (SAR) based on the 0–1 contiguity matrix (Table 16) show that, after selecting the two-way fixed effects model according to the Akaike Information Criterion (AIC), the coefficient for the upward adjustment of the logistics industry transport structure is −0.0247 and is significant at the 5% level. This indicates that for every 1% increase in the share of railway transport turnover volume relative to road transport, carbon emissions decrease significantly by 2.47%. This result is highly consistent with the estimates based on the geographical distance weight matrix, further validating the robustness and reliability of the model specification and the empirical conclusions.
Table 16.
Spatial Panel Data Regression Results Based on the 0–1 Contiguity Matrix.
5.4. Analysis of Spatial Effects for Regional Samples
5.4.1. Selection of Spatial Econometric Models
According to the test results in Table 17, the SAR, SAR, and SEM models were selected for analyzing the eastern, central, and western regions, respectively.
Table 17.
LM Test Results.
5.4.2. Spatial Model Estimation Results
According to the spatial econometric regression results by region (Table 18), and based on the Akaike Information Criterion (AIC) minimization principle, fixed effects models should be adopted for all three major regions: eastern, central, and western.
Table 18.
Spatial Panel Data Regression Results by Region.
In the eastern region, the coefficient for transport structure adjustment is −0.0439, indicating that an increase in the share of railway transport can significantly reduce carbon emissions. The coefficient for the energy structure (share of electricity consumption) is significantly negative, reflecting that the promotion of clean energy effectively promotes emission reduction. Conversely, the industrialization level shows a significant positive correlation with carbon emissions. In the central region, the coefficient for transport structure adjustment is 0.00972 and did not pass the significance test, suggesting that the optimization of transport modes in this region does not yet contribute significantly to carbon emission reduction. The energy structure also exhibits a significant negative impact, but the technological innovation level significantly increases carbon emissions. In the western region, the transport structure adjustment coefficient is −0.0535, which is significantly negative at the 1% level, indicating a clear emission reduction effect from structural adjustment. Labor force growth significantly increases carbon emissions at the 10% level, while the development of the technology market has a significant positive effect on emission reduction.
5.5. Analysis of Spatial Spillover Effects
According to the spatial econometric model regression results (Table 19), after incorporating the spatial lag term, the impact of upward adjustment in the logistics industry transport structure on carbon emissions can be decomposed into direct effects, indirect effects (spatial spillover effects), and total effects. At the national level, the direct effect of transport structure upward adjustment is −0.0209, significant at the 1% level, indicating that an increase in the railway transport share has a significant effect on reducing carbon emissions within the province itself. Its indirect effect is −0.0435, also significant at the 1% level, and the spillover effect is larger than the direct effect. This suggests that an increase in the railway transport share not only helps reduce emissions within the province but also significantly contributes to lowering carbon emissions in neighboring provinces. Hypothesis H2 is further validated. Results by region show that upward adjustment of the transport structure in both the eastern and western regions exhibits significant indirect effects, reflecting notable spatial spillover emission reduction effects. The eastern region may benefit from its diversified transportation systems and travel modes, while the western region relies more on the low-carbon advantages of railways due to factors like long transport distances and sparse populations. Although the central region shows a negative direct effect, the indirect effect is not significant. This might be related to its role in handling substantial cross-regional passenger and freight transfers and potentially insufficient resource utilization. It is anticipated that this structural constraint will gradually ease with the continuous improvement of the transportation network and advancements in technological levels.
Table 19.
Decomposition of Spatial Effects.
6. Discussion
Using the case of China, this paper analyzes the impact mechanism of logistics industry transport structure adjustment on carbon emissions.
Firstly, starting from the theoretical mechanism of how logistics transport structure affects carbon emissions, this study measures the logistics transport structure and carbon emission levels, revealing their temporal evolution and spatial differentiation characteristics. This overcomes the limitations of existing research, which lacks macro-level quantitative characterization of the spatio-temporal evolution of transport structure and fails to reveal its dynamic patterns. This study provides a detailed investigation of the logistics industry transport structure. Considering the dominant position of railway and road transport in China’s comprehensive transport system (combined share exceeding 80%) and their primary role in transport structure optimization, this study selects these two most representative modes as the research subjects. The logistics industry transport structure is measured using the ratio of railway transport turnover volume to road transport turnover volume. Furthermore, in Refs. [4,6] existing research predominantly focuses on micro-level and enterprise-level analyses involving technological improvements, model construction, and policy recommendations, or emphasizes case studies of specific modes, resulting in limited reliability of measurement results. Therefore, this paper selects the ratio of railway-to-road transport turnover volume to measure the logistics transport structure. Compared to existing studies, this measurement method can more effectively encompass the logistics transport network. The findings reveal that logistics industry turnover volume shows a fluctuating upward trend. The ratio is generally lower in East and South China, while it is relatively higher in Northwest and Northeast China. Nationally, the share of railway transport exhibits a trend of gradual increase from the southeast to the northwest. It should be noted that railway transport in China is primarily based on electrified trunk lines, mainly driven by electricity, with power sources including hydropower, wind power, solar energy, and thermal power. A small number of branch lines still use diesel locomotives. Overall, the carbon emission intensity of electrified railways is lower than that of road transport; however, this advantage may be diminished in regions where thermal power accounts for a high share of the electricity mix or where the proportion of diesel locomotives is relatively large. Therefore, when analyzing the impact of railway transport on carbon emissions, consideration should be given to the energy structure and regional differences.
Secondly, this study expands research on logistics industry carbon emissions. Existing studies [30,31] lack dynamic analysis of the spatio-temporal evolution characteristics of logistics carbon emissions, making it difficult to reveal regional disparities and evolutionary patterns. This paper measures carbon emissions from China’s logistics transport sector based on fuel consumption data by source category and carbon emission coefficients, improving the accuracy of the estimates. The findings indicate that economically strong provinces like Guangdong and Jiangsu maintain high carbon emission levels due to high industrial agglomeration and strong logistics demand. Transportation hub provinces like Hubei and Henan also exhibit high emission levels, leveraging their advantageous geographical locations and large logistics scale. Notably, during the observation period, carbon emissions showed a clear southward shift. Southeastern coastal regions experienced a significant rise in emissions, benefiting from rapid economic development, while northern provinces saw relatively slower emission growth, partly due to their slower economic growth rates. Observing regional differences: most provinces exhibited an upward trend in logistics carbon emissions between 2008 and 2018, with economically developed eastern coastal provinces generally having higher emission levels. Emissions in the central and western regions were relatively lower but showed a clear growth trend.
Finally, regarding research on the impact of logistics transport structure adjustment on carbon emissions, existing studies have two main shortcomings. First, most [32,33] focus on local direct effects while neglecting the inherent network characteristics of the logistics industry and the potential spatial spillover effects, leading to an incomplete assessment of emission reduction potential and difficulty in supporting regionally coordinated governance. Second, existing analytical frameworks fail to adequately consider the moderating roles of key socio-economic factors such as industrialization level and labor force size. Specifically, a higher industrialization level, when combined with a low-carbon transport structure (e.g., high railway share), can effectively curb emissions associated with industrial expansion. However, an increase in the labor force size leads to higher carbon emissions due to the growing population, thereby resulting in an increase in total carbon emissions. This research gap makes it difficult for academia to accurately grasp the substantive impact of regional heterogeneity, limiting the explanatory power of theoretical models. This omission makes it challenging to accurately assess the carbon reduction effects of transport structure adjustment against the backdrop of regional development imbalances, thereby affecting the depth of research and policy applicability. Consequently, this paper constructs standard panel models and spatial econometric models to systematically investigate the impact mechanism and spatial effects of logistics transport structure adjustment on carbon emissions, introducing industrialization level and labor force size as moderating variables. The findings reveal that in provinces with higher industrialization levels, the increase in railway turnover volume relative to road transport is more pronounced, leading to a stronger effect on carbon emission reduction.
This paper also tests the spatial autocorrelation of carbon emissions using the Global Moran’s I index, with results indicating significant spatial agglomeration characteristics. Based on this, spatial econometric models were selected for different regions: the Spatial Lag Model (SAR) for eastern and central China, and the Spatial Error Model (SEM) for western China. The research finds significant regional heterogeneity in the spatial spillover effects of logistics transport structure adjustment on carbon emissions. Firstly, the eastern region is known for its highly developed economy and high urbanization, creating industrial clustering effects which concentrate transport demand. This demand concentration not only drives the construction of efficient logistics networks but also provides favorable conditions for optimizing the transport structure. Rational planning of transport routes and modes can reduce unnecessary long-distance transport, effectively lowering carbon emissions. Furthermore, the advanced infrastructure and technological innovation capacity in the eastern region provide solid material support for green logistics. By integrating resources, improving load efficiency, and adopting low-carbon technologies, the eastern region leads the nation in achieving sustainable development goals. In central region provinces, a higher railway-to-road transport turnover volume ratio is associated with higher carbon emissions. Typically, railway transport is considered a relatively low-carbon mode due to its lower carbon emissions per unit of cargo compared to road transport. During the adjustment process, the transition between transport modes might lead to reduced efficiency. Significant volumes of goods being loaded, unloaded, and transferred at hubs in this region could increase energy consumption and emissions. The western region has seen significant improvements in transportation infrastructure, particularly in the expansion and modernization of the railway network. These improvements provide conditions for more efficient freight transport, reducing energy consumption and emissions during transit. Additionally, the western region has shortened transport distances by adjusting industrial layouts, thereby enhancing logistics efficiency.
Secondly, the promoting effect of transport structure optimization on carbon reduction is most significant in eastern China. This result is closely related to the region’s well-developed transportation infrastructure, higher proportion of clean energy use, and advanced application of green technologies. Moreover, the developed economy and strong logistics demand in the east allow the carbon reduction potential of transport structure adjustment to be fully realized. The carbon reduction effect of transport structure adjustment is relatively limited in central China. This may be related to the region’s heavier industrial structure, coal-dominated energy consumption mix, and its role as a transport hub undertaking massive passenger and freight transfers between east and west. The promoting effect of transport structure optimization on carbon reduction is also significant in western China. This result benefits from the continuous investment in green transportation infrastructure under the national Western Development Strategy and the region’s abundant renewable energy resources. Furthermore, the relatively lower logistics demand in the west means the marginal emission reduction effect of transport structure adjustment is more pronounced.
From a practical perspective, the logistics industry is a major source of CO2 emissions, and its green transformation is crucial for achieving the “Dual Carbon” goals. This study not only reveals the core role of logistics transport structure adjustment in carbon emission reduction but also identifies its regional disparities and spatial mechanisms, providing a scientific basis for formulating differentiated and coordinated low-carbon logistics policies in China. Furthermore, the methodological framework and empirical conclusions can offer insights for other developing countries, promoting the green and low-carbon development of the logistics industry globally.
7. Conclusions and Implications
7.1. Research Findings
Based on panel data from 30 Chinese provinces from 2008 to 2022, this study employs data visualization, standard panel models, and spatial econometric models to empirically investigate the spatio-temporal evolution characteristics and impact mechanisms of logistics industry transport structure adjustment on carbon emissions. It further introduces industrialization level and labor force size as moderating variables for an in-depth discussion. The main findings are as follows:
Firstly, China’s logistics industry transport structure exhibits significant regional heterogeneity. Railway-dependent regions: Examples include Beijing, Qinghai, Shanxi, and Inner Mongolia. These areas are either resource-based provinces where railways hold a significant advantage in long-distance bulk cargo transport, or their road development is constrained by geographical conditions (e.g., the Qinghai–Tibet Plateau). Road-dominant regions: These are primarily concentrated in economically developed provinces such as those in the Yangtze River Delta and Pearl River Delta (e.g., Shanghai, Jiangsu, Zhejiang). These regions feature high urbanization levels and dense road networks, making road transport more suitable for high-frequency, short-haul logistics demands. Economically developed eastern coastal regions lean towards road transport, while Northwest and Northeast China rely more on railway transport due to geographical and economic factors. China’s railway-to-road turnover volume ratio shows an overall declining trend, with significant decreases in coastal areas like Tianjin and Shanghai. Conversely, provinces like Qinghai and Xinjiang show a continuous increase in the railway share due to their geographical environments and population distribution characteristics. Concurrently, national logistics carbon emissions showed a fluctuating upward trend. Economically strong provinces like Guangdong and Jiangsu, and hub provinces like Hubei and Henan, maintained high emission levels. Logistics carbon emissions exhibited a “southward shift,” with significant growth rates in the southeastern coast and relatively slower growth in northern provinces, indicating a positive correlation between economic development and carbon emissions.
Secondly, baseline regressions show that increasing the share of railway transport has a significant inhibitory effect on carbon emissions, significant at the 1% level. Regional regressions indicate that the emission reduction effect is most pronounced in the eastern region, followed by the western region, and insignificant in the central region. These differences stem from factors like infrastructure, industrial structure, and energy consumption structure. Tests of moderating effects indicate that in provinces with higher industrialization levels, the increase in the railway-to-road transport turnover volume ratio is more pronounced, leading to a stronger effect on carbon emission reduction. However, an increase in the labor force size leads to higher carbon emissions due to the growing population, thereby resulting in an increase in total carbon emissions.
Thirdly, spatial econometric tests confirm significant spatial correlation in carbon emissions. The Spatial Lag Model (SAR) is more suitable for eastern and central China, while the Spatial Error Model (SEM) is preferable for western China. Regional regression results show that in the eastern region, transport structure optimization contributes significantly to carbon reduction, benefiting from a well-developed road network, clean energy vehicles, and smart logistics systems, while in the central region, the results are insignificant, potentially related to its ongoing industrial transition and relatively high reliance on traditional energy sources. As for the western region, the effect is significant at the 1% level, closely associated with investments in green infrastructure and the promotion of new energy logistics equipment.
7.2. Policy Implications
Based on the above conclusions, this study derives the following policy implications:
First, carbon emissions in China’s logistics industry are closely related to the transport structure and exhibit significant regional disparities. Therefore, promoting regionally differentiated transport structure adjustment and optimizing logistics transport modes is essential. At the national level, it is necessary to continuously increase the share of railways in comprehensive transport, particularly in East and South China where road dependency is high. Specifically, the eastern region should take the lead in promoting the “shift from road to rail” and deploying clean energy vehicles, The central region needs to focus on industrial structure upgrading and investment in green transportation infrastructure, while jointly investing in dedicated railway freight lines through cross-provincial collaboration. The western region should continue to strengthen its railway network and promote the adoption of new energy vehicles. Through the above measures, the overall optimization of the transport structure and the maximization of carbon reduction benefits can be achieved. At the same time, it should enhance cross-regional collaborative emission reduction capacity.
Second, China’s logistics carbon emissions show a clear regional imbalance. To promote coordinated regional development and effectively narrow the carbon emission gap, a differentiated strategic system of “categorized guidance, regional coordination, and innovation-driven” should be established. On one hand, fully leverage the innovative leadership and demonstration role of developed urban agglomerations like the Yangtze River Delta, Pearl River Delta, and Beijing-Tianjin-Hebei region. They should pioneer trials in key technology breakthroughs, green regulation formulation, and financial product innovation. On the other hand, Greater precision support should be provided to the central and western regions and the “High-High” (H-H) carbon emission agglomeration areas. This includes establishing cross-provincial special funds, building cross-provincial logistics information sharing and multimodal transport dispatching platforms, and incentivizing low-carbon transport development through joint supervision and performance evaluation mechanisms. In this way, a favorable pattern of complementary advantages and coordinated emission reduction can be formed.
Third, effective policy support and market-based incentive mechanisms are crucial guarantees for promoting the green and low-carbon transition of the logistics industry. The government is advised to improve a multi-level policy incentive system. On one hand, Strengthen fiscal investment in railway and green infrastructure in the central and western regions and high-carbon agglomeration areas, and establish special construction funds. On the other hand, progressively promote market-based emission reduction mechanisms such as carbon trading and carbon taxes, prioritizing pilot programs in developed regions and incorporating the transportation sector into the trading system. Simultaneously, establish special funds for low-carbon technology research and development. Use policies like tax reductions and additional expense deductions to incentivize enterprises for technological innovation and application, providing sustained momentum for emission reduction.
Through the above measures, not only can regional transport structure optimization be achieved, but the carbon reduction efficiency of green railways and cross-provincial coordinated transport can also be enhanced, providing an operable pathway for the construction of a regional green and low-carbon logistics system.
7.3. Limitations and Future Research Directions
This study comprehensively employs various methods, including data visualization and econometric models, to systematically analyze the spatio-temporal evolution characteristics and impact mechanisms of logistics transport structure adjustment and carbon emissions. However, some limitations remain. First of all, regarding data availability, the lack of publicly available, continuous, and standardized micro-level data at the city or enterprise level necessitated analysis based on provincial-level macro data. This somewhat limits the detailed examination of heterogeneous behavioral patterns of small and medium-sized logistics enterprises. Meanwhile, existing studies have shown that “bottom-up” carbon emission estimation methods, constructed based on data such as vehicle operating status, fuel consumption, and driving behavior, can characterize emission differences at the micro level. Due to data availability constraints, this study is unable to incorporate such micro-level data; future research may combine relevant data to validate or refine the macro-level estimation results. Second, the data used in this study only extend to 2022, mainly because relevant data after 2022 have not yet been fully disclosed or uniformly compiled. Consequently, the latest changes in transport structure and carbon emissions are not included in the analysis, which may affect the short-term estimation of spatial spillover effects and the emission reduction effects of the “shift from road to rail.” Finally, given the characteristics of currently available data and macro-analysis methods, this study adopts a uniform approach and does not differentiate by cargo type, transport service mode, or specific connecting transport demand (e.g., door-to-door transport still requiring trucks/lorries). Under conditions of short-distance transport or specific transport services, this may lead to certain differences in mode substitution effects, but it does not affect the overall analysis of macro-level transport structure adjustment.
In light of the above limitations, future research can be further expanded and deepened from multiple dimensions. On the one hand, data sources can be expanded by integrating micro-enterprise data, traffic flow data, satellite remote sensing data, and data related to new energy heavy-duty trucks and smart logistics platforms after 2022, to construct a more comprehensive and accurate carbon emission measurement system, in order to capture the latest changes in transport structure and carbon emissions, and to verify the robustness of transport mode shifts and emission reduction effects under the new development context. On the other hand, analytical methods can be enhanced by introducing dynamic spatial panel models, threshold regression models, etc., to reveal the nonlinear, dynamic changes and regional differences in the emission reduction effects of transport structure adjustment. Furthermore, by integrating multimodal transport routing and Geographic Information System (GIS) technology, future research could analyze the spatial impact of cargo type, connecting transport, geographical conditions, and resource endowments on the emission reduction effectiveness of transport structure, thereby providing a scientific basis for formulating differentiated regional policies.
Author Contributions
Conceptualization, H.C. and Q.L.; methodology, H.C. and B.Z.; software, Q.L.; validation, H.C., Q.L. and B.Z.; formal analysis, B.Z.; investigation, Q.L.; resources, H.C. and B.Z.; data curation, H.C.; writing—original draft preparation, Q.L.; writing—review and editing, J.T.; visualization, J.T.; supervision, Q.L.; project administration, H.C.; funding acquisition, H.C. All authors have read and agreed to the published version of the manuscript.
Funding
This research was funded by the National Social Science Fund General Project “Evaluation, Impact Mechanism and Policy Improvement of China’s Regional Emergency Logistics Rapid Response Capacity under Public Emergencies” (grant number 22BJY159), the Fundamental Research Funds for the Central Universities (grant number SK2025016), and the China Postdoctoral Science Foundation General Project (grant number 2019M663757).
Institutional Review Board Statement
Not applicable.
Informed Consent Statement
Not applicable.
Data Availability Statement
Data will be made available on request.
Acknowledgments
During the preparation of this study, the author employed artificial intelligence tools (DeepSeek-V4) for text translation and language polishing. The author has thoroughly reviewed, edited, and verified all content and assumes ultimate responsibility for its accuracy and the entirety of the published work.
Conflicts of Interest
The authors declare no conflict of interest.
References
- Cao, X.; Ouyang, S.; Liu, D.; Yang, W. Spatiotemporal patterns and decomposition analysis of CO2 emissions from transportation in the Pearl River Delta. Energies 2019, 12, 2171. [Google Scholar] [CrossRef] [Scilit]
- Liu, Q.; Ma, C. Eco-efficient transition pathways for urban transportation: A case study of Chengdu’s decarbonization initiatives. Sustainability 2025, 17, 4949. [Google Scholar] [CrossRef] [Scilit]
- Nocera, S.; Cavallaro, F.; Irranca Galati, O. Options for reducing external costs from freight transport along the Brenner corridor. Eur. Transp. Res. Rev. 2018, 10, 53. [Google Scholar] [CrossRef] [Scilit]
- Sittivijan, P. Application of Disaggregate Discrete Choice Model for Intermodal Stochastic Congested Freight Network Flow Assignment. Ph.D. Thesis, Oklahoma State University, Stillwater, OK, USA, 2009. [Google Scholar]
- Huang, Q.; Ling, J. Measuring embodied carbon dioxide of the logistics industry in China: Based on industry stripping method and input-output model. Environ. Sci. Pollut. Res. 2021, 28, 52780–52797. [Google Scholar] [CrossRef] [Scilit]
- Wu, J.; Wang, Y.; Li, W.; Wu, H. Research on green transport mode of Chinese bulk cargo based on fourth-party logistics. J. Adv. Transp. 2021, 2021, 1–16. [Google Scholar] [CrossRef] [Scilit]
- Go, Y.S.; Park, D.J.; Kim, C.S.; Kim, H.S.; Park, M.C. Supply chain-based freight distribution channel choice model using distribution channel analysis. J. Korean Soc. Transp. 2010, 28, 133–146. [Google Scholar]
- Liu, P.; Mu, D.; Gong, D. Eliminating overload trucking via a modal shift to achieve intercity freight sustainability: A system dynamics approach. Sustainability 2017, 9, 398. [Google Scholar] [CrossRef] [Scilit]
- Chang, Y.T.; Lee, P.T.W.; Kim, H.J.; Shin, S.H. Optimization model for transportation of container cargoes considering short sea shipping and external cost: South Korean case. Transp. Res. Rec. 2010, 2166, 99–108. [Google Scholar] [CrossRef] [Scilit]
- Dong, C.; Li, D. Achieving economic and environmental sustainability with supply chain contracts. Prod. Oper. Manag. 2025, 34, 1632–1649. [Google Scholar] [CrossRef] [Scilit]
- Zhao, P.; Zeng, L.; Li, P.; Lu, H.; Hu, H.; Li, C.; Qi, Y. China’s transportation sector carbon dioxide emissions efficiency and its influencing factors based on the EBM DEA model with undesirable outputs and spatial Durbin model. Energy 2022, 238, 121934. [Google Scholar] [CrossRef] [Scilit]
- Bugge, M.M.; Andersen, A.D.; Steen, M. The role of regional innovation systems in mission-oriented innovation policy: Exploring the problem-solution space in electrification of maritime transport. Eur. Plan. Stud. 2022, 30, 2312–2333. [Google Scholar] [CrossRef] [Scilit]
- Jackson, I.; Saenz, M.J.; Li, Y.; Moreno, M.S.R. Synchromodal supply chains for fast-moving consumer goods. Appl. Sci. 2023, 13, 3119. [Google Scholar] [CrossRef] [Scilit]
- De Moor, B.J.; Creemers, S.; Boute, R.N. Breaking truck dominance in supply chains: Proactive freight consolidation and modal split transport. Int. J. Prod. Econ. 2023, 257, 108764. [Google Scholar] [CrossRef] [Scilit]
- Hrušovský, M.; Hemmelmayr, V.; Schett, G.; Birkmaier, A.; Schlund, S. Integrated planning approach for fleet sizing and fleet management of freight railcars. Flex. Serv. Manuf. J. 2025, 37, 869–903. [Google Scholar] [CrossRef] [Scilit]
- Eschmann, J.; Mueller, K.; Oesingmann, K.; Ennen, D. The economic implications of carbon neutrality ambitions in extra-European freight transport. Transp. Res. Part D Transp. Environ. 2025, 146, 104812. [Google Scholar] [CrossRef] [Scilit]
- Ping, G.; Zhu, M.; Ling, Z.; Niu, K. Research on optimizing logistics transportation routes using AI large models. Spectrum Res. 2024, 4. Available online: https://spectrumofresearch.com/index.php/sr/article/view/7 (accessed on 26 April 2026).
- McKinnon, A.C.; Piecyk, M.I. Measurement of CO2 emissions from road freight transport: A review of UK experience. Energy Policy 2009, 37, 3733–3742. [Google Scholar] [CrossRef] [Scilit]
- Piecyk, M.I.; McKinnon, A.C. Forecasting the carbon footprint of road freight transport in 2020. Int. J. Prod. Econ. 2010, 128, 31–42. [Google Scholar] [CrossRef] [Scilit]
- McKinnon, A.C.; Browne, M.; Whiteing, A.; Piecyk, M. Green Logistics: Improving the Environmental Sustainability of Logistics, 3rd ed.; Kogan Page: London, UK, 2015. [Google Scholar]
- Pålsson, H.; Finnsgård, C.; Wänström, C. Packaging logistics in supply chain practice―Current state, trade-offs and improvement potential. Int. J. Phys. Distrib. Logist. Manag. 2013, 43, 425–447. [Google Scholar] [CrossRef] [Scilit]
- Cui, J.; Li, Z.; Wang, Y. The impact of transportation investment on carbon emissions: Empirical evidence from China’s provinces. Transp. Res. Part D Transp. Environ. 2017, 50, 274–287. [Google Scholar]
- De, M.; Giri, B.C. Modelling a closed-loop supply chain with a heterogeneous fleet under carbon emission reduction policy. Transp. Res. Part E Logist. Transp. Rev. 2020, 133, 101813. [Google Scholar] [CrossRef] [Scilit]
- Dubisz, D.; Golinska-Dawson, P.; Zawodny, P. Measuring CO2 emissions in e-commerce deliveries: From empirical studies to a new calculation approach. Sustainability 2022, 14, 16085. [Google Scholar] [CrossRef] [Scilit]
- Raihan, A.; Tuspekova, A. Dynamic impacts of economic growth, renewable energy use, urbanization, industrialization, tourism, agriculture, and forests on carbon emissions in Turkey. Carbon Res. 2022, 1, 20. [Google Scholar] [CrossRef] [Scilit]
- Li, R.; Li, L.; Wang, Q. The impact of energy efficiency on carbon emissions: Evidence from the transportation sector in Chinese 30 provinces. Sustain. Cities Soc. 2022, 82, 103880. [Google Scholar] [CrossRef] [Scilit]
- Zhang, Q.; Liu, S.; Chen, X. Green logistics practices and firm performance: The role of environmental innovation capability. J. Clean. Prod. 2020, 258, 120810. [Google Scholar]
- Dan, Y.; Liu, G. Integrated scheduling optimization of production and transportation for precast component with delivery time window. Eng. Constr. Archit. Manag. 2024, 31, 3335–3355. [Google Scholar] [CrossRef] [Scilit]
- Zheng, J.; Shi, X.; Zhang, Z. Assessing feasibility of direct measurement technology for monitoring carbon emissions in ports. Commun. Transp. Res. 2024, 4, 100132. [Google Scholar] [CrossRef] [Scilit]
- Wang, Z.; Mae, M.; Nishimura, S.; Matsuhashi, R. Vehicular fuel consumption and CO2 emission estimation model integrating novel driving behavior data using machine learning. Energies 2024, 17, 1410. [Google Scholar] [CrossRef] [Scilit]
- Lin, S.; Wang, J. Carbon emission reduction effect of transportation structure adjustment in China: An approach based on multi-objective optimization model. Environ. Sci. Pollut. Res. 2021, 29, 6166–6183. [Google Scholar] [CrossRef] [Scilit]
- Albalate, D.; León-Gómez, C.R. High-speed rail: A game changer for Spanish motorway transport? Econ. Transp. 2024, 39, 100360. [Google Scholar] [CrossRef] [Scilit]
- Fontaine, P.; Minner, S.; Schiffer, M. Smart and sustainable city logistics: Design, consolidation, and regulation. Eur. J. Oper. Res. 2023, 307, 1071–1084. [Google Scholar] [CrossRef] [Scilit]
- Ouyang, B.; Zhang, Y.J.; Guo, J. Comprehensive evaluation indicators for low-carbon transportation and their application. J. Beijing Inst. Technol. 2014, 16, 7–13. [Google Scholar]
- Wang, Z.; Matsuhashi, R.; Onodera, H. Intrusive and non-intrusive early warning systems for thermal discomfort by analysis of body surface temperature. Appl. Energy 2023, 329, 120283. [Google Scholar] [CrossRef] [Scilit]
- Jiang, Z.Q.; Liu, J.J.; Han, F. Traffic congestion, spatial spillover and population urbanization. Collect. Essays Financ. Econ. 2019, 35, 104–112. [Google Scholar]
- Tian, C.L.; Yang, D. An empirical analysis of the impact of transport structure on transportation carbon emissions. J. Transp. Res. 2022, 8, 10–18. [Google Scholar] [CrossRef]
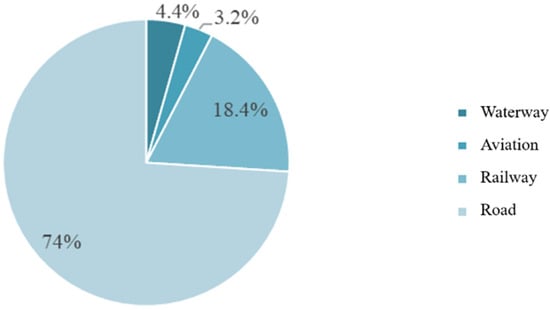
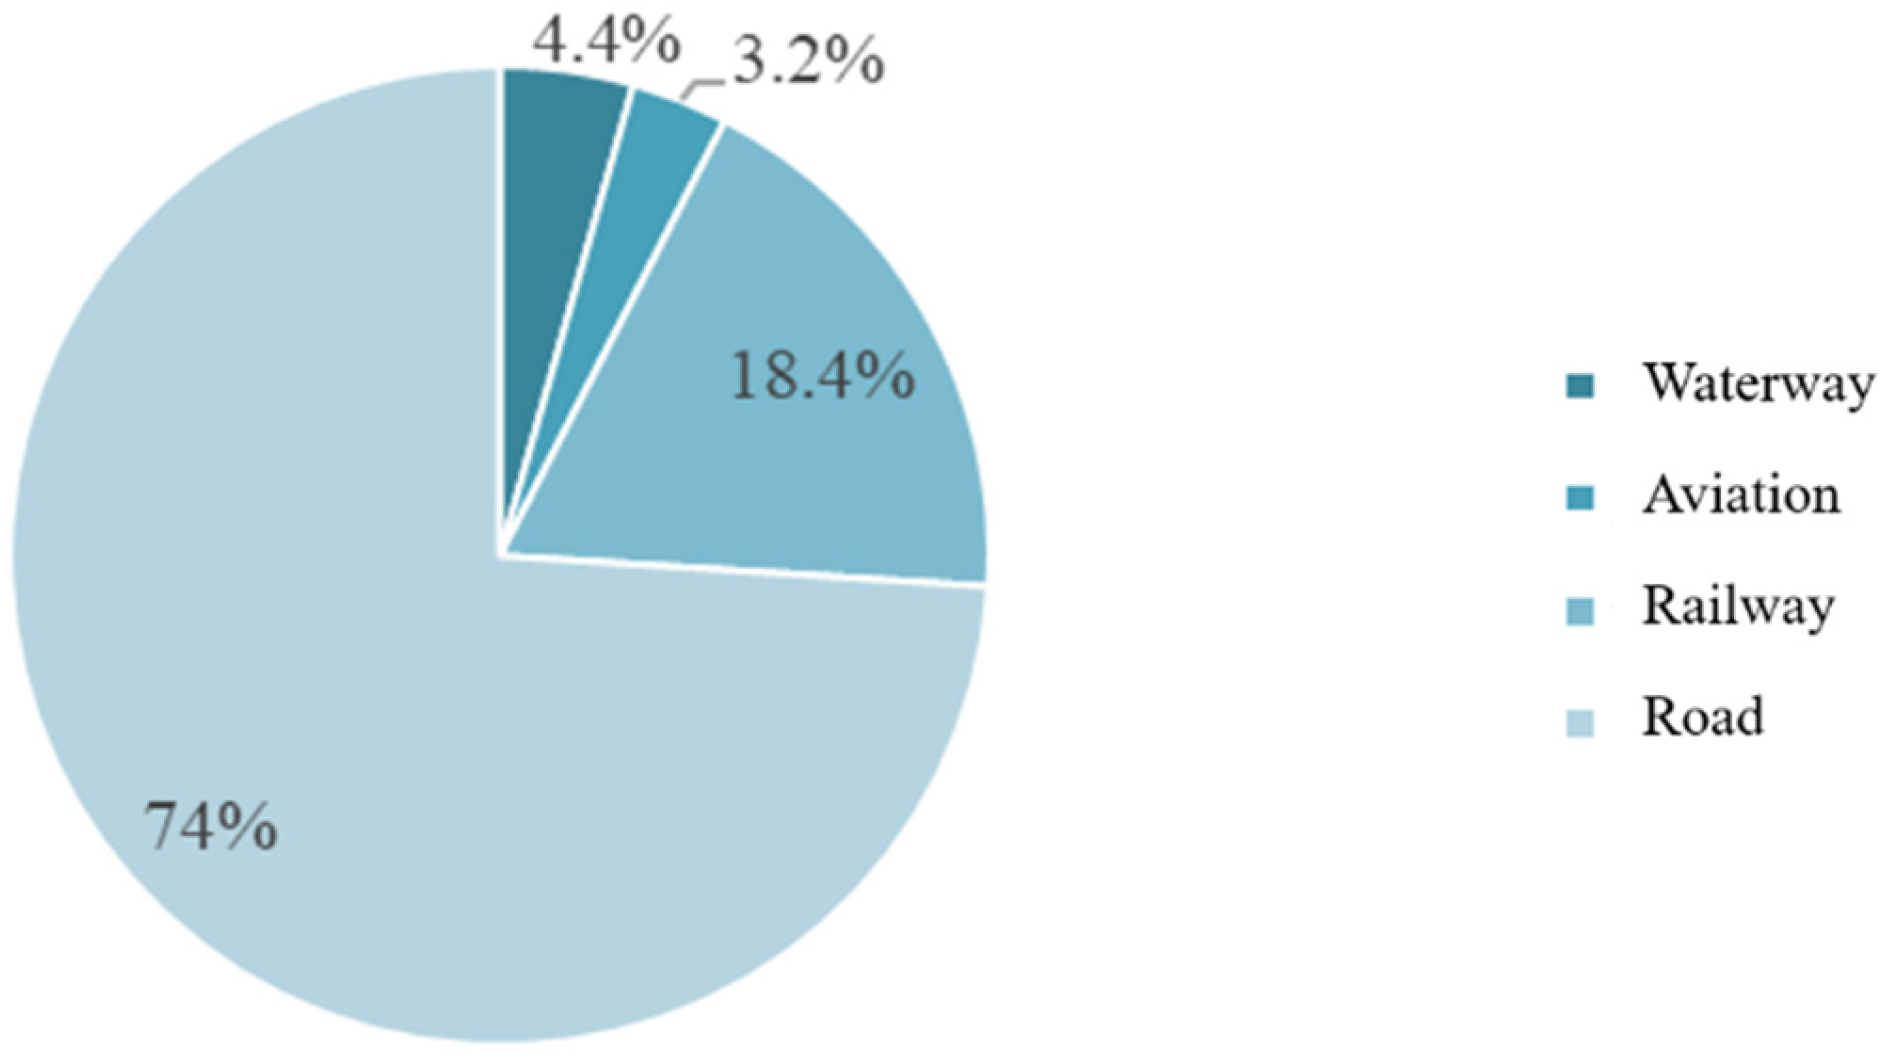
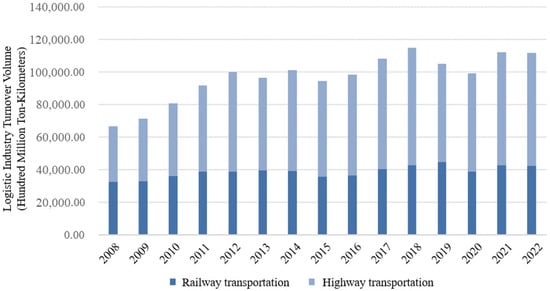
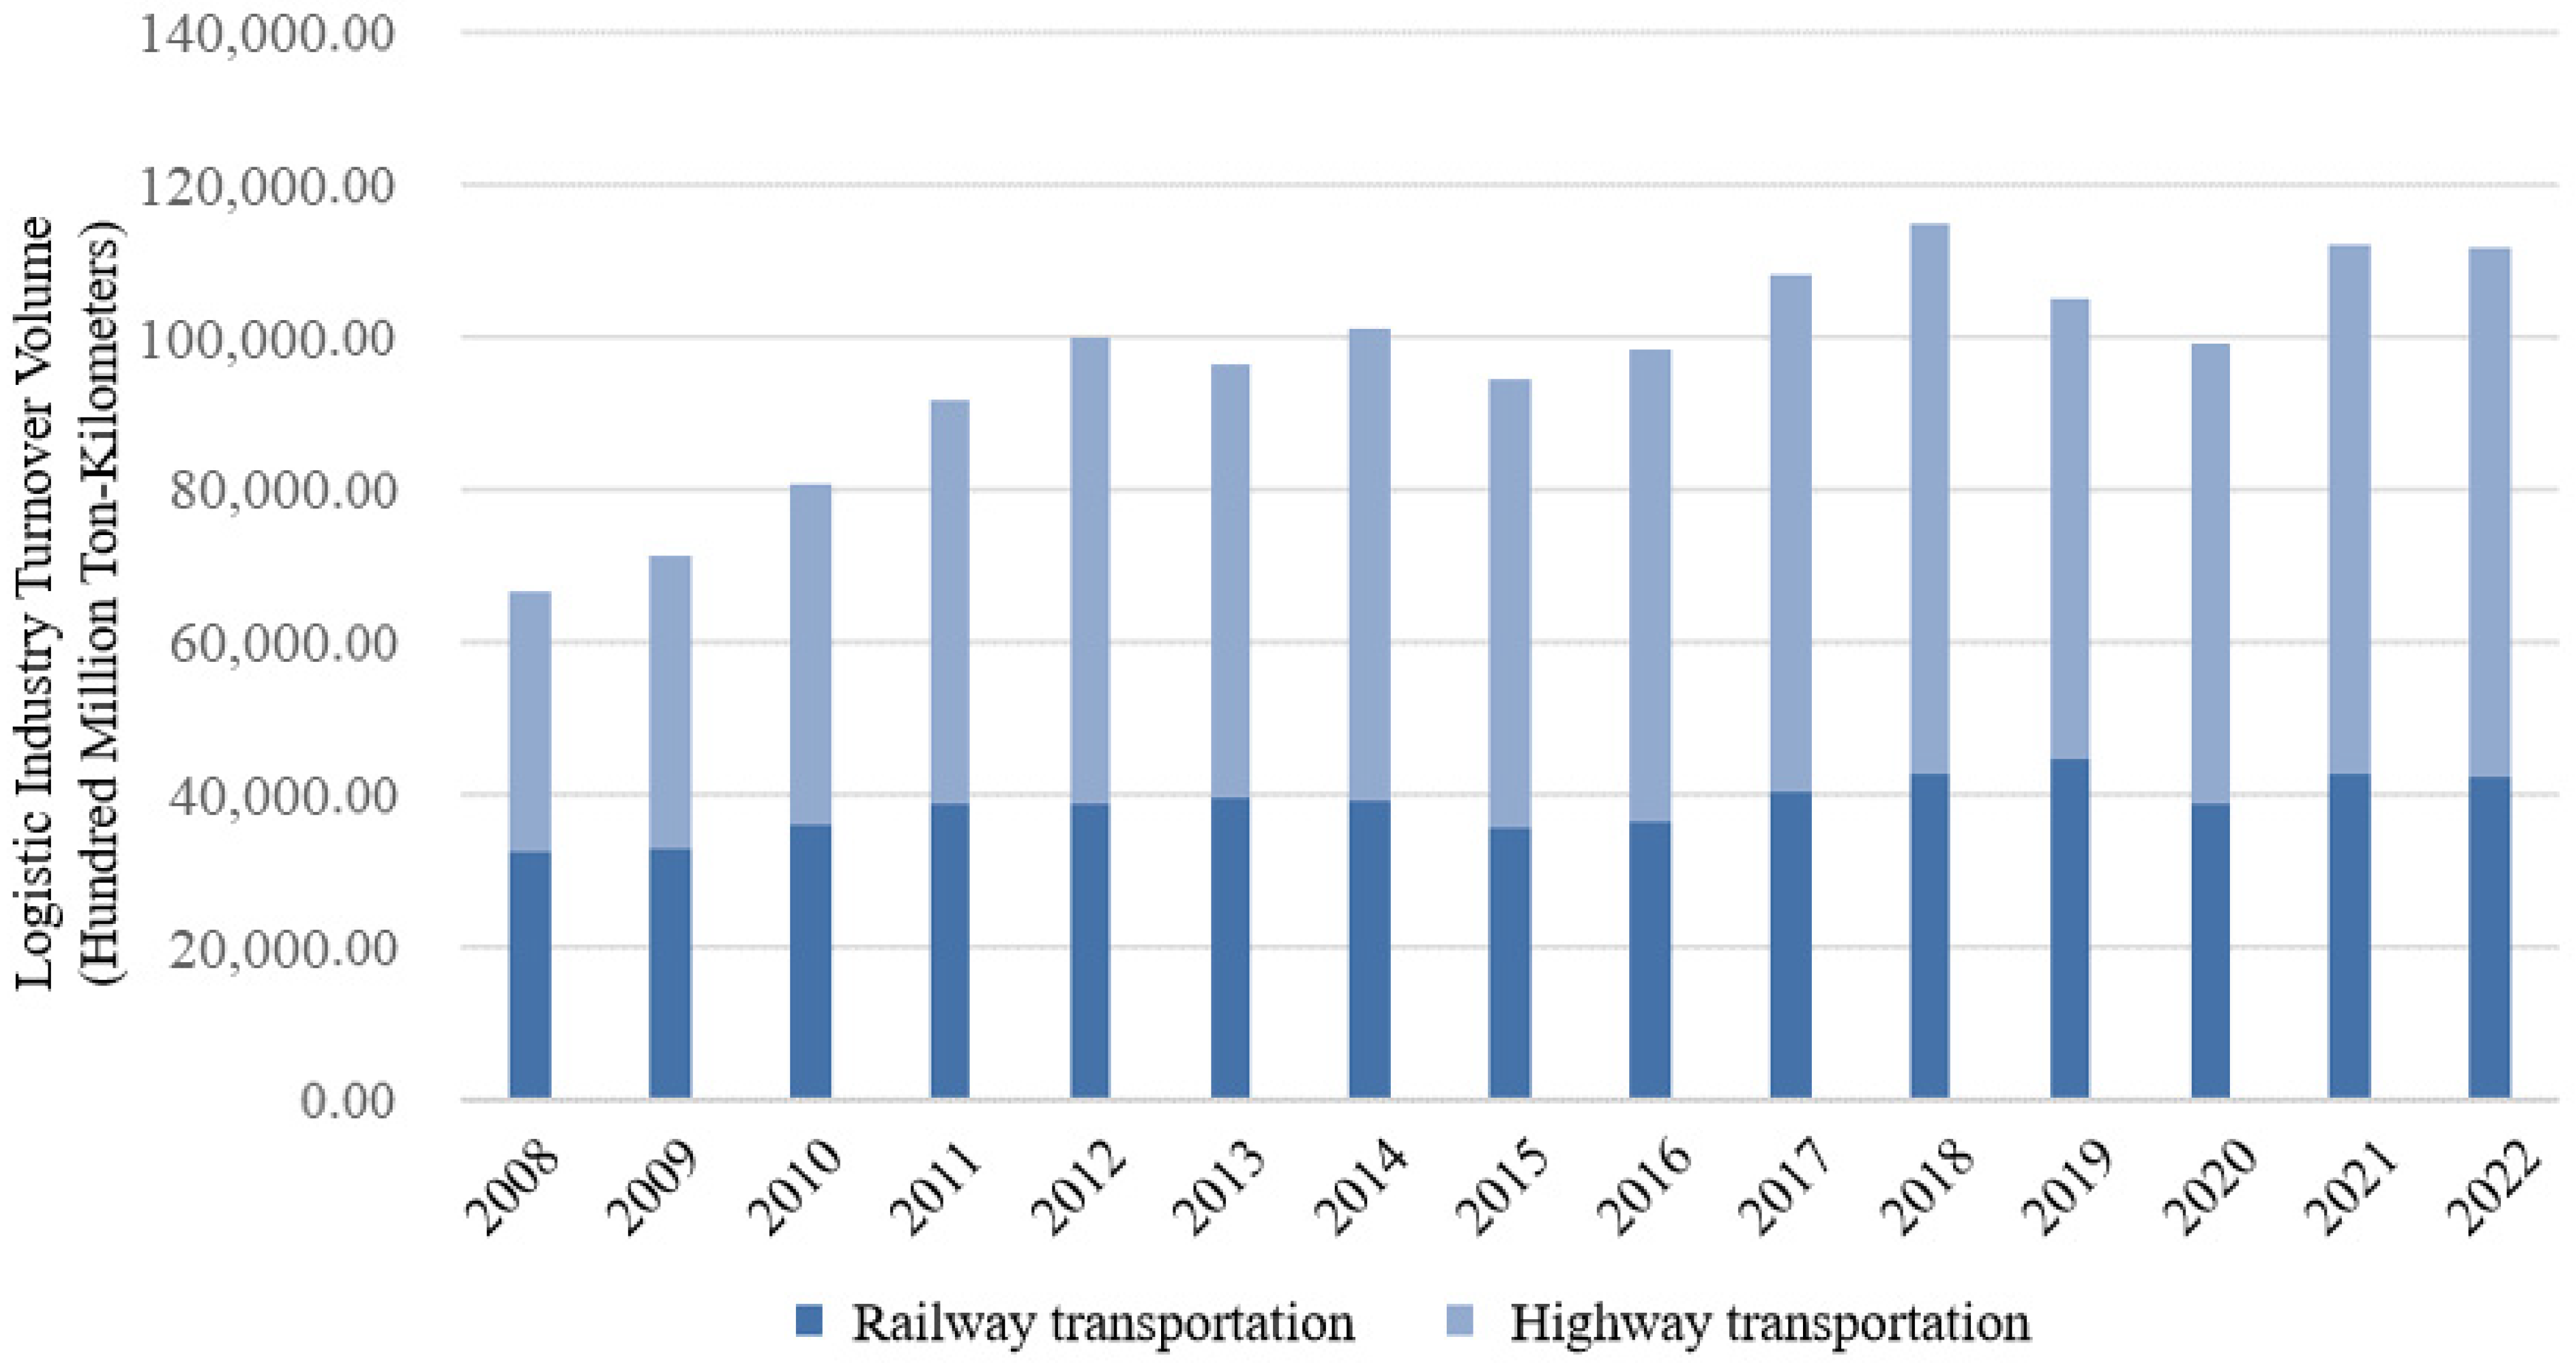
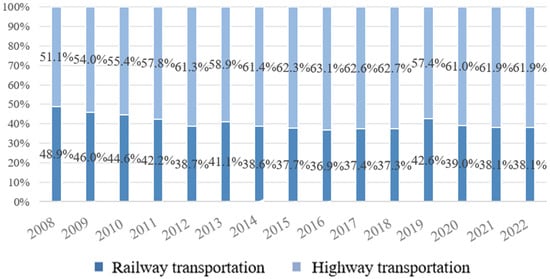
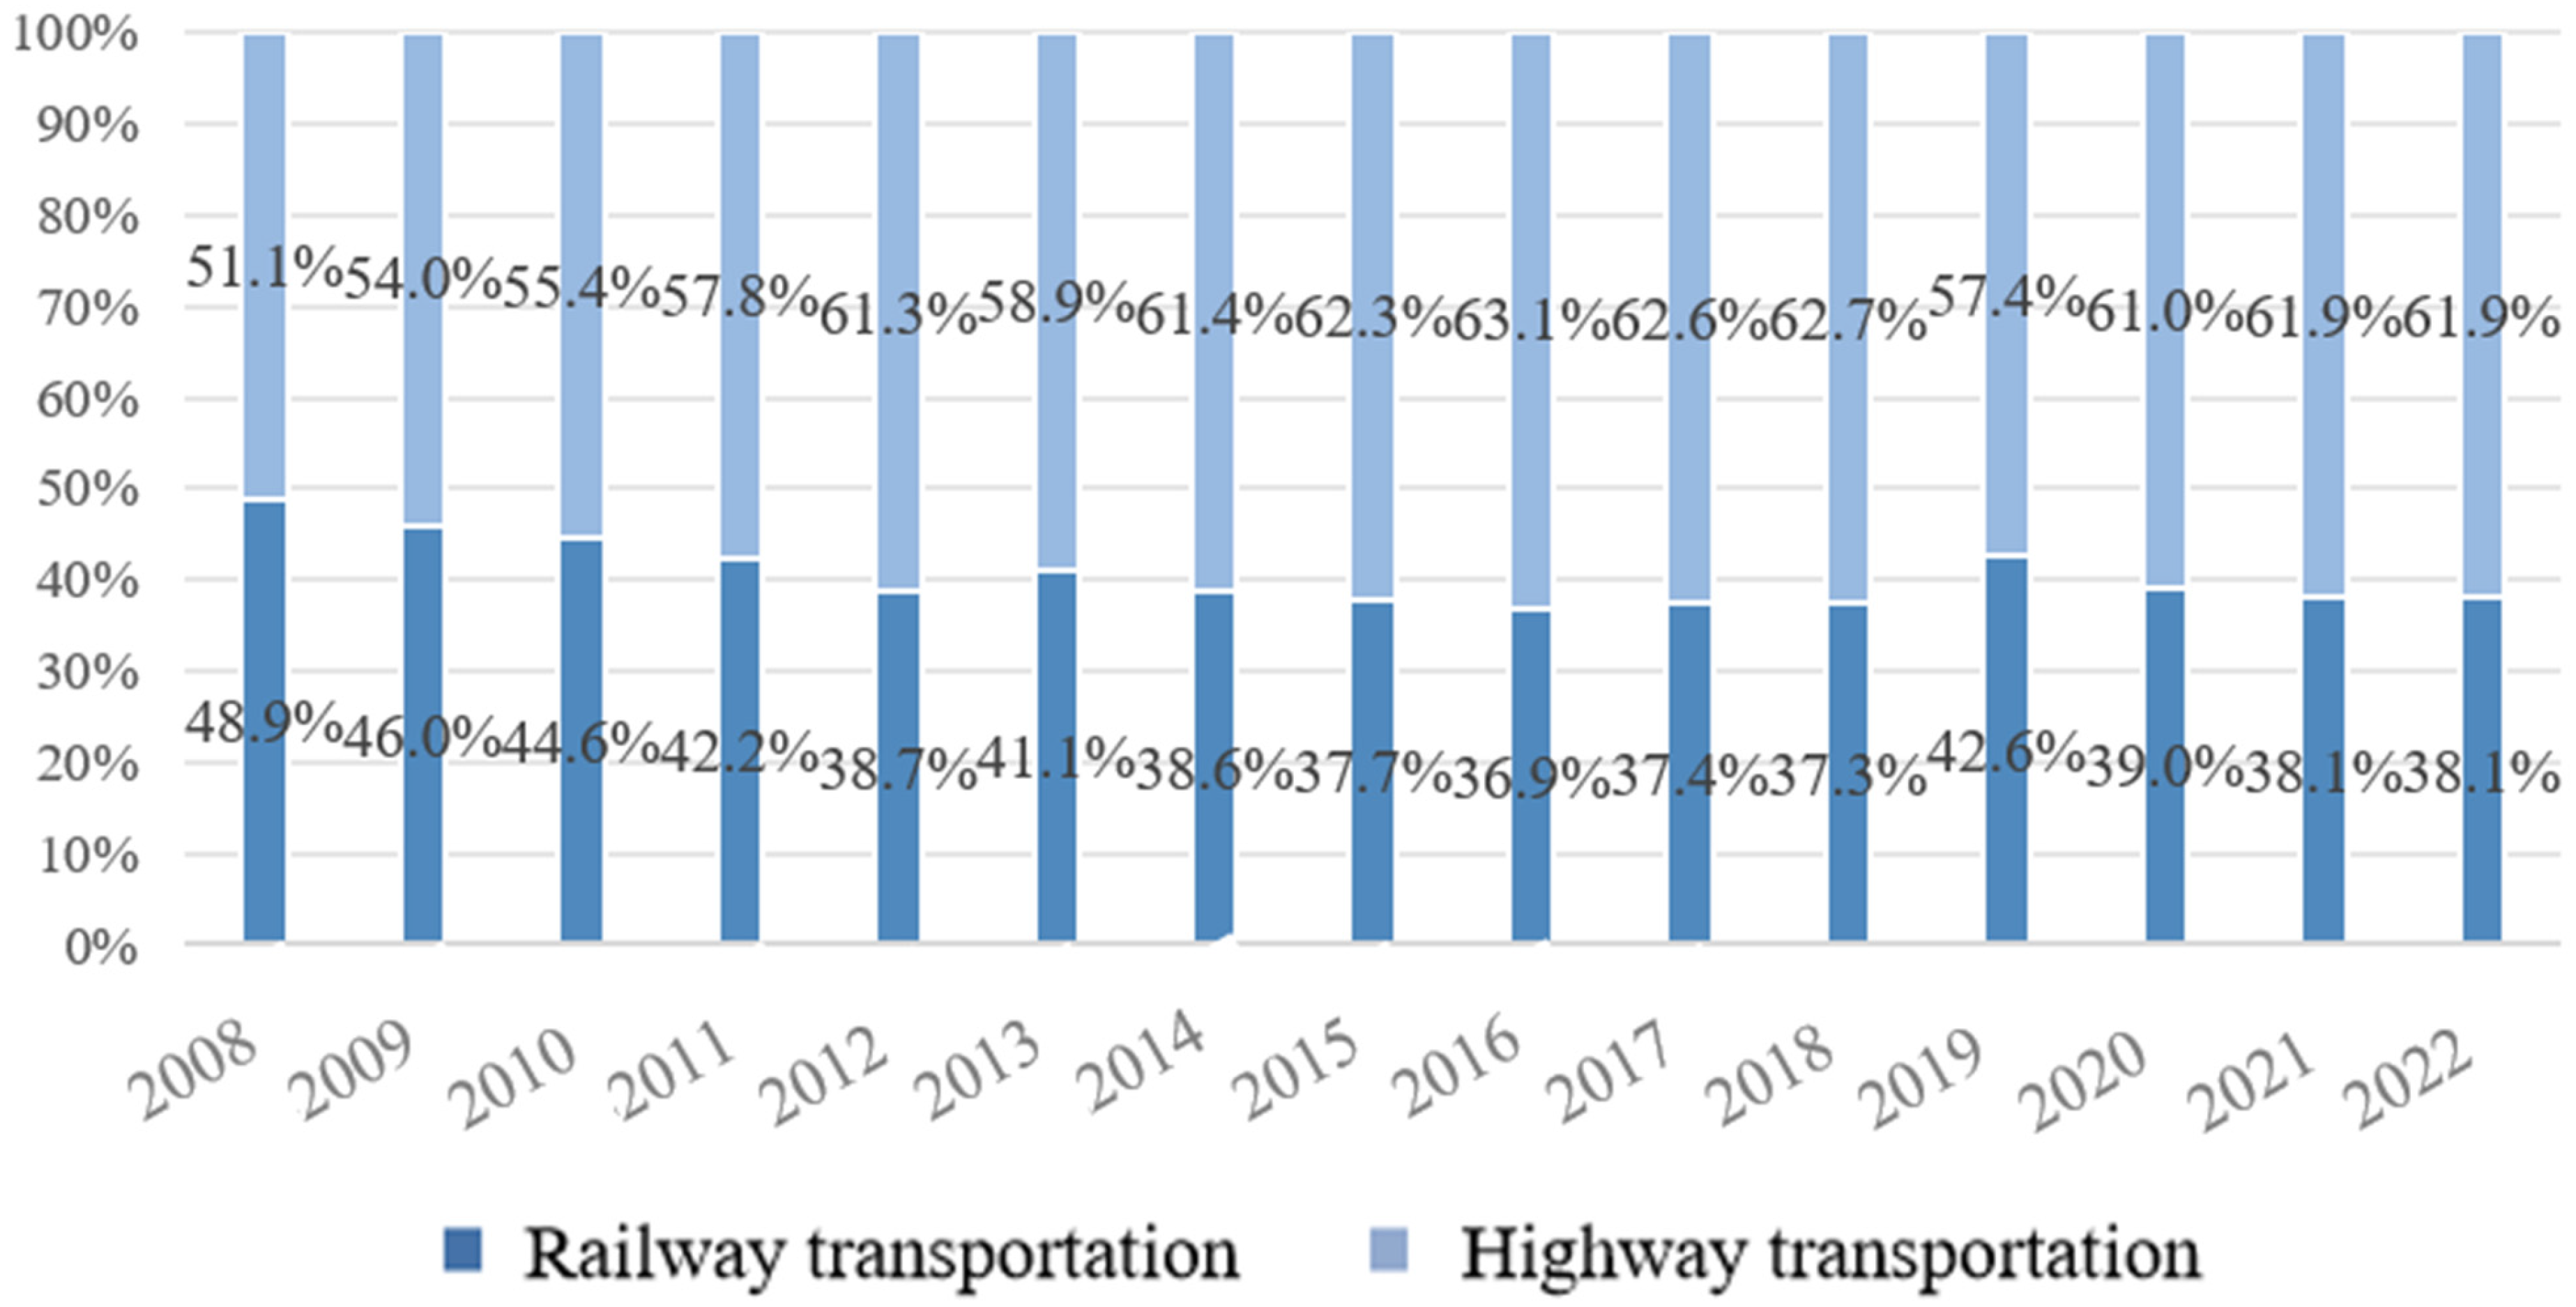
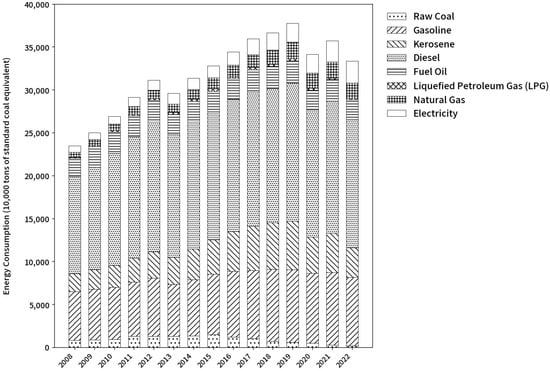
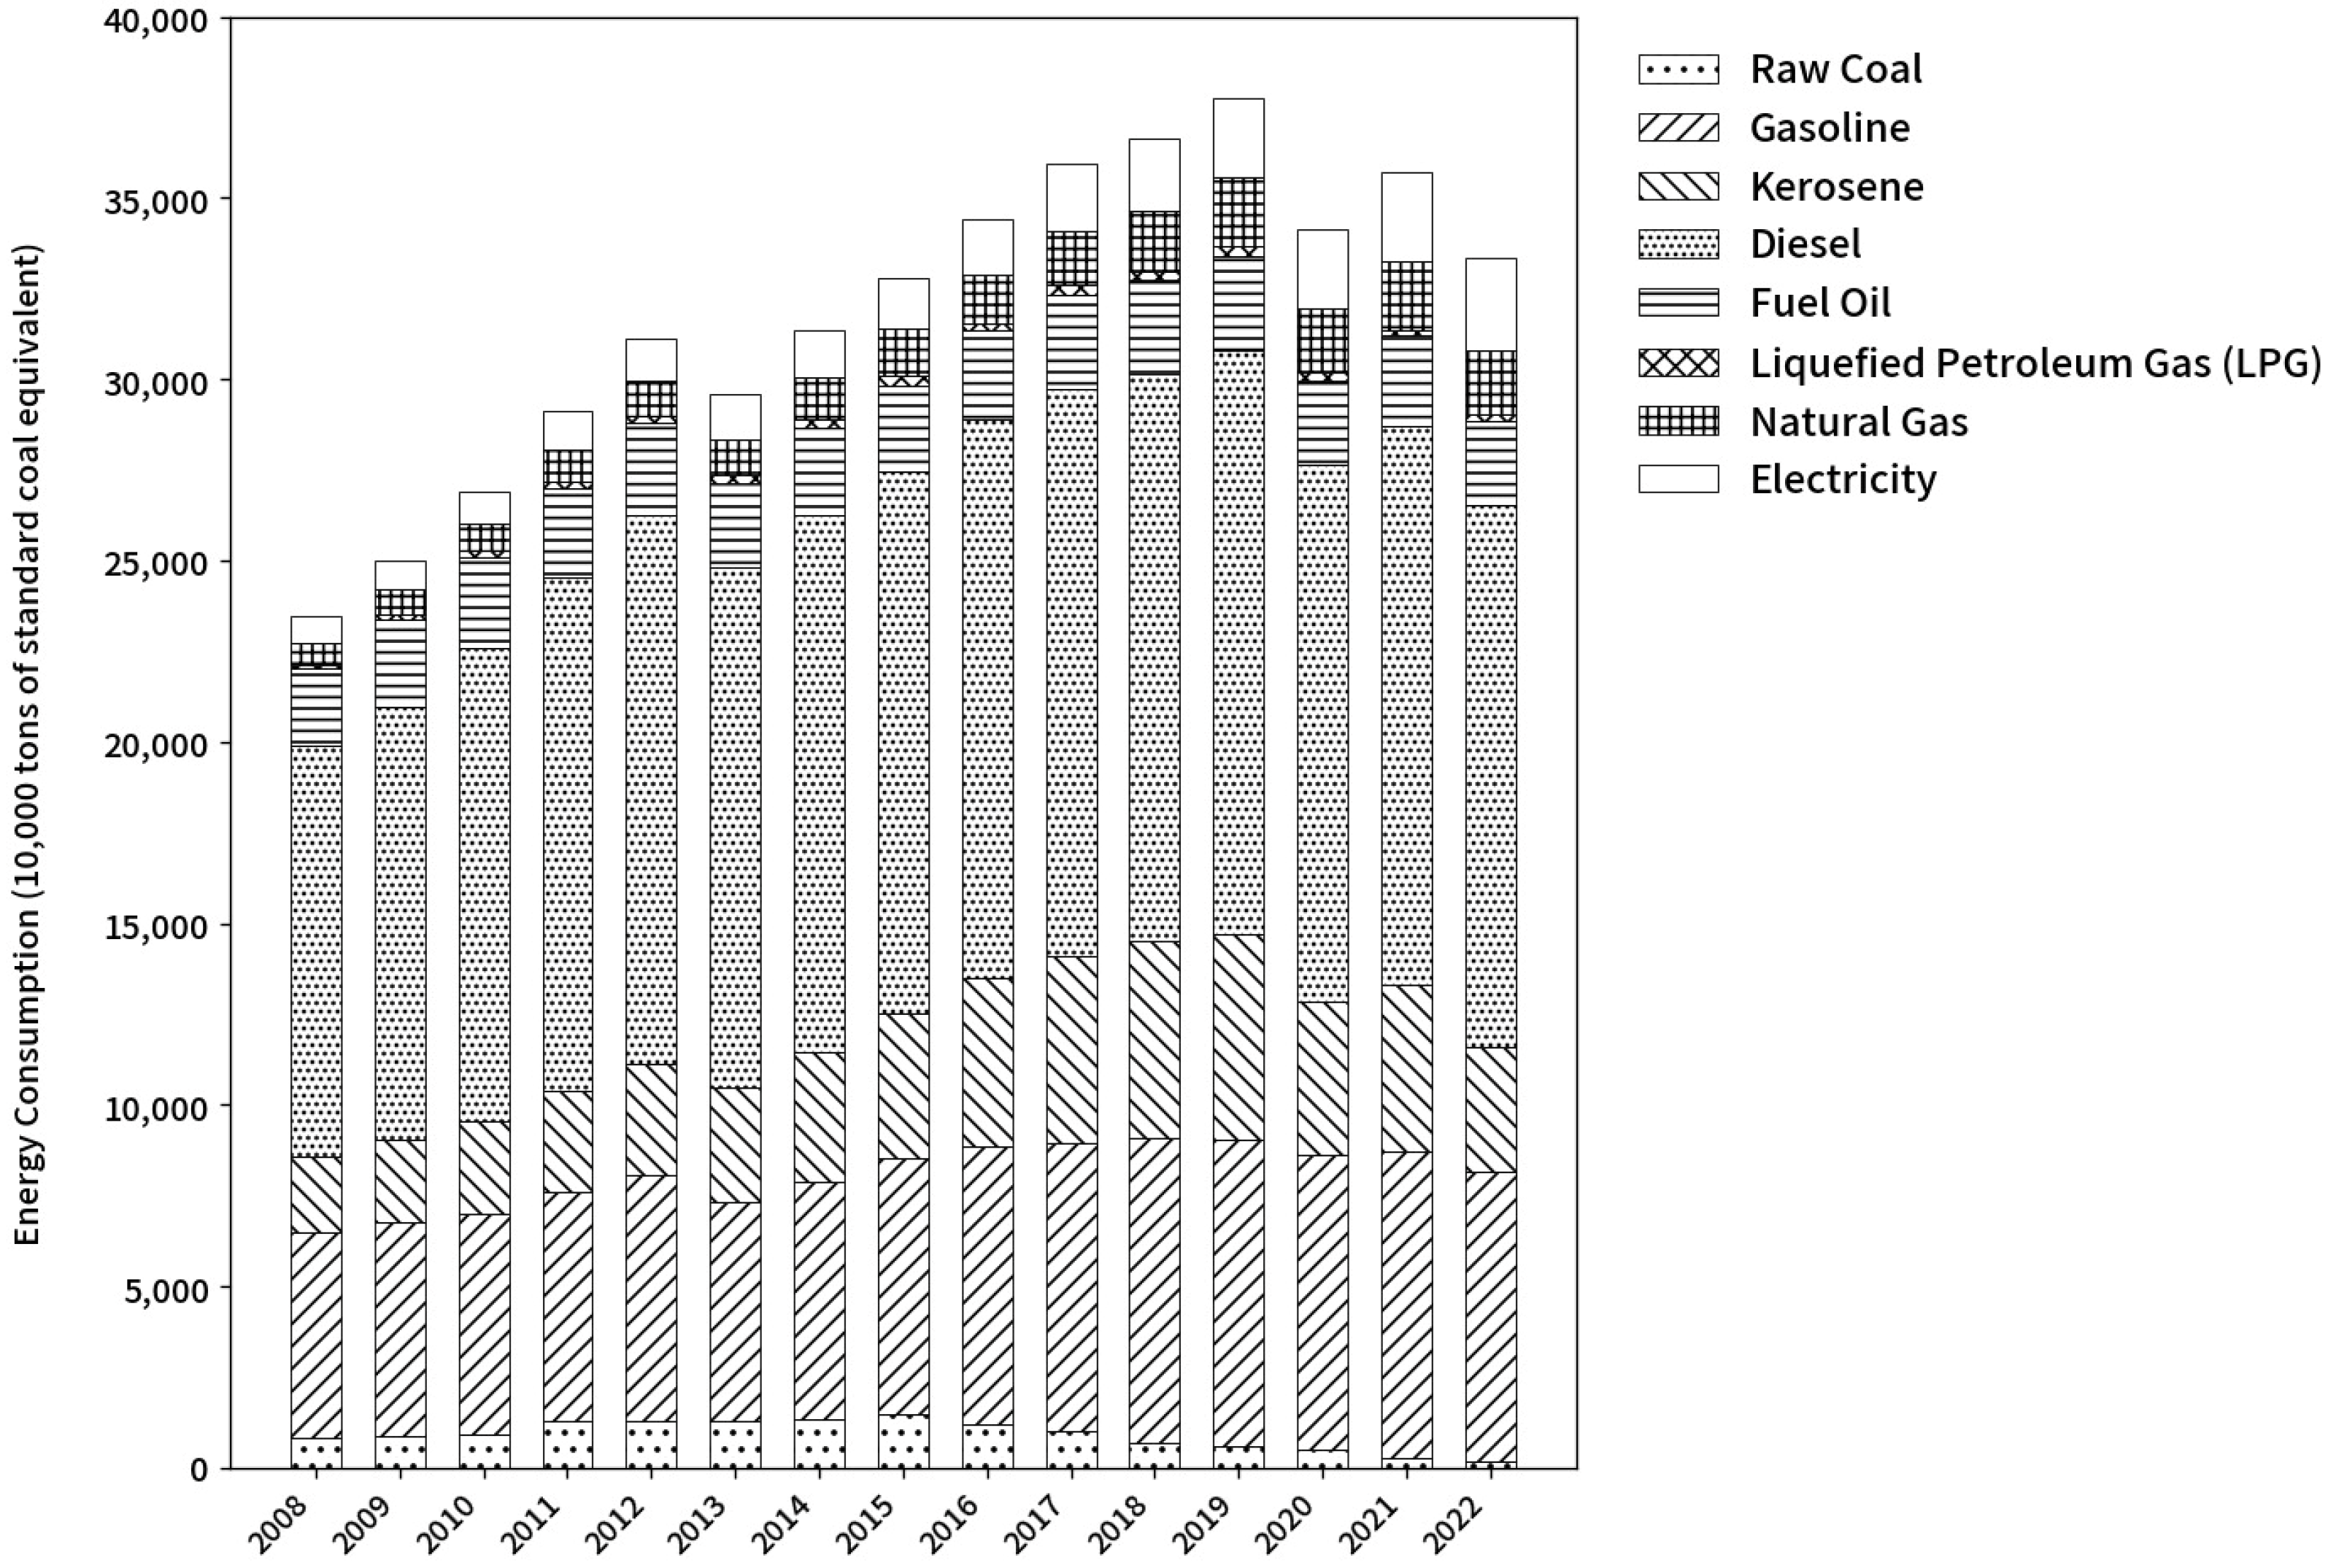
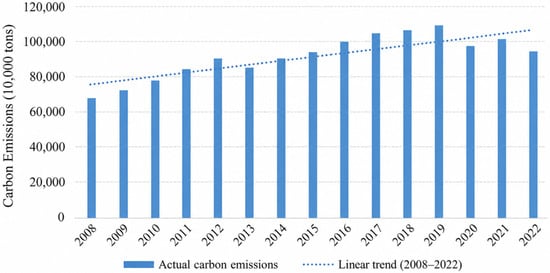
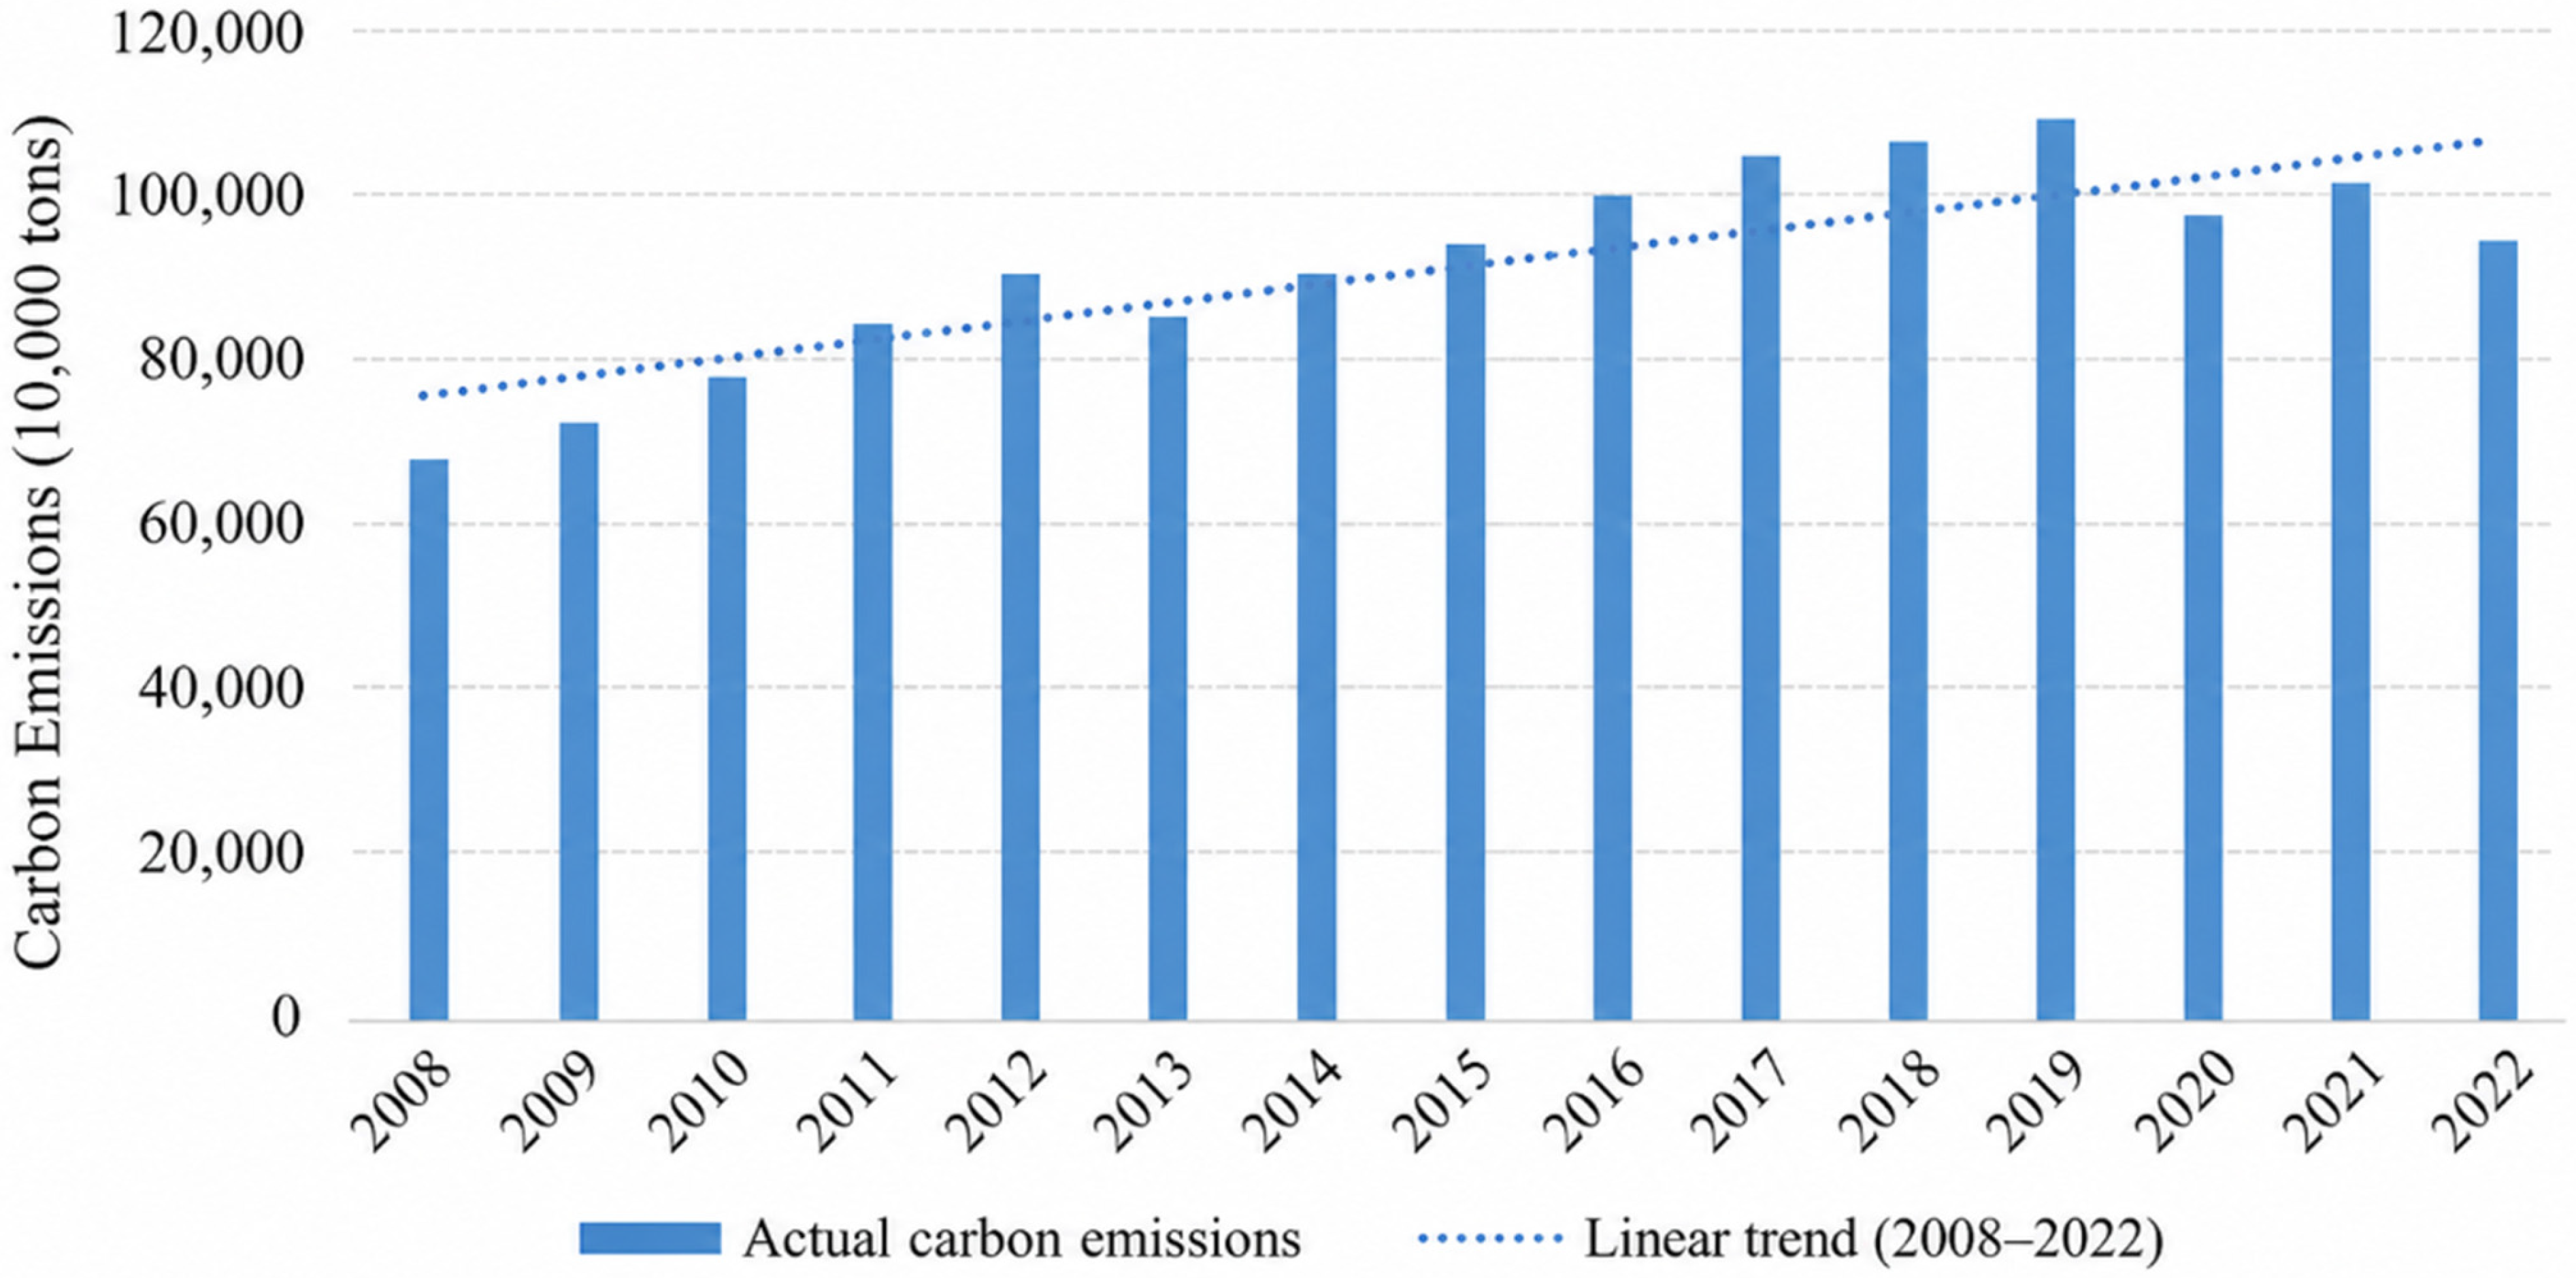
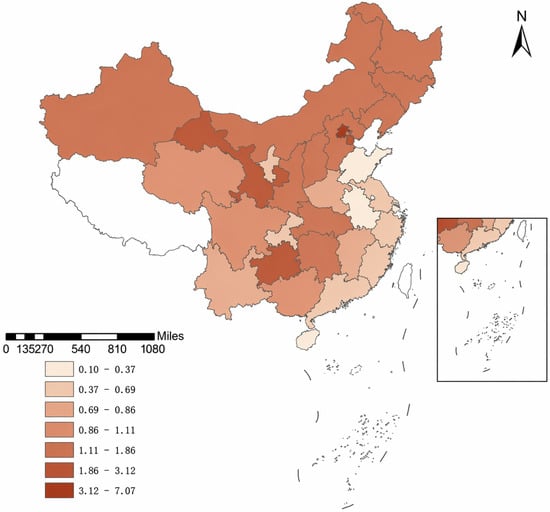
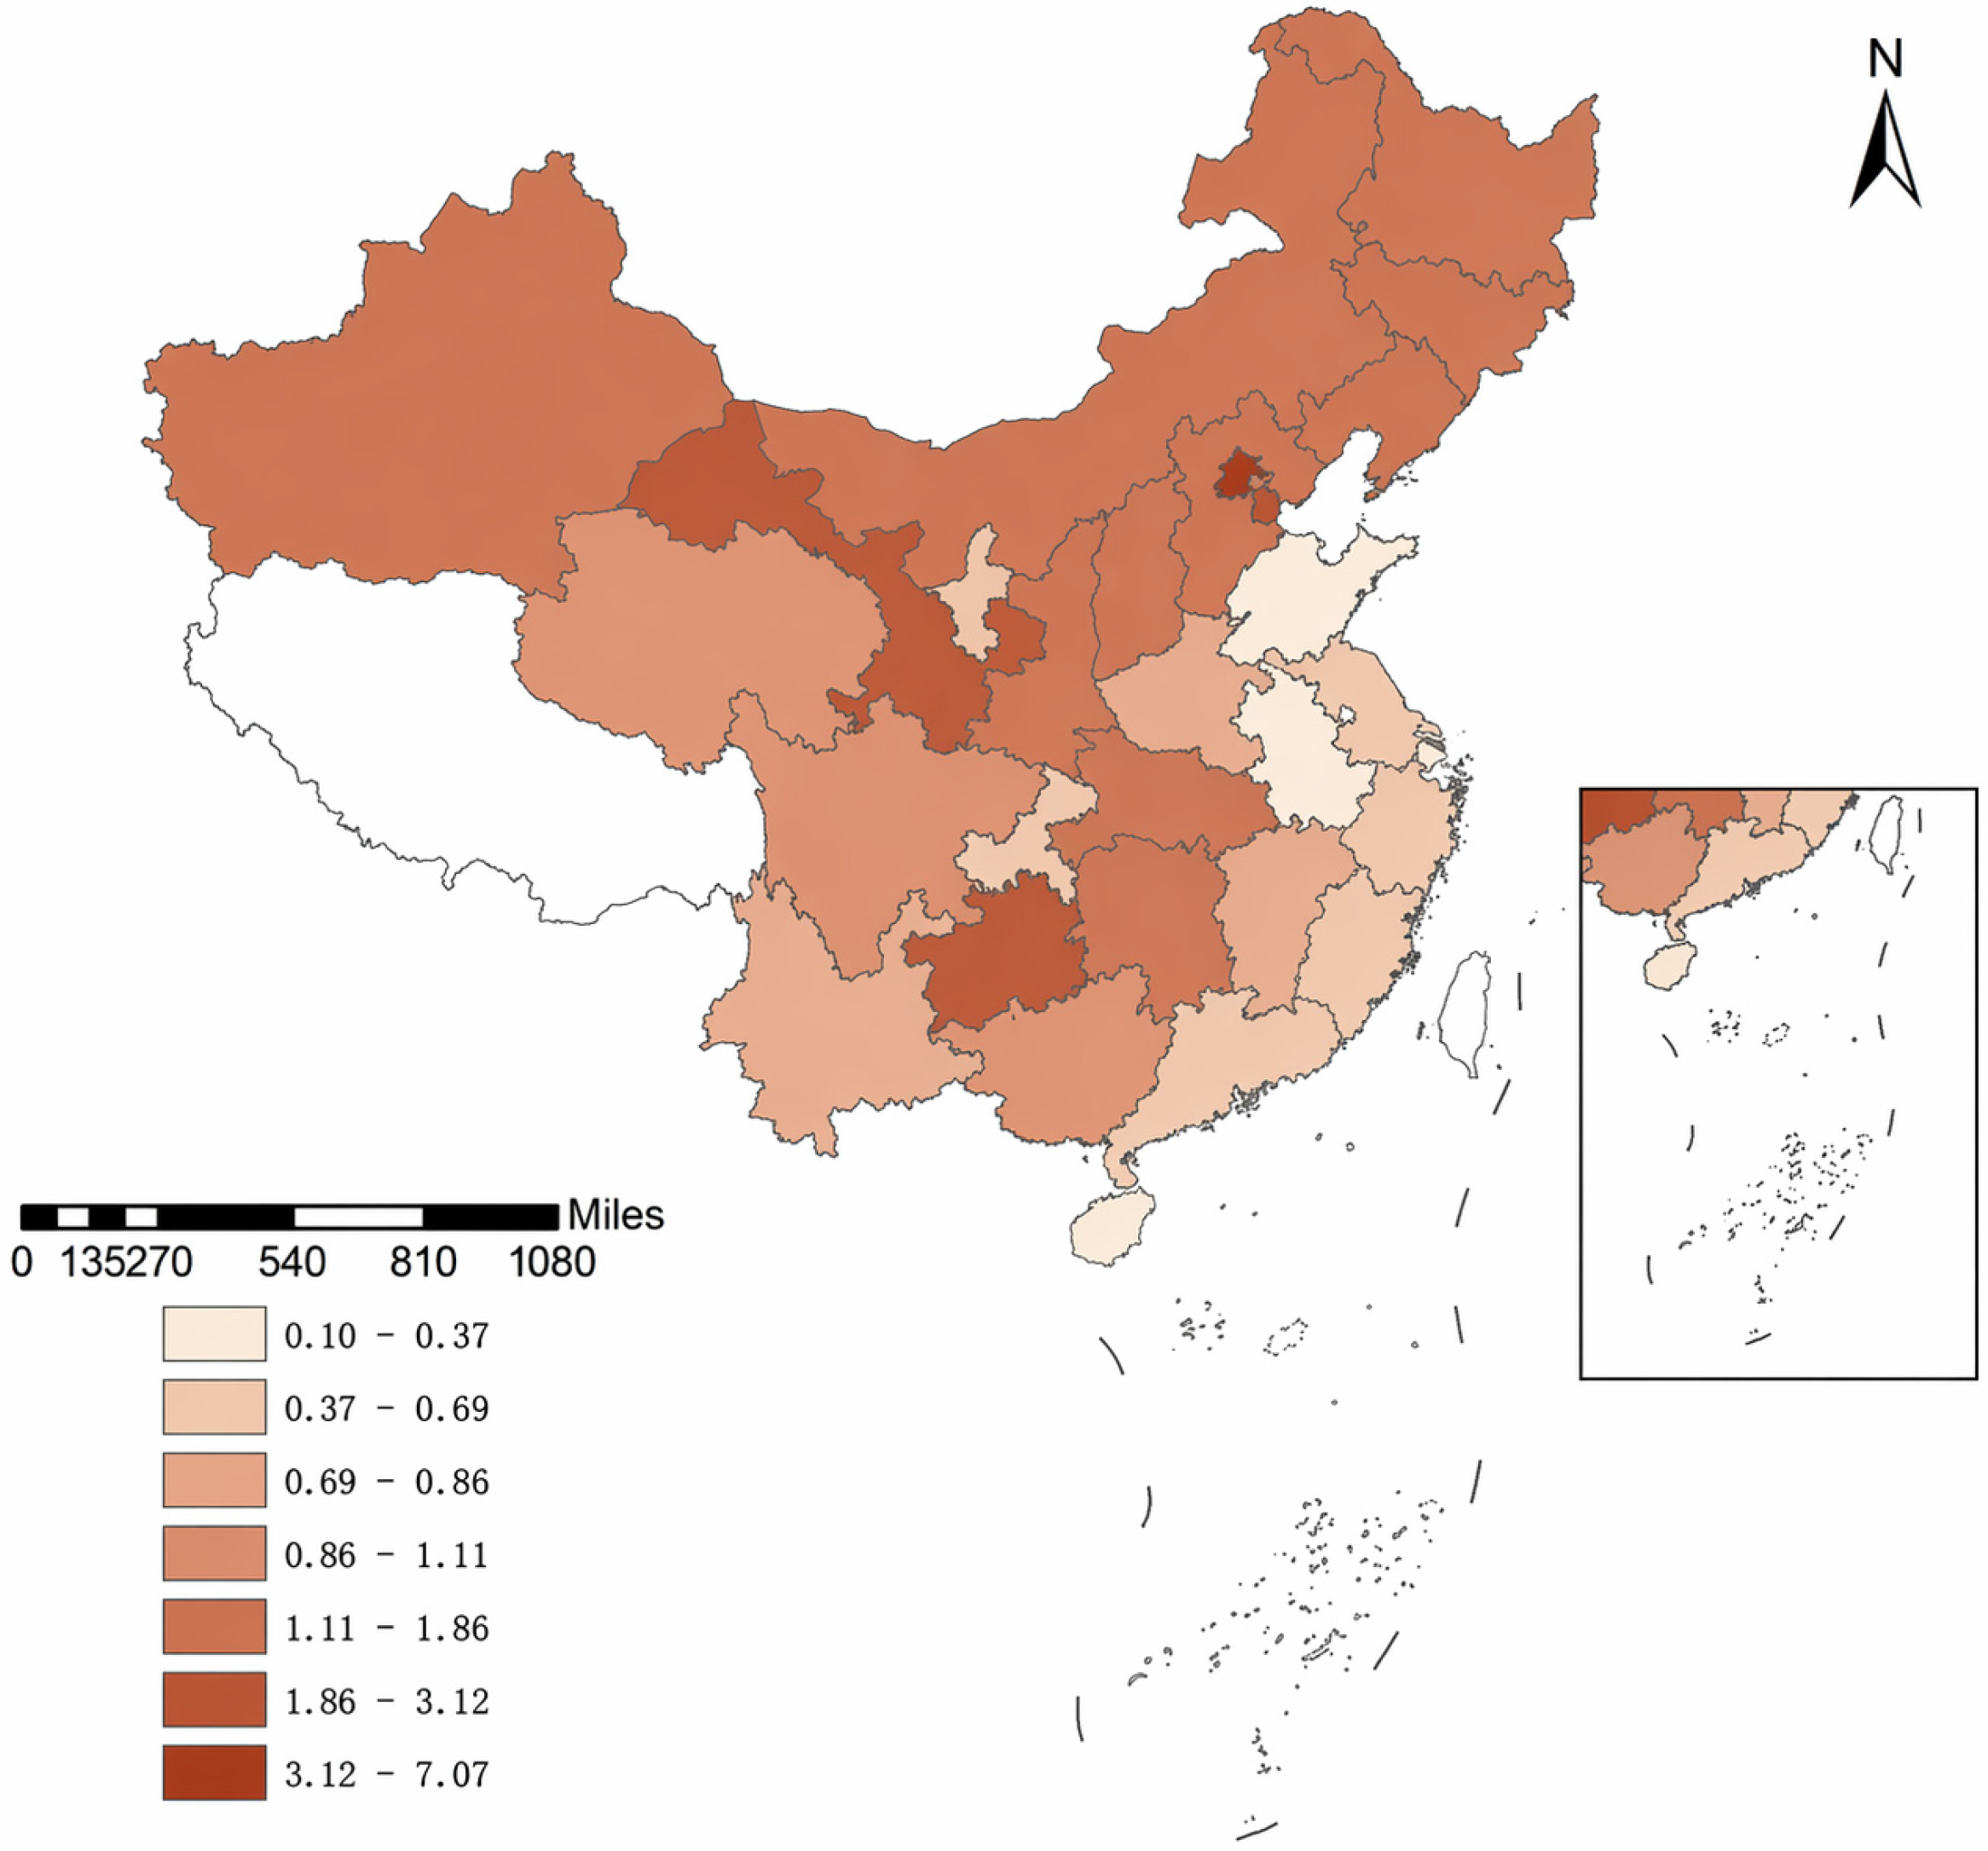
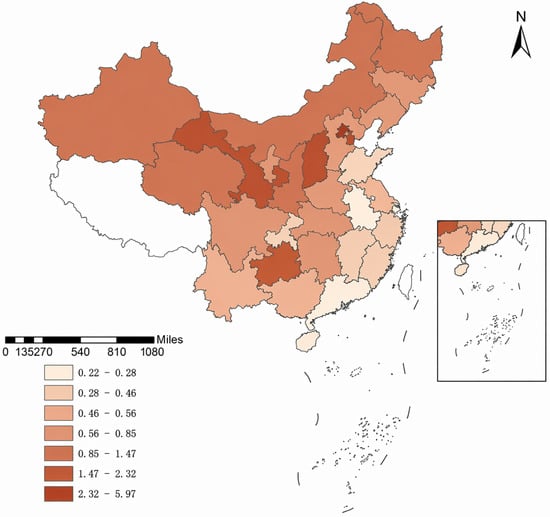
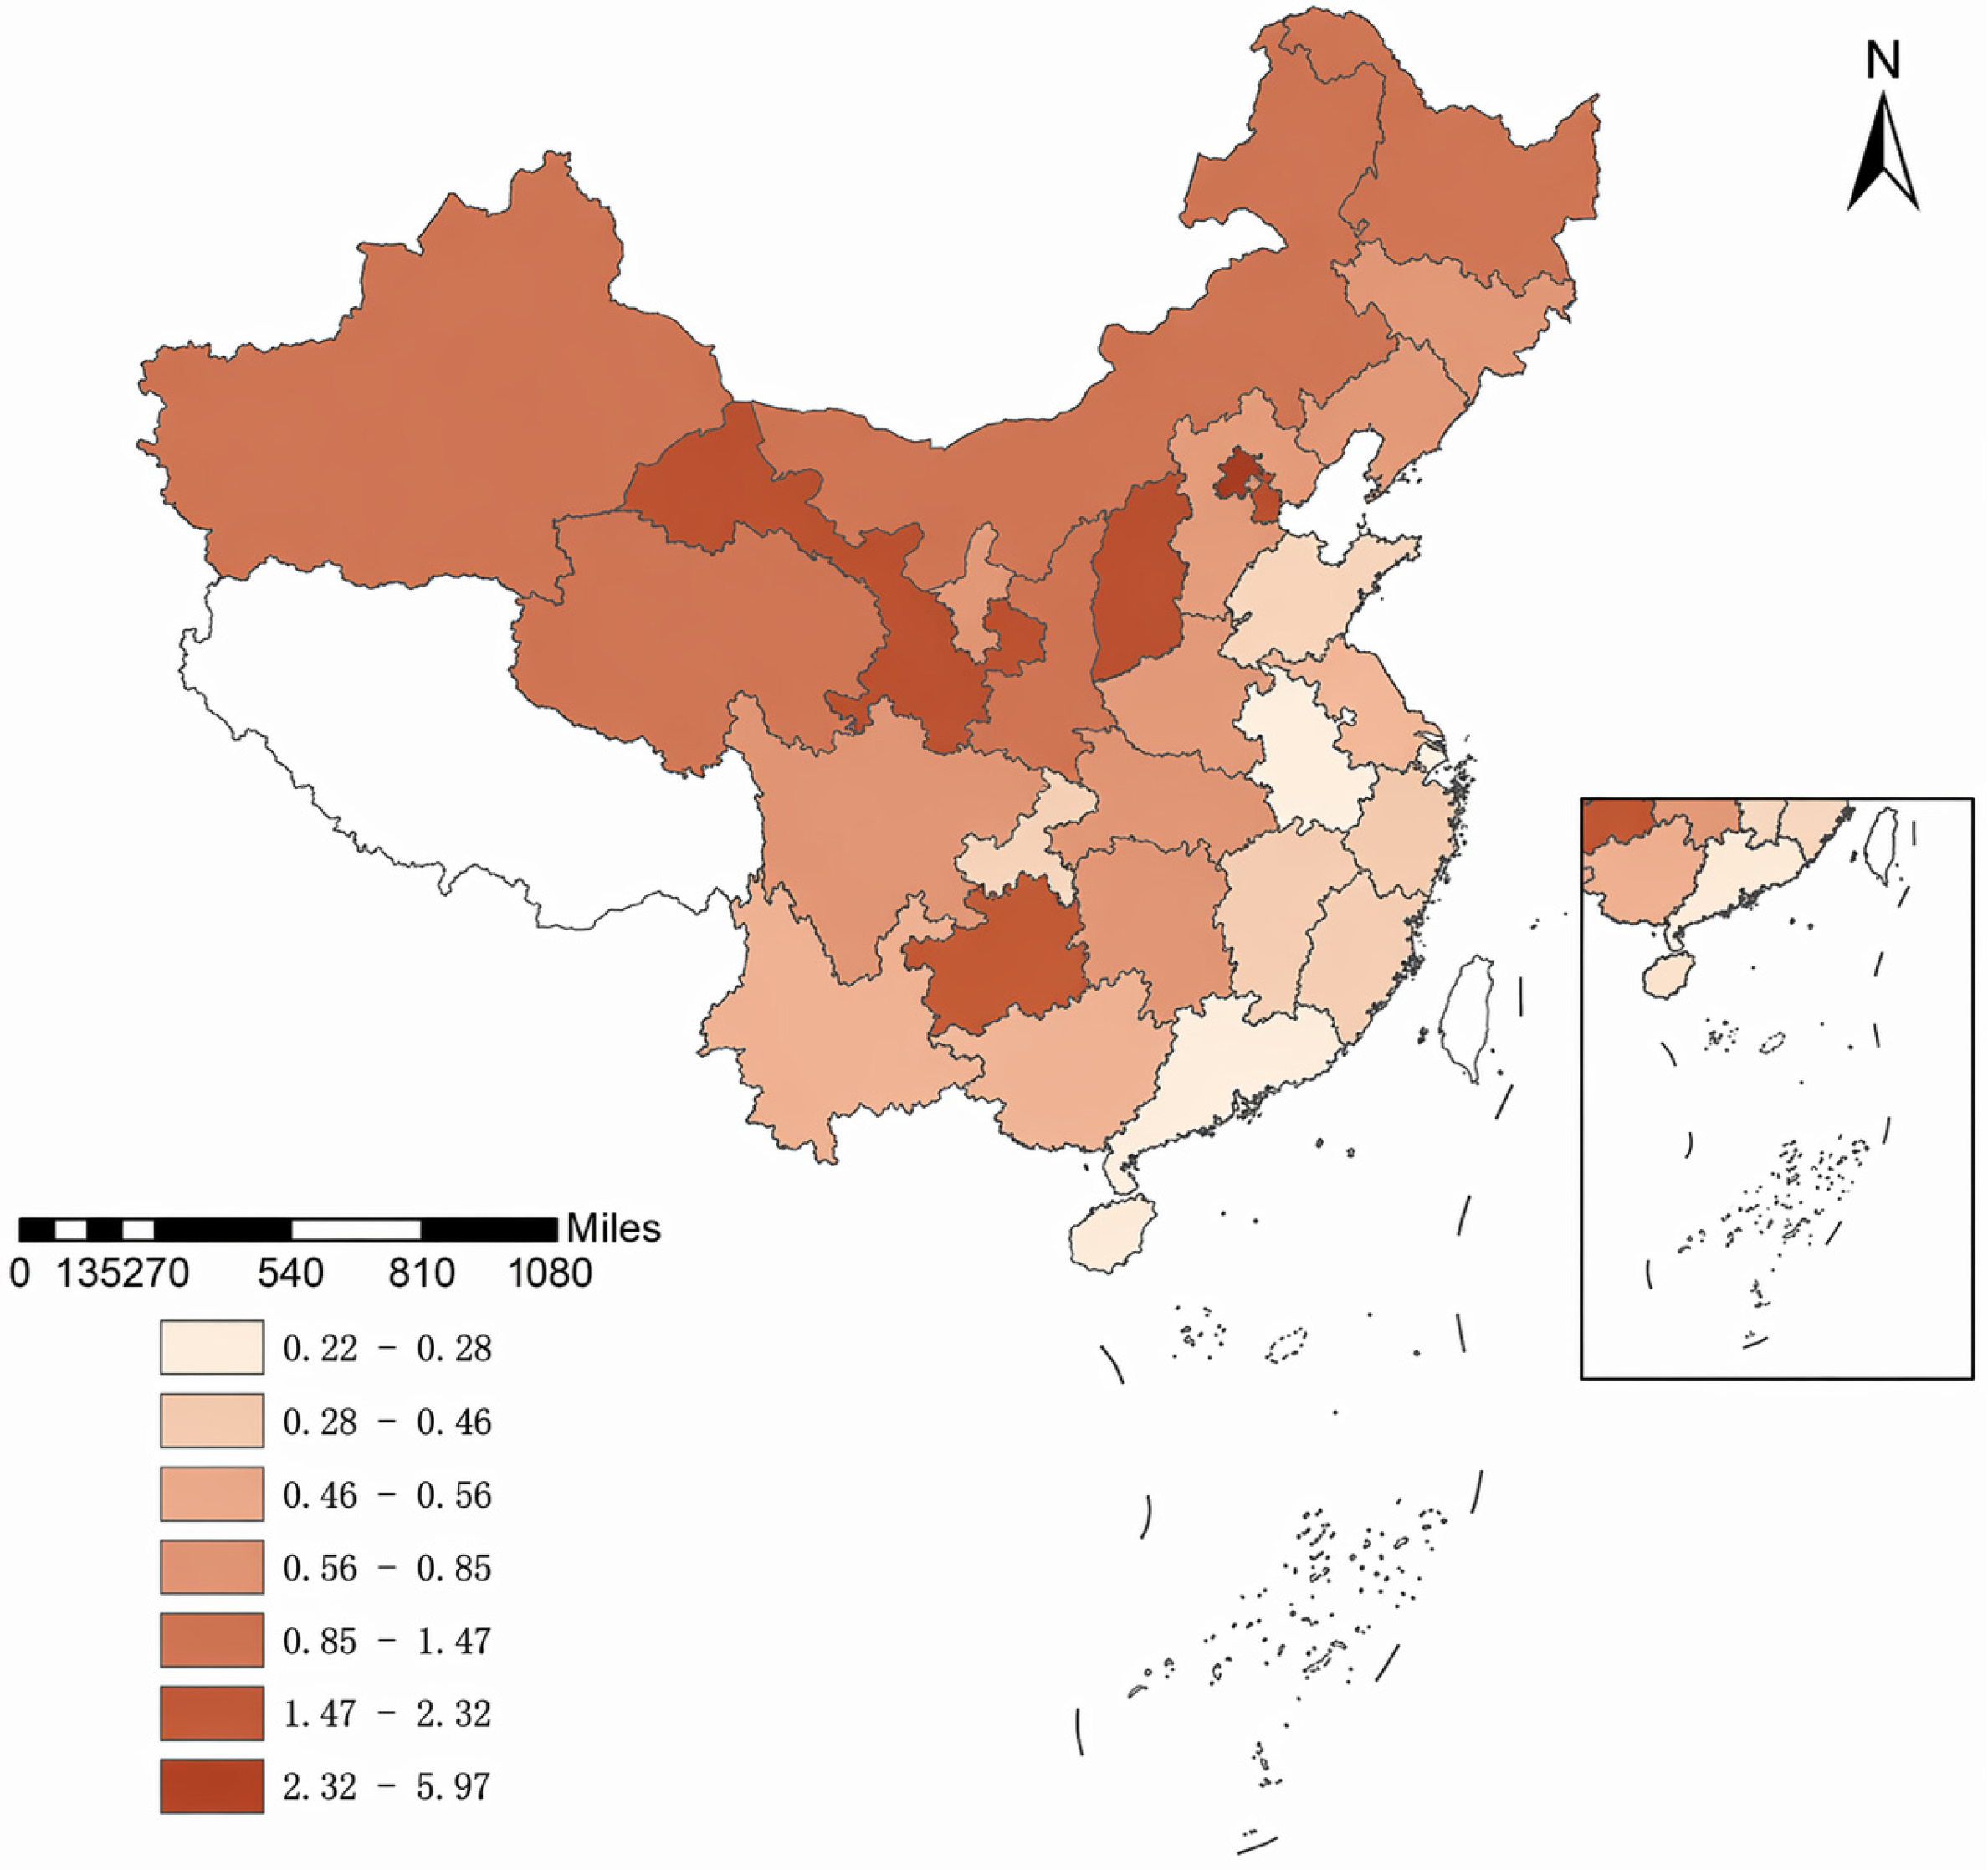
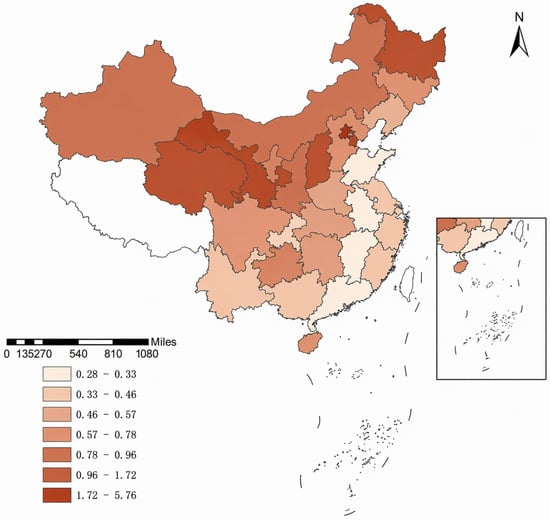
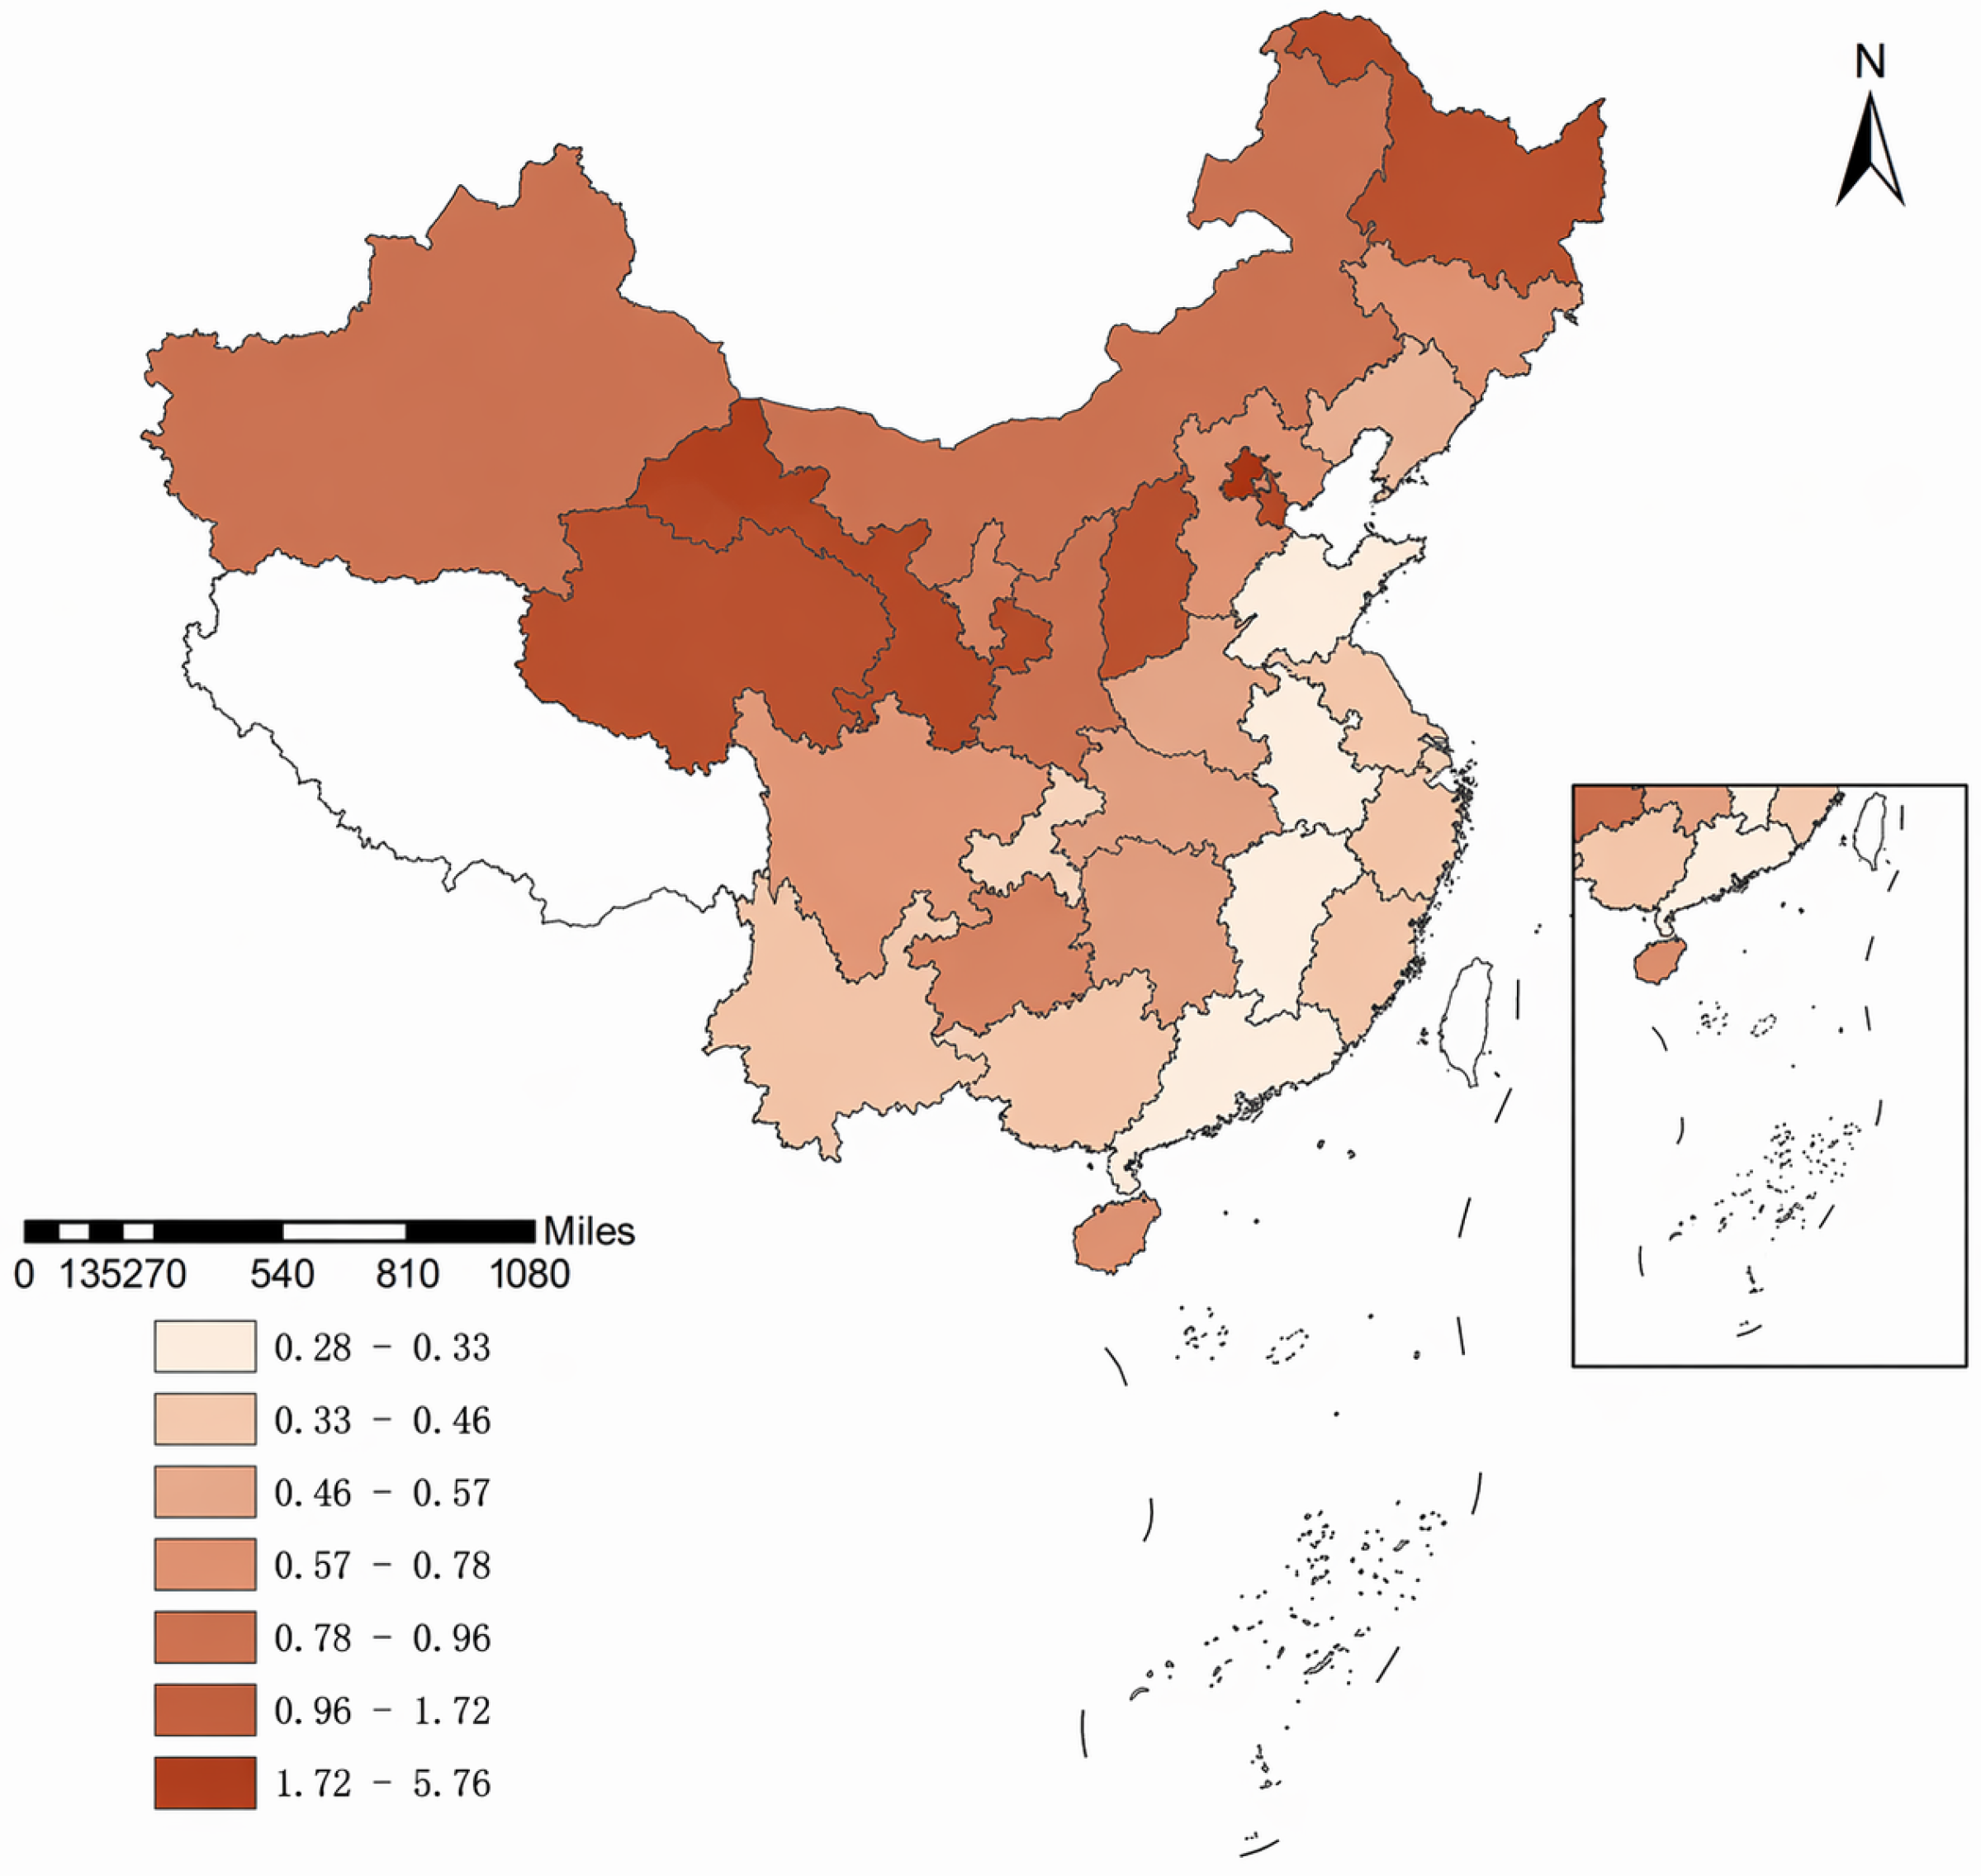
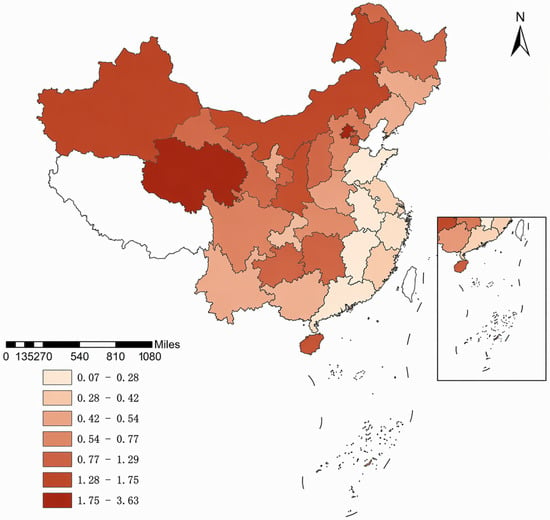
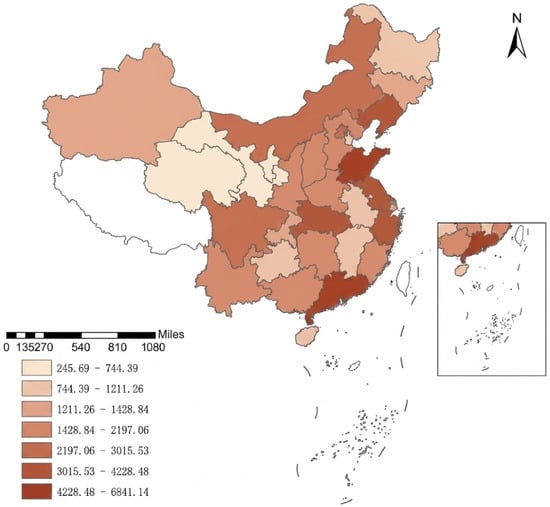
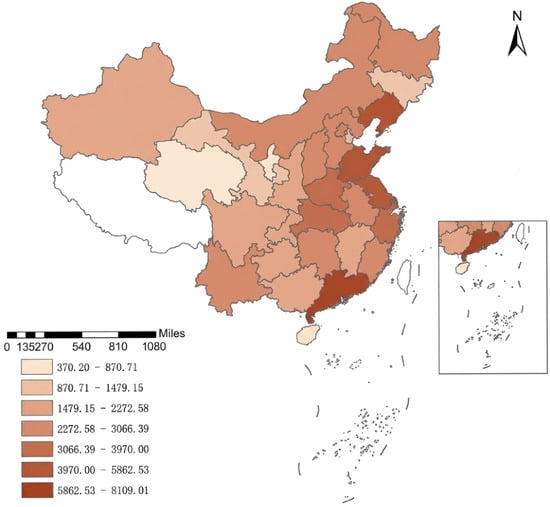
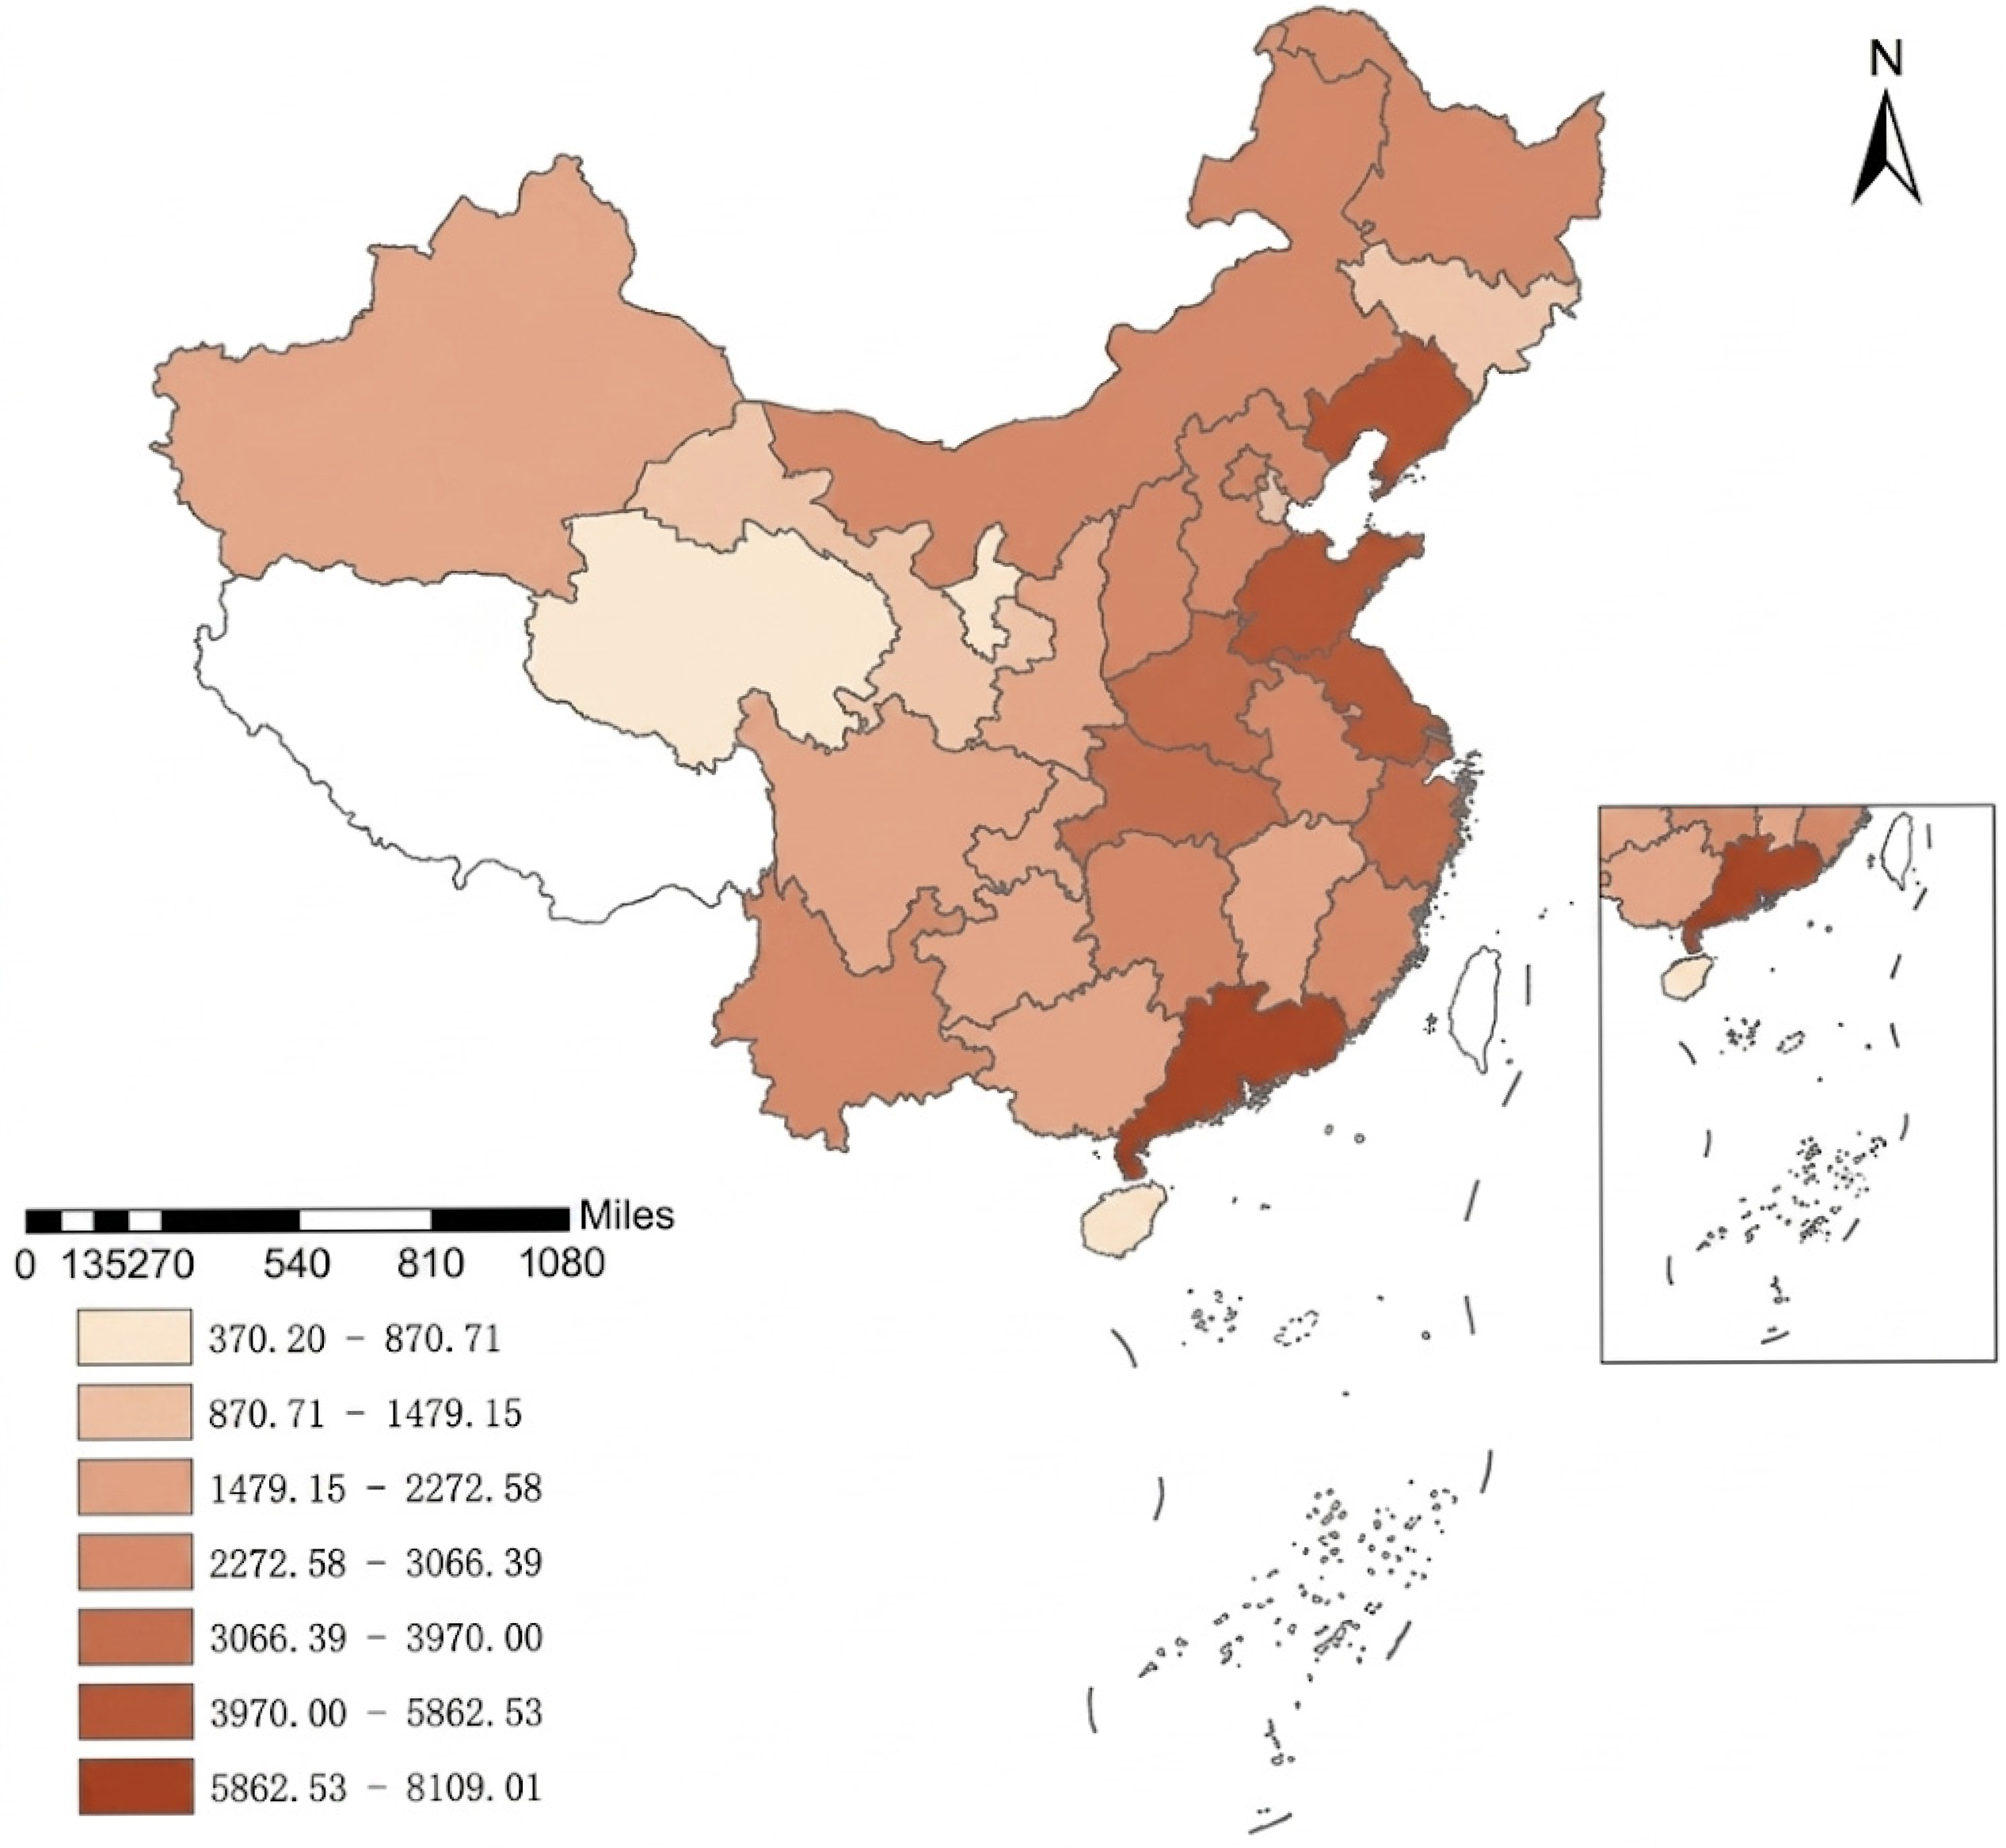
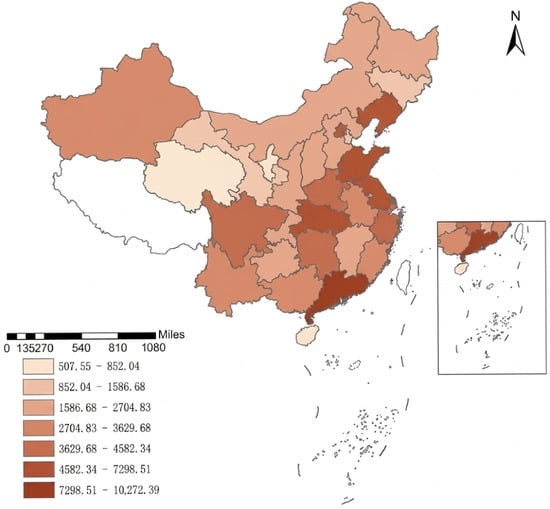
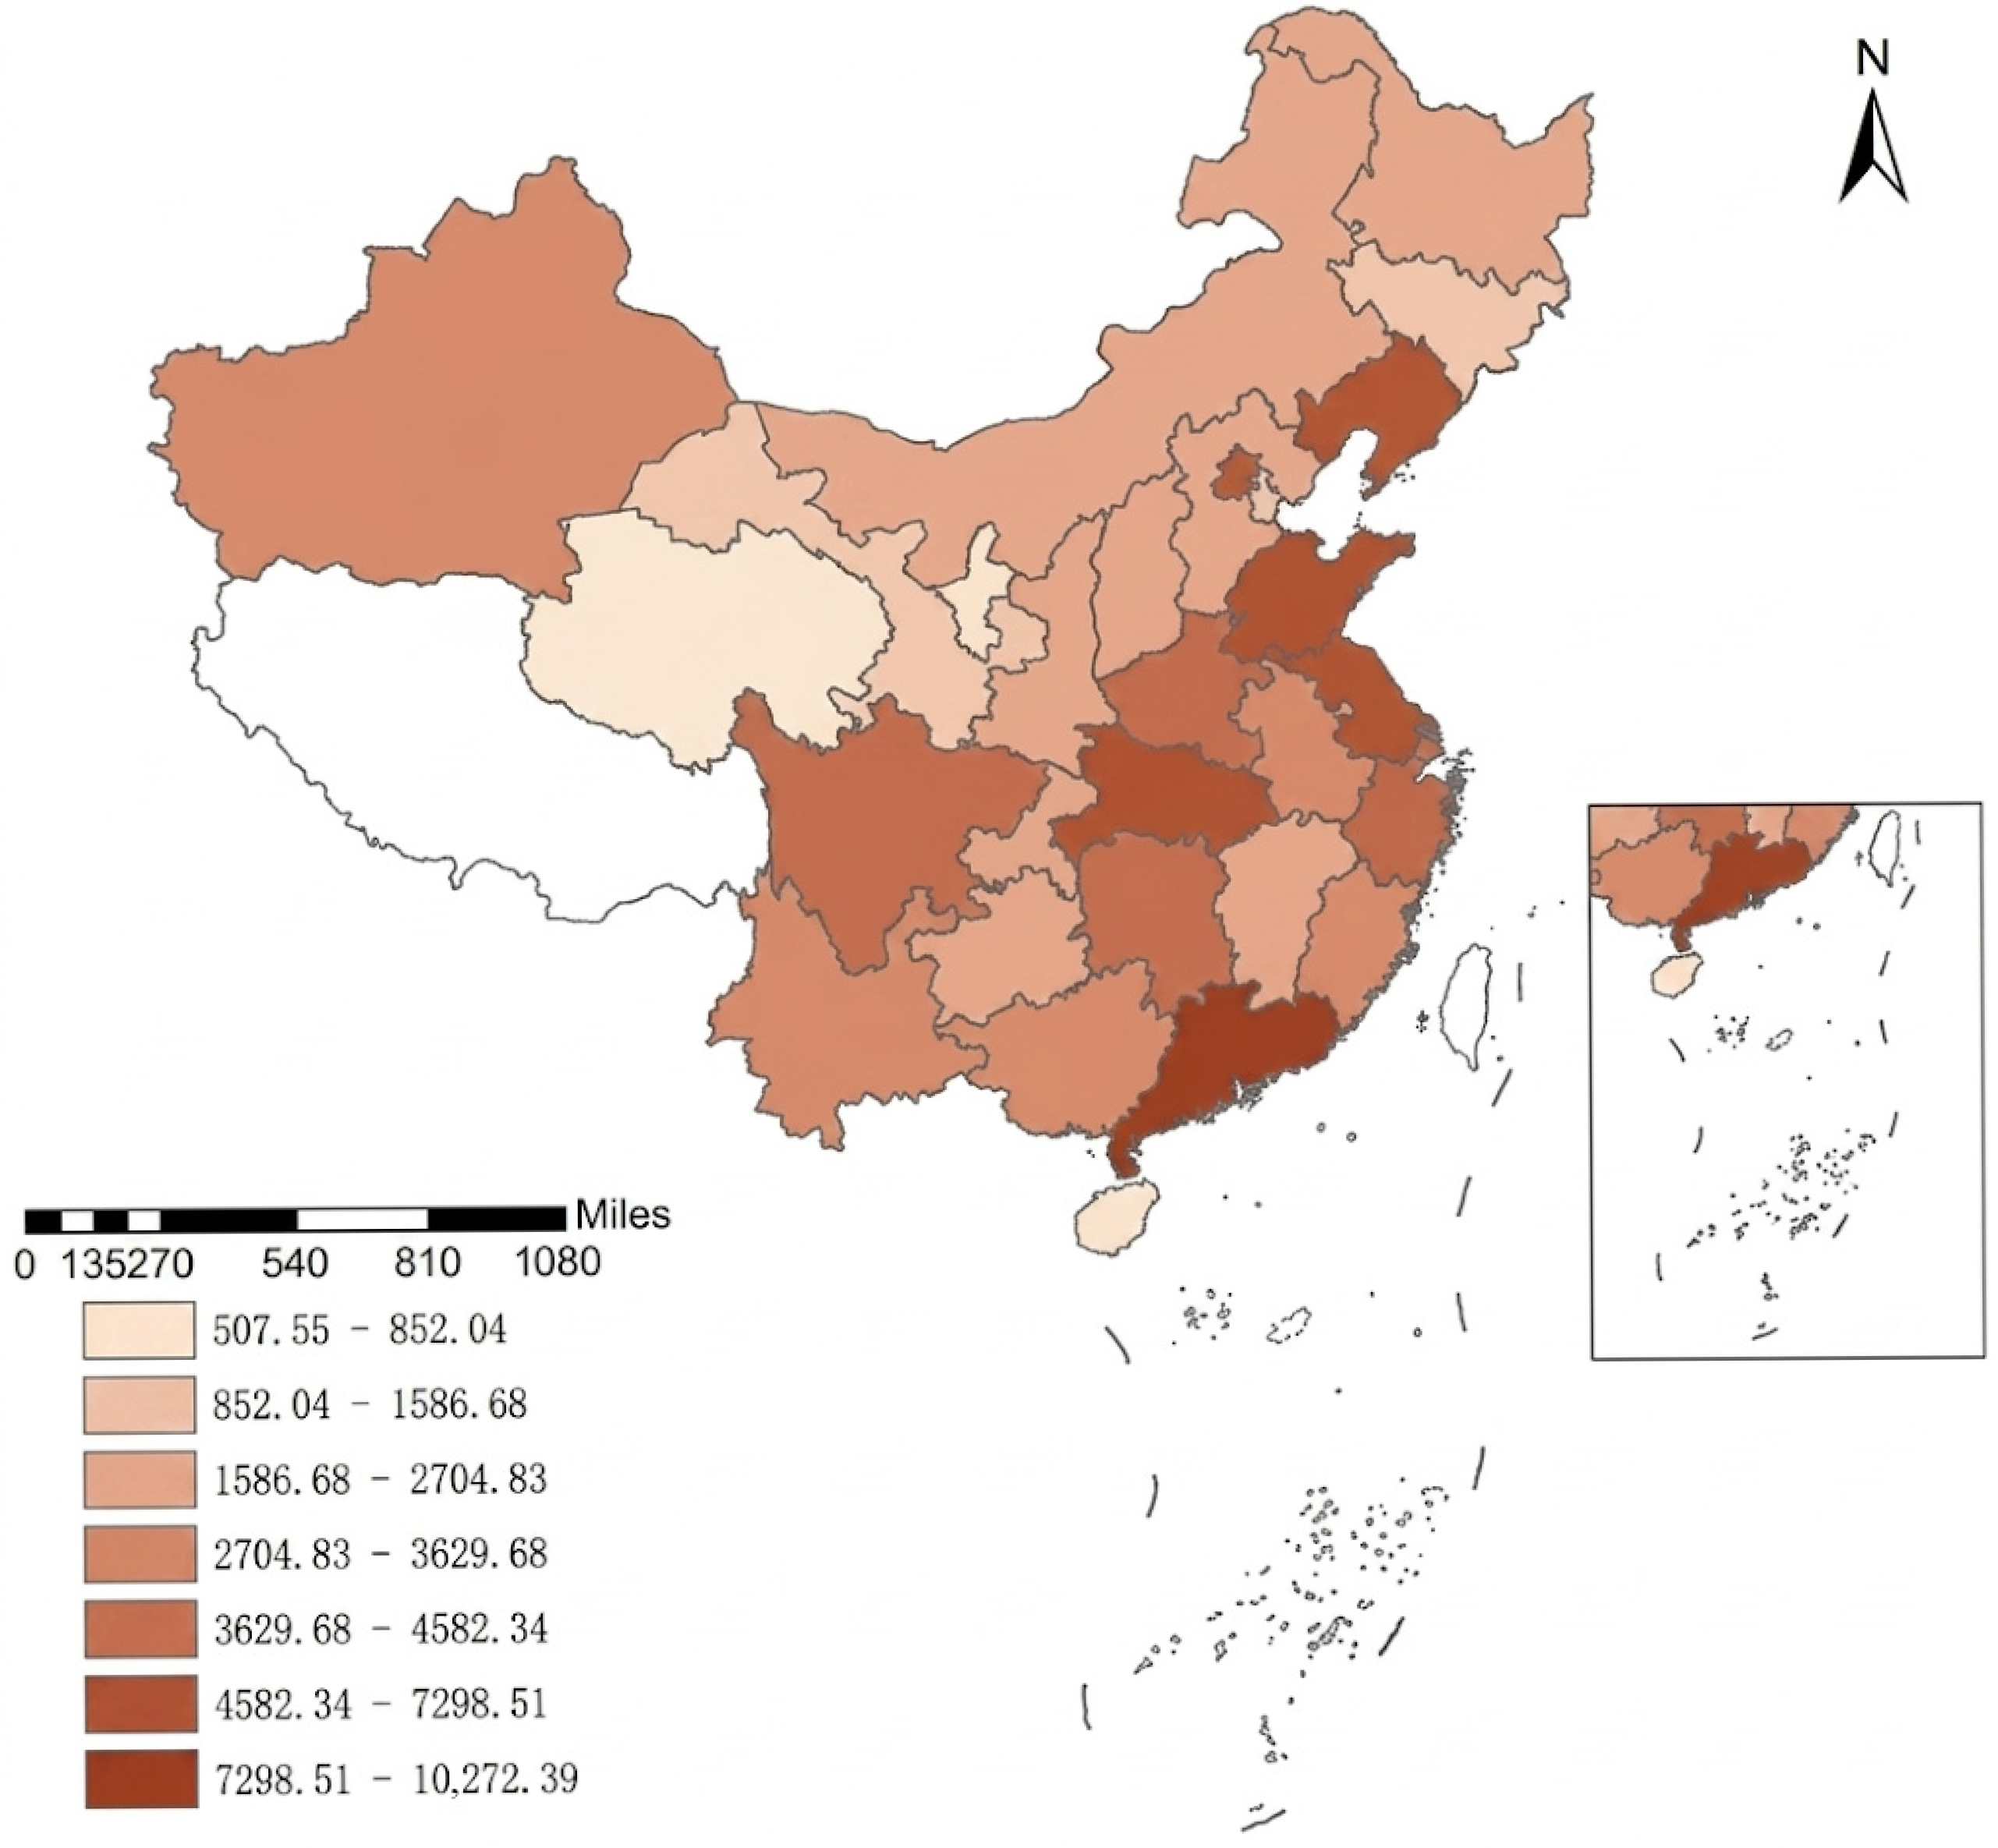
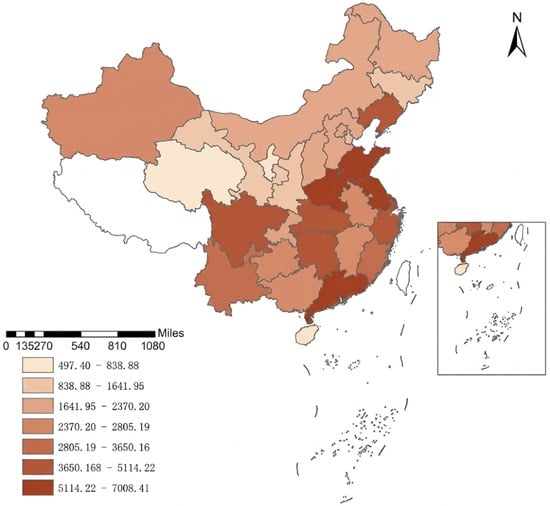
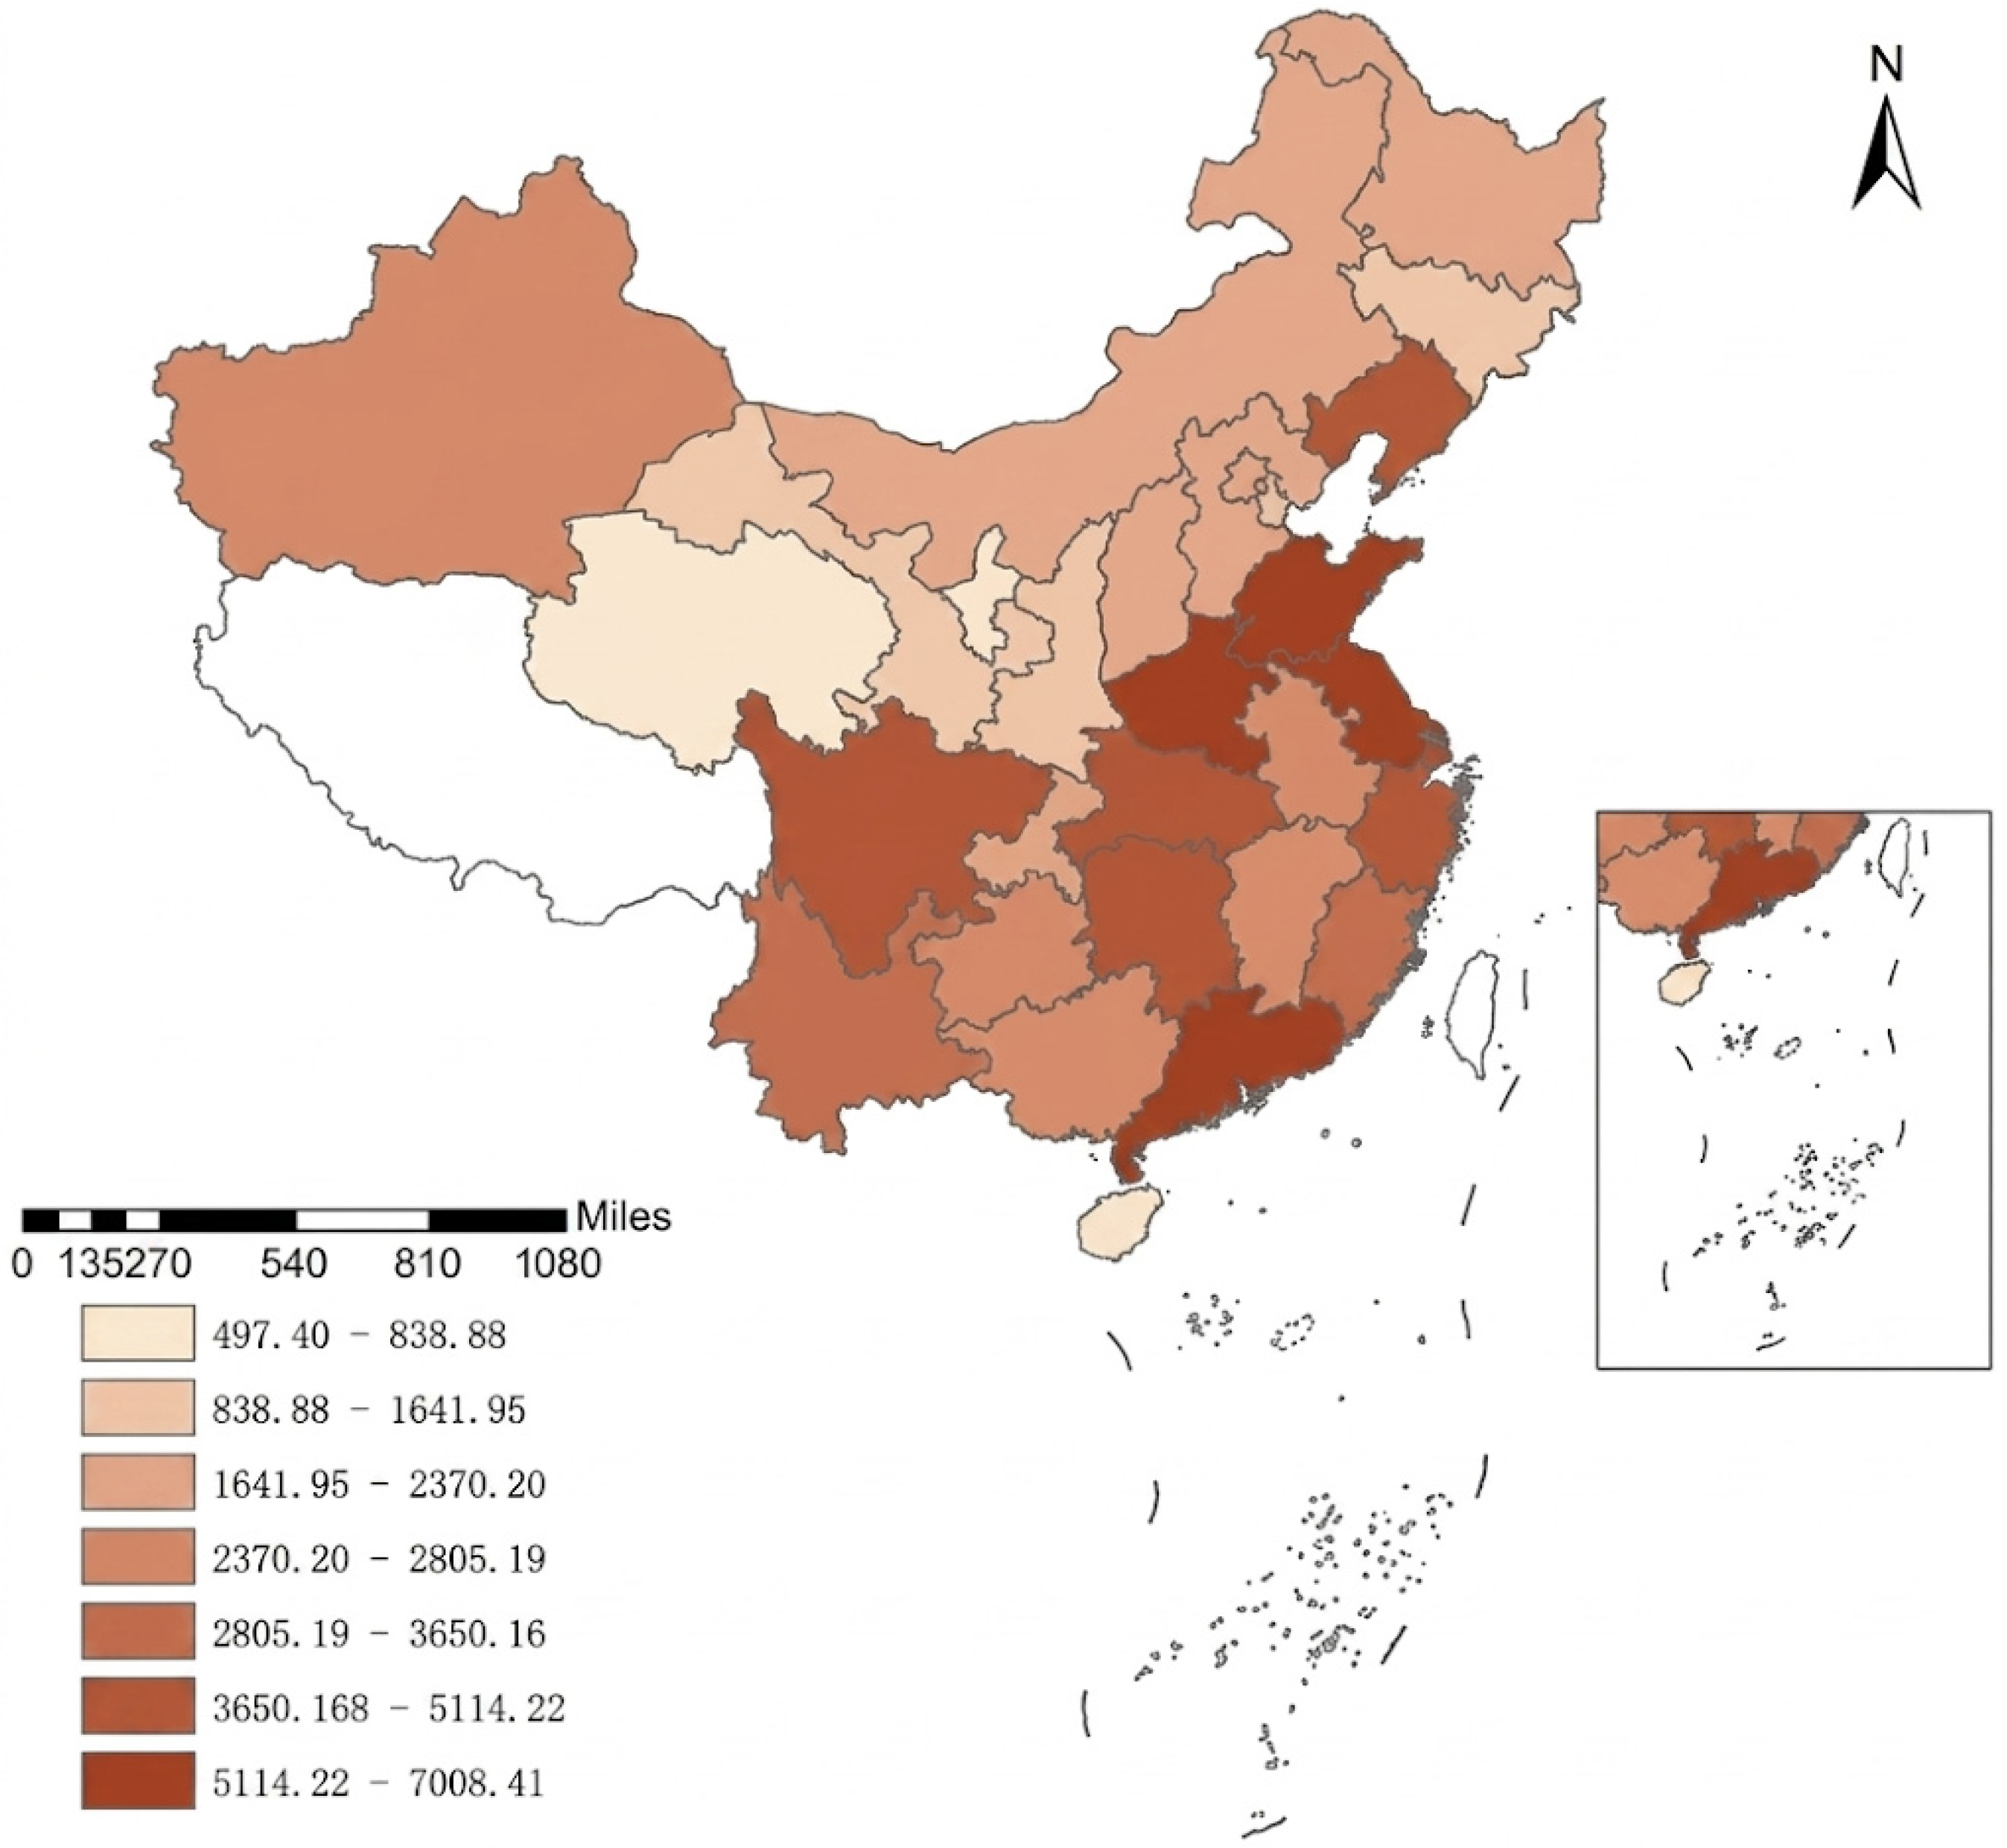

Disclaimer/Publisher’s Note: The statements, opinions and data contained in all publications are solely those of the individual author(s) and contributor(s) and not of MDPI and/or the editor(s). MDPI and/or the editor(s) disclaim responsibility for any injury to people or property resulting from any ideas, methods, instructions or products referred to in the content. |
© 2026 by the authors. Licensee MDPI, Basel, Switzerland. This article is an open access article distributed under the terms and conditions of the Creative Commons Attribution (CC BY) license.