


Abstract
The coordinated advancement of economic growth, ecological resource constraints, and societal well-being is pivotal to achieving high-quality development in the Yellow River Basin. The influence of the digital economy on urban development manifests as systemic, dynamic, and spatially heterogeneous—exhibiting pronounced interurban correlations. This study adopts a dual analytical lens: first, ecological well-being performance—which quantifies the efficiency with which natural resource inputs are converted into improvements in residents’ subjective and objective well-being; and second, ecological common prosperity—which captures equity dimensions in the distribution of ecological benefits across populations and territories. Drawing on system dynamics modeling, we elucidate the underlying mechanisms through which the digital economy shapes ecological well-being performance, simulate evolutionary trajectories of both ecological well-being performance and ecological common prosperity under alternative policy regimes, and identify optimal intervention pathways. Empirical results indicate that the integrated policy scenario combining green welfare enhancement and economic growth-oriented development, with digitally driven and regional cooperation, yields the greatest improvement in ecological well-being performance; the green welfare–focused scenario ranks second. Grounded in regional heterogeneity, we recommend a phased, differentiated implementation strategy—tailored to the developmental stage, endowments, and institutional capacities of individual cities within the basin. Methodologically, this study advances beyond conventional city-centric frameworks by introducing a local–neighborhood coupled simulation model that explicitly accounts for intercity spillovers. Furthermore, our measurement of ecological well-being performance integrates text-based big data analytics—leveraging sentiment lexicons—to robustly capture subjective welfare dimensions, thereby addressing a longstanding limitation in extant literature regarding the operationalization of well-being. Collectively, these contributions provide theoretically grounded, empirically informed insights to support the strategic implementation of ecological conservation and high-quality development in the Yellow River Basin.
1. Introduction
The Yellow River Basin, serving as a vital energy resource base and ecological barrier for China, functions as an ecological corridor linking the Qinghai–Tibet Plateau, the Loess Plateau, and the North China Plain. However, the basin’s fragile ecological foundation has been increasingly strained by prolonged resource exploitation, leading to prominent environmental and resource issues that severely hinder improvements in residents’ well-being. Based on Herman Daly’s philosophy of sustainable development, the ultimate goal of development is to enhance comprehensive well-being, encompassing utility, quality of life, and well-being [1]. The enhancement of human well-being cannot rely solely on increasing the consumption of natural resources [2]. Therefore, balancing the relationship among ecological resources, economic growth, and improvements in well-being within the ecological environment’s carrying capacity is a key objective of the national primary strategy for ecological governance and high-quality development in the Yellow River Basin. The basin’s developmental positioning and inherent resource endowments dictate that ecological conservation must serve as the foundation for high-quality economic growth and enhanced resident well-being. This approach aims to achieve a development pattern characterized by shared ecological governance, joint environmental protection, and coordinated regional collaboration across the entire basin. Based on this, the study begins with ecological well-being performance, which balances natural resource consumption and well-being enhancement, and introduces the concept of ecological common prosperity to represent the balanced development of ecological well-being performance. From the perspective of ecological well-being performance, it explores paths for synergistic advancement between ecological civilization construction and common prosperity [3,4].
Previous scholarly research has consistently identified population size and economic development as primary determinants of ecological environmental quality [5]. In recent years, the rapid expansion of the digital economy has elevated digital elements—such as data, artificial intelligence, and digital infrastructure—to the status of critical production factors, demonstrating a pronounced multiplier effect on both economic productivity and environmental governance outcomes. For the Yellow River Basin, characterized by fragile ecosystems and a sharp tension between population and land resources, achieving high-quality development hinges on fostering an intensive economic model and enhancing resource utilization efficiency. The advancement of the digital economy can facilitate the swift flow of diverse resources and factors both within and beyond the basin, enabling effective resource allocation and precise supply-demand matching. Simultaneously, it supports the digital and intelligent transformation of traditional industries, thereby providing a solid foundation for improving resource efficiency in the Yellow River Basin.
With the rapid development of the digital economy and the comprehensive advancement of digital transformation, how the digital economy empowers improvements in ecological environments and residents’ well-being has become a current research hotspot. Existing studies have primarily focused on the digital economy’s impact on ecological environments and resource allocation efficiency. Some research has found that the digital economy can effectively reduce environmental pollution and exhibit spatial spillover effects in mitigating it [6]. However, some scholars have pointed out that the digital economy exhibits an inverted U-shaped relationship with carbon emissions [7,8]. The research by Yu et al. (2024) revealed a U-shaped relationship between the digital economy and carbon-emission efficiency [9]. Research on the impact of the digital economy on residents’ well-being has revealed that the digital economy can enhance quality of life while simultaneously amplifying the adverse effects of carbon emissions on it [7]. However, Zhu, C. et al. noted that the impact of the digital economy on health levels follows a U-shaped pattern, initially detrimental but later beneficial [10]. At the same time, the digital economy also negatively affects consumption among economically disadvantaged and low-income households, with the impact more pronounced for impoverished families [11]. For the Yellow River Basin, the digital economy can not only enhance carbon emission efficiency [12] and promote industrial ecologicalization [13] but also foster common prosperity through spatial spillover effects [14]. However, these effects vary across river basins. Carbon emission efficiency and common prosperity in both upstream and downstream cities are more susceptible to significant impacts from the digital economy [11,15]. Existing scholarly research has yet to reach a consensus regarding the socioeconomic and ecological impacts of the digital economy. Nevertheless, the digital economy in the Yellow River Basin has experienced rapid growth and attracted substantial governmental attention. Given its widely acknowledged role as both a new “catalyst” and “stabilizer” for China’s economic development, this study investigates whether and through what mechanisms the digital economy can alleviate historical developmental constraints in the basin, enhance regional ecological benefits and residents’ well-being, and thereby improve overall ecological well-being performance and promote balanced development of ecological well-being performance.
To address the increasingly severe environmental issues and challenges posed by climate change, there is a growing demand for establishing a sustainable social ecosystem involving multiple stakeholders, disciplines, and factors. System Dynamics (SD) has been widely used to model social ecosystems to meet various research needs [16]. However, in research on urban environmental performance based on SD modeling, most literature treats a specific city or area as an independent entity, aiming to explore the impacts of multiple factors. This approach neglects the interactive influence between cities [16,17]. Especially for SD modeling of specific regions, if the interaction between cities is not considered, the feedback mechanisms established are worrying. Furthermore, in the process of applying SD modeling, the quantitative relationships among variables are of great significance. However, very few studies have scientifically measured the relationships between variables; more often, the magnitudes of influences are subjectively assigned, which may compromise the robustness of the research conclusions. Additionally, ecological well-being performance has gradually become an important tool for measuring the level of regional sustainable development and for assessing the future sustainable development potential and direction of regions. However, the measurement of ecological well-being performance mostly relies on objective indicators, such as resource consumption and economic output. In contrast, subjective variables, such as residents’ well-being and happiness, are often ignored. Reducing resource consumption and improving environmental quality are largely aimed at improving residents’ well-being. The neglect of subjective welfare indicators is also an important reason for the instability of existing research conclusions.
In view of this, this study adopts a systems perspective and conducts a scenario analysis of 78 cities in the Yellow River Basin. It clarifies the mechanisms and flow dynamics of the digital economy in enhancing ecological well-being performance at both the internal and inter-city levels. In measuring ecological well-being performance, important elements of residents’ well-being are included, thereby more systematically revealing the path of realization of the digital economy in driving improvements in ecological well-being performance. The primary contributions lie in the research perspective: adopting a dual local-neighboring perspective to deeply explore how the digital economies of local and spatially connected cities empower ecological well-being performance within the basin system. Simultaneously, from the perspective of the development gap in ecological well-being performance, regression analysis is employed to quantify the influence relationships among variables and to deeply analyze the implementation paths that affect the process of ecological common prosperity. In indicator measurement, text analysis methods are employed to establish a digital economy indicator system and to incorporate carbon emissions and subjective well-being metrics derived from hundreds of millions of emotional data points into the input-output indicator system for ecological well-being performance, thereby enhancing the scientific rigor and accuracy of indicator calculation. Regarding scenario design, multiple-measure variation scenarios are established based on the systemic operation of ecological well-being performance. These include a baseline scenario, multi-measure scenarios featuring policy combinations for green well-being, economic growth, and coordinated development. Additionally, the research developed multi-measure variation scenarios under the contexts of regional cooperation and digital economic development. This framework enables an in-depth exploration of optimal paths for the digital economy to enhance ecological well-being performance in the Yellow River Basin through systemic feedback mechanisms.
2. Analysis of System Operation Mechanisms
Ecological well-being performance represents the systemic process of converting ecological resources into well-being levels. The enabling effects of the digital economy manifest not only within cities but also exert significant driving forces across urban areas [13,18]. Based on the existing research results, the enabling effect of the digital economy on ecological well-being performance is summarized as the internal impact mechanism within cities and the interaction relationship between cities. It mainly manifests in two aspects: direct impact and indirect impact. In the context of the internal impact mechanism within cities, the digital economy, as a new driving force for economic development, empowers the real economy through the development and penetration of digital technologies and data. It has a positive impact across multiple areas, including energy transition, green innovation, high-tech industry development, and technological innovation for the benefit of the people [19,20,21]. Firstly, numerous scholars have conducted fruitful research on the role of the digital economy in promoting green innovation, and they have reached a relatively consistent conclusion: the development of the digital economy can effectively stimulate green innovation [22,23]. The digital economy has distinct characteristics of openness, sharing, and connectivity, providing an open platform for green innovation. All the entities involved in green innovation can overcome the limitations of time and space, scientifically match and optimize innovation resources such as capital and talent, and also provide a convenient way for knowledge to flow [24]. The digital economy has given rise to numerous innovative products and solutions, meaning the government has more diverse means of environmental regulation. At the same time, for enterprises, although they face greater regulatory pressure, this will force them to pursue green innovation more widely. Although Wu et al. (2024) pointed out that in the early stage of digital economy development, too much of the limited resources were occupied [23], from a long-term perspective, as the digital economy continues to develop and becomes more mature, the regions with more developed digital economy will have a more fruitful green innovation achievements [22]. Green innovation has played a significant and constructive role in improving energy efficiency and reducing carbon emissions [22,23]. Especially in the Yellow River Basin, the development characteristics of an industry structure overly reliant on resources and an energy structure heavily dependent on coal urgently need to be improved through new technologies and methods to enhance resource utilization efficiency. The development of the digital economy has brought new opportunities for this. Moreover, the insufficient development of the high-tech industry is a significant bottleneck, hindering the Yellow River Basin’s development and providing insufficient internal driving force. The digital economy can effectively alleviate the unfavorable factors of regional development. Although the development of high-tech industries in the Yellow River Basin itself is relatively weak, the digital economy can effectively promote spillover effects from high-tech innovation, enabling high-tech industries in backward regions to make significant progress [25]. In terms of the region itself, the digital economy achieves breakthrough innovation by improving resource accessibility and promoting the establishment of effective connections among organizations, in addition to the change in management models that helps the formation of an innovative culture, which further amplifies the positive effect of the digital economy on achieving breakthrough innovation [26]. At the micro level, the digital economy has had positive effects, promoting employment and improving residents’ social security, including medical services. Specifically, first, the development of the digital economy has a positive impact on social insurance. On the one hand, the digital economy can increase employment and income, thereby expanding the scale of social insurance funds [27]. More importantly, the digital economy can enrich residents’ financial knowledge, promote social interaction, and thereby strengthen residents’ willingness to participate in insurance, especially for low-income and less educated rural families; the impact is more significant [28]. Secondly, the impact of the digital economy on residents’ employment. Whether from the perspective of reality or theoretical research, the rapid development of the digital economy has had a certain substitution effect on traditional employment. However, numerous studies have shown that the digital economy can significantly optimize the employment structure, which is of great significance for enhancing employees’ knowledge and skills and stimulating the human capital dividend [29,30]. Finally, regarding medical services and housing, existing research has confirmed that the development of the digital economy can effectively expand the supply of medical services, particularly in the economically underdeveloped Yellow River Basin [31]. Cong et al. (2024) [32] conducted a study and found that the development of the digital economy will increase housing prices in first- and second-tier cities but reduce them in fourth- and fifth-tier cities. That is, the impact of the digital economy on housing prices has a two-tier effect. Overall, in the Yellow River region, dominated by fourth- and fifth-tier cities, the development of the digital economy can effectively lower housing prices and thereby improve residents’ living standards [32].
From the perspective of inter-city interactions, balanced development of ecological well-being performance among cities within the basin constitutes a critical dimension of systemic advancement, representing a systematic process toward achieving common ecological prosperity across the basin. With the rapid advancement of the digital economy in the Yellow River Basin, digital technologies have been widely applied in cities, stimulating green technological innovation and enhancing green production efficiency [33]. According to innovation diffusion theory, the development of green technologies will accelerate diffusion once it reaches a certain level of accumulation [34]. Given the energy- and resource-dependent development characteristics of cities in the Yellow River Basin, the green transformation of these cities is imperative. Amid high demand for green innovation, the networked, shared characteristics of the digital economy provide a platform for the flow and diffusion of innovation resources between cities [35]. Accelerated innovation diffusion not only drives learning and imitation in neighboring regions but also facilitates the efficient movement and collaboration of critical factors, such as talent and technology, thereby promoting knowledge spillovers and dissemination [36]. Furthermore, the development of the digital economy can create a large number of job opportunities, which also facilitates the flow of population between cities and further promotes the interaction and sharing of knowledge and information [37]. In terms of the environment, the digital economy helps reduce carbon transfers between cities. Reasonable policies for carbon import and export can contribute to the region’s overall ecological improvement [38]. Simultaneously, practical experiences in urban ecological conservation can generate demonstration and imitation effects in other regions through interregional information exchange, official mobility, and technology spillovers, thereby accelerating the catch-up pace of “lagging” areas [39]. In terms of promoting common prosperity, the significant spatial spillover effects of the digital economy on regional development are conducive to achieving common prosperity [15]. The mechanism of the digital economy mainly promotes common prosperity by stimulating entrepreneurial spirit, facilitating entrepreneurial activities, increasing disposable income, and narrowing the income gap between urban and rural areas [40]. It also promotes sustainable development [15]. Consequently, at some point in the future, disparities in ecological well-being performance among cities will gradually diminish.
In summary, the paths through which the digital economy enhances ecological well-being performance are illustrated in Figure 1:
Figure 1.
The System Operating Mechanism of the Digital Economy in the Yellow River Basin on the Performance of Ecological Well-being.
3. Research Methods and Variable Definitions
3.1. Research Methods and Data Sources
This study develops a simulation model to enhance ecological well-being performance through the digital economy, utilizing system dynamics. For variable measurement, digital economic development indicators are established through text analysis, and the improved CRITIC weighting method is used to calculate cities’ digital economic development levels in the Yellow River Basin. At the same time, the non-radial and non-directional super-efficiency network SBM model considering non-desired outputs is adopted to reveal the “black box” in the input-output process of ecological well-being performance in the Yellow River Basin, providing a reference for scientifically and accurately calculating ecological well-being performance and clarifying the process of resource consumption and welfare output.
Given that the Outline of the Development Vision for the Yellow River Basin’s Ecological Protection and High-Quality Development sets the long-term planning period for the development of the Yellow River Basin as the middle of this century, to better serve the development goals, this paper sets the historical years as 2011–2021 and the prediction years as 2022–2050. The data sources of the variables in the model are the “China Urban Statistical Yearbook”, the statistical yearbooks and statistical bulletins of each province (municipality), Chinese Research Data Services Platform, Institute of Digital Finance, Peking University, Emissions Database for Global Atmospheric Research, the water resources bulletins of each province, the shared application service platform for land survey results, etc.
3.2. Variable Definition
Digital Economy: The level of digital economy development is measured using an index approach, specifically by constructing an indicator system to assess the degree of digital economy advancement. This indicator system of the digital economy was established primarily by retrieving relevant literature on digital economy measurement indicators from the Web of Science and the China National Knowledge Infrastructure (CNKI), extracting these indicators from the literature, and conducting text analysis. The level of digital economy development in cities in the Yellow River Basin is assessed across four dimensions: digital infrastructure, digital industrialization, industrial digitalization, and digital innovation. The specific indicators include measuring digital infrastructure through mobile phone penetration rates and internet access rates and representing digital industrialization by the number of internet professionals and the level of internet output. Additionally, the research assessed industrial digitalization through the development of digital finance and e-commerce, and the number of digital patents serves as an indicator of digital innovation. Based on four evaluation indicators, the CRITIC method is used to determine indicator weights, and the weighted sum is then calculated to obtain the level of digital economic development.
This study measures ecological well-being performance using a non-radial, non-directional, and super-efficiency network SBM model that accounts for undesired outputs. Energy consumption, land consumption, and water resource consumption are selected as input indicators reflecting the consumption of ecological resources. At the same time, expected outputs, including economic development, and undesired outputs, such as carbon emissions and industrial pollutants, are chosen as intermediate outcomes. The comprehensive welfare, which combines subjective and objective welfare, is selected as the final output indicator. Ecological well-being performance can be regarded as the welfare output resulting from economic growth driven by resource consumption. The specific two-stage process is as follows:
Among them, represents the urban ecological well-being performance level, represents the ecological footprint, represents the regional gross domestic product, represents comprehensive welfare, represents subjective welfare factors, and represents objective welfare factors other than economic development.
This study defines the first stage as the economic performance of natural consumption, which reflects the economic output efficiency of resource utilization, that is, the process of converting ecological resource consumption into economic output; it is worth noting that, in this process, in addition to economic growth brought about by resource consumption, there is also the emission of pollutants. The second stage is the welfare transformation stage of economic input, which reflects the economy’s welfare output efficiency. In the second stage, the economic output indicators from the first stage serve as intermediate inputs to obtain the final subjective and objective welfare outcomes for residents. Based on existing research, subjective well-being is calculated from Baidu search data on positive and negative words in the sample cities, collected daily. The positive and negative words come from the authoritative LIWC sentiment analysis dictionary. Specifically, we collected Baidu index data for each positive and negative emotion word in every city of the Yellow River Basin from 2011 to 2021. We aggregated these data to form the basic Baidu index for positive and negative words across 78 cities in the Yellow River Basin each year. Then, the difference value in retrieval data between standardized positive and negative words is used to measure subjective well-being [41,42].
Based on the above calculation method, the digital economy development level in the Yellow River Basin has shown a year-on-year upward trend. At the same time, the ecological well-being performance has presented a trend of first decreasing and then increasing (Table 1). The result may be due to policy regulation playing a crucial role in guiding and regulating the construction of ecological civilization and the implementation of green environmental regulations in cities within the Yellow River Basin. Before and after 2011, promoting economic recovery and stimulating economic growth were the key tasks of governments at all levels, but ecological environmental problems gradually emerged. With the successive introduction of policies such as supply-side structural reform and the “dual carbon” target, ecological environment problems have received attention and been alleviated, leading to improvements in ecological well-being performance.
Table 1.
Average levels of digital economic development and ecological well-being performance of cities in the Yellow River Basin from 2011 to 2021.
4. System Dynamics Model of Digital Economy Impacting Ecological Well-Being Performance in the Yellow River Basin
4.1. System Boundary Definition
The system examining the impact of the digital economy on ecological well-being performance in the Yellow River Basin comprises three subsystems: socioeconomic development, resource-environment, and regional coordination. Given the extended study period, socioeconomic factors—including the level of economic development, total population size, the extent of urban expansion, capital misallocation, labor misallocation, and the government’s focus on the digital economy—were incorporated. Factors such as population and the economy influence the enhancement of the human capital stock within the region. At the same time, the guiding role of policy variables accelerates the advancement of digital economic development. Considering the mutual influence among cities and the developmental trends of ecological well-being performance across the entire basin. From the perspectives of temporal evolution and spatial interconnections among cities, this study constructed a system dynamics model of the digital economy’s impact on ecological well-being performance in the Yellow River Basin. Ecological Common Prosperity serves as an indicator of the balanced development of ecological well-being performance in the Yellow River Basin, derived from calculations of ecological well-being performance. It quantifies the region’s progress in ecological civilization construction and common prosperity from an ecological well-being perspective. The temporal scope of this study spans from 2011 to 2050, with a time step of one year.
4.2. Causal Analysis
The primary feedback loops of the model are as follows:
- (1)
- Digital Economy → (+) Ecological Well-being Performance → (+) Urban construction → (+) Economic Development Level → (+) Investment Returns → (+) Digital Economy.
- (2)
- Digital Economy → (+) Ecological Well-being Performance → (+) Urban construction → (+) Total Population → (+) Human Capital → (+) Digital Economy.
- (3)
- Digital Economy → (+) Green Innovation → (−) Resource Consumption (−) → Ecological Well-being Performance → (+) Urban construction → (+) Economic Development Level → (+) Investment Returns → (+) Digital Economy.
- (4)
- Digital Economy → (+) High-Tech Industry Development → (+) Economic Development Level → (+) Ecological Well-being Performance → (+) Urban construction → (+) Economic Development Level → (+) Investment Returns → (+) Digital Economy.
- (5)
- Digital Economy → (+) Social Security → (+) Residents’ Welfare → (+) Ecological Well-being Performance → (+) Urban construction → (+) Total Population → (+) Human Capital → (+) Digital Economy.
- (6)
- Digital Economy → (+) Ecological well-being performance of spatially associated cities → (+) Ecological Well-being Performance → (+) Ecological Common Prosperity → (+) Resource Misallocation → (+) Economic Development Level → (+) Investment Returns → (+) Digital Economy.
- (7)
- Digital Economy → (+) Digital additive effect of environmental concerns → (+) Residents’ Welfare → (+) Ecological Well-being Performance → (+) Urban construction → (+) Total Population → (+) Human Capital → (+) Digital Economy.
4.3. System Flow Diagram and Key Equations
Based on the system dynamics causal loop diagram illustrating how the digital economy affects ecological well-being performance in the Yellow River Basin, we further analyze the properties of these variables and refine their specifications. This approach explains the system’s operational patterns, illustrates the paths of information and material flows between system elements, and reveals the logical relationships among system components (Figure 2).
Figure 2.
System Dynamics Model Flowchart of Digital Economy Impacting Ecological Well-being Performance.
This model was constructed and simulated using Vensim DSS software Version 10.1.3. System variable parameters were primarily calculated through regression analysis, variable assignment methods, and reference to existing literature. According to the approach of existing research, the historical data in the model are set to the average values from 78 cities in the Yellow River Basin [5,43]. The main equations of the system dynamics model are as follows (Table 2):
Table 2.
System Parameter Settings.
4.4. Model Validation
This study conducted intuitive validation, operational testing, historical validation, and sensitivity analysis on the system dynamics model constructed earlier. In terms of intuitive validation and operational testing, the system model not only passed structural validation and dimensional consistency checks via Vensim’s “Check Model” and “Unit Check” functions but also demonstrated sustained steady-state behavior after operational testing. The result indicates the system’s overall operational validity and stability. For historical validation, simulated values for economic development level, total population, ecological well-being performance, and the digital economy were compared with actual data.
Through the analysis of historical tests (Table 3), we found that the errors of the four variables are all within 10%, within the allowable error range [46], and the average errors of the four variables are all no more than 5%. The average errors of economic development level, total population, ecological well-being performance, and digital economy are 4.55%, 1.94%, 2.96%, and 4.50% respectively. This indicates that the simulation results of the system model as a whole can truly reflect the operating status of the system.
Table 3.
Historical Validation Results.
Sensitivity analysis is to observe the impact of the change in a certain variable within the defined range of the system on a key result variable within the system. Taking the Ecological well-being effect of digital economy as an example, 200 random samples were taken within the range of [0.1674, 0.3906], and 100 of the sampling results fell within the area bounded by yellow, and 150 of the sampling results fell within the area bounded by green and including yellow (Figure 3). Therefore, all the variables in this model do not have overly sensitive or overly insensitive variables, indicating that the model has good stability. Based on this, the dynamic impact of digital economy in the Yellow River Basin on ecological well-being performance can be analyzed using the system model constructed in the previous text.
Figure 3.
Sensitivity Analysis.
Finally, this paper conducted a running test, using the Vensim DSS software Version 10.1.3 to select time nodes, and selected years and quarters for simulation, observing the changes in the results of key indicators (Figure 4). If the time dimensions are different and the simulation results of the same indicator have large differences, it indicates that the stability of the model is poor, and vice versa, it represents that the system stability is better. Given the excessive number of system variables, this paper selected economic development level, total population, ecological well-being performance, and digital economy from each subsystem for detection successively. The main representative indicators did not show large fluctuations due to different time dimensions and were all in a stable state, indicating that the stability of the constructed model is good. It also reflects from another aspect that the step size selected by the simulation model has little impact on the simulation results, and the system operation is consistent with the real situation.
Figure 4.
Running test.
5. Scenario Simulation of Digital Economy Impact on Ecological Well-Being Performance in the Yellow River Basin
5.1. Scenario Setting
This study focuses on the dynamic impacts of multi-measure combinations on ecological well-being performance. Based on the characteristics of the Yellow River Basin and the two-stage operational process of ecological well-being performance, scenarios are categorized into five primary types: baseline scenario, green well-being-oriented multi-measure scenario, economic growth-oriented multi-measure scenario, and coordinated development-oriented multi-measure scenario (Table 4).
Table 4.
Summary of Model Scenario Settings.
Baseline Scenario (SA1): All variable parameters in the system simulation model—including socioeconomic indicators, environmental protection, and social well-being—are maintained at current levels without modification.
Green Well-being-Oriented Multi-Measure Scenario (SA2): Guided by promoting green development and enhancing public well-being, relevant policies and measures are adjusted. Key adjustments include steady urban economic growth, gradual population decline, rapid improvement in residents’ well-being levels, increased intensity of environmental regulation, heightened public participation in ecological conservation, reduced resource consumption by cities, enhanced levels of green innovation, improved environmental pollution issues, and elevated ecological environment quality.
Economic Growth-Oriented Multi-Measure Scenario (SA3): Aiming to drive economic development, relevant policies and measures are adjusted. Key outcomes include rapid urban economic growth, increased investment in urban fixed assets, expanded openness to the outside world, accelerated urbanization, steady improvement in residents’ well-being levels, and greater emphasis on economic development than on ecological environment improvement, resulting in slower growth rates for ecological environment indicators.
Synergistic Development-Oriented Multi-Measure Scenario (SA4): Pursues inclusive development that enhances urban residents’ well-being through socioeconomic progress and ecological conservation. Policy adjustments include steady economic growth, ecological improvement, elevated resident well-being, and coordinated advancement across economic, social, environmental, and well-being dimensions to achieve sustainable development.
Based on relevant research reports and authoritative literature on China’s digital economy, including the China Academy of Information and Communications Technology’s “China Digital Economy Development Report (2024),” and considering the development trajectory of the digital economy in the Yellow River Basin, the fluctuation range for the digital economy growth rate under the rapid development strategy is set at 5‰.
For parameters related to socioeconomic development indicators, based on national and regional economic development planning documents and historical data trends, the growth rates for the following indicators under the multi-measure scenario oriented toward green well-being are set as follows: economic growth rate at 3%, high-tech industry growth rate at 4%, fixed-asset investment at 1%, openness to the outside world at 1%, urbanization rate at 1%, and natural population growth rate at −5‰. For the economic growth-oriented and coordinated development-oriented scenarios, the corresponding growth rates were set at 4%, 5%, 2%, 1%, 2%, and 5‰, respectively.
For green welfare indicators, parameters were set based on the National Intellectual Property Administration’s “2024 Green and Low-Carbon Patent Statistical Analysis Report,” the Ministry of Ecology and Environment’s Environmental and Economic Policy Research Center’s “Citizen Ecological Environment Behavior Survey Report (2022),” the “Action Plan for the Ecological Protection and Governance Campaign of the Yellow River” jointly issued by 12 departments including the Ministry of Ecology and Environment, and actual basin development conditions. Under the economic growth-oriented multi-measure scenario, the growth rates for green innovation, urban greening, public environmental concern, government environmental concern, environmental pollution control cost coefficient, social security growth rate, education support intensity, and employment density growth rate were set at 1%, 2%, 1%, 1%, −0.5%, 0.5%, 5%, and 4%, respectively. For the green, welfare-oriented, and development-oriented scenarios, the corresponding parameter variation ranges were set to 4%, 4%, 7%, 5%, −2%, 1%, 7%, and 6%.
Additionally, based on the spatial autocorrelation coefficient of the digital economy derived from historical data, the growth rates of spatial correlation were set at 1% and 3% for the economic-growth-oriented and green-welfare-oriented scenarios, respectively. To distinguish the compound effects of the digital economy on economic growth, social development, and green low-carbon aspects across different scenarios, a stepwise parameter setting was adopted in the coordinated development scenario. The corresponding spatial correlation growth rates for 2030, 2040, and 2050 were set at 5%, 10%, and 15%, respectively.
5.2. Scenario Simulation
Based on parameter settings for different scenarios within the system dynamics model, multiple policy simulations are conducted. Observed variables include both ecological well-being performance and ecological common prosperity levels. By analyzing changes in these two target variables, the advantages and disadvantages of each scenario are evaluated. It should be noted that ecological common prosperity in the simulation model represents the gap in ecological well-being performance between the two cities, with lower values indicating higher common prosperity levels. The policy simulation timeframe spans from 2022 to 2050.
- (1)
- Baseline Scenario
In Scenario ①, as shown in Figure 5a, without intervention, the digital economy maintains its current growth rate, and the ecological well-being performance continues to show an upward trend. After 2030, the growth rate of ecological well-being performance began to diverge, and after 2040, it accelerated. As an important “energy basin” and economic belt in China, the Yellow River Basin’s urban economic growth is overly dependent on resource development. The growth model, characterized by high pollution and energy consumption, impedes improvements in the ecological environment. However, after 2030, the role of the “Outline for Ecological Conservation and High-Quality Development of the Yellow River Basin” (hereinafter, the “Outline”) began to emerge. Cities in the Yellow River Basin have made significant progress in ecological and environmental protection, and the well-being of residents has improved substantially, aligning with the Outline’s medium- and short-term goals.
Figure 5.
Simulation Results of the benchmark scenario.
According to Figure 5b, the level of ecological common prosperity fluctuated and then began to decline. By 2048, it began to approach zero, indicating that the gap in urban ecological benefit performance exhibits an “N”- type development pattern. In 2014, the “Broadband China” strategy was proposed, and the construction of digital infrastructure nationwide accelerated. In 2015, the policy effects of “Broadband China” began to show. By 2020, a relatively complete network and information security guarantee system had been established nationwide. Especially in the Yellow River Basin, various provinces and cities have adopted policies as a guide and actively explored new paths for green development driven by the digital economy, reshaping the economic ecology of the Yellow River Basin with digital momentum. However, due to the regional bias in the digital economy’s layout, the digital economy’s development dividends will initially benefit cities and developed regions. Therefore, during the period from 2016 to 2021, the rapid development of the digital economy may widen the gap in ecological well-being performance levels among cities. As the growth rate of the digital economy stabilizes, the accumulation of digital capital, in conjunction with the catch-up effect of regions with poor ecological well-being, will jointly boost regional development and narrow the gap in ecological well-being performance among cities.
- (2)
- Multiple measures scenario
The three policy combinations have demonstrated significant differences in enhancing the ecological well-being performance of the Yellow River Basin and promoting ecological common prosperity.
In terms of ecological well-being performance, the green welfare policy package (Figure 6a, scenario ②) is centered on ecological priority, by placing the ecological environment and residents’ welfare at the top of urban development. The green welfare policy package has effectively enhanced ecological well-being performance, and its improvement effect is superior to that of the economic growth policy package (Figure 6b, scenario ⑤). The latter is oriented towards economic growth and neglects ecological protection and welfare guarantees, resulting in lower welfare levels in the Yellow River Basin, where the resource-carrying capacity is weak, and the human-land relationship is tense. The coordinated development policy package (Figure 6c, scenario ⑧) integrates economic, social, environmental, and residents’ welfare as a collaborative goal, optimizing input-output efficiency and ecological carrying capacity. Its performance in enhancing ecological well-being was superior to that of the aforementioned two scenarios and had a greater advantage in improving ecological well-being levels.
Figure 6.
Ecological Well-being Performance under Scenarios of Green Well-being, Economic Growth, and Coordinated Development.
In terms of ecological common prosperity, the time required to reduce the gap varies significantly among the three packages. In the green welfare package (Figure 7a, scenario ②), the strategy of ecological priority and welfare guarantee delays the reduction in the ecological well-being performance gap among cities until 2041, which is significantly later than the scenario of only implementing economic and social development (2034), reflecting the short-term gap expansion phenomenon that occurs during the system’s transition from the old balance to the new balance due to differences in resource endowment and governance capacity. Under the economic growth package (Figure 7b, scenario ⑤), the rapid growth of ecological well-being begins in 2036–2037, slightly later than the improvement time of the green welfare package. In the coordinated development package (Figure 7c, scenario ⑧), the time at which the economic and social development strategy begins to take effect, as well as the level of ecological common prosperity by 2050, are respectively superior to those in the economic growth and green well-being scenarios. The result indicates that multi-objective coordination helps to reduce the gap between cities while promoting the overall improvement of ecological well-being performance.
Figure 7.
Ecological Common Prosperity under Scenarios of Green Well-being, Economic Growth, and Coordinated Development.
- (3)
- The multi-measure scenario of the nested strategy
After introducing the two nested strategies of regional cooperation and rapid development of the digital economy, the ecological well-being performance and the ecological common prosperity of the three policy combinations show significant differences in terms of the paths of action, the intensity of influence, and the time dimension.
In terms of ecological well-being performance, the nested strategy of the green welfare combination (Figure 8a, scenarios ③ and ④) shows that the digital economy has a significant multiplier effect, which can amplify the efficacy of ecological protection and welfare strategies; while regional cooperation, although promoting technological exchanges and industrial interactions among cities, has a weaker direct impact on the ecological well-being performance compared to the digital economy. The nested strategy of the economic growth combination (Figure 8b, scenarios ⑥ and ⑦) indicates that regional cooperation reduces the environmental cost per unit of economic output through synergy and scale effects. However, the coordinated development policy combination (Figure 8c, scenarios ⑨ and ⑩) demonstrates the optimal system coordination, where regional cooperation and the digital economy jointly release the synergy effects of resource integration, technology diffusion, and institutional innovation, achieving a win-win situation for the environment and the economy, and significantly enhancing the ecological well-being performance.
Figure 8.
Ecological Well-being Performance under Scenarios of Green Well-being, Economic Growth, and Coordinated Development Combined with Regional Cooperation and Digital Economy Development.
In terms of ecological common prosperity, the nested strategy of the green welfare combination (Figure 9a, scenarios ③ and ④) shows that regional cooperation can promote knowledge spillover and industrial transfer, leading to a rapid improvement in ecological common prosperity after 2030, with a significantly stronger positive impact than other strategies; while the addition of the digital economy temporarily widened the ecological well-being performance gap between cities due to the regional digital divide before 2037, but the gap narrowed at a faster rate later, showing a dynamic characteristic of “first differentiation, then convergence”. The nested strategy of the economic growth combination (Figure 9b, scenarios ⑥ and ⑦) has a relatively limited promotion effect on ecological common prosperity. At this time, the comprehensive improvement effect of the digital economy on the level of ecological common prosperity is not as significant as that of the green welfare scenario. The nested strategy of the coordinated development combination (Figure 9c, scenarios ⑨ and ⑩) not only achieved the quickly change of ecological common prosperity (beginning in 2030), but also effectively broke through the administrative boundary constraints under the joint effect of policy coordination, factor flow, and knowledge transfer, continuously narrowing the gap between cities while improving the ecological well-being performance, becoming the scenario with the most effective and best balance among the three combinations for achieving ecological common prosperity.
Figure 9.
Ecological Common Prosperity under Scenarios of Green Well-being, Economic Growth, and Coordinated Development Combined with Regional Cooperation and Digital Economy Development.
It should be noted that, based on simulation results of urban ecological well-being performance in the Yellow River Basin under various scenarios, all show a flat trend in the early stage and then a rapid rise in the later stage. The main reasons are as follows: First, in the Yellow River Basin, especially in the middle and upper reaches, there are many resource-based cities, such as those in Shanxi, Henan, and Inner Mongolia. The development of ecological well-being in resource-based cities exhibits path dependence and path locking. Second, technological progress is an important driver of ecological well-being performance in the Yellow River Basin. Especially amid the empowerment of the digital economy, technological progress plays a more significant role in structural reshaping, but this force has a time-lag effect. When technological progress exceeds the critical point, ecological well-being performance will show a rapid improvement. Similarly, policy intervention also has a lag effect. For the Yellow River Basin, after the protection and high-quality development of the Yellow River Basin was elevated to a major national strategy in 2019, environmental regulations began to strengthen. Policy effects began to accumulate. When the effect of policy began to exceed the turning point, the ecological well-being performance entered a rapid improvement channel. Third, with the rapid development of the digital economy, urban areas in the Yellow River Basin have overcome geographical limitations and formed a multi-threaded, complex network. The network concentration degree is constantly increasing. This networkization enables the optimization and allocation of factors such as technology, capital, and talent on a larger scale. Advanced experiences and capital from downstream developed cities begin to benefit the middle and upper reaches through industrial transfer and ecological compensation, generating significant spatial spillover effects.
Furthermore, the simulation results indicate that the trend toward ecological common prosperity will intensify significantly after 2030. This performance is mainly attributed to the structural changes triggered by the release of institutional dividends: Firstly, 2030 is the target year for carbon peaking, marking a transition in policy logic from total control to structural optimization and providing an institutional foundation for regional collaboration. Secondly, the carbon trading market, ecological compensation mechanism, and digital governance system will enter their mature stages around 2030, creating a cumulative effect of multiple policies and releasing synergy dividends. Thirdly, the distribution effect of new quality productive forces. The integration of the digital economy, green economy, and high-end manufacturing will create a large number of high-quality jobs, significantly increase the proportion of labor remuneration in the primary distribution, and optimize residents’ income structure at the source [47]. Fourthly, the breakthrough of the mechanism for urban-rural integration. In response to the dual-structure characteristics of the Yellow River Basin, with the deepening of rural land system reform, the advancement of agricultural modernization, and the equalization of public services; combined with the improvement of the multi-level social security system, the income gap between urban and rural areas will further converge after 2030, and the foundation for people’s livelihood will be further strengthened.
5.3. The Path Selection for Enhancing Ecological Well-Being Performance Through Digital Economy in the Yellow River Basin
Based on scenario simulation results, different policy combinations exhibit significant variations in the intensity and duration of their impact on enhancing ecological well-being performance and ecological prosperity. When evaluating solely based on the magnitude of ecological well-being improvement and the timeline for achieving ecological prosperity, the coordinated development scenario emerges as the optimal pathway for the digital economy to enhance ecological well-being performance in the Yellow River Basin. This scenario maximizes both ecological well-being performance and ecological prosperity levels while accelerating the timeline for achieving ecological prosperity. The green welfare scenario ranks as the next-best option. Meanwhile, the digital economy demonstrates significant enabling effects, contributing to enhanced ecological well-being performance and ecological prosperity in cities along the Yellow River Basin. Internally, the basin exhibits substantial development disparities among cities, facing severe issues of inadequate and unbalanced development that will persist for an extended period. Under resource and environmental constraints, the contradiction between holistic basin governance and administrative territorial management is prominent [48]. Given that cities along the Yellow River with substantial development disparities cannot achieve full development and balanced progress simultaneously, the enabling role of the digital economy should be fully leveraged at different developmental stages to address prominent issues in the “two sides of the same coin” regional development. Scenario simulation results indicate divergent trends in ecological well-being performance and ecological common prosperity across different strategic scenarios. To address the Yellow River Basin’s prolonged challenges of inadequate and unbalanced development, it is essential to delineate developmental stages scientifically, rationally group cities within the basin, clarify development priorities for each stage, and subsequently propose optimal strategic choices for each phase.
The principles of the research are “digital empowerment, ecological friendliness, improvement of well-being, leading advantages, categorized guidance, and regional collaboration”. It proposes phased improvement paths for the digital economy to enhance ecological well-being performance in the Yellow River Basin. Regarding developmental stage classification, scenario simulations indicate that while ecological well-being performance maintains sustained growth, trends in ecological co-prosperity exhibit complexity. Significant shifts in direction or magnitude of ecological co-prosperity primarily occur around 2030 and 2035. Considering national strategic timelines, 2030 marks China’s critical carbon peak target, and 2035 signifies the fundamental realization of socialist modernization. Meanwhile, the development goals of the “Outline for the Ecological Protection and High-Quality Development Plan of the Yellow River Basin” require that by 2030, the Yellow River Basin should achieve significant progress in harmonious human-water relations and prosperous people’s livelihoods, by 2035, achieve comprehensive improvement in the ecological environment and modernization of the economic system, and by the middle of this century, fully build a modern river basin that is in harmony with nature and serves as a model of modernization, providing critical support for achieving the goal of a socialist modernized strong country. Based on these temporal considerations, this study divides the subsequent development phases of ecological well-being performance in the Yellow River Basin into three phases: the Foundational Adjustment Phase (2022–2030), the System Optimization Phase (2031–2035), and the Collaborative Symbiosis Phase (2036–2050).
Regarding urban grouping, cities in the upper, middle, and lower reaches of the Yellow River Basin are at different developmental stages, resulting in significant disparities in their ecological well-being performance levels. Consequently, development strategies applicable to cities at different levels will vary considerably. To propose practical, targeted recommendations, this study follows the methodology of Li and Wang (2023), categorizing sample cities into four types based on their basin distribution and the ecological well-being performance level of their specific basin: upstream cities with strong ecological well-being performance, upstream cities with weak ecological well-being performance, mid- and downstream cities with strong ecological well-being performance, and mid- and downstream cities with weak ecological well-being performance [49]. Figure 10 is the phased ecological well-being performance enhancement paths for each city type.
Figure 10.
Paths for Enhancing Urban Ecological Well-being Performance in the Yellow River Basin.
Baseline Adjustment Phase (2022–2030): During this phase, a significant gap in ecological well-being performance exists among cities, and the underdevelopment of ecological well-being in disadvantaged cities is particularly pronounced. If both advantaged and disadvantaged cities adopt the same policy scenarios, the development gap between them may continue to widen, and the ecological well-being performance of disadvantaged cities will remain relatively low. Given this, advantaged and disadvantaged cities should adopt differentiated scenario strategies to coordinate the development rhythm and pace of each city. For disadvantaged cities, appropriate policy scenarios can be selected to address underdevelopment. The comprehensive scenario simulation section presents the growth trend of ecological well-being performance under each policy scenario. Therefore, under the impetus of the digital economy, disadvantaged cities midstream and downstream can choose the green well-being path to improve their ecological well-being performance. In contrast, disadvantaged cities upstream can adopt the collaborative development path. For advantaged cities, the development effectiveness can be further consolidated. Cities midstream and downstream with strong ecological well-being performance can choose the baseline scenario. In contrast, advantaged ecological well-being performance cities upstream can choose the economic growth path.
System Optimization Phase (2031–2035): During this phase, the ecological well-being performance of disadvantaged cities has increased significantly, further narrowing the gap with advantaged cities. The ecological well-being performance of the advantaged cities has steadily grown. According to the schedule for achieving the “dual carbon” goal in our country, the system optimization phase has passed the time node for achieving the carbon peak target and has also entered the industrialization phase. After this, efforts will be made to ensure that carbon emissions remain stable and decrease, and to promote green transformation, energy structure optimization, and industrial transformation and upgrading in cities along the Yellow River Basin, to accelerate the pace of green and sustainable development, and become a focus of attention for all levels of government. To comprehensively consider the extent of improvement and regional disparities, the path selection in this phase can focus on enhancing the upper limit levels of ecological well-being performance of both advantaged and disadvantaged cities while narrowing the gap in ecological well-being performance. Based on the results of comprehensive scenario simulation, the advantaged cities midstream and downstream can choose a multi-measure path oriented towards green well-being. In contrast, the advantaged cities upstream select for a multi-measure approach oriented towards coordinated development. The disadvantaged cities upstream, midstream, and downstream also adopt a coordinated development path to accelerate the growth of ecological well-being performance. From the perspective of digital economy development, implementing differentiated policies across regions can promote the formation of a gradient in digital economy industry development, enhance industry-wide enterprise collaboration, and further advance the optimization of the ecological well-being performance system across the Yellow River Basin.
Synergistic Symbiosis Phase (2036–2050): By this stage, all cities achieve a high level of ecological well-being, with inter-city disparities gradually disappearing. Ecological well-being performance continues to grow as all cities cross the development inflection point for ecological common prosperity. Over time, ecological common prosperity is progressively realized. To accelerate ecological common prosperity, a comprehensive, coordinated, and balanced regional development strategy should be implemented. In this phase, all cities adopt the same strategic scenario. A coordinated approach integrating strategies such as ecological priority, socioeconomic development, safeguards for well-being, and regional cooperation can steadily improve ecological well-being performance. Accordingly, during the collaborative symbiosis phase, all cities in the Yellow River Basin will adopt coordinated development paths to elevate the upper limit of ecological well-being performance, thereby achieving higher levels of ecological common prosperity.
6. Conclusions and Discussions
6.1. Conclusions
This study adopts a systems perspective and employs system dynamics methodology to reveal the paths by which the digital economy enhances ecological well-being in the Yellow River Basin. First, model validation results confirm the validity and reliability of the established system dynamics model, demonstrating its applicability for forecasting dynamic trends in the ecological well-being performance system as urban digital economies develop in the basin. Considering both the magnitude and duration of improvements in ecological well-being performance and ecological common prosperity, synergistic development emerges as the optimal strategy for enhancing ecological well-being performance, with the green well-being scenario ranking as the next-best option. Based on the actual development conditions of cities in the upper, middle, and lower reaches of the Yellow River Basin, cities with advantages and disadvantages should adopt phased enhancement strategies: During the foundational adjustment phase, cities upstream with ecological well-being performance advantages should choose the economic growth path, while midstream and downstream cities with ecological well-being performance advantages may choose the baseline scenario paths. The disadvantaged cities mentioned above should respectively choose the coordinated development and green well-being paths. During the system optimization phase, advantaged cities upstream should pursue the coordinated development path, while midstream and downstream cities may choose green well-being paths. In contrast, disadvantaged cities in all river sections should adopt coordinated development. In the symbiotic coordination phase, all cities within the basin should adopt the coordinated development path.
6.2. Discussion
- (1)
- Ecological well-being performance exhibits distinct dynamic evolutionary characteristics [50]. This study adopts a systems perspective, considering the dynamic changes in macro- and micro-level indicators across the entire enhancement path chain. It balances economic, ecological, and demographic development trends, thereby avoiding the shortcomings of static analysis that often result in policy recommendations lacking foresight. Within the bounds of ecological carrying capacity, balancing the relationship among ecological resources, economic growth, and well-being enhancement requires not only improving individual cities’ ecological well-being performance but also advancing common prosperity at the basin level to prevent polarization [14]. This study incorporates inter-city interactions, using ecological common prosperity as an observational variable to analyze the dynamic enabling role of digital economic development from a holistic perspective, thereby enriching research on how the digital economy empowers ecological well-being performance.
- (2)
- Based on the research results, in the policy-making process for enhancing ecological well-being performance, the path for improving ecological well-being performance should fully take into account the actual situations among cities, to promote the improvement of ecological well-being performance in river basins and achieve ecological common prosperity. It should be implemented in stages and across river basins with differentiated strategies. In terms of the practical implementation, given the significant developmental disparities among cities in the Yellow River Basin, during the classification adjustment and gradual optimization phases, green well-being, economic development, and coordinated development strategies should be implemented for cities with ecological well-being performance advantages and disadvantages in the upper, middle, and lower reaches. Tailored approaches should be adopted to unlock the dividends of the digital economy, with digitally disadvantaged cities receiving appropriately advanced digital infrastructure development [14]. During this phase, creating new growth poles will strengthen trickle-down effects while mitigating polarization effects. In the synergistic coexistence phase, the development path can shift from unilateral breakthroughs to basin-wide collaborative strategies [51], enhancing inter-city interactions and connectivity to form a holistic development pattern where linear progress drives broader regional advancement [52].
- (3)
- While this study’s parameter selection considered actual operational conditions across diverse river basins and development stages, it did not comprehensively cover distinctive indicators for specific basins. Future research may incorporate heterogeneous structural issues into system dynamics modeling to identify tailored enhancement paths for specific regions.
7. Policy Recommendations
- (1)
- Strengthening the Digital Infrastructure Foundation to Advance Ecological Well-being
Adopt a regionally differentiated strategy for digital infrastructure development, aligning investments and priorities with local endowments and ecological responsibilities. Upstream Region: Cities with strong digital capacity should establish ecological big data centers to consolidate hydrological, meteorological, and environmental monitoring data, serving as regional data aggregation and circulation hubs. Cities facing infrastructure constraints should prioritize the targeted deployment of digital tools—such as IoT-enabled sensors and mobile reporting platforms—for ecological monitoring, early warning systems, and restoration project management. Midstream Region: Digitally advanced cities should leverage intelligent computing platforms to integrate distributed computing resources, thereby reinforcing the ecological security barrier through real-time analytics and predictive modeling. Cities with higher industrial energy intensity should mandate digital connectivity for high-energy-consuming enterprises to provincial-level environmental supervision platforms, enabling full-process, closed-loop tracking of emissions, energy use, and compliance—thus accelerating sectoral digital transformation. Downstream Region: Leading cities should foster cross-sectoral industrial internet platforms integrating manufacturing and ecological services (“dual-industry” platforms), facilitating synergies between green industrial upgrading and ecosystem conservation. Cities with distinctive ecological assets but limited digital maturity should concentrate on niche, high-impact applications—such as smart wetland management and biodiversity monitoring—to strategically fill critical gaps in new infrastructure coverage.
- (2)
- Deepening Digital–Real Economy Integration to Cultivate Green Industrial Engines
Leverage the basin’s resource endowments and industrial strengths to dismantle sectoral silos and establish a virtuous cycle wherein digital innovation empowers green industries, and sustainable industrial growth reinforces ecological resilience. Upstream Region: Technologically capable cities should specialize in R&D and commercialization of plateau-adapted ecological monitoring equipment and AI-driven analytical algorithms—positioning themselves as technology exporters for fragile ecosystems. Resource-constrained cities should deploy lightweight mobile Internet solutions to streamline ecological patrol workflows, significantly reducing operational costs while improving response timeliness and data fidelity. Midstream Region: Cities with robust industrial bases should build integrated digital systems for end-to-end perception and optimization across energy generation, transmission, consumption, and waste treatment, establishing a regional hub for circular resource management. Cities undergoing industrial transition should incubate local industrial internet service providers, offering standardized SaaS modules for energy auditing, real-time consumption monitoring, and retrofit advisory—ensuring scalable, low-barrier digital adoption by SMEs. Downstream Region: Innovation-leading cities should institutionalize academia–industry–research collaboration through joint ventures or consortia, packaging proven technologies for transfer and replication. Cities emphasizing ecological tourism should develop modular, cloud-native digital tourism platforms that integrate visitor flow analytics, low-impact route planning, and real-time ecological impact dashboards to elevate conservation outcomes while enhancing economic returns.
- (3)
- Advancing Digital Ecological Civilization to Enable Systemic Optimization
Overcome data fragmentation, unlock the quantifiable value of ecosystems, and foster human–nature harmony through interoperable, evidence-based governance. Upstream Region: Digital-capable cities should pioneer the digital valuation of ecological assets—launching pilot projects on carbon sink measurement, certification, and trading; cities with underdeveloped data ecosystems should implement granular ecological contribution accounting and deploy smart grid infrastructure to optimize clean energy dispatch and consumption. Midstream Region: Industry-leading cities should deploy digital twin systems in priority sectors—including coal, steel, and cement—to simulate, monitor, and optimize production processes in real time, thereby minimizing energy waste and pollutant emissions. Post-mining cities should conduct comprehensive digital surveys of abandoned mining sites to inform integrated land-use plans that combine photovoltaic power generation with agrivoltaics or eco-tourism, creating multi-benefit regeneration models. Downstream Region: Metropolitan centers should develop dynamic “urban mine” resource atlases and digital secondary-material trading platforms, coupled with green financial instruments. Cities with significant wetland assets should implement high-precision, satellite and sensor-fused carbon sink monitoring, directly linking verified sequestration data to national carbon markets—and complementing this with an incentive-based ecological points system to mobilize community stewardship.
Author Contributions
M.S.: Conceptualization, Funding acquisition, Project administration, Resources, Supervision, Investigation, Validation, Writing—review & editing. J.Z.: Methodology, Formal analysis, Data curation, Visualization, Software, Resources, Writing—original draft, Writing—review & editing. All authors have read and agreed to the published version of the manuscript.
Funding
This research was supported by the National Social Science Fund of China (Grant number: 23BGL311).
Data Availability Statement
Data will be made available on request.
Conflicts of Interest
The authors declare that they have no known competing financial interests or personal relationships that could have appeared to influence the work reported in this paper.
References
- Zhu, D.; Zhang, S.; Sutton, D.B. Linking Daly’s Proposition to policymaking for sustainable development: Indicators and pathways. J. Clean. Prod. 2015, 102, 333–341. [Google Scholar] [CrossRef] [Scilit]
- Xia, M.; Li, J. Assessment of ecological well-being performance and its spatial correlation analysis in the Beijing-Tianjin-Hebei urban agglomeration. J. Clean. Prod. 2022, 362, 132621. [Google Scholar] [CrossRef] [Scilit]
- Li, B.; Huang, M.; Li, Q. Can the digital economy narrow the gap in environmental development between the East and the West of China? Environ. Dev. Sustain. 2025. [Google Scholar] [CrossRef] [Scilit]
- Zhang, H.; Geng, C.; Wei, J. Coordinated development between green finance and environmental performance in China: The spatial-temporal difference and driving factors. J. Clean. Prod. 2022, 346, 131150. [Google Scholar] [CrossRef] [Scilit]
- Wang, H.; Bao, C. Scenario modeling of ecological security index using system dynamics in Beijing-Tianjin-Hebei urban agglomeration. Ecol. Indic. 2021, 125, 107613. [Google Scholar] [CrossRef] [Scilit]
- Zhang, Y.; Ran, C. Effect of digital economy on air pollution in China? New evidence from the “National Big Data Comprehensive Pilot Area” policy. Econ. Anal. Policy 2023, 79, 986–1004. [Google Scholar] [CrossRef] [Scilit]
- Li, Z.; Wang, J. The Dynamic Impact of Digital Economy on Carbon Emission Reduction: Evidence City-level Empirical Data in China. J. Clean. Prod. 2022, 351, 131570. [Google Scholar] [CrossRef] [Scilit]
- Xu, C.; Zhao, W.; Li, X.; Cheng, B.; Zhang, M. Quality of life and carbon emissions reduction: Does digital economy play an influential role? Clim. Policy 2023, 24, 346–361. [Google Scholar] [CrossRef] [Scilit]
- Yu, Z.; Liu, Y.; Yan, T.; Zhang, M. Carbon emission efficiency in the age of digital economy: New insights on green technology progress and industrial structure distortion. Bus. Strategy Environ. 2024, 33, 4039–4057. [Google Scholar] [CrossRef] [Scilit]
- Zhu, C.; Wang, Z.; Sun, B.; Yue, Y. Urban digital economy, environmental pollution, and resident’s health–empirical evidence from China. Front. Public Health 2023, 11, 1238670. [Google Scholar] [CrossRef] [Scilit]
- Zhang, Y.; Qu, Y. Has the digital economy improved the consumption of poor and subsistence households? China Econ. Rev. 2024, 83, 102083. [Google Scholar] [CrossRef] [Scilit]
- Nie, L.; Bao, X.; Song, S.; Wu, Z. The Impact of the Digital Economy on Total-Factor Carbon Emission Efficiency in the Yellow River Basin from the Perspectives of Mediating and Moderating Roles. Systems 2024, 12, 99. [Google Scholar] [CrossRef] [Scilit]
- Xu, Q.; Shu, S. A study of the impact of digital technology on industrial ecologisation in the Yellow River Basin of China. Sci. Rep. 2023, 13, 22468. [Google Scholar] [CrossRef] [Scilit]
- Yang, M.; An, Q.; Zheng, L. The Spatial Effect of Digital Economy Enabling Common Prosperity—An Empirical Study of the Yellow River Basin. Systems 2024, 12, 500. [Google Scholar] [CrossRef] [Scilit]
- Zhou, M.; Guo, F. Mechanism and spatial spillover effect of digital economy on common prosperity in the Yellow River Basin of China. Sci. Rep. 2024, 14, 23086. [Google Scholar] [CrossRef] [Scilit]
- Kim, Y.; Lee, M.; Hong, J.; Lee, Y.-S.; Wee, J.; Cho, K. Development of a fuzzy logic-embedded system dynamics model to simulate complex socio-ecological systems. Ecol. Model. 2024, 493, 110738. [Google Scholar] [CrossRef] [Scilit]
- Amorocho-Daza, H.; van der Zaag, P.; Sušnik, J. Ethical considerations of using system dynamics in participatory settings: A social-ecological-systems perspective. Syst. Dyn. Rev. 2023, 40, e1755. [Google Scholar] [CrossRef] [Scilit]
- Tian, F.; Weng, G. The integration and challenges of digital economy with the tourism industry: Evidence from the Yellow River Basin in China. J. Clean. Prod. 2024, 475, 143672. [Google Scholar] [CrossRef] [Scilit]
- Zhou, Q.; Cheng, C.; Fang, Z.; Zhang, H.; Xu, Y. How does the development of the digital economy affect innovation output? Exploring mechanisms from the perspective of regional innovation systems. Struct. Change Econ. Dyn. 2024, 70, 1–17. [Google Scholar] [CrossRef] [Scilit]
- Wang, L.; Shao, J. Digital economy, entrepreneurship and energy efficiency. Energy 2023, 269, 126801. [Google Scholar] [CrossRef] [Scilit]
- Bai, T.; Qi, Y.; Li, Z.; Xu, D. Digital economy, industrial transformation and upgrading, and spatial transfer of carbon emissions: The paths for low-carbon transformation of Chinese cities. J. Environ. Manag. 2023, 344, 118528. [Google Scholar] [CrossRef] [Scilit]
- Zhao, Z.; Zhao, Y.; Shi, X.; Zheng, L.; Fan, S.; Zuo, S. Green innovation and carbon emission performance: The role of digital economy. Energy Policy 2024, 195, 114344. [Google Scholar] [CrossRef] [Scilit]
- Wu, L.; Zhu, C.; Wang, G. The impact of green innovation resilience on energy efficiency: A perspective based on the development of the digital economy. J. Environ. Manag. 2024, 355, 120424. [Google Scholar] [CrossRef] [Scilit]
- Zhao, Y.; Zhao, Z.; Qian, Z.; Zheng, L.; Fan, S.; Zuo, S. Is cooperative green innovation better for carbon reduction? Evidence from China. J. Clean. Prod. 2023, 394, 136400. [Google Scholar] [CrossRef] [Scilit]
- Liu, Y.; Wang, H.; Pang, B.; Zhao, S. Capital investment, digital economy and innovation of high-tech industries. Int. Rev. Financ. Anal. 2024, 96, 103761. [Google Scholar] [CrossRef] [Scilit]
- Qin, T.; Qin, C.; Wang, J.; Xing, H. Can the digital economy enhance enterprises’ breakthrough innovation? Int. Rev. Financ. Anal. 2025, 104, 104269. [Google Scholar] [CrossRef] [Scilit]
- Rahman, A.M.; Pan, X.; Li, B.; Wu, J. The effects of digital economy development on social insurance funds revenue: Evidence from China. PLoS ONE 2024, 19, e0303897. [Google Scholar] [CrossRef] [Scilit]
- Du, C.; Ouyang, Y.; Yang, Q.; Shi, Z. The impact of digital economy on household private insurance participation. Int. Rev. Econ. Financ. 2024, 95, 103456. [Google Scholar] [CrossRef] [Scilit]
- Qu, Y.; Fan, S. Is there a “Machine Substitution”? How does the digital economy reshape the employment structure in emerging market countries. Econ. Syst. 2024, 48, 101237. [Google Scholar] [CrossRef] [Scilit]
- Wu, B.; Yang, W. Empirical test of the impact of the digital economy on China’s employment structure. Financ. Res. Lett. 2022, 49, 103047. [Google Scholar] [CrossRef] [Scilit]
- Chen, K.; Ding, Z.; Tao, Q.; Fu, R.; Zhu, W. Analysis of the Coupled Coordination of Digital Economy and Public Health Services in China and Its Influencing Factors. Risk Manag. Healthc. Policy 2025, 18, 1651–1668. [Google Scholar] [CrossRef] [Scilit]
- Cong, S.; Chin, L.; Muhamad Senan, M.K.A.; Song, Y. The Impact of the Digital Economy on Urban House Prices: Comprehensive Explorations. Int. J. Strateg. Prop. Manag. 2024, 28, 163–176. [Google Scholar] [CrossRef] [Scilit]
- Dian, J.; Song, T.; Li, S. Facilitating or inhibiting? Spatial effects of the digital economy affecting urban green technology innovation. Energy Econ. 2024, 129, 107223. [Google Scholar] [CrossRef] [Scilit]
- Al-Husain, R.A.; Jasim, T.A.; Mathew, V.; Al-Romeedy, B.S.; Khairy, H.A.; Mahmoud, H.A.; Liu, S.; El-Meligy, M.A.; Alsetoohy, O. Optimizing sustainability performance through digital dynamic capabilities, green knowledge management, and green technology innovation. Sci. Rep. 2025, 15, 24217. [Google Scholar] [CrossRef] [Scilit] [PubMed]
- Qi, L.; Yang, L.; Ta, M. The impact of digital economy on regional resource allocation efficiency: An analysis based on resource flow speed and direction. Financ. Res. Lett. 2025, 82, 107644. [Google Scholar] [CrossRef] [Scilit]
- Liang, S.; Tan, Q. Can the digital economy accelerates China’s export technology upgrading? Based on the perspective of export technology complexity. Technol. Forecast. Soc. Change 2024, 199, 123052. [Google Scholar] [CrossRef] [Scilit]
- Zhong, H.; Wang, X. Spatial mobility of China’s population in the digital economy. J. Asian Econ. 2025, 99, 101941. [Google Scholar] [CrossRef] [Scilit]
- Zhu, X.; Chen, H.; Xiang, E.; Qi, Y. Digital transformation and corporate green technology transfer: The moderating effect of executive green cognition. Financ. Res. Lett. 2025, 76, 107035. [Google Scholar] [CrossRef] [Scilit]
- Liu, Z.; Liu, B.; Luo, H.; Chen, S. Digital economy and fiscal decentralization: Drivers of green innovation in China. Heliyon 2024, 10, e33870. [Google Scholar] [CrossRef] [Scilit]
- Zhong, S.; Zhang, X.; Zhang, L.; Zhao, C. How does digital economy influence urban common prosperity? Evidence from China’s demonstration area for common prosperity. Int. Rev. Econ. Financ. 2025, 104, 104629. [Google Scholar] [CrossRef] [Scilit]
- Kramer, A.D.I. An Unobtrusive Behavioral Model of “Gross National Happiness”; Association for Computing Machinery: New York, NY, USA, 2010; pp. 287–290. [Google Scholar]
- Cheng, L.; Mi, Z.; Wei, Y.-M.; Wang, S.; Hubacek, K. Dirty skies lower subjective well-being. J. Clean. Prod. 2022, 378, 134380. [Google Scholar] [CrossRef] [Scilit]
- Tang, X.; Chen, N. A multi-scenario urban resilience simulation study based on the system dynamics model. Phys. Chem. Earth Parts A/B/C 2023, 132, 103467. [Google Scholar] [CrossRef] [Scilit]
- Pu, L. Fairness of the Distribution of Public Medical and Health Resources. Front. Public Health 2021, 9, 768728. [Google Scholar] [CrossRef] [Scilit]
- Peng, X.; Yan, S.; Yan, X. Studying whether the digital economy effectively promotes China’s common prosperity based on the spatial Durbin model. Humanit. Soc. Sci. Commun. 2024, 11, 1655. [Google Scholar] [CrossRef] [Scilit]
- Wen, L.; Wang, A. System dynamics model of Beijing urban public transport carbon emissions based on carbon neutrality target. Environ. Dev. Sustain. 2022, 25, 12681–12706. [Google Scholar] [CrossRef] [Scilit]
- Wang, D.; Zhu, Z.; Chen, S.; Luo, X.R. Running out of steam? A political incentive perspective of FDI inflows in China. J. Int. Bus. Stud. 2021, 52, 692–717. [Google Scholar] [CrossRef] [Scilit]
- Zhang, C.; Zhao, Z.; Wang, Q.; Xu, B. Title: Holistic governance strategy to reduce carbon intensity. Technol. Forecast. Soc. Change 2022, 179, 121600. [Google Scholar] [CrossRef] [Scilit]
- Li, G.; Wang, L. Study of regional variations and convergence in ecological resilience of Chinese cities. Ecol. Indic. 2023, 154, 110667. [Google Scholar] [CrossRef] [Scilit]
- Liu, N.; Wang, Y. Urban Agglomeration Ecological Welfare Performance and Spatial Convergence Research in the Yellow River Basin. Land 2022, 11, 2073. [Google Scholar] [CrossRef] [Scilit]
- Zhang, H.; Li, F.; Wei, S.; Jiang, L.; Xiong, J.; Zhang, T. Spatiotemporal evolution characteristics and influencing factors of digital industry in China. Sci. Rep. 2024, 14, 28591. [Google Scholar] [CrossRef] [Scilit]
- Wang, L.; Ye, Z.; Li, C. Coordinated development of the digital economy and environmental quality: Evidence from 285 Chinese cities. Environ. Conserv. 2025, 52, 224–232. [Google Scholar] [CrossRef] [Scilit]
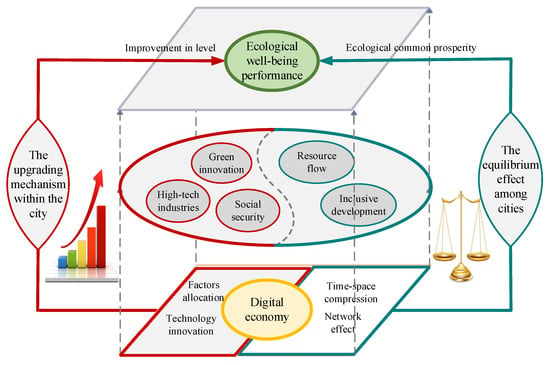
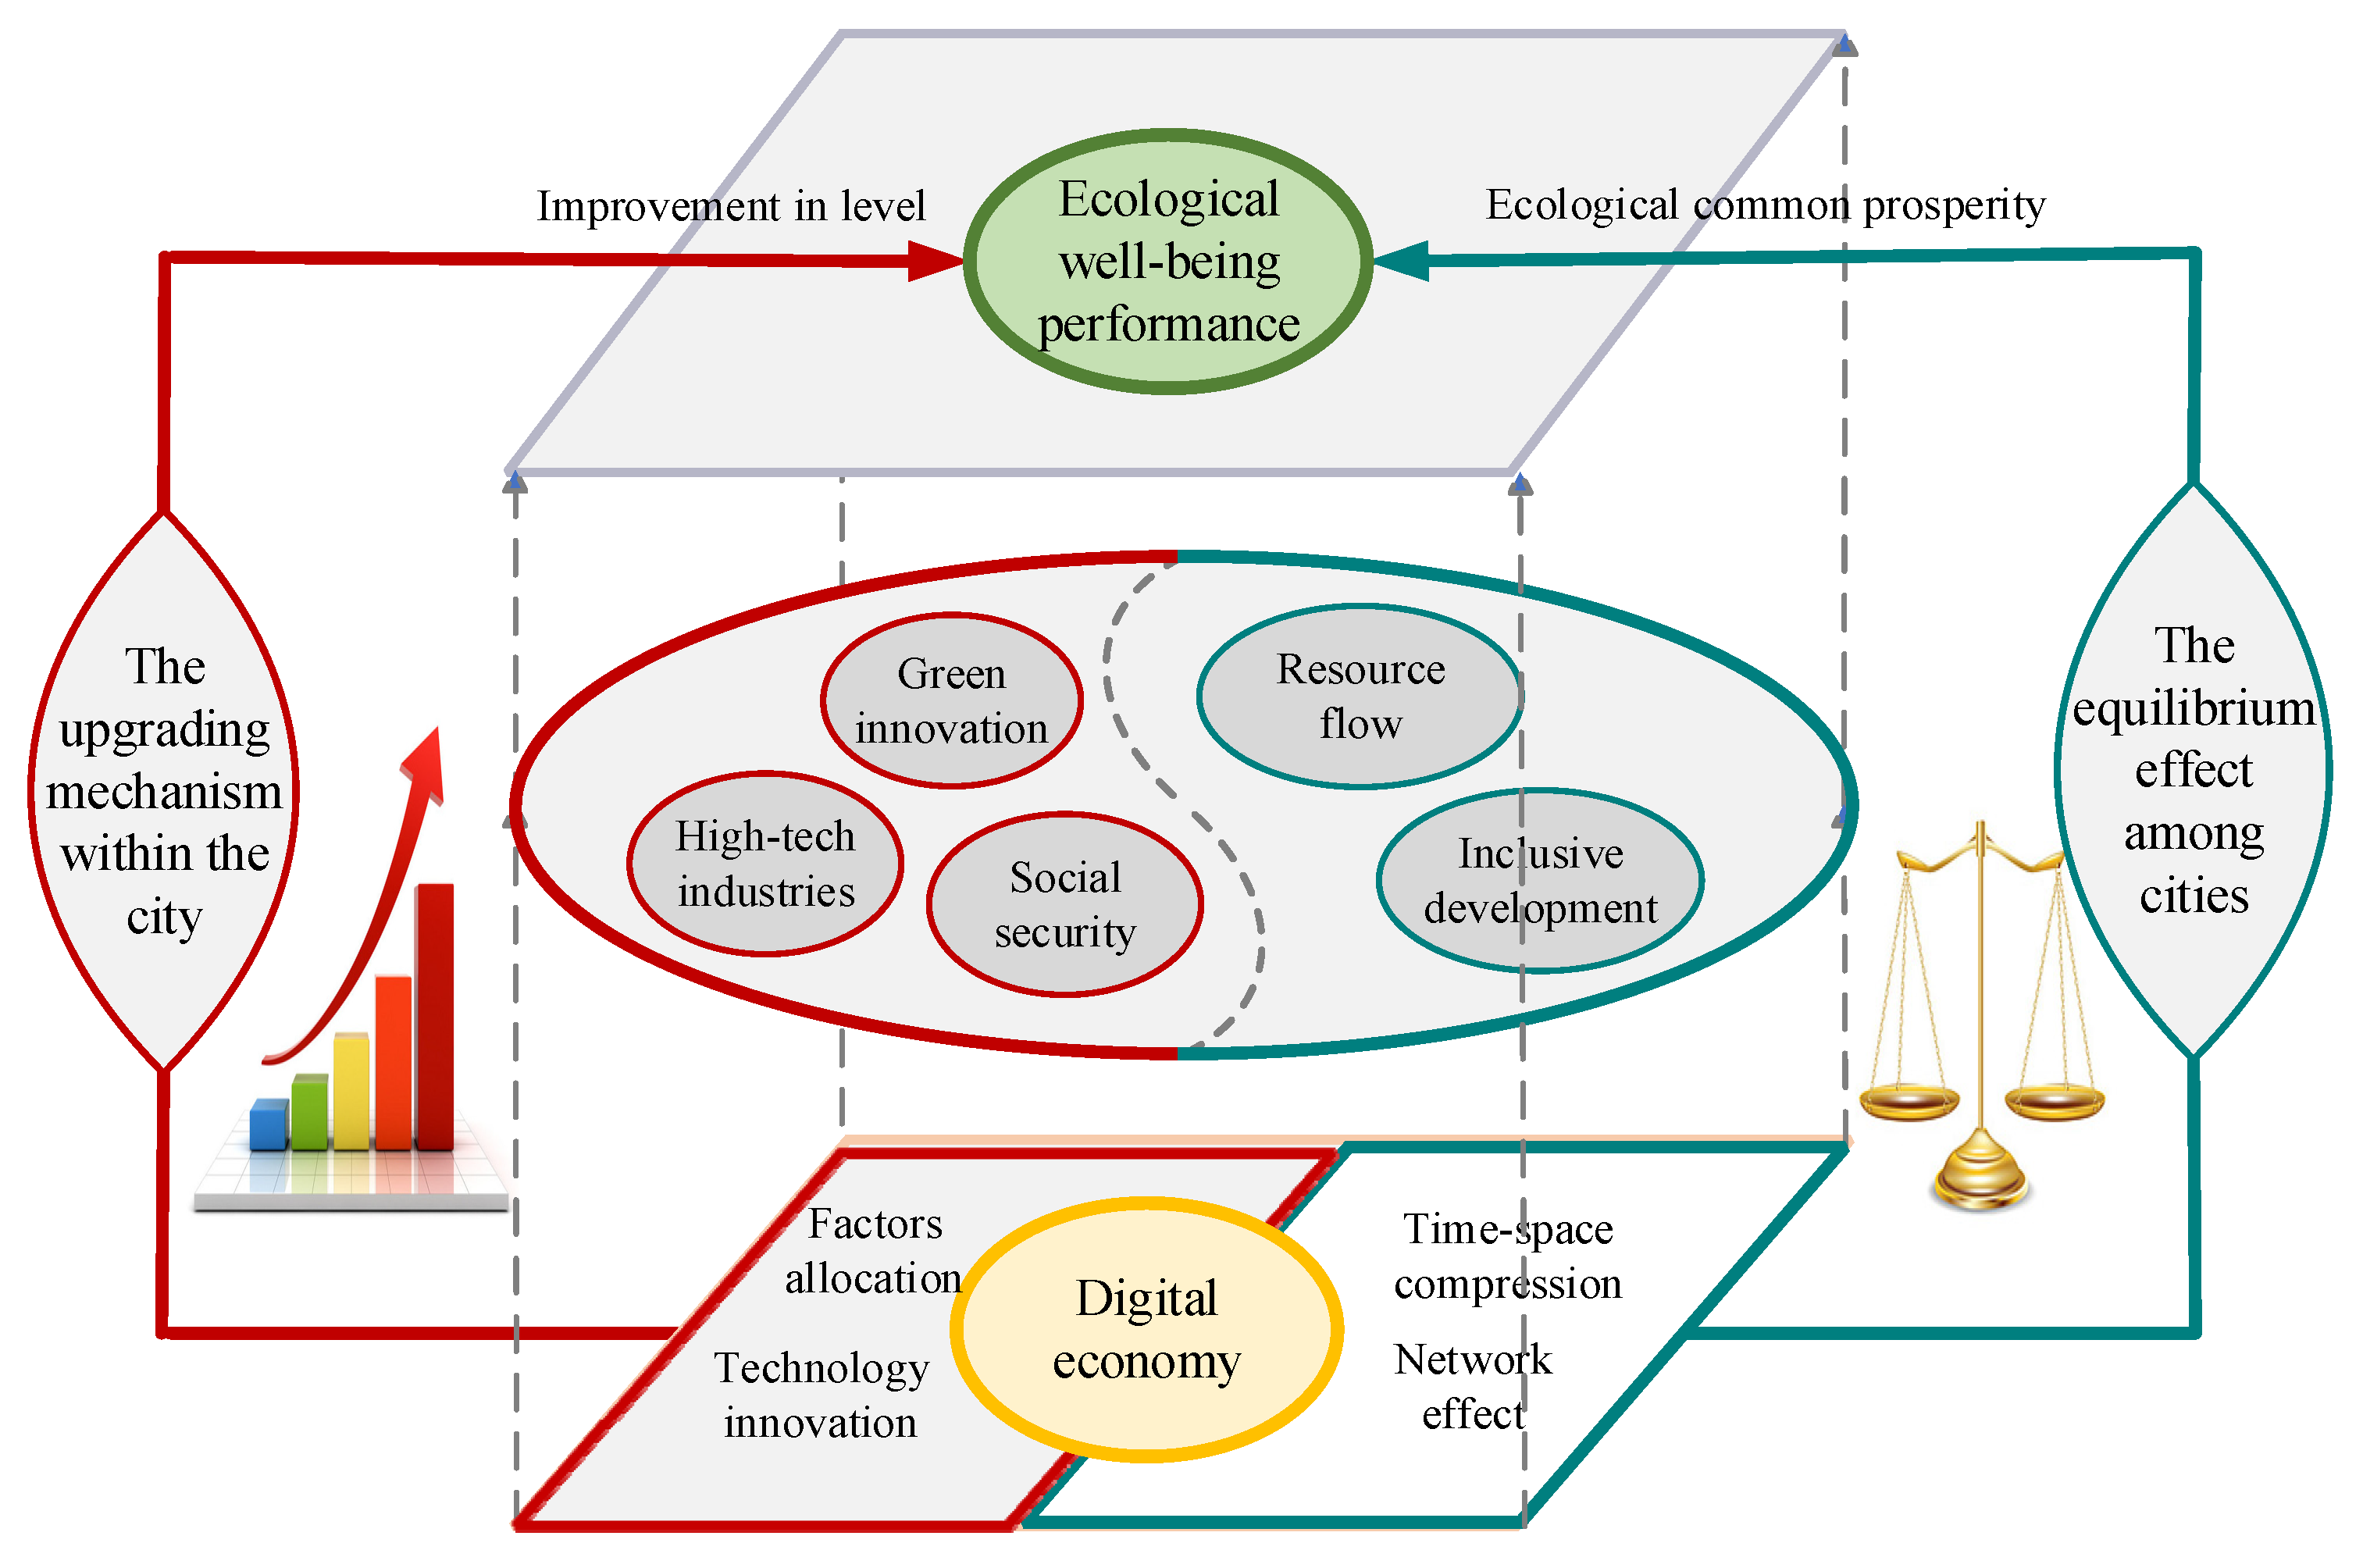
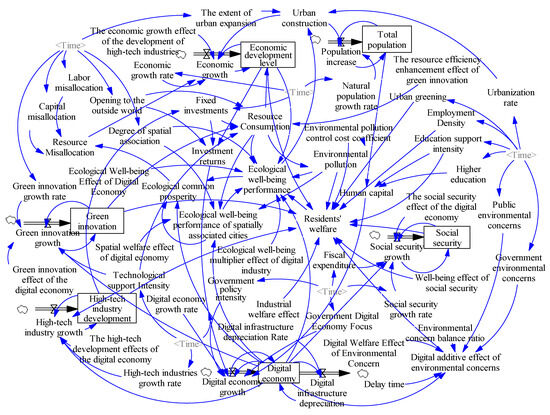
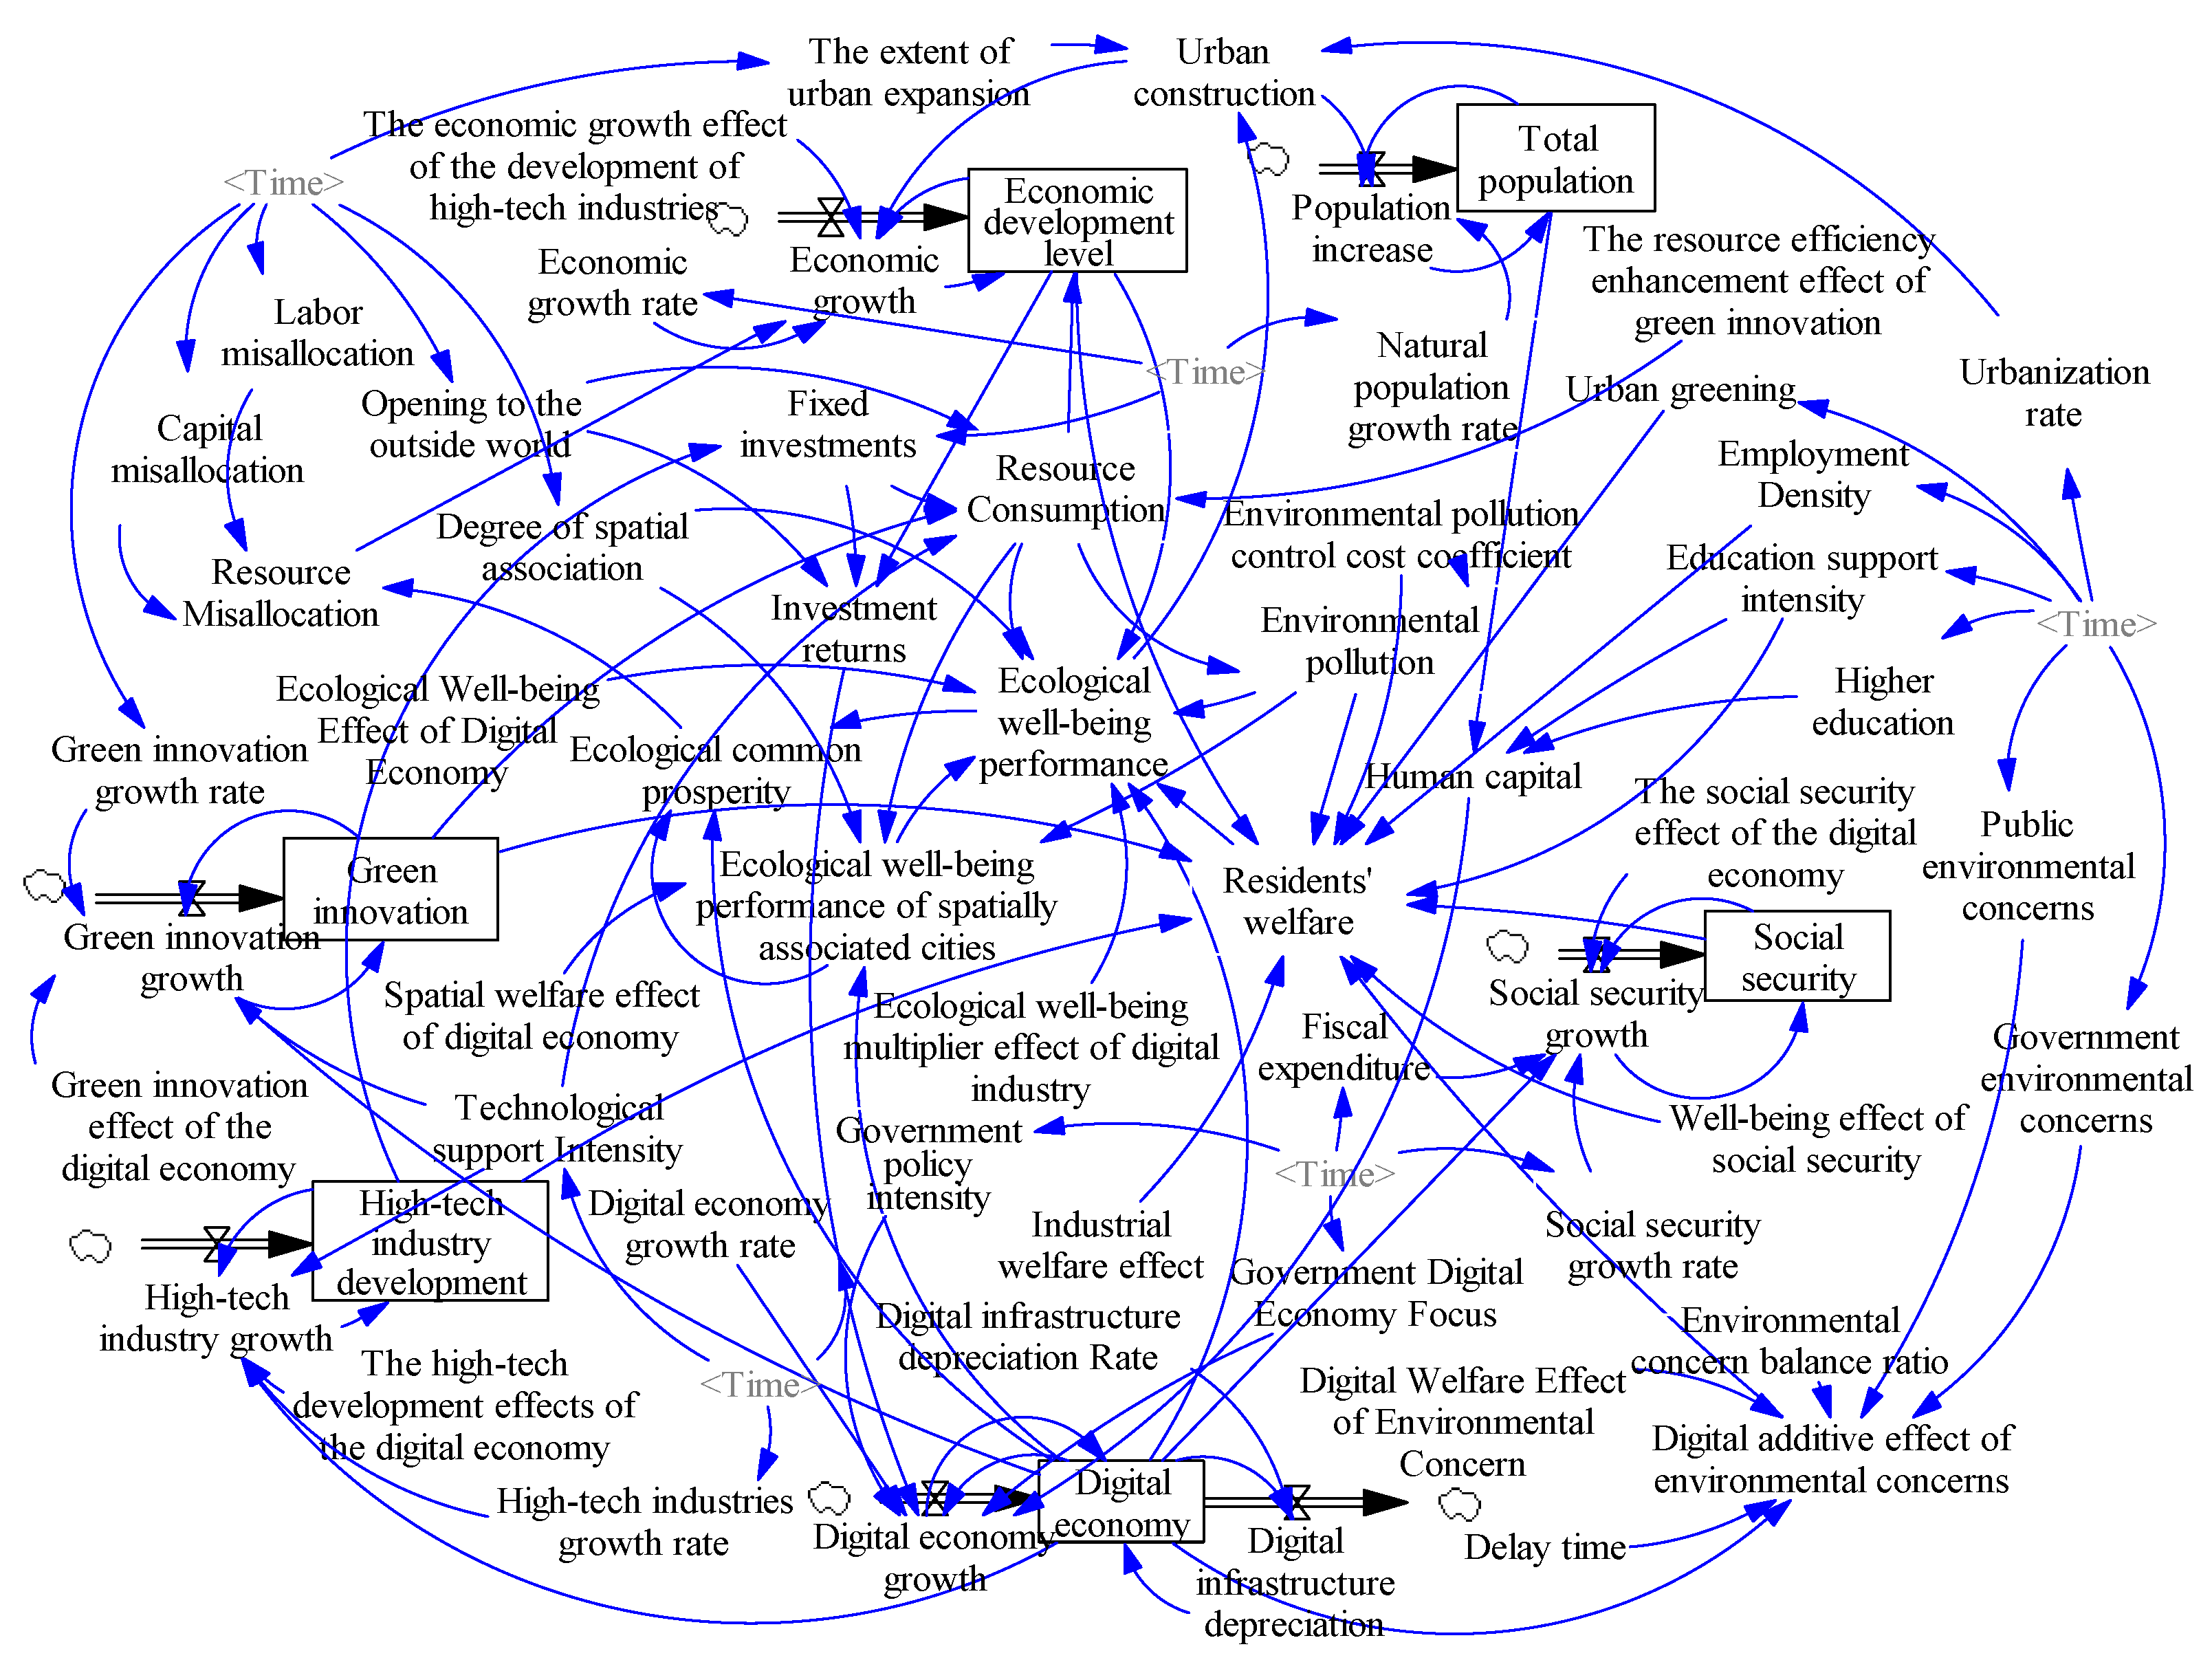
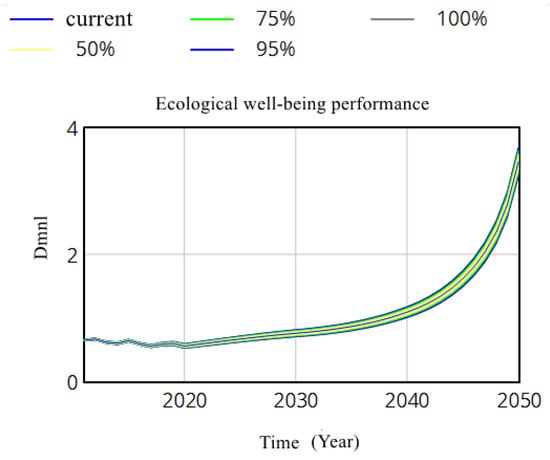
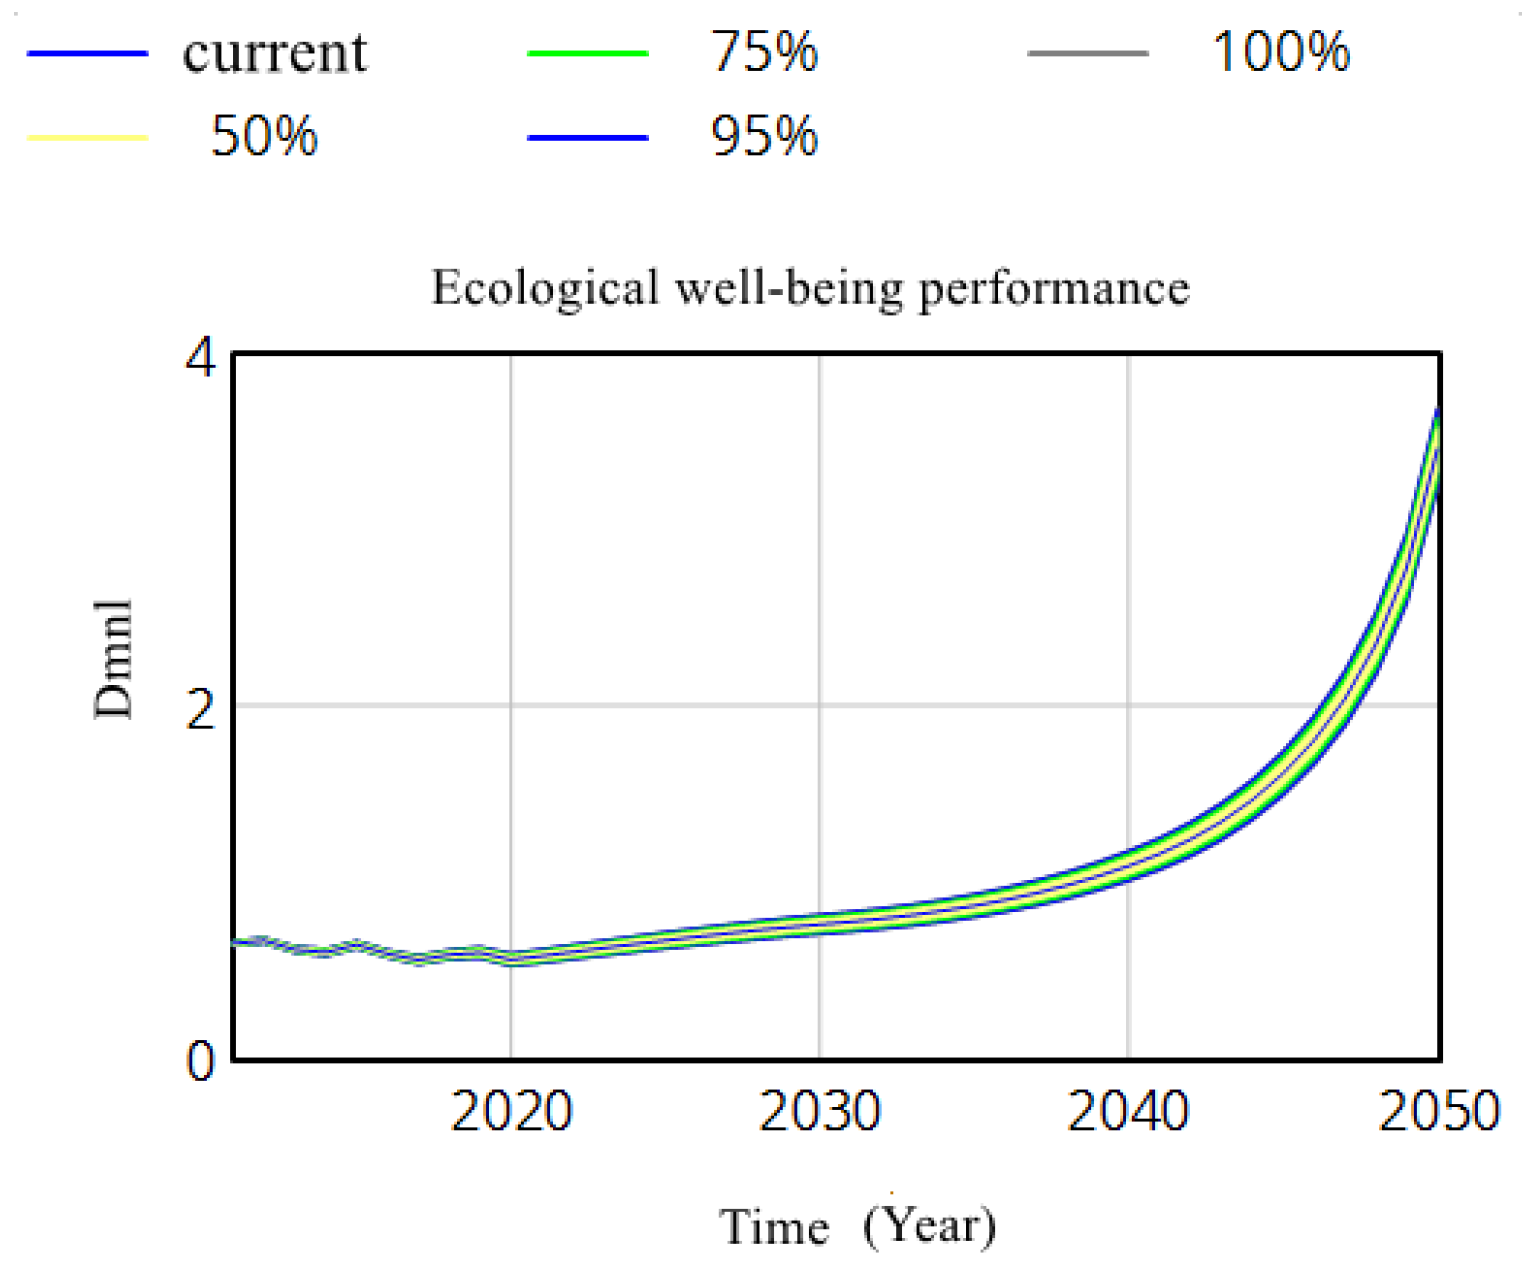
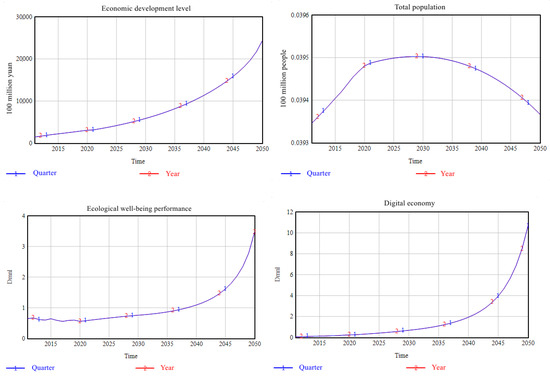
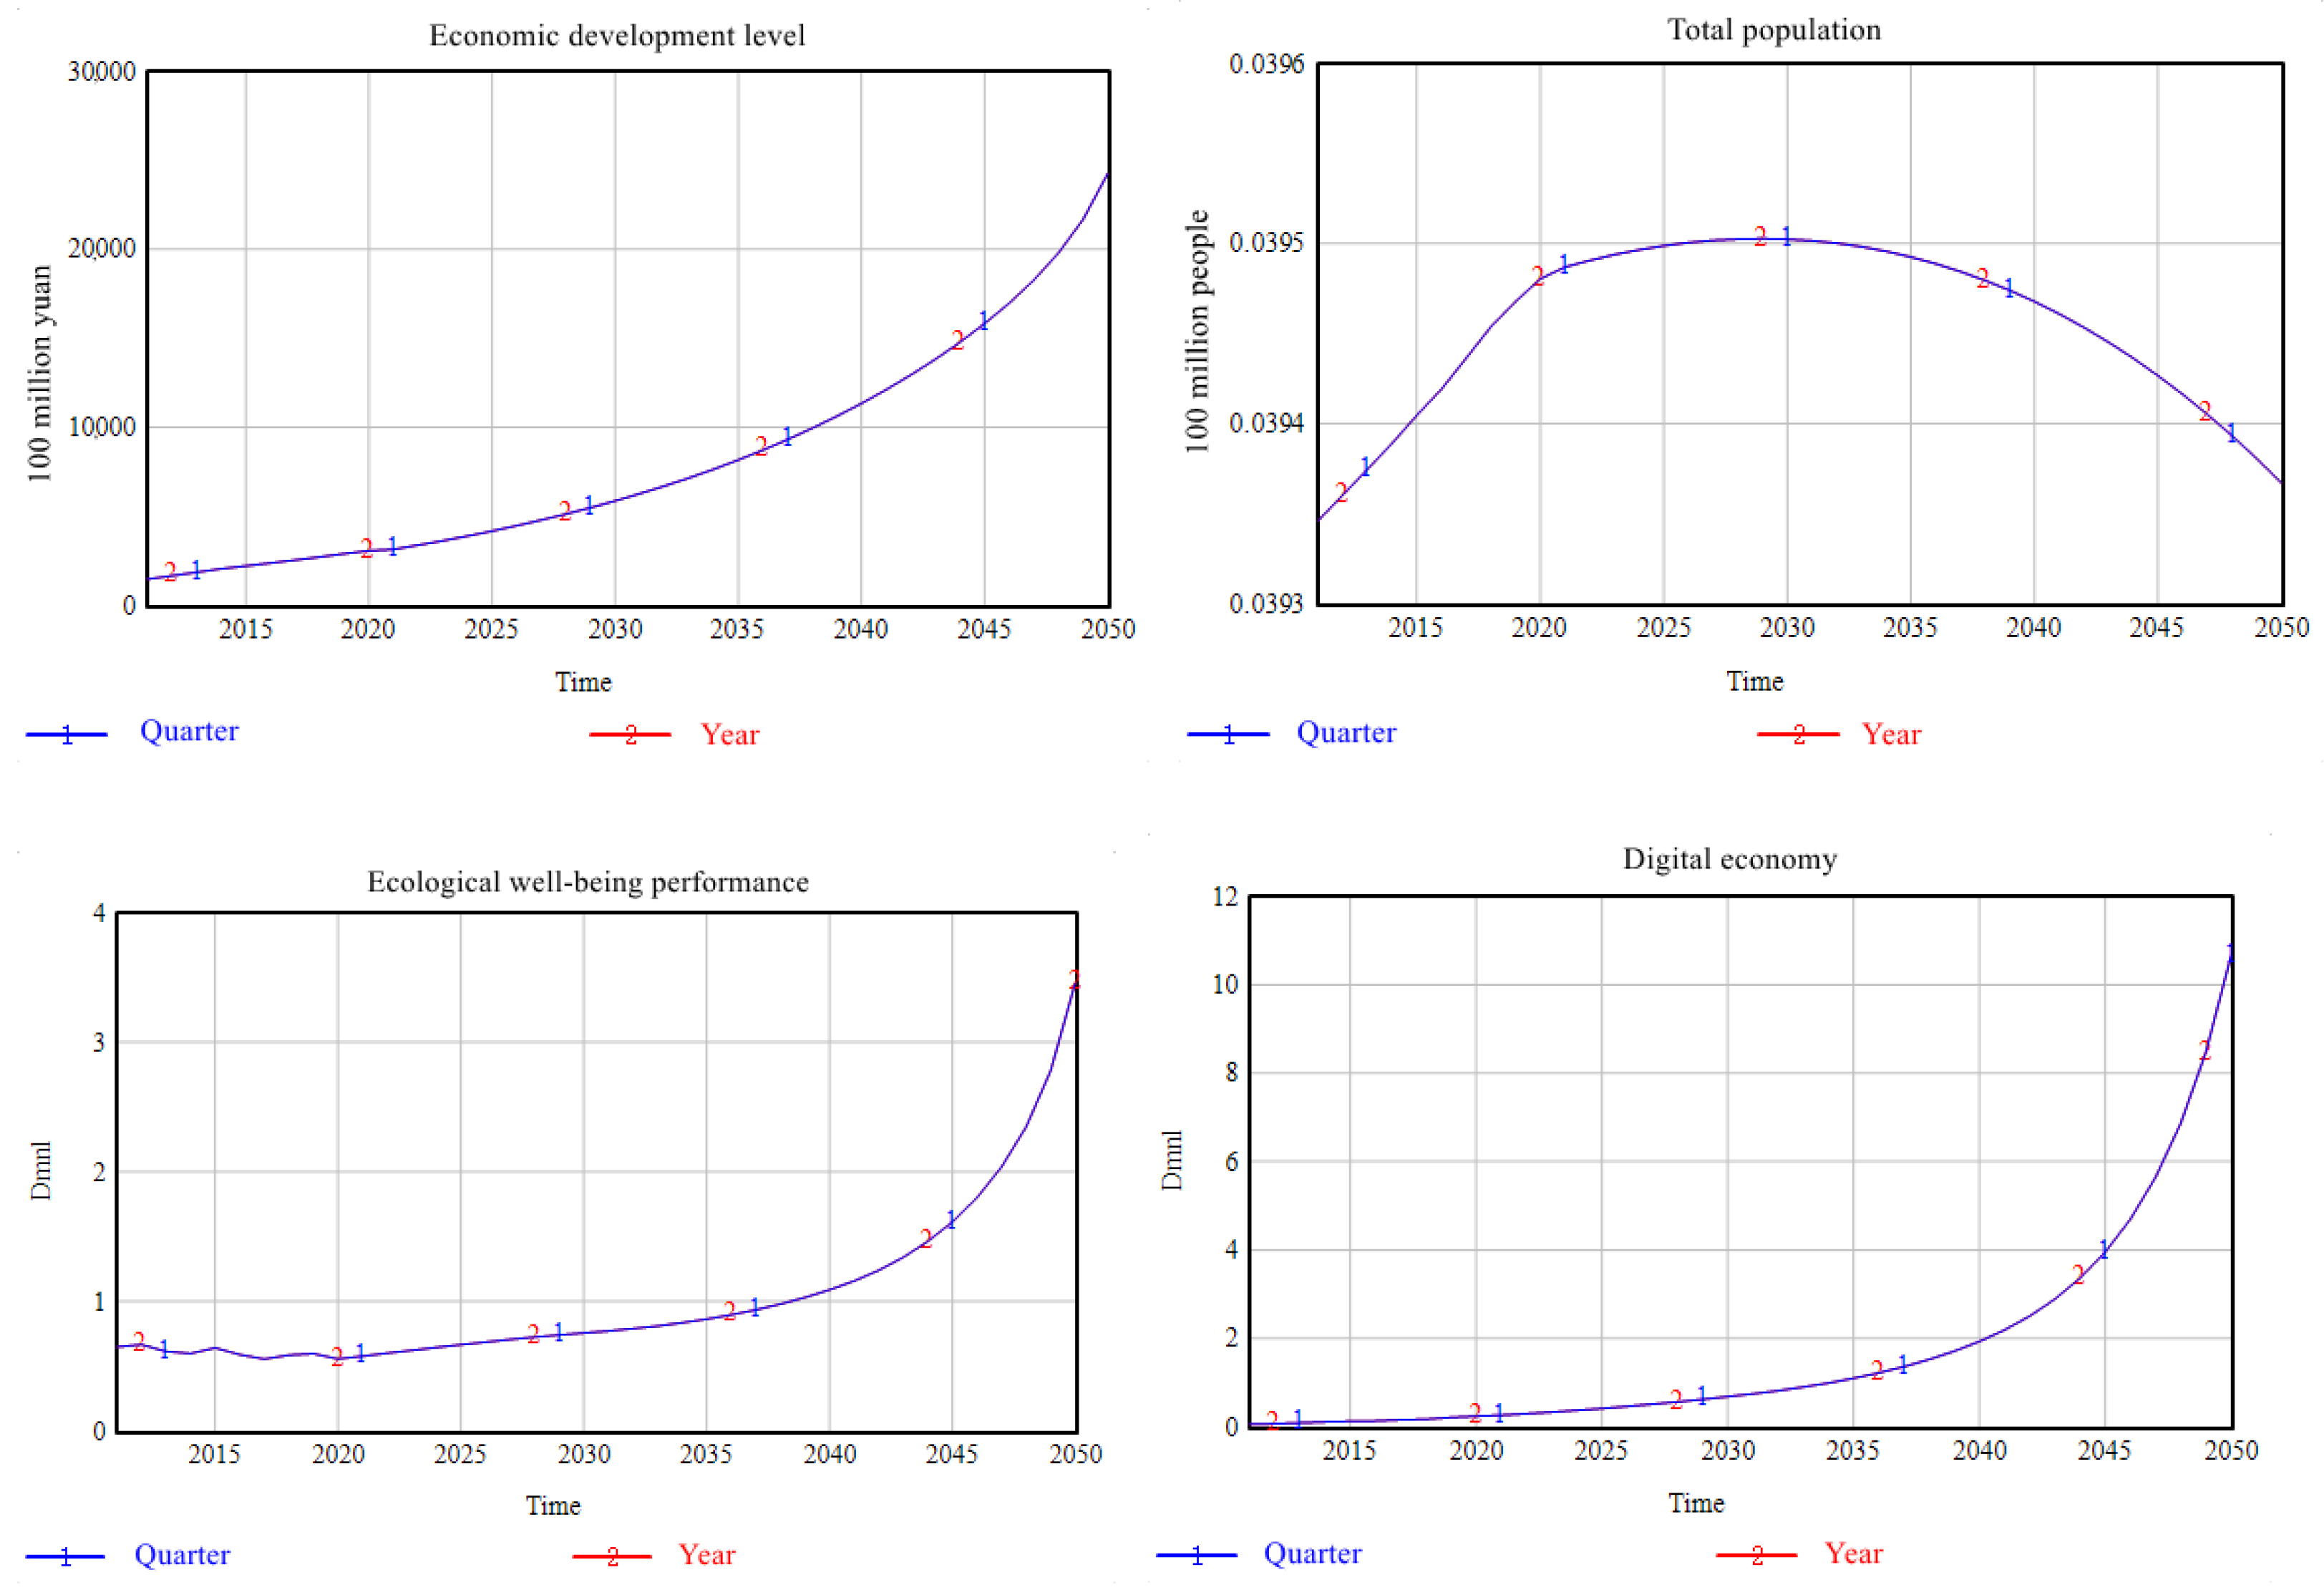
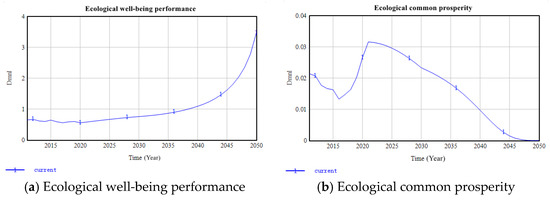
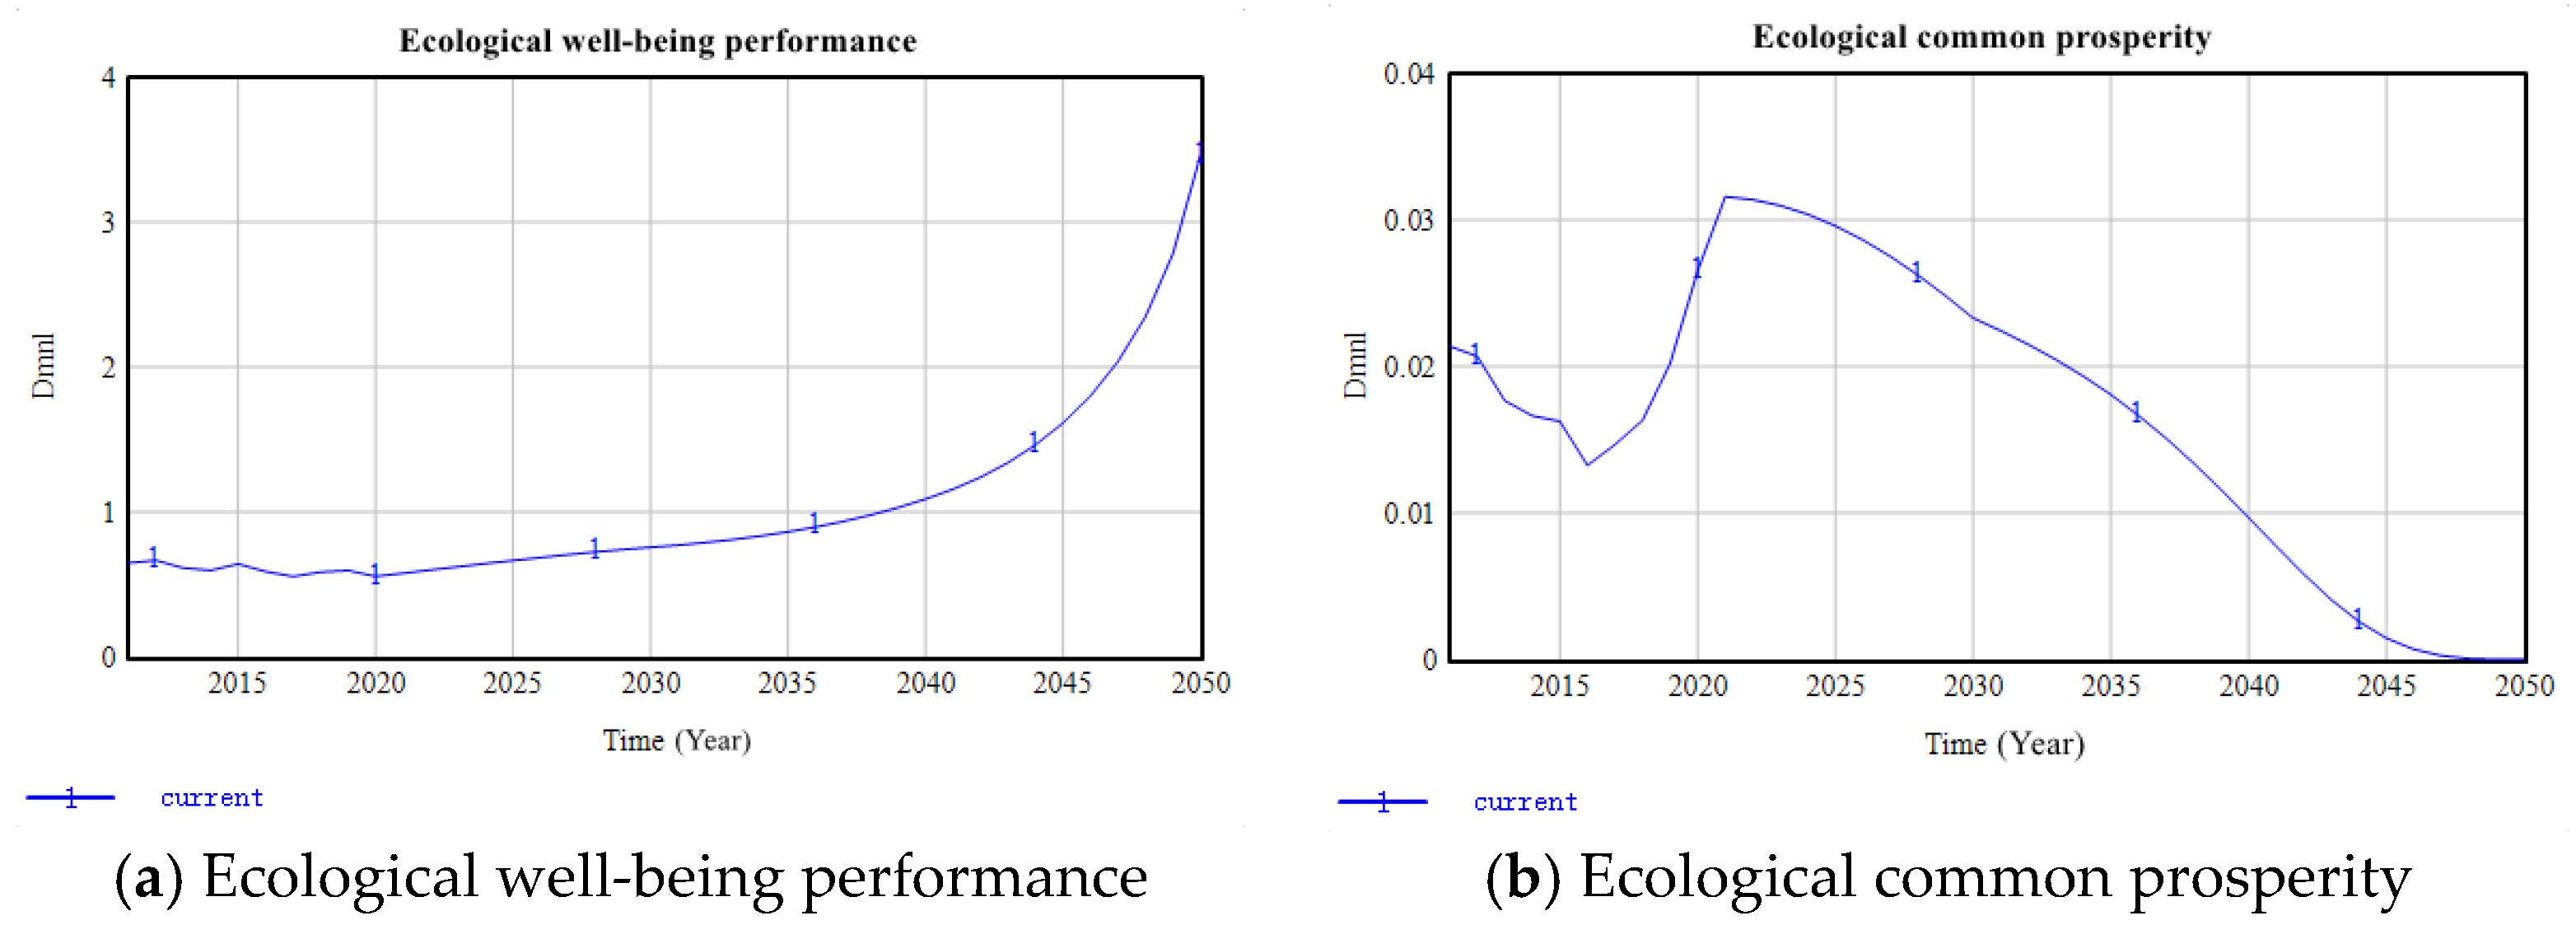
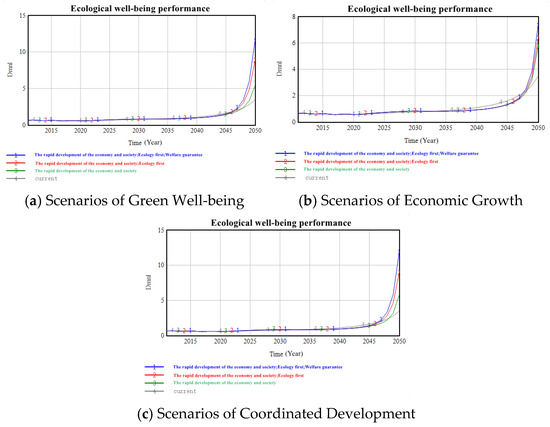
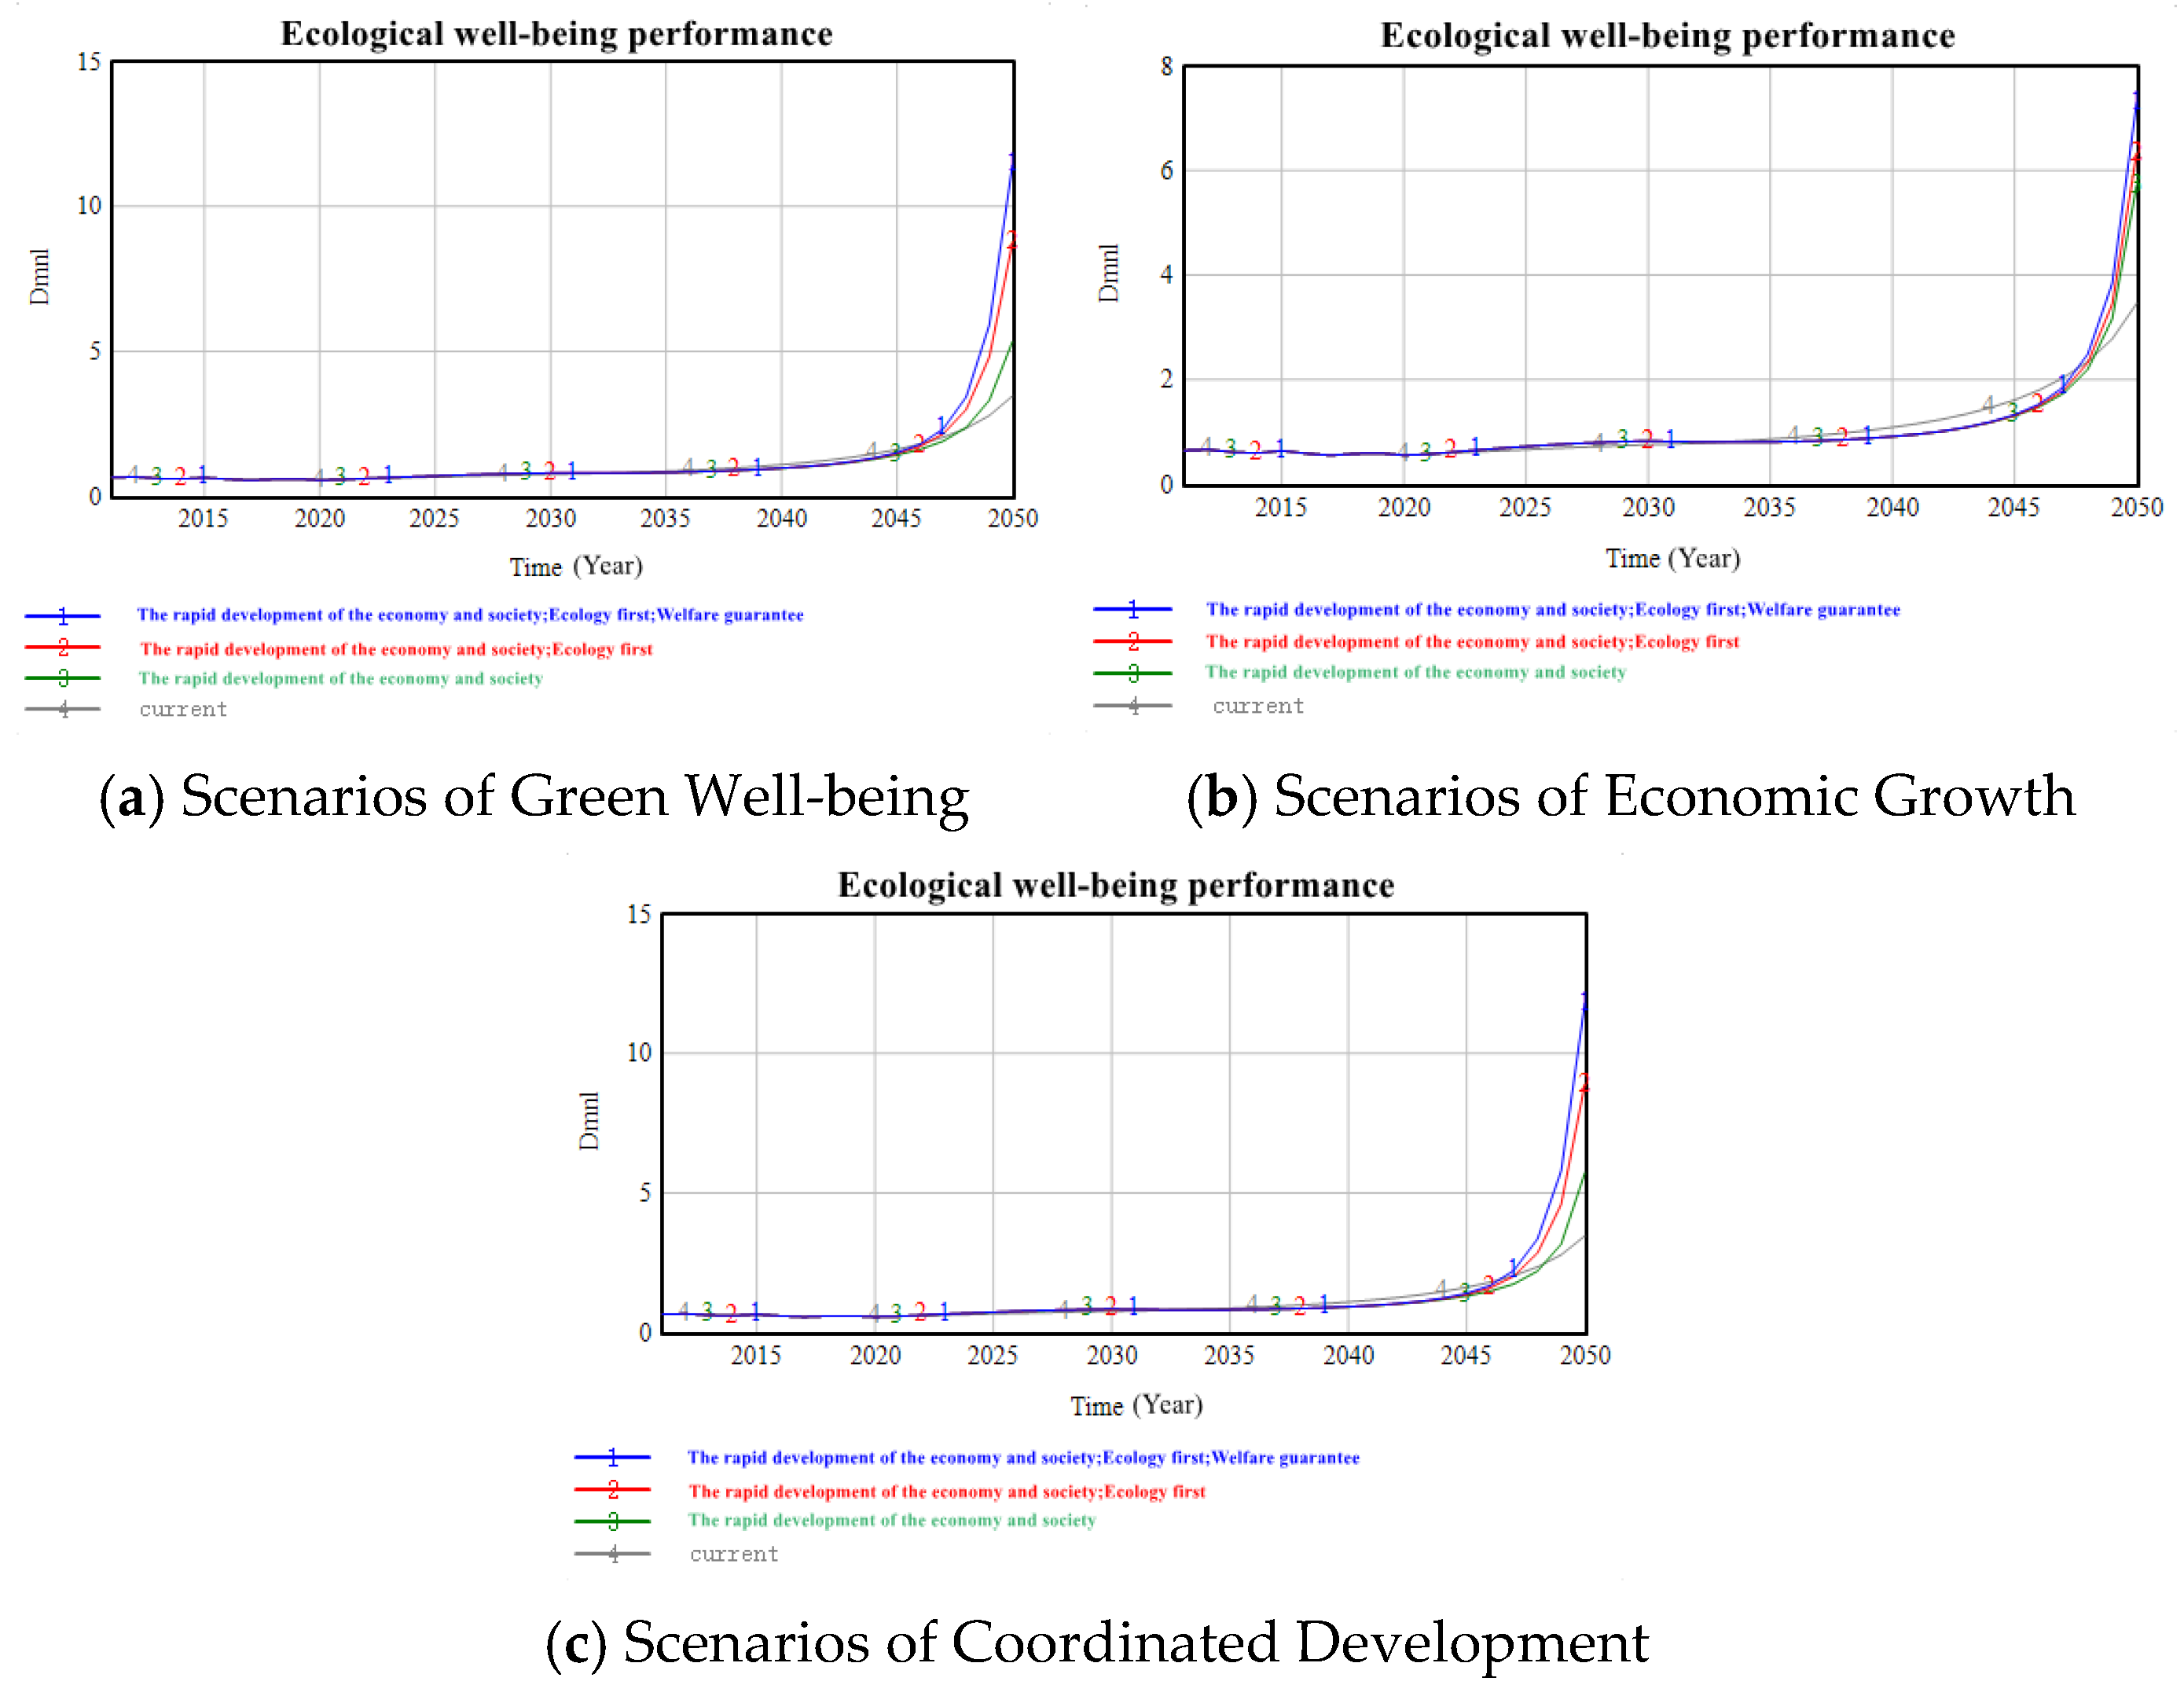
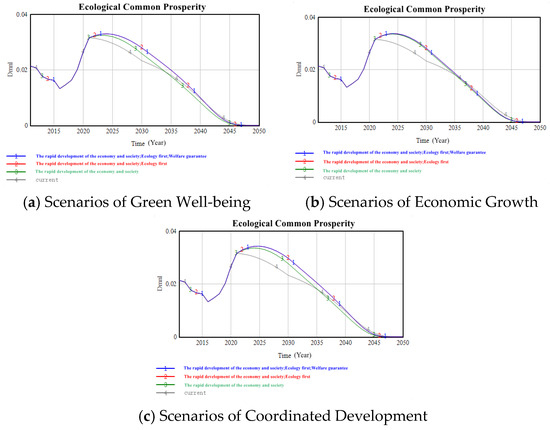
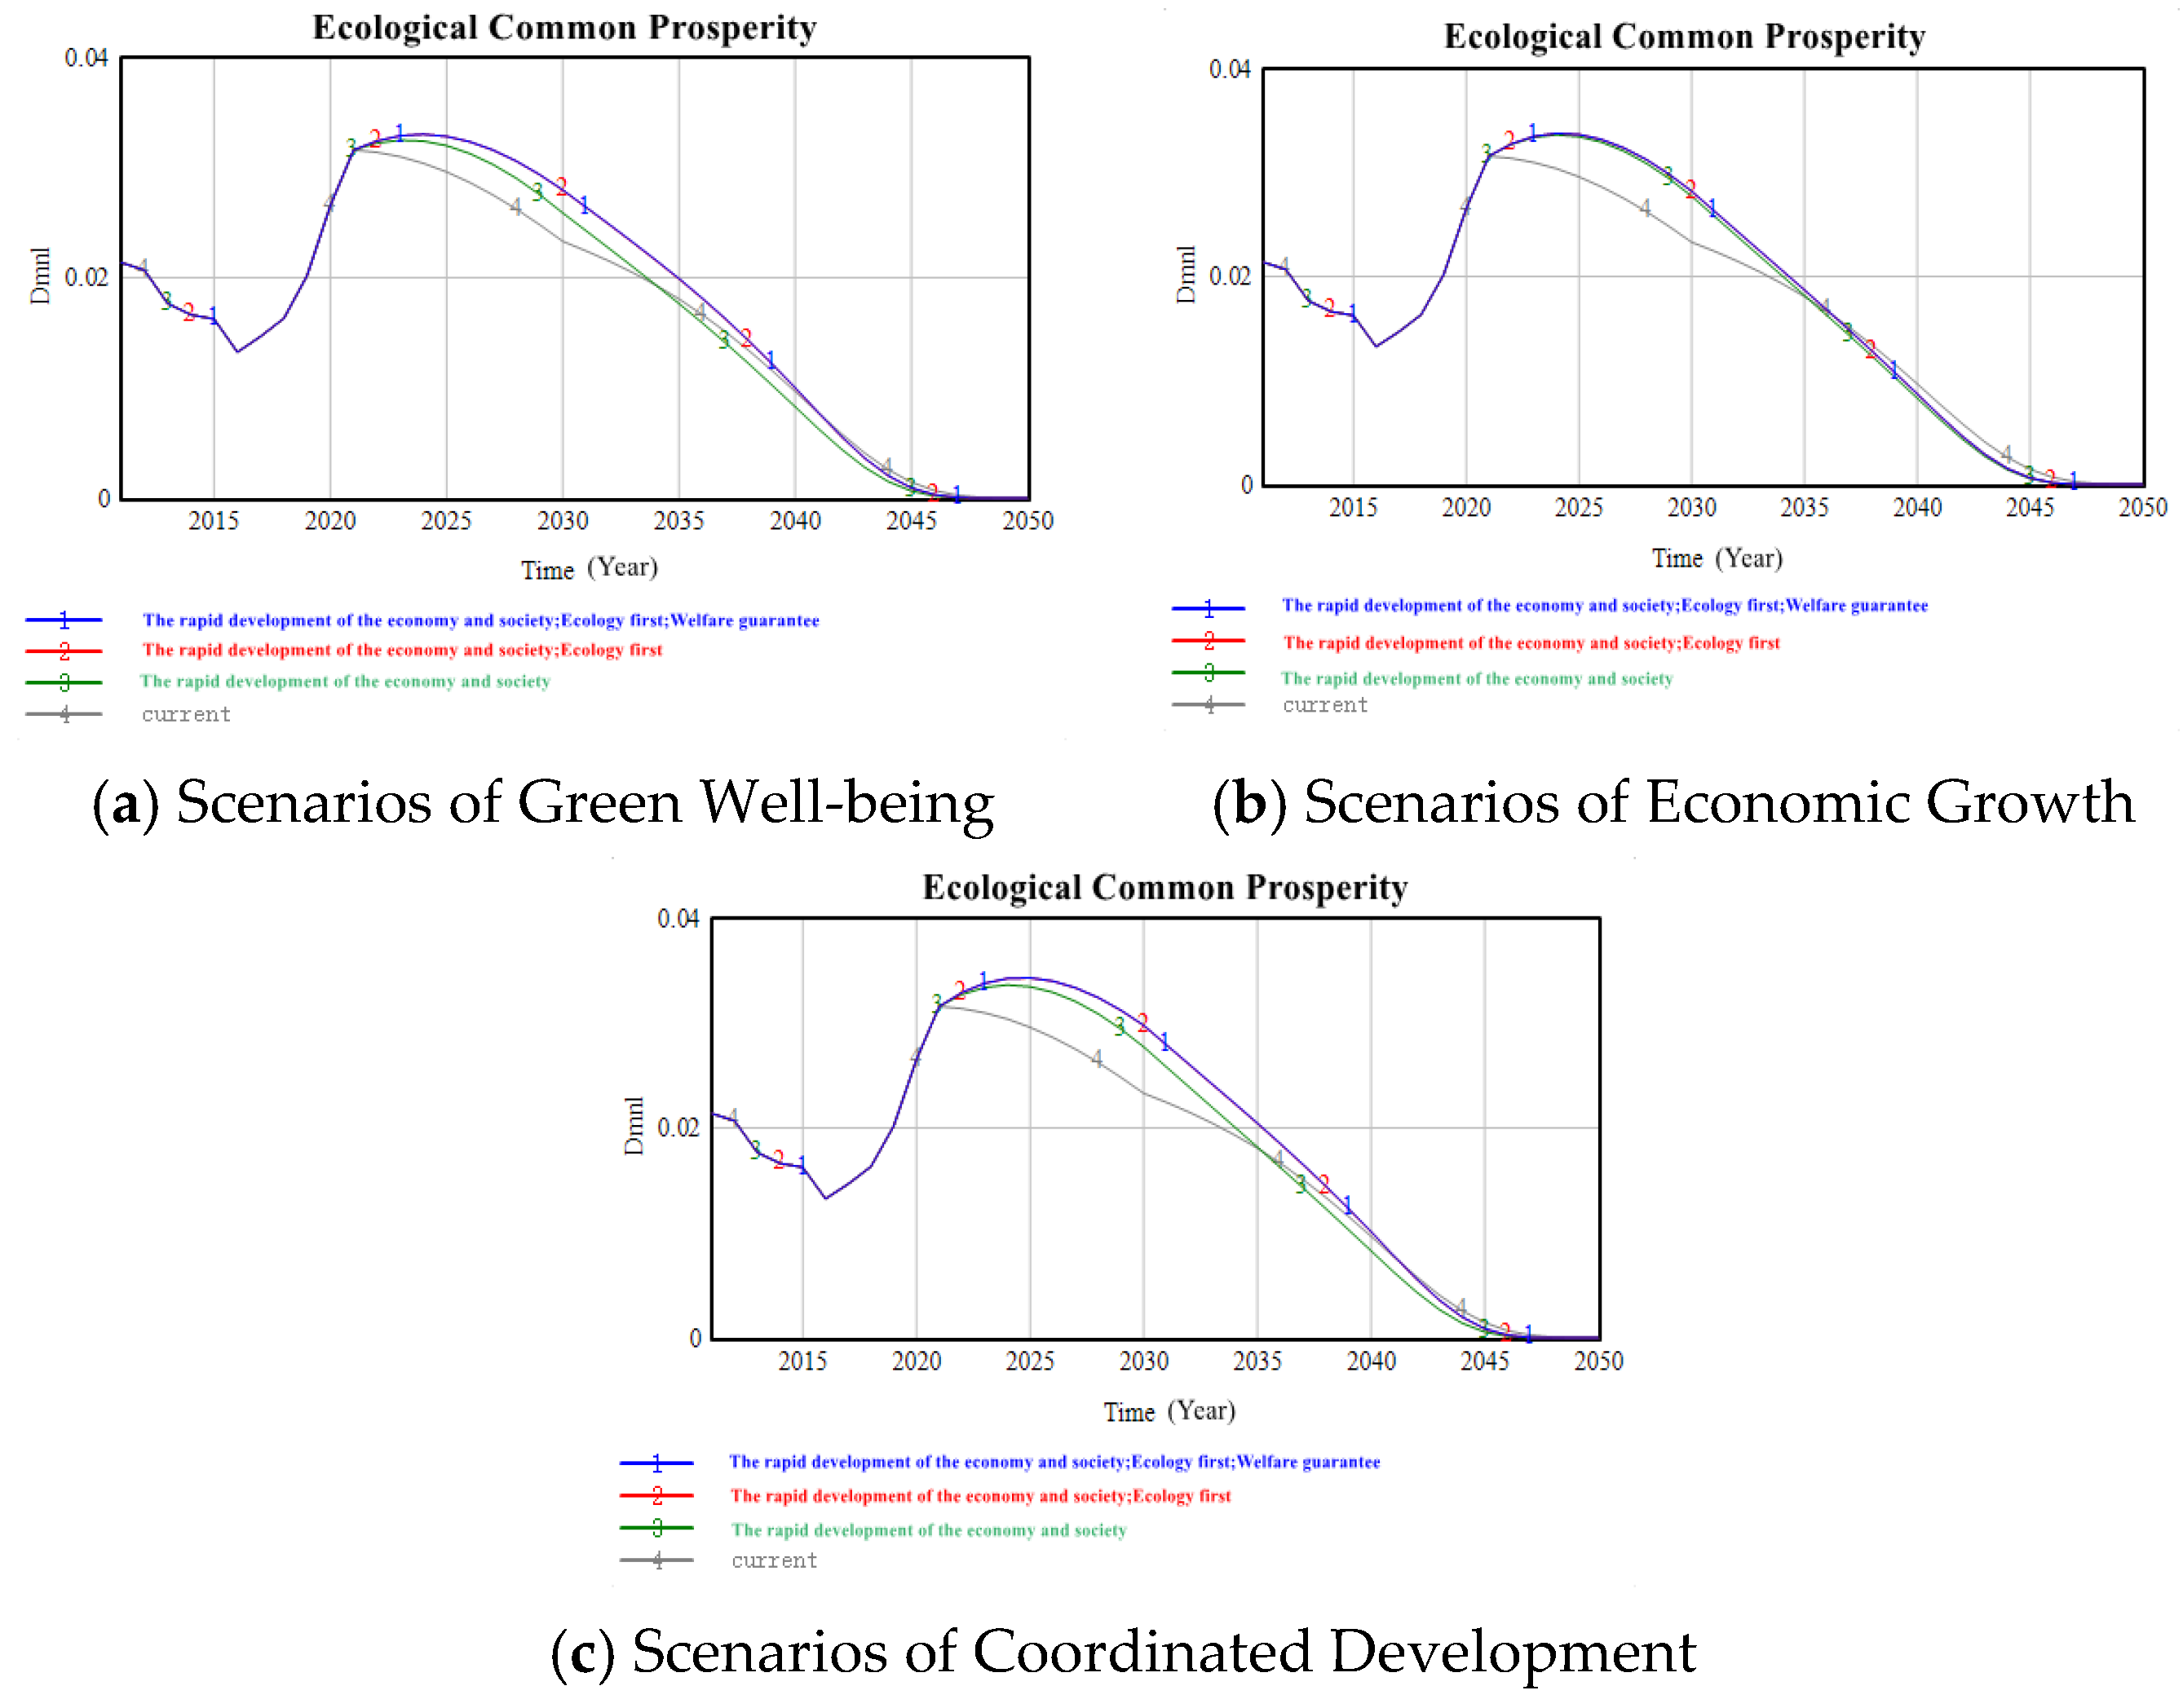
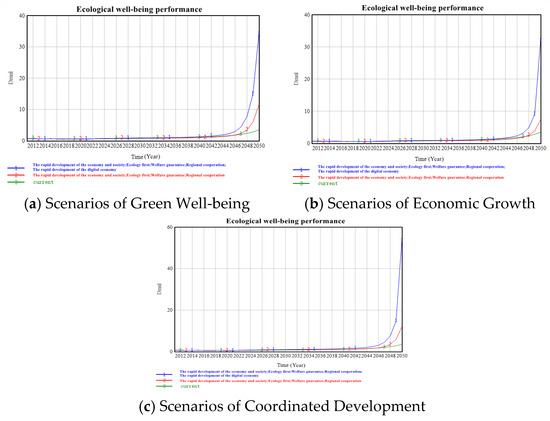
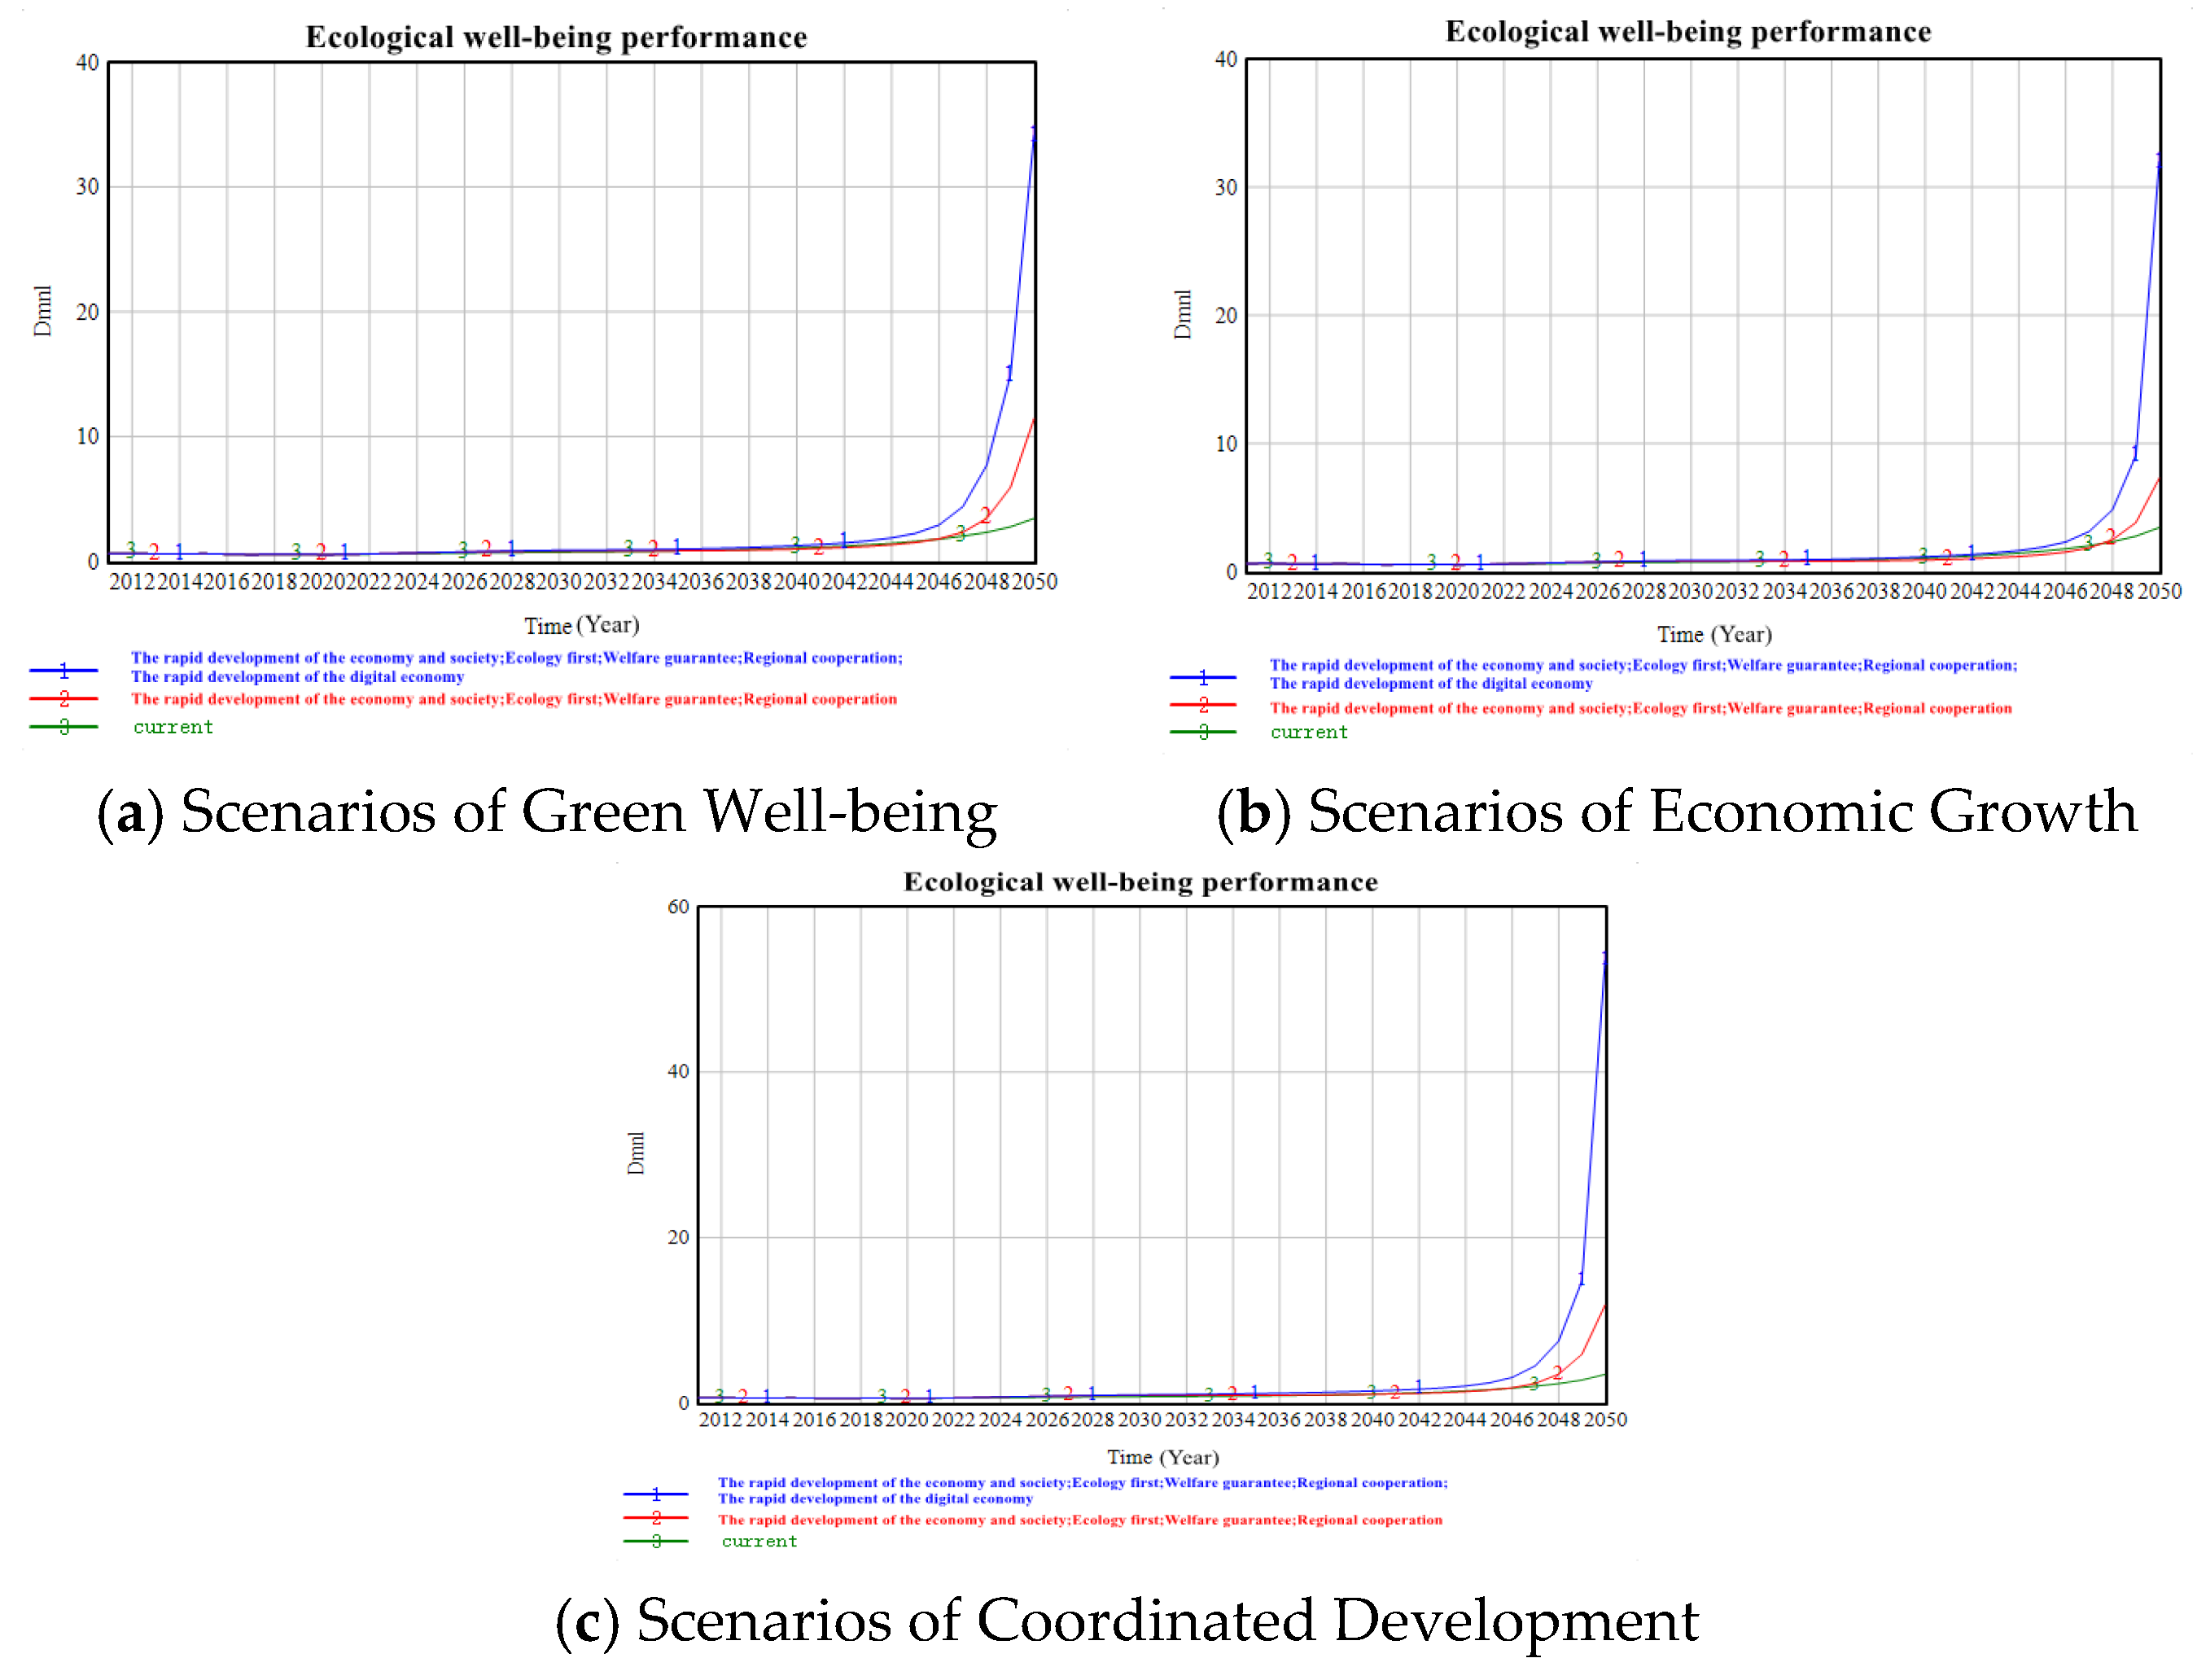
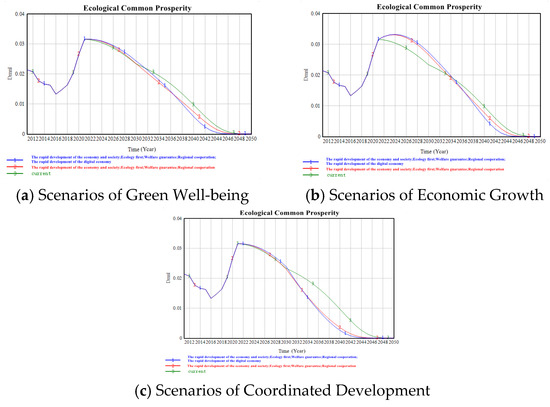
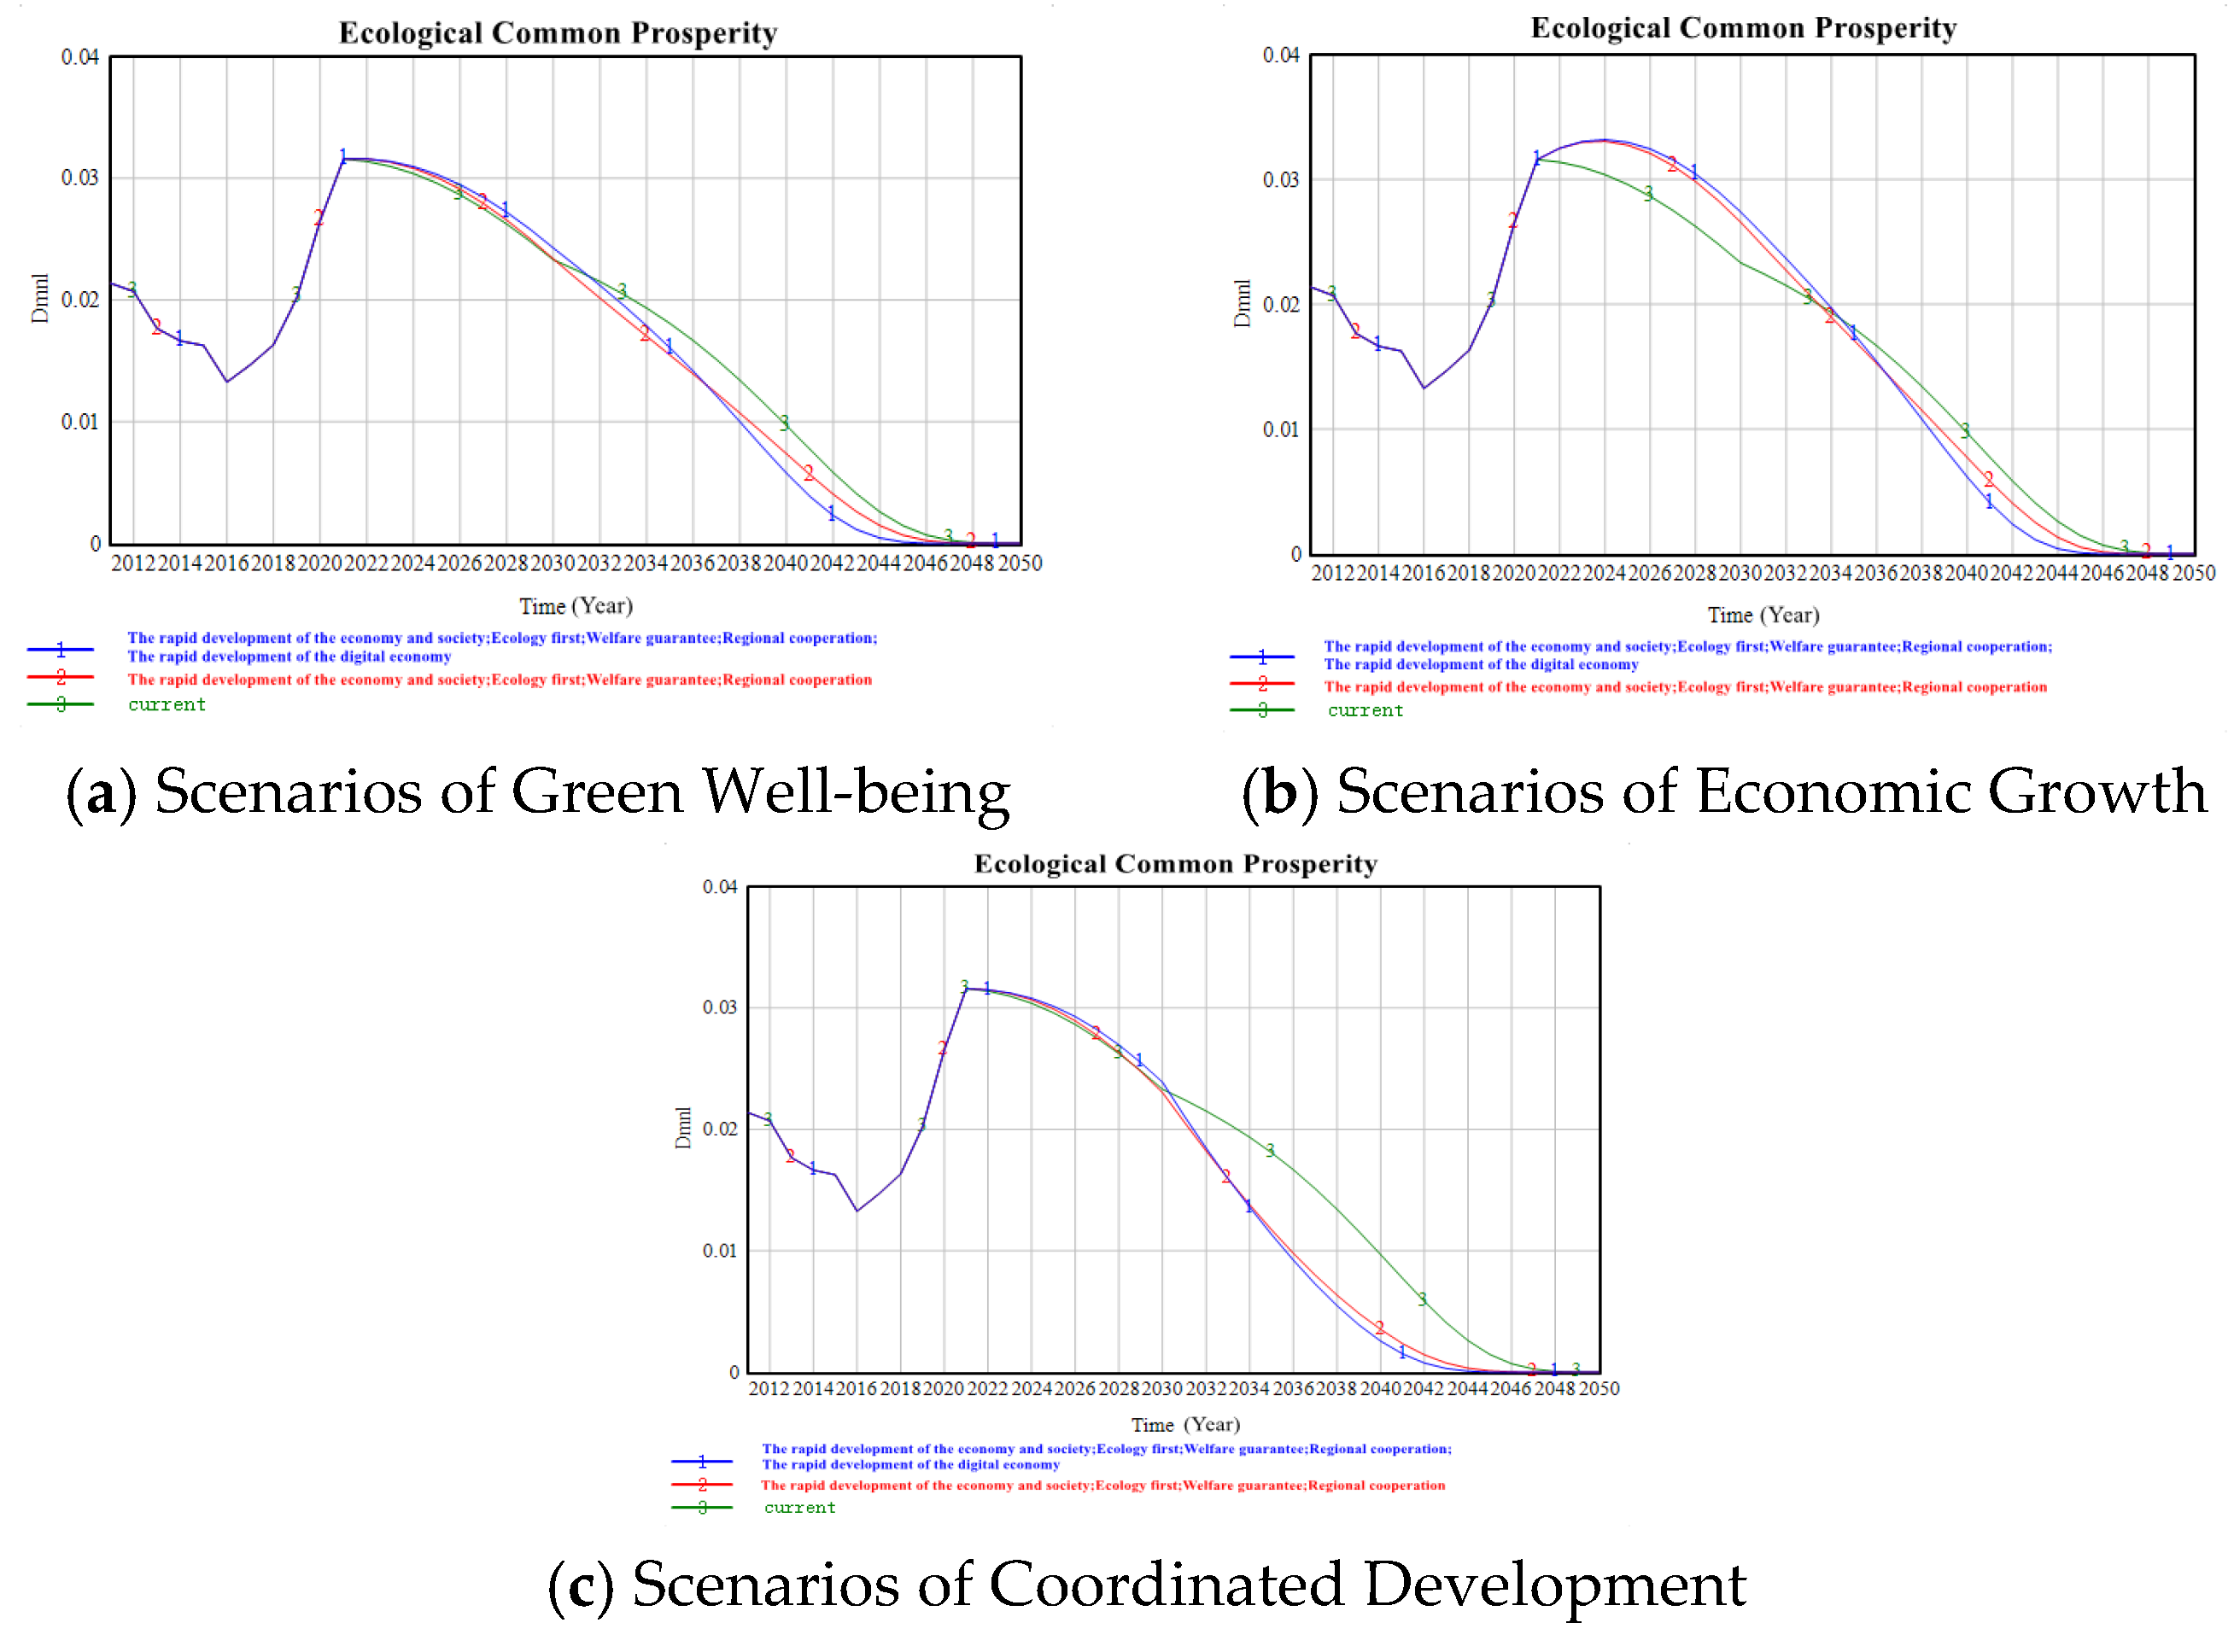
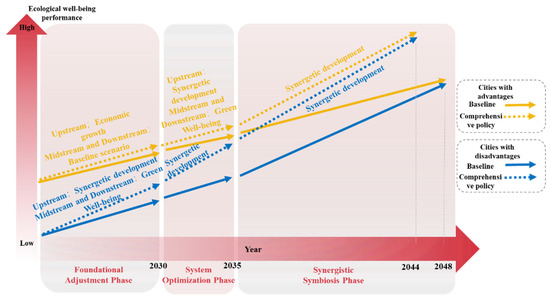
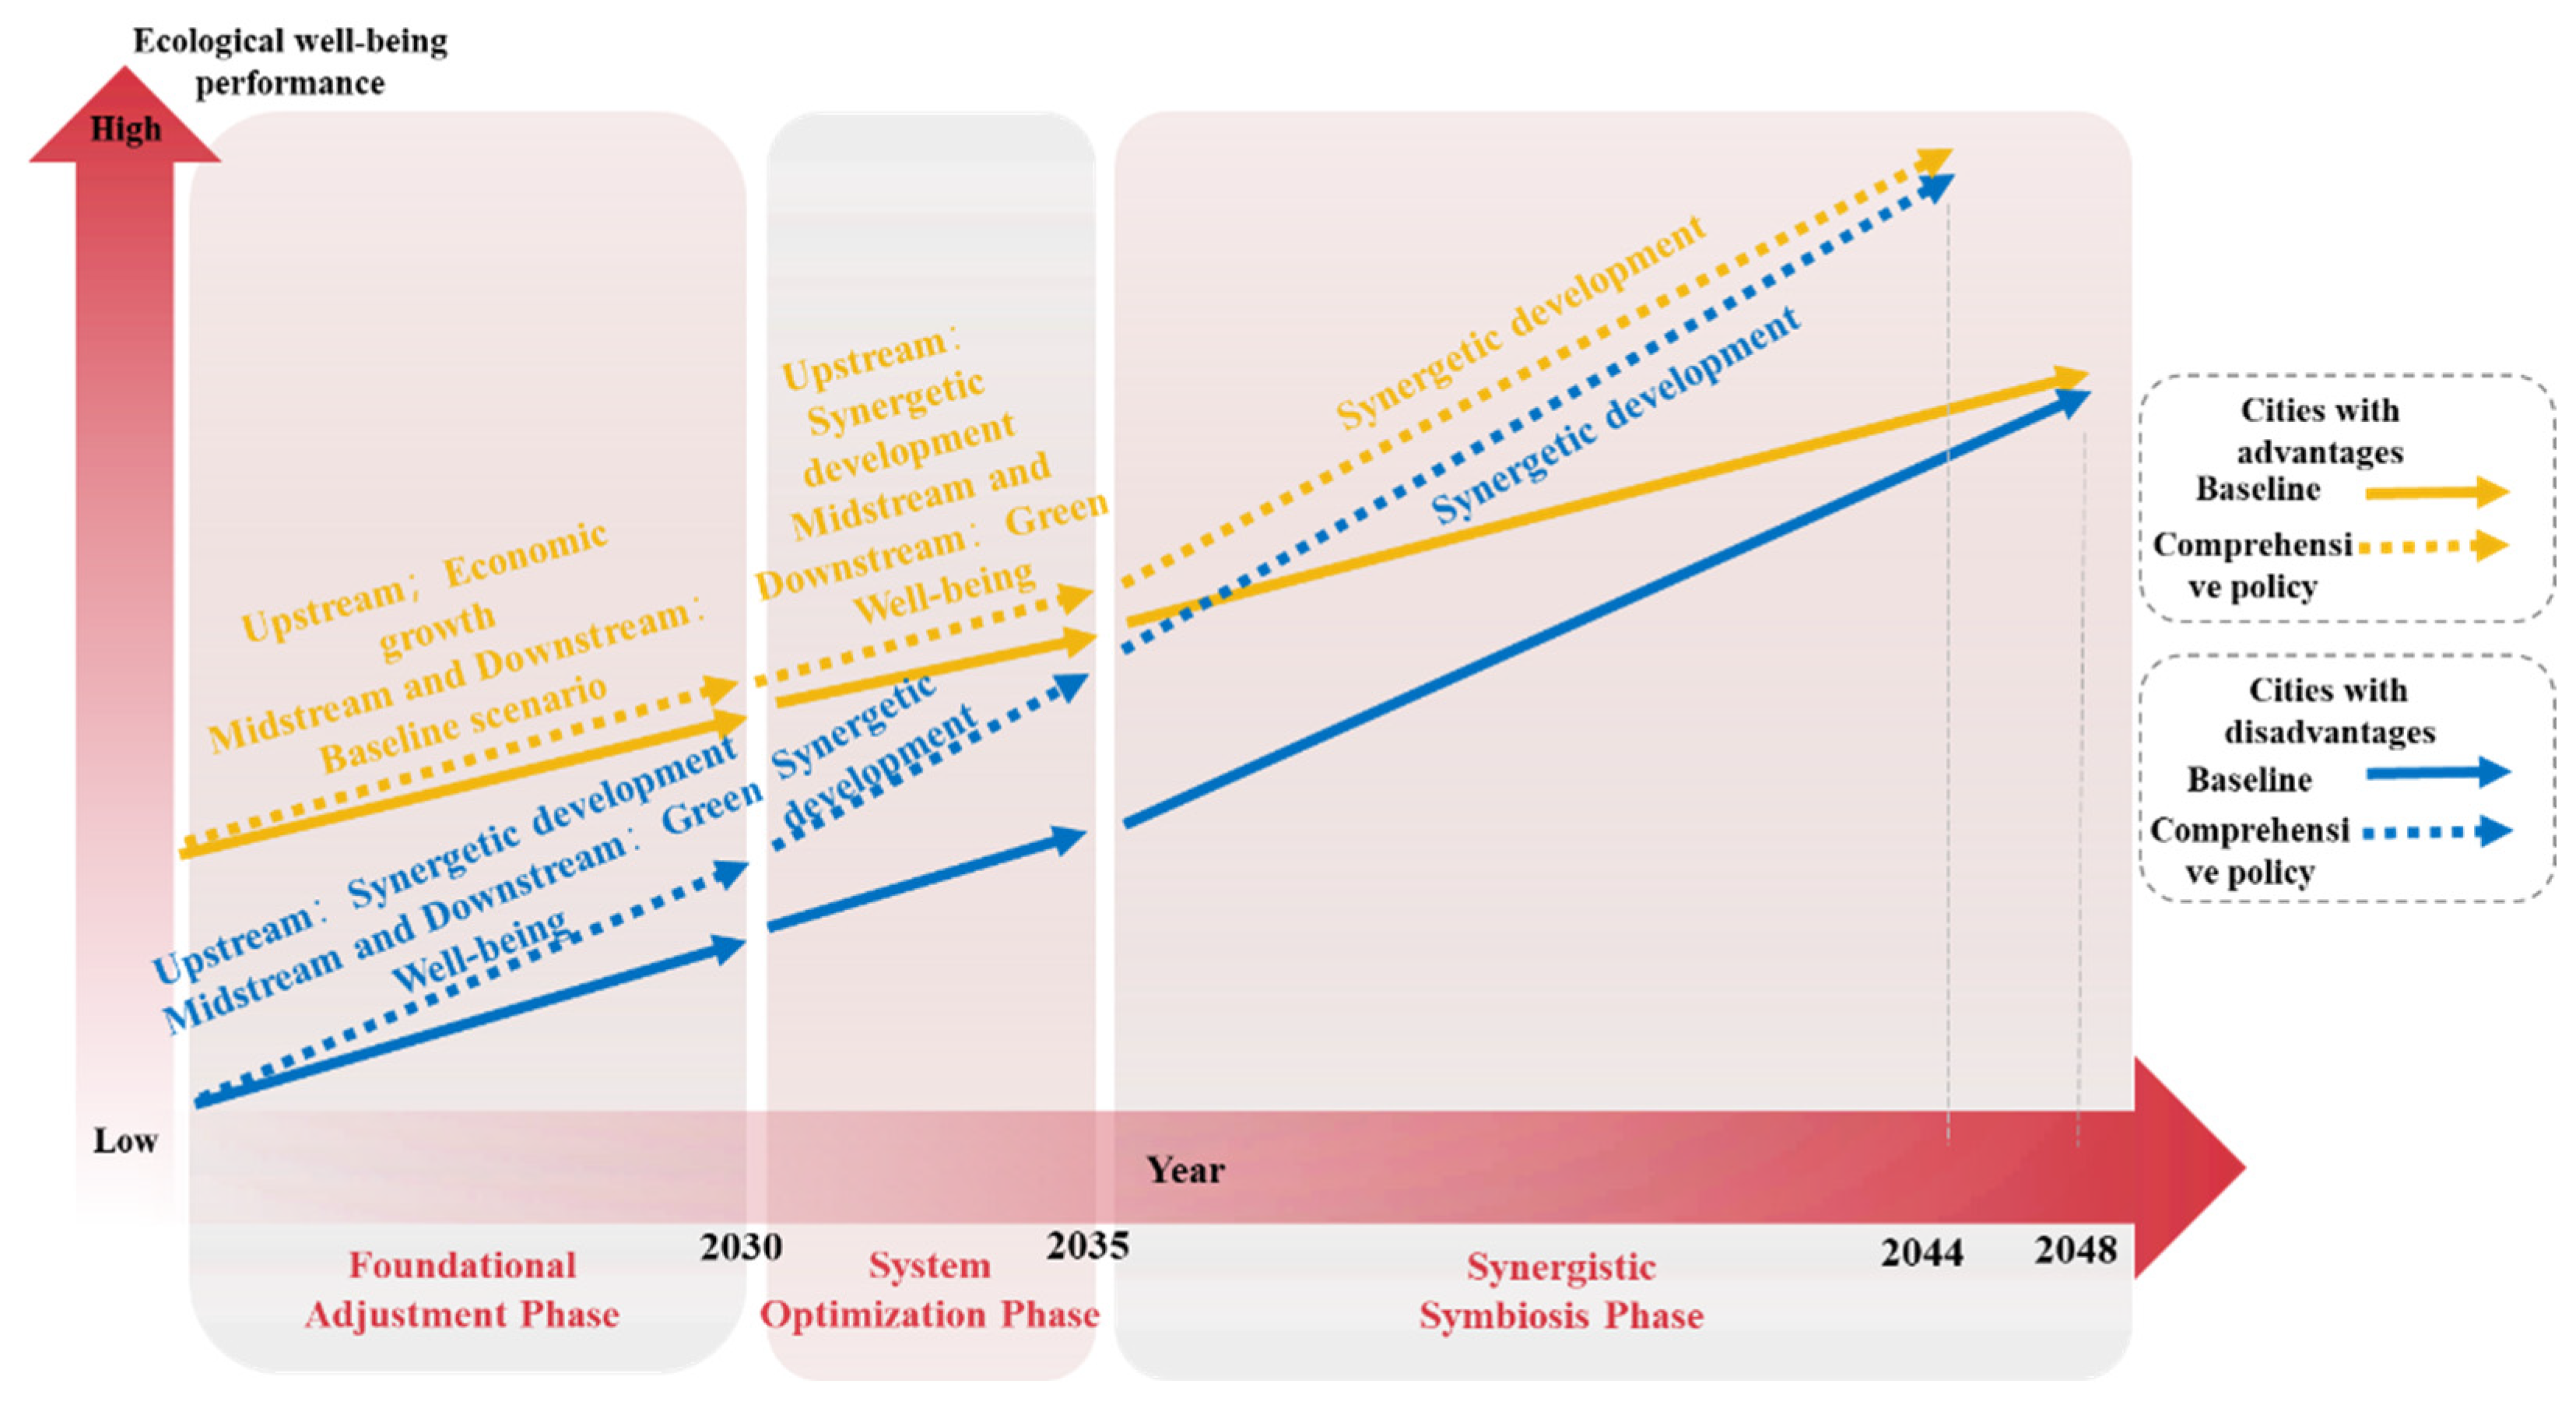

Disclaimer/Publisher’s Note: The statements, opinions and data contained in all publications are solely those of the individual author(s) and contributor(s) and not of MDPI and/or the editor(s). MDPI and/or the editor(s) disclaim responsibility for any injury to people or property resulting from any ideas, methods, instructions or products referred to in the content. |
© 2026 by the authors. Licensee MDPI, Basel, Switzerland. This article is an open access article distributed under the terms and conditions of the Creative Commons Attribution (CC BY) license.