


Abstract
Climate change is intensifying hydroclimatic extremes and agricultural water scarcity, sharpening trade-offs among yield stability, water saving, and farm incomes in major grain regions. Existing studies often optimise cropping patterns or irrigation schedules separately, seldom embedding yield robustness and policy instruments in one decision framework. We propose an integrated Machine-learning–System-dynamics–Non-dominated-sorting-genetic-algorithm-II (ML–SD–NSGA-II) framework linking long-horizon meteorological scenario generation, crop–water–economy feedback and multi-objective optimisation of crop areas and irrigation depths. ML models generate daily climate sequences to drive an SD model of soil moisture, yield formation, basin-scale allocable water, and farm returns; NSGA-II searches Pareto-optimal strategies that maximise profit and irrigation water productivity while minimising yield deviation. Applied to a rice–wheat irrigation system in the middle Yangtze River Basin, knee-point solutions lift irrigation water productivity by about 14%, maintain near-baseline profits, and reduce yield deviation. Scenario tests with block tariffs, quota-based subsidies, and extreme drought show pricing mainly curbs low-value water use in normal years, while under drought, physical scarcity dominates and economic tools offer limited buffering. This reveals the existence of a scarcity-regime threshold beyond which economic instruments become second-order relative to binding biophysical constraints. The framework supports transparent ex ante testing of tariff–subsidy packages for irrigation governance and adaptation.
1. Introduction
Agriculture plays a foundational role in global food security and rural livelihoods while remaining the largest consumer of freshwater worldwide, accounting for approximately 70% of global withdrawals and an even higher share in many developing regions [1]. Under ongoing climate warming, the frequency and intensity of droughts, floods, and compound hot-dry events continue to rise [2], undermining yield stability and water security in major grain-producing regions [3]. As a result, policymakers are increasingly confronted with a persistent governance dilemma: how to maintain food supply and farm incomes while operating within tightening freshwater constraints and climate uncertainty.
Experiences from major producers and exporters such as Iran, the U.S. Great Plains, India, and Brazil suggest that policy strategies centred on irrigated-area expansion and yield maximisation have often intensified pressure on limited blue and green water resources, accelerated groundwater depletion, and exacerbated vulnerability to climatic shocks [4,5,6,7,8]. These cases highlight that, in an era of more frequent extremes and deep integration with global markets, conventional approaches relying primarily on expanding irrigation to raise technical efficiency struggle to reconcile production stability with finite water availability. The challenge is therefore not only technical but institutional: existing policy instruments may redistribute scarcity without fundamentally resolving the underlying trade-offs.
Within this context, crop planting structure and irrigation water allocation represent two central levers of agricultural water governance. Crops differ substantially in water demand, yield potential, and economic returns [9], meaning that extensive cultivation of high-water-use, low-value crops aggravate water stress and weakens system resilience [10,11,12]. Adjusting cropping patterns has been shown to reduce peak irrigation demand and moderate yield volatility under climate shocks [13,14]. In parallel, irrigation allocation strategies—ranging from critical-growth-stage prioritisation to differentiated water pricing and quota-based subsidies—have been widely promoted to enhance water-use efficiency and steer scarce water towards higher-value uses [15,16,17,18,19,20,21]. Among these instruments, pricing and quota-type measures remain widely debated because empirical outcomes are highly context-dependent. Comparative reviews and multi-country evidence suggest that, while pricing and quota schemes can improve water-use efficiency, their effectiveness hinges on metering and enforcement capacity, affordability constraints, and the prevailing scarcity regime; demand responses are also often weak at low price ranges [22,23,24]. Evidence on increasing block-rate tariffs similarly suggests that policy performance is sensitive to tariff design and whether supply constraints are binding, reinforcing the need to test pricing performance across a range of hydrologic stress levels rather than only under average conditions [22,23].
However, most policy interventions and analytical frameworks continue to address cropping decisions and irrigation management in isolation. Empirical and modelling studies often optimise either crop structure or irrigation scheduling separately, without explicitly representing how land-use decisions, water allocation, soil moisture, yields, and farm incomes interact dynamically over time [25,26]. As a result, important feedback and trade-offs are obscured, and policies that appear effective under average conditions may perform poorly under climate extremes.
More fundamentally, the effectiveness of commonly used economic instruments—such as volumetric water pricing, tiered tariffs, and irrigation subsidies—remains contested under conditions of absolute scarcity. While moderate price increases can suppress low-marginal-benefit water use in normal years, and subsidies can buffer income losses, evidence suggests that these instruments offer only limited protection when water availability collapses during severe droughts [27,28]. Under such conditions, efficiency-oriented policies may reallocate scarcity rather than mitigate its impacts, exposing structural limits of existing governance approaches. Yet there remains a lack of quantitative tools that can examine these policy trade-offs dynamically, across interacting land–water systems and under explicit climate uncertainty.
To fill this methodological gap, an analytical tool is needed that links climate variability, land-use decisions, within-season irrigation allocation, and economic outcomes in a single, dynamic framework. System dynamics provides a process representation of feedbacks and time delays, while machine-learning-based forcing generation and multi-objective optimisation support non-stationary time-series and systematic trade-off analysis across competing objectives [29,30,31]. We therefore frame the gap as a concrete decision problem: identifying when coordinated choices of crop areas, dekad irrigation depths, and incentive instruments can stabilise yields and incomes, and when pricing-based measures lose marginal leverage as scarcity becomes binding. In particular, we conceptualise this transition as a scarcity-regime threshold, beyond which economic instruments cease to be first-order drivers of system outcomes and become secondary to biophysical constraints. In monsoon rice–wheat systems, these outcomes are driven by wet–dry spell timing and persistence, which control stage-sensitive soil-moisture deficits and yield losses and cannot be diagnosed from seasonal averages or a few static scenarios. This motivates an integrated workflow that propagates non-stationary climate signals into within-season water stress, yield stability, and economic performance, enabling transparent diagnosis of the regime-dependent applicability limits of pricing instruments.
Building on this rationale, we develop and apply an integrated ML–SD–NSGA-II decision-support framework to a representative monsoon rice–wheat irrigation system in eastern China to analyse land–water allocation and policy trade-offs under extreme climate stress. The workflow is generate–simulate–optimise: ML supplies non-stationary daily forcing, SD simulates the coupled soil–water–crop–income feedbacks at dekad resolution, and NSGA-II searches coordinated land–water and policy decisions to produce decision-relevant outputs.
By foregrounding trade-offs among efficiency, stability, and income under climate uncertainty, this study contributes to debates in environmental governance on the limits of marginal efficiency improvements and the need for coordinated structural and institutional responses. Empirically, it provides evidence from a major grain-producing region in monsoon Asia, while methodologically offering a transparent tool for evaluating land–water policies in climate-sensitive irrigation systems.
2. Literature Review
2.1. Hydro-Economic Models (HEMs)
Hydro-economic models (HEMs) are integrated decision-support tools that combine representations of water supply, storage, and conveyance infrastructure with the economic value of water use. They typically formulate water allocation and management as an optimisation problem under hydrologic and institutional constraints, and have become a widely used framework for evaluating water policies at basin scale [32,33,34]. In recent years, HEMs have been increasingly applied to irrigated agriculture under climate change, including the assessment of drought adaptation portfolios and institutional reforms. Some studies further link HEM outputs to broader economic modules to examine how drought impacts propagate beyond the water sector and influence land use and crop prices [35,36].
Despite their strengths for basin-scale accounting and optimisation, many agricultural HEM applications represent crop–water responses at annual or seasonal resolution, for example through reduced-form production functions or water-demand curves. Such representations may mask within-season mechanisms that are important for yield stability in rice–wheat systems, including irrigation timing, soil-moisture carry-over, and growth-stage-specific water stress. Moreover, climate-change assessments based on a limited number of discrete scenarios may not fully reflect non-stationary temporal patterns in the forcing series, such as the sequencing of wet–dry spells and seasonal evolution, which influence irrigation demand and yield variability. To better accommodate these modelling needs, we adopt an integrated SD–ML–MOO framework: the SD module represents dekad-scale soil-moisture states and stage-dependent yield formation, ML supplies non-stationary climate forcing as continuous time-series rather than a few static scenarios, and MOO enables systematic exploration of policy packages to characterise Pareto trade-offs and identify knee-point compromise strategies.
2.2. SD, ML, and MOO for Dynamic Governance Trade-Offs
Building on the above motivation, system dynamics (SD) provides a complementary modelling tradition for analysing governance trade-offs in agricultural water systems. SD models are designed to represent feedbacks, delays, and accumulation processes, allowing physical water balances to be linked with land-use decisions, irrigation behaviour, and economic outcomes over time. Reviews and foundational applications highlight SD’s value for policy analysis in complex socio-environmental systems because it focuses on dynamic trajectories and internal feedback structures rather than single-equilibrium outcomes [37,38,39]. Recent studies have applied SD to governance-relevant questions such as groundwater depletion and regulation, conjunctive surface–groundwater management, and the evaluation of demand-management and infrastructure-planning scenarios [40,41,42]. At the same time, SD-based policy analysis is often implemented through a limited number of predefined scenarios and can be sensitive to forcing and parameter uncertainty, which motivates coupling SD with tools that better represent climate non-stationarity and enable systematic exploration of policy design spaces [40,42].
In parallel, machine learning (ML) has expanded the toolkit for generating and refining climate inputs used in impact assessment. ML-based statistical downscaling and super-resolution approaches can translate coarse climate-model outputs into higher-resolution daily fields while improving the representation of spatiotemporal structure and reducing biases that matter for hydrologic and agricultural simulations [43,44,45]. For policy analysis that aims to explore climate non-stationarity, these data-driven approaches offer a practical way to provide time-series forcing beyond a small set of static scenario summaries.
Finally, multi-objective optimisation (MOO) supports decision framing when multiple governance goals must be considered simultaneously. Evolutionary algorithms such as NSGA-II have been widely used to search large combinations of land allocation, irrigation rules, and policy instruments, thereby characterising Pareto-efficient trade-offs rather than relying on a few hand-picked scenarios [46,47]. In irrigation and cropping applications, MOO has been coupled with crop–water representations to jointly explore cropping structure and irrigation scheduling under competing criteria, such as profitability and water-use efficiency [48]. Knee-point detection methods can further aid transparent identification of compromise strategies along a Pareto frontier [49].
2.3. Research Gap and Contribution
Despite substantial progress in modelling irrigation systems and policy instruments, three gaps remain for governance-oriented analysis in rice–wheat regions. First, crop-portfolio choices and irrigation management are often assessed at annual or seasonal resolution with simplified crop–water responses, which limits the ability to examine within-season mechanisms relevant to yield stability. Second, policy instruments are frequently evaluated under a small set of average scenarios, with less attention to their performance limits under severe drought stress. Third, yield stability is rarely treated as an explicit objective alongside farm income and water saving in policy-package design.
To address these gaps, this study proposes an integrated SD–ML–MOO framework that (i) represents dekad-scale crop–soil moisture dynamics and stage-dependent yield formation, (ii) drives the simulation with non-stationary climate time-series forcing, and (iii) uses multi-objective search to evaluate policy packages on a Pareto frontier and identify knee-point compromise strategies. The framework enables quantitative comparison of baseline and policy-adjustment strategies under both future baseline conditions and a severe drought stress test, thereby clarifying when pricing-based instruments have limited marginal leverage and when structural constraints dominate.
3. System Dynamics Modelling
3.1. Conceptual Framework and Study Area
3.1.1. Study Area Description
The case study represents a rice–wheat double-cropping irrigation system in Hubei Province, located in the middle reaches of the Yangtze River Basin. The production landscape is dominated by lowland plains (the Jianghan Plain) connected to a dense network of rivers, lakes, canals, and reservoirs, supporting large areas of paddy rice and irrigated winter wheat. This rotation is representative of monsoon-based grain regions where high seasonal yields depend on coordinated land allocation and within-season irrigation management.
Hubei has a humid subtropical monsoon climate characterised by pronounced seasonality. The mean annual temperature is about 15 °C, with July averaging about 27–30 °C and January averaging about 1–5 °C. Annual precipitation is roughly 800–1600 mm, concentrated in summer at about 300–700 mm, whereas winter receives only about 30–190 mm. The rainfall peak from mid-June to mid-July corresponds to the regional “plum-rain” season. This strong seasonality creates a pronounced mismatch between supply and demand: rainfall is relatively abundant during the rice season, whereas winter–spring conditions make the wheat season particularly irrigation dependent. Recent evidence for the middle–lower Yangtze rice–wheat region further suggests increasing seasonal water stress and higher inter-annual variability in irrigation requirements during the wheat season [50].
3.1.2. Conceptual Framework
To analyse how land-use decisions, irrigation allocation, and economic incentives interact under climate uncertainty, we develop a SD model that links crop area decisions and within-season irrigation depths to soil moisture, growth-stage water stress, yields, basin-scale allocable water, and farm returns over multiple years. The model is designed to capture nonlinear feedbacks and time delays that are central to irrigation governance.
The model operates at a ten-day (dekad) time step, which corresponds to the practical decision cycle of irrigation scheduling while allowing key crop growth stages and soil-moisture dynamics to be resolved explicitly. Water-related variables are consistently represented in both depth (mm) and volume (million m3), with conversion based on crop-specific sown area. This ensures internal accounting consistency between land-use decisions and basin-scale water availability.
As illustrated in Figure 1, the SD model integrates four tightly coupled sub-systems:
Figure 1.
The four sub-systems included in the model.
- a soil-moisture sub-system that represents root-zone water storage for rice and wheat as stock variables;
- a crop-yield sub-system that translates accumulated water stress over successive growth stages into seasonal yield outcomes;
- an available-water sub-system that represents basin-scale allocable water as a stock and imposes binding supply constraints on irrigation decisions; and
- an economic-return sub-system that accumulates revenue, costs policy transfers over time.
Meteorological variables, including precipitation, temperature, humidity, radiation, and wind speed, enter the model as exogenous drivers. Crop-specific sown areas and dekad-level net irrigation depths are treated as decision variables whose trajectories are determined externally by the optimisation module and then introduced into the SD framework. Once introduced, these decision variables endogenously shape soil-moisture dynamics, yields, water availability, and economic returns through a series of feedback mechanisms.
The model explicitly links “cropping area–irrigation–soil moisture–yield–economic returns–available water” through endogenous feedback within a unified stock–flow structure, rather than treating these components as independent optimisation problems (Figure 2). In this way, the model is designed to trace how governance-relevant decisions propagate through coupled biophysical and economic processes over time. Detailed variable definitions are provided in Appendix B.
Figure 2.
Stock–flow diagram of the system. Note: Colored lines represent different sub-systems: blue for soil-moisture, green for crop-yield, orange for economic returns, and black for available water. Font colors indicate variable types: red for decision variables in MOO, and green for ML output variables.
3.2. Key Process and Governing Relationships
3.2.1. Soil-Moisture Dynamics and Crop-Water Balance
The soil-moisture sub-system represents root-zone water storage for rice and wheat as stock variables at the dekad scale [51]. Reference evapotranspiration is calculated using the FAO Penman–Monteith formulation, and crop- and stage-specific coefficients are applied to obtain potential evapotranspiration for each crop [52] (see Appendix A).
Root-zone soil moisture evolves according to a water-balance relationship in which effective precipitation and net irrigation constitute inflow rate variables, while actual evapotranspiration, deep percolation, and subsurface drainage constitute outflow rate variables. Water stress is determined by comparing current soil-water depletion with a readily available water threshold. A water-stress coefficient scales potential to actual evapotranspiration, allowing soil-moisture conditions to influence crop-water uptake dynamically.
Net irrigation is constrained by both crop-water requirements and basin-level water availability. In each dekad, the optimisation module proposes crop-specific net irrigation depths, which implies a planned allocation of the limited basin supply across crops and growth stages. When allocable water is insufficient to satisfy total irrigation demand, an irrigation-reliability coefficient applies proportional rationing so that the realised irrigation to each crop is scaled down consistently while respecting the binding supply constraint. Therefore, the model does not assume a physical ‘transfer’ of water already applied to one crop to another; instead, water is reallocated at the decision level through the choice of crop areas and the timing of irrigation depths, allowing scarce water to be shifted towards more sensitive crops or critical growth stages by increasing their planned shares before rationing is applied.
3.2.2. Crop-Yield Formation
The crop-yield sub-system links soil-moisture dynamics to seasonal yield outcomes using the FAO water–yield-response framework. Potential yield is defined under near-optimal water conditions, while actual yield emerges as a state-dependent outcome resulting from the accumulation of evapotranspiration deficits over successive phenological stages.
The growing season is divided into crop-specific growth stages, each characterised by a yield-response factor and weighting coefficient. Stage-level water stress is aggregated to obtain seasonal yield reductions. Model parameters are calibrated so that simulated yields under historical climate and management conditions reproduce observed yield patterns.
Through this structure, yields are not imposed exogenously but emerge endogenously from the interaction among soil-moisture, irrigation decisions, and climatic conditions.
3.2.3. Basin-Scale Available Water Balance
Available water is represented as a stock variable describing basin-scale allocable water for agricultural use. The magnitude of this stock at each dekad is governed by inflow and outflow rate variables. Inflows include natural recharge, inter-basin transfers, and agricultural return flows, while outflows include agricultural withdrawals, ecological releases, and other sectoral water uses [53].
Natural recharge, inter-basin transfers, and non-agricultural demands are treated as exogenous, whereas agricultural withdrawals and return flows are endogenously determined by cropping structure, irrigation depth and irrigation efficiency. Gross withdrawals are derived by adjusting net irrigation for conveyance and application losses, allowing inefficiencies to feed back into basin-scale availability via return flows.
The available water stock functions as an explicit state-dependent constraint on feasible irrigation flows at each dekad. Under wet conditions, irrigation is primarily constrained by crop demand and economic considerations. Under drought or persistent over-extraction, declining storage progressively tightens this constraint, forcing trade-offs between crops and growth stages. This mechanism captures how climate trends and policy interventions jointly shape both short-run irrigation choices and medium-run water availability.
3.3. Model Calibration and Validation
The SD model is calibrated using data from a representative rice–wheat irrigation system in the middle Yangtze region. Calibration parameters include crop coefficients, soil water-holding capacity, irrigation efficiency, potential yields, yield-response factors, cost coefficients, and policy parameters.
Crop calendars are derived from regional cultivation guidelines and agrometeorological observations, while potential yields and cost parameters are derived from recent agricultural statistics. Using historical meteorological data and observed crop areas and irrigation practices, the model is run for the year 2021 and parameters are adjusted within agronomically plausible ranges until simulated yields and total irrigation use fall within acceptable error bounds.
Model validation follows standard system dynamics practice and focuses on behaviour reproduction rather than point prediction. First, a realism test evaluates whether simulated yields and water-use trajectories under observed 2021 meteorological conditions and cropping patterns are consistent with empirical observations. Simulated rice and wheat yields deviate from observed values by approximately ±5% (Figure 3), the flat segments reflect the crop-calendar structure of the SD model, crop yield is accumulated during the active growth stages and remains constant after harvest, so the plot shows growth-phase evolution rather than continuous year-round dynamics. To address the concern that a climate–dynamic model should not rely on a single year, we conduct a multi-year hindcast validation over 2021–2023 to check whether simulated inter-annual yield variability and aggregate agricultural water use remain within the historical envelope when driven by the corresponding observed meteorology (Appendix C).
Figure 3.
Comparison between simulated and observed yields for 2021. Note: the figures are plotted over the full simulation calendar; values become constant outside the active growing period because yield formation is completed, and no additional stress accumulation occurs.
Second, an extreme-condition test examines model behaviour under a stylised extreme-drought scenario with zero precipitation. Under this scenario, available-water storage declines rapidly, irrigation constraints tighten, and yields decrease sharply as soil–water deficits accumulate. The model exhibits no negative stocks or unstable dynamics (Figure 4), suggesting that its behaviour remains physically and logically consistent under stress conditions.
Figure 4.
Simulated yield response under the extreme drought scenario. Note: the figures are plotted over the full simulation calendar; values become constant outside the active growing period because yield formation is completed, and no additional stress accumulation occurs.
Together, these tests indicate that the SD model provides a robust representation of coupled land–water–economy dynamics suitable for subsequent optimisation and scenario analysis.
4. Multi-Objective Optimisation
4.1. Objective Setting
After calibration and validation, the SD model is embedded within a multi-objective optimisation (MOO) framework to identify robust land–water strategies under climate change. Because the coupled land–water system is nonlinear, feedback-rich, and characterised by multiple competing objectives, we employ the NSGA-II evolutionary algorithm, which is well suited to approximate non-convex Pareto fronts without gradient information.
The decision vector comprises crop-specific sown areas and dekad-level net irrigation depths for wheat and rice over the planning horizon. For each candidate decision vector, the SD model simulates coupled dynamics of soil water, crop growth, yield formation, economic returns, and basin-scale available water under a given climate–policy scenario. Land- and water-balance constraints, upper bounds on total arable land and irrigation water, and minimum area requirements for each crop are imposed as inequality constraints. Infeasible solutions are penalised and gradually eliminated during the evolutionary search.
Three policy-relevant objectives are optimised simultaneously.
- First, total net profit over the planning horizon captures the primary economic incentive of farmers and local governments.
- Second, irrigation water productivity (IWP) measures total grain output per unit of gross irrigation, capturing how effectively scarce water is transformed into production.
- Third, yield stability is represented by cumulative deviation of total production from a baseline level, so that land–water strategies that induce large aggregate production losses are penalised. These objective functions are all presented in Appendix A.
Within NSGA-II, candidate land–water strategies are sampled within the feasible decision space and evaluated by the SD model to obtain profit, IWP, and yield-deviation values. Through non-dominated sorting and diversity preservation, the algorithm evolves the population towards the Pareto front that characterises trade-offs among economic returns, water-use efficiency, and production stability. This frontier forms the analytical basis for result interpretation in Section 4.2.
4.2. Result Analysis
4.2.1. Trade-Offs Under the Historical Baseline
The Pareto frontier under the historical baseline scenario reveals pronounced trade-offs among irrigation water productivity, economic returns, and yield stability (Figure 5). Configurations that maximise irrigation water productivity tend to achieve lower total profits, while profit-oriented strategies are associated with larger cumulative yield deviations. Each point in Figure 5 represents a joint land–water strategy defined by rice and wheat areas together with dekad-scale irrigation depths. The non-dominated points form the Pareto frontier, summarising the feasible compromises under the baseline constraints.
Figure 5.
Pareto frontier of the historical baseline model.
To select a representative compromise strategy from the non-dominated solution set, we identify the “knee point” on the Pareto frontier, defined as the solution where marginal gains in one objective begin to require disproportionately large sacrifices in at least one other objective. Operationally, we (i) transform objectives so that larger values indicate better performance, IWP and profit are maximised, and yield deviation is converted to a benefit by taking its negative; (ii) apply min–max normalisation across the non-dominated set to remove unit effects; and (iii) select the knee point as the solution with the maximum perpendicular distance to the chord connecting two extreme solutions in the normalised objective space.
Compared with the baseline model representing actual 2021 production patterns (Table 1), all Pareto-efficient strategies achieve substantial gains in irrigation water productivity—on the order of 14%—demonstrating substantial scope to increase grain output per unit of irrigation water through joint adjustment of cropping area and irrigation allocation under unchanged aggregate land and water constraints. This finding indicates that prevailing land–water configurations are not located near the efficiency frontier, even in the absence of additional technological change.
Table 1.
Performance comparison with the baseline model.
However, strategies that prioritise profit maximisation do so at the cost of increased pressure on both land and water systems. The profit-oriented solution increases total profit by approximately 5.9% relative to the baseline but simultaneously expands the sown area and induces much larger yield deviations. From a governance perspective, this implies heightened exposure to production risk and resource stress, particularly under climatic variability.
By contrast, the knee-point solution on the Pareto frontier achieves irrigation water productivity gains comparable to those of the most water-efficient configurations while maintaining total profit at baseline levels. Importantly, this solution slightly reduces total sown area and markedly lowers cumulative yield deviation relative to the profit-oriented alternative. As such, it represents a balanced land–water strategy that improves efficiency without exacerbating production instability or resource pressure.
4.2.2. Governance-Relevant Interpretation of Optimisation Outcomes
The structure of the Pareto frontier suggests that efficiency gains in irrigation water use are not inherently incompatible with economic viability. Rather, the principal tension arises between short-term profit maximisation and production stability under constrained land and water resources. Profit-oriented strategies implicitly rely on expanded land use and intensified water withdrawals, which may be viable under favourable conditions but amplify vulnerability to drought and water scarcity.
The knee-point configuration illustrates the existence of land–water strategies that reconcile moderate economic performance with enhanced water-use efficiency and reduced yield volatility. From a policy perspective, such strategies align more closely with objectives of sustainable agricultural intensification, where incremental efficiency gains are prioritised over maximal exploitation of land and water.
Importantly, these results highlight that optimisation alone does not prescribe a single “optimal” strategy. Instead, it delineates a feasible space of trade-offs within which policy choices must be made. The Pareto frontier therefore serves as a diagnostic tool for governance, clarifying the opportunity costs associated with privileging profit, efficiency, or stability under given institutional and resource constraints.
5. Extended Results: Framework Coupling and Future Baseline
5.1. Coupling of ML-Based Climate Scenarios, System Dynamics, and Optimisation
This section extends the analysis by examining future baseline conditions using a coupled machine-learning (ML), system dynamics (SD), and multi-objective optimisation framework. The overall analytical structure is illustrated in Figure 6, which shows the one-way transfer of climatic forcing from the ML module to the SD model and the iterative feedback between the SD model and the NSGA-II optimisation algorithm.
Figure 6.
Interactions between models.
Within this framework, ML models generate multi-year meteorological sequences that preserve observed seasonality, inter-annual variability, and extreme-event characteristics. These climate series are treated as exogenous drivers and introduced into the SD model, where they influence soil moisture dynamics, crop growth, available basin-scale water, and economic returns through explicit stock–flow relationships. For each candidate land–water strategy proposed by NSGA-II, the SD model simulates system behaviour over the planning horizon and returns performance metrics to the optimisation algorithm.
As shown in Table 2, this integration is functional because each component resolves a distinct bottleneck in decision support. ML provides non-stationary climate forcing but cannot infer governance outcomes without a process-based system model; SD represents crop–water–economy feedbacks and constraints over time but would otherwise rely on a limited set of hand-picked scenarios; and NSGA-II can map trade-offs only when coupled to a dynamic evaluator that returns objective values for each candidate strategy. Their coupling therefore yields decision products that no single method can produce alone.
Table 2.
Functional roles and added value of the integrated ML–SD–NSGA-II workflow.
The SD–NSGA-II dynamical coupling is mechanistically necessary because the objectives and constraints are shaped by within-season soil-moisture dynamics and irrigation timing at dekad scale, not by seasonal totals alone. Yield deviation is produced by stage-sensitive water stress that depends on soil-moisture carry-over and on when irrigation is applied relative to wet–dry spell sequences. Basin-scale available water is also represented as a dynamic stock constraint that tightens under sustained deficits, which shifts the feasible set over time. Because the decision variables include both crop areas and within-season irrigation depths, replacing the SD evaluator with a reduced-form approximation would require extensive pre-fitting over a high-dimensional decision space and could distort the Pareto frontier and knee-point selection. We therefore evaluate each candidate strategy through a dynamic SD simulation within the NSGA-II search. We also conduct an elimination-based stress test of the framework, reported in Appendix E.
With this evaluator-in-the-loop structure, the coupled framework allows systematic exploration of trade-offs among irrigation water productivity, economic returns, and yield stability under future climatic conditions. Rather than producing a single optimal solution, it identifies a set of Pareto-efficient strategies that characterise the feasible space of land–water decisions under uncertainty.
5.2. Reliability of ML-Generated Climatic Forcing
The credibility of future baseline simulations depends on the adequacy of the ML models used to generate meteorological inputs [54]. The predictive performance of the selected ML models is summarised in Table 3, which reports accuracy metrics for key climate variables relevant to crop-water demand and evapotranspiration.
Table 3.
Quantitative results of meteorological forecasts.
As shown in Table 3, Ridge regression reproduces the seasonal dynamics of relative humidity and shortwave radiation with low error, while the Hist Gradient Boosting Regressor (HGBR) captures nonlinear temperature patterns that are critical for reference evapotranspiration estimation. Wind-speed variability is represented using gradient-boosted regression trees with Huber loss, and precipitation dynamics are modelled using a combined GBRT–Tweedie approach that accounts for both extreme events and cumulative rainfall behaviour.
Table 3 reports relatively large sMAPE values for cumulative precipitation (≈128%) and a non-negligible value for solar irradiance (≈33.6%). This does not necessarily imply that the generated climate series is unusable for scenario forcing. First, sMAPE is a relative metric that becomes unstable when the denominator is small; for precipitation, many days have zero or near-zero rainfall, so small absolute errors on low-rain days can yield very large percentage errors and can push sMAPE above 100%. For solar irradiance, day-to-day variability is strongly driven by cloud processes; local cloud-cover mismatch can therefore yield elevated relative errors even when the seasonal mean is captured. Second, our SD model operates at a dekad time step and uses effective precipitation and soil-moisture storage to filter high-frequency noise; for crop-water balance and yield formation, the seasonal distribution and cumulative totals are more influential than exact daily timing. Accordingly, we interpret solar-radiation errors primarily through their effect on ET0 at dekad scale, rather than through daily pointwise accuracy alone. Therefore, we interpret precipitation performance jointly using MAE/RMSE and by checking whether the generated series preserves the observed seasonal cycle, wet–dry contrast, and frequency of wet spells. Nevertheless, the large precipitation sMAPE indicates substantial uncertainty in rainfall occurrence at the daily scale, which we explicitly acknowledge in the scenario interpretation (Section 7) and address through sensitivity tests on precipitation forcing (Appendix D).
These results suggest that the ML-generated series are suitable as meteorological forcing for multi-year land–water stress tests at dekad scale. Here, the ML module is used to produce internally consistent daily sequences for the planning horizon, rather than to make point predictions of specific future weather. In this monsoon rice–wheat setting, yield deviation and policy leverage are especially sensitive to when dry spells occur and how long they persist, because stage-sensitive water stress accumulates when consecutive dry periods coincide with critical growth stages. This highlights that the advantage of ML in this context lies not primarily in pointwise predictive accuracy, but in its ability to preserve temporal dependence under non-stationary conditions, which is critical for capturing stage-sensitive water stress dynamics.
We also considered two widely used alternatives for daily forcing generation, namely stochastic weather generators (SWGs) and GCM-based downscaled products. Standard SWGs can reproduce marginal statistics under a stationary calibration, but representing changes in wet–dry spell persistence under non-stationary conditions typically requires additional conditioning or time-varying parameters [55]. Multi-variable coherence is another practical constraint. Many generator structures simulate precipitation occurrence first and then condition temperature and radiation on that occurrence; therefore, preserving cross-variable dependence relies on explicit modelling choices [56]. Downscaled GCM products commonly apply bias correction, but reviews show that bias correction can alter variability and temporal dependence and may produce implausible changes if applied mechanically [57,58]. Given these additional assumptions, we use ML as an observation-conditioned forcing generator for ex ante stress testing, and we carry remaining forcing uncertainty through the precipitation-scaling experiments in Appendix D.
5.3. Future Baseline Optimisation Outcomes
Using the ML-generated climate series as forcing, the coupled SD–optimisation framework is applied to derive Pareto-efficient land–water strategies under future baseline conditions. The resulting solution set reveals systematic trade-offs among irrigation water productivity, economic returns, and yield stability.
Across the Pareto-efficient solutions, configurations that prioritise higher water productivity tend to sacrifice economic returns, while profit-oriented strategies are associated with greater production variability. Solutions located near the knee of the Pareto frontier represent balanced strategies that improve irrigation water productivity without incurring disproportionate yield instability. These results provide a reference benchmark for subsequent region-specific and policy-focused analyses.
6. Regional Multi-Objective Optimisation Results for Hubei Province
6.1. Baseline Model Set-Up and Regional Constraints
Daily meteorological series for the period 2025–2029 are first generated using the trained machine-learning models described in Section 5 and then introduced into the system dynamics framework. These time-series provide the climatic forcing for all simulations reported in this section.
To interpret the ML-generated forcing, we summarise the daily sequences into dekad climatologies and compare their seasonal evolution with the historical training period. The generated series preserves the characteristic monsoon seasonality, with a concentrated rainfall peak in early summer and a drier winter–spring, which is critical for capturing the contrasting irrigation dependence of rice and wheat in the region. In line with recent evidence for increasing seasonal water stress during the wheat season in the middle–lower Yangtze rice–wheat region [50], the future baseline forcing tends to imply higher evaporative demand in late winter and spring and more variable effective precipitation, thereby tightening the water–yield trade-off for wheat and increasing the importance of within-season irrigation timing.
Regional land and water resource constraints are calibrated using agricultural and water statistics for Hubei Province. Key parameters describing arable land availability, irrigation water supply, and historical utilisation levels are summarised in Table 4. These values define upper and lower bounds for cropping area and irrigation allocation and are held constant across all scenarios examined in Section 6.
Table 4.
Statistical data for Hubei Province, 2018–2023.
Based on the regional constraints reported in Table 4 and the ML-generated meteorological inputs, a future baseline model is constructed to represent the land–water system under current management practices and anticipated climate conditions. This baseline provides a reference against which alternative climate and policy scenarios are evaluated in subsequent analyses.
6.2. Multi-Objective Optimisation Results Under Regional Constraints
Subject to the regional land and water constraints defined in Table 4, the NSGA-II algorithm is applied to derive Pareto-optimal land–water strategies for Hubei Province over the 2025–2029 planning horizon. The resulting Pareto frontier is presented in Figure 7.
Figure 7.
Pareto frontier for the future scenario.
As shown in Figure 7, the feasible solution space is substantially narrower than that obtained under the future baseline analysis in Section 5, reflecting the binding effects of regional land and water limitations. The frontier reveals clear trade-offs among irrigation water productivity, economic returns, and yield stability. Solutions located towards the profit-maximisation end of the frontier are associated with higher water withdrawals and increased production variability, while water-saving solutions achieve higher irrigation water productivity at the expense of economic returns.
More specifically, profit-oriented solutions prioritise economic returns while exhibiting lower irrigation water productivity and greater yield variability. In contrast, water-saving solutions maximise irrigation water productivity but entail notable reductions in total economic returns. A knee-point solution identified on the Pareto frontier in Figure 7 represents an intermediate configuration that moderates these trade-offs, achieving balanced performance across irrigation water productivity, economic returns, and yield stability.
Relative to the more extreme solutions along the frontier, the knee-point configuration reduces irrigation demand and stabilises yields while maintaining acceptable economic performance. This solution is therefore selected as the reference configuration for subsequent climate and policy scenario comparisons in Section 6.3.
6.3. Climate and Policy Scenario Comparison
To assess the robustness of land–water strategies under different climatic and policy conditions, additional scenarios are simulated for Hubei Province, including reduced-precipitation (drought) conditions and alternative policy instruments. Specifically, scenarios incorporating irrigation quotas, block water pricing, and combined policy packages are examined.
Key performance indicators for all climate–policy combinations are reported in Table 5, including irrigation water productivity, total economic returns, and yield stability. Under normal climatic conditions, Table 5 shows that policy instruments induce moderate improvements in water-use efficiency while maintaining production and income levels close to the future baseline. These effects are achieved primarily through reallocation of irrigation water towards higher-marginal-return uses.
Table 5.
Comparison of key indicators across scenarios.
Under drought conditions, the results in Table 5 indicate substantial declines in both yields and economic returns across all policy scenarios. Although quota-based and pricing policies partially mitigate income losses, they do not prevent significant reductions in irrigation during critical crop growth stages. Differences among policy regimes narrow markedly under drought, highlighting the dominance of biophysical constraints over marginal economic incentives when water availability becomes severely limited.
Beyond the aggregate indicators in Table 5, the knee-point solution is defined by two sets of coordinated decisions: first, crop areas, expressed as rice and wheat shares under the fixed arable-land constraint; second, within-season irrigation depths at the dekad scale. Regarding land allocation, Table 6 shows a consistent tendency for knee-point strategies to reallocate a modest share of land from rice to wheat as water scarcity or pricing pressure increases. Relative to the future-baseline knee solution, rice area decreases from 248.88 to 220.09 × 10⁴ ha, a reduction of 11.6%, under policy adjustment, whereas wheat area remains nearly unchanged, increasing from 79.30 to 79.89 × 10⁴ ha, or 0.7%. Under extreme drought, rice area decreases to 226.47 × 10⁴ ha, down 9.0%, while wheat area increases to 84.85 × 10⁴ ha, up 7.0%. This pattern is consistent with the knee-point trade-off logic in a rice–wheat system. Rice is generally more irrigation-dependent, so reducing rice area offers a direct way to lower total irrigation demand when scarcity constraints bind; maintaining or modestly increasing wheat area can, in contrast, help stabilise total output and farm income as marginal water costs rise. In the drought cases, shifting part of the portfolio towards wheat can also reduce exposure to peak-season water stress by spreading water demand across seasons, thereby improving yield robustness at the system level.
Table 6.
Decision variables of knee-point strategies across scenarios.
Regarding irrigation allocation, Table 6 indicates that the reduction in total irrigation water under policy adjustment is driven primarily by lower seasonal irrigation for rice. Rice net irrigation volume declines from 91.55 to 80.56 × 10⁸ m3, whereas wheat irrigation increases slightly from 24.93 to 26.11 × 10⁸ m3. This pattern suggests that the knee-point strategy does not scale irrigation down uniformly but reallocates water towards the crop and season with higher marginal returns under the prevailing constraints. Figure 8 further shows how this redistribution unfolds within each season by plotting dekad irrigation-depth profiles for rice and wheat.
Figure 8.
Delta. Rice and wheat irrigation depth difference.
Overall, the policy instruments mainly shift seasonal irrigation volumes and crop-mix decisions under moderate conditions, while their leverage weakens once scarcity becomes binding under extreme drought stress in Hubei Province.
7. Discussion
7.1. Pareto Trade-Offs in a Broader Context
The Pareto results highlight the governance nature of land–water allocation in climate-sensitive irrigation systems: improving water productivity can entail costs in profit or yield stability, and these trade-offs shift under drought stress. Framing yield stability as an explicit objective is particularly important in rice–wheat systems, where shortfalls during sensitive periods can translate into disproportionate yield losses and income risk. The Pareto frontier therefore provides not only better solutions but also a transparent map of feasible compromises, which is essential for policy design under climate non-stationarity.
Beyond performance metrics, the frontier underscores that policy instruments should be assessed as part of a coordinated package rather than as isolated levers. In particular, the same instrument can perform differently across scarcity regimes, and the most policy-relevant solutions are often compromise strategies rather than extremes. This motivates the use of knee-point solutions as representative, implementable options for balancing competing objectives under changing hydrologic conditions.
These policy-relevant insights are enabled by the integrated modelling workflow rather than by any single component alone. The study illustrates how SD can be operationalised as a decision engine when coupled with AI-generated forcing and multi-objective search. This coupling enables stress-testing of governance instruments under non-stationary forcing while retaining within-season mechanisms that drive yield stability. The resulting decision artefacts—Pareto frontiers, knee-point strategies, and regime thresholds—support transparent decision making in complex irrigation–governance systems.
7.2. Knee-Point Composition and Within-Season Reallocation
The knee-point strategy is defined by coordinated decisions on crop areas and irrigation allocation. Table 6 shows that the compromise solution tends to shift a modest share of land from rice towards wheat as scarcity or pricing pressure increases, while keeping total arable land fixed. This pattern is consistent with the role of crop portfolio adjustment as a structural demand-management lever: rice is typically more irrigation-dependent in monsoon rice–wheat systems, so reducing rice area can directly lower irrigation exposure under binding scarcity, whereas maintaining or moderately increasing wheat area can help stabilise overall production and income when water becomes more limiting.
Table 6 also indicates that changes in aggregate irrigation are achieved primarily through cross-crop reallocation in seasonal totals, rather than through large changes in seasonal net depths. For example, reductions in total irrigation under policy adjustment are driven mainly by lower seasonal irrigation volumes for rice, while wheat irrigation volumes can increase slightly. This suggests that compromise solutions do not simply apply a uniform scaling of irrigation across crops; instead, they adjust the crop portfolio and the distribution of irrigation effort to preserve higher-return production under constraints.
7.3. Policy Instruments and Scarcity Regimes
The results suggest that the marginal leverage of variable pricing depends on the scarcity regime and on how the tariff affects realised costs and irrigation decisions. Under wetter forcing conditions, variable pricing can deliver meaningful water savings while maintaining or slightly improving water productivity, consistent with price signals trimming lower-return irrigation when rainfall is relatively abundant. However, as conditions become drier, the system’s behaviour is increasingly driven by precipitation deficits and compensatory irrigation needs, so that additional pricing signals have limited scope to raise water productivity around the compromise region. This pattern reflects a regime shift in which economic instruments lose marginal influence as binding biophysical constraints dominate system behaviour.
We use a joint criterion for a near-ineffective regime—one in which the marginal gain in water productivity is within a policy-relevant tolerance and pricing no longer reduces irrigation withdrawals. The results (Table A4) indicate a regime shift from P_scale equal to 0.9 onwards. In this range, the marginal effect on IWP remains within plus or minus 1 percent, while total irrigation increases by about 6.6 to 8.2 percent. Under these drier conditions, variable pricing can also raise profits, which is consistent with Table A4 showing a small reduction in the average unit water price and with the crop-portfolio adjustments observed in Table 6.
7.4. Climate Uncertainty
The climate-forcing evaluation indicates that precipitation errors at the daily scale can be large under sMAPE, which is expected for intermittent variables with many near-zero values. In this study, the SD model operates at a dekad time step and represents precipitation impacts through effective rainfall and soil-moisture storage, which reduces sensitivity to high-frequency timing noise and focuses attention on seasonal evolution and cumulative water-balance drivers. Nevertheless, uncertainty in rainfall occurrence and timing remains a relevant source of uncertainty for yield stability, particularly under drought stress where sequences of dry spells can matter even when seasonal totals are similar.
To quantify how precipitation uncertainty can affect outcomes and policy conclusions, Appendix D reports precipitation-forcing sensitivity results that scale the precipitation series across wetter-to-drier multipliers. Table A3 shows that, as precipitation decreases, IWP and profit decline and irrigation demand exhibits compensatory tendencies, which is consistent with crop-water-response theory. Importantly, the regime-dependent pricing effects identified in Table A4 are evaluated under the same forcing variations, supporting the interpretation that conclusions about policy leverage should be framed as conditional on hydrologic stress levels rather than as single-scenario statements. Together, these results motivate interpreting the climate-driven scenarios as stress tests under non-stationarity and focusing policy conclusions on robust patterns and relative rankings across strategies, rather than on small differences between nearby solutions.
7.5. Groundwater Representation and Its Potential Influence on Results
In the current SD structure, groundwater is represented implicitly within basin-scale allocable water and as a supplementary source during dry spells, without explicitly simulating spatial drawdown, delayed recharge, pumping-energy feedbacks, or regulatory constraints that may tighten as water tables decline. This abstraction helps keep the optimisation tractable and maintains a focus on seasonal allocation trade-offs. However, it may understate long-run depletion risks and the heterogeneity of local pumping constraints.
If groundwater were modelled explicitly as a separate stock with delayed recharge and policy red-line constraints, the feasible solution space could contract and compromise strategies might shift accordingly. Potential shifts include more conservative irrigation timing, greater reliance on surface-water efficiency improvements, and stronger crop-portfolio adjustments. Groundwater simplification is therefore treated as a source of structural uncertainty in the interpretation of results, and explicit surface–groundwater coupling is identified as a priority extension for future work.
8. Conclusions
This study develops an integrated ML–SD–NSGA-II framework to analyse and optimise trade-offs among the coupled challenges of yield stability, water scarcity, and income growth in irrigated agriculture under climate change. The framework links ML-based meteorological scenario generation, SD simulation of crop–water–economy interactions and multi-objective optimisation within a unified decision-support system, using a humid monsoon rice–wheat double-cropping region in central China as a representative case with potential transferability to other irrigated basins.
Under current-climate conditions, comparison with the observed baseline reveals substantial untapped efficiency. Representative Pareto-optimal schemes increase irrigation water productivity by about 14% without relaxing land or water constraints. A profit-oriented configuration increases net revenue by about 6% but expands sown area and amplifies yield deviation, implying greater exposure to climate risk and land pressure. By contrast, a knee-point configuration maintains near-baseline profit while improving water-use efficiency, slightly reducing sown area and markedly lowering yield deviation, indicating that coordinated adjustment of cropping structure and irrigation allocation can deliver “more grain per drop” without sacrificing income.
Future scenario analysis clarifies the differentiated role of economic instruments under climate stress. Under differentiated volumetric pricing and otherwise normal weather, water-use efficiency improves modestly, profits decline only slightly and yield deviations remain small, indicating that tariffs calibrated to local conditions can curb low-value irrigation while safeguarding supply during critical growth stages. Under an extreme-drought analogue, sharp reductions in effective water availability lead to simultaneous deterioration in efficiency, profit, and yield stability. In this context, the addition of quotas and block tariffs yields only marginal improvements, indicating that prices and subsidies primarily facilitate buffering and reallocation and cannot offset absolute water scarcity. This finding can be interpreted as evidence of a scarcity-regime threshold, beyond which economic instruments lose first-order influence over system outcomes and structural constraints become dominant. Structural measures, including drought-tolerant varieties, upgraded irrigation technologies, and reconfigured crop portfolios, therefore remain indispensable.
Methodologically, the study demonstrates how a transferable ML–SD–NSGA-II framework can shift SD-based analysis from ex post scenario exploration towards ex ante multi-objective decision support, and how treating yield deviation as an explicit objective helps make trade-offs among economic returns, resource efficiency, and robustness to climatic extremes transparent for policy deliberation. Practically, the optimised schemes provide concrete land–water configurations that improve water productivity while maintaining acceptable income and yield stability, and the standardised “forecast–simulate–optimise” workflow can be adapted to other climate-sensitive irrigation regions to inform tariff design, subsidy rules, and basin allocation.
Nevertheless, several limitations remain. The analysis is calibrated to a single humid monsoon system, adopts a simplified representation of groundwater processes and compound extremes, and relies on ML-based climate scenarios. Future research should extend the framework to semi-arid and groundwater-dependent basins, explicitly couple surface–groundwater regulation and water-rights trading, and incorporate ensemble climate projections to assess the robustness of policy-relevant trade-offs.
Author Contributions
Conceptualisation, X.J.; study design, R.Z.; methodology, R.Z.; software, R.Z.; validation, R.Z.; formal analysis, R.Z.; investigation, R.Z.; resources, X.J.; data curation, R.Z.; writing—original draft preparation, R.Z.; writing—review and editing, X.J.; visualisation, R.Z.; supervision, X.J.; project administration, X.J.; funding acquisition, X.J. All authors have read and agreed to the published version of the manuscript.
Funding
This research was partially supported by the National Natural Science Foundation of China (Grant Nos. 71774182 and 72571298).
Institutional Review Board Statement
Not applicable.
Informed Consent Statement
Not applicable.
Data Availability Statement
The meteorological datasets used in this study are available from the National Tibetan Plateau Data Center and the Scientific Data Center of the China Meteorological Administration, subject to their data-access policies. The model code and processed data that support the findings of this study are available from the corresponding author upon reasonable request.
Conflicts of Interest
The authors declare that there is no conflict of interest with respect to the research, authorship, and publication of this article.
Abbreviations
The following abbreviations are used in this manuscript:
| SD | System Dynamics |
| ML | Machine Learning |
| NSGA-II | Non-dominated Sorting Genetic Algorithm II |
| HGBR | HistGradientBoostingRegressor |
| GBRT | Gradient Boosting Regression Tree |
| IWP | Irrigation Water Productivity |
| MAE | Mean Absolute Error |
| RMSE | Root Mean Squared Error |
| sMAPE | Symmetric Mean Absolute Percentage Error |
Appendix A. Calculation Formula
Appendix B. Definitions of Variables
Table A1.
Definitions of variables.
Appendix C. Multi-Year Validation
Table A2 summarises the multi-year hindcast validation for 2021–2023. For rice, simulated yields are consistently lower than the observed provincial statistics, with APE values of −4.8% (2021), −11.6% (2022), and −6.0% (2023); the largest deviation occurs in 2022. For wheat, the model reproduces observed yields closely in 2022 (−0.6%) and remains within single-digit deviations in 2021 (−4.5%) and 2023 (−9.1%), with the largest deviation in 2023. Overall, the mean absolute percentage error is 7.5% for rice and 4.7% for wheat across the three years, indicating that the model reproduces the inter-annual yield level and variability within an acceptable range for a climate–dynamic SD application.
Table A2.
Multi-year validation summary, 2021–2023.
Several factors may contribute to the remaining discrepancies between observed and simulated yields. First, the model uses dekad-aggregated meteorological inputs; this temporal aggregation can smooth daily extremes in precipitation, radiation, wind speed, temperature, and humidity. Because crop-water balance and stress responses are non-linear, yield impacts driven by short heat spells, consecutive dry days, or intense rainfall events are not fully captured by dekad means, which can lead to systematic underestimation in years where extremes play a larger role. Second, observed provincial yields embed management factors not explicitly modelled here, such as year-specific changes in cultivar choice, fertiliser application, pest/disease pressure, and adoption of improved irrigation technologies; these factors can shift yields upwards without being attributable solely to climate forcing.
Appendix D. Precipitation-Forcing Sensitivity
To examine how uncertainty in precipitation forcing propagates into crop yield, irrigation demand, and policy performance, we conducted a precipitation-scaling sensitivity experiment. The baseline precipitation time-series used in the future-scenario simulations was multiplicatively scaled as , where . These multipliers represent progressively wetter-to-drier forcing regimes, including a severe drought stress level at (40% precipitation reduction). All other inflows and exogenous water-supply assumptions were kept unchanged, so that the experiment isolates the effect of precipitation forcing on the coupled land–water system.
For each precipitation multiplier , the model was evaluated under two governance settings: a baseline case and a pricing policy-adjustment case. Within each setting, we report representative Pareto-efficient solutions corresponding to the knee-point compromise strategy and, for reference, the profit-oriented and water-minimising strategies. For each solution, we record key outcome metrics used throughout the paper—IWP, net profit, yield deviation, and total irrigation water use—together with the associated decision variables.
Table A3.
Baseline knee-point sensitivity to precipitation scaling.
The sensitivity results are summarised in Table A3. As precipitation decreases, both IWP and profit decline monotonically, and crop yields fall, consistent with crop-water-response theory. But total irrigation does not vary monotonically with precipitation scaling because two counteracting mechanisms operate simultaneously. Under mild-to-moderate drying, the knee-point solution can reduce irrigation demand mainly through modest shifts in crop areas and efficiency-oriented irrigation allocation, so total irrigation decreases slightly. Under more severe drying, however, the physical water deficit dominates: effective precipitation falls sharply and irrigation becomes the primary compensatory source to avoid disproportionate yield losses, so the optimisation increases irrigation withdrawals despite continued structural adjustments. The observed “decrease-then-increase” pattern therefore reflects a regime shift from adaptation-dominated savings to deficit-compensation dominance as drought stress intensifies.
Table A4.
Marginal effect of variable pricing at the knee point, relative to baseline.
Table A4 indicates a clear regime shift in the marginal effect of variable pricing at the knee point. Under wetter forcing (P_scale = 1.5–1.2), pricing reduces total irrigation by about 8% while slightly improving IWP, consistent with price signals trimming lower-return irrigation when rainfall is relatively abundant. In contrast, under drier forcing (P_scale ≤ 0.9), the leverage of pricing on IWP becomes negligible, while irrigation withdrawals increase by 6.58–8.15%. We therefore interpret this as a near-ineffective regime for variable pricing in terms of both water saving and water-productivity improvement, and it may even become counterproductive for the water-saving objective, because irrigation withdrawals rise while IWP gains remain negligible.
Appendix E. Elimination Test
To assess the contribution of ML forcing through elimination, we re-optimised the knee-point strategy using three repeat-year alternatives (2021–2023) in place of the ML-generated non-stationary forcing. Table A5 shows that the resulting knee-point solutions are highly sensitive to the selected historical year. In the no-ML runs, yield deviation ranges from 168.7 to 385.7 × 10⁴ t, profit varies from 35.0 to 40.9 billion yuan, and IWP ranges from 0.0008360 to 0.0009397 t/m3. This spread shows that, when ML forcing is removed, optimisation outcomes and policy diagnostics depend on which historical year is repeated and its wet–dry spell structure. ML is therefore used as an observation-conditioned generator of non-stationary daily forcing for the planning horizon, providing a consistent basis for ex ante stress testing rather than relying on a single repeated historical year.
Table A5.
Knee-point solutions under alternative climate forcing (ML vs repeat-year meteorology, 2021–2023).
In order to justify the necessity of multi-objective optimisation through elimination, we removed NSGA-II and evaluated a set of SD-only scenario tests under the same ML forcing. The tests enumerate 45 hand-crafted combinations (Table A6) defined by five crop-area settings and three irrigation-depth levels for each crop (5 × 3 × 3), producing a discrete set of outcome points in the three-objective space.
As shown in Table A7, among the 45 scenarios, only eight are non-dominated, while 82.2% are dominated by other scenarios in the same grid. Figure A1 illustrates this limitation more directly. In both panels, blue circles are the dominated scenarios and orange triangles are the non-dominated subset. In the IWP–profit panel (left), the non-dominated points trace an upper envelope, but the grid leaves large gaps and many near-neighbour points are clearly suboptimal. In the IWP–yield-deviation panel (right), improving IWP often coincides with higher yield deviation, and only a few points lie on the trade-off boundary. These plots show that hand-crafted scenario enumeration does not provide a complete picture of the trade-off boundary, and selecting a compromise strategy would depend on which scenarios are included and how objectives are weighted.
Table A6.
SD-only scenario design (5 × 3 × 3 = 45).
Table A7.
Summary statistics of SD-only test outcomes.
Figure A1.
SD-only results for 45 hand-crafted scenarios.
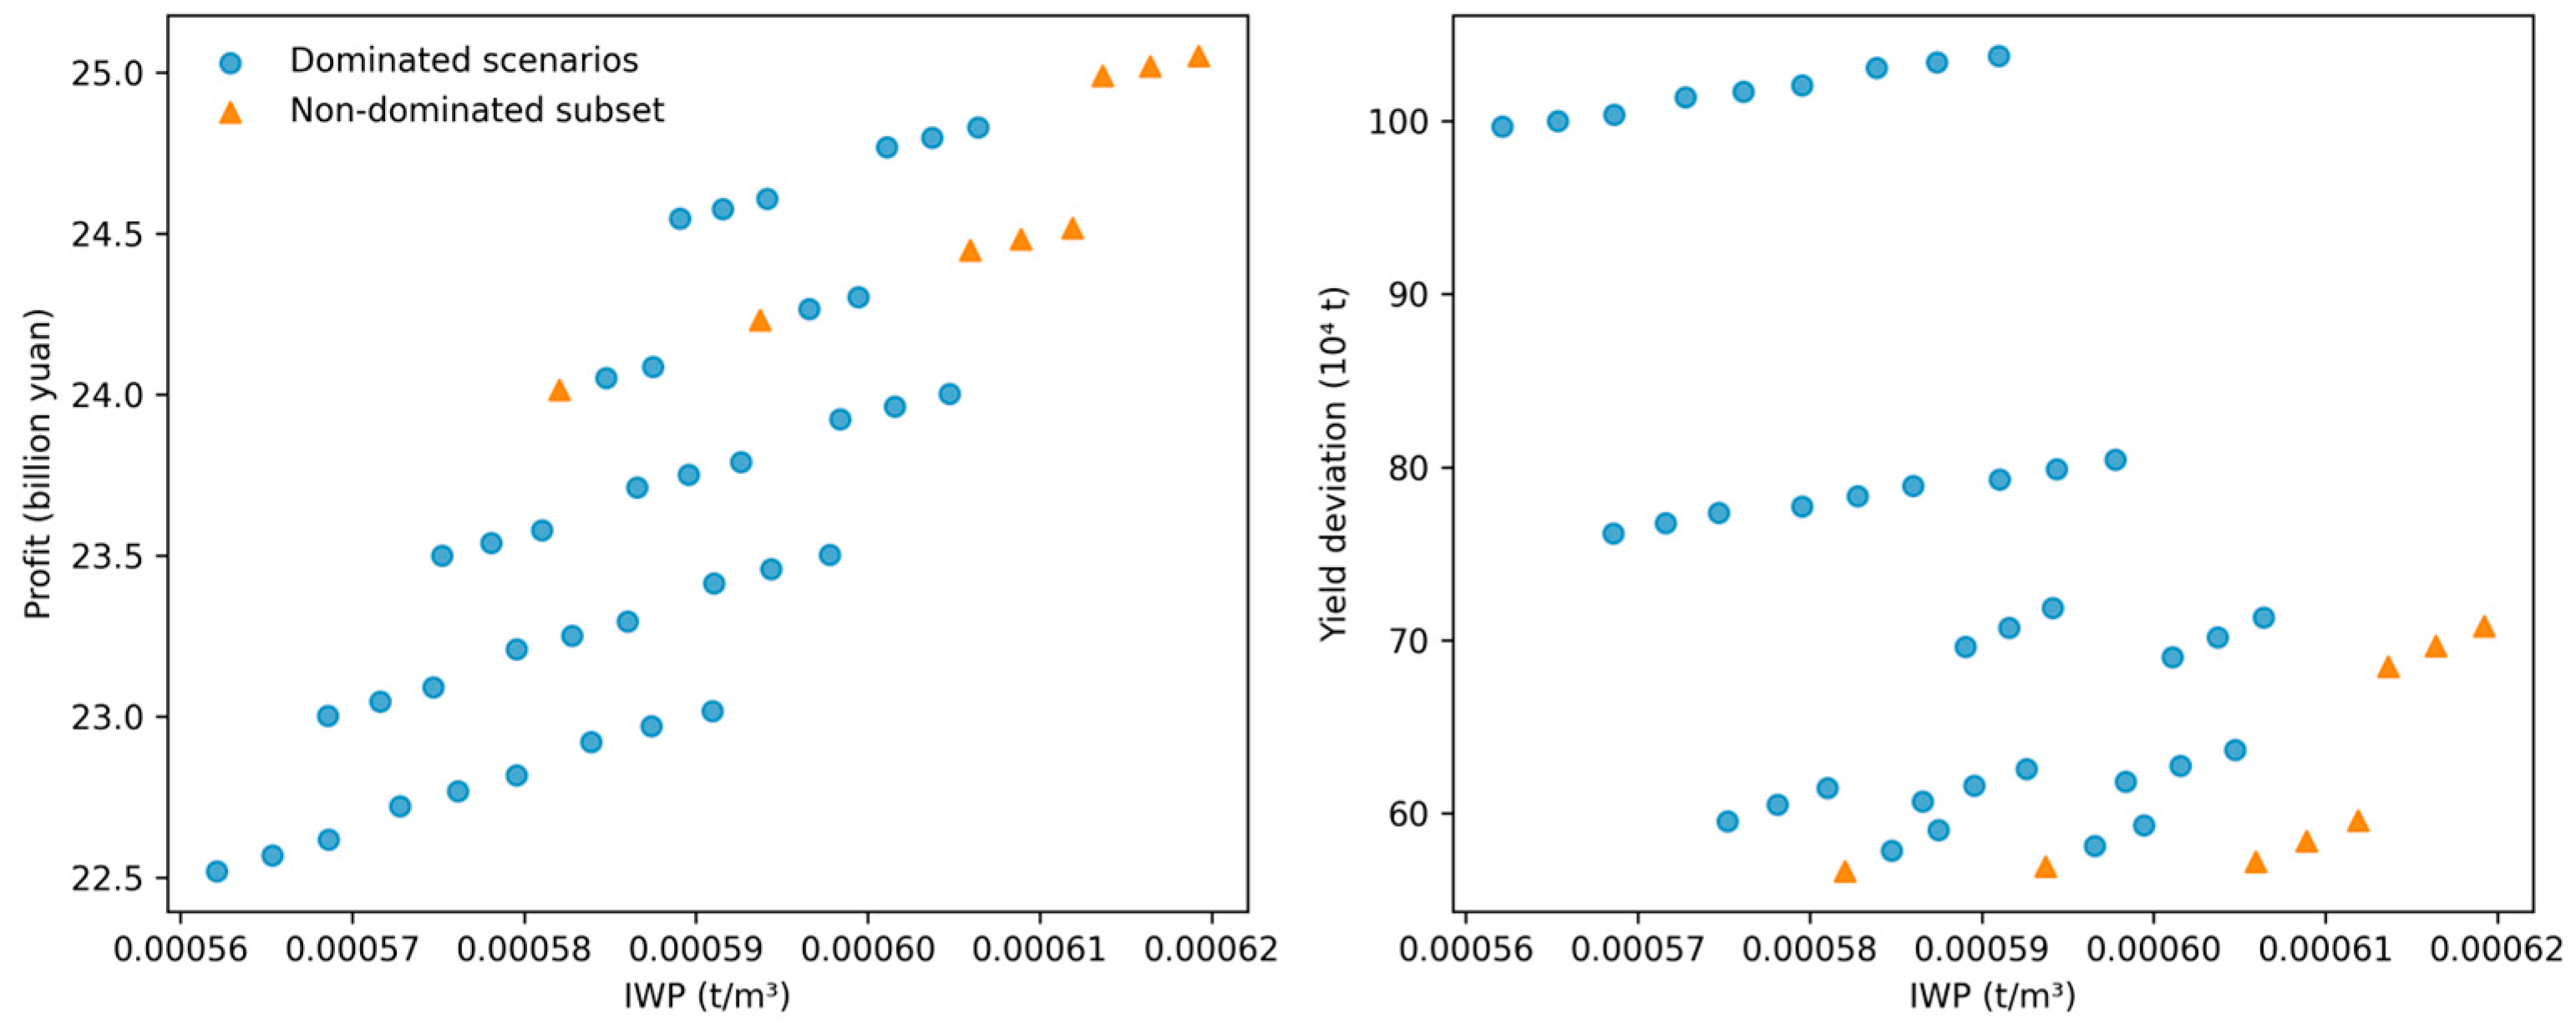
Overall, ad hoc scenario enumeration generates many clearly suboptimal strategies and provides only a sparse set of candidate compromises. By contrast, the full SD–NSGA-II coupling systematically searches the joint decision space and returns a reproducible non-dominated frontier and knee-point strategies. Multi-objective optimisation is, therefore, required not because SD cannot simulate outcomes, but because optimisation is needed to map feasible trade-offs efficiently when coordinated land–water decisions must balance efficiency, income, and yield stability.
References
- FAO. The State of the World’s Land and Water Resources for Food and Agriculture (SOLAW): Managing Systems at Risk; FAO and Earthscan: Rome, Italy, 2011. [Google Scholar]
- IPCC. Climate Change 2021: The Physical Science Basis; Contribution of Working Group I to the Sixth Assessment Report of the Intergovernmental Panel on Climate Change; Intergovernmental Panel on Climate Change: Geneva, Switzerland, 2021. [Google Scholar]
- IPCC. Climate Change 2022: Impacts, Adaptation and Vulnerability; Contribution of Working Group II to the Sixth Assessment Report of the Intergovernmental Panel on Climate Change; Cambridge University Press: Cambridge, UK, 2022. [Google Scholar]
- Lopes, G.R.; Bastos Lima, M.G.; dos Reis, T.N.P. Maldevelopment revisited: Inclusiveness and social impacts of soy expansion over Brazil’s Cerrado in Matopiba. World Dev. 2021, 139, 105316. [Google Scholar] [CrossRef] [Scilit]
- Madani, K. Water management in Iran: What is causing the looming crisis? J. Environ. Stud. Sci. 2014, 4, 315–328. [Google Scholar] [CrossRef] [Scilit]
- Mall, R.K.; Singh, R.; Gupta, A.; Srinivasan, G.; Rathore, L.S. Impact of Climate Change on Indian Agriculture: A Review. Clim. Change 2006, 78, 445–478. [Google Scholar] [CrossRef] [Scilit]
- McGuire, V.L. Water-Level Changes and Change in Water in Storage in the High Plains Aquifer, Predevelopment to 2013 and 2011–13; U.S. Geological Survey: Reston, VA, USA, 2014.
- Steward, D.R.; Bruss, P.J.; Yang, X.; Staggenborg, S.A.; Welch, S.M.; Apley, M.D. Tapping Unsustainable Groundwater Stores for Agricultural Production in the High Plains Aquifer of Kansas, Projections to 2110. Proc. Natl. Acad. Sci. USA 2013, 110. [Google Scholar] [CrossRef] [Scilit]
- Cao, D.; Yi, X.; Chen, X.; Xian, J.; Hu, Q. Water requirement of non-staple crops in the Yellow River Delta based on climate change. Chin. J. Soil Sci. 2022, 53, 795–804. (In Chinese) [Google Scholar]
- Wu, H.; Li, Z.; Deng, X.; Zhao, Z. Enhancing Agricultural Sustainability: Optimizing Crop Planting Structures and Spatial Layouts within the Water-Land-Energy-Economy-Environment-Food Nexus. Geogr. Sustainability 2025, 6, 100258. [Google Scholar] [CrossRef] [Scilit]
- Xu, L.; Xu, B.; Gao, R.; Wang, G.; Tian, D.; Chen, Y.; Zhou, J.; Miao, X.; Wang, P. Study on Water Resource Carrying Capacity and Crop Structure Optimization Based on Gray Relational Analysis. Plants 2025, 14, 685. [Google Scholar] [CrossRef] [Scilit] [PubMed]
- Zhang, H. Climate Change Threatens China’s Rice Bowl. Available online: https://eastasiaforum.org/2023/08/05/climate-change-threatens-chinas-rice-bowl/ (accessed on 5 August 2023).
- Feng, Y.; Guo, Y.; Shen, Y.; Zhang, G.; Wang, Y.; Chen, X. Change of Crop Structure Intensified Water Supply-Demand Imbalance in China’s Black Soil Granary. Agric. Water Manag. 2024, 306, 109199. [Google Scholar] [CrossRef] [Scilit]
- He, L.; Du, B.; Xiong, L.; Wang, P.; Zhang, W.; Imran, M.; Sun, G.; Yuan, F.; Liu, Z.; Yao, X. Enhancing Food Security and Farmers’ Profit through Ratoon Rice-Potato Rotation in Central China. Eur. J. Agron. 2025, 168, 127636. [Google Scholar] [CrossRef] [Scilit]
- Deng, Y.; Zhang, L. Water rights trading and agricultural water use efficiency: Evidence from China. Water 2025, 17, 2047. [Google Scholar] [CrossRef] [Scilit]
- Qi, P.; Sun, J.; Zhang, G. Optimal allocation of water and land resources considering crop water demand process from the perspective of water–carbon–economy nexus. J. Hydrol. 2025, 654, 132831. [Google Scholar] [CrossRef] [Scilit]
- Reca, J.; Roldán, J.; Alcaide, M.; López, R.; Camacho, E. Optimisation Model for Water Allocation in Deficit Irrigation Systems I. Description of the Model. Agric. Water Manag. 2001, 48, 103–116. [Google Scholar] [CrossRef] [Scilit]
- Yin, N.; Luo, S.; Xia, Y. Policy effects of China’s water rights trading on grain production: The role of market incentives in promoting sustainability. Front. Sustain. Food Syst. 2025, 9, 1607156. [Google Scholar] [CrossRef] [Scilit]
- Fereres, E.; Soriano, M.A. Deficit irrigation for reducing agricultural water use. J. Exp. Bot. 2007, 58, 147–159. [Google Scholar] [CrossRef] [Scilit]
- Geerts, S.; Raes, D. Deficit irrigation as an on-farm strategy to maximize crop water productivity in dry areas. Agric. Water Manag. 2009, 96, 1275–1284. [Google Scholar] [CrossRef] [Scilit]
- Chai, Q.; Gan, Y.; Zhao, C.; Xu, H.-L.; Waskom, R.M.; Niu, Y.; Siddique, K.H.M. Regulated Deficit Irrigation for Crop Production under Drought Stress. A Review. Agron. Sustain. Dev. 2016, 36, 3. [Google Scholar] [CrossRef] [Scilit]
- Johansson, R.C.; Tsur, Y.; Roe, T.L.; Doukkali, R.M.; Dinar, A. Pricing irrigation water: A review of theory and practice. Water Policy 2002, 4, 173–199. [Google Scholar] [CrossRef] [Scilit]
- Tsur, Y.; Dinar, A.; Doukkali, R.M.; Roe, T. Irrigation water pricing: Policy implications based on international comparison. Environ. Dev. Econ. 2004, 9, 735–755. [Google Scholar] [CrossRef] [Scilit]
- Molle, F.; Berkoff, J. (Eds.) Irrigation Water Pricing: The Gap Between Theory and Practice; CABI: Wallingford, UK, 2007. [Google Scholar]
- Su, R.; Sui, H.; Ren, G.; Wang, Q. Evaluation of Crop Structure Optimization Policy Quantitatively and Future Directions in China: A PMC-Index Model Approach. Front. Sustainable Food Syst. 2024, 8, 1422614. [Google Scholar] [CrossRef] [Scilit]
- Zhou, J.; Luo, Y.; Wang, J.; Dou, J.; Wang, L.; Shi, W.; Zhang, D.; Wei, W.; Zhu, G. Impacts of Planting Structure Adjustment on Water Saving in the Shiyang River Basin of Arid Region. Sci. Rep. 2024, 14, 30732. [Google Scholar] [CrossRef] [Scilit] [PubMed]
- Lesk, C.; Anderson, W.; Rigden, A.; Coast, O.; Jägermeyr, J.; McDermid, S.; Davis, K.F.; Konar, M. Compound Heat and Moisture Extreme Impacts on Global Crop Yields under Climate Change. Nat. Rev. Earth Environ. 2022, 3, 872–889. [Google Scholar] [CrossRef] [Scilit]
- Zhao, Y.; Li, G.; Li, S.; Luo, Y.; Bai, Y. A Review on the Optimization of Irrigation Schedules for Farmlands Based on a Simulation–Optimization Model. Water 2024, 16, 2545. [Google Scholar] [CrossRef] [Scilit]
- Jamali, M.; Yazdian, H.; Bahman, G.; Eslamian, S. Water Agriculture Nexus a System Dynamics Approach for the next Three Decades. Sci. Rep. 2025, 15, 5946. [Google Scholar] [CrossRef] [Scilit]
- Ortuzar, I.; Serrano, A.; Xabadia, A.; Brouwer, R. Balancing Efficiency and Inequality in a Non-Linear Multi-Regional Water Allocation Optimization Model. Environ. Resour. Econ. 2025, 88, 761–794. [Google Scholar] [CrossRef] [Scilit]
- Shi, R.; Guo, W. Research progress on the optimal allocation of agricultural irrigation water resources. Trans. Chin. Soc. Agric. Eng. 2024, 40, 1–13. [Google Scholar]
- Harou, J.J.; Pulido-Velazquez, M.; Rosenberg, D.E.; Medellín-Azuara, J.; Lund, J.R.; Howitt, R.E. Hydro-Economic Models: Concepts, Design, Applications, and Future Prospects. J. Hydrol. 2009, 375, 627–643. [Google Scholar] [CrossRef] [Scilit]
- Draper, A.J.; Jenkins, M.W.; Kirby, K.W.; Lund, J.R.; Howitt, R.E. Economic-Engineering Optimization for California Water Management. J. Water Resour. Plann. Manag. 2003, 129, 155–164. [Google Scholar] [CrossRef] [Scilit]
- Harou, J.J.; Medellín-Azuara, J.; Zhu, T.; Tanaka, S.K.; Lund, J.R.; Stine, S.; Olivares, M.A.; Jenkins, M.W. Economic Consequences of Optimized Water Management for a Prolonged, Severe Drought in California. Water Resour. Res. 2010, 46, 2008WR007681. [Google Scholar] [CrossRef] [Scilit]
- Esteve, P.; Varela-Ortega, C.; Blanco-Gutiérrez, I.; Downing, T.E. A Hydro-Economic Model for the Assessment of Climate Change Impacts and Adaptation in Irrigated Agriculture. Ecol. Econ. 2015, 120, 49–58. [Google Scholar] [CrossRef] [Scilit]
- Valle-García, Á.; Montilla-López, N.M.; Parrado, R.; Berbel, J.; Martínez-Dalmau, J.; Kahil, T.; Gutiérrez-Martín, C. Integrated Assessment of Resilience to Drought by Coupling Hydro-Economic and Macroeconomic Models. J. Hydrol. 2025, 661, 133549. [Google Scholar] [CrossRef] [Scilit]
- Winz, I.; Brierley, G.; Trowsdale, S. The Use of System Dynamics Simulation in Water Resources Management. Water Resour. Manag. 2009, 23, 1301–1323. [Google Scholar] [CrossRef] [Scilit]
- Simonovic, S.P. World Water Dynamics: Global Modeling of Water Resources. J. Environ. Manag. 2002, 66, 249–267. [Google Scholar] [CrossRef] [Scilit]
- Mirchi, A.; Madani, K.; Watkins, D.; Ahmad, S. Synthesis of System Dynamics Tools for Holistic Conceptualization of Water Resources Problems. Water Resour. Manag. 2012, 26, 2421–2442. [Google Scholar] [CrossRef] [Scilit]
- Zomorodian, M.; Lai, S.H.; Homayounfar, M.; Ibrahim, S.; Fatemi, S.E.; El-Shafie, A. The State-of-the-Art System Dynamics Application in Integrated Water Resources Modeling. J. Environ. Manag. 2018, 227, 294–304. [Google Scholar] [CrossRef] [Scilit]
- Barati, A.A.; Azadi, H.; Scheffran, J. A System Dynamics Model of Smart Groundwater Governance. Agric. Water Manag. 2019, 221, 502–518. [Google Scholar] [CrossRef] [Scilit]
- Qin, H.; Zheng, C.; He, X.; Refsgaard, J.C. Analysis of Water Management Scenarios Using Coupled Hydrological and System Dynamics Modeling. Water Resour. Manag. 2019, 33, 4849–4863. [Google Scholar] [CrossRef] [Scilit]
- Vandal, T.; Kodra, E.; Ganguly, S.; Michaelis, A.; Nemani, R.; Ganguly, A.R. DeepSD: Generating High Resolution Climate Change Projections through Single Image Super-Resolution. In Proceedings of the 23rd ACM SIGKDD International Conference on Knowledge Discovery and Data Mining, Halifax, NS, Canada, 13–17 August 2017; Association for Computing Machinery: New York, NY, USA; pp. 1663–1672.
- Quesada-Chacón, D.; Barfus, K.; Bernhofer, C. Repeatable high-resolution statistical downscaling through deep learning. Geosci. Model Dev. 2022, 15, 7353–7370. [Google Scholar] [CrossRef] [Scilit]
- Sun, Y.; Deng, K.; Ren, K.; Liu, J.; Deng, C.; Jin, Y. Deep Learning in Statistical Downscaling for Deriving High Spatial Resolution Gridded Meteorological Data: A Systematic Review. Isprs J. Photogramm. Remote Sens. 2024, 208, 14–38. [Google Scholar] [CrossRef] [Scilit]
- Deb, K.; Pratap, A.; Agarwal, S.; Meyarivan, T. A Fast and Elitist Multiobjective Genetic Algorithm: NSGA-II. IEEE Trans. Evol. Comput. 2002, 6, 182–197. [Google Scholar] [CrossRef] [Scilit]
- Reed, P.M.; Hadka, D.; Herman, J.D.; Kasprzyk, J.R.; Kollat, J.B. Evolutionary Multiobjective Optimization in Water Resources: The Past, Present, and Future. Adv. Water Resour. 2013, 51, 438–456. [Google Scholar] [CrossRef] [Scilit]
- Gao, X.; Qin, G.; Yin, F.; Liu, J.; Lin, H.; YueWen; Wang, Z.; Javed, T.; Zhang, J.; Wang, Z. Multi-Objective Optimization of Cropping Structures and Irrigation Strategies for Sustainable Agricultural Development in Arid Regions. Agric. Water Manag. 2025, 321, 109909. [Google Scholar] [CrossRef] [Scilit]
- Satopaa, V.; Albrecht, J.; Irwin, D.; Raghavan, B. Finding a “Kneedle” in a Haystack: Detecting Knee Points in System Behavior. In 2011 31st International Conference on Distributed Computing Systems Workshops, Minneapolis, MN, USA, 20–24 June 2011; IEEE: Minneapolis, MN, USA, 2011; pp. 166–171. [Google Scholar]
- He, H.; Li, M.; Zhao, L.; Yu, J.; Li, Q.; Hu, Z. Climate change aggravates the spatiotemporal imbalance of water resources in the rice–wheat rotation region of the middle and lower Yangtze river. Theor. Appl. Climatol. 2025, 156, 455. [Google Scholar] [CrossRef] [Scilit]
- Basir, M.S.; Noel, S.; Buckmaster, D.; Ashik-E-Rabbani, M. Enhancing Subsurface Soil Moisture Forecasting: A Long Short-Term Memory Network Model Using Weather Data. Agriculture 2024, 14, 333. [Google Scholar] [CrossRef] [Scilit]
- Allen, R.; Pereira, L.; Raes, D.; Smith, M.; Allen, R.G.; Pereira, L.S.; Martin, S. Crop Evapotranspiration: Guidelines for Computing Crop Water Requirements; FAO Irrigation and Drainage Paper 56; FAO: Rome, Italy, 1998. [Google Scholar]
- Sun, L.; Dai, S.; Tian, L.; Ni, Z.; Lu, S.; Yao, Y. Optimal Water Allocation Considering Water Diversion Projects in an Agricultural Irrigation District. Agriculture 2025, 15, 949. [Google Scholar] [CrossRef] [Scilit]
- Wi, S.; Steinschneider, S. Assessing the physical realism of deep learning hydrologic model projections under climate change. Water Resour. Res. 2022, 58, e2022WR032123. [Google Scholar] [CrossRef] [Scilit]
- Wilks, D.S. Use of Stochastic Weathergenerators for Precipitation Downscaling. WIREs Clim. Change 2010, 1, 898–907. [Google Scholar] [CrossRef] [Scilit]
- Wilks, D.S. Simultaneous Stochastic Simulation of Daily Precipitation, Temperature and Solar Radiation at Multiple Sites in Complex Terrain. Agric. For. Meteorol. 1999, 96, 85–101. [Google Scholar] [CrossRef] [Scilit]
- Maraun, D.; Shepherd, T.G.; Widmann, M.; Zappa, G.; Walton, D.; Gutiérrez, J.M.; Hagemann, S.; Richter, I.; Soares, P.M.M.; Hall, A.; et al. Towards Process-Informed Bias Correction of Climate Change Simulations. Nat. Clim Change 2017, 7, 764–773. [Google Scholar] [CrossRef] [Scilit]
- Maraun, D. Bias Correcting Climate Change Simulations—A Critical Review. Curr. Clim. Change Rep. 2016, 2, 211–220. [Google Scholar] [CrossRef] [Scilit]
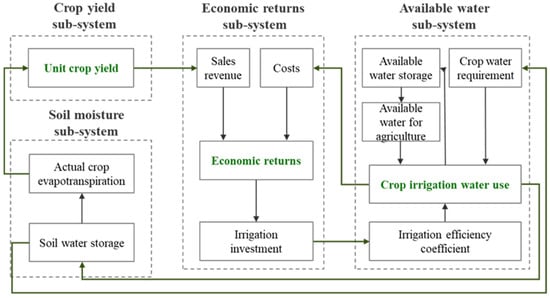
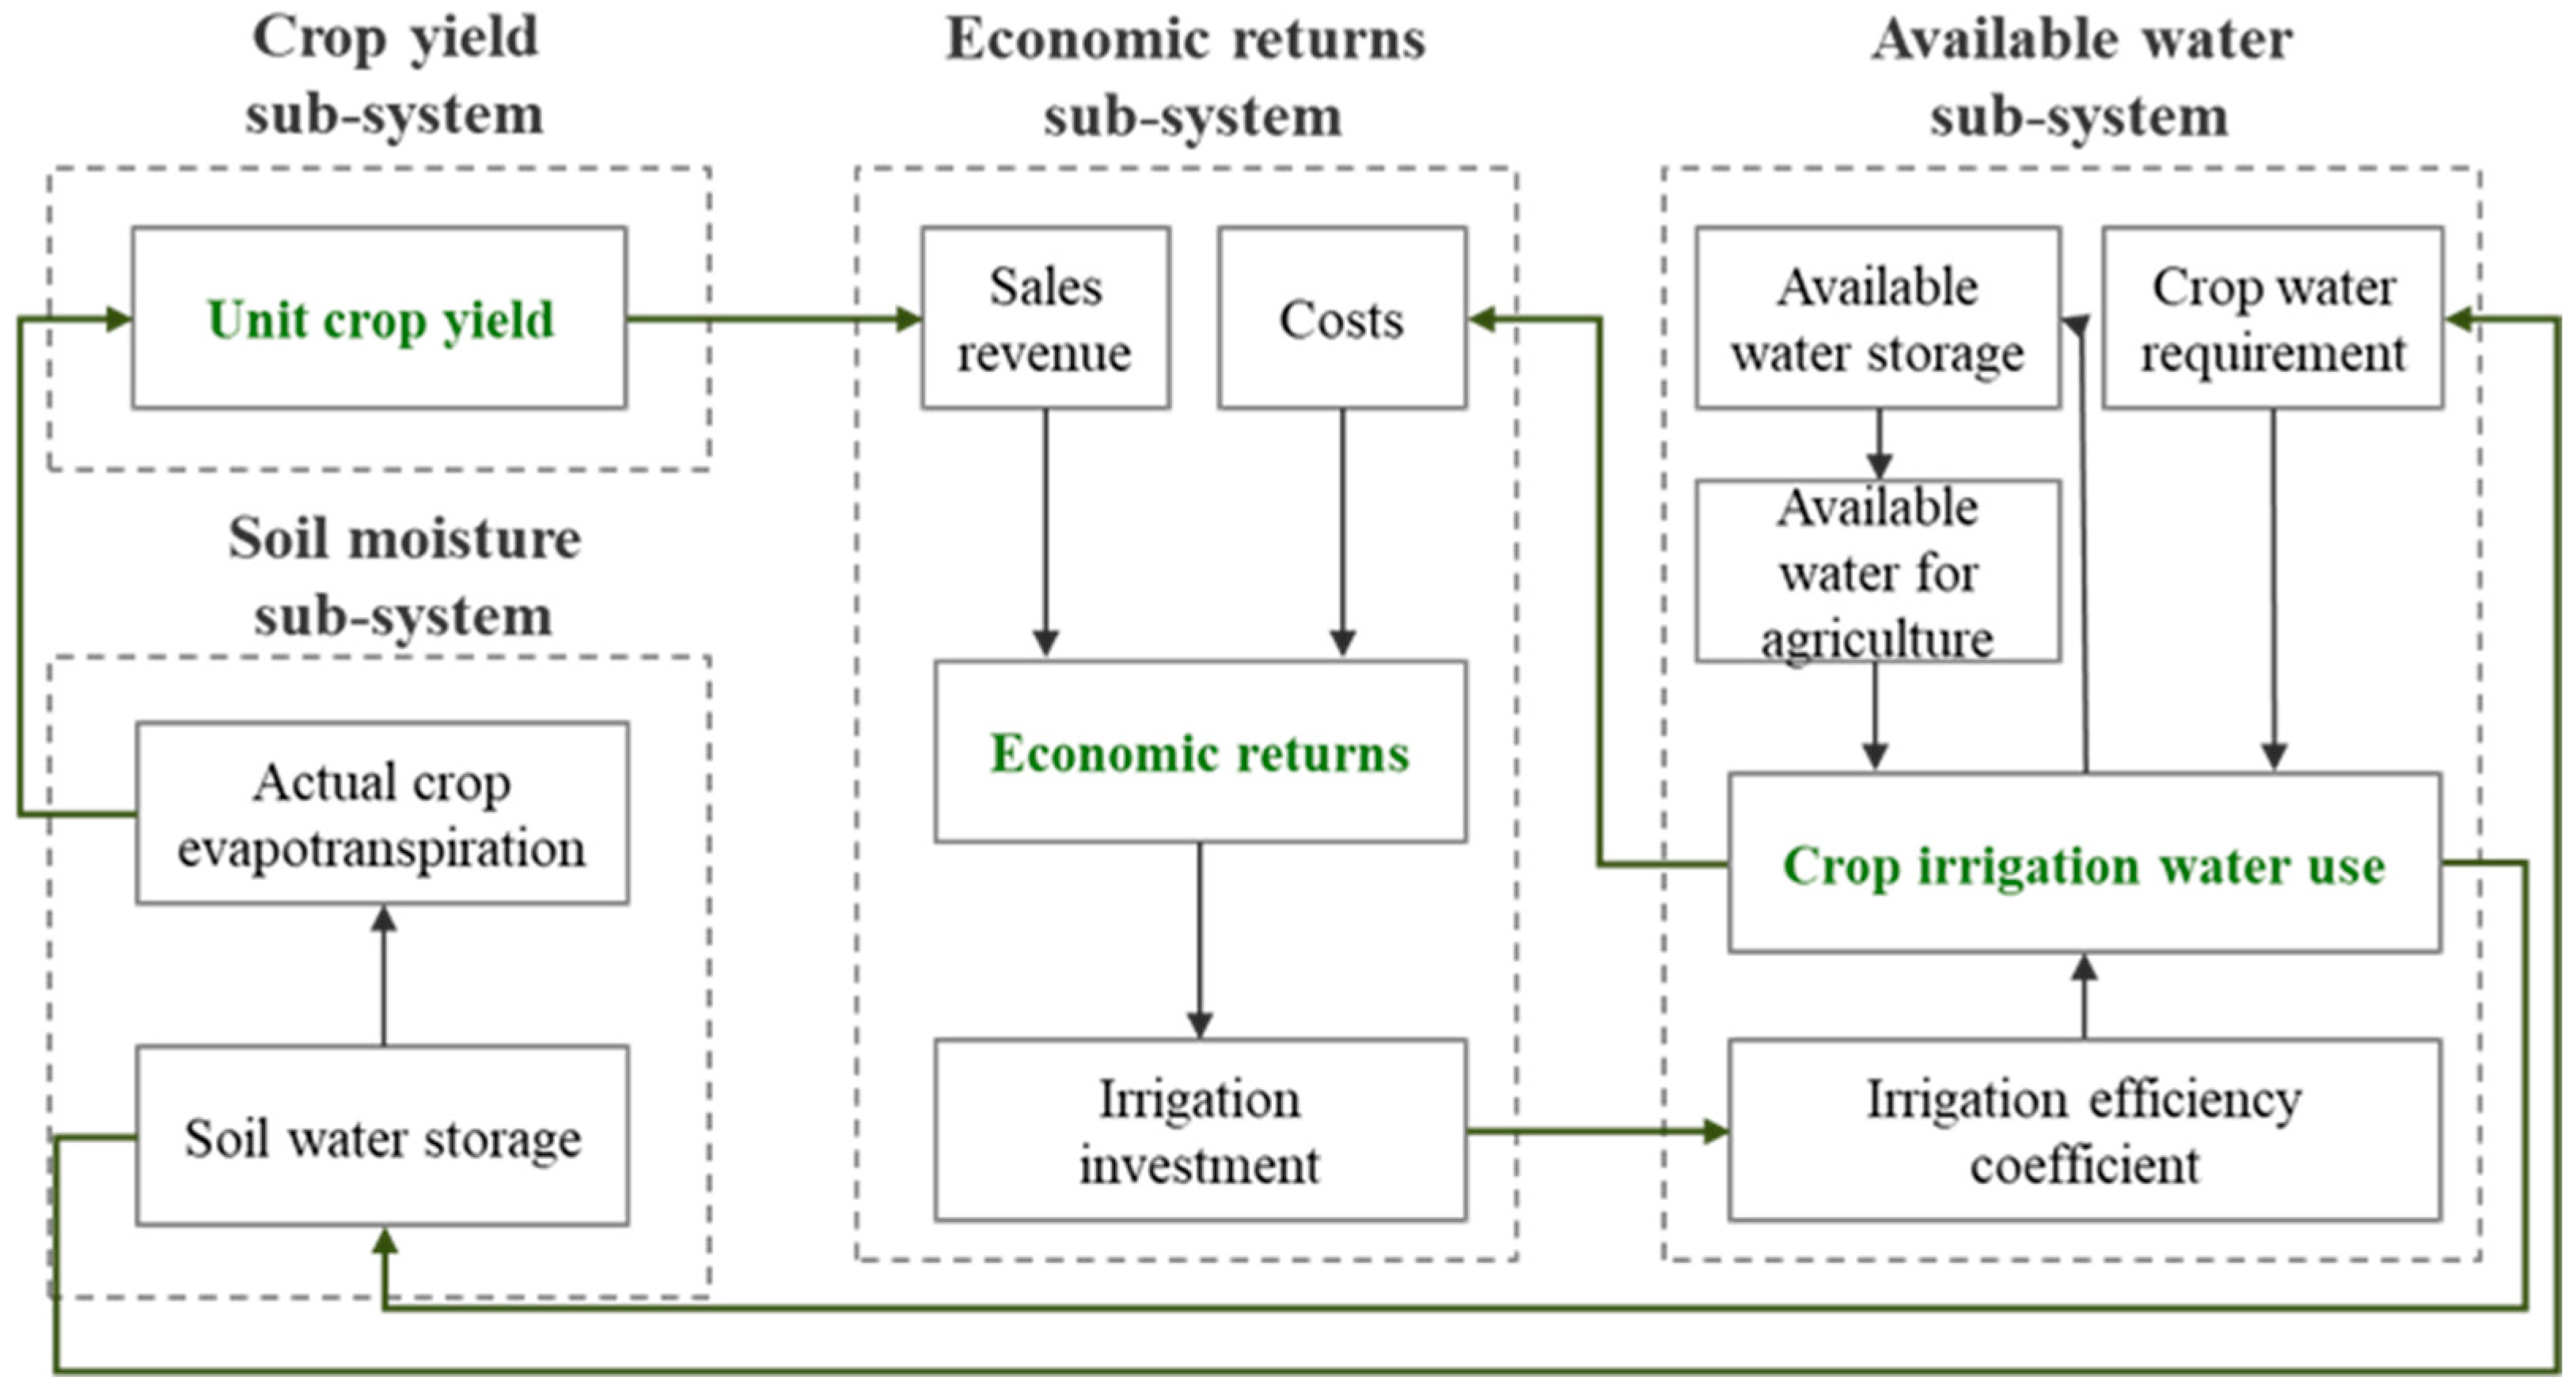
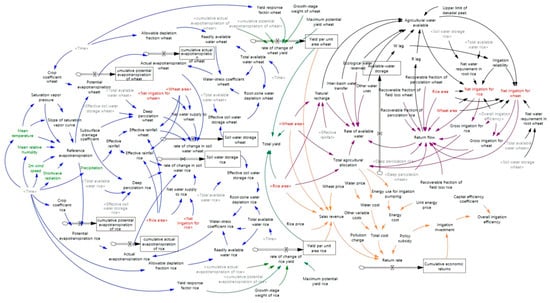
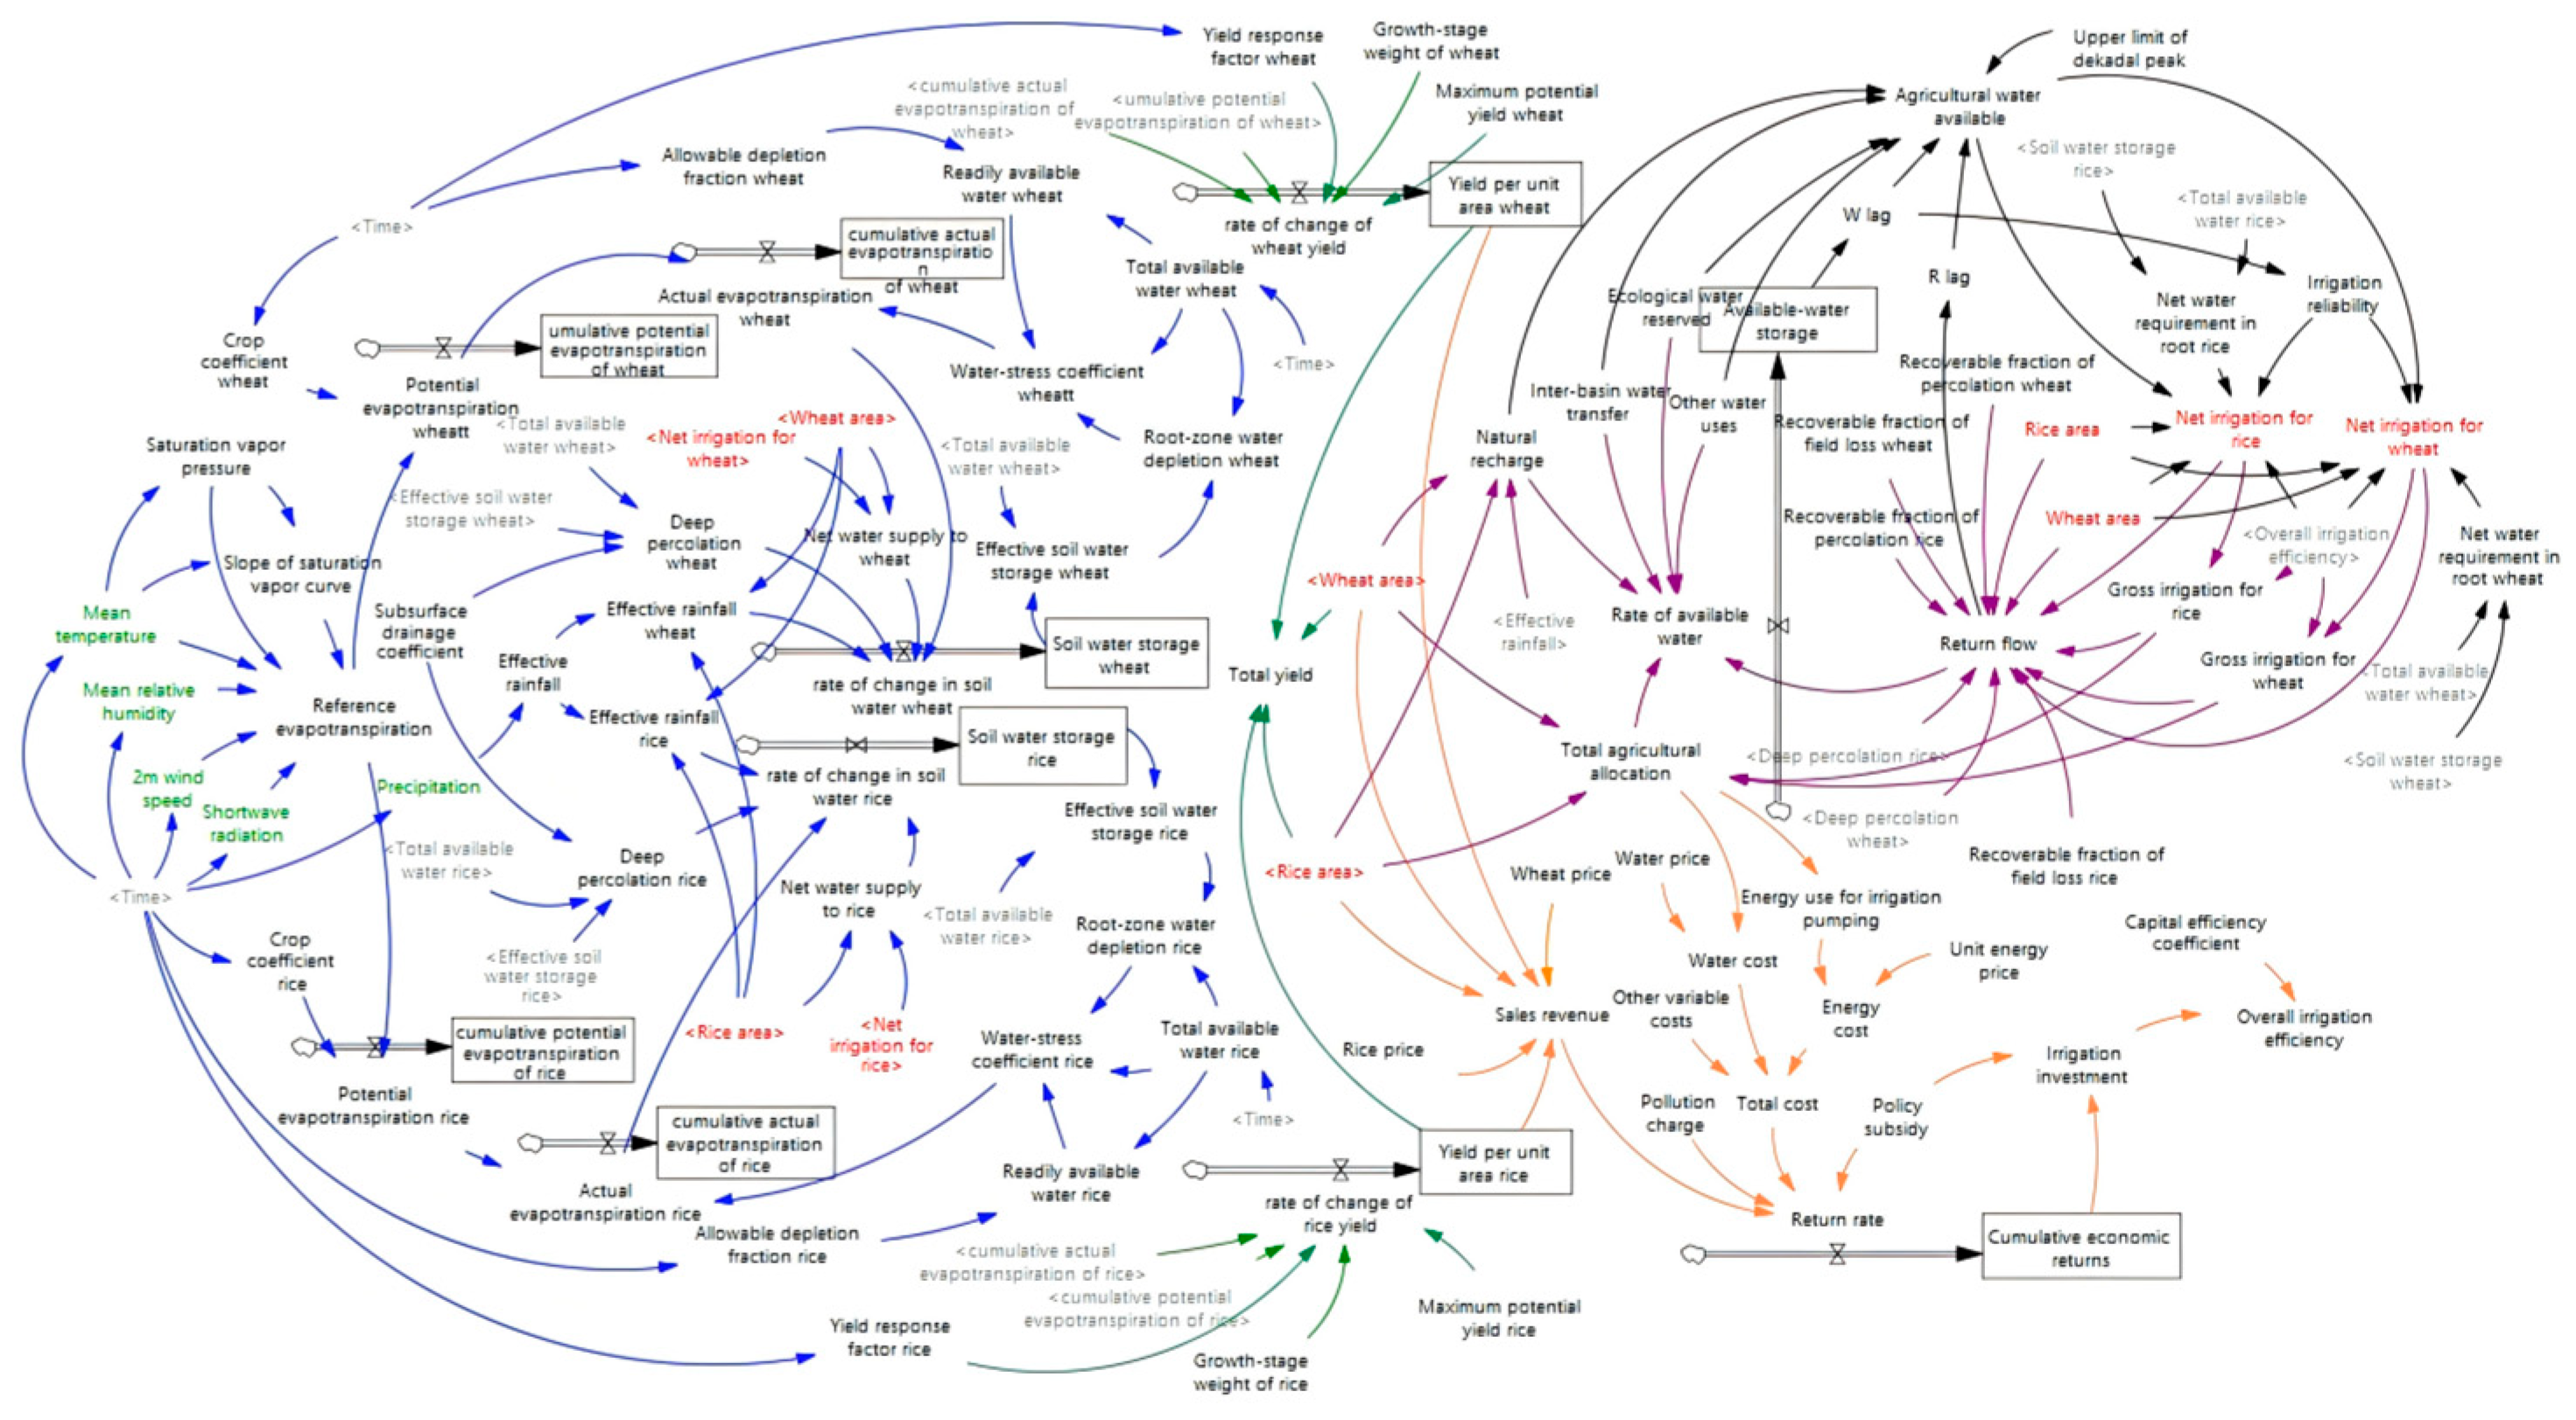
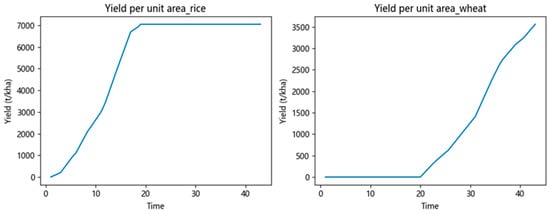
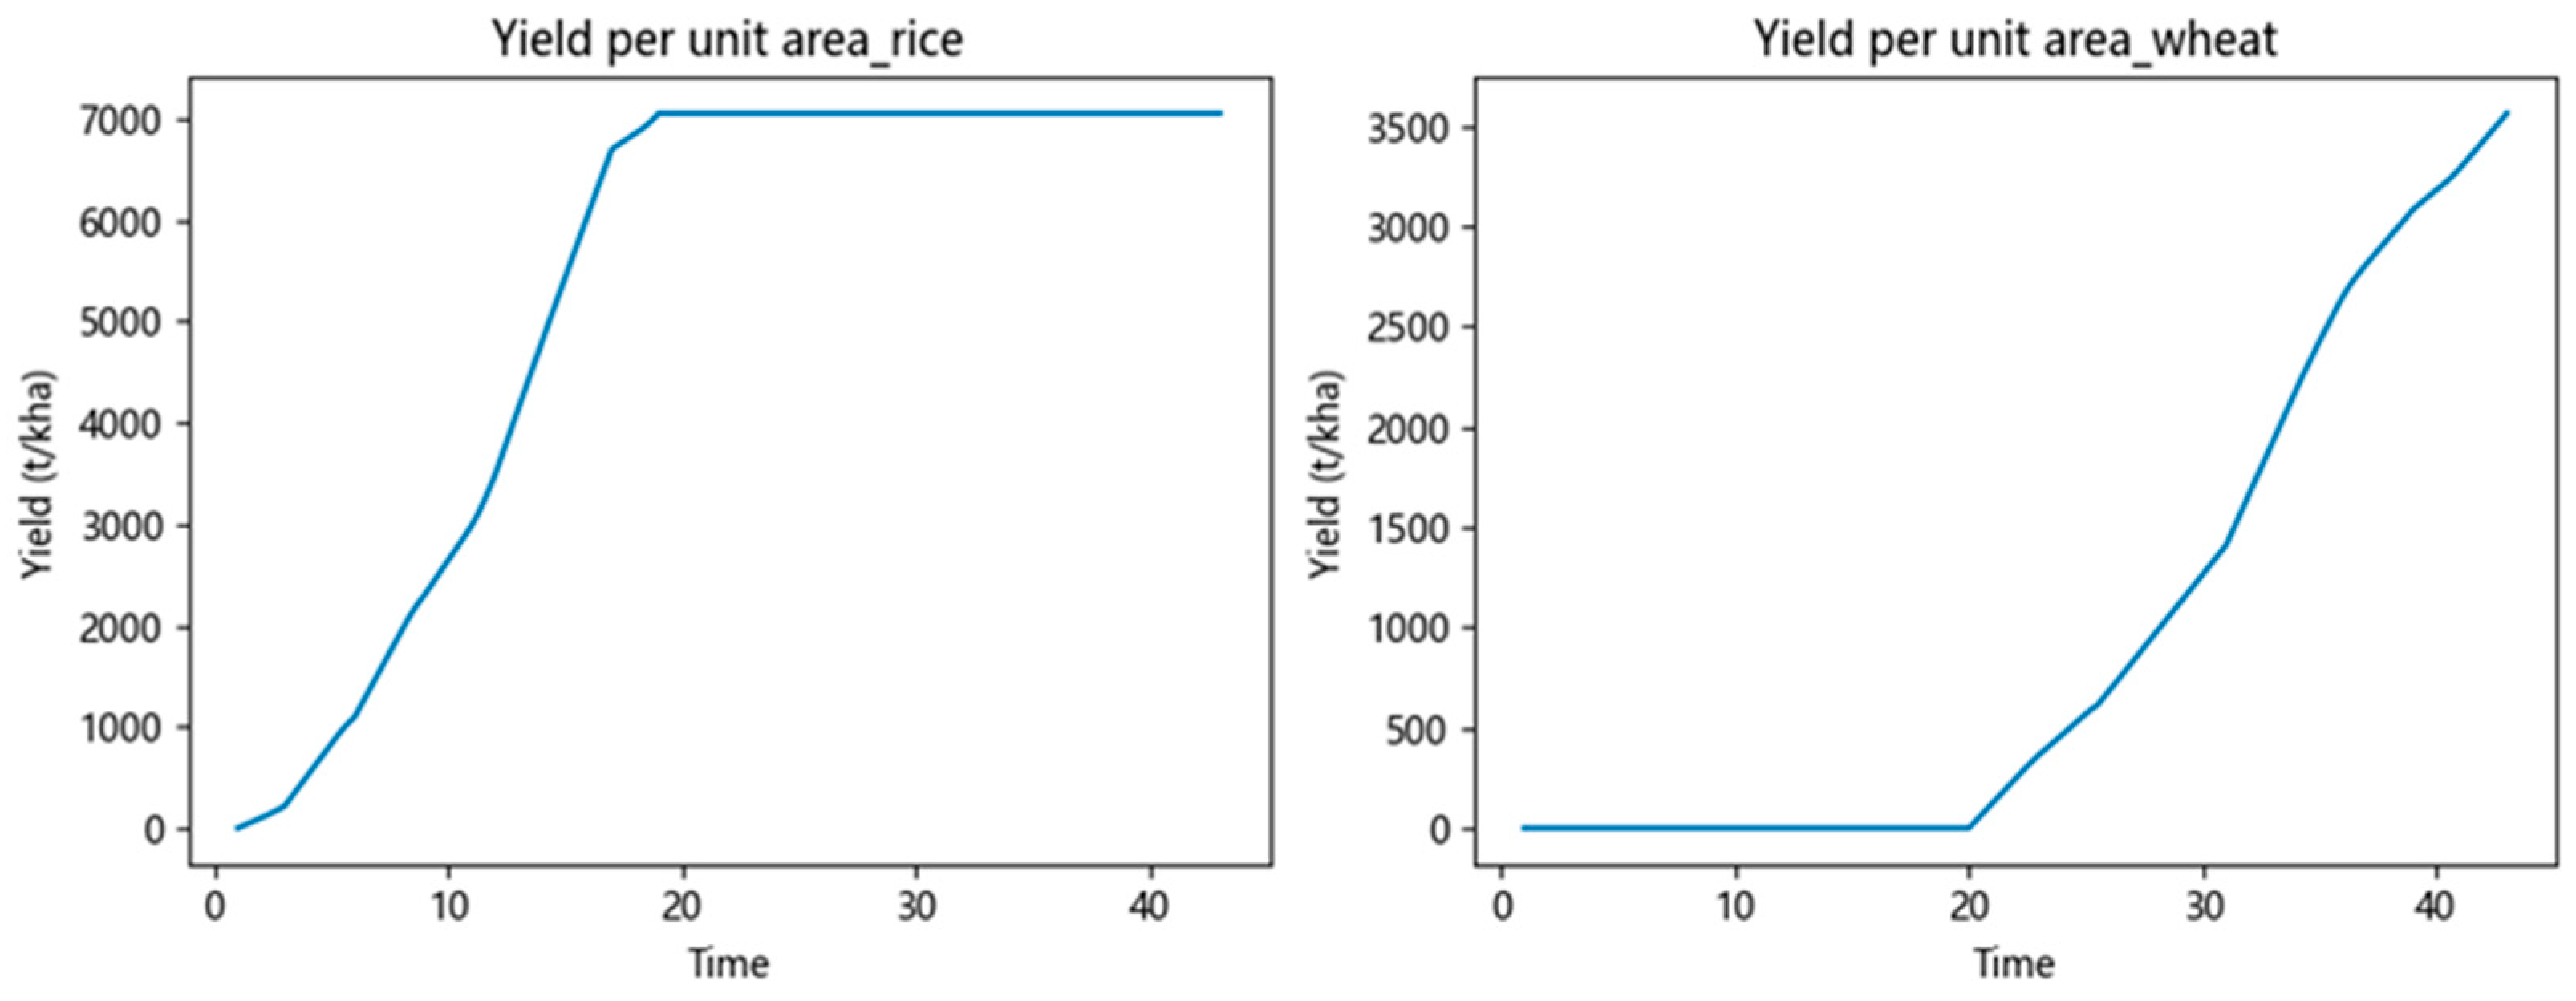
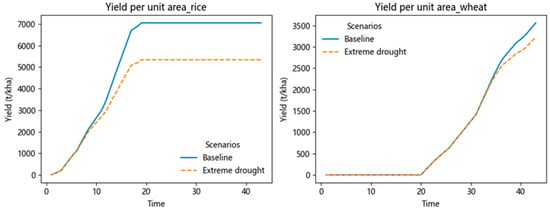
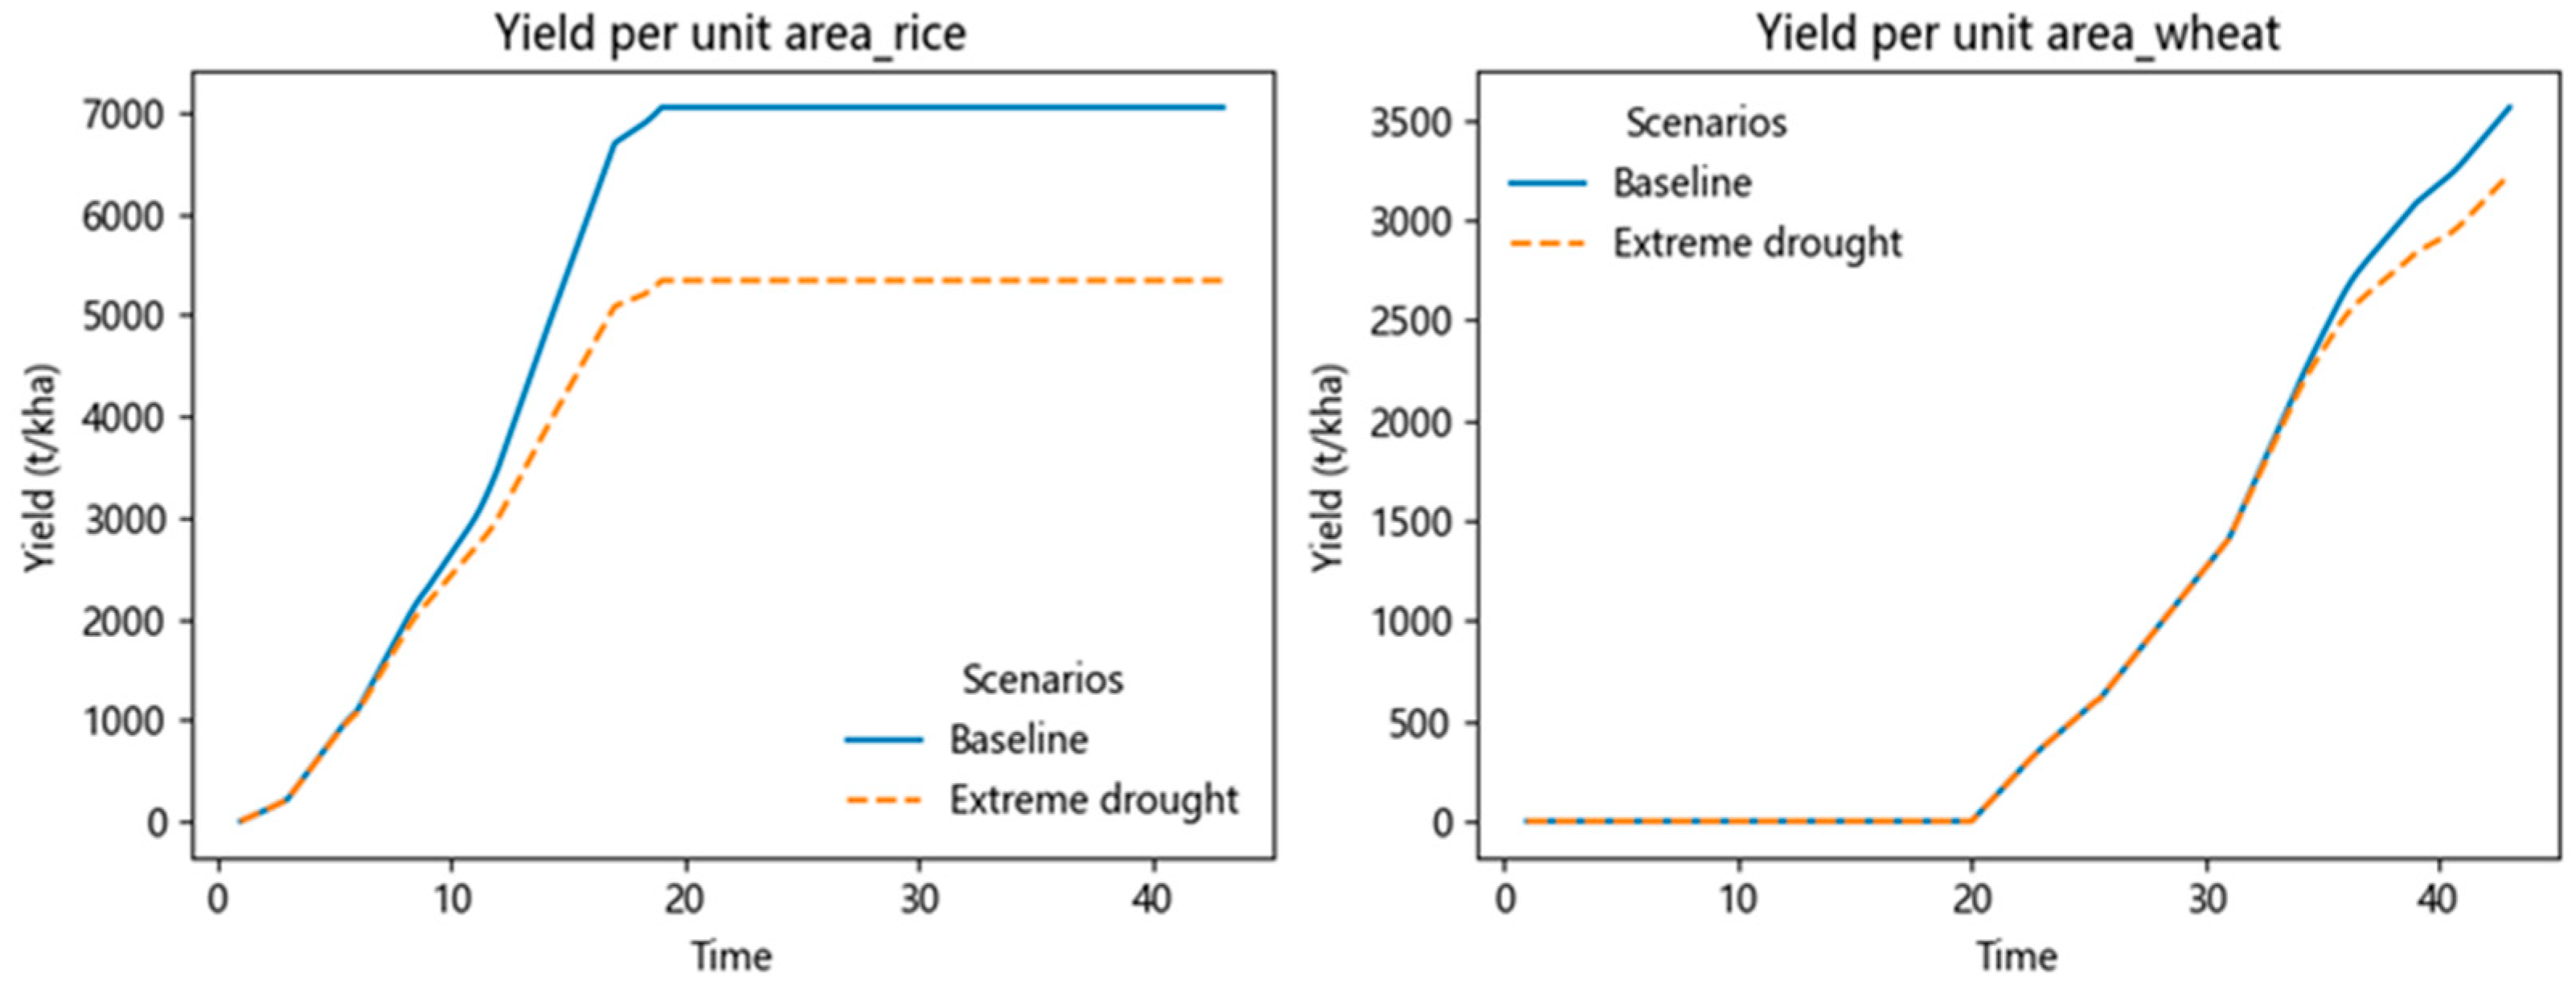
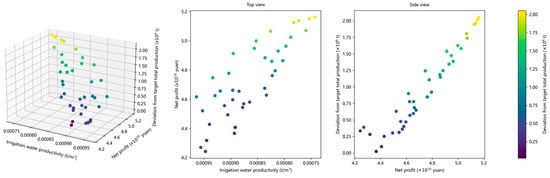
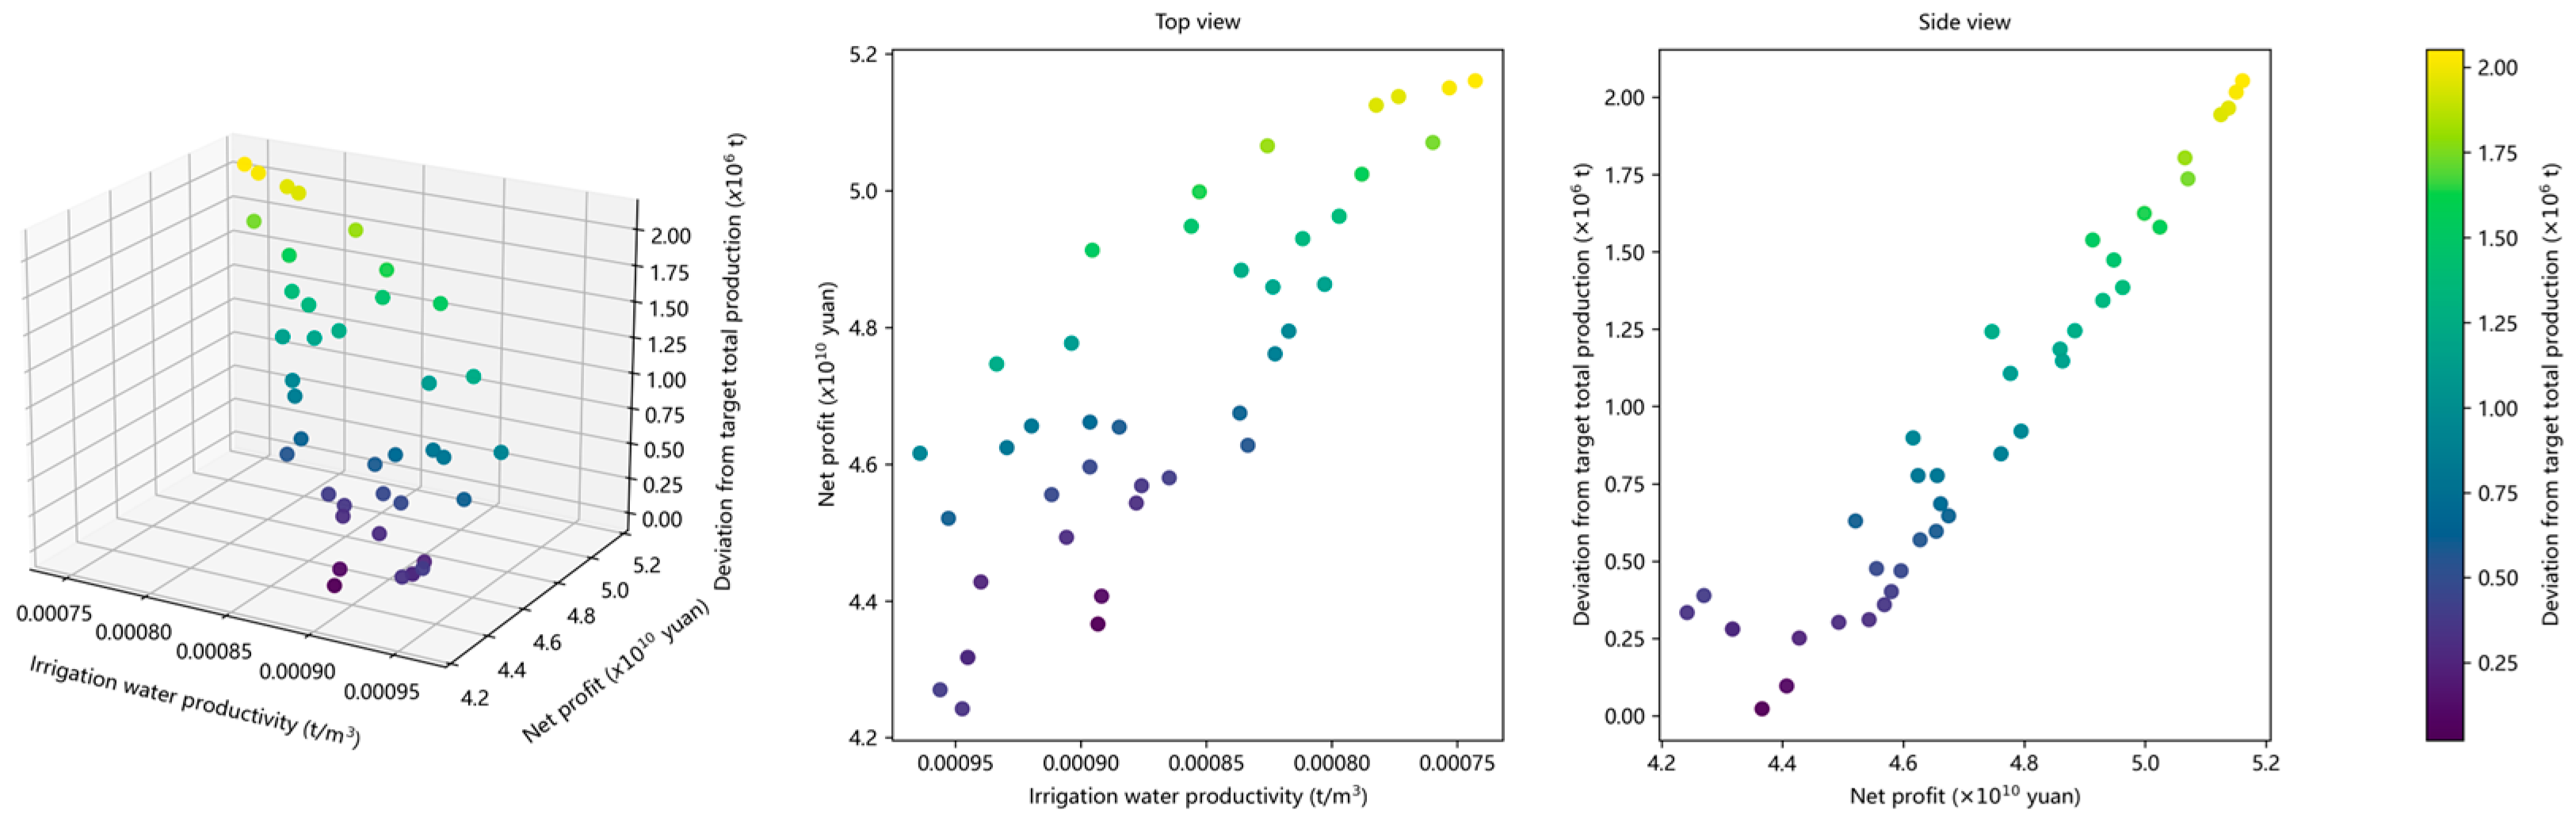
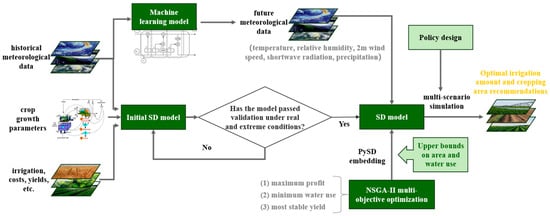
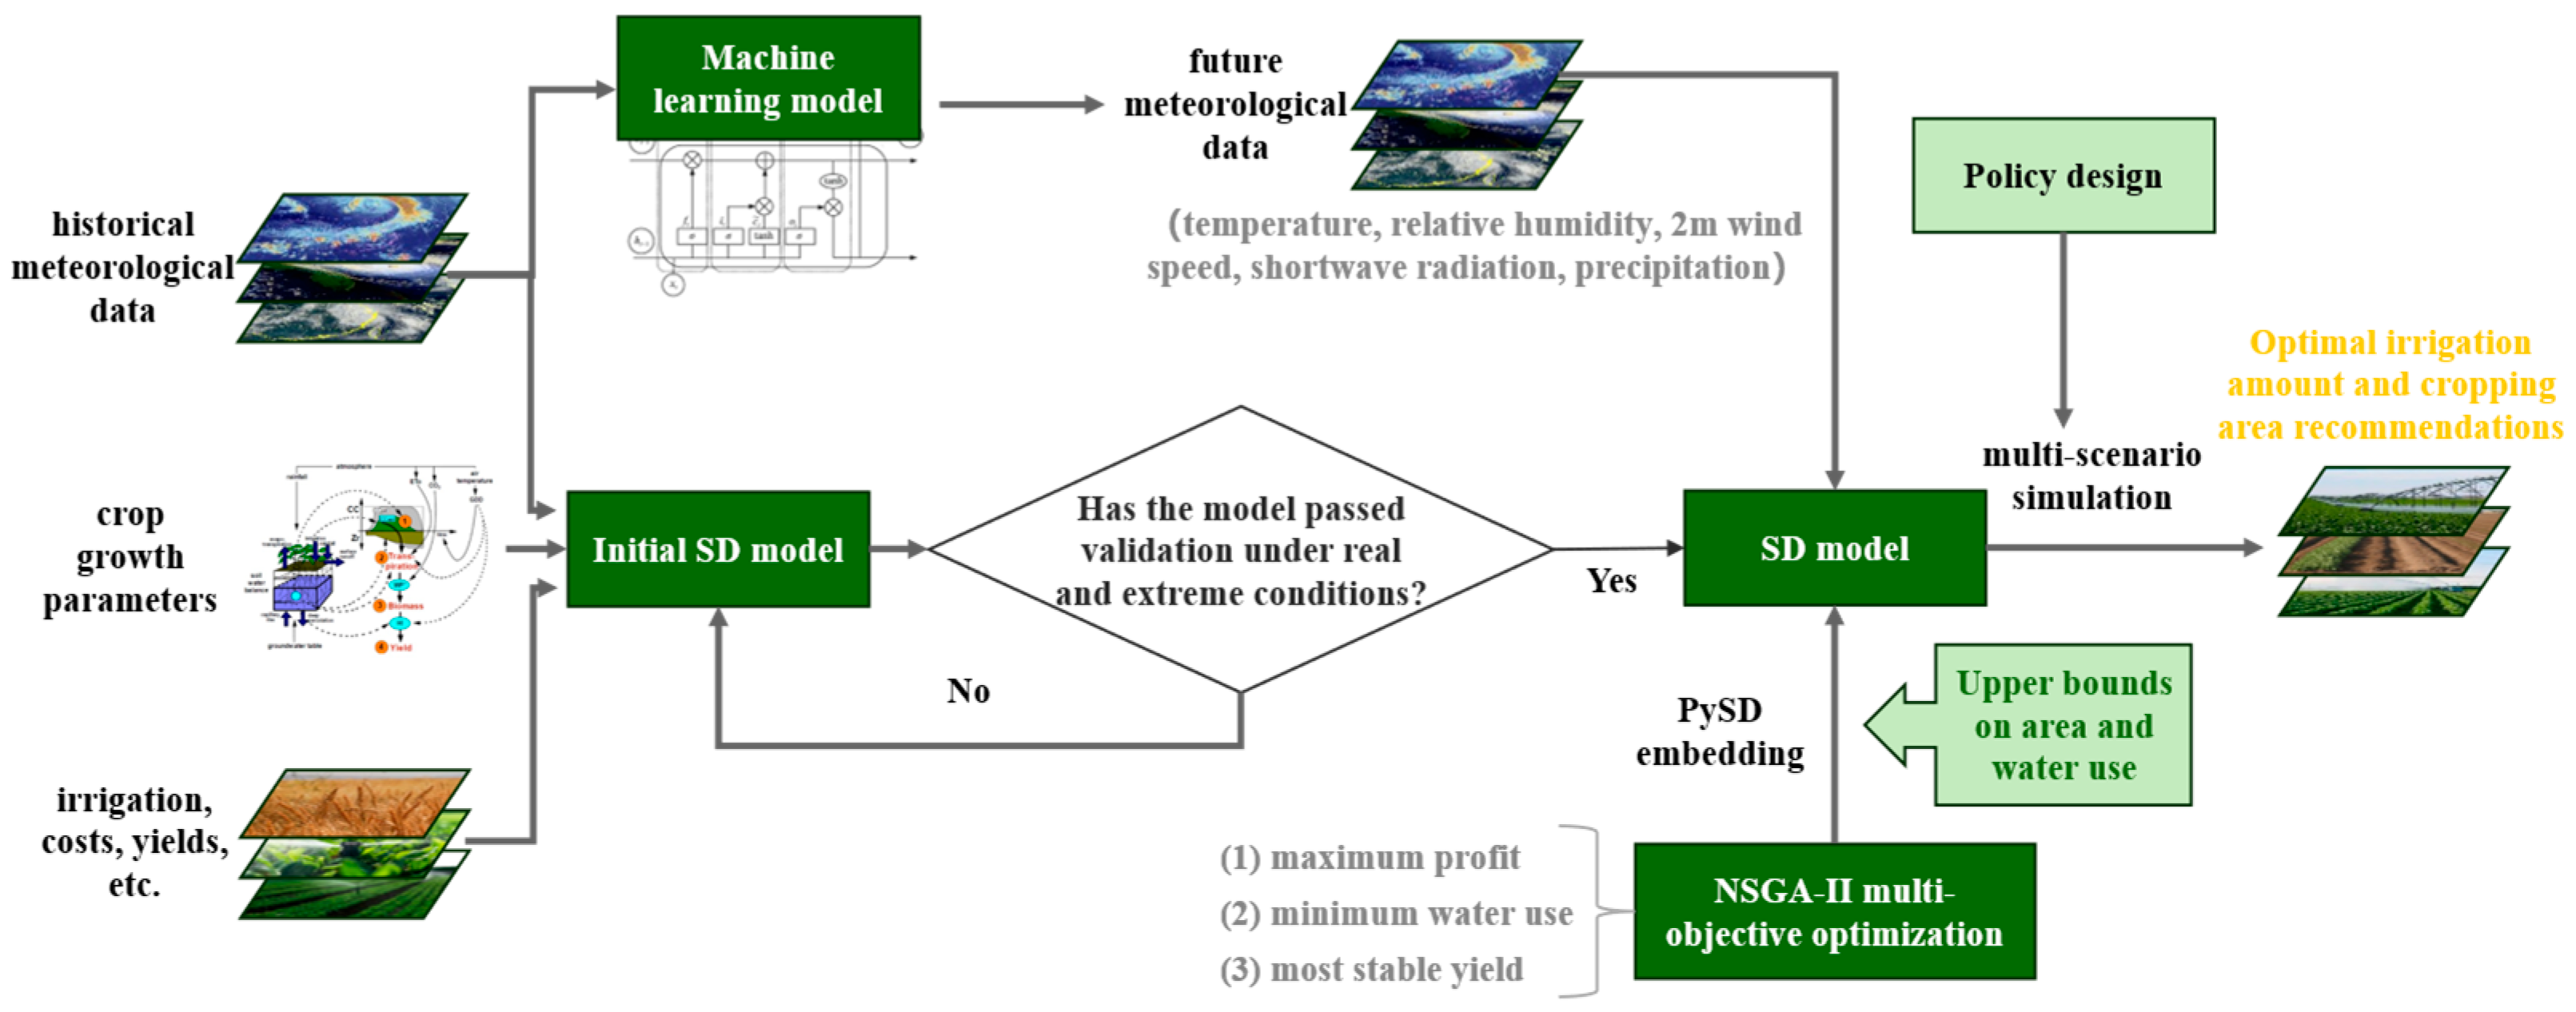
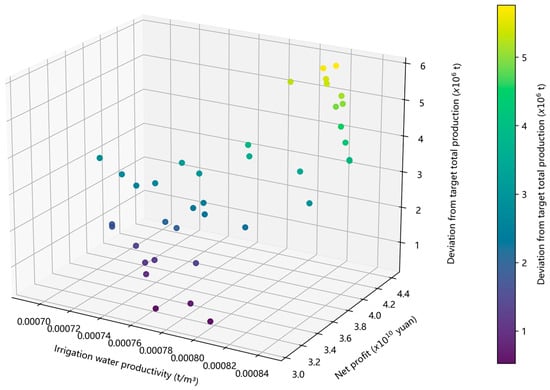
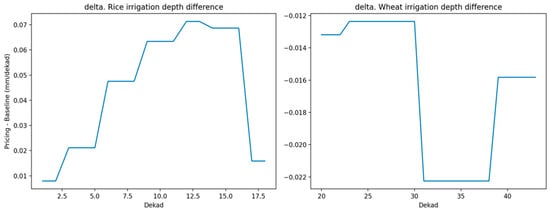
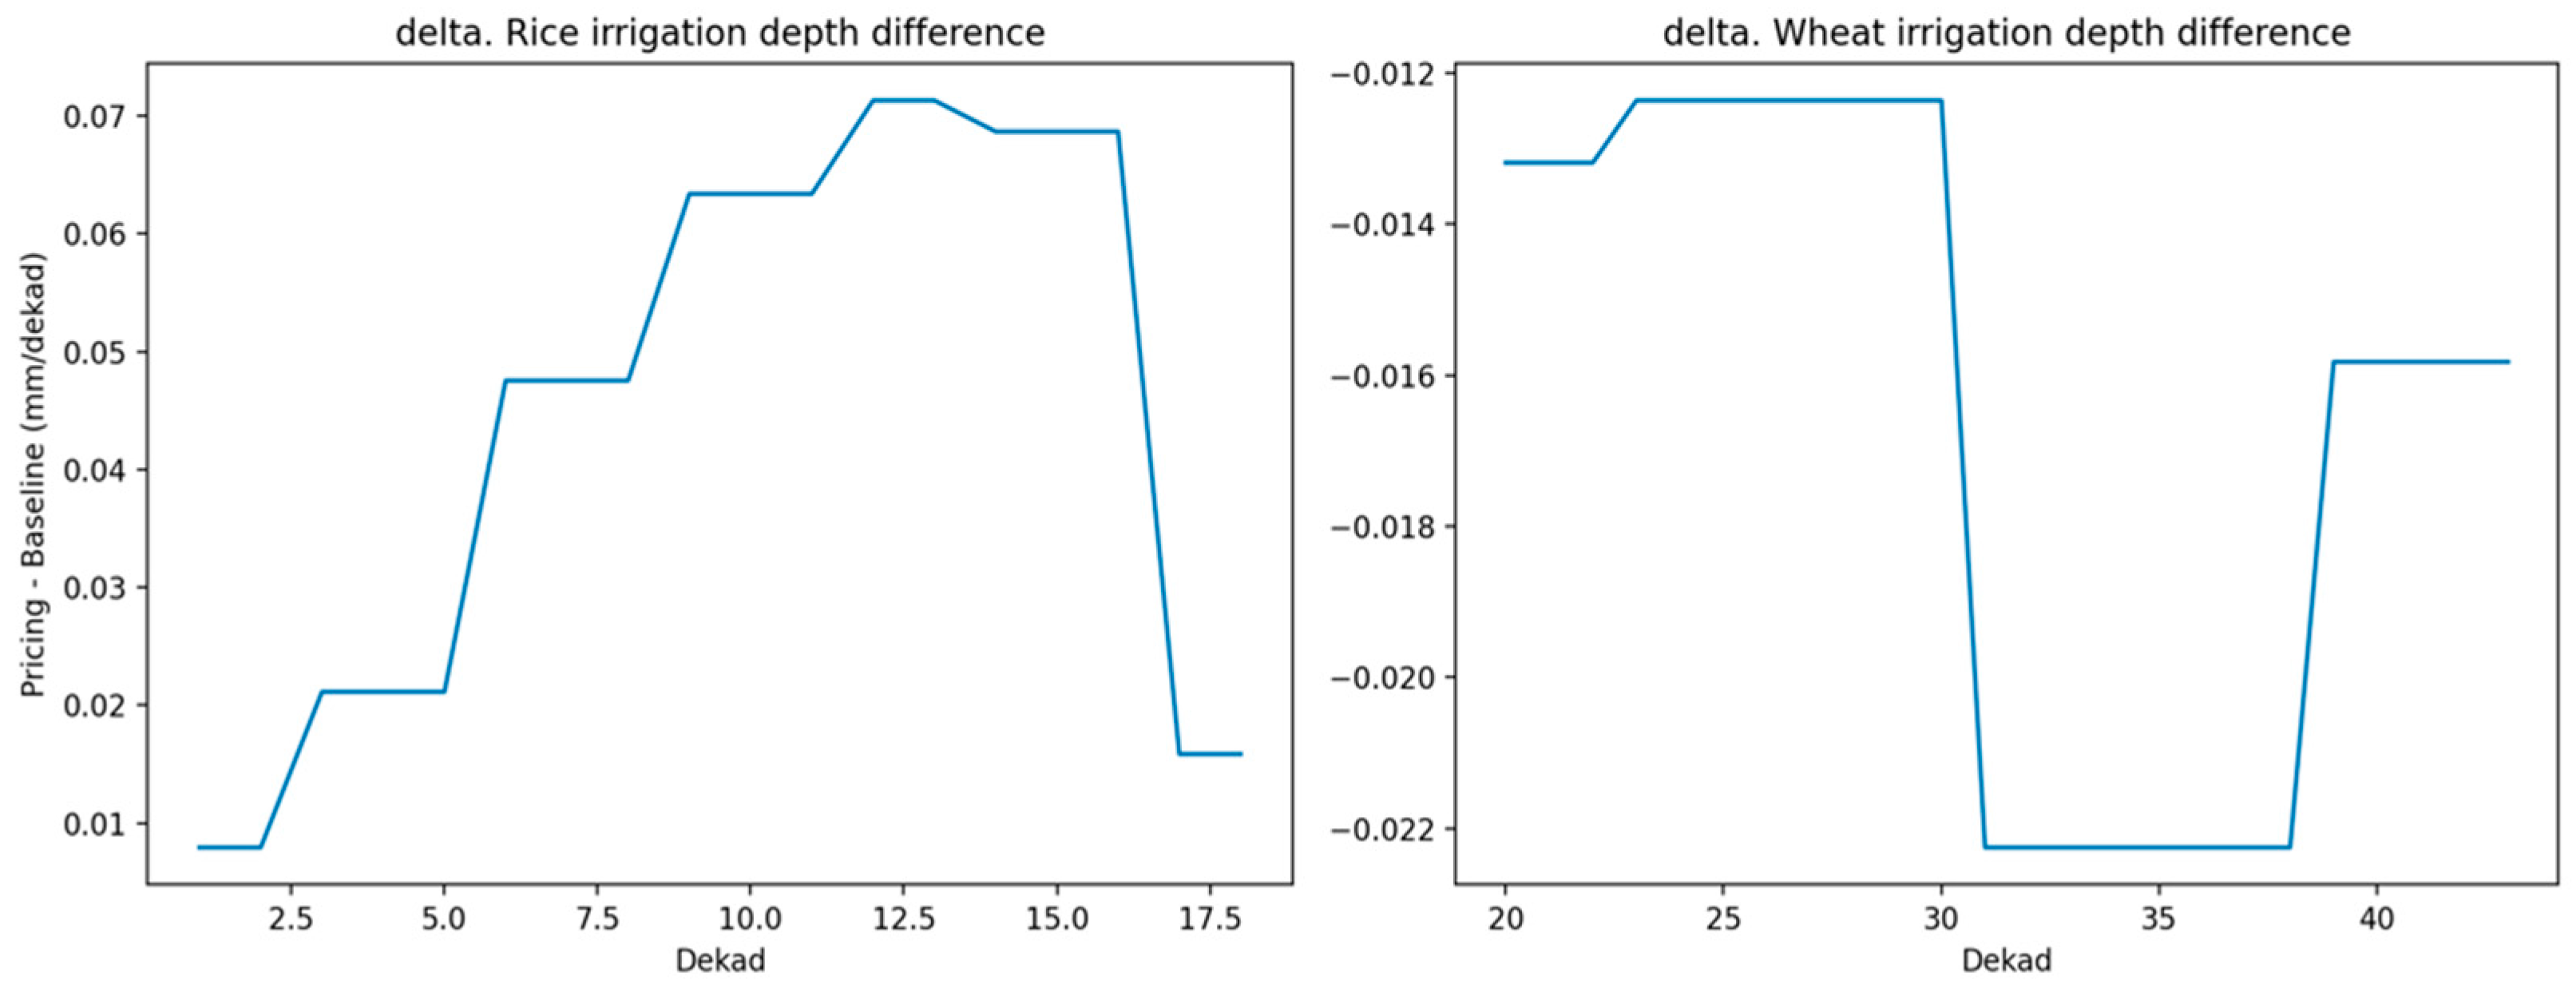

Disclaimer/Publisher’s Note: The statements, opinions and data contained in all publications are solely those of the individual author(s) and contributor(s) and not of MDPI and/or the editor(s). MDPI and/or the editor(s) disclaim responsibility for any injury to people or property resulting from any ideas, methods, instructions or products referred to in the content. |
© 2026 by the authors. Licensee MDPI, Basel, Switzerland. This article is an open access article distributed under the terms and conditions of the Creative Commons Attribution (CC BY) license.