Article

Purpose-Driven Smart Specialization (S3+P): A Multilevel Model for Sustainable Regional Development


by
Maria Luísa Silva
1,2,3,4,
María Isabel Sánchez-Hernández
5,*,
Marc Jacquinet
6,7,8 and
Paulo Neto
9,10,11
1
Management Department, Lisbon Accounting and Business School (ISCAL), Polytechnic of Lisbon, 1069-035 Lisboa, Portugal
2
Department of Mathematical Sciences, Faculty of Sciences, University of Lisbon, 1749-016 Lisboa, Portugal
3
Center for Advanced Studies in Management and Economics (CEFAGE), University of Évora, 7000-809 Évora, Portugal
4
Interdisciplinary Center for Social Sciences (CICS.NOVA.UÉvora), University of Évora, 7000-809 Évora, Portugal
5
Business Administration and Sociology Department, School of Economics and Busines Sciences, Campus of Badajoz, University of Extremadura, 06006 Badajoz, Spain
6
Department of Social Sciences and Management, Universidade Aberta, 1269-001 Lisboa, Portugal
7
TERRA Associate Laboratory, Centre for Functional Ecology, Science for People and the Planet (CFE), 1349-017 Lisboa, Portugal
8
Department of Life Sciences (DCV), University of Coimbra (UC), 3000-456 Coimbra, Portugal
9
Department of Economics, University of Évora, 7004-516 Évora, Portugal
10
UMPP—Public Policy Monitoring Unit, University of Évora, 7004-516 Évora, Portugal
11
CICP—Research Centre in Political Science, University of Évora, 7004-516 Évora, Portugal
*
Author to whom correspondence should be addressed.
Systems 2026, 14(4), 409; https://doi.org/10.3390/systems14040409
Submission received: 11 February 2026 / Revised: 1 April 2026 / Accepted: 7 April 2026 / Published: 8 April 2026
(This article belongs to the Section Systems Practice in Social Science)

Abstract

Smart Specialization Strategy (S3) has become a central instrument of European Union Cohesion Policy, yet its implementation has revealed recurring limitations, including formalistic Entrepreneurial Discovery Processes, weak multilevel coordination, generic priorities, and evaluation systems focused mainly on innovation outputs. This paper examines how shared purpose can be incorporated into S3 in ways that improve both developmental direction and implementation quality across levels. The study adopts a conceptual research design based on a critical synthesis of literature and a model-building procedure, complemented by an illustrative regional application. The main result is the Purpose-Driven Smart Specialization (S3+P) framework, a multilevel model linking individual, organizational, territorial, and macro-policy dimensions through five catalytic mechanisms: plasticity, temporality, identity, memory, and relational networks. The paper also proposes a six-step policy cycle and an indicator logic that broadens evaluation beyond conventional innovation metrics. The analysis suggests that purpose can strengthen directionality, coherence, and legitimacy in regional strategy while preserving the place-based and discovery-oriented rationale of S3. The framework contributes to current debates on the renewal of smart specialization for more sustainable and coordinated regional development.

1. Introduction

Smart Specialization Strategy (S3) became a core instrument of European Union (EU) cohesion policy by encouraging regions to focus innovation on priorities grounded in local capabilities rather than on fragmented or imitative choices [1,2,3,4,5]. As a place-based approach, it linked innovation policy to territorial specificity [2,3,4,5]. This rationale also reflects the broader recognition that regional innovation patterns are territorially differentiated and require policy approaches sensitive to knowledge structures, institutional settings, and development trajectories [6]. Yet S3 now operates in a context in which regions are also expected to address climate transition, digital transformation, inclusion, resilience, and territorial balance [7,8,9,10,11,12,13,14,15], especially in lagging or institutionally fragile regions [7,15,16,17,18]. This is particularly important in less developed regions, where S3 was conceived not as a strategy for building generic capabilities across all domains, but as a way of identifying and consolidating more selective, territorially grounded competitive advantages through entrepreneurial discovery [19].
Research nevertheless shows persistent implementation weaknesses. EDP has often become formalistic or dominated by incumbents [17,20,21,22,23,24]; priorities have often remained generic, path-dependent, or weakly differentiated [16,21,25,26,27,28]; and critics continue to highlight copy–paste choices, policy-driven winner-picking, and limited sensitivity to uneven regional capacities [16,17,20,21,25,26,27]. Weak vertical and horizontal coordination further undermines coherence [11,17,20,27], particularly where regional authorities and innovation intermediaries face capacity constraints in developing or structurally fragile regions [29].
These problems become even sharper when S3 is assessed against sustainable-development ambitions. Monitoring privileges innovation outputs over outcomes such as well-being, inclusion, resilience, carbon reduction, and regional equality [8,9,10,11,12,13,14,18], creating a gap between policy ambition and the criteria used to assess success [14,18]. The issue is therefore also normative, because regional innovation policy often lacks an explicit account of direction, public value, and coordination across scales [9,10,11,30,31,32]. Recent work has reinforced this concern by showing that regional innovation policy increasingly requires clearer directionality and stronger territorial articulation when linked to sustainability transitions and mission-oriented agendas [33,34].
Purpose becomes relevant in this setting because it links strategic choice to societal challenges, shared values, and public legitimacy [30,31,35,36]. A purpose-based perspective can strengthen directionality and multilevel coordination without abandoning S3’s place-based rationale [9,10,11,15,32], orient priorities beyond narrow sectoral advantage, and improve coherence among portfolios, stakeholders, and broader agendas [9,10,11,32,35,36]. It therefore renews rather than replaces S3 [15,30,31]. This is increasingly consistent with recent efforts to embed mission-oriented approaches into smart specialization and to rethink their territorial and multilevel implications [34,37]. The unresolved gap is how purposes align or conflict across individuals, organizations, territories, and macro-policy frameworks [9,10,11,30,31,32,35,36,38,39,40,41,42,43,44,45]. This article therefore asks how shared purpose can be incorporated into S3 to improve developmental direction and implementation quality across levels. It contributes by reframing S3 through a purpose lens [15,30,31,32], proposing the multilevel S3+P model structured around five catalytic mechanisms [30,31,35,36,38,39,40,41,42,43,44,45], and translating that model into an operational logic for design, monitoring, and evaluation [11,14,18,46].
The remainder of the article is structured as follows. Section 2 reviews the evolution of S3 in the EU, the EDP, and key implementation limitations. Section 3 presents the research design and method. Section 4 develops conceptual foundations. Section 5 introduces the S3+P model. Section 6 operationalizes the framework. Section 7 discusses its implications. Section 8 concludes this paper.
Although the present paper is grounded in the EU smart specialization debate, the proposed framework is intended to have broader analytical relevance for other multilevel governance settings in which place-based development, cross-scalar coordination, and territorially embedded innovation strategies are also central.

2. Smart Specialization in the European Union: Evolution, EDP, and Limitations

This section briefly situates the evolution of S3, the role of EDP, and the main implementation bottlenecks that motivate renewal.

2.1. From Research and Innovation Strategies for Smart Specialisation (RIS3) Conditionality to a Broader Transformative Agenda

Smart Specialization Strategy (S3) entered EU cohesion policy as a place-based strategy for concentrating innovation effort on domains rooted in regional capabilities rather than on dispersed or imitative investments [2,3,4,5]. This place-based rationale can also be situated within the broader family of territorial development instruments in Europe, which combine explicit spatial targeting, place-specific strategies, integrated multisectoral intervention, and multi-level governance arrangements adapted to territorial conditions [47]. In this sense, RIS3 translated territorial development logic into innovation policy and renewed Regional Innovation Systems thinking through prioritization, entrepreneurial discovery, and greater sensitivity to differentiated regional innovation patterns [2,3,4,5,6,48,49].
From the outset, RIS3 aimed both to reduce fragmented investment and to align intervention with local strengths and opportunities [2,3,4]. It was therefore not merely a funding condition, but also a mechanism for improving the quality of regional innovation systems through prioritization, participation, and learning [5,50]. At the same time, these ambitions also exposed strategic and implementation tensions that later became central to the debate on the opportunities and challenges of smart specialization in regional innovation policy [51].
In the 2021–2027 cycle, however, S3 became increasingly connected to the Green Deal, the digital transition, resilience, industrial modernization, and mission-oriented innovation [8,9,10,11,12,13,14,15,33,34,37]. This broader repositioning of S3 within the current Cohesion Policy cycle is also consistent with recent calls for a more dynamic and systemic approach to territorial development, one that places greater emphasis on institutional capacity, territorial sensitivity, and performance-oriented delivery [52]. Regions were thus expected not only to identify niches but also to support broader socioecological transformation, territorial balance, and more directional forms of innovation governance [9,10,11,12,13,14,15,33,34], while initiatives such as the Partnerships for Regional Innovation encouraged stronger articulation with national and European agendas [11,12,13,14].
S3 has therefore shifted from a bounded prioritization exercise to a more demanding framework for steering regional transformation.

2.2. The Entrepreneurial Discovery Process: Rationale, Operation, and Evolution

EDP was originally conceived as a participatory discovery process through which dispersed regional knowledge could inform specialization choices [2,3,4,20]. Because opportunity knowledge is distributed, priorities should emerge through interaction and experimentation rather than through administrative selection alone [2,3,4,20].
Properly understood, EDP is iterative rather than episodic: it should inform diagnosis, priority setting, portfolio design, feedback, and revision [20,22,23,53]. It is also political as well as epistemic, because it can broaden ownership and legitimacy [20,22,23,53].
As S3 became tied to societal challenges, EDP was reinterpreted as a continuous and challenge-oriented process, often termed EDP 2.0 [11,13,14]. In this broader reading, discovery also addresses problems, needs, and cross-sector missions [11,14], requiring better evidence, wider inclusion, and stronger links with monitoring and multilevel coordination [11,14,46].
Where institutional capacity is weak, these conditions are fragile, so EDP can easily become procedural rather than genuinely generative.

2.3. Recurring Implementation Bottlenecks

Implementation bottlenecks recur most strongly in peripheral or weak-capacity regions [7,15,16,17,18,20,21]. Participation has often been formalistic or dominated by the usual actors [17,20,21,22,23,24], which weakens the exploratory and adaptive role of discovery [20,22,23].
Priorities have also often been broad, generic, or weakly differentiated [16,17,20,21,25,26,27], reviving concerns about lock-in, incumbent reinforcement, and policy-driven winner-picking [16,21,25,26,27,28].
A further problem is uneven institutional capability: S3 assumed coordination and strategic competence that many territories lacked [16,17,20,21], so weaker regions often struggled to build portfolios and sustain implementation [7,16,17,18,20,21,29]. This is particularly visible in developing or structurally fragile regions, where public authorities and innovative intermediaries often face resource, coordination, and governance constraints that limit the effective translation of strategy into action [29].
In addition, S3 has often remained inward-looking despite the importance of interregional complementarities [16,26,27]; this is increasingly problematic where green and digital transitions require combinations of capacities that no single region possesses on its own [11,13,14,27].
Multilevel governance is another persistent weakness. Vertical and horizontal coordination failures generate overlaps, gaps, and inconsistent policy mixes [11,17,20,27], even though contemporary challenge-led transformation depends precisely on coordination across levels, sectors, and territories [11,17,20,27,34]. As regional innovation policy becomes more closely linked to sustainability transitions, these coordination problems become more consequential because transformative change depends not only on local specialization choices but also on the alignment of actors, instruments, and policy scales [34].

2.4. Monitoring, Evaluation, and the Rationale for Renewal

Monitoring and evaluation remain especially weak. Existing systems still emphasize inputs and outputs such as expenditure, patents, projects, start-ups, or (Research and Development) R&D intensity [14,18,46], while broader developmental outcomes such as inclusion, resilience, decarbonization, and well-being receive less attention [8,9,10,11,12,13,14,18].
As S3 becomes linked to sustainability and transformation, this narrow evaluative focus is increasingly inadequate [11,14,18]. Recent debates accordingly call for broader monitoring architectures that combine output and outcome indicators, participatory and portfolio-based assessment, and place-sensitive evidence [11,14,18,46]. This is particularly relevant in current discussions on directional regional innovation policy, which stress that evaluation systems should not merely record activity, but also assess whether innovation trajectories are being oriented towards socially desirable and territorially grounded goals [33].
Recent work on mission-oriented and challenge-led regional policy also suggests that monitoring frameworks need to capture coordination, legitimacy, and transformative direction, rather than only the volume of projects or investment [34,37]. In this sense, the renewal of S3 is not only a technical matter of improving indicators, but also a strategic matter of clarifying what counts as success and for whom [33,34].
These limits do not invalidate smart specialization, but they do show the need for a more directional, inclusive, context-sensitive, and coordinated version of it. Purpose is relevant precisely because it can clarify direction, strengthen public justification, and broaden what counts as success. It also helps connect evaluation to the wider territorial and multilevel logic now associated with more mission-oriented interpretations of smart specialization [33,37].

3. Research Design and Method

This article adopts a conceptual design aimed at policy-oriented model building. It combines a critical synthesis of the literature, a sequential procedure for deriving the S3+P framework, and an illustrative regional application.

3.1. Conceptual Approach and Critical Synthesis

The review is selective and theory-building rather than systematic in a statistical sense. Rather than following a systematic-review protocol aimed at exhaustive retrieval, the review was designed as a problem-driven and theory-building synthesis consistent with the article’s conceptual purpose. This approach is consistent with conceptual article design in which selective and purpose-driven review strategies are used to support theory development and model building rather than exhaustive evidence aggregation [46].
The selection of sources was guided by their analytical relevance to five interconnected domains: Smart Specialization Strategy, Entrepreneurial Discovery Process, multilevel governance, purpose across levels, and monitoring and evaluation. Priority was given to seminal contributions and recent debates that helped identify recurrent implementation weaknesses, clarify design requirements, and support the construction of an integrative conceptual framework.
The analysis used deductive themes derived from the research question and Section 2, alongside inductive identification of cross-cutting patterns such as directionality, legitimacy, alignment, learning, identity, temporality, memory, and networks.
This synthesis served two functions: it defined the design requirements for a renewed S3 and supported the identification of five catalytic mechanisms with cross-level relevance.

3.2. Model-Building Procedure

Model building proceeded sequentially. First, the literature-based weaknesses of S3 were translated into design requirements. Second, comparison across debates on purpose, place-based development, governance, and evaluation yielded five mechanisms: plasticity, temporality, identity, memory, and relational networks.
Third, these mechanisms were organized into a multilevel model linking individual, organizational, territorial, and macro-policy dimensions. Fourth, the model was translated into a six-step policy cycle covering diagnosis, purpose definition, portfolio design, instrument mobilization, implementation, and learning-oriented evaluation.
The result is an analytically grounded framework intended for strategy design and assessment rather than as a validated causal model.

3.3. Illustrative Application

The article also includes an illustrative application to Alentejo. Its function is heuristic: it shows how the framework could orient diagnosis, missions, governance, and indicators in a concrete territorial setting, but it is neither a formal case study nor an empirical validation. Alentejo is suitable for illustration because it combines low density, ageing, service contraction, and pressure to move towards greener and more digital development trajectories. The exercise relies on secondary sources and contextual knowledge rather than on primary fieldwork, and its value lies in showing how a purpose-based framework can reframe scattered sectoral priorities into more integrated development trajectories. Overall, the design combines conceptual rigor with practical orientation and prepares the framework for later empirical testing.

4. Conceptual Foundations

The conceptual premise of S3+P is that smart specialization becomes more directional and legitimate when anchored in shared purpose: a collectively meaningful orientation that links strategic choice to societal challenges, public value, and long-term territorial trajectories.
Purpose is multilevel. At the organizational level, it aligns missions, stakeholder relations, and sustainability-oriented behavior [35,36,40]. At the territorial level, it can mobilize actors and narratives around a common regional direction [38,39]. At the macro-policy level, it reconnects territorial strategy to broader goals such as human development, sustainability, and the Sustainable Development Goals (SDGs) [30,31]. Evidence from regional development planning also suggests that alignment with the SDGs is not automatic and requires contextual localization, political commitment, and multiparty support if broader sustainability goals are to shape territorial strategy in practice [54].
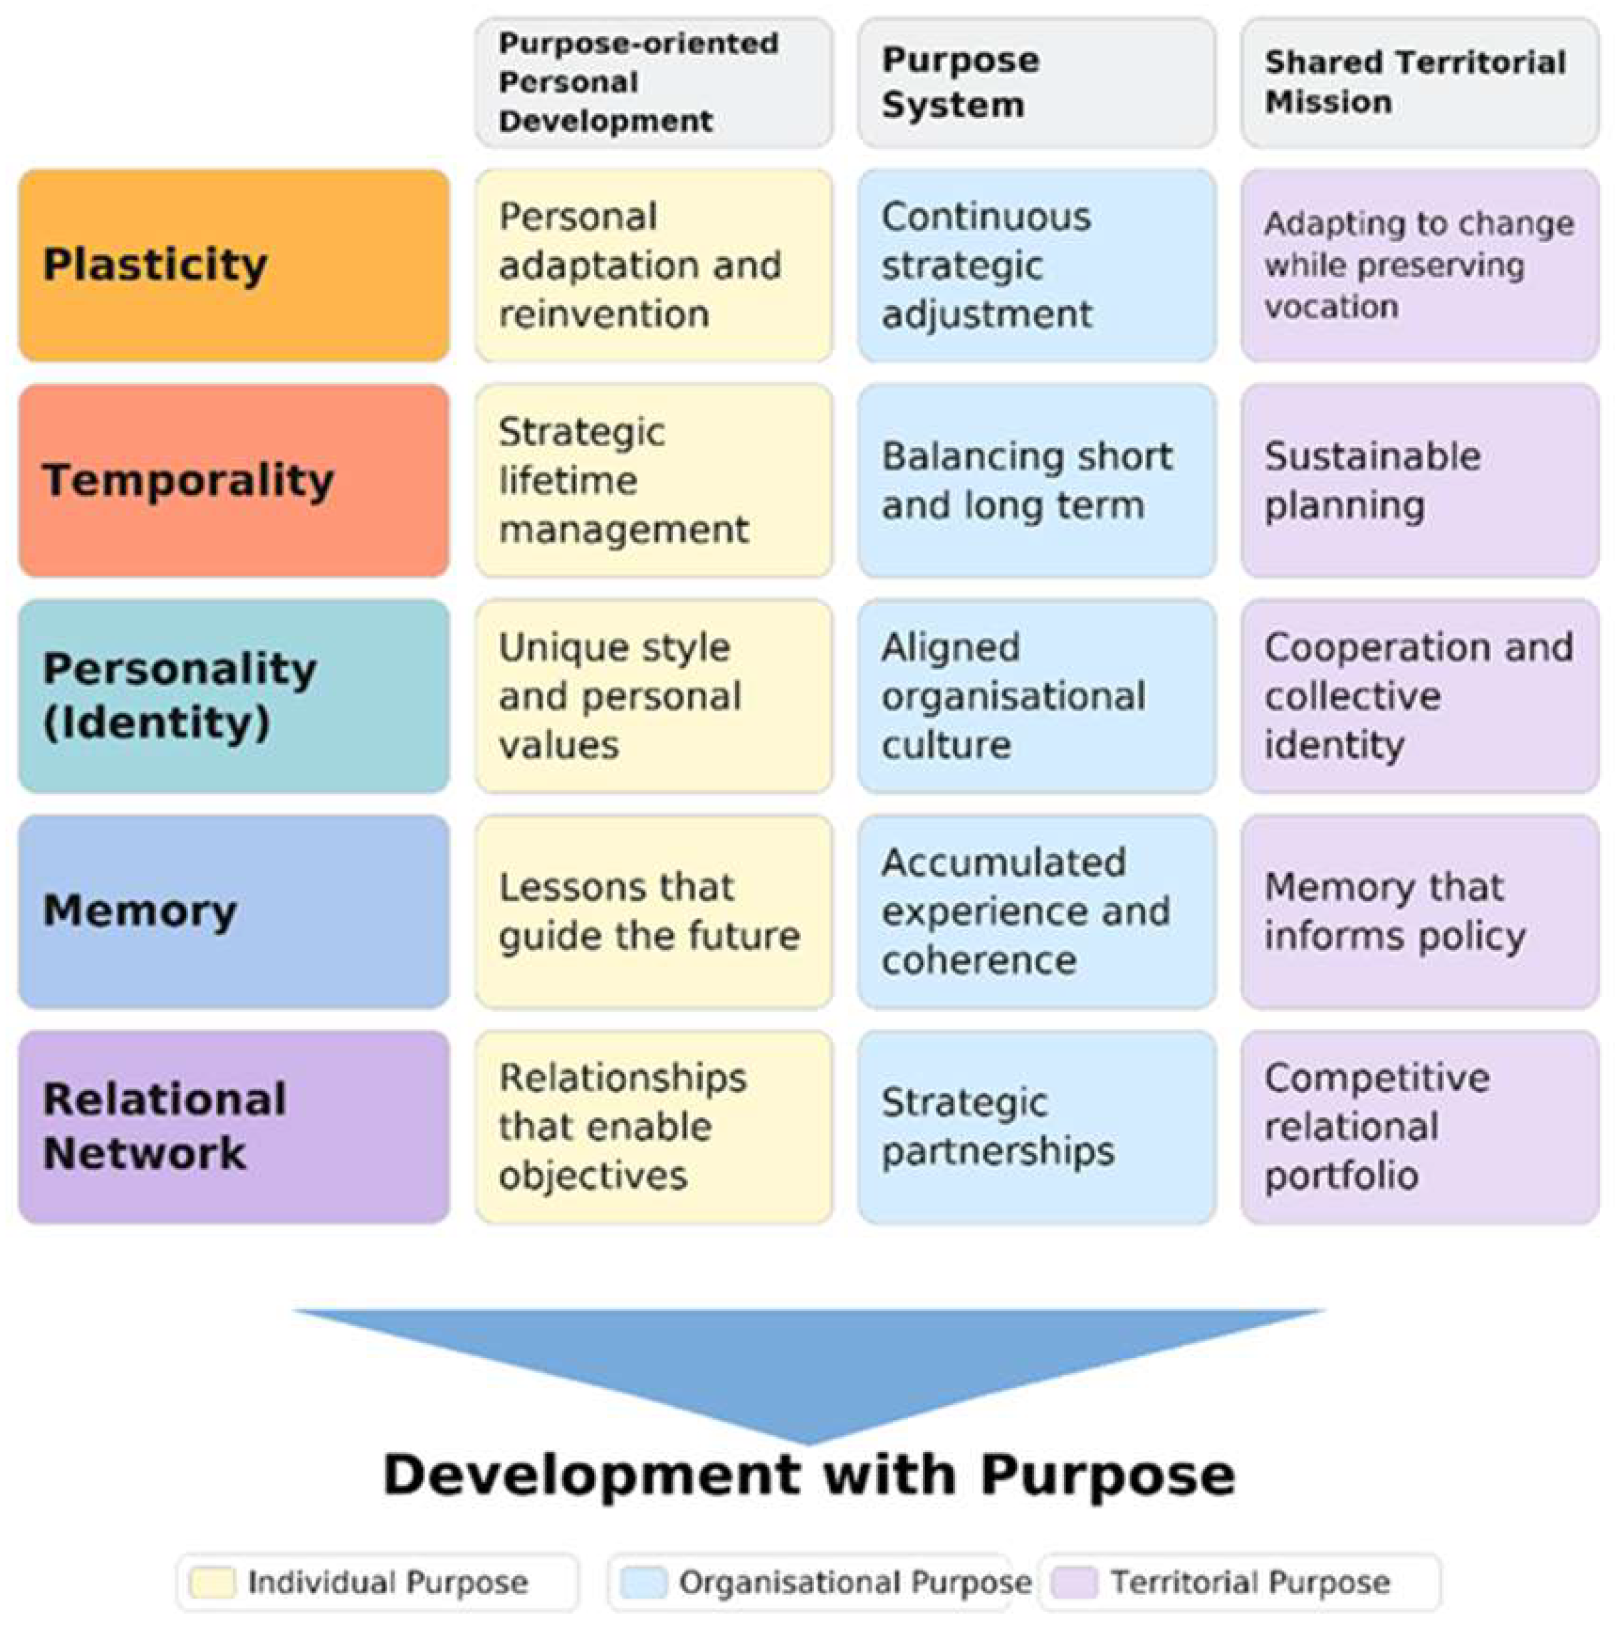
Development with purpose therefore depends on alignment across levels rather than on isolated decisions. The framework explains this alignment through five catalytic mechanisms: plasticity, or adaptive recombination and the avoidance of lock-in [21,41]; temporality, or the linking of short-term decisions to long horizons [11,42]; identity, or the narratives and values that support legitimacy [38,39]; memory, or the retention of lessons and routines [42,43]; and relational networks, or the infrastructures through which purpose is co-produced and coordinated [44,45].
These mechanisms operate across individual, organizational, territorial, and macro-policy dimensions, shaping whether purpose becomes actionable rather than rhetorical.
Figure 1 summarizes these conceptual foundations and prepares for the transition to the S3+P model.

5. The S3+P Model

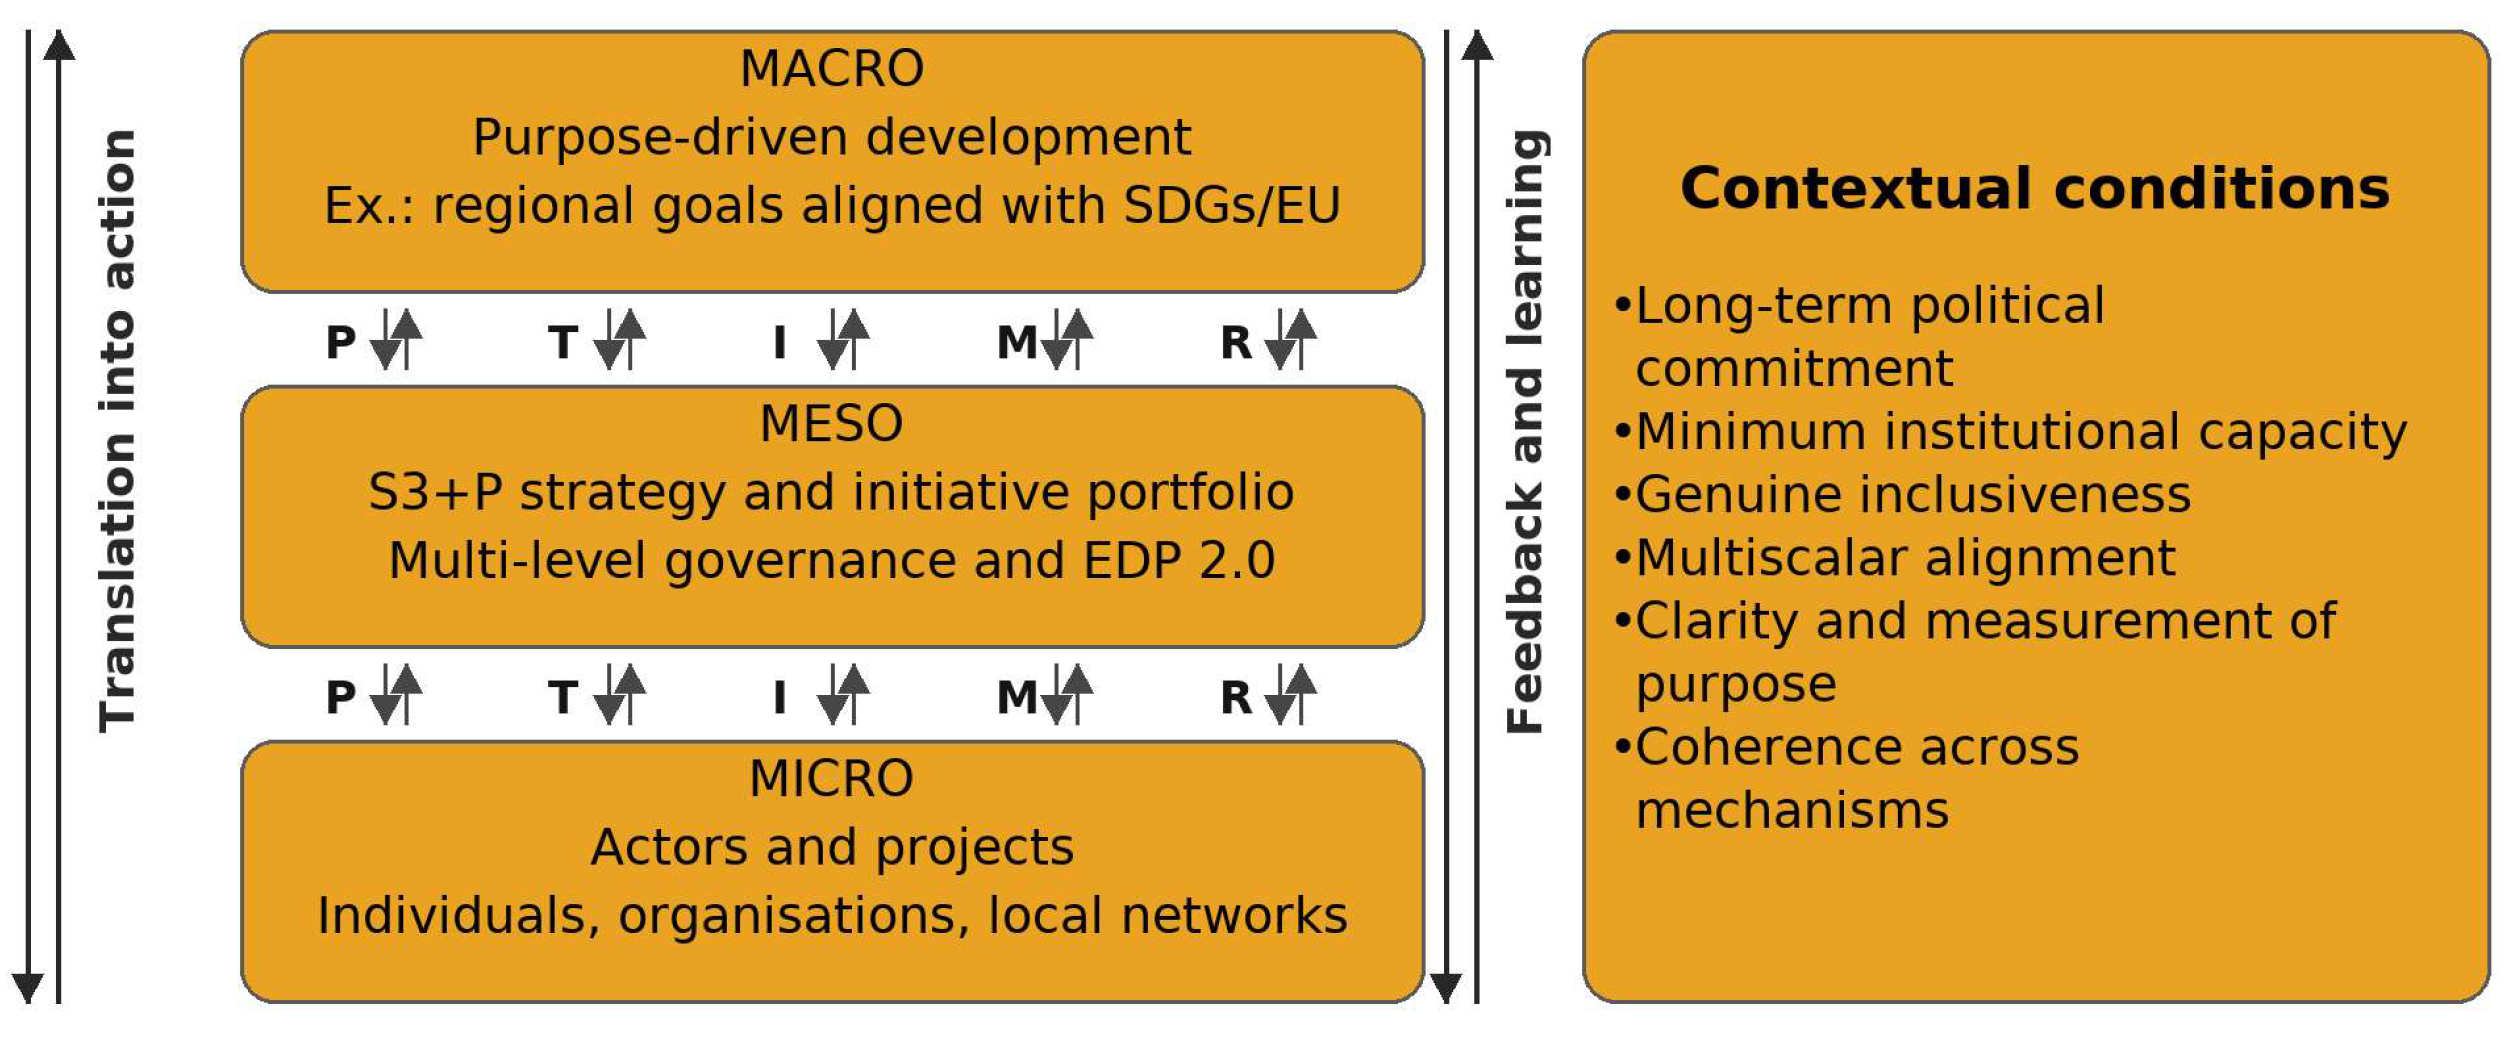
Based on these foundations, S3+P is a conceptual and operational model for integrating societal purposes into S3. It is multilevel and dynamic: micro, meso, and macro scales interact continuously, each level reinforces the others, and all are mediated by five catalytic mechanisms.
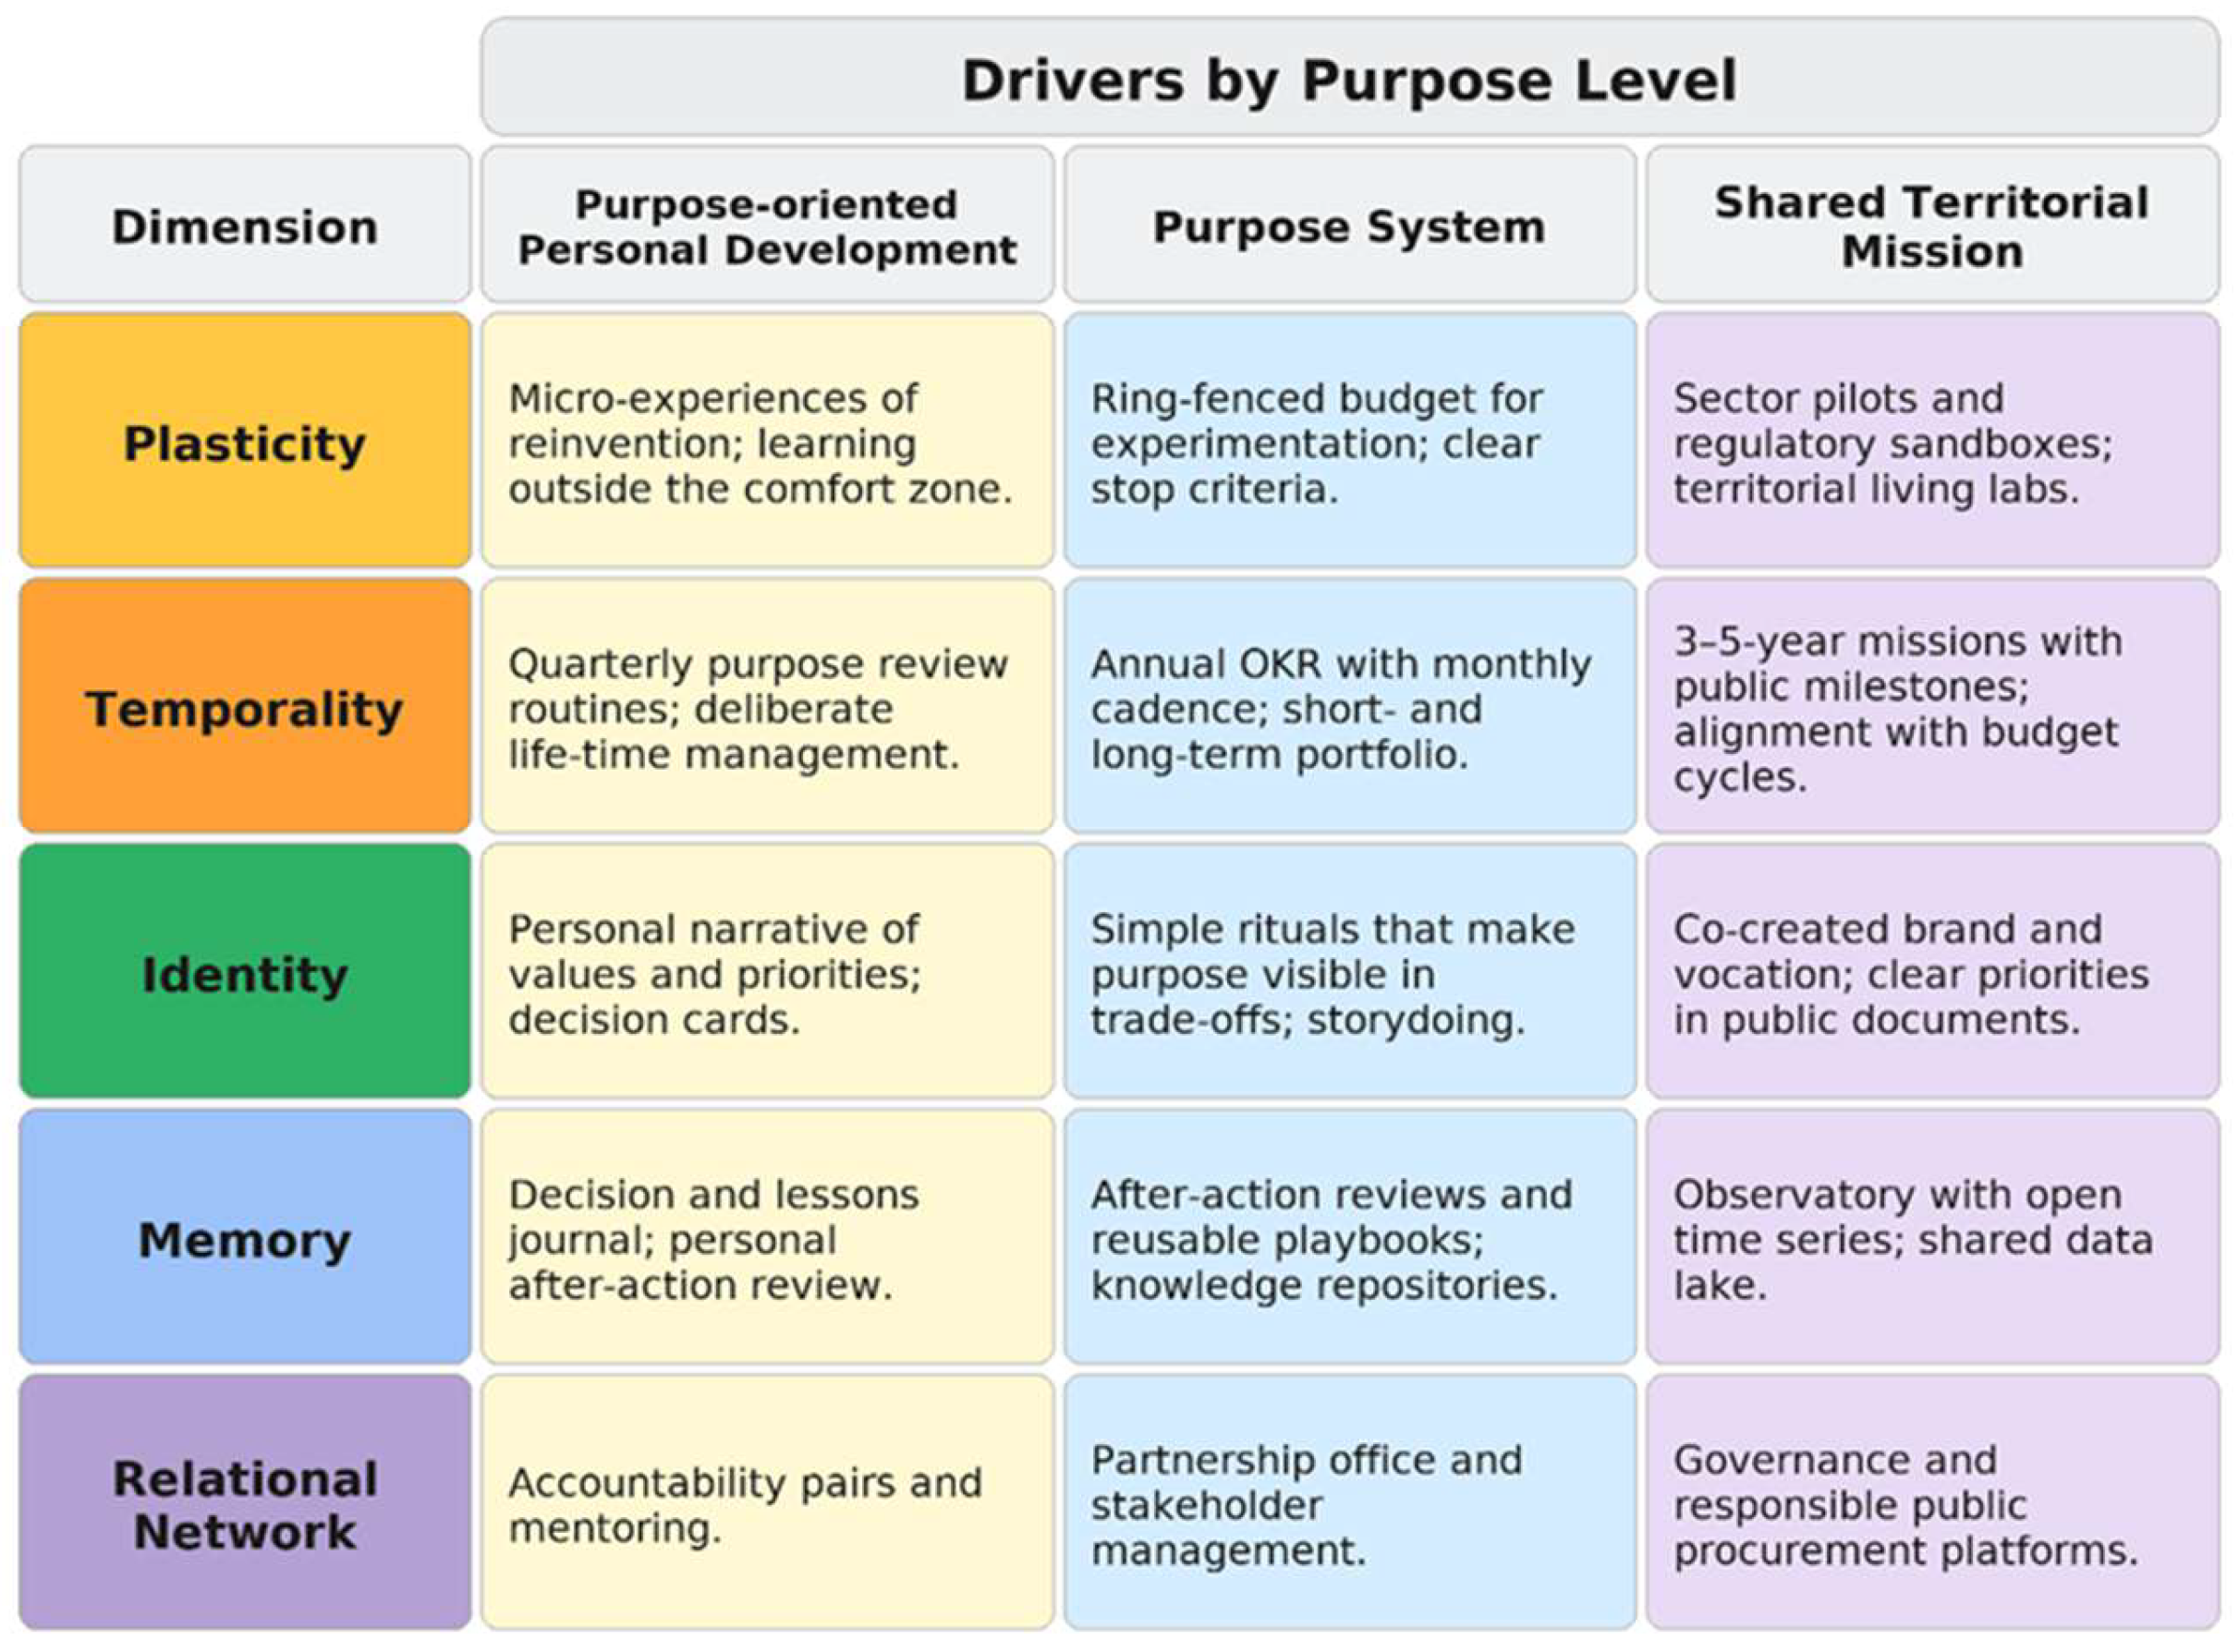
In summary, the model begins with a shared territorial mission as the driver of territorial purpose and then systematizes the components at each level, the functioning of the mechanisms across the policy cycle, the conditions for validity, and the added value of S3+P relative to current S3. Figure 2 presents the dimensions common to the three levels—plasticity, temporality, identity, memory, and relational networks—as catalytic mechanisms that generate amplified effects; the drivers are the actionable levers that set them in motion: purpose-oriented personal development, the purpose system, and the shared territorial mission.

5.1. Components of the Model by Level

It is important to note that, in practice, the different levels are not watertight. They interact continuously: individuals participate in meso organizations and networks; macro decisions influence micro incentives; and successful micro experiences can scale up and reshape part of the macro level.
At the micro level, individuals and organizations are the immediate bearers of purpose and the agents of execution. Citizens, entrepreneurs, workers, and students co-produce visions and initiatives through civic laboratories, forums, and entrepreneurship aligned with the regional purpose. Organizations clarify their purpose-driven missions and act as nodes of diffusion, while regional anchors such as universities and business associations coordinate training, R&D, and collaborative projects for the green and digital transitions. Person–organization alignment can be supported by purpose-alignment programmes and inter-organizational participation platforms [55,56,57,58].
At the meso level, the regional community translates macro purpose into strategy and a portfolio of initiatives. A governance coalition brings together regional and local government, academia, businesses, civil society, and, ideally, citizen representatives to conduct EDP 2.0, set priorities, and articulate partnerships. Mobilizing narratives anchored in local identity connects past and future, guards against sectoral capture, and supports thematic transversality and multisectoral cooperation [9,20,27,38,53].
At the macro level, development with purpose aligns regional strategy with the SDGs and with national and European targets, while setting measurable objectives at the regional scale. The macro statement works as both a normative and an operational compass, guiding decisions at the meso and micro levels and serving as a criterion for alignment and prioritization [30,31]. The S3+P model is therefore multilevel and dynamic, requiring information flows and feedback across all levels (Figure 3). This interaction is made possible by the cross-cutting mechanisms discussed below.

5.2. Catalytic Mechanisms Across the Policy Cycle

Across the public policy cycle—from diagnosis to design, implementation, and evaluation—five catalytic mechanisms accelerate and align action with purpose, functioning as connective ‘lubricants’ between levels:
  • Plasticity: ensures continuous adaptation, for example through flexible pilots or open calls that prevent long-term plans from becoming rigid [41].
  • Temporality: supports long-term vision and continuity, for example through roadmaps with milestones backed by cross-party agreements [11].
  • Identity: provides evaluative coherence, visible in participatory foresight and territorial-branding initiatives that legitimize transformation [24,38,39].
  • Memory: supports adaptive learning through observatories and open repositories that prevent the repetition of mistakes and institutionalize innovation [43].
  • Relational Networks: promote multisectoral cooperation, for example through public–private consortia or citizen observatories that reinforce accountability [44,45].
Acting in an integrated way, these mechanisms make S3+P a catalytic policy, distinct from traditional S3 in that it operates as a living process of adaptation, learning, and cohesion [32].

5.3. Conditions of Validity and Assumptions of the Model

Like any conceptual model, S3+P rests on certain assumptions and has specific conditions for effective application. The main ones are as follows:
  • Long-term political commitment: directionality is lost if purpose fluctuates with each electoral cycle; multiparty consensus and stable governance institutions are therefore recommended [2].
  • Minimum institutional capacity: participatory processes, network coordination, and monitoring require a core capacity, which can be reinforced through training and external support where necessary.
  • Genuine inclusiveness: the purpose must reflect collective interests and avoid capture. Deliberative tools help to test resonance and legitimacy [20].
  • Multi-scale alignment: the region needs compatibility with national and European policies and resources, avoiding conflicts of directionality. Missions and Partnerships for Regional Innovation (PRIs) serve as practical bridges [11].
  • Clarity and measurability: vague purposes do not guide choices. It is essential to translate them into verifiable goals and indicators [9].
  • Coherence among mechanisms: identity and memory can hinder change if they are not balanced with plasticity; political time can also clash with social time. Skillful leadership is needed to calibrate these tensions [41].
In summary, the S3+P model is not a universal panacea. It requires minimum enabling conditions—political commitment, basic capacity, and a willingness to cooperate—and may not flourish in contexts of deep institutional crisis or acute social conflict. Nevertheless, we argue that many territories, including some considered ‘lagging regions’, can build these conditions with appropriate support, and that the potential benefits justify the effort. Section 6 therefore presents an illustrative scenario under realistic conditions. Before that, Table 1 summarizes the improvements that S3+P brings relative to traditional S3.

5.4. What S3+P Adds to the Current S3

As Table 1 shows, S3+P shifts the focus from the mere identification of advantages to collective mobilization around a desired future. S3+P responds to criticism of the societal vision and governance of the original S3, offers an implementation matrix based on the five mechanisms, and brings S3 closer to transformative innovation policy through spaces for experimentation, coalition building, and the alignment of expectations [23,26,32]. The clarity of purpose also facilitates coordination between regional strategies and national and EU agendas, improving public communication and the democratic legitimacy of investment by linking each decision to the larger measurable goal it serves [11]. The S3+P model may also strengthen territorial resilience by enhancing collective adaptive capacity in the face of risks associated with the green and digital transitions [48].

6. Implementation of S3+P

This section operationalizes S3+P by outlining the step-by-step cycle and EDP 2.0, setting out monitoring and multilevel governance arrangements with indicators and feedback, and presenting an illustrative pilot that shows how purpose can improve decisions and outcomes.

6.1. Operational Cycle and EDP 2.0

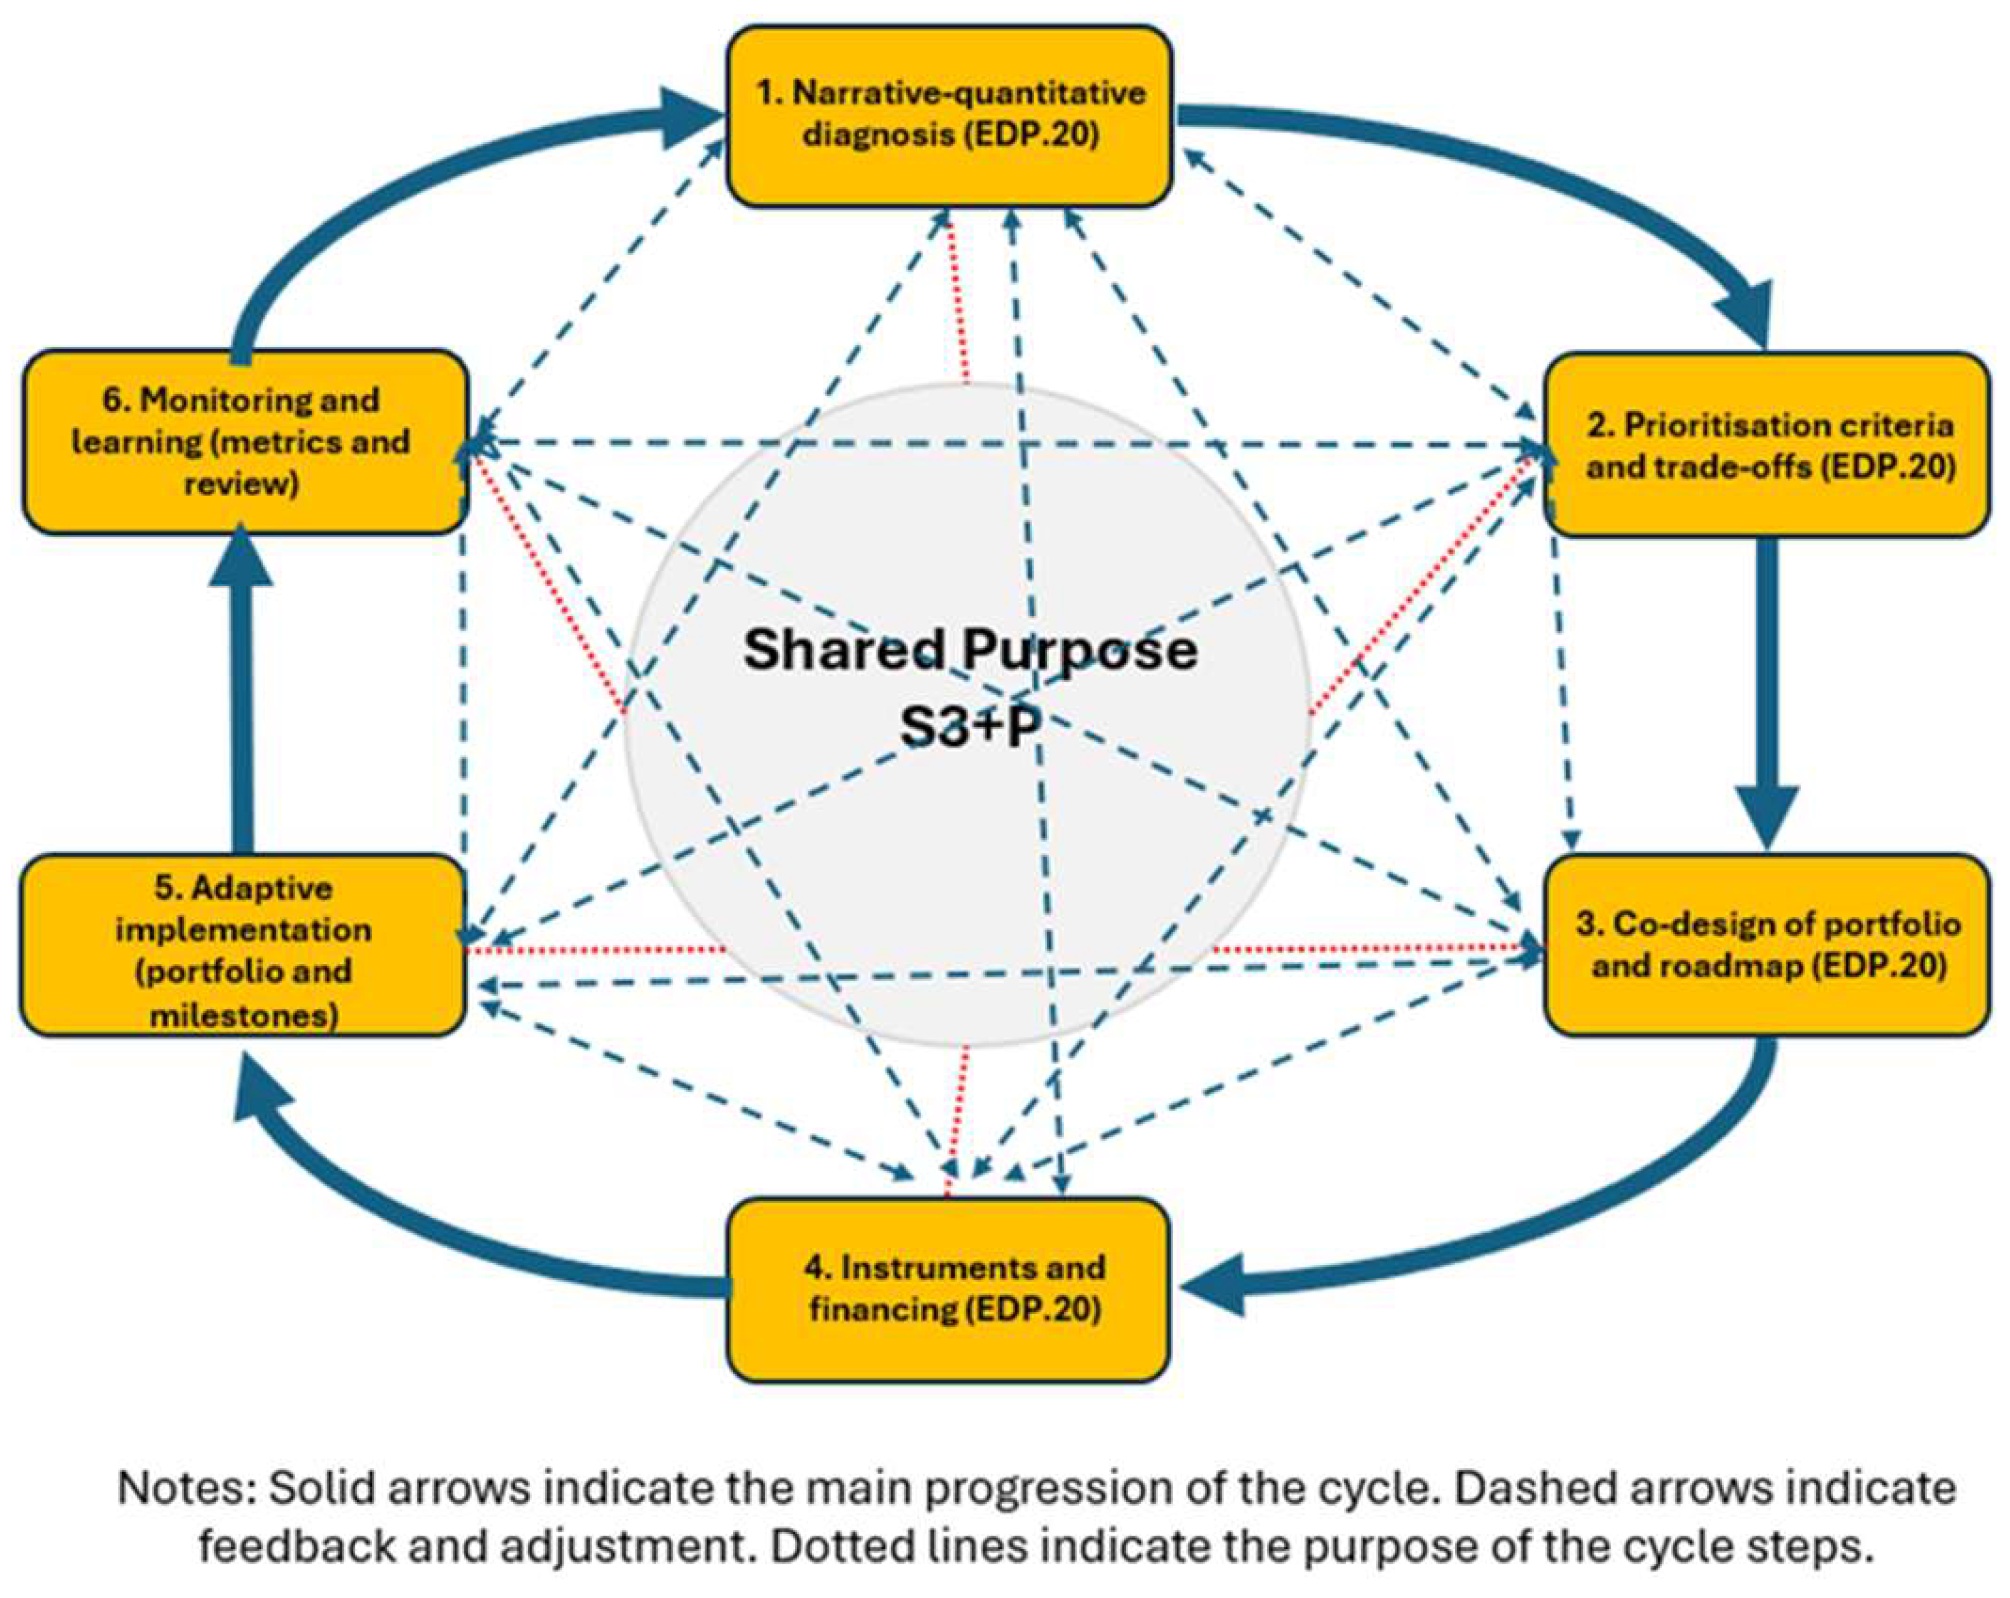
We propose a six-step S3+P cycle that translates the model into practice. EDP 2.0 guides the definition of purpose and prioritization by combining quantitative evidence with participatory methods. Figure 4 summarizes the iterations and feedback points.
Step 1—Narrative–quantitative diagnosis [49]: This step combines socioeconomic statistics, productive structure, innovation profiles, and network analysis with interviews, surveys, and open sessions. It seeks to identify collective obstacles and aspirations, producing an accessible portrait of the territory and one to three systemic challenges that anchor the purpose and serve as a basis for public discussion and validation by a representative panel.
Step 2—Purpose definition and strategic prioritization (EDP 2.0) [11,50]: Deliberation focuses on the question, ‘What future do we want, and which innovation trajectories can take us there?’ The result is a concise statement of purpose and three to five priorities formulated as missions and assessed for both contribution to the purpose and feasibility. Analysis of related variety and the knowledge space helps to identify new activities close to the region’s existing competencies, thereby reducing risk and increasing the probability of success. Recent empirical evidence from digital industries also suggests that related density and knowledge complexity can positively shape innovation outcomes within regional innovation systems, although their effects depend on broader institutional conditions and the degree of government intervention [59]. Final selection proceeds only when these options also serve the defined societal purpose, so that direction is not lost.
Step 3—Co-design of the portfolio of initiatives [28]: Each priority generates a complementary portfolio of initiatives that combines research and development, social innovation, training, regulatory adjustments, and collaborative instruments. Public facilitators ensure a balance between bottom-up initiatives proposed by local actors and top-down structural actions launched by the regional authority, using calls for interest, hackathons, and thematic consortia. Each proposal must explain how it contributes to the purpose and which preliminary indicators it mobilizes.
Step 4—Mobilization of instruments and funding [11]: This step defines the policy mix and combines regional, national, and European funds, private investment, public procurement for innovation, and regulatory measures. Where possible, programme contracts are signed for each priority, bringing together the relevant policy instruments and defining a phased payment schedule by milestone so that resources arrive when each project stage requires them. This ensures temporal synchronization between funding and implementation. Multilevel coordination is formalized to align Smart Specialisation Strategies (S3) and Smart Specialisation Strategies for Sustainability (S4) with national and European missions and programmes such as Horizon Europe and the Partnerships for Regional Innovation (PRI), among others.
Step 5—Adaptive implementation and collaborative governance: Implementation is coordinated by an S3+P Secretariat and overseen by a Strategic Council [28], with representatives from academia, business, government, civil society, and environmental actors [60]. Regular meetings help remove obstacles, align information, and validate milestones [28]. The portfolio is reviewed periodically and adjusted based on evidence, incorporating new opportunities and discontinuing underperforming projects in order to maintain plasticity without losing direction [61]. Transparency and public communication sustain identity alignment and citizen engagement [28].
Step 6—Monitoring, evaluation, and learning: Continuous monitoring and ex post evaluation measure outcomes linked to purpose and generate lessons for the next cycle. Evaluation should be participatory, involving stakeholders and citizens and, where necessary, drawing on independent studies. Observatories, open databases, and peer-learning routines consolidate institutional and relational memory, reducing the repetition of errors and accelerating the diffusion of good practices.
The cycle organizes action around purpose and integrates the five mechanisms of S3+P. Networks and identity structure diagnosis and deliberation by mapping relational configurations and by assessing how identity and narratives shape engagement and priority setting. Plasticity and temporality guide design, mobilization, and execution. Memory closes the cycle through learning. Practical adoption requires greater investment in steps 1 and 2, stronger facilitation, systems-thinking and evaluation capabilities, and sufficient administrative flexibility. The expected gain is a more coherent portfolio with stronger local buy-in and greater transformative impact, anchored in metrics that matter to communities.

6.2. Monitoring and Governance

The effective operationalization of the S3+P model requires a monitoring architecture capable of capturing both the functioning of the strategy and the longer-term results to which that functioning is expected to contribute. Unlike traditional RIS3, which tends to privilege innovation and financial performance metrics, S3+P calls for a broader monitoring logic that distinguishes between intermediate indicators and end indicators. Intermediate indicators capture the performance of the mechanisms and implementation conditions through which purpose-driven regional development is expected to occur, including alignment, adaptability, continuity, legitimacy, learning, coordination, innovation dynamics, execution quality, and stakeholder capability. End indicators, by contrast, capture the longer-term outcomes most directly aligned with the ultimate purpose of the strategy, namely societal impact and the distribution of benefits across territories and social groups.
This distinction strengthens the analytical clarity of the framework because it avoids conflating successful implementation with successful developmental outcomes. A strategy may perform well in terms of coordination, participation, learning, or innovation and still fall short of its final societal objectives because of time lags, structural constraints, or external shocks. Conversely, weak intermediate performance may help explain disappointing end results even where the strategic purpose itself remains relevant. The proposed indicator set therefore follows a theory-of-change logic in which intermediate indicators help assess whether the catalytic mechanisms are operating as expected, while end indicators help assess whether these mechanisms are translating into meaningful territorial outcomes. In this way, the framework avoids focusing only on what is easiest to measure, such as expenditure or project counts, and instead asks whether the strategy is doing the right things, doing them well, and reaching the right people at the right time. Baselines should be established during diagnosis and progress should be tracked throughout the cycle, relying as far as possible on objective and recurrent data sources, while allowing for survey-based, documentary, or qualitative evidence where necessary.
For practical application, however, these indicators should be treated as a staged and adaptive monitoring architecture rather than as a uniform reporting burden. A realistic strategy, especially in weaker-capacity regions, is to begin with a core set based on routinely available administrative and statistical data and to expand progressively through surveys, network analysis, or qualitative assessment. In weaker-capacity regions, this implies starting from a minimum viable monitoring package composed of the most policy-relevant indicators that can be populated regularly from existing administrative and statistical sources, and only expanding to more demanding indicators as institutional capacity and data availability improve. In practical terms, such a minimum package could begin with purpose alignment, multilevel synchronization, execution efficiency and financial leverage, and inclusion and benefit distribution, because these dimensions are more readily approximated through existing programme, funding, and beneficiary data than more interpretive constructs such as identity cohesion or relational density.
Appendix A makes this staged logic more explicit by mapping each of the 12 indicators against existing national, European, and administrative sources and by identifying complementary proxies where no direct official series exists. Appendix A uses Portugal only as an illustrative national setting for proxy identification; in other country contexts, the corresponding national administrative and statistical proxies would necessarily differ according to institutional arrangements, data infrastructures, and indicator availability.
Accordingly, Appendix A should be read as an indicative operational guide rather than as a uniform protocol to be applied identically across all regional and national contexts. Its practical value lies in helping regions identify a realistic sequence of operationalization, rather than in assuming that all indicators can be measured with the same degree of precision, frequency, or administrative effort from the outset.
In practical terms, many execution, funding, employment, innovation, and beneficiary-distribution indicators can be updated annually, perception-based indicators such as identity cohesion and stakeholder satisfaction are more realistically collected biennially, and relational indicators are more appropriately gathered periodically. This sequencing is intended not only to reduce administrative burden, but also to protect analytical quality by avoiding the appearance of measurement precision in dimensions for which stable and recurrent data may not yet exist. Where direct measures are unavailable, Appendix A also identifies contextual or secondary proxies that may support interpretation, although these should not be treated as exact equivalents of the core conceptual constructs defined in Table 2. Taken together, these indicators are proposed as a conceptual architecture designed to support adaptive learning under real-world capacity constraints, rather than as a validated measurement instrument. This routine monitoring architecture should be distinguished from periodic impact evaluation, including quasi-experimental or counterfactual approaches, which belong to a complementary evaluative layer rather than to the regular monitoring dashboard.
Table 2 summarizes the 12 indicators, their associated mechanisms, their operational definitions, and their suggested data sources. Whereas Table 2 presents the conceptual architecture of the proposed indicator set, Appendix A provides an indicative and context-dependent operationalization guide based on existing statistical, administrative, and complementary proxy sources. The appendix should therefore be read as a pragmatic illustration of how the indicators may be approximated in practice, rather than as a redefinition of the constructs specified in Table 2.
As a general rule, purpose alignment, regional plasticity, temporal cadence and policy continuity, identity cohesion and public support, active institutional-memory loops, relational density and social capital, multilevel synchronization, purpose-driven innovation, execution efficiency and financial leverage, and stakeholder satisfaction and capacity building should be treated as intermediate indicators, since they primarily capture whether the strategy is aligned, adaptive, coordinated, legitimate, and capable of learning and implementation.
By contrast, societal impact and inclusion and benefit distribution should be treated as end indicators, since they capture the ultimate developmental outcomes to which the strategy is oriented. This classification should nevertheless be read as heuristic rather than absolute, because the analytical status of a given indicator may vary according to the substantive purpose of the strategy, the underlying theory of change, and the maturity and resolution of the available data.
Accountability is reinforced by periodically publishing a set of S3+P indicators, ideally through an online dashboard that is easy for both the public and decision-makers to read. In addition to monitoring progress, the dashboard serves as a tool for communicating the strategy’s identity by showcasing achievements, acknowledging challenges honestly, and maintaining confidence in the process [7]. It makes purpose visible, tells a shared regional story, and reinforces the sense of belonging, while also demonstrating the value of well-being metrics in reframing narratives of regional success beyond gross domestic product (GDP).
Finally, the interpretation of these indicators must remain contextual. If certain outcome targets are not met, intermediate indicators can help diagnose why, for example whether cooperation was weak, continuity was lacking, implementation capacity was insufficient, or stakeholder support remained fragile. Conversely, if the intermediate mechanisms performed well, such as where identity was strong and networks were mobilized, but the expected end outcomes have not yet been achieved, external factors such as economic shocks or a pandemic may be part of the explanation. Governance arrangements should therefore take such contingencies into account before adjusting the strategy. In short, monitoring in S3+P is not merely a technical exercise in target compliance, but an integral part of adaptive management and collective policy memory.
The practical application of S3+P requires clear role allocation across levels and actors, together with a coherent set of instruments. Its logic is multilevel and aligned with mission-oriented agendas and place-based policy direction [2,11].
  • European Union: defines the strategic framework for the Green Deal and the digital and social transitions while allowing flexibility for local adaptation. It offers technical assistance and benchmarking through the S3 Platform, promotes alignment and synergies with Horizon Europe, LIFE programme, and Interreg programmes, among others, and can launch calls focused on the implementation of regional missions. In this way, it ensures macro-level consistency between regional strategies and European goals [11].
  • Member State: co-finances the strategy and creates the legal and institutional conditions for implementation. It integrates regional S3+P into sectoral policies and national agendas, provides counterpart funding, adjusts regulations through sandboxes where necessary, and mobilizes technical teams. It can also encourage interregional cooperation when objectives are shared, thereby strengthening vertical coordination [2].
  • Region and municipalities: act as coordinating hubs that lead the strategy, mobilize actors, manage implementation and monitoring, and communicate purpose [28]. They create the S3+P team, participatory councils, and forums [28,62], involve sub-territories [28], and can launch thematic participatory budgets and tailored financial instruments [28,62], including public procurement to solve priority challenges [63]. They also test pilot initiatives and scale those that work [28,61].
  • Universities and knowledge centres: train talent aligned with purpose and lead localized research missions [64,65], operate observatories and independent evaluations, connect the region to scientific networks, and mediate public debate [64,65]. Programme contracts and extension programmes can anchor this role [65].
  • Companies: lead anchor projects, collaborate in networks, co-invest, and participate in governance [28,66]. Purpose-oriented tax incentives and subsidies, public–private partnerships, and support for clusters can reinforce market involvement and traction [63,66,67].
  • Civil society and citizens: identify real needs, monitor commitments, and confer public legitimacy on the strategy [62,68]. They participate in co-design and implementation through consortia, consultations, participatory budgets, civic challenges, and volunteering [62,69,70].
  • Instruments and financing: these include regional mission contracts [71]; Integrated Territorial Investments (ITI) and Community-Based Local Development (CLLD), combining funds from the European Regional Development Fund (ERDF), the European Social Fund and European Social Fund Plus (ESF/ESF+), and the European Agricultural Fund for Rural Development (EAFRD) [72]; regulatory sandboxes [73]; pre-commercial public procurement and public procurement of innovative solutions to create initial demand [63]; awards and competitions to generate ideas [74]; microcredit and impact finance to support small projects and scale up solutions with social and environmental returns [75]; and continuing education and training to update the skills of workers, public managers, and entrepreneurs in priority areas [76].
In summary, the policy toolbox in S3+P is broader and more integrated than in a traditional RIS3. It ranges from regulation to training, including financial instruments, to address development in a holistic and problem-oriented manner. Multilevel governance provides the collaborative framework needed to apply these instruments coherently across European, national, regional, and local levels and across sectors.

6.3. Short Illustrative Application to a Pilot Region

To illustrate the applicability of the S3+P framework, we present a hypothetical scenario for Alentejo in southern Portugal. It is a low-density region characterized by depopulation, understood here as the continuous loss of population through youth out-migration and ageing, the closure of services, and the weakening of the local economic fabric. It is also experiencing an economic transition, namely a shift from a model based on traditional agriculture and a limited range of higher-value services towards a greener and more digital economy with higher productivity and more skilled employment. This example shows how the model could alter decisions and outcomes relative to a conventional strategy.
This illustrative application is intended solely to show how the S3+P framework may be interpreted and translated into a plausible regional strategy scenario. It does not constitute a formal case study, an empirical validation of the model, or evidence that the proposed outcomes would necessarily occur in Alentejo. Rather, it uses a theoretically informed and contextually plausible example, based on secondary sources and accumulated regional knowledge, to make the framework more concrete and to show how purpose could reshape diagnosis, prioritization, governance, and evaluation in practice. More specifically, the illustrative scenario comprises the following elements:
  • S3+P purpose: following a participatory process involving local authorities, polytechnics, the University of Évora, associations, and citizens, the region adopts the following purpose statement: to become a sustainable well-being eco-region by 2035, retaining talent through a green and digital economy adapted to climate conditions.
  • Strategic missions: (1) solar energy and smart rural communities; (2) sustainable and circular agri-food; and (3) experiential tourism and the silver economy. These missions replace generic sectoral lists and organize projects around concrete problems and results for people.
  • Difference from the previous RIS3: instead of funding being scattered across ‘Agri’, ‘Renewables’, and ‘Tourism’, S3+P integrates energy, digital, and social dimensions to halt population outflow and create new development trajectories.
  • Illustrative initiatives: Smart Solar Village—an energy cooperative with smart grids, coworking, telehealth, and an electric minibus, developed in partnership between EDP, the University of Évora, the municipality, and a local association. Agrotech Youth Programme—training for 50 young people and incubation for 10 micro-enterprises in precision agriculture, with 30% reductions in water use in pilot olive groves. Slow Tourism and Health Cluster—winter stays for senior citizens from Northern Europe, combining rural accommodation, telehealth, and cultural experiences, supported by INTERREG and Turismo de Portugal.
  • Governance and communication: the Alentejo 2035 Council meets quarterly, removes obstacles, aligns with ministries, and monitors indicators. Communication is continuous and includes a public online dashboard—an open page with key indicators, targets, progress, and short project stories—reinforcing identity and external visibility.
  • Hypothetical impacts over ten years: demographic stabilization and some return migration of families; a modest rise in GDP per capita and gains in well-being; net exports of renewable energy; the emergence of three industrial (Small and medium-sized enterprises) SMEs and dozens of micro-enterprises linked to the purpose; and a positive territorial narrative that attracts projects and people.
The focus on purpose generates coherence, integration, and learning, allowing local initiatives to contribute more clearly to regional goals of well-being and sustainability.

7. Discussion

7.1. Practical Implications

S3+P suggests that purpose should be treated as an explicit criterion for diagnosis, prioritization, governance, portfolio design, and evaluation. In that sense, it answers the research question by showing how purpose can improve implementation quality and developmental direction relative to familiar S3 problems such as formalistic participation, generic priorities, weak coordination, and narrow output monitoring [11,14,17,20,27,46].
In practical terms, this implies greater emphasis on early diagnosis and participatory purpose definition, together with redesigning EDP as a continuous process of challenge framing, coalition building, and portfolio revision rather than as a one-off consultation [11,13,14,32].
It also means building governance arrangements capable of sustaining alignment over time: adaptive portfolios, continuity mechanisms, legitimating narratives, institutional memory, and structured collaboration across public authorities, firms, universities, civil society, and citizens [11,17,20,27].
A further implication concerns evaluation. Regions should monitor not only projects and patents, but also alignment, learning, cooperation, continuity, inclusion, and broader societal outcomes, thereby linking smart specialization more clearly to public value [11,14,18,46].

7.2. Theoretical Implications

Theoretically, the article connects bodies of literature that often remain separate by reframing smart specialization through a purpose-based, multilevel lens linking individuals, organizations, territories, and macro-policy frameworks [9,10,11,30,31,32,35,36,38,39,40,41,42,43,44,45].
This matters because it addresses the problem of directionality without abandoning the place-based logic of S3. Whereas earlier critiques stressed formalism, lock-in, weak differentiation, and governance failure [16,17,20,21,25,26,27], and recent debates linked S3 to sustainability and transformative agendas [9,10,11,12,13,14,15,32], S3+P specifies how shared orientation can be produced and maintained across levels.
Compared with earlier conceptualizations of smart specialization, S3+P retains the core place-based and discovery-oriented rationale of S3 [51], while extending it in several respects. Whereas foundational contributions emphasized prioritization, entrepreneurial discovery, and the development of a regional policy space [8,70], the S3+P framework introduces shared purpose as a more explicit principle for aligning strategic direction across individuals, organizations, territories, and macro-policy agendas. In doing so, it also brings the framework closer to recent debates on directionality, public value, and mission-oriented innovation [9] while preserving the territorial specificity of smart specialization. Finally, S3+P broadens the evaluative logic of S3 by suggesting that coherence, legitimacy, learning, and cross-level alignment should be considered alongside conventional innovation outputs when assessing strategy quality. From this perspective, S3+P is proposed not as a substitute for smart specialization, but as a conceptual extension aimed at strengthening its relevance for sustainable regional development.
The five catalytic mechanisms further recast alignment as an emergent and negotiated process rather than as a static condition, extending debates on place-based development, mission orientation, and territorial transformation [11,30,31,32,38,39,41,42,43,44,45].
The framework also repositions evaluation as part of strategy formation and revision rather than as a merely ex post technical exercise.

7.3. Limitations

This article remains a conceptual contribution. Its purpose is therefore not to provide a validated empirical model, formal robustness testing, or sensitivity analysis, but to develop an analytically grounded framework that can guide future empirical application and assessment. It does not establish causal effects, since the Alentejo application is intended solely as an illustrative exercise rather than as empirical validation. Several limitations nonetheless remain. Purpose may become vague, rhetorically invoked, politically contested, or excessively rigid in practice, and implementation is likely to be more demanding in weak-capacity or politically fragmented settings. Moreover, not all proposed dimensions are equally straightforward or equally cost-effective to operationalize, and some depend on composite proxies rather than direct official statistics. Identity cohesion, institutional memory, and relational density rely partly on survey evidence, documentary coding, or qualitative interpretation, which introduces measurement trade-offs and places demands on administrative coordination, data access, and analytical capacity. Accordingly, Appendix A should be read as an indicative operational guide rather than as evidence that all dimensions are equally measurement-ready across regional contexts. For this reason, early empirical applications may need to privilege a narrower and lower-cost indicator package, especially in lagging or weak-capacity regions, before extending the framework to more survey-intensive, network-based, or interpretive dimensions.

7.4. Future Research Agenda

Future research should therefore test whether purpose-oriented strategies improve coherence, implementation quality, and developmental outcomes; refine measures for the five catalytic mechanisms; compare how the model works across different territorial and institutional settings; and examine possible risks such as exclusion, narrative capture, or excessive strategic closure. Future empirical research should also assess the validity, sensitivity, and comparability of the proposed proxies across regional contexts and refine low-cost versus higher resolution operationalizations. A particularly relevant line of inquiry is whether lower-cost annual administrative indicators provide sufficiently stable governance signals when compared with higher-resolution but less frequent survey-based, qualitative, or network-analytic measures. Future empirical applications of S3+P should also include sensitivity tests that systematically vary operational definitions, proxy choices, and aggregation rules to assess whether the main findings remain stable. It would be useful to test whether purpose alignment yields similar results when measured through manual portfolio coding alone or when combined with ex ante and ex post project scoring, and whether the regional plasticity index remains stable when different weights are assigned to employment diversification, reskilling intensity, and business innovation. Likewise, future studies should examine the robustness of more interpretive dimensions by comparing alternative proxies for identity cohesion and public support and by testing different temporal baselines and continuity criteria for temporal cadence and policy continuity, especially given the distinction between annual, biennial, and periodic data collection in Appendix A. Such tests would help clarify the validity, comparability, and transferability of the framework while reinforcing its role as an adaptive monitoring architecture rather than a closed measurement instrument. In addition, quasi-experimental and counterfactual methods should be explored as a complementary layer of periodic impact evaluation for selected missions, interventions, or portfolio components. In this sense, the present article treats counterfactual analysis not as a routine feature of the monitoring dashboard, but as a subsequent evaluative stage once implementation maturity and data quality permit. Routine monitoring should therefore be used primarily to assess alignment, implementation quality, coordination, and adaptive learning, whereas counterfactual designs are more appropriately reserved for the periodic evaluation of mature interventions with clearer baselines, intervention logic, and comparison conditions.

8. Conclusions

This article argues that shared purpose can be incorporated into Smart Specialization Strategy by turning it into an explicit organizing principle that links diagnosis, prioritization, governance, implementation, and evaluation across levels.
Its contribution lies in reframing S3 through a purpose-based lens, proposing the multilevel S3+P model and its five catalytic mechanisms, and translating that model into an operational policy cycle. The broader implication is that renewing smart specialization requires not only better priority selection, but also clearer direction, stronger alignment, and broader criteria of success.
When purpose is made explicit, translated into missions, embedded in collaborative governance, and monitored through process and outcome indicators, S3 is more likely to function as a meaningful instrument of sustainable regional development.
While the present study is anchored in the EU smart specialization context, future research may explore the analytical applicability of the S3+P framework in other multilevel governance settings beyond Europe, particularly where place-based development and territorial coordination are also significant policy concerns.

Author Contributions

Conceptualization, M.L.S. and P.N.; methodology, M.L.S. and P.N.; validation, M.L.S., M.I.S.-H., M.J. and P.N.; formal analysis, M.L.S.; investigation, M.L.S.; resources, M.L.S., M.I.S.-H., M.J. and P.N.; writing-original draft preparation, M.L.S.; writing—review and editing, M.L.S., M.I.S.-H., M.J. and P.N.; visualization, P.N.; supervision, M.I.S.-H. and M.J.; project administration, M.I.S.-H. and M.J.; funding acquisition, M.I.S.-H. and M.J. All authors have read and agreed to the published version of the manuscript.

Funding

This research received no external funding.

Data Availability Statement

No new data were created or analyzed in this study. Data sharing is not applicable to this article.

Conflicts of Interest

The authors declare no conflict of interest.

Appendix A. Existing Statistical and Administrative Proxies for the Operationalization of the Proposed S3+P Indicators

Proposed IndicatorSuggested National ProxiesSuggested European ProxiesComplementary Existing ProxiesMethodological NoteIndicative Collection FrequencyAdministrative Burden
1. Purpose Alignment (% aligned initiatives)Share of Portugal 2030, Recovery and Resilience Plan, or Regional Programme projects classified under priorities directly linked to the strategic purpose; share of committed expenditure allocated to those prioritiesKohesio project and beneficiary data by theme, fund, and territory; Horizon Dashboard project data by topic, programme, geography, and organizationManual coding of project portfolios; ex ante and ex post project scoring; documentary analysis of calls, applications, and selection criteriaNo direct official statistical equivalent exists. The primary indicator should remain the share of projects or initiatives explicitly aligned with the strategic purpose, assessed through portfolio coding and documentary analysis. The share of committed expenditure allocated to purpose-aligned priorities should be treated as a complementary financial proxy rather than as a substitute for the main alignment measure.AnnualMedium
2. Regional Plasticity IndexRegional employment by economic activity; vocational education, training, and reskilling statistics; national innovation survey dataRegional employment by activity at Nomenclature of Territorial Units for Statistics (NUTS) level; Community Innovation Survey data; OECD regional employment indicatorsRelated variety index; share of employment in emerging activities; proportion of firms adopting new technologiesThis indicator can be approximated through a composite measure combining employment diversification, reskilling intensity, and business innovation.AnnualMedium
3. Temporal Cadence and Policy ContinuityShare of initiatives maintained after changes in government; multiannual execution rates; deviation between planned and actual implementation schedulesEU funds reporting on continuity of operations; project duration and continuity in KohesioMinutes of decision-making bodies; programme contracts; timetables for calls, contracting, and paymentsNo ready-made statistical series is available. The most suitable proxy is administrative, combining continuity of strategic operations and average timetable deviation.AnnualMedium
4. Identity Cohesion and Public SupportLife satisfaction and well-being indicators; regional opinion surveys; participation in public consultationsRegional Eurobarometer indicators on quality of life and trust in regional/local authorities; European Social Survey indicators on trust, attitudes, and belonging; Eurostat quality-of-life indicatorsSocial listening; media monitoring; civic participation rates; territorial branding indicatorsNo single official indicator captures this dimension directly. The core construct concerns recognition of, identification with, and support for the regional purpose, which is best assessed through dedicated or adapted regional opinion surveys. Trust in regional or local authorities, perceived regional quality of life, and life satisfaction may serve as contextual or complementary proxies, but they should not be treated as direct equivalents of purpose recognition and support.BiennialHigh
5. Active Institutional Memory (Learning) LoopsNumber of monitoring and evaluation reports produced; number of formal strategy revisions; existence of a public lessons-learned repositoryPublished EU programme evaluations and monitoring reportsRegional observatories; dashboards; minutes of strategic councils; internal learning logsThis indicator depends primarily on governance data. A defensible proxy is the number of evidence-based strategic adjustments and the regular updating of monitoring repositories or dashboards.AnnualMedium
6. Relational Density and Social CapitalAverage number of partners per project; number of university-business-government consortia; number of intersectoral agreementsKohesio data on consortia and beneficiaries; Horizon Dashboard collaboration data; European Social Survey indicators on generalized trustSocial network analysis; centrality of anchor actors; formal cooperation agreementsA strong operational proxy should prioritize observable collaboration structure, especially the average number of partners per project and the share of multi-helix collaborative projects. Broader social-capital measures, such as generalized trust, may provide contextual background but should be treated as secondary proxies rather than as direct measures of relational density within the S3+P governance ecosystem.PeriodicHigh
7. Multilevel Synchronization (Vertical Coordination)Share of initiatives with combined regional, national, and EU funding; number of joint State-Region decisions; alignment with national strategic agendasKohesio and Cohesion Data; Horizon Dashboard; relevant Inforegio programme dataNumber of combined policy instruments per priority; number of joint committees or formal coordination decisionsThis dimension can be approximated through the share of the portfolio supported by mixed regional/national/EU funding and the number of formal joint decisions.AnnualMedium
8. Purpose-Driven Innovation IndexShare of innovative firms; purpose-aligned R&D projects; thematic patents; surveys of beneficiary firmsCommunity Innovation Survey indicators; Eurostat regional patent data; Horizon Dashboard projects in relevant thematic domainsEuropean Patent Office statistics; number of new green, digital, or socially oriented products and services aligned with the strategic purposeThis is one of the strongest candidates for operationalization through existing data. A recommended combination includes innovative firms, thematic patents, and purpose-related R&D projects.AnnualMedium
9. Societal Impact Indicator (Main Outcome)Regional emissions, life satisfaction, well-being index, demography and migration, skilled employment, health, income, and quality-of-life indicatorsEurostat regional environmental and quality-of-life data; OECD Regional Well-Being indicatorsThematic observatories; mission-oriented indicators tailored to the territoryThis indicator should remain mission-specific. For example, in Alentejo it could combine life satisfaction, youth retention or net migration, and regional greenhouse gas emissions.AnnualMedium
10. Inclusion and Benefit DistributionGini coefficient, poverty and deprivation indicators, territorial inequality measures, beneficiary distribution by territoryEurostat income and living conditions database; regional poverty and social exclusion indicators; regional inequality statisticsShare of projects located in low-density municipalities; share of women, youth, or minority beneficiariesA robust minimum package may combine the Gini coefficient, at-risk-of-poverty or social exclusion rates, and the territorial distribution of projects and beneficiaries.AnnualMedium
11. Execution Efficiency and Financial LeverageFinancial execution rates; commitment rates; average time from approval to contracting and payment; amount of private leverage per euro of public fundingKohesio and EU funds dashboards; Horizon Dashboard for R&D projectsProgramme financial reports; contracts; firm-level co-financing recordsThis is one of the most readily measurable indicators. The most useful combination is execution rate, leverage ratio, and time-to-contract/time-to-payment.AnnualLow
12. Stakeholder Satisfaction and Capacity BuildingVocational training and activity statistics; number of trained participants; dedicated biennial stakeholder surveyBiennial satisfaction survey; repeat participation rates; self-assessed skills acquisitionAnnual satisfaction survey; repeat participation rates; self-assessed skills acquisitionThis dimension combines two related but analytically distinct components: stakeholder satisfaction with S3+P governance and evidence of capability building among participants. The most appropriate design is therefore a biennial stakeholder survey for satisfaction, complemented by participation in priority-field training, repeat participation in governance bodies, and self-assessed skills acquisition as evidence of capacity building. Official statistics alone are insufficient for the satisfaction component.BiennialMedium
Note: The territorial scale of the suggested proxies may vary across indicators depending on data availability and the substantive object being measured. In practice, some indicators are more appropriately operationalized at NUTS level, others at municipal or low-density territorial level, and others at project, beneficiary, or governance-network level. This variation does not alter the conceptual definition of the indicators, but it should be made explicit in empirical applications to preserve comparability and interpretive clarity. Indicative collection frequency and administrative burden are included only as broad implementation guidance. In general, indicators based primarily on recurrent administrative, programme, or statistical data are more suitable for annual collection and tend to involve lower or moderate administrative burden. Perception-based indicators are more realistically collected on a biennial basis, while network-analytic or more interpretive indicators may be collected periodically or on an ad hoc basis depending on regional capacity and data availability.

References

  1. Ferreira, H.; Marques, C.S.; Farinha, L. Regional smart specialisation strategies: A systematic literature review. J. Knowl. Econ. 2025, 17, 3032–3059. [Google Scholar] [CrossRef]
  2. Barca, F. An Agenda for a Reformed Cohesion Policy: A Place-Based Approach to Meeting European Union Challenges and Expectations; European Commission: Brussels, Belgium, 2009; Available online: https://img9.custompublish.com/getfile.php/930314.1169.qfspvupwqe/Barca_final_version_21_04.pdf?return=www.innovationcircle.no (accessed on 24 January 2026).
  3. Foray, D.; David, P.A.; Hall, B.H. Smart Specialisation: From Academic Idea to Political Instrument, the Surprising Career of a Concept and the Difficulties Involved in Its Implementation; MTEI Working Paper 2011-001; École Polytechnique Fédérale de Lausanne: Lausanne, Switzerland, 2011. [Google Scholar]
  4. Foray, D. On the policy space of smart specialization strategies. Eur. Plan. Stud. 2016, 24, 1428–1437. [Google Scholar] [CrossRef]
  5. McCann, P.; Ortega-Argilés, R. Smart specialization, regional growth and applications to European Union cohesion policy. Reg. Stud. 2015, 49, 1291–1302. [Google Scholar] [CrossRef]
  6. Camagni, R.; Capello, R. Regional innovation patterns and the EU regional policy reform: Toward smart innovation policies. Growth Change 2013, 44, 355–389. [Google Scholar] [CrossRef]
  7. Eadson, W.; van Veelen, B. Green and just regional path development. Reg. Stud. Reg. Sci. 2023, 10, 218–233. [Google Scholar] [CrossRef]
  8. Harding, R.; Nauwelaers, C.; Cohen, C.; Seigneur, I. Fostering the Green Transition Through Smart Specialisation Strategies: Some Inspiring Cases Across Europe (EUR 30921 EN); Publications Office of the European Union: Luxembourg, 2021. [CrossRef]
  9. Mazzucato, M. Mission-oriented innovation policies: Challenges and opportunities. Ind. Corp. Change 2018, 27, 803–815. [Google Scholar] [CrossRef]
  10. Grillitsch, F.; Cappellano, F.; Makkonen, T.; Hassink, R. Smart Specialisation Strategies and Mission-Oriented Approach: Bridging Theory and Practice; JRC Working Paper Series on Transforming Territories No. 01/2025; European Commission, Joint Research Centre: Brussels, Belgium, 2025; Available online: https://publications.jrc.ec.europa.eu/repository/handle/JRC141409 (accessed on 24 January 2026).
  11. Reid, A.; Steward, F.; Miedzinski, M. Aligning Smart Specialisation with Transformative Innovation Policy: Lessons for Implementing Challenge-Led Missions in Smart Specialization; Publications Office of the European Union: Luxembourg, 2023. [CrossRef]
  12. European Commission; Joint Research Centre; European Committee of the Regions. Partnerships for Regional Innovation Pilot (2022–2023). Available online: https://sl1nk.com/0zLoh (accessed on 24 January 2026).
  13. Pontikakis, D.; González Vázquez, I.; Bianchi, G.; Ranga, M.; Marqués Santos, A.; Reimeris, R.; Mifsud, S.; Morgan, K.; Madrid González, C.; Stierna, J. Partnerships for Regional Innovation—Playbook: Concepts and Rationales; Publications Office of the European Union: Luxembourg, 2022. [CrossRef]
  14. Moujaes, G. Moving to smart specialization for sustainability: The implications for the design of monitoring indicators. Sci. Public Policy 2024, 51, 127–143. [Google Scholar] [CrossRef]
  15. McCann, P.; Soete, L. Place-Based Innovation for Sustainability; Publications Office of the European Union: Luxembourg, 2020. [CrossRef]
  16. Barzotto, M.; Corradini, C.; Fai, F.; Labory, S.; Tomlinson, P.R. Smart specialisation, Industry 4.0 and lagging regions: Some directions for policy. Reg. Stud. Reg. Sci. 2020, 7, 318–332. [Google Scholar] [CrossRef]
  17. Capello, R.; Kroll, H. From theory to practice in smart specialization strategy: Emerging limits and possible future trajectories. Eur. Plan. Stud. 2016, 24, 1393–1406. [Google Scholar] [CrossRef]
  18. Esparza-Masana, R. Towards smart specialisation 2.0: Main challenges when updating strategies. J. Knowl. Econ. 2022, 13, 635–655. [Google Scholar] [CrossRef]
  19. del Castillo Hermosa, J.; Paton Elorduy, J.; Barroeta Eguía, B. Smart specialization and entrepreneurial discovery: Theory and reality. Rev. Port. Estud. Reg. 2015, 39, 5–22. [Google Scholar] [CrossRef]
  20. Gianelle, C.; Guzzo, F.; Mieszkowski, K. Smart specialisation: What gets lost in translation from concept to practice? Reg. Stud. 2020, 54, 1377–1388. [Google Scholar] [CrossRef]
  21. Hassink, R.; Gong, H. Six critical questions about smart specialization. Eur. Plan. Stud. 2019, 27, 2049–2065. [Google Scholar] [CrossRef]
  22. Cvijanović, V.; Griniece, E.; Gulyás, O.; Reid, A.; Varga, H. Stakeholder engagement through entrepreneurial discovery? Lessons from countries and regions in Central and Eastern Europe. Cogent Soc. Sci. 2020, 6, 1794273. [Google Scholar] [CrossRef]
  23. Marques, P.; Morgan, K. The heroic assumptions of smart specialisation: A sympathetic critique of regional innovation policy. In New Avenues for Regional Innovation Policy; Isaksen, A., Martin, R., Trippl, M., Eds.; Springer: Cham, Switzerland, 2018; pp. 275–293. [Google Scholar] [CrossRef]
  24. Aranguren, M.-J.; Izulain, A.; Wilson, J.R. Shared Visioning as an Approach to Regional Strategic Foresight: The Experience of Euskadi 2040; Orkestra Policy Briefs, 01/2024; Basque Institute of Competitiveness (Orkestra): Bilbao, Spain, 2024. [Google Scholar] [CrossRef]
  25. Iacobucci, D.; Guzzini, E. Relatedness and connectivity in technological domains: Missing links in S3 design and implementation. Eur. Plan. Stud. 2016, 24, 1511–1526. [Google Scholar] [CrossRef]
  26. Benner, M. Six additional questions about smart specialisation: Implications for regional innovation policy 4.0. Eur. Plan. Stud. 2020, 28, 1667–1684. [Google Scholar] [CrossRef]
  27. Uyarra, E.; Marzocchi, C.; Sörvik, J. How outward looking is smart specialisation? Rationales, drivers and barriers. Eur. Plan. Stud. 2018, 26, 2344–2363. [Google Scholar] [CrossRef]
  28. Gianelle, C.; Kyriakou, D.; Cohen, C.; Przeor, M. (Eds.) Implementing Smart Specialisation: A Handbook; Publications Office of the European Union: Luxembourg, 2016.
  29. Pinto, H.; Laranja, M.; Uyarra, E. Smart specialization, public authorities, and innovation intermediaries in developing regions. Reg. Sustain. 2024, 5, 100175. [Google Scholar] [CrossRef]
  30. Pike, A.; Rodríguez-Pose, A.; Tomaney, J. Local and Regional Development, 2nd ed.; Routledge: London, UK, 2016. [Google Scholar] [CrossRef]
  31. Sen, A. Development as Freedom; Alfred A. Knopf: New York, NY, USA, 1999. [Google Scholar]
  32. Schot, J.; Steinmueller, W.E. Three frames for innovation policy: R&D, systems of innovation and transformative change. Res. Policy 2018, 47, 1554–1567. [Google Scholar] [CrossRef]
  33. Molica, F. Regional innovation policies and directionality: Exploring the role of conditionality. Eur. Plan. Stud. 2024, 32, 1653–1670. [Google Scholar] [CrossRef]
  34. Uyarra, E.; Bugge, M.M.; Coenen, L.; Flanagan, K.; Wanzenböck, I. Geographies of mission-oriented innovation policy. Environ. Innov. Soc. Transit. 2025, 56, 100970. [Google Scholar] [CrossRef]
  35. Bhattacharya, C.B.; Van den Broeck, A.; Slater, S. Corporate purpose and employee sustainability behaviors. J. Bus. Ethics 2023, 188, 675–692. [Google Scholar] [CrossRef]
  36. Ocasio, W.; Gai, S.; Ma, F. Making sense of corporate purpose. Strategy Sci. 2023, 8, 329–346. [Google Scholar] [CrossRef]
  37. Molica, F.; Cappellano, F.; Makkonen, T.; Hassink, R. Embedding the mission-oriented approach in smart specialization strategies: An exploratory assessment. Eur. Plan. Stud. 2026; epub ahead of printing. [CrossRef]
  38. Agnew, J. The territorial trap: The geographical assumptions of international relations theory. Rev. Int. Polit. Econ. 1994, 1, 53–80. [Google Scholar] [CrossRef]
  39. Budd, L.; Hirmis, A. Conceptual framework for regional competitiveness. Reg. Stud. 2004, 38, 1015–1028. [Google Scholar] [CrossRef]
  40. Gartenberg, C.; Prat, A.; Serafeim, G. Corporate purpose and financial performance. Organ. Sci. 2019, 30, 1–18. [Google Scholar] [CrossRef]
  41. Neto, P. Strategic planning of territorial image and attractability. In Advances in Modern Tourism Research; Matias, Á., Nijkamp, P., Neto, P., Eds.; Physica-Verlag: Heidelberg, Germany, 2007; pp. 275–296. [Google Scholar] [CrossRef]
  42. Neto, P.; Serrano, M.M.; Santos, A. Políticas Públicas de Desenvolvimento Regional em Portugal: Contexto, Atores e Perspetivas; UMPP Policy Papers, No. 1; Universidade de Évora—Unidade de Monitorização de Políticas Públicas: Évora, Portugal, 2016; Available online: https://www.umpp.uevora.pt/publicacoes/Policy-Papers (accessed on 24 January 2026).
  43. Roessler, M. Untangling regional development traps through narratives. Reg. Stud. Reg. Sci. 2024, 11, 406–418. [Google Scholar] [CrossRef]
  44. Rutten, R.; Boekema, F. From learning region to learning in a socio-spatial context. Reg. Stud. 2012, 46, 981–992. [Google Scholar] [CrossRef]
  45. Sutton, J.; Arku, G. Regional economic resilience: Toward a system approach. Reg. Stud. Reg. Sci. 2022, 9, 497–512. [Google Scholar] [CrossRef]
  46. Jaakkola, E. Designing conceptual articles: Four approaches. AMS Rev. 2020, 10, 18–26. [Google Scholar] [CrossRef]
  47. Kah, S.; Ferry, M. Territorialising Development Policies in Europe: A Review of Current Practice; EoRPA Report 25/2; EoRPA Regional Policy Research Consortium: Glasgow, UK; European Policies Research Centre: Glasgow, UK; University of Strathclyde: Glasgow, UK; EPRC Delft: Delft, The Netherlands, 2025. [Google Scholar]
  48. JRC. Regional Resilience in the Era of Climate Change and Digitalization; JRC Working Papers on Territorial Modelling and Analysis, 08/2025; JRC: Brussels, Belgium, 2025. [Google Scholar]
  49. Ortega-Argilés, R.; Goddard, J.; Goenaga, X.; Landabaso, M.; Morgan, K.; Nauwelaers, C.; Foray, D. Guide to Research and Innovation Strategies for Smart Specialisation (RIS3); Publications Office of the European Union: Luxembourg, 2012.
  50. Balland, P.A.; Boschma, R.; Crespo, J.; Rigby, D.L. Smart specialization policy in the European Union: Relatedness, knowledge complexity and regional diversification. Reg. Stud. 2019, 53, 1252–1268. [Google Scholar] [CrossRef]
  51. Foray, D. Smart Specialisation: Opportunities and Challenges for Regional Innovation Policy; Routledge: London, UK, 2015. [Google Scholar] [CrossRef]
  52. Rodríguez-Pose, A. Forging a sustainable future together: Cohesion Policy at its defining moment. Reg. Stud. 2025, 59, 2552869. [Google Scholar] [CrossRef]
  53. Aranguren, M.J.; Magro, E.; Navarro, M.; Wilson, J.R. Governance of the territorial entrepreneurial discovery process: Looking under the bonnet of RIS3. Reg. Stud. 2019, 53, 451–461. [Google Scholar] [CrossRef]
  54. Putra, A.A.; Hasibuan, H.S.; Tambunan, R.P.; Lautetu, L.M. Integration of the Sustainable Development Goals into a Regional Development Plan in Indonesia. Sustainability 2024, 16, 10235. [Google Scholar] [CrossRef]
  55. Fauth, J.; Haukipuro, L.; Schaffers, H. Living labs as orchestrators in the regional innovation ecosystem: A conceptual framework. Reg. Stud. Reg. Sci. 2024, 11, 1–18. [Google Scholar] [CrossRef]
  56. Nieth, L.; Benneworth, P.; Charles, D.; Sotarauta, M. Universities as strategic agents in regional path development. Eur. Plan. Stud. 2023, 31, 2051–2072. [Google Scholar] [CrossRef]
  57. Roman, M.; Varga, J.; Cvijanović, V. Quadruple Helix models for sustainable regional innovation: Engaging civil society in the entrepreneurial discovery process. Economies 2020, 8, 48. [Google Scholar] [CrossRef]
  58. van Tuin, L.; Schalk, R.; van der Heijden, B.I.J.M.; van Zyl, L.E. A corporate purpose as an antecedent to employee motivation and work engagement. Front. Psychol. 2020, 11, 572343. [Google Scholar] [CrossRef]
  59. Yue, Z.; Zhang, M.; Yang, S.; Zhao, K. Understanding the role of smart specialization strategies (S3) within a regional innovation system: Evidence from digital industries in the Yangtze River Delta, China. Systems 2024, 12, 62. [Google Scholar] [CrossRef]
  60. Carayannis, E.G.; Barth, T.D.; Campbell, D.F.J. The Quintuple Helix innovation model: Global warming as a challenge and driver for innovation. J. Innov. Entrep. 2012, 1, 2. [Google Scholar] [CrossRef]
  61. OECD. Proactive Portfolio Management in Mission-Oriented Innovation Policy; OECD Science, Technology and Industry Policy Papers, No. 173; OECD Publishing: Paris, France, 2025. [Google Scholar] [CrossRef]
  62. OECD. Innovative Citizen Participation and New Democratic Institutions: Catching the Deliberative Wave; OECD Publishing: Paris, France, 2020. [Google Scholar] [CrossRef]
  63. OECD. Public Procurement for Innovation: Good Practices and Strategies; OECD Public Governance Reviews; OECD Publishing: Paris, France, 2017. [Google Scholar] [CrossRef]
  64. Kempton, L.; Goddard, J.; Edwards, J.H.; Hegyi, F.B.; Elena-Pérez, S. Universities and Smart Specialisation (EUR 26343 EN); Publications Office of the European Union: Luxembourg, 2014. [CrossRef]
  65. Woolford, J.; Boden, M. (Eds.) Higher Education for Smart Specialisation: A Handbook; Publications Office of the European Union: Luxembourg, 2021. [CrossRef]
  66. OECD. OECD Science, Technology and Innovation Outlook 2021; OECD Publishing: Paris, France, 2021. [Google Scholar] [CrossRef]
  67. OECD. Clusters, Innovation and Entrepreneurship; OECD: Paris, France, 2009. [Google Scholar]
  68. Arnstein, S.R. A ladder of citizen participation. J. Am. Inst. Plan. 1969, 35, 216–224. [Google Scholar] [CrossRef]
  69. Radovanovic, N.; Bole, D. Guidelines for the Stakeholder Dialogue in the Process of Designing and Implementing Smart Specialisation Strategies in the EU Enlargement and Neighbourhood Region; Publications Office of the European Union: Luxembourg, 2024. [CrossRef]
  70. United Nations Volunteers. State of the World’s Volunteerism Report 2022: Building Equal and Inclusive Societies; United Nations: New York, NY, USA, 2022. [Google Scholar]
  71. Bianchi, G. (Ed.) Innovation for Place-Based Transformations: ACTION Book, Practices and Tools; Publications Office of the European Union: Luxembourg, 2024. [CrossRef]
  72. European Commission; DG REGIO. Integrated Sustainable Urban Development; European Commission, DG REGIO: Etterbeek, Belgium, 2014.
  73. Gorenstein Dedecca, J.; Ansarin, M.; Adsal, K.A.; Blind, K. Regulatory Sandboxes in the Energy Sector: Final Report; Publications Office of the European Union: Luxembourg, 2023. [CrossRef]
  74. Kumpf, B.; Zavarella, A.; Chis, T.; Nothstine, K. Fostering Innovation in Low- and Middle-Income Countries Through Challenge Funds and Prizes: Lessons for Development Co-Operation; OECD Development Co-Operation Working Papers, No. 116; OECD Publishing: Paris, France, 2024. [Google Scholar]
  75. OECD. Social Impact Investment 2019: The Impact Imperative for Sustainable Development; OECD Publishing: Paris, France, 2019. [Google Scholar]
  76. OECD. Getting Skills Right: Future-Ready Adult Learning Systems; OECD Publishing: Paris, France, 2019. [Google Scholar]
Figure 1. Development with purpose as an emerging outcome. Source: Own elaboration based on [41].
Systems 14 00409 g001
Figure 2. Examples of catalysing mechanisms by dimension and drivers. Source: Own elaboration.
Systems 14 00409 g002
Figure 3. S3+P: multilevel conceptual model with contextual conditions. Legend: P—Plasticity; T—Temporality; I—Identity; M—Memory; R—Relational Networks. Source: Own elaboration.
Systems 14 00409 g003
Figure 4. S3+P policy cycle with six steps and feedback points. Source: Own elaboration.
Systems 14 00409 g004
Table 1. Mapping of gaps in the current S3 and corresponding innovations in S3+P.
Current S3 LimitationS3+P Approach (Response)
Formal EDP and limited stakeholder participationParticipatory and purpose-driven EDP 2.0: deliberate inclusion of diverse voices (citizens, small businesses, non-governmental organizations (NGOs) from the diagnosis stage onward; continuous quintuple-helix governance throughout the cycle, not only during planning. Active public facilitation helps engage ‘new discoverers’ (start-ups, young people, minorities) in innovative priorities.
Generic priorities and risk of sectoral lock-inMission-oriented prioritization: priority areas are defined around societal challenges and specific local opportunities (e.g., ‘clean mobility in rural areas’ rather than simply ‘automobiles’), encouraging sectoral combination and reducing lock-in. Evidence on related variety and targeted diversification helps select ambitious but viable domains. A plasticity mechanism supports periodic review as new opportunities emerge.
Failure of multilevel coordination (vertical and horizontal)Formalized multilevel governance: joint State-Region committees align investments and remove legal obstacles; national agencies and the European Commission are actively involved in monitoring the regional strategy (e.g., through intergovernmental policy labs). Purpose-driven interregional alliances allow regions with similar goals to share knowledge and develop cross-regional projects. Temporality and networks help synchronize efforts within and beyond the territory.
Indicators focused on outputs, with limited impact assessmentA metrics framework aligned with purpose-driven outcomes: alongside R&D indicators, societal progress (Key Performance Indicators) KPIs are introduced (e.g., percentage reduction in CO2 emissions, well-being index, regional inequality). Monitoring is participatory and transparent, and strategy adjustments follow where necessary. Institutional memory retains evaluation results for future policy cycles. Evaluation also considers transformative additionality: whether S3+P changed trajectories rather than merely generating isolated projects.
Uneven capabilities and risk of captureCapacity building combined with a purpose-based approach: alongside implementation, investment is made in training local staff and strengthening institutions (e.g., partnerships with universities for innovative public-management courses and exchanges of good practice across regions). A clear purpose acts as a strategic umbrella that makes capture more visible and open to public scrutiny. The involvement of multiple stakeholders also creates checks and balances, reducing the discretion of any single actor.
Source: Authors’ elaboration based on academic literature.
Table 2. Indicators and sources by mechanism with operational definition.
IndicatorIndicator TypeMechanisms AssociatedOperational DefinitionSuggested Data Sources
Purpose alignment (% of aligned initiatives)IntermediateI, RProportion of projects in the S3+P portfolio that explicitly contribute to the defined strategic purpose, measured as the number of ongoing projects or investments assessed as highly aligned with the purpose divided by the total number of projects.Qualitative analysis of project objectives, validated by the S3+P board; project portfolios; documentary analysis of calls, applications, and selection criteria.
Regional plasticity indexIntermediateP, RComposite indicator of economic diversification and adaptability, combining variation in sectoral employment diversification, the percentage of workers retrained for priority sectors, and the rate of adoption of emerging technologies by local firms.Employment statistics, business innovation surveys, vocational education, training and reskilling data; complementary related variety and technology adoption proxies.
Temporal cadence and policy continuityIntermediateT, M, RIndicator of strategic synchronization and persistence, measured through the percentage of S3+P actions that remain in implementation after a local or regional government transition and the degree of temporal alignment between multiyear plans at regional and national levels.Administrative records, regional plans and budgets, programme contracts, implementation timetables, and official government transition documentation.
Identity cohesion and public supportIntermediateI, R, MDegree to which the population and key stakeholders identify with and support the regional purpose, measured by the percentage of citizens who recognize and agree with the purpose and the visibility of the purpose in public discourse.Regional opinion surveys, media monitoring, official communications, social listening, civic participation rates, and territorial branding indicators.
Active institutional-memory (learning) loopsIntermediateM, T, REvidence of learning and policy adjustment, measured through the number of significant strategies or project adaptations based on evaluation and feedback, and the existence of an accessible and regularly updated lessons-learned repository.Monitoring reports, minutes of the S3+P board or strategic council, public dashboards, observatories, internal learning logs, and strategy websites.
Relational density and social capitalIntermediateR, I, MStrength of collaboration networks in the regional ecosystem, measured through the degree of interconnectivity among actors, average number of partners per strategic project, and the number of new cross-sector agreements or partnerships formed within the scope of the purpose.Project databases, consortium records, cooperation agreements, network surveys, and social network analysis.
Multilevel synchronization (vertical coordination)IntermediateT, RDegree of alignment between regional, national, and European policies, measured through the share of S3+P initiatives receiving combined regional, national, and EU support and the number of formal joint decisions or coordination meetings.Funding documents, institutional meeting records, programme data, Kohesio and other EU funding dashboards, and records of joint State-Region committees.
Purpose-driven innovation indexIntermediateP, I, RVolume and relevance of innovation generated in line with the strategic purpose, measured through the number of new products, services, or processes developed through S3+P projects that directly address the purpose challenge, and the percentage of participating firms introducing purpose-aligned innovation.R&D project reports, patent databases with thematic classification, Community Innovation Survey data, beneficiary firm surveys, and thematic Horizon data.
Societal impact indicator (main outcome)EndT, I, MPrincipal metric of success in achieving the strategic purpose. Its content is mission-specific and may include, depending on the territorial purpose, greenhouse gas emissions reduction, life satisfaction, well-being, youth retention, migration balance, skilled employment, health, or other outcome variables.Official statistics, regional environmental and quality-of-life indicators, research institute data, (Organization for Economic Co-operation and Development) OECD or Eurostat regional well-being data, and thematic observatories.
Inclusion and benefit distributionEndR, IDegree to which the strategy reduces inequalities and distributes benefits across territories and social groups, measured through changes in inequality, poverty, deprivation, territorial gaps, and the share of projects and beneficiaries located in or drawn from less advantaged areas and underrepresented groups.Disaggregated regional socioeconomic data, inequality and poverty indicators, beneficiary monitoring systems, and territorial distribution of projects and participants.
Execution efficiency and financial leverageIntermediateT, R, PFinancial and managerial performance of implementation, measured through the execution rate of allocated funds, the amount of private investment mobilized per euro of public investment, and, where relevant, the average time from approval to contracting and payment.Regional operational programme financial reports, contracts, programme dashboards, and records of private co-investment.
Stakeholder satisfaction and capacity buildingIntermediateR, M, IQualitative assessment of the process and its capability-building effects, measured through stakeholder satisfaction with S3+P governance and the extent to which participants report acquiring new skills in collaboration, evaluation, and related areas.Stakeholder surveys and interviews, participation records, training statistics, repeat participation data, and self-assessed skills acquisition.
Legend: P, plasticity; T, temporality; I, identity; M, memory; R, networks. Source: Own elaboration.
Disclaimer/Publisher’s Note: The statements, opinions and data contained in all publications are solely those of the individual author(s) and contributor(s) and not of MDPI and/or the editor(s). MDPI and/or the editor(s) disclaim responsibility for any injury to people or property resulting from any ideas, methods, instructions or products referred to in the content.