


Abstract
The escalation of geopolitical tensions has forced global manufacturers to reconfigure their supply chains. While Digital Transformation (DT) is widely touted as a primary driver of resilience, traditional variance-based research often assumes a symmetric, linear relationship that applies universally across firms. This study challenges this assumption through the lens of Complexity Theory. Viewing supply chains as Complex Adaptive Systems (CASs), we employ Fuzzy-Set Qualitative Comparative Analysis (fsQCA) on a stratified sample of 928 manufacturers in a geopolitical high-risk zone (Taiwan). We identify equifinal pathways to Organizational Resilience, revealing a fundamental asymmetry between organizational types. The results suggest that while large enterprises rely on a resource-intensive strategy—which we term the “Digital Fortress” configurational metaphor (combining high digital maturity and agility as a core condition)—SMEs can achieve high resilience through an “Agile Dodger” configuration, leveraging operational agility and niche positioning without necessitating high digital maturity. This study contributes to the systems literature by mapping the “topology of resilience” and offering tailored configurational pathways that complement traditional variance-based perspectives in volatile ecosystems.
1. Introduction
The contemporary global supply chain ecosystem is operating under a state of “permacrisis,” characterized by cascading disruptions ranging from the post-pandemic bullwhip effects to escalating geopolitical fragmentation [1,2]. In this high-velocity environment, Organizational Resilience has transitioned from an operational “nice-to-have” to a strategic imperative for survival. Consequently, academics and practitioners alike have championed Digital Transformation (DT) as a critical enabler for enhancing visibility and responsiveness [3,4,5].
However, the prevailing operations management literature suffers from critical systemic limitations when addressing this complex landscape. First, the majority of studies rely on variance-based approaches (e.g., regression, SEM) that assume causal symmetry—implying that the path to success is simply the reverse of the path to failure. As noted by Woodside [6] and Ragin [7], these net-effects models—built on assumptions of linearity, additivity, and homogeneity—often fail to capture the interdependent, multi-causal reality of Complex Adaptive Systems (CAS). Therefore, this study aims to complement traditional variance-based perspectives by demonstrating how non-linear causalities operate under extreme duress.
Second, and critically, current research often adopts a generic, “one-size-fits-all” logic. It implicitly assumes that the mechanisms for building resilience—such as heavy investment in Industry 4.0 technologies—are universally applicable, ignoring the structural and resource-based chasms between Large Enterprises and Small and Medium Enterprises (SMEs) [8,9]. Given that SMEs constitute the backbone of global manufacturing yet face distinct resource constraints, applying large-firm logic to them is theoretically flawed and practically hazardous.
To address these gaps, this study adopts a Complexity Theory lens, viewing supply chains as Complex Adaptive Systems (CAS). We move beyond asking “What is the unique effect of DT on resilience?” to asking “What distinct configurations of digital capability, operational agility, and risk exposure lead to high resilience across different organizational species?” Leveraging Fuzzy-Set Qualitative Comparative Analysis (fsQCA), we utilize Taiwan’s manufacturing sector as a critical geopolitical “natural laboratory” to uncover the equifinal and asymmetric paths to survival.
2. Theoretical Background
2.1. Supply Chains as Complex Adaptive Systems (CAS)
Traditional reductionist approaches isolate individual variables to test linear hypotheses. However, Complexity Theory posits that modern supply networks function as Complex Adaptive Systems (CASs), characterized by non-linearity, interdependence, and emergence [10,11,12]. In a CAS, system-level properties like resilience do not result from simple additive effects of inputs. Instead, they “emerge” from the specific ways subsystems interact under environmental pressure. Therefore, understanding survival in the current geopolitical climate necessitates a shift from variance theory to Configuration Theory [13]. This perspective conceptualizes organizational outcomes as the result of distinct “recipes” of causal conditions, aligning perfectly with the systems thinking approach required for modern crisis management.
2.2. Causal Complexity: Equifinality and Asymmetry
A configurational approach highlights two foundational tenets often overlooked in linear models:
- Equifinality: This is the principle that there is no single “best way” to achieve an outcome. Different firms may reach high resilience through entirely different combinations of attributes [13]. For instance, a firm lacking advanced digital twins might compensate with exceptional human-centric agility to achieve the same level of viability.
- Causal Asymmetry: This is the notion that pathways leading to the presence of an outcome (e.g., high resilience) are not mere mirror images of pathways leading to its absence [7]. Recent studies specifically highlight digital capability asymmetry, where buyer-supplier power dynamics distort the resilience benefits of digitalization [12]. Furthermore, while recent supply chain literature has increasingly embraced configurational approaches (fsQCA) to unpack resilience pathways [14,15], many of these studies primarily focus on general capabilities without distinguishing the structural boundaries of firm size. Building upon these configurational foundations, we argue for cross-context asymmetry: a configuration that spells success for a resource-rich giant may be ineffective for a resource-poor SME. A significant debate in the current literature revolves around whether digitalization is a universal shield against disruption or a highly context-dependent asset. While some scholars advocate for uniform digital adoption, others warn of its limitations under resource constraints. By differentiating firm size, our configurational approach directly addresses this debate, revealing that size acts as a critical boundary condition for digital efficacy.
2.3. Resource Orchestration and Strategic Heterogeneity
While the Resource-Based View highlights the importance of assets, the Resource Orchestration View (ROV) emphasizes that value is created by how resources are bundled and leveraged to address environmental shifts [8,16]. We posit that the mechanisms of orchestration differ fundamentally by firm size in a crisis context.
- Large Enterprises (Structuring Orchestration): Large firms typically possess “slack resources,” enabling them to engage in what we term “structuring orchestration”—investing heavily in comprehensive digital infrastructures for sensing and seizing at scale [17]. Their path to resilience is often capital- and technology-intensive, relying on digital dominance to buffer against shocks.
- SMEs (Leveraging Orchestration): Facing “resource poverty,” SMEs cannot replicate the heavy digital infrastructure of large firms. Instead, they must rely on “leveraging orchestration”—mobilizing existing, often human-centric resources more effectively. Recent studies suggest that for SMEs, Agile Coordination—the ability to rapidly reconfigure processes and decision-making without heavy tech dependence—acts as a critical strategic substitute for expensive digitalization [9].
Therefore, based on ROVs under complexity, we propose that the “resilience premium” is generated through asymmetric paths: Large firms likely follow a tech-intensive trajectory, while SMEs follow an agility-intensive trajectory.
3. Methodology
3.1. Methodological Justification: fsQCA
To capture the causal complexity and asymmetry hypothesized above, we employ Fuzzy-Set Qualitative Comparative Analysis (fsQCA). Unlike regression analysis, which focuses on the unique contribution of independent variables holding others constant, fsQCA analyzes set-theoretic relationships to identify sufficient configurations of conditions [7,18]. This method is uniquely suited for answering “how” distinct combinations of conditions lead to high resilience across different organizational species.
3.2. Conceptual Framework
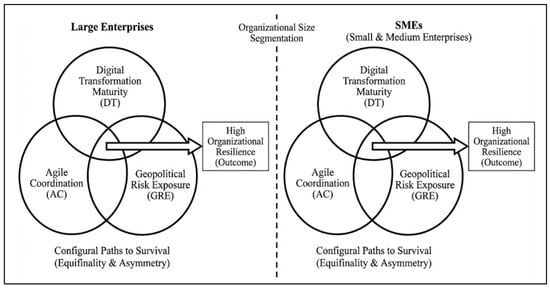
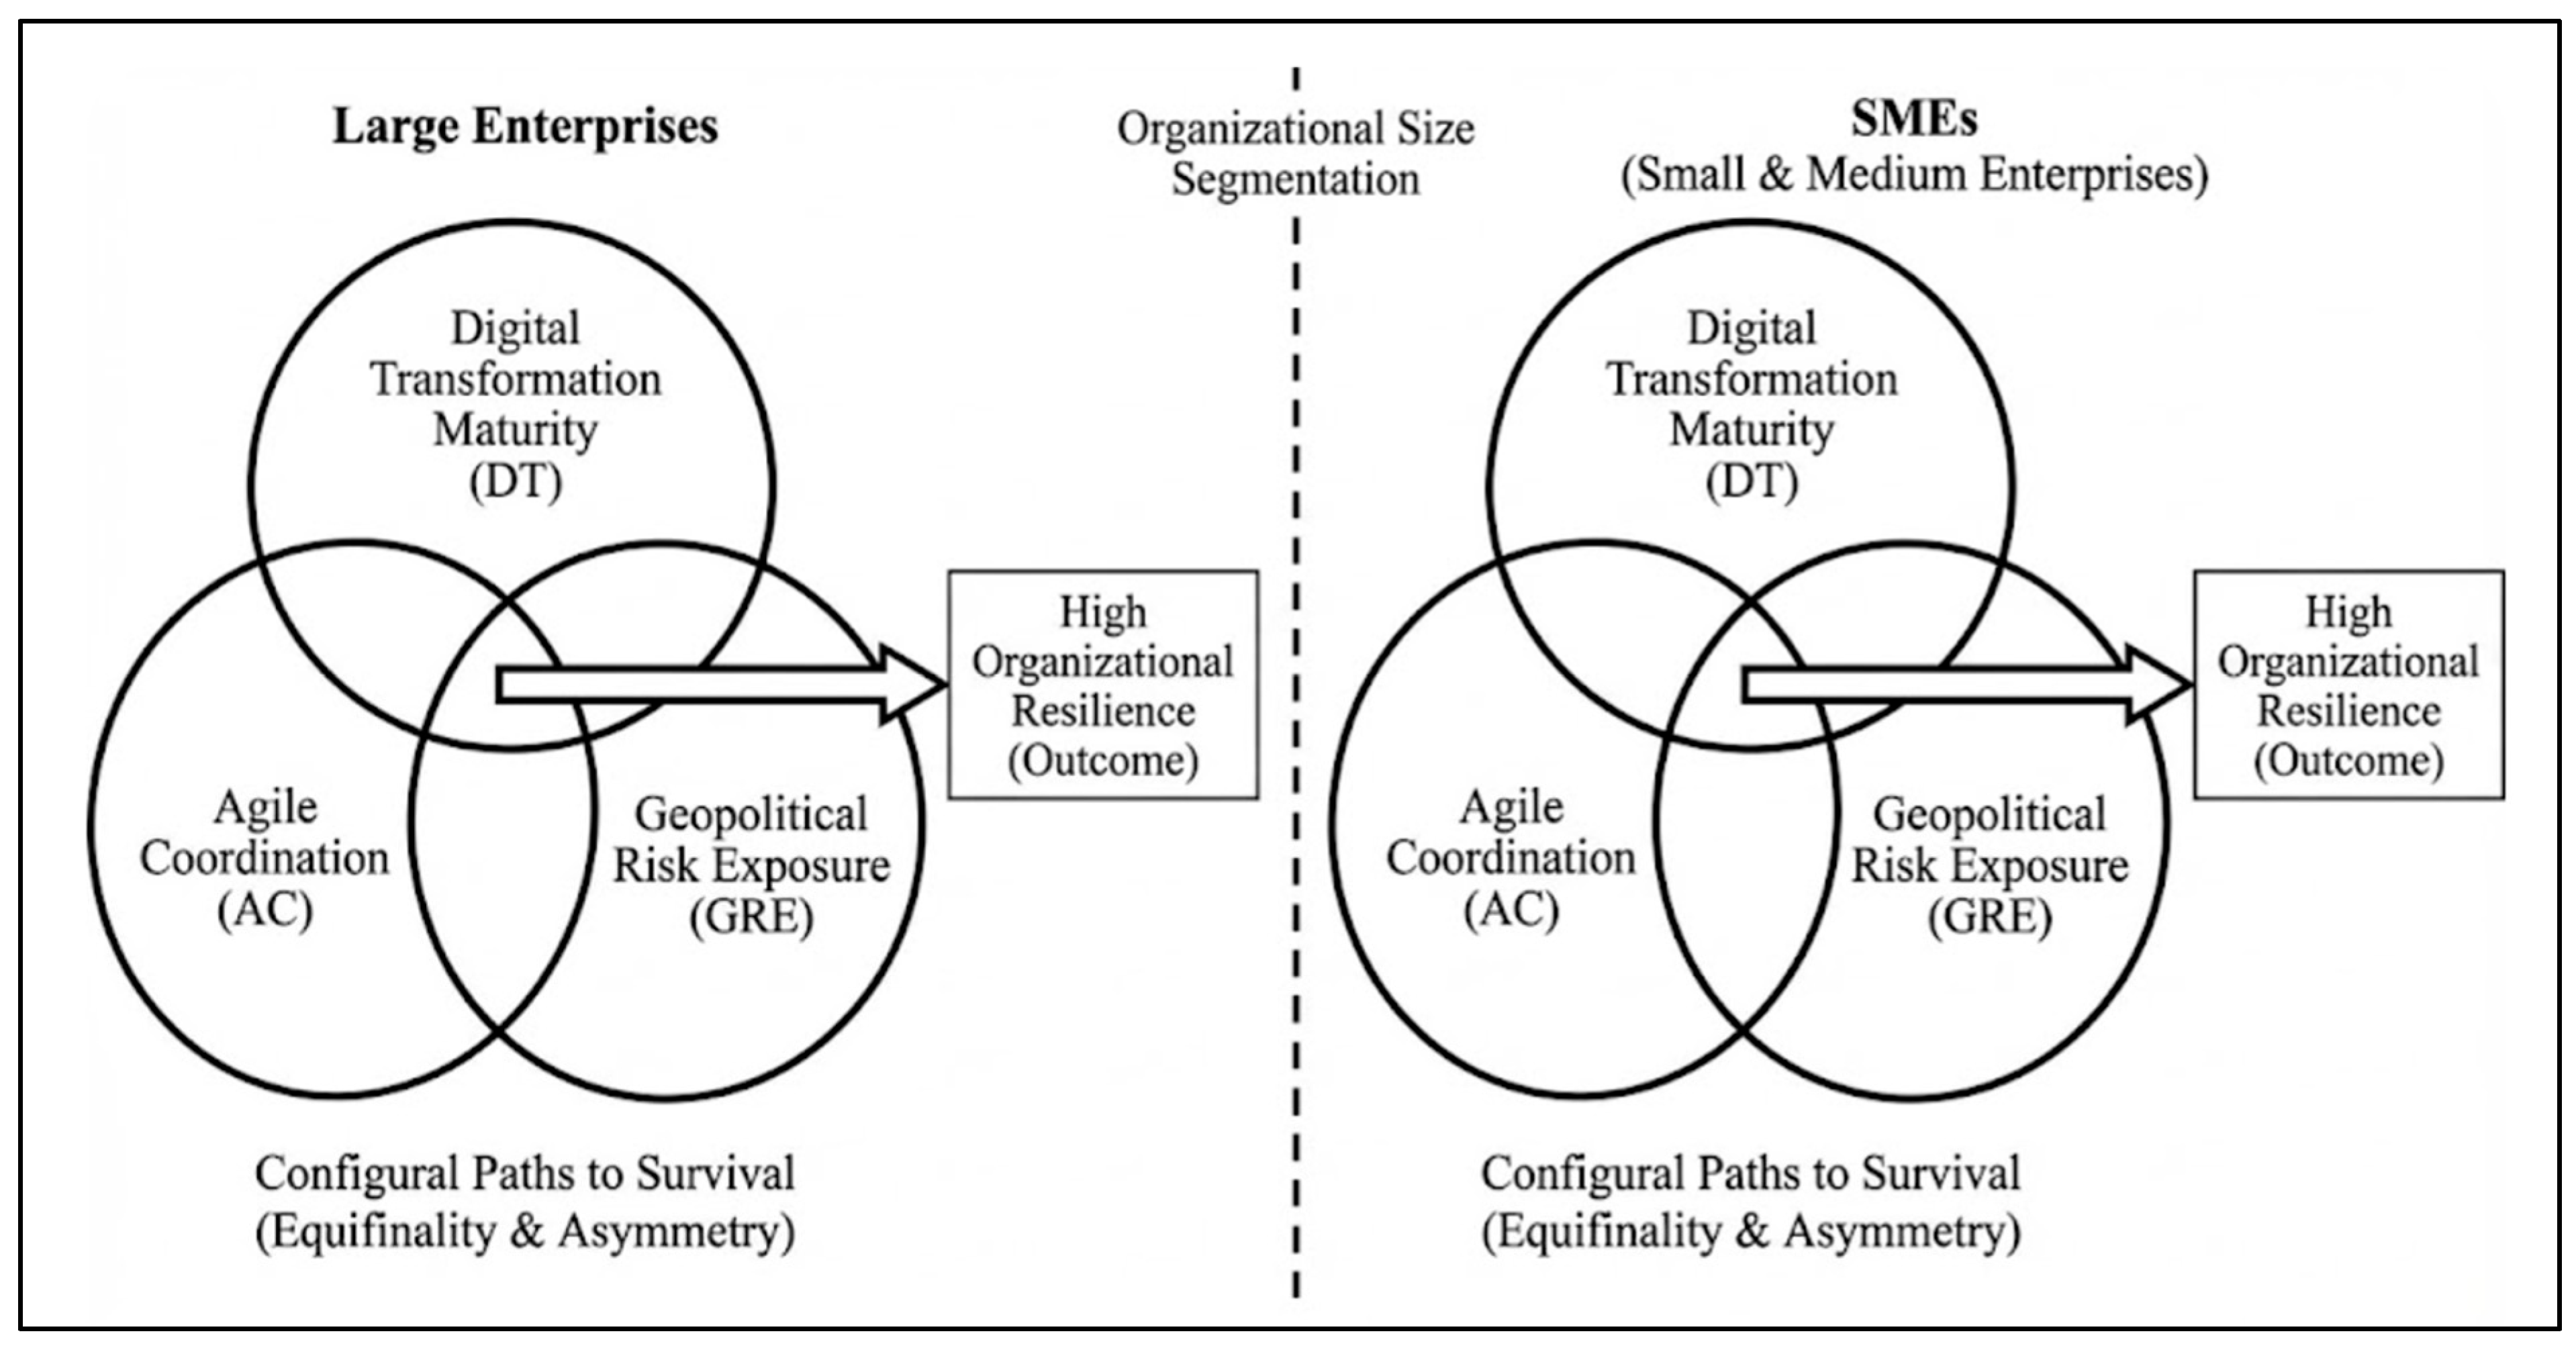
Our framework visualizes resilience not as a dependent variable at the end of a linear path, but as a subset of the intersection of three key conditions: Digital Transformation Maturity (DT), Agile Coordination (AC), and Geopolitical Risk Exposure (GRE) (Figure 1). Crucially, we segment the analysis by Organizational Size to detect group-specific patterns.
Figure 1.
The Configural Conceptual Framework: A Set-Theoretic View of Resilience. Note: Figure 1 illustrates that resilience emerges from the intersection of sets, and this intersection logic is applied separately to Large Enterprises and SMEs.
3.3. Sample and Data Collection
The empirical data is drawn from a stratified survey of manufacturing firms in Taiwan. Taiwan represents an “extreme case” [19] for studying geopolitical resilience due to its integral role in global semiconductor supply chains and high exposure to trade dynamics. The sampling frame was derived from the Taiwan Economic Journal (TEJ) database. Data collection occurred between February 2025 and August 2025. We distributed a total of 2500 questionnaires and achieved an effective sample of 928 unique firms, yielding a valid response rate of 37.1%. Firm size was classified based on the Ministry of Economic Affairs (Taiwan) criteria, where SMEs are defined as having paid-in capital under NT$80 million or fewer than 200 employees. The sample spans key industries including electronics, machinery, and textiles.
The survey was administered to senior executives (e.g., supply chain directors, CEOs) who possess comprehensive knowledge of their firm’s operations and strategic responses to geopolitical shocks. Unlike middle managers who often focus on localized operational tasks, senior executives are uniquely positioned at the nexus of external environmental scanning and internal resource allocation, making them the most qualified informants for assessing macro-level geopolitical risks. While relying on a single senior executive per firm introduces potential single-informant limitations, CEO-level respondents are considered highly reliable proxies for firm-level strategic posture, particularly in SME contexts where decision-making is heavily centralized. To assess non-response bias, we employed Armstrong and Overton’s (1977) procedure [20], comparing early and late respondents. Independent t-tests on firm size and age showed no significant differences (p > 0.05), indicating minimal non-response bias.
3.4. Measures and Calibration
All focal constructs were measured using 7-point subjective, self-reported scales adapted from the established literature. The full survey instrument is provided in Appendix A. Constructs were adapted from established scales: Digital Transformation Maturity [4], Agile Coordination [9], Geopolitical Risk Exposure (GRE), and Organizational Resilience [21]. For Geopolitical Risk Exposure (GRE), we operationalized this measure based on perceived trade dependency. It is important to clarify that our GRE construct measures the perceived risk exposure of the firm. Consistent with Upper Echelons Theory and behavioral strategy perspectives [22], organizational responses—such as reconfiguring supply chains or investing in agility—are primarily driven by how top management teams perceive and interpret environmental threats, rather than objective macroeconomic indices alone. High perceived dependency in the contested US–China corridor serves as a highly sensitive proxy for regulatory and political uncertainty in the Taiwanese context. To evaluate construct validity and reliability, we calculated Cronbach’s alpha, Composite Reliability (CR), and Average Variance Extracted (AVE). As detailed in Table 1, all factor loadings > 0.70, Cronbach’s α > 0.80, CR > 0.85, and AVE > 0.60, confirming robust internal consistency and convergent validity. Furthermore, to check for Common Method Variance (CMB), Harman’s single-factor test was conducted. The first factor accounted for only 28.4% of the variance (<50%), indicating that CMB is not a pervasive issue in this study [23].
Table 1.
Psychometric Properties and Construct Validity.
Following the direct method recommended by Ragin [7], raw data from Likert scales were calibrated into fuzzy-set membership scores ranging from 0.0 to 1.0. We specified three qualitative anchors: full membership (0.95) anchored at the 95th percentile, a crossover point (0.50) anchored at the median, and full non-membership (0.05) anchored at the 5th percentile. Rather than merely reflecting the empirical distribution of the sample, these thresholds carry substantive qualitative meaning. The 95th percentile (full membership) represents firms demonstrating unambiguous, best-in-class integration of the respective conditions. The 50th percentile (crossover point) reflects the point of maximum ambiguity—where a firm’s condition is ‘neither definitively present nor absent.’ The 5th percentile designates a clear absence. This rigorous calibration ensures that the subsequent analysis reflects substantive theoretical meaning rather than statistical artifacts.
4. Empirical Results
4.1. Data Calibration
Consistent with best practices in set-theoretic methods [7], we calibrated the raw Likert-scale data into fuzzy-set membership scores ranging from 0.0 (full non-membership) to 1.0 (full membership). We applied the direct method of calibration using three qualitative anchors: the 95th percentile for full inclusion, the 50th percentile for the crossover point, and the 5th percentile for full exclusion. Table 2 presents the calibration thresholds and descriptive statistics.
Table 2.
Calibration Anchors and Descriptive Statistics.
4.2. Analysis of Necessary Conditions
We first analyzed whether any single condition is necessary for the outcome of high Organizational Resilience. A condition is considered necessary if its consistency score exceeds the threshold of 0.90 [24].
As shown in Table 3, the results reveal a striking asymmetry between firm types. For Large Enterprises, Digital Transformation Maturity emerges as a necessary condition (Consistency = 0.92), indicating that high digital capability is a prerequisite. Conversely, for SMEs, digital maturity is NOT necessary (Consistency = 0.65); instead, Agile Coordination emerges as the critical requisite (Consistency = 0.94). This fundamentally challenges the universal applicability of digital mandates. To ensure robustness, we also checked for trivial necessity (Relevance of Necessity, RoN). For Large Enterprises, the RoN for Digital Transformation Maturity is satisfactory, confirming it is not a trivial necessary condition despite its borderline consistency (0.92) and moderate coverage (0.78).
Table 3.
Analysis of Necessary Conditions for High Organizational Resilience.
4.3. Analysis of Sufficient Configurations
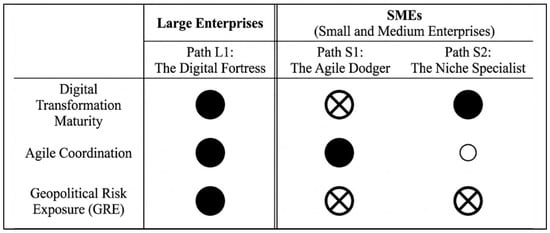
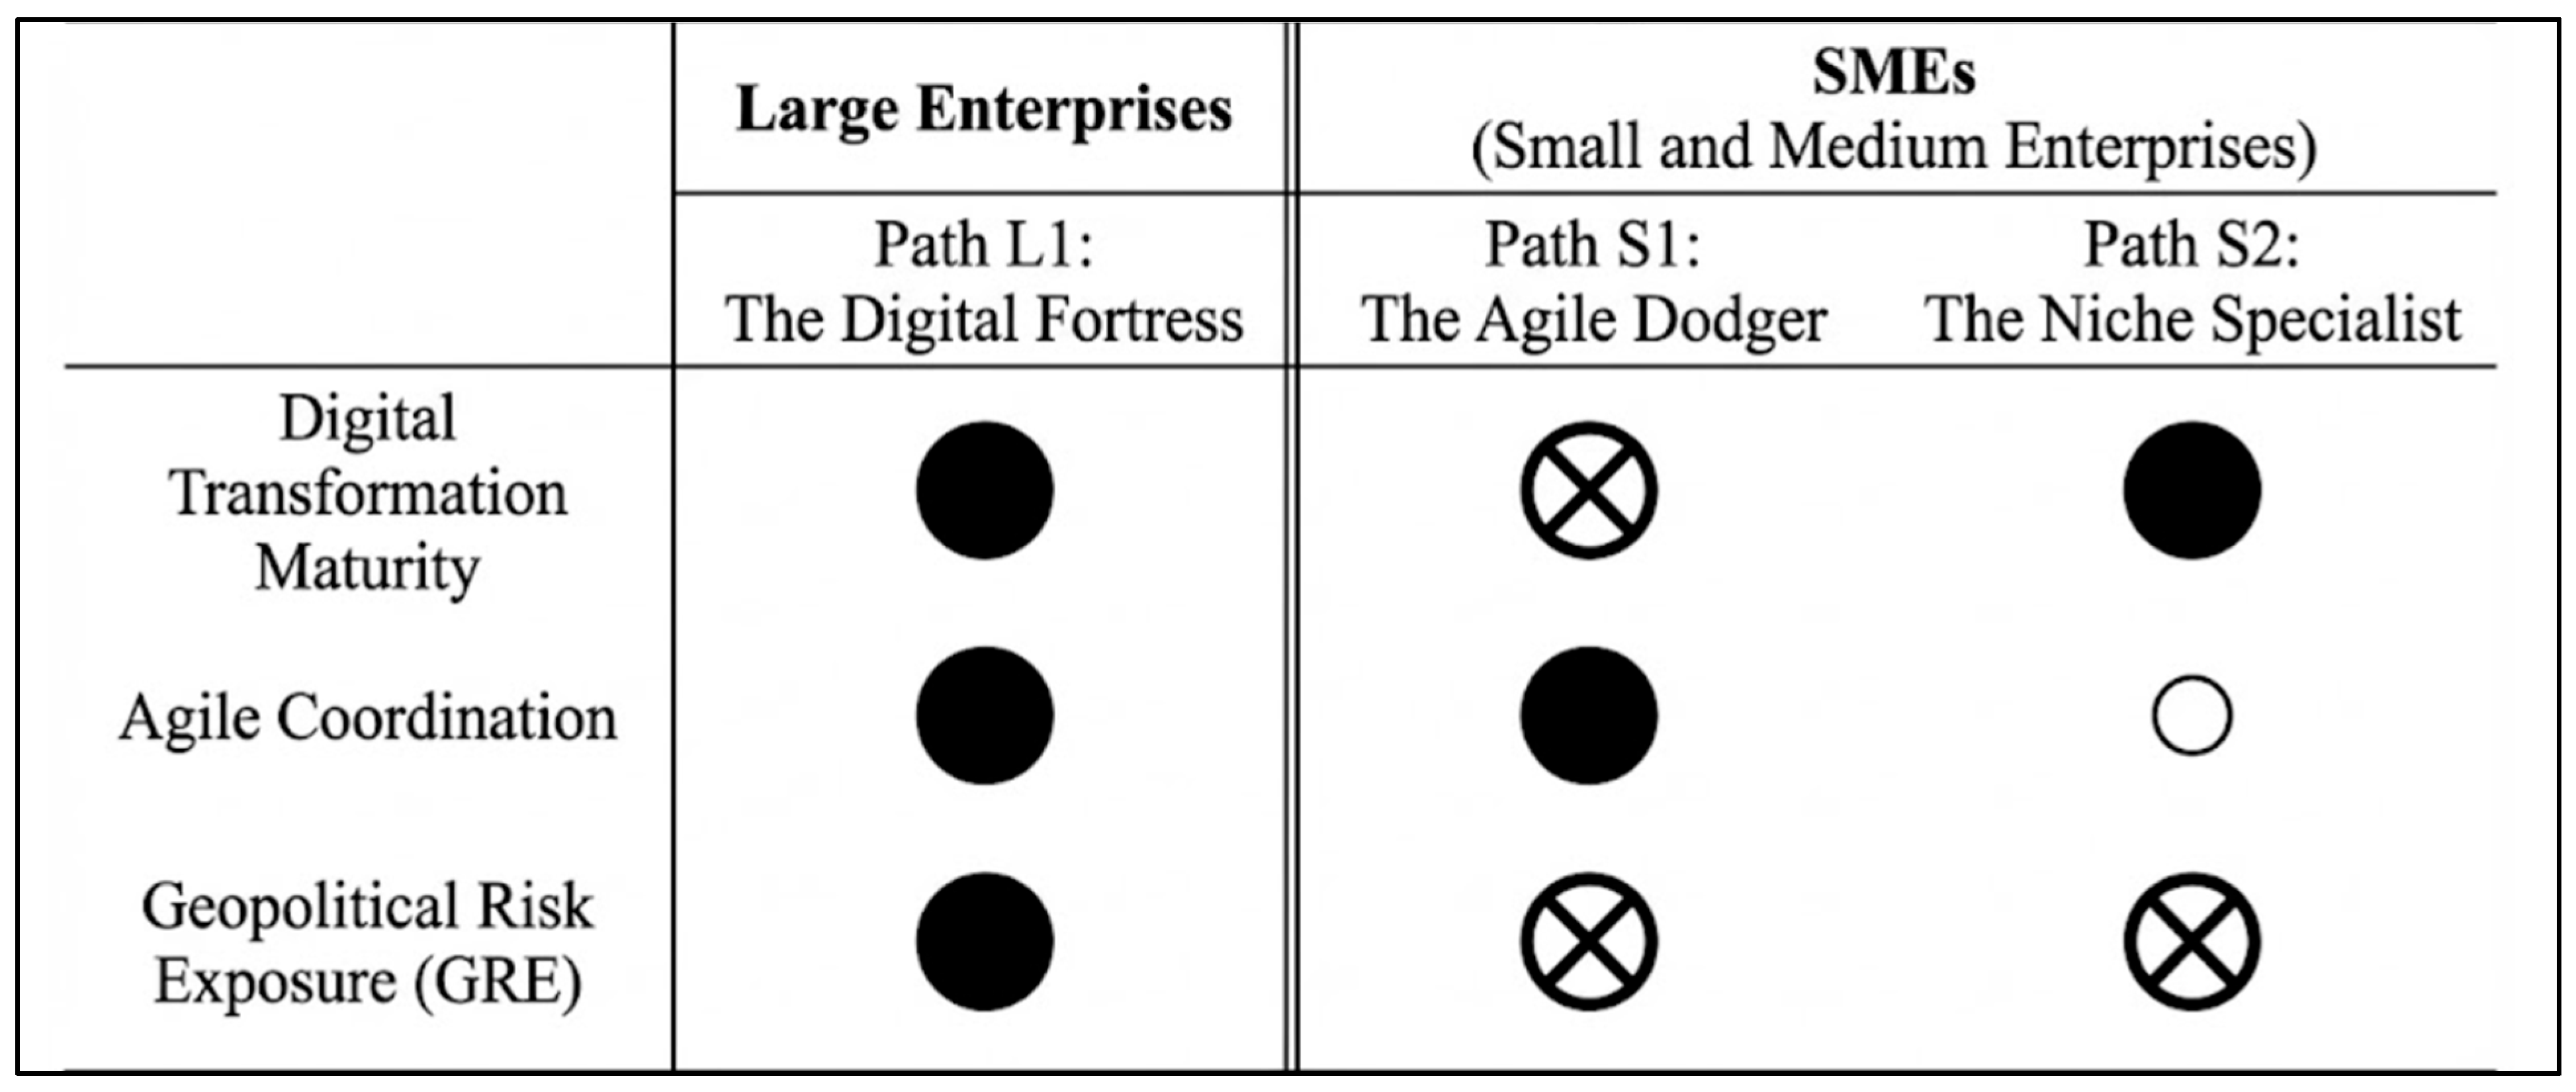
We utilized the truth table algorithm to identify the causal “recipes” sufficient for the outcome. Following standard fsQCA reporting guidelines, the analysis was conducted using fsQCA 3.0 software (Ragin & Davey, Irvine, CA, USA). The full truth tables—including the number of cases, raw consistency, and Proportional Reduction in Inconsistency (PRI) scores—are provided in Appendix B (Table A1). We utilized a frequency threshold of 2 and a raw consistency threshold of 0.80. To derive the intermediate solution, we specified directional expectations based on our theoretical framework. Specifically, we expected the presence of DT and AC to contribute to high resilience (directional expectation: present), whereas GRE was generally expected to negatively impact resilience. By logically comparing the parsimonious and intermediate solutions, we distinguished between core conditions (those appearing in both solutions) and peripheral conditions (those appearing only in the intermediate solution). Figure 2 visualizes the configuration map, and Table 4 details the solution paths.
Figure 2.
Asymmetric Configurational Paths to High Organizational Resilience (Visual Configuration Map). Note: Notation based on Fiss (2011) [13]. ● = Core condition present; ⊗ = Core condition absent; ⚪ = Peripheral condition present; Blank space indicates “don’t care” condition.
Table 4.
Sufficient Configurations for Large Enterprises and SMEs.
Interpretation of Findings: Large Enterprises: The “Digital Fortress” (Path L1). For large firms, the dominant path (L1) requires the simultaneous presence of High DT, High Agile Coordination, and persists even under High GRE. This confirms a “resource-driven” resilience model where scale and technology buffer against external shocks.
SMEs: Divergent Paths to Survival. For SMEs, distinct paths emerge, confirming equifinality:
- Path S1 (“The Agile Dodger”): This path combines High Agile Coordination with the Absence of High DT and the Absence of High GRE. This suggests that SMEs can achieve high resilience without high-tech investments, provided they possess superior operational agility and strategically avoid high-risk zones.
- Path S2 (“The Niche Specialist”): This path involves High DT but is effective only when the GRE is Low. This suggests that for SMEs, digital tools are most effective as efficiency engines in stable markets, rather than as shields in turbulent ones.
4.4. Sufficiency Analysis for the Absence of Resilience (~RES)
To empirically substantiate the core claim of causal asymmetry, we conducted a sufficiency analysis for the negation of the outcome (i.e., low organizational resilience, ~RES). As presented in Appendix C (Table A2), the configurations leading to failure (~RES) are distinct from the high-resilience pathways. For instance, SMEs facing high geopolitical risk fall into low resilience when they lack agile coordination (AC = ⊗), regardless of their digital maturity. This confirms that the pathway to failure is not merely the mirror opposite of the pathway to success, reinforcing the value of the configurational approach.
4.5. Robustness Checks
To ensure the external validity and stability of our configurational findings, we conducted standard robustness checks recommended for fsQCA. Specifically, we modified the calibration thresholds by adjusting the crossover point slightly (e.g., from the 50th percentile to the 55th percentile) and increased the raw consistency threshold from 0.80 to 0.85. Under these alternative specifications, the resulting configurations remained substantively identical in their core conditions, and the changes in solution coverage and consistency were marginal. This confirms that our theoretical models are robust to methodological parameter variations.
5. Discussion
5.1. The Topology of Resilience: Equifinality and Asymmetry
This study set out to challenge the linear “net-effects” assumption dominant in the supply chain literature. Our fsQCA results empirically validate Proposition 1, demonstrating equifinality: there is no single “golden rule” for resilience [13]. Instead, multiple distinct causal recipes exist. Furthermore, we confirm Proposition 2 (Causal Asymmetry), revealing that the survival strategies for Large Enterprises and SMEs are structurally distinct [6].
5.2. Large Enterprises: The “Digital Fortress” Strategy
For large enterprises, the path to resilience is “all-encompassing.” The necessity of Digital Transformation Maturity (Table 3) aligns with the Resource Orchestration View for resource-rich firms [16]. Large firms effectively use their deep pockets to build a “Digital Shield.” They do not simply avoid risk; they use superior digital sensing and operational seizing capabilities to “absorb” the geopolitical shock. For these players, digital transformation acts as a core condition for achieving high resilience in high-risk zones.
5.3. SMEs: The “Substitution Effect”
The most novel contribution of this study lies in the SME findings. The literature often treats digital transformation as a universal imperative. However, our results reveal a “Strategic Substitution Effect”:
- Agility over Tech: Path S1 (“The Agile Dodger”) demonstrates that for resource-constrained firms, human-centric agility can substitute techno-centric maturity. SMEs survive not by building thicker shields, but by moving faster than the threat. To illustrate this pathway, consider the real-world response of typical Taiwanese SMEs in the bicycle component or machinery sectors during recent tariff escalations. Rather than engaging in heavy, capital-intensive digital integration, these SMEs leveraged their inherent operational agility. By relying on rapid cross-functional communication and flexible human-centric routines, they swiftly relocated specific assembly lines to Southeast Asia (executing a rapid “China + 1” strategy) and diversified their supplier base, thereby dodging geopolitical exposure without the need for a “Digital Fortress.”
- Fair-Weather Technology: Path S2 (“The Niche Specialist”) offers a critical nuance. It suggests that when SMEs do invest in digital transformation, it does not confer the same “shielding” effect against geopolitical risk that it does for large firms. Instead, SME digitalization thrives primarily in low-risk environments. This warns against the “blind adoption” of Industry 4.0 tools as a universal solution for trade wars.
5.4. The Topology of Vulnerability: Unpacking the Failure Pathways (~RES)
To fully capture causal asymmetry, it is crucial to understand not just how firms survive, but why they fail. Our analysis of the negation of the outcome (~RES) reveals that the pathways to vulnerability are structurally distinct from the pathways to resilience. For instance, the SME failure model (Appendix C, Table A2) demonstrates a highly consistent path (Consistency = 0.87; Coverage = 0.44), where, under high geopolitical risk (GRE = ●), the mere absence of agile coordination (AC = ⊗) is sufficient to cause low resilience, regardless of their digital transformation maturity. This sharply contrasts with the successful “Agile Dodger” path (S1: Consistency = 0.86), where high agility neutralizes the risk. From a theoretical standpoint, this highlights the critical concept of capability mismatch or resource rigidity. For resource-constrained SMEs, investing in digital tools without the underlying operational agility creates a “hollow fortress”—the firm possesses data visibility, but lacks the organizational flexibility to execute physical supply chain relocations when geopolitical shocks hit. This asymmetric finding robustly confirms that while agility is the core engine for SME survival, lacking it is a fatal vulnerability that technology cannot mask.
6. Conclusions
6.1. Theoretical Contributions
This research contributes to the Systems Theory and Crisis Management literature by mapping the “configurational topology” of organizational resilience.
- Dismantling the “One-Size-Fits-All” Myth: We empirically demonstrate that the causal mechanisms of resilience are asymmetric. The resource-intensive “Digital Fortress” model, valid for large firms, is neither feasible nor necessary for the agile “species” of the SME ecosystem.
- Redefining the Role of Digitalization: By applying fsQCA, we show that digital maturity is not just a necessary condition for large firms but also a substitutable condition for SMEs. This advances the Dynamic Capabilities framework by adding a boundary condition based on organizational size and risk exposure.
6.2. Managerial Implications
For Managers of Large Enterprises:
- Invest in Integration: Within the specific context of high geopolitical risk, our findings suggest that resilience is closely associated with the synergy between digital tools and operational teams. Possessing data (Digital Maturity) without the ability to act on it (Agile Coordination) may be insufficient.
- Maintain Strategic Scale: In high-risk zones, large firms are advised to leverage their digital scale to absorb external shocks rather than retreating.
For Managers of SMEs:
- Strategic Differentiation: We recommend avoiding the blind mimicry of large competitors. Heavy investments in “Industry 4.0” standards may not yield proportionate resilience if foundational agility is lacking.
- Prioritize Agility: Under resource constraints, investing in Agile Coordination (cross-functional teams, rapid decision protocols) represents a highly effective, context-specific pathway to resilience.
- Strategic Decoupling: Given the inability to absorb high Geopolitical Risk Exposure (GRE), a viable alternative for SMEs is risk avoidance—such as utilizing a “China + N” strategy to physically relocate away from geopolitical crosshairs.
6.3. Limitations and Future Research
This study focuses on the manufacturing sector in Taiwan. While this context is a prime “natural laboratory” for geopolitical tension, future research should test these configurations in other regions to assess generalizability. Furthermore, our study has several limitations that provide fruitful avenues for future research. First, our binary classification of firms into SMEs and large enterprises may obscure finer-grained heterogeneity. Future research should explore configuration differences among micro-, small-, and medium-sized enterprises. Second, we rely on cross-sectional survey data. Given that resilience and the effects of digital transformation are dynamic, evolving phenomena, future studies are strongly encouraged to employ longitudinal QCA (LQCA) or trajectory analysis to capture how these configurations shift over time. Finally, our measurement of GRE relies on managers’ subjective perceptions. Subjective perceptions are highly responsive to immediate political rhetoric and media signals, directly triggering strategic pivots. In contrast, objective indicators (e.g., actual shifts in trade volume) are often indicators of lagging. Future scholars could enrich this model by incorporating objective geopolitical indices to contrast the effects of immediate perceived threats versus delayed structural impacts.
Funding
This research received no external funding.
Institutional Review Board Statement
Not applicable.
Informed Consent Statement
Not applicable.
Data Availability Statement
The data presented in this study are available on request from the corresponding author. The data are not publicly available due to privacy and ethical restrictions.
Conflicts of Interest
The author declares no conflict of interest.
Appendix A. Survey Instrument and Measurement Scales
All subjective constructs were measured using a 7-point Likert scale ranging from 1 (“strongly disagree”) to 7 (“strongly agree”). The measures were adapted from the established literature to fit the context of supply chain geopolitical disruptions.
Digital Transformation Maturity (DT) (Adapted from [4]):
- DT1: Our firm extensively utilizes digital platforms to share real-time information with supply chain partners.
- DT2: We possess high maturity in using predictive analytics to forecast potential supply chain bottlenecks.
- DT3: Our core operational processes are highly integrated through digital technologies (e.g., ERP, cloud systems).
- DT4: We continuously invest in digital technologies to enhance our supply chain visibility.
Agile Coordination (AC) (Adapted from [5,16]):
- AC1: Our firm can rapidly reconfigure internal resources to adapt to sudden geopolitical or trade policy changes.
- AC2: We can swiftly switch to alternative suppliers or logistics routes when disruptions occur.
- AC3: Our cross-functional teams exhibit high agility in coordinating responses to supply chain shocks.
- AC4: We can seamlessly synchronize our production schedules with new partners in neutral regions.
Organizational Resilience (RES) (Adapted from [3,21]):
- RES1: Our firm was able to maintain operational continuity during recent geopolitical/tariff shocks.
- RES2: We successfully anticipated and prepared for potential trade disruptions before they severely impacted us.
- RES3: Our organization quickly recovered to normal performance levels following supply chain interruptions.
- RES4: Overall, our firm demonstrated robust structural viability during recent global trade turbulence.
Geopolitical Risk Exposure (GRE) (Author-developed based on trade dependency):
- GRE1: A significant portion of our revenue or critical component supply is heavily dependent on high-risk/contested regions (e.g., the US–China trade corridor).
- GRE2: Our supply chain operations are highly sensitive to sudden tariff hikes or export controls.
- GRE3: We perceive a high level of regulatory and political uncertainty affecting our current global supply network.
Appendix B. fsQCA Truth Tables for High Organizational Resilience (RES)
In accordance with fsQCA best practices, the truth table was constructed using a frequency threshold of 2 and a Proportional Reduction in Inconsistency (PRI) threshold. The table below details the logically possible configurations for both SMEs and Large Enterprises.
Table A1.
fsQCA Truth Tables for Organizational Resilience (SMEs and Large Enterprises).
Appendix C. Sufficiency Analysis for the Absence of Resilience (~RES)
To demonstrate causal asymmetry, we conducted a sufficiency analysis for the negation of the outcome (i.e., low organizational resilience, denoted as ~RES). The intermediate solutions are presented below, confirming that the pathways leading to failure (~RES) are distinct and not simply the mirror opposites of the pathways leading to high resilience.
Table A2.
Configurational Paths to Low Organizational Resilience (~RES).
References
- Ivanov, D.; Dolgui, A. Viability of intertwined supply networks: Extending the supply chain resilience angles towards survivability. A position paper motivated by COVID-19 outbreak. Int. J. Prod. Res. 2020, 58, 2904–2915. [Google Scholar] [CrossRef] [Scilit]
- Tang, C.S.; Veelenturf, L.P. The strategic role of logistics in the Industry 4.0 era. Transp. Res. Part E Logist. Transp. Rev. 2019, 129, 1–11. [Google Scholar] [CrossRef] [Scilit]
- Linnenluecke, M.K. Resilience in business and management research: A review of influential publications and a research agenda. Int. J. Manag. Rev. 2017, 19, 4–30. [Google Scholar] [CrossRef] [Scilit]
- Vial, G. Understanding digital transformation: A review and a research agenda. J. Strateg. Inf. Syst. 2019, 28, 118–144. [Google Scholar] [CrossRef] [Scilit]
- Wieland, A.; Durach, C.F. Two perspectives on supply chain resilience. J. Bus. Logist. 2021, 42, 315–322. [Google Scholar] [CrossRef] [Scilit]
- Woodside, A.G. Moving beyond multiple regression analysis to algorithms: Calling for adoption of a paradigm shift from symmetric to asymmetric thinking. J. Bus. Res. 2013, 66, 463–472. [Google Scholar] [CrossRef] [Scilit]
- Ragin, C.C. Redesigning Social Inquiry: Fuzzy Sets and Beyond; University of Chicago Press: Chicago, IL, USA, 2008. [Google Scholar]
- Sirmon, D.G.; Hitt, M.A.; Ireland, R.D.; Gilbert, B.A. Resource orchestration to create competitive advantage: Breadth, depth, and life cycle effects. J. Manag. 2011, 37, 1390–1412. [Google Scholar] [CrossRef] [Scilit]
- Zhang, J.; Long, J.; von Schaewen, A.M.E. How does digital transformation improve organizational resilience? Findings from PLS-SEM and fsQCA. Sustainability 2021, 13, 11487. [Google Scholar] [CrossRef] [Scilit]
- Choi, T.Y.; Dooley, K.J.; Rungtusanatham, M. Supply networks and complex adaptive systems: Control versus emergence. J. Oper. Manag. 2001, 19, 351–366. [Google Scholar] [CrossRef] [Scilit]
- Pathak, S.D.; Day, J.M.; Nair, A.; Sawaya, W.J.; Kristal, M.M. Complexity and adaptivity in supply networks: Building supply network theory using a complex adaptive systems perspective. Decis. Sci. 2007, 38, 547–580. [Google Scholar] [CrossRef] [Scilit]
- Son, B.-G.; Kim, H.; Hur, D.; Subramanian, N. The dark side of supply chain digitalisation: Supplier-perceived digital capability asymmetry, buyer opportunism and governance. Int. J. Oper. Prod. Manag. 2021, 41, 1220–1247. [Google Scholar] [CrossRef] [Scilit]
- Fiss, P.C. Building better causal theories: A fuzzy set approach to typologies in organization research. Acad. Manag. J. 2011, 54, 393–420. [Google Scholar] [CrossRef] [Scilit]
- Zhuo, R.; Gong, J.; Zhao, H. Supply chain collaboration, supply chain disruption and supply chain resilience: A fuzzy-set QCA approach. Nankai Bus. Rev. Int. 2025, 16, 579–597. [Google Scholar] [CrossRef] [Scilit]
- Mandal, S.; Kar, A.K.; Gupta, S.; Sivarajah, U. Achieving food supply chain resilience during natural disasters through Industry 5.0 enablers: Empirical insights based on an fsQCA approach. Inf. Syst. Front. 2024, 26, 441–460. [Google Scholar] [CrossRef] [Scilit]
- Ketchen, D.J.; Hult, G.T.M. Bridging organization theory and supply chain management: The case of best value supply chains. J. Oper. Manag. 2007, 25, 573–580. [Google Scholar] [CrossRef] [Scilit]
- Teece, D.J. Explicating dynamic capabilities: The nature and microfoundations of (sustainable) enterprise performance. Strateg. Manag. J. 2007, 28, 1319–1350. [Google Scholar] [CrossRef] [Scilit]
- Misangyi, V.F.; Greckhamer, T.; Furnari, S.; Fiss, P.C.; Crilly, D.; Aguilera, R. Embracing causal complexity: The emergence of a neo-configurational perspective. J. Manag. 2017, 43, 255–282. [Google Scholar] [CrossRef] [Scilit]
- Yin, R.K. Case Study Research and Applications: Design and Methods, 6th ed.; Sage Publications: Thousand Oaks, CA, USA, 2018. [Google Scholar]
- Armstrong, J.S.; Overton, T.S. Estimating nonresponse bias in mail surveys. J. Mark. Res. 1977, 14, 396–402. [Google Scholar] [CrossRef] [Scilit]
- Williams, T.A.; Gruber, D.A.; Sutcliffe, K.M.; Shepherd, D.A.; Zhao, E.Y. Organizational response to adversity: Fusing crisis management and resilience research streams. Acad. Manag. Ann. 2017, 11, 733–769. [Google Scholar] [CrossRef] [Scilit]
- Hambrick, D.C.; Mason, P.A. Upper echelons: The organization as a reflection of its top managers. Acad. Manag. Rev. 1984, 9, 193–206. [Google Scholar] [CrossRef] [Scilit]
- Podsakoff, P.M.; MacKenzie, S.B.; Lee, J.Y.; Podsakoff, N.P. Common method biases in behavioral research: A critical review of the literature and recommended remedies. J. Appl. Psychol. 2003, 88, 879–903. [Google Scholar] [CrossRef] [Scilit] [PubMed]
- Schneider, C.Q.; Wagemann, C. Set-Theoretic Methods for the Social Sciences; Cambridge University Press: Cambridge, UK, 2012. [Google Scholar]

Disclaimer/Publisher’s Note: The statements, opinions and data contained in all publications are solely those of the individual author(s) and contributor(s) and not of MDPI and/or the editor(s). MDPI and/or the editor(s) disclaim responsibility for any injury to people or property resulting from any ideas, methods, instructions or products referred to in the content. |
© 2026 by the author. Licensee MDPI, Basel, Switzerland. This article is an open access article distributed under the terms and conditions of the Creative Commons Attribution (CC BY) license.