


Abstract
This study investigates the dynamic patterns of global financial risk transmission across 11 major economies and four key asset classes (stocks, bonds, foreign exchange, and gold) using daily data spanning 2012 to 2025. To capture the non-linearities of extreme market stress, we construct a multilayer directed network based on least absolute shrinkage and selection operator (LASSO) penalized quantile regression at the 5% lower tail. We estimate tail risk spillovers using a one-year rolling window approach and identify systemically important nodes via an extended PageRank algorithm applied to the resulting adjacency tensors. Empirical results suggest that the rankings of systemically important countries undergo significant re-orderings during crisis periods. We find robust statistical evidence that the Herfindahl–Hirschman Index (HHI) of risk concentration provides forward-looking information regarding structural polarization and systemic fragility. These observed associations remain consistent across alternative quantile thresholds, varying lag lengths, and alternative rolling window specifications. Our results provide granular insights for policymakers monitoring cross-asset contagion and provides a framework for institutional investors to assess potential tail-risk hedging strategies within an increasingly interconnected multilayer architecture.
1. Introduction
In today’s highly integrated global financial architecture, shocks originating in a single economy or asset class are frequently amplified through cross-market linkages. These shocks propagate rapidly as downstream tail risk spillovers, complicating macroprudential oversight and crisis early-warning frameworks [1,2]. During distress periods, market correlations typically exhibit significant spikes, with risk transmission characterized by marked non-linearity and asymmetry. Consequently, identifying directional spillovers across diverse asset classes remains a pivotal challenge. Specifically, determining whether these linkages undergo structural “regime jumps” under crisis-induced shocks is essential for robust systemic risk modeling and policy design.
Standard spillover measures, such as the Diebold–Yilmaz framework, rely on forecast error variance decomposition to capture average interdependencies at the second-moment level [3]. However, these second-moment methods often understate downside tail dependence and asymmetric transmission. They also fail to fully capture the propagation of extreme losses, which are critical during financial distress. Conversely, while systemic risk metrics such as CoVaR, Adrian and Brunnermeier [4] prioritize extreme tail events, they often lack a framework for identifying high-dimensional, cross-market network structures. This limitation makes it difficult to uncover directional mechanisms, specifically regarding the origins of risk and the channels through which it diffuses.
To bridge this gap, we adopt a quantile-based perspective that integrates regularized quantile regression within a high-dimensional system. This framework performs tail-sensitive spillover estimation and sparse edge selection simultaneously, effectively filtering out noise to reveal the most impactful risk connections [5].
Existing research extensively employs single-layer spillover networks to characterize risk linkages within a single asset class. However, this framework often ignores coupling mechanisms across asset classes, thereby missing the pivotal role of cross-market connectivity in triggering cascading effects. In contrast, multilayer networks provide a unified representation of these interactions. Distinct asset classes constitute the layers of the network, where intralayer edges capture cross-border spillovers and interlayer edges represent risk coupling channels within the same country [6,7,8,9]. Because risk typically amplifies through these cross-layer connections during crisis shocks, a single-layer framework may systematically underestimate network vulnerability and the systemic importance of key nodes.
This paper defines systemic importance as a node’s capacity to propagate and amplify tail risk through network linkages under extreme downside scenarios. Empirically, we rank country nodes using multilayer edge weights and cross-layer consistent centrality measures, specifically PageRank versatility and its decomposed in-strength and out-strength. This framework identifies primary risk sources while characterizing transmission hubs that act as critical intermediaries within the multilayer architecture. Ultimately, this structural approach supports the early identification of systemic risk and the formulation of macroprudential interventions [10,11].
Risk connectivity exhibits significant time-variation and may undergo structural reorganization during crisis shocks. Since Static network frameworks tend to average out pre-crisis risk accumulation, they may underestimate the systemic roles of specific nodes during the incipient stages of risk diffusion. Incorporating time-varying dynamics ensures a more robust estimation of systemic contributions as risk begins to propagate. We, therefore, employ a rolling-window approach to track network evolution. This method captures structural shifts in connectivity during crisis periods, enhancing the precision of the analysis [12].
Existing literature remains constrained by three primary gaps: a predominant focus on single-layer networks that overlook cross-market coupling; technical difficulties in identifying sparse connections within high-dimensional financial systems; and a lack of forward-looking indicators to monitor systemic risk concentration. To address these limitations, the primary novelty of this paper lies in integrating three methodological dimensions into a unified analytical framework: multilayer financial networks for cross-market contagion, least absolute shrinkage and selection operator (LASSO) penalized quantile regression for sparse tail spillover identification, and Herfindahl–Hirschman Index (HHI) based concentration measures for early-warning monitoring of systemic connectedness. Specifically, our contributions are fourfold:
First, we extend the traditional single-layer risk transmission analysis into a multilayer topological framework. Unlike previous studies that treat asset markets in isolation or via simple bipartite structures, we construct a four-layer network (equities, bonds, FX, and gold). This allows us to simultaneously characterize within-market contagion and the “interlayer coupling” that defines modern financial fragility, providing a more comprehensive map of global risk pathways.
Second, we introduce a high-dimensional identification strategy using LASSO-penalized quantile regression. To overcome the “curse of dimensionality” inherent in multilayer systems, we employ the LASSO regularization to identify sparse, non-linear tail dependencies. This methodological choice ensures that our network only retains the most significant transmission channels, effectively filtering out noise and providing a high-precision estimation of directional risk spillovers.
Third, we provide a granular characterization of the asymmetric risk roles across different asset layers. By quantifying nodal importance through PageRank Versatility, we identify persistent “Risk Exporters” (e.g., the U.S. and Eurozone) and “Risk Absorbers.” Our findings reveal how these roles shift during geopolitical and economic shocks, offering new empirical evidence on the heterogenous impact of localized crises on the global multilayer architecture.
Finally, we operationalize the HHI as a prospective early-warning indicator for network fragility. A key innovation is our demonstration of the HHI’s predictive power over network connectivity utilizing a lead–lag relationship. By establishing that rising concentration in systemic importance serves as a reliable lead indicator for subsequent structural collapse, we offer a concrete tool for macroprudential authorities to monitor polarization effects before systemic events manifest.
2. Literature Review
2.1. Global Financial Risk Transmission
Following successive financial crises, the transmission mechanisms of global economic shocks have gained significant scholarly attention. The literature underscores the importance for international portfolio investors to monitor cross-border tail risk connectivity. Kenourgios et al. [13] demonstrate that every financial crisis in their sample exhibits contagion effects flowing from the source country to all other economies. This study further illustrates that market correlations typically surge during periods of distress. Similarly, in an analysis of the 2008 Global Financial Crisis, Abduraimova [14] finds that countries with high contagion centrality may exhibit relatively low idiosyncratic tail risk. Despite this, such countries still exert a disproportionate impact on the broader network. Consequently, incorporating network topology becomes essential for accurately characterizing tail risk dynamics [15]. Following the influential framework of Forbes and Rigobon (2002) [16], we clarify that true contagion represents a significant increase in cross-market linkages after a shock, rather than a mere continuation of high historical correlations. This theoretical distinction provides the direct rationale for our use of quantile regression to identify shifts in tail-risk coefficients during crisis periods.
The tail properties of financial risk drive high levels of synchronicity and systemic fragility during extreme market conditions. One prominent modeling approach focuses on “co-exceedances,” which occur when multiple asset returns simultaneously fall below a predefined tail threshold. Beine et al. [17] utilize this framework to simulate tail risk dependencies while incorporating macroeconomic variables to capture shifting co-exceedance patterns. Despite their utility in characterizing linkage structures, these methods remain sensitive to threshold selection and primarily capture contemporaneous co-occurrences. As a result, they offer limited insight into directional mechanisms and the structural chains of risk transmission.
A primary limitation of the co-exceedance approach is its focus on the joint probability of tail events, which often fails to reveal the directionality of risk spillovers. To address this gap, subsequent studies introduced frameworks based on Granger causality to identify transmission channels across various markets. For instance, Hong et al. [18] develop a directional spillover structure by testing for Granger causality within conditional quantiles. Similarly, Iloskics et al. [19] derive a directed contagion network by estimating Granger-causal relationships between business cycles. By filtering out cyclical components, this method effectively captures the dynamic propagation of systemic shocks.
However, these methodologies typically rely on a two-step “estimate-then-network” strategy, where networks are constructed using a priori estimates of individual tail risk indicators. This decoupled approach struggles to simultaneously achieve tail-sensitive estimation and sparse edge identification within high-dimensional systems.
Building on these developments, quantile regression has emerged as a standard framework for tail risk modeling. This approach characterizes response relationships across the entire distribution, particularly at extreme quantiles such as 0.05 or 0.10 [20]. Unlike traditional Ordinary Least Squares (OLS), quantile regression captures the heterogeneous reactions of financial variables during tail events. Such sensitivity makes it more effective for analyzing complex risk spillover mechanisms.
To address overfitting and variable selection in high-dimensional settings, Belloni and Chernozhukov [5] embed the Least Absolute Shrinkage and Selection Operator (LASSO) within the quantile regression framework. This technique achieves sparse modeling without sacrificing tail sensitivity. Consequently, regularized quantile regression has gained prominence in constructing cross-country networks, offering both robust estimation and clear interpretability. Belloni and Chernozhukov [5] formally establish the validity of this approach for high-dimensional sparse models, providing a rigorous foundation for applications such as those by Hautsch et al. [21].
The LASSO quantile regression framework has also been successfully extended to international market networks. Nguyen and Lambe [22] utilize this method to construct complete directed networks of cross-country connectivity. Furthermore, G.-J. Wang et al. [9] quantify the linkages between global equity and foreign exchange markets. Their study demonstrates that measuring spillover effects across multiple asset classes yields a more comprehensive understanding of financial contagion than single-market analyses. Applying this framework to cross-country spillovers facilitates a robust quantification of aggregate tail connectivity within complex architectures. This capacity is critical in our multilayer setup, where regressors encompass both intralayer and interlayer sources. Consequently, high-dimensional sparse identification is the pivotal step for constructing a directed network that remains statistically tractable and economically interpretable.
2.2. Economic Mechanisms of Cross-Market Spillovers
A critical mechanism in cross-market risk transmission is the flight-to-safety phenomenon, which describes the sudden reallocation of capital from risky assets to safe-haven claims during periods of heightened uncertainty. In the context of a multilayer financial architecture, flight-to-safety serves as a primary driver of interlayer coupling, as it dictates the shifting correlations between equity, bond, and gold layers.
Traditional asset pricing models attribute flight-to-safety to exogenous macro-uncertainty. As noted by Barsky and Bekaert et al. [23,24], extreme market stress often triggers higher economic uncertainty, which simultaneously depresses equity prices through risk premium channels and lowers real interest rates through a precautionary savings channel. Ilmanen [25] further clarifies that the correlation between stocks and bonds is primarily driven by growth and inflation uncertainties: while growth uncertainty fosters a negative correlation (flight-to-safety behavior), inflation uncertainty may lead to a positive correlation due to the common interest rate factor.
More recent theoretical literature emphasizes the role of market frictions and liquidity dynamics in exacerbating flight-to-safety episodes. Vayanos [26] pioneered this perspective by demonstrating that fund managers, fearing redemptions during high-volatility periods, tend to shed illiquid and risky assets to meet potential liquidity needs. This endogenous increase in risk aversion effectively generates a “flight to liquidity” alongside a “flight to quality,” pushing up risk premiums across the system. This is complemented by the “liquidity spiral” framework of Brunnermeier and Pedersen [27], where deteriorating market liquidity forces speculators to provide liquidity only in safer, low-margin securities, thereby widening the liquidity differential between safe and risky assets.
Beyond mechanical liquidity constraints, uncertainty plays a pivotal role in shaping the network topology during crises. Caballero and Krishnamurthy [28] argue that when aggregate liquidity is low, uncertainty-averse agents—operating under max-min preferences—project the most unfavorable scenarios and switch abruptly from risky to safe assets. Such behavioral shifts lead to the “structural synchronization” observed in modern financial networks, where traditional diversification benefits may either strengthen or collapse depending on the nature of the shock.
The empirical characterization of flight-to-safety is essential for understanding the directional tail risk captured in our model. While flight-to-safety typically manifests as a pronounced negative correlation between stocks and bonds, it also justifies the inclusion of gold as a distinct layer. As an asset with unique risk-isolation properties, gold often exhibits decoupled movements relative to the broader financial system during extreme stress [29]. Integrating these flight-to-safety mechanisms into a multilayer framework allows us to identify whether a specific transmission path represents a pure contagion (contemporaneous decline) or a flight-to-safety (inverse coupling), thereby providing a more nuanced map of global systemic fragility.
While flight-to-safety represents a reactive surge during crises, Portfolio Rebalancing offers a more continuous and structural mechanism for risk transmission. This process explains how international investors adjust risk exposure in response to return fluctuations, creating persistent links between disparate market layers.
As gross cross-border assets expanded from 60% of global GDP in the mid-1990s to over 200% by 2015, valuation effects—driven by asset price shifts rather than trade flows—have become dominant drivers of international capital flows [30]. Consequently, significant capital gains or losses across equity and bond layers trigger portfolio reallocations as global investors recalibrate their positions to maintain target risk-return profiles.
The systemic impact of this rebalancing depends on whether investors act as stabilizers or amplifiers. While traditional contrarian strategies (selling appreciating assets) can create stabilizing feedback loops, momentum-following behaviors may exacerbate volatility. In a multilayer network, these strategies define edge strength: contrarian flows stabilize the system, whereas momentum-driven rebalancing can trigger the “liquidity spirals” identified by Brunnermeier and Pedersen [27].
From a network perspective, rebalancing provides the micro-foundation for cross-layer connectivity. For instance, valuation shifts in the equity layer may force managers to adjust sovereign bond holdings or FX hedges, mechanically transmitting shocks across asset classes. By incorporating these theories, our model moves beyond simple correlations to capture the dynamic adjustment paths that define the robustness or fragility of the global financial architecture.
Beyond portfolio rebalancing, macro-structural drivers such as the “Global Financial Cycle” posit that global risky asset prices and capital flows are driven by a single common factor—largely dictated by U.S. monetary policy and reflected in the VIX. To mechanically understand this cycle, the framework of Adrian and Shin (2010) [31] on the procyclicality of financial intermediary leverage is particularly relevant. Their research elucidates how the balance sheet capacity of global banks fluctuates with market volatility: during periods of low volatility, intermediaries expand their leverage to pursue higher returns, effectively flooding the global system with liquidity.
Conversely, as documented by Adrian and Shin (2010) [31], a spike in tail risk triggers a contraction of leverage where intermediaries are forced to shrink their balance sheets simultaneously across all geographic and asset borders. This mechanism functions as a systemic driver that synchronizes connectivity across seemingly disparate layers of the financial system—such as equities, bonds, and foreign exchange. By integrating these theories, we provide a robust economic rationale for our empirical findings: when global liquidity cycles contract, the cross-layer synchronization and network concentration (measured by our HHI) surge, as the shared dependency on intermediary funding overrides market-specific fundamentals. This theoretical addition directly justifies our use of a multilayer architecture to capture the systemic “pooling” of risk that occurs when global liquidity evaporates.
2.3. Literature Review on Financial Networks
Existing research on financial networks generally follows two distinct strands. The first examines systemic stability and cascading failure mechanisms through network topology. The second focuses on the construction of risk connectivity networks to identify systemically important nodes. Recently, financial network methodologies have increasingly investigated risk transmission mechanisms. These studies have evolved from early analyses of inter-institutional linkages to the modeling of complex cross-market and cross-border systems.
Early research in financial networks models the cascading dynamics triggered by institutional interdependence. Most notably, Elliott et al. [32] addresses how discrete shifts in asset values, such as those resulting from default or bankruptcy, precipitate chain reactions throughout the financial architecture. Alongside this work, Acemoglu et al. [33] examines the relationship between network topology and systemic failures driven by counterparty contagion. Their findings highlight a “phase transition” in financial contagion. While denser interbank claims can bolster systemic stability under localized shocks, they exacerbate risk propagation once the magnitude of the shock exceeds a critical threshold.
A prevailing paradigm in financial network modeling centers on constructing tail risk networks to identify the roles of countries in global risk diffusion. Nguyen and Lambe [22] employ quantile regression to map directed tail risk connectivity across a multi-country setting. This mapping uncovers the structural characteristics and transmission pathways of international tail spillovers. Extending this framework, G.-J. Wang et al. [9] develop an interconnected multilayer network comprising global equity and foreign exchange markets. Their analysis demonstrates that a multilayer approach offers significantly more explanatory power than traditional single-market models. Furthermore, empirical evidence from Abduraimova [14] reveals a potential decoupling between normal-state risk centrality and extreme tail risk. Specifically, countries with high centrality may exhibit low idiosyncratic risk yet remain capable of triggering system-wide cascades during crises. These findings underscore the importance of incorporating network topology into tail risk studies.
Multilayer network methodologies have advanced rapidly, establishing the foundations necessary to characterize complex interdependencies across market layers. De Domenico et al. [6] pioneered the use of adjacency tensors to model these structures within a unified mathematical framework. Building on this foundation, Bargigli et al. [34] analyze the multiplex nature of interbank exposures. Their study demonstrates that isolating a single layer significantly underestimates aggregate systemic risk. Similarly, Poledna et al. and Brummitt and Kobayashi [7,35] extend metrics of systemic importance to the multilayer domain. Within these architectures, localized shocks can trigger iterative cascading processes through interlayer connections [8,36]. These insights have catalyzed robust systemic risk measures, such as the DebtRank framework [37,38], which simulates the amplification of failures through network propagation.
Selecting appropriate node centrality measures is pivotal for identifying systemic risk. While in-degree and out-degree provide intuitive structural insights, researchers increasingly favor the PageRank algorithm [39]. For instance, Nguyen and Lambe [22] utilize out-degree to quantify risk-propagation intensity, yet PageRank better identifies influential nodes within complex link topologies. Grounded in random-walk theory, PageRank identifies high-impact nodes based on the global connection structure. In single-layer settings, it effectively evaluates the systemic importance of individual institutions or markets. Its multilayer extension, PageRank versatility [9], generalizes this approach to high-dimensional architectures. By integrating risk propagation across market layers, this measure identifies pivotal nodes that maintain systemic relevance throughout the system. Unlike simple out-strength, which merely aggregates local edge weights, PageRank-based metrics capture the second-order effects generated by connections from other important nodes. The versatility variant provides a consistent ranking across layers, aligning with our objective of mapping cross-market transmission.
Beyond individual nodes, the distribution of systemic importance across the network carries profound implications for collective stability. From a systemic perspective, concentrating structural importance in a few nodes may increase vulnerability to localized shocks [40]. Highly centralized systems are often prone to catastrophic failure if key hubs are compromised. We therefore posit that centrality concentration signals underlying structural fragility and a forthcoming reconfiguration of connectivity. In this context, the Herfindahl–Hirschman Index (HHI) of systemic centrality transcends its role as a purely descriptive measure. Instead, it serves as a potential indicator of future changes in network connectivity. This index provides a conceptual link between the current risk distribution and the prospective resilience of the multilayer architecture. By monitoring the lead–lag relationship between concentration and aggregate spillovers, this study tests the hypothesis that extreme polarization serves as a precursor to systemic instability.
2.4. Summary and Synthesis of the Literature
Existing studies predominantly rely on single-layer network structures that model different asset classes in isolation. This siloed approach fails to capture how within-country cross-market coupling catalyzes international cascading effects. Furthermore, as the number of nodes and layers expands, potential linkages grow quadratically. This dimensionality curse complicates both the robust estimation and sparse identification of tail networks. Consequently, isolating the most explanatory risk channels remains a significant challenge in high-dimensional systems. Additionally, current systemic risk metrics are often restricted to single-layer centrality measures. These metrics lack a unified, cross-layer framework, which hinders the identification of globally systemic countries.
To address these gaps, we construct a multilayer tail spillover network using LASSO quantile regression. Our framework allows us to address three central research questions:
- What are the primary transmission pathways for cross-market tail spillovers?
- Which countries exhibit persistent systemic importance within the multilayer architecture?
- Do network connectivity and systemic importance undergo structural shifts in response to crisis shocks?
3. Methodology
To characterize the architecture of global risk transmission under extreme market conditions, we represent individual countries as nodes within a network, where the edges signify tail risk spillovers. Specifically, we establish a directed edge if an extreme negative return in one country provides significant predictive information for the tail returns of another. The edge direction denotes the orientation of risk propagation, while the edge weight quantifies the intensity of the spillover.
To capture a comprehensive representation of the global financial system, we construct a multilayer network comprising four foundational asset classes: equities, sovereign bonds, foreign exchange (FX), and gold. The selection of these markets is theoretically grounded in their roles as the primary pillars of international capital flows and systemic risk transmission [3,41]. Specifically, equities and bonds represent the core channels of corporate and public financing, reflecting growth expectations and credit conditions, respectively. The FX market serves as the essential connective tissue for cross-border transactions and global liquidity dynamics [16]. Finally, gold is integrated as a distinct layer to account for systemic ’safe-haven’ effects, which often exhibit decoupled or inverse risk co-movements relative to traditional assets during extreme stress [29]. By mapping these interactions into a multilayer architecture, our model simultaneously characterizes within-market contagion and the cross-market diffusion pathways that define the modern financial architecture.
To operationalize this multilayer architecture, we employ a LASSO-penalized quantile regression framework, which integrates the unique strengths of both methodologies to address the specific challenges of systemic risk modeling. On one hand, quantile regression allows us to capture spillovers in the extreme tails (e.g., the 5% quantile) of return distributions, which is essential for identifying the non-linear “tail-dependence” characteristic of financial crises. On the other hand, the inclusion of multiple assets and countries results in an over-parameterized system where the number of potential edges grows quadratically. The LASSO penalty resolves this “curse of dimensionality” by shrinking statistically insignificant spillover coefficients to zero. By combining these two approaches, we can identify a sparse and interpretable network structure that retains only the most significant risk transmission pathways, thereby providing a more robust characterization of cross-market diffusion and systemic fragility.
Furthermore, to quantify the systemic importance of nodes within this interconnected architecture, we utilize the PageRank Versatility metric specifically applied to cross-asset systemic risk. Unlike traditional centrality measures that operate on single-layer structures, PageRank Versatility accounts for the multiplex nature of the global financial system by aggregating a node’s influence across all asset layers. Specifically, it identifies “systemic hubs” that possess a high probability of propagating shocks not just within a single market, but across the entire multilayer topology. By calculating the versatility scores, we can distinguish between nodes with localized influence and those that act as cross-asset risk propellers, thereby providing a robust ranking of countries based on their total systemic footprint in the global financial architecture.
This chapter systematically outlines the construction of the multilayer financial network. Section 3.1 introduces the tail risk modeling framework, elucidating the role of quantile regression in capturing extreme risk spillovers. By incorporating a LASSO regularization mechanism, we facilitate high-dimensional variable selection to define the network’s edges. Section 3.2 details the derivation of directed single-market tail risk networks from these estimates. Section 3.3 specifies the parameter selection and implementation details, providing a rigorous justification for the chosen configurations to ensure the methodological rigor and replicability of the estimated network. Section 3.4 integrates multi-market information to construct the multilayer structural framework and its associated adjacency tensor representation. This section further introduces PageRank versatility as a metric to evaluate the systemic importance of country nodes, enabling the identification of key risk emitters and absorbers. Through this integrated modeling scheme, we identify primary transmission pathways, core systemic nodes, and the network topological features that trigger cascading effects across both cross-country and cross-market dimensions.
3.1. Estimation of Risk Spillover Coefficients
Before detailing the econometric estimation, it is essential to bridge the gap between our high-dimensional framework and the underlying financial economic theories. The spillovers captured by our model are not merely statistical co-movements but are manifestations of three primary economic mechanisms:
First, Information Contagion and the “Wake-up Call” Hypothesis: Spillovers occur when a tail event in one market (e.g., U.S. equities) acts as a signal for global investors to reassess the risk profiles of other economies or asset classes. Extreme shocks increase information sensitivity, causing investors to disregard idiosyncratic fundamentals and focus on common risk factors [42]. Our use of quantile regression is theoretically grounded in this mechanism, as it specifically identifies how “tail-end” information in source nodes triggers a nonlinear shift in the conditional distribution of recipient nodes.
Second, Liquidity Spirals and Funding Constraints: The interaction between disparate asset classes is driven by the “liquidity spiral” mechanism [27]. When a shock hits a specific layer (e.g., the bond or equity market), leveraged institutional investors face margin calls and funding shocks, forcing them to liquidate positions in other market layers to maintain solvency. This cross-asset rebalancing creates a contagion channel where risk “jumps” across layers regardless of trade or fundamental ties. The multilayer architecture of our model is designed to map these cross-asset liquidations, explaining how localized distress in one market can cascade into a system-wide liquidity crisis.
Third, Flight-to-Safety and Risk Rebalancing: The interaction between risky assets (equities) and safe-havens (gold and sovereign bonds) is governed by flight-to-safety behavior [26]. During acute crises, capital migrates from high-volatility layers to safety-oriented layers, altering the network’s topology. Our model captures this by identifying both positive risk-propagation edges (contagion) and the dynamic coupling/decoupling between layers. By integrating these theories, the subsequent LASSO-quantile framework functions as an empirical mapping of the behavioral and institutional frictions that define modern financial fragility.
We clarify a dual-quantile approach central to our methodology. We strictly distinguish between two distinct quantile measures: (i) an unconditional threshold (), derived from the sample distribution to identify realized tail events and construct binary indicators; and (ii) a conditional quantile (), which serves as the estimated state variable within our regression framework to model the potential transmission of risk. While the former categorizes historical extremes, the latter captures the dynamic, state-dependent evolution of tail risk spillovers across the multilayer system.
As research into cross-border financial risk transmission deepens, the dimensionality and complexity of the underlying datasets have increased significantly. To navigate these high-dimensional sparse settings, the LASSO (Least Absolute Shrinkage and Selection Operator) quantile regression framework has become a preferred methodological choice. Belloni and Chernozhukov [5] demonstrate the effectiveness of LASSO for variable selection and parameter estimation within high-dimensional sparse quantile models, providing a rigorous asymptotic foundation. Subsequently, Hautsch et al. [21] apply this framework to investigate tail risk transmission among U.S. financial institutions, validating its advantages in processing complex financial data. In the study of risk propagation, the primary strength of LASSO quantile regression lies in its capacity to mitigate model complexity through a penalty term. By shrinking irrelevant coefficients to zero, the estimator achieves efficient variable selection while preserving the informational content of critical risk drivers, thereby ensuring both the robustness and the interpretability of the resulting network linkages.
To identify network connectivity, we employ the LASSO quantile regression framework proposed by Belloni and Chernozhukov [5] to analyze tail risk linkages across international financial markets. Within this setup, the tail risk of country i in a specific market is driven by several key determinants: its own autoregressive components, the losses incurred by other countries, and the tail risk transmitted from the country’s other asset classes. Our methodology allows us to robustly estimate the risk transmission intensities associated with these diverse channels. A principal advantage of this approach is its system-wide perspective. By considering the aggregate tail risk dependencies among all countries simultaneously, it overcomes the inferential limitations inherent in bivariate or single-market specifications. This integrated estimation ensures that we capture the full topology of the global financial system while maintaining the sparsity necessary for high-dimensional identification.
Let denote the market-specific daily return measure for country i in market layer , representing log returns for equities, exchange rates, and gold, and daily yield changes for sovereign bonds. In this study, we characterize the tail risk of each market as the conditional quantile of this return measure at the significance level q. This specification allows us to capture extreme downside movements by focusing on the quantile of the conditional distribution of , thereby providing a standardized framework for analyzing risk spillovers across diverse asset classes.
Then, we define the conditional q-quantile (the predicted quantile) for country i in market as:
Here, the term denotes the set of regressors utilized in the estimation, which includes idiosyncratic cross-market variables, contemporaneous spillover terms from other countries within the same layer, and relevant autoregressive lags. By defining tail risk through this conditional framework, we isolate the dynamic influence of external shocks and internal market coupling on extreme downward movements.
We initiate the analysis by defining a tail event indicator variable, , using the 5% unconditional sample quantile as the threshold:
where represents the 5% sample quantile of the return measures for the respective market.We emphasize a critical distinction in our dual-quantile approach: this unconditional quantile serves exclusively to construct the tail event indicators and remains separate from the conditional quantile, , estimated within the regression framework. To ensure the results are not sensitive to this specific threshold, we consider alternative quantile levels in our subsequent robustness checks.
We characterize the tail risk of country i in market layer using the following quantile regression specification:
In this framework, the left-hand side represents the predicted conditional quantile function. The vector comprises the selected regressors, while denotes the corresponding vector of regression coefficients. We formally define the estimated values of these coefficients as the risk spillover coefficients. Furthermore, represents the stochastic error term. We define as the conditional quantile of the return measures distribution at the percentile. This notation allows us to interpret the estimated conditional quantiles directly within a risk management framework while maintaining the econometric rigor of the quantile regression approach.
We estimate the spillover coefficients by solving the following penalized quantile regression problem:
where denotes the indicator function. The objective function consists of the asymmetric absolute loss (check function) and an penalty term that facilitates sparsity. Here, K represents the number of regressors in , with denoting the k-th element of the coefficient vector. To account for varying scales among the predictors, we weight the penalty by the estimated standard deviation of the k-th regressor, :
The tuning parameter controls the degree of regularization; higher values of yield a more parsimonious model by shrinking more coefficients to zero. Following Hautsch et al. [21], we adopt a data-driven approach to determine the country-specific tuning parameters . We provide the detailed algorithmic implementation for this selection process in Appendix A. To perform a holistic analysis of the financial system, we construct a multilayer network and select the regressors based on the specific topological features of the system.
3.2. Construction of the Risk Transmission Network
While single-layer network analysis of financial systems is well-established—with studies such as Nguyen and Lambe [22] highlighting how intrinsic network topologies drive tail risk propagation—standard frameworks often overlook the critical role of cascading effects in complex systems [43,44]. A cascading effect describes an iterative process where localized failures trigger secondary disruptions in interconnected components, potentially leading to system-wide instability. By mapping financial interactions across different asset classes into distinct layers, multilayer network models incorporate cross-market interlayer transmission channels. This approach transcends the limitations of isolated single-layer analyses and more effectively captures the amplification of risk propagation driven by cascading dynamics across the global financial architecture.
Research within the financial network framework, such as de la Concha et al. [45], X. Wang et al. [46] and Le et al. [47] demonstrates that risk transmission is not confined to isolated markets or domestic contagion but arises from intricate interactions between diverse market sectors and economies. To capture these multi-faceted dependencies, multilayer network models have gained significant traction as a means to represent the complex interdependencies of real-world systems. In a multilayer configuration, nodes participate in various interaction systems, each mapped onto a distinct topological layer. By conceptualizing the interactions of financial entities across different markets as separate layers and utilizing interlayer edges to denote cross-market connections, we construct a robust representation of the financial system’s architecture. This multilayer approach elucidates how network topology dictates systemic resilience against risk shocks, enabling a more comprehensive characterization of global risk propagation and providing essential insights for the forecasting and prevention of systemic crises.
The primary distinction between the proposed approach and previous studies on multilayer financial networks lies in the shift from mean-based, linear dependencies to high-dimensional tail-risk topographies. While traditional multilayer frameworks typically rely on Pearson correlations or VAR-based variance decompositions to capture average market co-movements, our approach utilizes a quantile-based framework to specifically isolate risk spillovers that occur during extreme market distress. Furthermore, unlike existing models that are often constrained by the “curse of dimensionality”—limiting their scope to a small number of nodes—our integration of LASSO regularization enables the construction of a sparse, directional, and high-dimensional network. This allows us to filter out statistical noise and identify the most significant transmission pathways across a global, multi-asset architecture, providing a more accurate mapping of systemic fragility during crisis episodes compared to traditional dense or mean-centric models.
A single-layer network is formally defined as , where denotes a set of N nodes and () represents the set of edges connecting node pairs. In our framework, we employ weighted directed edges. Each node represents country i, while the edge signifies a directed link originating from country i and terminating at country j. The edge weight quantifies the intensity of the tail risk spillover. Within a single-layer context, we establish directed intralayer edges between nodes whenever significant volatility spillovers occur between national markets. We subsequently extend this baseline framework into a multilayer structure by modeling distinct asset markets as separate layers and incorporating cross-market risk propagation as interlayer connections.
We begin by establishing the mathematical framework for the multilayer network structure employed in this study. We construct a multilayer network consisting of N country nodes and L market layers.
denotes the node of country i in the market layer. Following the mathematical formulation established by De Domenico et al. [6], we define a fourth-order adjacency tensor, , to represent the network’s connectivity. Its components, , quantify the directed link originating from node i in layer and terminating at node j in layer . The edges within this multilayer architecture fall into two distinct categories: intralayer edges, which represent dependencies between different nodes within the same layer (), and interlayer edges, which represent the coupling of a single node or different nodes across distinct market layers ().
Within each market layer, we model the tail risk of country i as a function of its own lagged values, its performance indicators across other market layers, and the exceedance levels of other countries. A significant advantage of this system-wide approach is its capacity to simultaneously quantify tail risk connectivity across all countries and layers, transcending the limitations of bivariate or isolated assessments. For each layer, we calculate the return measures of the respective market indicators. We then employ LASSO quantile regression to achieve high-dimensional variable selection; coefficients with absolute values falling below a predefined threshold are identified as irrelevant and shrunk to zero. We define the resulting non-zero estimates as the tail spillover coefficients, which serve as the weights for constructing directed networks within each layer. Following Hautsch et al. [21], we determine the tuning parameter through a data-driven procedure, the details of which are provided in Appendix A.
For country i, we define the loss exceedance as:
where denotes the 5% unconditional sample quantile of . By constructing based on this unconditional threshold, we effectively isolate realized tail events to serve as exogenous shock inputs for characterizing risk transmission across markets and layers. To mitigate potential endogeneity issues arising from contemporaneous common shocks and to remain consistent with the temporal logic of risk propagation, we incorporate all cross-country and cross-market loss exceedance terms into the quantile regression using a one-period lag (). This lagged specification ensures that we capture the directional predictive ability of tail shocks rather than mere contemporaneous correlation.
We specify the quantile regression for tail risk as follows:
In this specification, the vector of length contains the lagged loss exceedances for country i across all other market layers, thereby capturing interlayer spillovers within the same country. The vector of length represents the lagged loss exceedances of all other countries within market layer , identifying intralayer spillovers. The term denotes the autoregressive component of the market-specific indicator. The parameters and are the corresponding coefficient vectors, while represents the scalar coefficient for the lagged term. Collectively, the estimated coefficients in quantify the intensity of directed tail risk transmission from both cross-market and cross-country sources.
Within the regression framework, the coefficients characterize the intralayer spillover effects from other nodes to node within the same market layer. In contrast, represents the interlayer connections, capturing cross-market risk spillovers originating from the country’s presence in alternative asset layers. We derive the specific values for the tail risk spillover coefficients based on the LASSO selection results. For each component of and , we retain the estimated coefficient if it exceeds a predefined threshold; otherwise, we consider the risk spillover insignificant and set the coefficient to zero. Following the methodology of Hautsch et al. [21], we apply this thresholding rule to achieve a sparse and interpretable network structure. Our benchmark specification employs a threshold of 0.001. To ensure the consistency of our results, we further examine alternative thresholds within our robustness checks, specifically 0.0005 and 0.0001.
Based on the foregoing estimation results, we define the components of the adjacency tensor, T, as follows:
where is the threshold selected by the LASSO algorithm (or the pre-specified robustness threshold), below which coefficients are truncated to zero. The operator denotes the positive part, ensuring that only spillovers exceeding the threshold are retained. Specifically, represents the component of the coefficient vector that identifies the risk spillover from node i to node j within market layer . Similarly, denotes the component of that captures the cross-market risk propagation for country j from layer to layer .
In the construction of the adjacency tensor, we retain only the positive part of the estimated spillover coefficients, denoted as . This decision is grounded in the specific economic objective of this study: to map the propagation and amplification of tail-risk contagion.
From an economic perspective, a positive coefficient in a quantile regression at the level indicates that an extreme downside movement in the source node is associated with a further deepening of the conditional tail risk in the target node. This represents a direct transmission of financial distress. In contrast, negative coefficients suggest an inverse relationship, where a tail event in one market coincides with an improvement (or a less severe drop) in the conditional quantile of another. Such negative associations are typically interpreted as hedging effects, diversification benefits, or flight-to-safety reallocations [48].
Since our research focus is exclusively on the architecture of systemic vulnerability and contagion paths, including negative coefficients would confound the interpretation of the directed spillover network, as buffers and hedges would offset the signals of risk propagation. As a robustness check, we verified that the inclusion of signed coefficients or absolute values does not fundamentally alter the primary topological rankings of systemic importance, confirming that the positive transmission channels dominate the network’s structural evolution during crisis periods.
3.3. Parameter Selection and Implementation Details
To ensure the methodological rigor and replicability of the estimated multilayer network, we provide a detailed justification for the following parameter configurations:
We select the 5th percentile to represent extreme market stress. While a more extreme quantile (e.g., 1%) theoretically captures more “tail” behavior, it suffers from a severe estimation efficiency loss in finite samples. In a standard one-year rolling window ( trading days), a 1% threshold yields only 2.5 tail observations, which is statistically insufficient for a high-dimensional LASSO regression. Conversely, a 5% threshold provides approximately 12.5 observations per window, ensuring the stability of the estimator and the convergence of the LASSO algorithm while remaining consistent with the “extreme event” definitions in the CoVaR and tail-risk literature [21,22].
We utilize a one-year (approximately 250 trading days) rolling window to capture the time-varying topology of risk propagation. This window size is strategically chosen to be “locally stationary”—long enough to provide sufficient degrees of freedom for the quantile estimation, yet short enough to remain sensitive to structural shifts during crisis episodes. Crucially, to mitigate potential endogeneity concerns such as simultaneity bias, we employ a lagged specification where all spillover regressors enter the model with a one-period lag. This ensures that the estimated edges represent the predictive power of past shocks on current tail risk, rather than contemporaneous correlations. A longer window (e.g., two years) would smooth out the idiosyncratic shocks we aim to identify, whereas a shorter window (e.g., six months) would introduce excessive sampling noise. Robustness checks in Section 4.6 confirm that our core findings remain stable across these window length variations.
The LASSO penalty is estimated country-by-country within each market layer to ensure granular sparsity. To maintain comparability across heterogeneous markets (e.g., high-volatility equity vs. lower-volatility bond yields), we standardize all regressors to zero mean and unit variance. The tuning parameter is determined via a data-driven method [5], which adaptively controls for the level of over-fitting. Furthermore, we employ variable-specific penalty loadings to account for conditional heteroskedasticity, ensuring that the regularization is robust to the volatility clustering inherent in financial time series.
To ensure a sparse and economically interpretable network, we apply a threshold of to the estimated coefficients. This threshold functions as a noise filter, pruning links that are statistically non-zero but economically negligible. By retaining only those coefficients that exceed this magnitude, we focus the analysis on significant transmission channels. We have verified that our topological conclusions remain consistent across alternative thresholds ( and ), including the nodal rankings and the concentration-fragility relationship.
In addition to the threshold, we also restrict our network construction to positive spillover coefficients. This refinement ensures that the identified edges strictly capture the mechanisms of risk propagation rather than hedging effects. Our study focuses specifically on tail-risk contagion, which is characterized by the co-movement of extreme losses. A positive coefficient in our quantile framework signifies that financial distress in one node is associated with a further deepening of tail risk in another, indicating a direct transmission of risk. Conversely, negative coefficients represent inverse associations, which are economically interpreted as hedging effects or flight-to-safety behavior. Mixing these distinct structural dynamics in a single directed network would confound the identification of systemic transmission hubs.
3.4. Systemic Importance and Node Centrality
A primary challenge in financial regulation involves identifying systemically important nodes within complex, interconnected financial architectures. Utilizing the multilayer tail spillover network constructed in the previous section, we can employ various centrality metrics to quantify the systemic relevance of each node. In a weighted directed network, we define a node’s out-strength (spillover intensity) as the sum of its outgoing edge weights and its in-strength (reception intensity) as the sum of its incoming edge weights. These degree-based measures provide an intuitive assessment of a node’s localized role in either initiating or absorbing risk within the propagation process.
Beyond these local measures, the PageRank algorithm, since its inception by Page et al. [49], has found extensive application across diverse disciplines. Within the context of systemic risk, Wen and Wang [50] demonstrate that PageRank centrality serves as a highly effective metric for identifying pivotal markets or institutions by accounting for the global connection topology.
The PageRank algorithm evaluates node importance by capturing the global interconnectedness of the network topology. Formally, we define the PageRank score of node u as follows:
In this specification, denotes the PageRank centrality of node u, represents the set of nodes pointing to u, and corresponds to the out-degree of node v. The parameter serves as the damping factor, representing the probability that a random walker continues to follow the link structure rather than jumping to a random node.
In empirical applications, many network systems exhibit heterogeneous interactions that manifest as complex multilayer architectures characterized by significant cross-layer interdependencies. To effectively quantify systemic importance within these high-dimensional environments, De Domenico et al. [51] extended the classical framework by introducing PageRank versatility. This metric generalizes the random walk process to account for the additional degrees of freedom provided by the interlayer transitions within the adjacency tensor. The calculation of PageRank versatility accounts for both intralayer centrality and the structural influence of interlayer connections, reflecting how tail risk propagates across disparate market segments. Consequently, this metric captures the systemic importance of nodes emergent from complex cross-layer interactions.
We represent the random walk process across the multilayer structure using a fourth-order transition tensor. In this framework, a random walker moves to an adjacent node with probability or teleports to any other node in the network with probability . The transition tensor is defined as:
where is the multilayer adjacency tensor (typically row-normalized to represent transition probabilities), and is a rank-one fourth-order tensor with all elements equal to one. The term denotes the total number of state-nodes (the product of the number of countries and market layers). In line with the canonical PageRank algorithm, we set the damping factor to 0.85. The PageRank versatility values for each country node are then derived from the steady-state solution of the stochastic process governed by this transition tensor. By solving for the stationary distribution, we obtain a consistent ranking that identifies which countries act as the primary structural anchors of systemic risk across the entire multi-market architecture.
Applying PageRank versatility within a financial network framework effectively assesses the role of individual nodes in systemic risk transmission. It facilitates the identification of nodes possessing high cross-market propagation capacity, a critical factor in understanding the dynamics of international contagion. For instance, national policy shifts often exert simultaneous pressure across multiple market layers—such as equities, bonds, and foreign exchange. PageRank versatility captures the pivotal roles these nodes play by integrating their influence across the entire multilayer topology.
To quantify the concentration of systemic importance across the network, we employ the Herfindahl–Hirschman Index (HHI), a metric traditionally used in industrial organization to measure market power, which we adapt here to evaluate the distribution of risk. We calculate the HHI as the sum of the squared centrality scores of all nodes:
where represents the normalized centrality value (e.g., PageRank versatility) of node i. An elevated HHI indicates that systemic importance is concentrated within a small subset of “too-interconnected-to-fail” nodes, signaling heightened structural fragility. Conversely, a lower HHI suggests a more homogeneous distribution of risk, which generally enhances the system’s ability to absorb localized shocks through diversification.
Analyzing the HHI provides a macro-level perspective on the structural topology of the global financial system. In our framework, the HHI serves as a diagnostic tool for monitoring systemic transitions and anticipating subsequent changes in network connectivity. Rather than acting as a simple proxy for spillover volume, an increasing HHI indicates a polarization effect where risk accumulates in a few pivotal hubs. This process often precedes structural reconfigurations of the network, such as the weakening of peripheral links, thereby providing regulators with a forward-looking indicator of impending systemic brittleness and potential regime shifts in the multilayer transmission mechanism.
4. Empirical Results
This chapter presents four key empirical findings regarding the structure, dynamics, and mechanisms of tail risk spillovers within the global multilayer financial network. First, we identify a robustly stratified and time-varying network architecture governing global tail risk transmission. Second, we document a marked directional asymmetry in international spillovers, characterized by a dynamic divergence between primary risk emitters and risk absorbers. Third, the significant predictive power of network concentration on subsequent connectivity suggests a persistent linkage between structural density and systemic tail risk. Finally, we find that cross-asset tail risk propagation maintains a stable functional structure that undergoes significant synchronous intensification during crisis periods.
4.1. Data and Variable Construction
This study examines tail risk spillovers across major financial markets using a balanced panel of 11 systemically important economies over the period January 2012 to December 2025. The sample includes the United States, China, Japan, Germany, the United Kingdom, France, Russia, Canada, Australia, South Korea, and India, which jointly represent a substantial share of global financial market capitalization and cross-border capital flows. These economies are selected due to their financial market depth, international integration, and relevance for global systemic risk transmission, consistent with prior studies on international financial connectedness.
We consider four key financial market segments—equity, sovereign bond, foreign exchange, and gold markets—which together capture the main channels through which financial shocks propagate across countries and asset classes. Gold is treated as a global asset priced in domestic currency, reflecting its role as a common risk transmitter rather than a country-specific market.
We consider four key asset classes for each economy. The data construction is detailed as follows:
Equity Market: For each country, the equity market is represented by its primary broad-based stock market index, see Table 1. Equity returns are computed as the logarithmic first differences of daily closing prices.
Table 1.
Representative Equity Indices Selection by Country.
Sovereign Bond Market: The sovereign bond market is proxied by 1-year government bond yields for each country. Following standard practice in the literature, bond market returns are measured as daily changes in yields, which capture valuation effects and interest rate risk in government bond markets.
Foreign Exchange Market: The foreign exchange market is represented by bilateral exchange rates against the U.S. dollar. Exchange rate returns are calculated as the logarithmic first differences of daily spot exchange rates, such that negative returns correspond to domestic currency depreciations.
Gold Market: Gold market exposure is captured using the daily log returns of gold prices denominated in the domestic currency. As gold is traded in a globally integrated market, utilizing logarithmic first differences ensures a consistent statistical treatment across all asset layers. This modeling choice reflects gold’s role as a global safe-haven asset that transmits common tail risk shocks across national financial systems rather than country-specific market dynamics.
All financial series are collected at the daily frequency. To ensure cross-market comparability, we align trading days across markets by retaining common trading dates and excluding non-overlapping holidays. When necessary, missing observations due to market-specific holidays are handled using last observation carried forward, which minimizes artificial volatility while preserving temporal continuity. Although Russian markets experienced trading restrictions after 2022, internationally traded financial series remained available, which are widely used in empirical studies. Data for various Russian markets is available from Wind database. Meanwhile, the Russian government bond yield data obtained from the database was missing for the years 2024 and 2025; we have manually filled in this missing data using the official website of the Bank of Russia.
Tail risk is measured using unconditional quantile obtained from quantile regression at the 5% lower tail (q = 0.05). This quantile level is chosen to balance sensitivity to downside risk and estimation reliability, and it is commonly adopted in empirical studies on financial tail dependence. Robustness checks using alternative quantile levels are reported in Section 4.3.
Equity indices, government bond yields, and exchange rates are obtained from the Wind database, and gold prices are from investing.com. All data sources are widely used in the empirical finance literature, which ensures the consistency and repeatability of the empirical analysis.
4.2. Hierarchical Structure and PageRank Versatility
By constructing a multilayer tail-risk transmission network, this study reveals a pronounced hierarchical architecture that evolves dynamically in response to shifts in the global financial environment and exogenous risk shocks. This dynamic hierarchy is rooted in the procyclicality of the global financial system theorized by [31]. Our four-layer framework—comprising equity, bond, foreign exchange, and gold markets—effectively differentiates the risk-propagation roles countries play across various market segments and identifies significant temporal shifts in their systemic risk contributions. In the aggregate financial system, we observe that “systemically important” pivotal countries often shift as new crisis events emerge.
Figure 1 illustrates the multilayer risk spillover network for the 2024 window. The network topology exhibits significant heterogeneity, where risk transmission is rarely confined to a single market. Indeed, several cross-market interlayer channels exhibit high weights; for instance, the interlayer connectivity of Russia and South Korea significantly outweighs the risk propagation emanating from any single asset class in these countries.
Figure 1.
Structure of the Multilayer Financial Risk Transmission Network in 2024. This figure illustrates the topology of the global financial system across four market layers (Stock, Bond, Foreign exchange, and Gold). Each blue ellipse represents a country-layer state node for one of the 11 countries (AUS, CAN, CHI, FRA, GER, IND, JAP, KOR, RUS, UK, and US). The directed arrows indicate the path of tail-risk spillovers from a source node to a receiver node, with the thickness and opacity of the edges representing the intensity of the risk transmission coefficients. Intralayer edges (horizontal) capture spillovers between countries within a specific market, while interlayer edges (vertical) represent cross-market risk transmission within a single country.
Our methodology specifically accounts for these dynamics through the PageRank Versatility metric. Economically, an increase in a country’s PageRank Versatility signifies its transition into a “systemic liquidity hub.” This measure captures not only the intensity of outgoing tail-risk spillovers but also the amplification effect induced by interlayer coupling. This amplification is consistent with the “liquidity spiral” [27], where localized shocks are magnified through margin calls and fire sales that bridge disparate asset layers. Therefore, an increase in a country’s PageRank Versatility implies that shocks originating from this node are more likely to cascade across both countries and asset classes, magnifying systemic tail risk. The empirical results confirm that tail risks generate cascading effects via cross-market spillovers, thereby amplifying shocks throughout the broader financial system. For example, volatility in sovereign bond spreads often propagates into the foreign exchange market, subsequently impacting equity valuations. This multi-dimensional transmission path facilitates the cross-layer amplification of localized shocks. By unifying cross-asset spillovers within a single network model, our findings provide empirical support for the theoretical conclusion that complex network cascades exacerbate the propagation of risk events [8].
Figure 2 and Figure 3 illustrates the temporal evolution of PageRank Versatility across countries, utilizing a rolling window analysis. We define a country’s aggregate PageRank Versatility as the sum of its scores across all constituent market layers. In our framework, PageRank Versatility serves as more than a simple measure of spillover intensity; it identifies an economy’s structural role as a pivotal hub within the complex financial system. Consequently, nodes with elevated PageRank Versatility possess a superior capacity to amplify and propagate shocks through interlayer coupling [52,53].
Figure 2.
Temporal Evolution of PageRank Versatility across Countries, Utilizing a Rolling Window Analysis. The white borders delineate the countries with the top five PageRank scores in each year, enabling rapid identification of systemically significant nodes.
Figure 3.
Stacked Heatmaps of Node PageRank Versatility across Four Market Layers (2012–2025). The white borders highlight the top five countries with the highest PageRank values within each layer for each year, facilitating a granular view of systemic risk emitters across different asset classes.
The time-varying empirical results reveal substantial volatility in node-level systemic importance. As shown in the figures, node-level PageRank Versatility reveals distinct heterogeneity across different market layers. During crisis episodes, a country’s influence within the network can undergo abrupt transformations. This phenomenon is particularly salient in the equity layer during the COVID-19 pandemic, where the systemic importance of the United States, Japan, South Korea, and Australia experienced sharp, short-term surges compared to the pre-crisis period. Notably, even the United States, which has central role in global finance, does not consistently maintain high PageRank Versatility scores across all market layers throughout the sample period. This suggests that risk-propagation hubs are not static; rather, they evolve alongside the global financial cycle and undergo structural migration during periods of acute stress. Ultimately, the time-varying redistribution of PageRank Versatility indicates that systemic importance is not an intrinsic country attribute but an emergent property shaped by global financial conditions.
The surge in U.S. centrality during the pandemic reflects its dual role as both a primary source of risk and the ultimate provider of global liquidity. This finding provides empirical support for the conclusion that U.S. monetary conditions serve as the common factor driving the risk appetite of the entire multilayer network. Economically, this is driven by the “Dollar Dominance” mechanism: during acute stress, the global scramble for dollar-denominated assets triggers a liquidity squeeze, causing the U.S. equity layer to become the global clearinghouse for risk signals. The systemic jumps for Japan, South Korea, and Australia are rooted in their high economic openness and critical positions within global supply chains. As the pandemic initially disrupted East Asian manufacturing hubs, these markets functioned as informationally efficient leading indicators. Investors utilized the fluctuations in these mature, high-transparency markets to assess the global evolution of the crisis, effectively transforming localized trade shocks into global financial signals.
PageRank Versatility captures not only the intensity of outgoing tail-risk spillovers but also the amplification effect induced by interlayer coupling. Therefore, a sharp increase in a country’s PageRank Versatility implies that its localized market fluctuations have become critical systemic signals, capable of cascading across the entire multilayer architecture. The heightened importance of the U.S. market during this shock period reinforces its status as the global financial system’s primary hub. Conversely, the systemic jump for the other three nations reflects their geographical and trade proximity to the pandemic’s initial epicenters. Due to their mature market institutions and high degrees of economic openness, their equity fluctuations functioned as leading indicators for global investors assessing the risk of pandemic spread. These markets thus played a pivotal role in translating localized shocks into global signals, resulting in a significant jump in their systemic importance rankings. This finding aligns with the research by Onour [54] regarding the Asia-Pacific region’s response during the early stages of the pandemic.
This leads to two critical policy implications:
Regulators should shift from static, size-based capital requirements to dynamic, connectivity-based buffers. The fact that PageRank Versatility can jump abruptly suggests that capital surcharges for systemically important institutions should be calibrated according to their real-time “connectedness” and versatility scores, rather than historical asset size alone.
Since risk hubs vary by market (e.g., U.S. dominance in FX vs. regional drivers in bond-layer fragility), macroprudential authorities must implement cross-layer monitoring. Tracking the “synchronization” between different asset layers can provide a more reliable early-warning signal of structural collapse than monitoring any single market index in isolation.
Ultimately, our network modeling of global financial risk spillovers reveals that the tail-risk network is a dynamic, hierarchical system. The reconfiguration of network topology during acute crises is driven by the interaction between micro-level balance sheet constraints and macro-level liquidity cycles. Key nodes are structurally determined; they act as risk-propagation hubs that shift according to the global financial cycle and specific risk shocks. These results highlight the critical role of extreme shocks in reconfiguring network topology, providing new evidence for the mechanisms governing risk transmission during periods of acute crisis.
4.3. Directional Asymmetry and Role Differentiation
Utilizing the weighted directed network architecture, we further examine the directional characteristics of tail risk transmission and the resulting role differentiation within the global financial system. Figure 4 illustrates the temporal evolution of aggregate in-strength and out-strength—calculated by summing values across all market layers—using a rolling window approach. Our results reveal pronounced directional asymmetry in international tail spillovers, characterized by distinct role variations between risk emitters and absorbers that evolve dynamically in response to global financial cycles and exogenous shocks [55,56]. Risk transmission asymmetry implies that systemic vulnerability is driven more by network position than by market size alone.
Figure 4.
Temporal Evolution of Aggregate In-strength and Out-strength.
Regarding risk exportation, the United States maintains persistently high out-strength throughout the sample period, underscoring its enduring financial hegemony. This dominance is economically rooted in the U.S. dollar’s status as the primary reserve currency, which allows U.S. monetary policy shifts to dictate global risk appetite. Shocks originating in U.S. markets propagate seamlessly through international asset reallocation and capital flows, as the U.S. effectively functions as the global “source of volatility” during expansionary phases and a “liquidity sink” during crises. This finding corroborates the “predictive directional measurement” framework of Diebold and Yilmaz [3] and the interdependence observations of Akinci et al. [57].
In contrast to the persistent dominance of the U.S., China exhibits a steady upward trend in out-strength. This trajectory signifies a structural pivot in China’s role within the global financial architecture, transitioning from a primary risk receiver to an active risk exporter. This shift reflects the increasing cross-border impact of China’s domestic volatility, facilitated by ongoing financial liberalization and the rapid expansion of its capital markets. Such findings suggest that the systemic importance of emerging economies is no longer merely a function of their economic scale, but of their increasing integration into the core of the global spillover network.
Regarding risk absorption, our analysis suggests that non-economic factors—most notably geopolitical shocks—fundamentally reshape country-level roles within the spillover network. Quantitative analysis of risk inflows reveals that Russia experienced an explosive growth in its in-strength surrounding the 2014 Crimean crisis and the 2022 Russia-Ukraine conflict. Following the “weaponized interdependence” theory of Farrell and Newman [58], sanctions can cut or restrict connection paths between specific nodes and key hubs, leading to functional dysfunction within the multilayer architecture. Empirical evidence further confirms that such sanctions erode the resilience of the Russian financial system, heightening its sensitivity to external shocks [59,60]. Our results thus identify a specific shock amplification mechanism: external factors such as geopolitical tension and financial sanctions transform an economy into a unidirectional risk receiver. This division of labor between risk emitters and absorbers is driven by the interaction between global liquidity cycles and localized institutional frictions. The resulting flight of international capital and the blockage of financial channels force these nodes to bear the brunt of the network’s risk spillovers, regardless of their absolute economic volume.
In summary, by quantifying the directional flows of tail spillovers, we uncover a dynamic and asymmetric mode of role transformation. The structure of risk transmission continuously evolves alongside geopolitical disruptions, where crisis-level shocks often intensify unidirectional spillovers. While core nodes like the United States maintain their status as persistent risk sources due to financial hegemony, emerging economies and geopolitically vulnerable nodes undergo significant role reconfiguration. This division of labor between risk emitters and absorbers exhibits features of endogenous evolution, where shocks trigger the reconfiguration of network links and the subsequent amplification of cascades, ultimately driving the transition of node roles. This confirms that systemic vulnerability is a product of shifting network coordinates rather than static market characteristics.
4.4. Structural Fragility and the Concentration of Systemic Importance
Figure 5 illustrates the annual evolution of network concentration (HHI) alongside total multilayer network connectivity. To formally examine the predictive capacity of network concentration for future connectivity shifts, we estimate the following baseline predictive model:
where denotes the aggregate multilayer network connectivity at time t and represents the network concentration index at time . Our empirical results indicate that a lag horizon of yields a significant predictive association (), suggesting that an increase in concentration significantly predicts a decline in future connectivity levels two periods ahead.
Figure 5.
Joint Dynamics of Systemic Importance Concentration (Herfindahl–Hirschman Index, HHI) and Financial Market Connectedness Across Layers, 2012–2025.
As an additional specification to account for the temporal persistence of connectivity, we estimate an extended dynamic model:
In this extended specification, the predictive effect of the HHI remains weakly negative and marginally significant (). This cautious reporting of results demonstrates that even when controlling for the persistence of network structure, the HHI provides distinct, forward-looking information about impending structural reconfigurations.
While both measures originate from the same adjacency tensor, they quantify fundamentally different structural characteristics. Specifically, the HHI measures the concentration of systemic importance among specific nodes, whereas connectivity captures system-wide connectedness. The use of time-lagged variables () and dynamic modeling further minimizes the risk of contemporaneous mechanical correlation.
The inverse relationship between concentration and connectivity reflects a polarization effect within the global financial system. During stable periods, tail risks are distributed more homogeneously across nodes, resulting in widespread mutual spillovers and higher total connectivity. Conversely, as systemic risk accumulates, risk pools rapidly into a few pivotal hubs. This process is typically accompanied by the weakening or dissolution of links between peripheral nodes, which ultimately reduces the network’s aggregate connectivity and facilitates the prospective monitoring of systemic stability.
The concentration of risk in a subset of nodes can erode systemic resilience and intensify contagion effects [33,61]. Under crisis-level shocks, the spillover network is observed to transition from a widely connected system to a skeletal structure supported by a few dominant hubs. In this state, risk flows are dictated primarily by these key nodes, suppressing overall connectivity and potentially inducing structural brittleness.
Critically, this HHI-based analysis is presented as a structural hypothesis for anticipatory monitoring [48], where the HHI serves as a diagnostic tool rather than a definitive causal identification. These results should be interpreted as predictive associations rather than exogenous causal effects, subject to further verification through designs that can isolate exogenous shocks from endogenous feedback loops.
4.5. Cross-Layer Transmission of Tail Risk
Figure 6 and Figure 7 illustrate the annual evolution of interlayer edge weights, providing a detailed view of cross-market spillovers within each economy. To facilitate the interpretation of these multi-panel results, it is noted that each individual panel depicts the internal risk transmission dynamics for a specific country, with the color intensity measuring the estimated spillover weight between asset layers. The analysis primarily focuses on identifying structural patterns across these panels, particularly during significant crisis episodes such as the 2014 Crimean crisis and the 2022 conflict. By examining the synchronized peaks across different country panels, we can observe how the sovereign bond market consistently serves as a primary risk receiver during periods of extreme market stress.
Figure 6.
Dynamic Evolution of Interlayer Risk Spillovers, Part I.
Figure 7.
Dynamic Evolution of Interlayer Risk Spillovers, Part II.
Specifically, we identify the sovereign bond market as a primary systemic risk receiver. Inward spillover weights from the other three layers to the bond layer are consistently the highest among all cross-asset connections. This finding corroborates [62,63] and provides empirical validation for the Flight-to-Safety framework, suggesting that during periods of extreme turbulence, increased macro-uncertainty triggers drive massive capital reallocations into sovereign bonds. This asymmetric transmission structure reflects a mechanism where the financial system transfers pressure across asset hierarchies through a specialized functional division of labor, effectively utilizing the bond layer as a systemic risk absorber during initial crisis phases.
Geopolitical shocks further induce a polarization effect within this cross-layer structure. For Russia, the 2014 Crimean crisis and the 2022 conflict triggered a massive surge in cross-layer risk propagation, particularly in the form of tail-risk inputs to the bond layer. Under the weight of international sanctions and heightened credit default expectations, extreme volatility in the Russian equity and foreign exchange markets funneled risk directly into the sovereign bond market, creating a level of spillover far exceeding tranquil periods. The intensity of this transmission suggests that the “flight-to-liquidity” identified by [26] becomes the dominant driver when market frictions are exacerbated by external shocks, forcing agents to shed even regionally significant assets to meet margin requirements.
Furthermore, our analysis of interlayer coherence identifies significant cross-asset synchronization during crisis periods, shown in Figure 8. During stable states, node-level importance rankings (centrality) vary across layers, reflecting market-specific idiosyncratic factors. However, during systemic eruptions—most notably the COVID-19 pandemic—cross-layer coherence rises sharply [64].
Figure 8.
Temporal Evolution of Cross-layer Rank Consistency.
This convergence in node rankings suggests that systemic shocks may supersede market-specific factors, forcing disparate asset classes to exhibit highly uniform risk characteristics. This structural alignment provides empirical evidence for the contraction of leverage characterized by [31]. In their framework, financial intermediaries manage balance sheet capacity according to Value-at-Risk (VaR) constraints; a spike in volatility triggers a simultaneous deleveraging across all asset borders, thereby overriding idiosyncratic market dynamics. Such structural convergence is interpreted as a potential failure of market segmentation during acute crises. As cross-layer friction diminishes and risk propagation resistance falls, localized regulation of a single market may become less effective because risk has synchronized across the entire multilayer architecture. This finding supports the theoretical frameworks of Kalemli-Ozcan et al. [65] and Vodenska and Becker [66], suggesting that systemic shocks may intensify through cascading effects across the complex global financial network.
The economic mechanism underlying this structural convergence is driven by the liquidity spiral and the correlated information effect, where the distinct informational boundaries between asset classes dissolve during periods of extreme stress. As localized shocks transition into global crises, investors tend to rebalance portfolios based on a unified global risk factor—often linked to a sudden contraction in dollar liquidity—rather than market-specific fundamentals, causing the “protective” decoupling of safe-havens like bonds to vanish. This dissolution of market segmentation implies that traditional diversification strategies may provide a false sense of security, as risk becomes “layer-blind” once systemic connectivity reaches a critical threshold. For macroprudential policy, these findings suggest that regulators must abandon “silo-based” oversight in favor of contingent cross-layer surveillance. By treating the rapid synchronization of node rankings across disparate layers as a high-frequency lead indicator of structural fragility, authorities can implement pre-emptive liquidity interventions that target the connective channels between markets, thereby preventing localized volatility from escalating into a pervasive, system-wide collapse.
4.6. Robustness Analysis
To ensure the reliability of our findings regarding global tail-risk transmission and to rule out potential artifacts from model specifications or estimation techniques, we conduct a series of robustness checks across three dimensions: rolling window length, quantile selection, and the regularization algorithm.
4.6.1. Sensitivity to Rolling Window Length
Our benchmark analysis employs a 12-month (one-year) rolling window to capture the dynamic evolution of the network. To test whether our results are sensitive to the chosen time horizon, we re-estimate the model using 6-month and 24-month windows. While the 6-month window is more sensitive to high-frequency shocks and the 24-month window prioritizes long-term structural trends, the core findings remain remarkably stable.
The temporal fluctuations in total connectivity and the relative importance of country nodes are consistent across specifications, with Spearman rank correlation coefficients for PageRank versatility consistently exceeding 0.85. Furthermore, the top-three systemically important nodes remain unchanged in over 80% of the rolling windows, regardless of window length. These results confirm that our characterization of the network’s dynamic shifts is not contingent on the choice of time horizon.
4.6.2. Sensitivity to Quantile Selection (q)
The benchmark model focuses on extreme tail risk at the q = 0.05 level. To determine if our conclusions are sensitive to the definition of “tail extremeness,” we examine alternative thresholds of q = 0.10 and q = 0.15. As the quantile increases, the effective sample size for tail events grows, naturally leading to a higher level of aggregate network connectivity.
However, the fundamental topology of the network—specifically the role differentiation between Risk Exporters (e.g., the U.S.) and Risk Absorbers (e.g., Russia during crisis periods)—remains robust. We find that node PageRank rankings across different quantiles maintain a high degree of concordance, with correlation coefficients exceeding 0.92. This stability ensures that the identified spillover mechanisms are representative of the broader tail distribution rather than being confined to the most extreme outliers.
4.6.3. Alternative Estimation: Elastic Net Regularization
Our benchmark specification utilizes the LASSO penalty for variable selection. To address potential regularization bias or the “grouped selection” issue associated with highly collinear financial variables, we re-estimate the network using the Elastic Net algorithm, which incorporates both and penalties.
The transition to Elastic Net yields a network topology with high overlap; specifically, over 90% of the significant links identified in the benchmark LASSO model are preserved. The preservation of these primary spillover paths confirms that the identified functional division of labor—and the amplification of geopolitical shocks—is driven by the underlying data rather than the specific shrinkage properties of the LASSO algorithm. This check reinforces the structural validity of the adjacency tensor used throughout our analysis.
4.6.4. Alternative Edge Weight Specifications
In our baseline model, the adjacency tensor retains only the positive part of the estimated coefficients to focus exclusively on risk contagion. To ensure the results are not sensitive to this specification, we conduct robustness tests using absolute values () and signed coefficients to incorporate both risk propagation and potential hedging effects into the network construction.
The results of these alternative specifications are highly consistent with our primary findings. While the absolute levels of aggregate connectivity increase when negative coefficients are included, the temporal dynamics and rankings of systemically important nodes remain largely unchanged. Crucially, the negative predictive relationship between the lagged HHI and subsequent connectivity persists across all weighting schemes. This confirms that positive transmission channels are the primary drivers of the network’s structural evolution, justifying our focus on the positive part of the spillover coefficients in the main analysis.
4.6.5. Summary
Taken together, these robustness checks confirm that the identified patterns of asymmetric tail-risk transmission, endogenous amplification through concentration, and functional differentiation across asset layers are not artifacts of parameter choices or estimation techniques. Instead, they reflect stable structural features of the global financial network.
5. Conclusions
5.1. Research Conclusions and Contributions
This study provides a comprehensive empirical analysis of the transmission structure and dynamic evolution of global financial tail risk from 2012 to 2025. Based on the multilayer network estimation and subsequent econometric tests, the primary findings are summarized as follows:
First, the multilayer network architecture exhibits a pronounced hierarchy and significant time-varying dynamics. The LASSO-penalized quantile regression identifies a high-dimensional structure where risk transmission intensity spikes during market distress. Crucially, the empirical results show that the weight of interlayer cross-market spillovers increases significantly relative to intralayer links during periods of extreme stress. This underscores the effectiveness of the multilayer framework in identifying cross-market coupling and cascading effects that single-layer models typically overlook.
Second, the system is characterized by a persistent directional asymmetry in risk roles. The empirical evidence identifies the United States as a primary risk exporter and a critical systemic hub across all market layers. In contrast, emerging markets and geopolitically sensitive nodes, particularly Russia, frequently function as risk absorbers. These roles are observed to shift in response to exogenous shocks—such as the 2014 and 2022 geopolitical crises—where the directional flow of international tail risk reconfigures to reflect heightened regional vulnerabilities.
Third, the analysis establishes the predictive capacity of network concentration as a prospective structural indicator. Time-series regressions reveal a significant negative association between the lagged Herfindahl–Hirschman Index (HHI) of systemic importance and subsequent total network connectivity. This predictive association, particularly at a two-period lag, suggests that as systemic importance pools within a few pivotal hubs, the architecture becomes increasingly fragile. The results support the structural hypothesis that extreme polarization serves as a precursor to a decline in aggregate connectivity and a loss of systemic resilience.
Fourth, cross-asset transmission patterns identify the sovereign bond market as the primary systemic risk receiver. While asset layers maintain distinct identities during stable periods, crisis events trigger a process of structural convergence. In these high-stress scenarios, node importance rankings across the stock, bond, FX, and gold layers tend to synchronize, overriding idiosyncratic market factors. This observed failure of market segmentation is associated with a sharp decline in cross-asset diversification benefits, providing an empirical basis for the observed fragility of traditional portfolio strategies during acute crises.
5.2. Policy Implications and Recommendations
The empirical findings regarding multilayer risk propagation and structural evolution offer several critical implications for macroprudential regulation.
First, regulators should implement a “Systemic Impact Surcharge” based on multilayer centrality indicators. Our results identify a persistent directional asymmetry where the United States and Eurozone function as primary Risk Exporters with high PageRank Versatility. Consequently, international regulatory bodies (e.g., the FSB) should utilize multilayer centrality measures, rather than simple size-based metrics, to calibrate capital buffers. For nodes identified as systemic hubs across multiple layers, authorities should impose higher counter-cyclical capital requirements. Furthermore, given the observed shift in risk roles during geopolitical shocks, regulators must dynamicize their “Risk Absorber” monitoring list, ensuring that emerging economies have sufficient liquidity buffers to withstand the documented spike in interlayer spillovers during regional distress.
Second, the identified lead–lag relationship between the HHI and connectivity should be operationalized as a “Structural Fragility Early Warning System”. Our empirical evidence demonstrates that a rise in the HHI of systemic importance serves as a reliable precursor to a decline in network connectivity and increased fragility. Regulators should institutionalize the HHI as a core monitoring index to detect the “polarization effect.” Specifically, when the concentration of PageRank Versatility exceeds a predefined historical threshold, an alert should be triggered. This two-period lead time allows for preemptive macroprudential interventions before the network undergoes the structural reconfiguration or systemic collapse characterized by extreme synchronization. For example, tightening margin requirements or restricting cross-market leverage can mitigate the build-up of systemic imbalances.
Third, the sovereign bond market requires a dedicated “Cross-layer Contagion Buffer” to mitigate its role as a primary risk receiver. The finding that the bond market is the ultimate destination for global tail risk highlights a critical vulnerability in the international financial architecture. Macroprudential authorities should monitor the participation coefficient of institutional investors in the bond layer to detect early signs of structural convergence. During periods of rising HHI, regulators should anticipate the failure of equity-bond diversification and prepare for fire-sale dynamics. To counter this, central banks could establish interlayer liquidity facilities specifically targeted at stabilizing the bond market when cross-asset synchronization exceeds crisis-level thresholds, thereby preventing idiosyncratic market failures from escalating into systemic liquidity droughts.
Finally, for global institutional investors, the observed structural synchronization necessitates a shift toward network-aware asset allocation. Our results indicate that during high-HHI regimes, traditional diversification strategies are likely to fail due to cross-layer ranking convergence. Investors should incorporate interlayer connectivity metrics into their Value-at-Risk (VaR) models. During episodes where HHI signals impending fragility, shifting allocations toward assets with proven “risk-isolation” properties, such as gold, is recommended. Moreover, institutional risk management frameworks should utilize our multilayer framework to simulate the cascading failure paths identified in the empirical analysis, moving beyond static correlation matrices toward dynamic, topology-based stress testing.
5.3. Limitations and Future Research
While this study provides a comprehensive framework for analyzing multilayer tail spillovers, several limitations should be acknowledged to define the empirical boundaries of the findings.
First, the identified relationship between network concentration (HHI) and aggregate connectivity is a predictive association rather than a definitive causal identification. Although the use of lagged variables () and dynamic specifications helps mitigate contemporaneous feedback, it does not fully resolve endogeneity or establish a structural causal mechanism. Our findings should be interpreted as a structural hypothesis for anticipatory monitoring, where the HHI serves as a diagnostic precursor rather than a proven driver of network reconfiguration. Future research could employ quasi-experimental designs or high-frequency identification to further isolate exogenous shocks from endogenous feedback loops.
Second, the empirical scope is constrained by the limited country sample. This study focuses on 11 major economies (e.g., US, Russia, India, and European nations) to ensure data consistency across all four market layers. While these nodes represent a significant portion of global systemic risk, the exclusion of frontier markets and smaller emerging economies may limit the generalizability of our findings regarding global topology. Expanding the node set to a more diverse range of countries would clarify whether the observed polarization effects are consistent across different economic scales.
Third, the construction of the multilayer network is based exclusively on positive spillover coefficients. In the LASSO-penalized quantile regression, edges are defined by positive risk transmission, representing the propagation of downside tail shocks. However, this approach ignores potential negative coefficients, which could represent hedging effects or cross-market diversification benefits. Incorporating both positive and negative links in a signed network framework remains a promising avenue to capture a more holistic view of systemic stability and resilience.
Beyond these core limitations, future research could explore several directions:
Asset Universe Expansion: Incorporating emerging asset classes, such as cryptocurrencies, to evaluate their role in risk propagation.
Machine Learning Integration: Using advanced algorithms to identify heterogeneous transmission pathways specific to different shock archetypes, such as monetary policy shifts or pandemic-related crises.
Policy Impact Quantification: Measuring how specific macroprudential regulations explicitly decouple systemic hubs within the adjacency tensor.
Author Contributions
Conceptualization, J.X. and Y.L.; methodology, J.X. and Y.L.; software, J.X.; validation, J.X.; formal analysis, J.X.; investigation, J.X.; resources, J.X.; data curation, J.X.; writing—original draft preparation, J.X.; writing—review and editing, J.X. and Y.L.; visualization, J.X.; supervision, J.X.; project administration, J.X.; funding acquisition, Y.L. All authors have read and agreed to the published version of the manuscript.
Funding
This research was funded by the National Natural Science Foundation of China, grant number 72371230.
Institutional Review Board Statement
Not applicable.
Informed Consent Statement
Not applicable.
Data Availability Statement
Restrictions apply to the availability of these data. The financial data supporting the findings of this study were obtained from the Wind Financial Terminal and Investing.com. The data from Wind are available from the provider upon subscription, and the data from Investing.com can be accessed freely at www.investing.com.
Conflicts of Interest
The authors declare no conflicts of interest.
Appendix A
To select the tuning parameter in a data-driven manner, we follow the procedure outlined below:
Step 1: Generate T independent random variables from the uniform distribution , independently of the data . For a given quantile level q, compute the statistic:
where is the indicator function and is a scaling parameter for the k-th covariate.
Step 2: Repeat Step 1 independently for iterations to obtain an empirical distribution of conditional on the data W, denoted as . Then, for a given confidence level , define the tuning parameter as:
where denotes the -quantile of the empirical distribution of , and is a predefined constant.
References
- Ando, T.; Greenwood-Nimmo, M.; Shin, Y. Quantile connectedness: Modeling tail behavior in the topology of financial networks. Manag. Sci. 2022, 68, 2401–2431. [Google Scholar] [CrossRef] [Scilit]
- Naveed, M.; Ali, S.; Gubareva, M.; Omri, A. When giants fall: Tracing the ripple effects of Silicon Valley Bank (SVB) collapse on global financial markets. Res. Int. Bus. Financ. 2024, 67, 102160. [Google Scholar] [CrossRef] [Scilit]
- Diebold, F.X.; Yilmaz, K. Better to give than to receive: Predictive directional measurement of volatility spillovers. Int. J. Forecast. 2012, 28, 57–66. [Google Scholar] [CrossRef] [Scilit]
- Adrian, T.; Brunnermeier, M.K. CoVaR; Technical report; National Bureau of Economic Research: Cambridge, MA, USA, 2011. [Google Scholar]
- Belloni, A.; Chernozhukov, V. ℓ1-penalized quantile regression in high-dimensional sparse models. arXiv 2011, arXiv:0904.2931. [Google Scholar] [CrossRef] [Scilit]
- De Domenico, M.; Solé-Ribalta, A.; Cozzo, E.; Kivelä, M.; Moreno, Y.; Porter, M.A.; Gómez, S.; Arenas, A. Mathematical formulation of multilayer networks. Phys. Rev. X 2013, 3, 041022. [Google Scholar] [CrossRef] [Scilit]
- Poledna, S.; Molina-Borboa, J.L.; Martínez-Jaramillo, S.; Van Der Leij, M.; Thurner, S. The multi-layer network nature of systemic risk and its implications for the costs of financial crises. J. Financ. Stab. 2015, 20, 70–81. [Google Scholar] [CrossRef] [Scilit]
- Aleta, A.; Moreno, Y. Multilayer networks in a nutshell. Annu. Rev. Condens. Matter Phys. 2019, 10, 45–62. [Google Scholar] [CrossRef] [Scilit]
- Wang, G.J.; Wan, L.; Feng, Y.; Xie, C.; Uddin, G.S.; Zhu, Y. Interconnected multilayer networks: Quantifying connectedness among global stock and foreign exchange markets. Int. Rev. Financ. Anal. 2023, 86, 102518. [Google Scholar] [CrossRef] [Scilit]
- Cao, J.; Wen, F.; Stanley, H.E.; Wang, X. Multilayer financial networks and systemic importance: Evidence from China. Int. Rev. Financ. Anal. 2021, 78, 101882. [Google Scholar] [CrossRef] [Scilit]
- Xie, Y.; Jiao, F.; Li, S.; Liu, Q.; Tse, Y. Systemic risk in financial institutions: A multiplex network approach. Pac.-Basin Financ. J. 2022, 73, 101752. [Google Scholar] [CrossRef] [Scilit]
- Gao, Q.; Fan, H.; Yu, C. Systemic Importance and Risk Characteristics of Banks Based on a Multi-Layer Financial Network Analysis. Entropy 2024, 26, 378. [Google Scholar] [CrossRef] [Scilit]
- Kenourgios, D.; Samitas, A.; Paltalidis, N. Financial crises and stock market contagion in a multivariate time-varying asymmetric framework. J. Int. Financ. Mark. Inst. Money 2011, 21, 92–106. [Google Scholar] [CrossRef] [Scilit]
- Abduraimova, K. Contagion and tail risk in complex financial networks. J. Bank. Financ. 2022, 143, 106560. [Google Scholar] [CrossRef] [Scilit]
- Chang, D.; Fu, T.; Zhang, W. Cross-industry contagion of systemic financial risks from the perspective of dynamic tail risk network: Evidence from China. Int. J. Financ. Eng. 2025, 12, 2450005. [Google Scholar] [CrossRef] [Scilit]
- Forbes, K.J.; Rigobon, R. No contagion, only interdependence: Measuring stock market comovements. J. Financ. 2002, 57, 2223–2261. [Google Scholar] [CrossRef] [Scilit]
- Beine, M.; Cosma, A.; Vermeulen, R. The dark side of global integration: Increasing tail dependence. J. Bank. Financ. 2010, 34, 184–192. [Google Scholar] [CrossRef] [Scilit]
- Hong, Y.; Liu, Y.; Wang, S. Granger causality in risk and detection of extreme risk spillover between financial markets. J. Econom. 2009, 150, 271–287. [Google Scholar] [CrossRef] [Scilit]
- Iloskics, Z.; Sebestyén, T.; Braun, E. Shock propagation channels behind the global economic contagion network. The role of economic sectors and the direction of trade. PLoS ONE 2021, 16, e0258309. [Google Scholar] [CrossRef] [Scilit]
- Giglio, S.; Kelly, B.; Pruitt, S. Systemic risk and the macroeconomy: An empirical evaluation. J. Financ. Econ. 2016, 119, 457–471. [Google Scholar] [CrossRef] [Scilit]
- Hautsch, N.; Schaumburg, J.; Schienle, M. Financial network systemic risk contributions. Rev. Financ. 2015, 19, 685–738. [Google Scholar] [CrossRef] [Scilit]
- Nguyen, L.H.; Lambe, B.J. International tail risk connectedness: Network and determinants. J. Int. Financ. Mark. Inst. Money 2021, 72, 101332. [Google Scholar] [CrossRef] [Scilit]
- Barsky, R.B.; Miron, J.A. The seasonal cycle and the business cycle. J. Political Econ. 1989, 97, 503–534. [Google Scholar] [CrossRef] [Scilit]
- Bekaert, G.; Hodrick, R.J.; Zhang, X. International stock return comovements. J. Financ. 2009, 64, 2591–2626. [Google Scholar] [CrossRef] [Scilit]
- Ilmanen, A. Stock-bond correlations. J. Fixed Income 2003, 13, 55. [Google Scholar] [CrossRef] [Scilit]
- Vayanos, D. Flight to Quality, Flight to Liquidity, and the Pricing of Risk. 2004. Available online: https://www.nber.org/system/files/working_papers/w10327/w10327.pdf (accessed on 14 March 2026).
- Brunnermeier, M.K.; Pedersen, L.H. Market liquidity and funding liquidity. Rev. Financ. Stud. 2009, 22, 2201–2238. [Google Scholar] [CrossRef] [Scilit]
- Caballero, R.J.; Krishnamurthy, A. Collective risk management in a flight to quality episode. J. Financ. 2008, 63, 2195–2230. [Google Scholar] [CrossRef] [Scilit]
- Baur, D.G.; McDermott, T.K. Is gold a safe haven? International evidence. J. Bank. Financ. 2010, 34, 1886–1898. [Google Scholar] [CrossRef] [Scilit]
- Lane, P.R.; Milesi-Ferretti, G.M. The external wealth of nations mark II: Revised and extended estimates of foreign assets and liabilities, 1970–2004. J. Int. Econ. 2007, 73, 223–250. [Google Scholar] [CrossRef] [Scilit]
- Adrian, T.; Shin, H.S. Liquidity and leverage. J. Financ. Intermediat. 2010, 19, 418–437. [Google Scholar] [CrossRef] [Scilit]
- Elliott, M.; Golub, B.; Jackson, M.O. Financial networks and contagion. Am. Econ. Rev. 2014, 104, 3115–3153. [Google Scholar] [CrossRef] [Scilit]
- Acemoglu, D.; Ozdaglar, A.; Tahbaz-Salehi, A. Systemic risk and stability in financial networks. Am. Econ. Rev. 2015, 105, 564–608. [Google Scholar] [CrossRef] [Scilit]
- Bargigli, L.; Di Iasio, G.; Infante, L.; Lillo, F.; Pierobon, F. The multiplex structure of interbank networks. Quant. Financ. 2015, 15, 673–691. [Google Scholar] [CrossRef] [Scilit]
- Brummitt, C.D.; Kobayashi, T. Cascades in multiplex financial networks with debts of different seniority. Phys. Rev. E 2015, 91, 062813. [Google Scholar] [CrossRef] [Scilit] [PubMed]
- Chen, L.; Zhu, Y.; Meng, F.; Liu, R.R. Catastrophic cascade of failures in interdependent hypergraphs. Chaos Interdiscip. J. Nonlinear Sci. 2024, 34, 043148. [Google Scholar] [CrossRef] [Scilit] [PubMed]
- Bardoscia, M.; Barucca, P.; Battiston, S.; Caccioli, F.; Cimini, G.; Garlaschelli, D.; Saracco, F.; Squartini, T.; Caldarelli, G. The physics of financial networks. Nat. Rev. Phys. 2021, 3, 490–507. [Google Scholar] [CrossRef] [Scilit]
- Pichler, A.; Poledna, S.; Thurner, S. Systemic risk-efficient asset allocations: Minimization of systemic risk as a network optimization problem. J. Financ. Stab. 2021, 52, 100809. [Google Scholar] [CrossRef] [Scilit]
- Brin, S.; Page, L. The anatomy of a large-scale hypertextual web search engine. Comput. Netw. ISDN Syst. 1998, 30, 107–117. [Google Scholar] [CrossRef] [Scilit]
- del Rio-Chanona, R.M.; Korniyenko, Y.; Patnam, M.; Porter, M.A. The multiplex nature of global financial contagions. Appl. Netw. Sci. 2020, 5, 74. [Google Scholar] [CrossRef] [Scilit]
- Billio, M.; Getmansky, M.; Lo, A.W.; Pelizzon, L. Econometric measures of connectedness and systemic risk in the finance and insurance sectors. J. Financ. Econ. 2012, 104, 535–559. [Google Scholar] [CrossRef] [Scilit]
- Goldstein, M. The Asian Financial Crisis: Causes, Cures, and Systemic Implications; Peterson Institute: Washington, DC, USA, 1998; Volume 55. [Google Scholar]
- Musmeci, N.; Nicosia, V.; Aste, T.; Di Matteo, T.; Latora, V. The multiplex dependency structure of financial markets. Complexity 2017, 2017, 9586064. [Google Scholar] [CrossRef] [Scilit]
- Undheim, T.A.; Ahmad, T. Visualizing Cascading Risk Effects: Organizing Disruptive Forces and Factors Towards a Color-Assisted, Standardized Cascading Risk Effects Framework. 2024. Available online: https://papers.ssrn.com/sol3/papers.cfm?abstract_id=4833759 (accessed on 14 February 2026).
- de la Concha, A.; Martinez-Jaramillo, S.; Carmona, C. Multiplex financial networks: Revealing the level of interconnectedness in the banking system. In Proceedings of the Complex Networks & Their Applications VI: Proceedings of Complex Networks 2017 (The Sixth International Conference on Complex Networks and Their Applications); Springer: Cham, Switzerland, 2018; pp. 1135–1148. [Google Scholar]
- Wang, X.; Zhang, J.; Chen, X.; Zhang, H.; Wong, C.U.I.; Chan, T. Heterogeneous Spillover Networks and Spatial–Temporal Dynamics of Systemic Risk Transmission: Evidence from G20 Financial Risk Stress Index. Mathematics 2025, 13, 1353. [Google Scholar] [CrossRef] [Scilit]
- Le, C.; Dickinson, D.; Le, A. Sovereign risk spillovers: A network approach. J. Financ. Stab. 2022, 60, 101006. [Google Scholar] [CrossRef] [Scilit]
- Salazar-Vélez, K.A.; Llampara-Apaza, A.C.; Lozano-Aguilar, A.J.; Hernández-Cenzano, C.G. Strategic Foresight of Cybersecurity Threats in Peru Toward 2035: Scenarios and Roadmap Based on Delphi and Backcasting. In Proceedings of the 2025 IEEE Colombian Caribbean Conference (C3); IEEE: Piscataway, NJ, USA, 2025; pp. 1–6. [Google Scholar]
- Page, L.; Brin, S.; Motwani, R.; Winograd, T. The PageRank Citation Ranking: Bringing Order to the Web; Technical report; Stanford Infolab: Stanford, CA, USA, 1999. [Google Scholar]
- Wen, T.; Wang, G.J. Volatility connectedness in global foreign exchange markets. J. Multinatl. Financ. Manag. 2020, 54, 100617. [Google Scholar] [CrossRef] [Scilit]
- De Domenico, M.; Solé-Ribalta, A.; Omodei, E.; Gómez, S.; Arenas, A. Ranking in interconnected multilayer networks reveals versatile nodes. Nat. Commun. 2015, 6, 6868. [Google Scholar] [CrossRef] [Scilit]
- Montagna, M.; Kok, C. Multi-Layered Interbank Model for Assessing Systemic Risk; Number 1944, ECB Working Paper; European Central Bank: Frankfurt am Main, Germany, 2016. [Google Scholar]
- Tzavellas, H. A multilayer view of systemic importance and aggregate fluctuations. Int. Econ. Rev. 2023, 64, 1023–1046. [Google Scholar] [CrossRef] [Scilit]
- Onour, I. The impact of COVID-19 pandemic shock on major Asian stock markets: Evidence of decoupling effects. Econ. Consult. 2021, 34. [Google Scholar] [CrossRef] [Scilit]
- Gallegati, M.; Greenwald, B.; Richiardi, M.G.; Stiglitz, J.E. The asymmetric effect of diffusion processes: Risk sharing and contagion. Glob. Econ. J. 2008, 8, 1850141. [Google Scholar] [CrossRef] [Scilit]
- Melo-Velandia, L.F.; Romero, J.V.; Ramírez-González, M.S. The Global Financial Cycle and country risk in emerging markets during stress episodes: A Copula-CoVaR approach. Res. Int. Bus. Financ. 2025, 73, 102601. [Google Scholar] [CrossRef] [Scilit]
- Akinci, O.; Kalemli-Özcan, Ṣ.; Queralto, A. Uncertainty Shocks, Capital Flows, and International Risk Spillovers; Technical report; National Bureau of Economic Research: Cambridge, MA, USA, 2022. [Google Scholar]
- Farrell, H.; Newman, A.L. Weaponized interdependence: How global economic networks shape state coercion. Int. Secur. 2019, 44, 42–79. [Google Scholar] [CrossRef] [Scilit]
- Dreger, C.; Kholodilin, K.A.; Ulbricht, D.; Fidrmuc, J. Between the hammer and the anvil: The impact of economic sanctions and oil prices on Russia’s ruble. J. Comp. Econ. 2016, 44, 295–308. [Google Scholar] [CrossRef] [Scilit]
- Pestova, A.; Mamonov, M.; Ongena, S. The Price of War: Macroeconomic Effects of the 2022 Sanctions on Russia. 2022. Available online: https://cepr.org/voxeu/columns/price-war-macroeconomic-effects-2022-sanctions-russia (accessed on 7 February 2026).
- Detering, N.; Meyer-Brandis, T.; Panagiotou, K.; Ritter, D. Systemic risk in networks. In Network Science: An Aerial View; Springer: Cham, Switzerland, 2019; pp. 59–77. [Google Scholar]
- Costantini, M.; Sousa, R.M. What uncertainty does to euro area sovereign bond markets: Flight to safety and flight to quality. J. Int. Money Financ. 2022, 122, 102574. [Google Scholar] [CrossRef] [Scilit]
- Janus, J. Flights to safe assets in bond markets: Evidence from emerging market economies. J. Int. Money Financ. 2023, 139, 102973. [Google Scholar] [CrossRef] [Scilit]
- Gao, Q.; Lv, D.; Jin, X. Systemic risk of multi-layer financial network system under macroeconomic fluctuations. Front. Phys. 2022, 10, 943520. [Google Scholar] [CrossRef] [Scilit]
- Kalemli-Ozcan, S.; Papaioannou, E.; Peydro, J.L. Financial regulation, financial globalization, and the synchronization of economic activity. J. Financ. 2013, 68, 1179–1228. [Google Scholar] [CrossRef] [Scilit]
- Vodenska, I.; Becker, A.P. Interdependence, vulnerability and contagion in financial and economic networks. In New Perspectives and Challenges in Econophysics and Sociophysics; Springer: Cham, Switzerland, 2019; pp. 101–116. [Google Scholar]
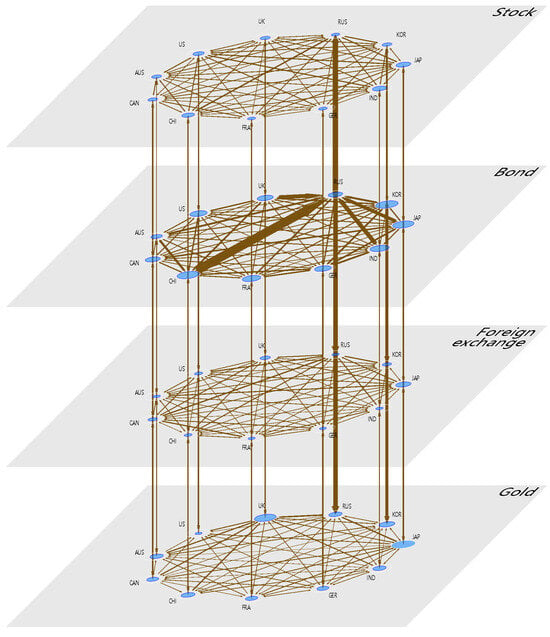
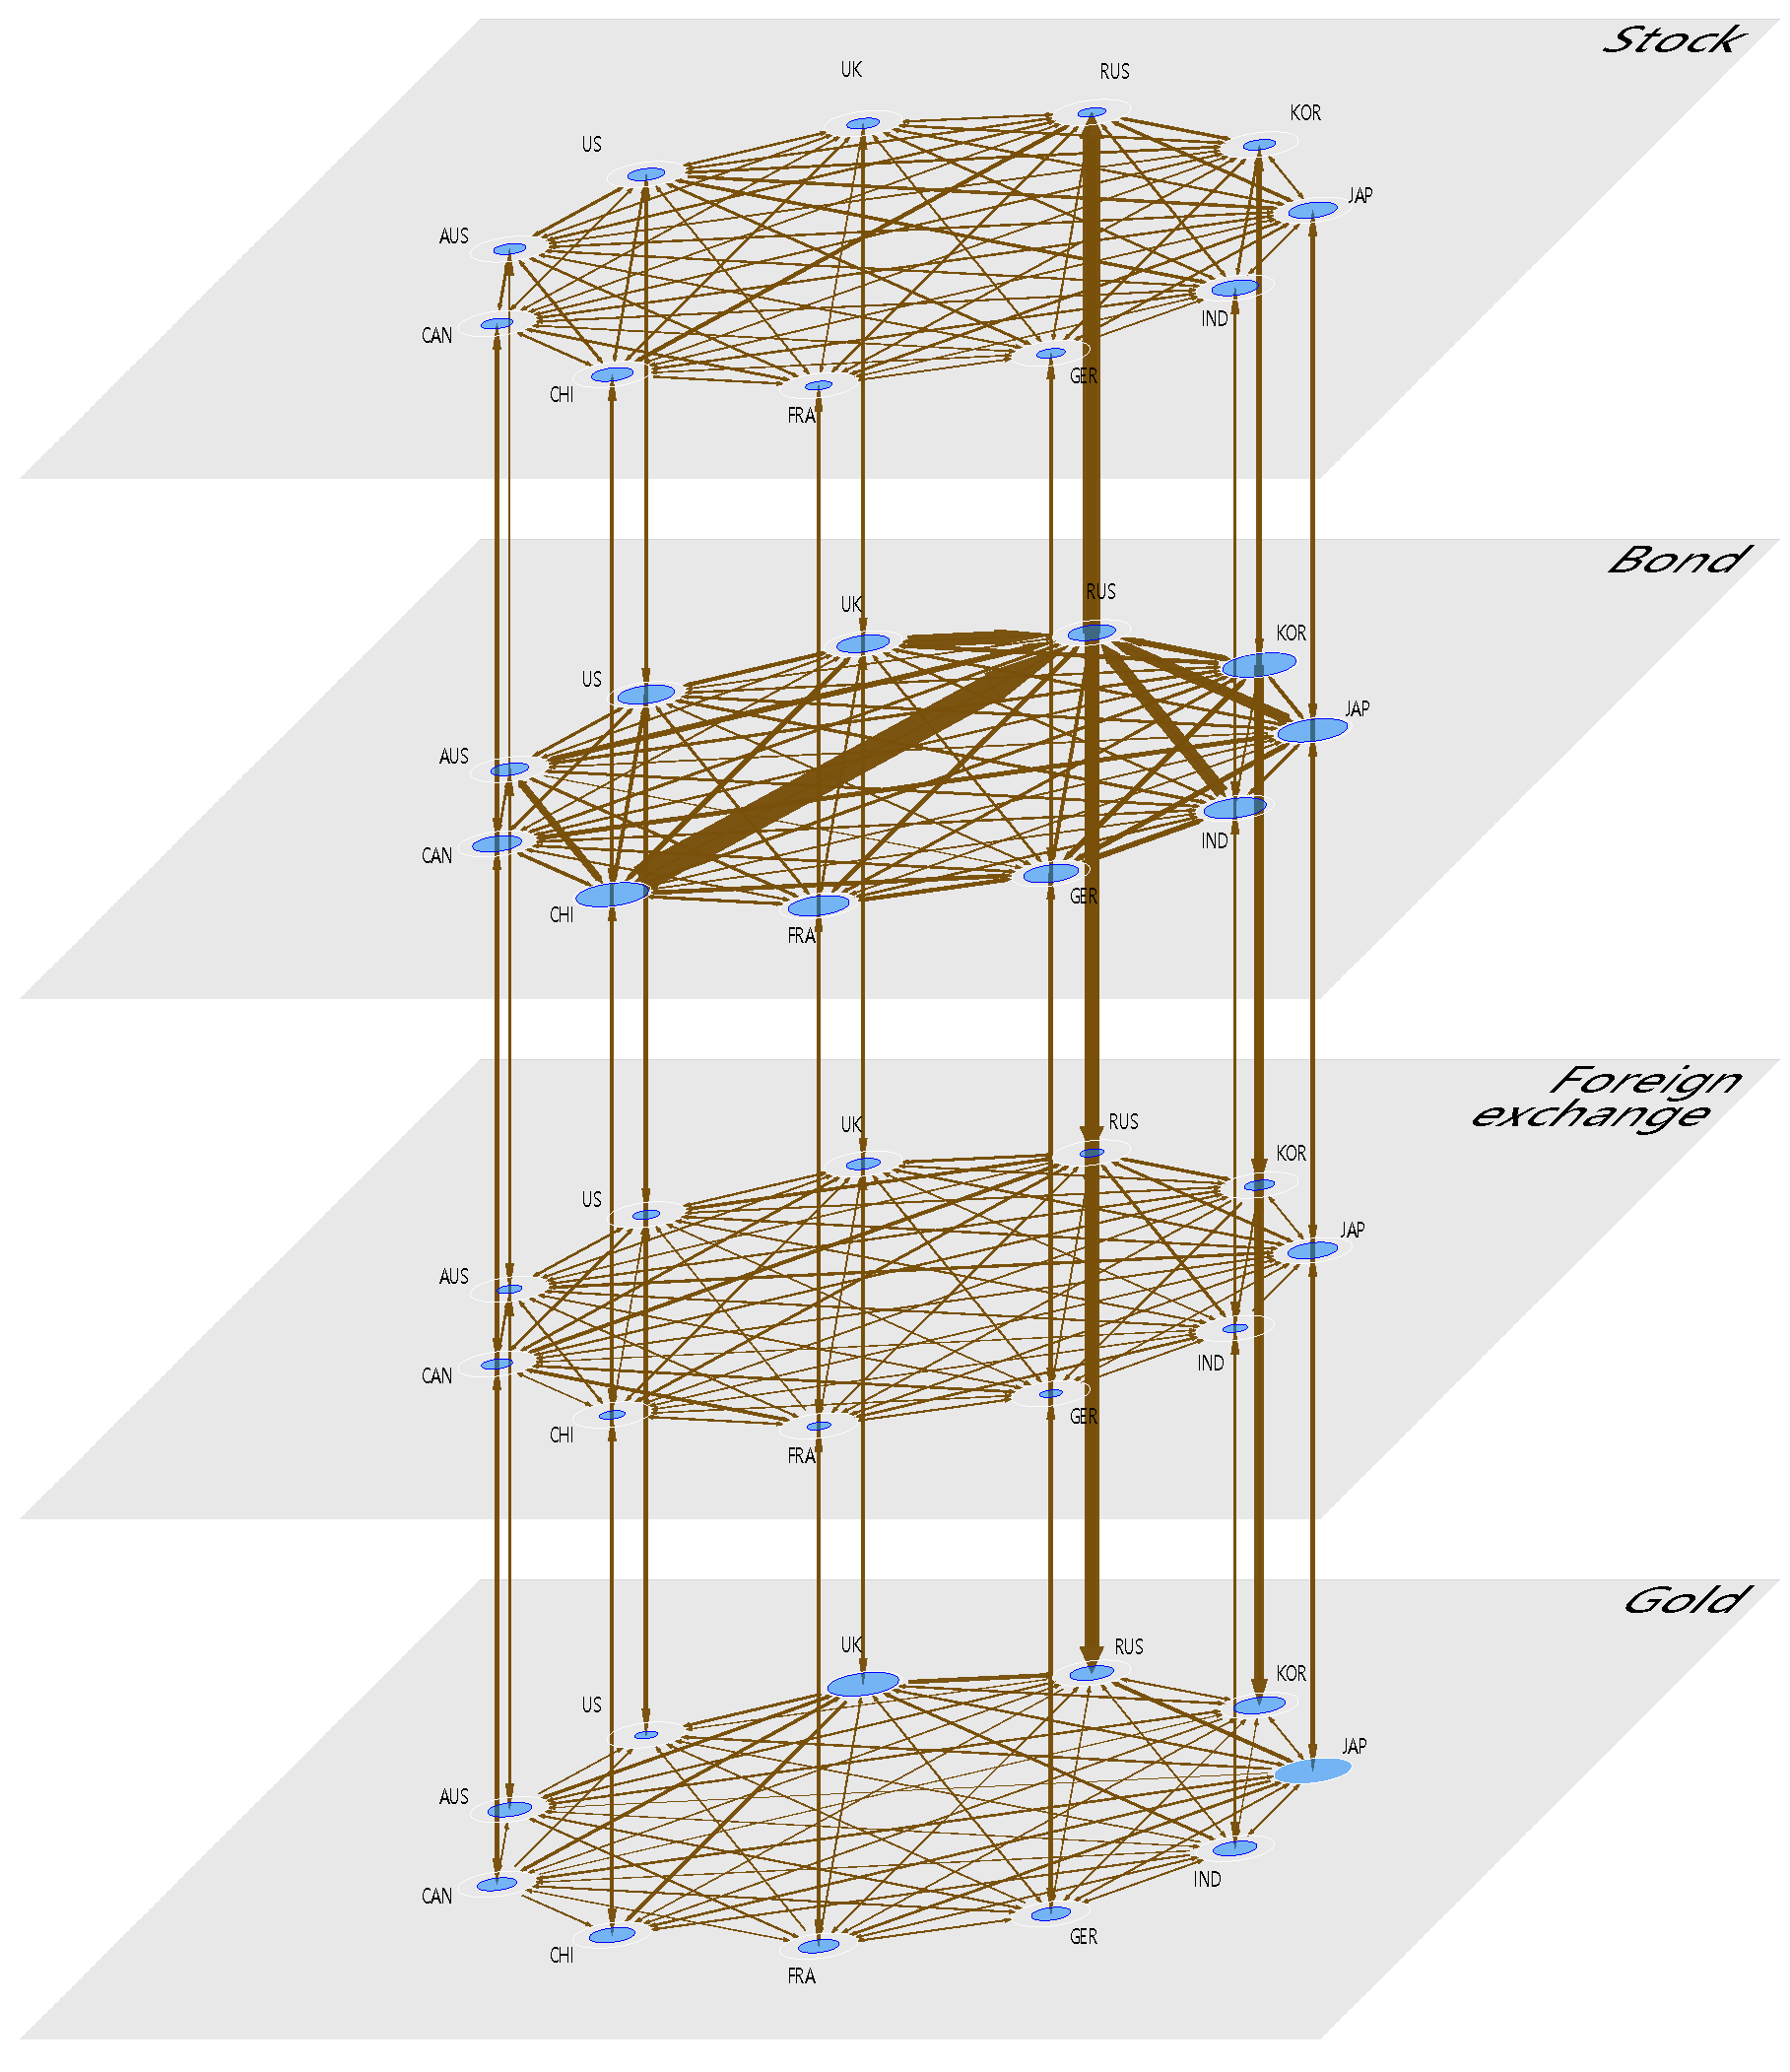
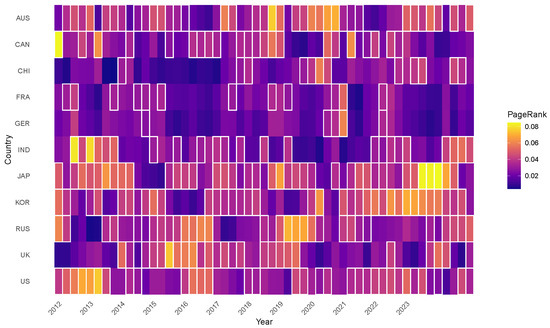
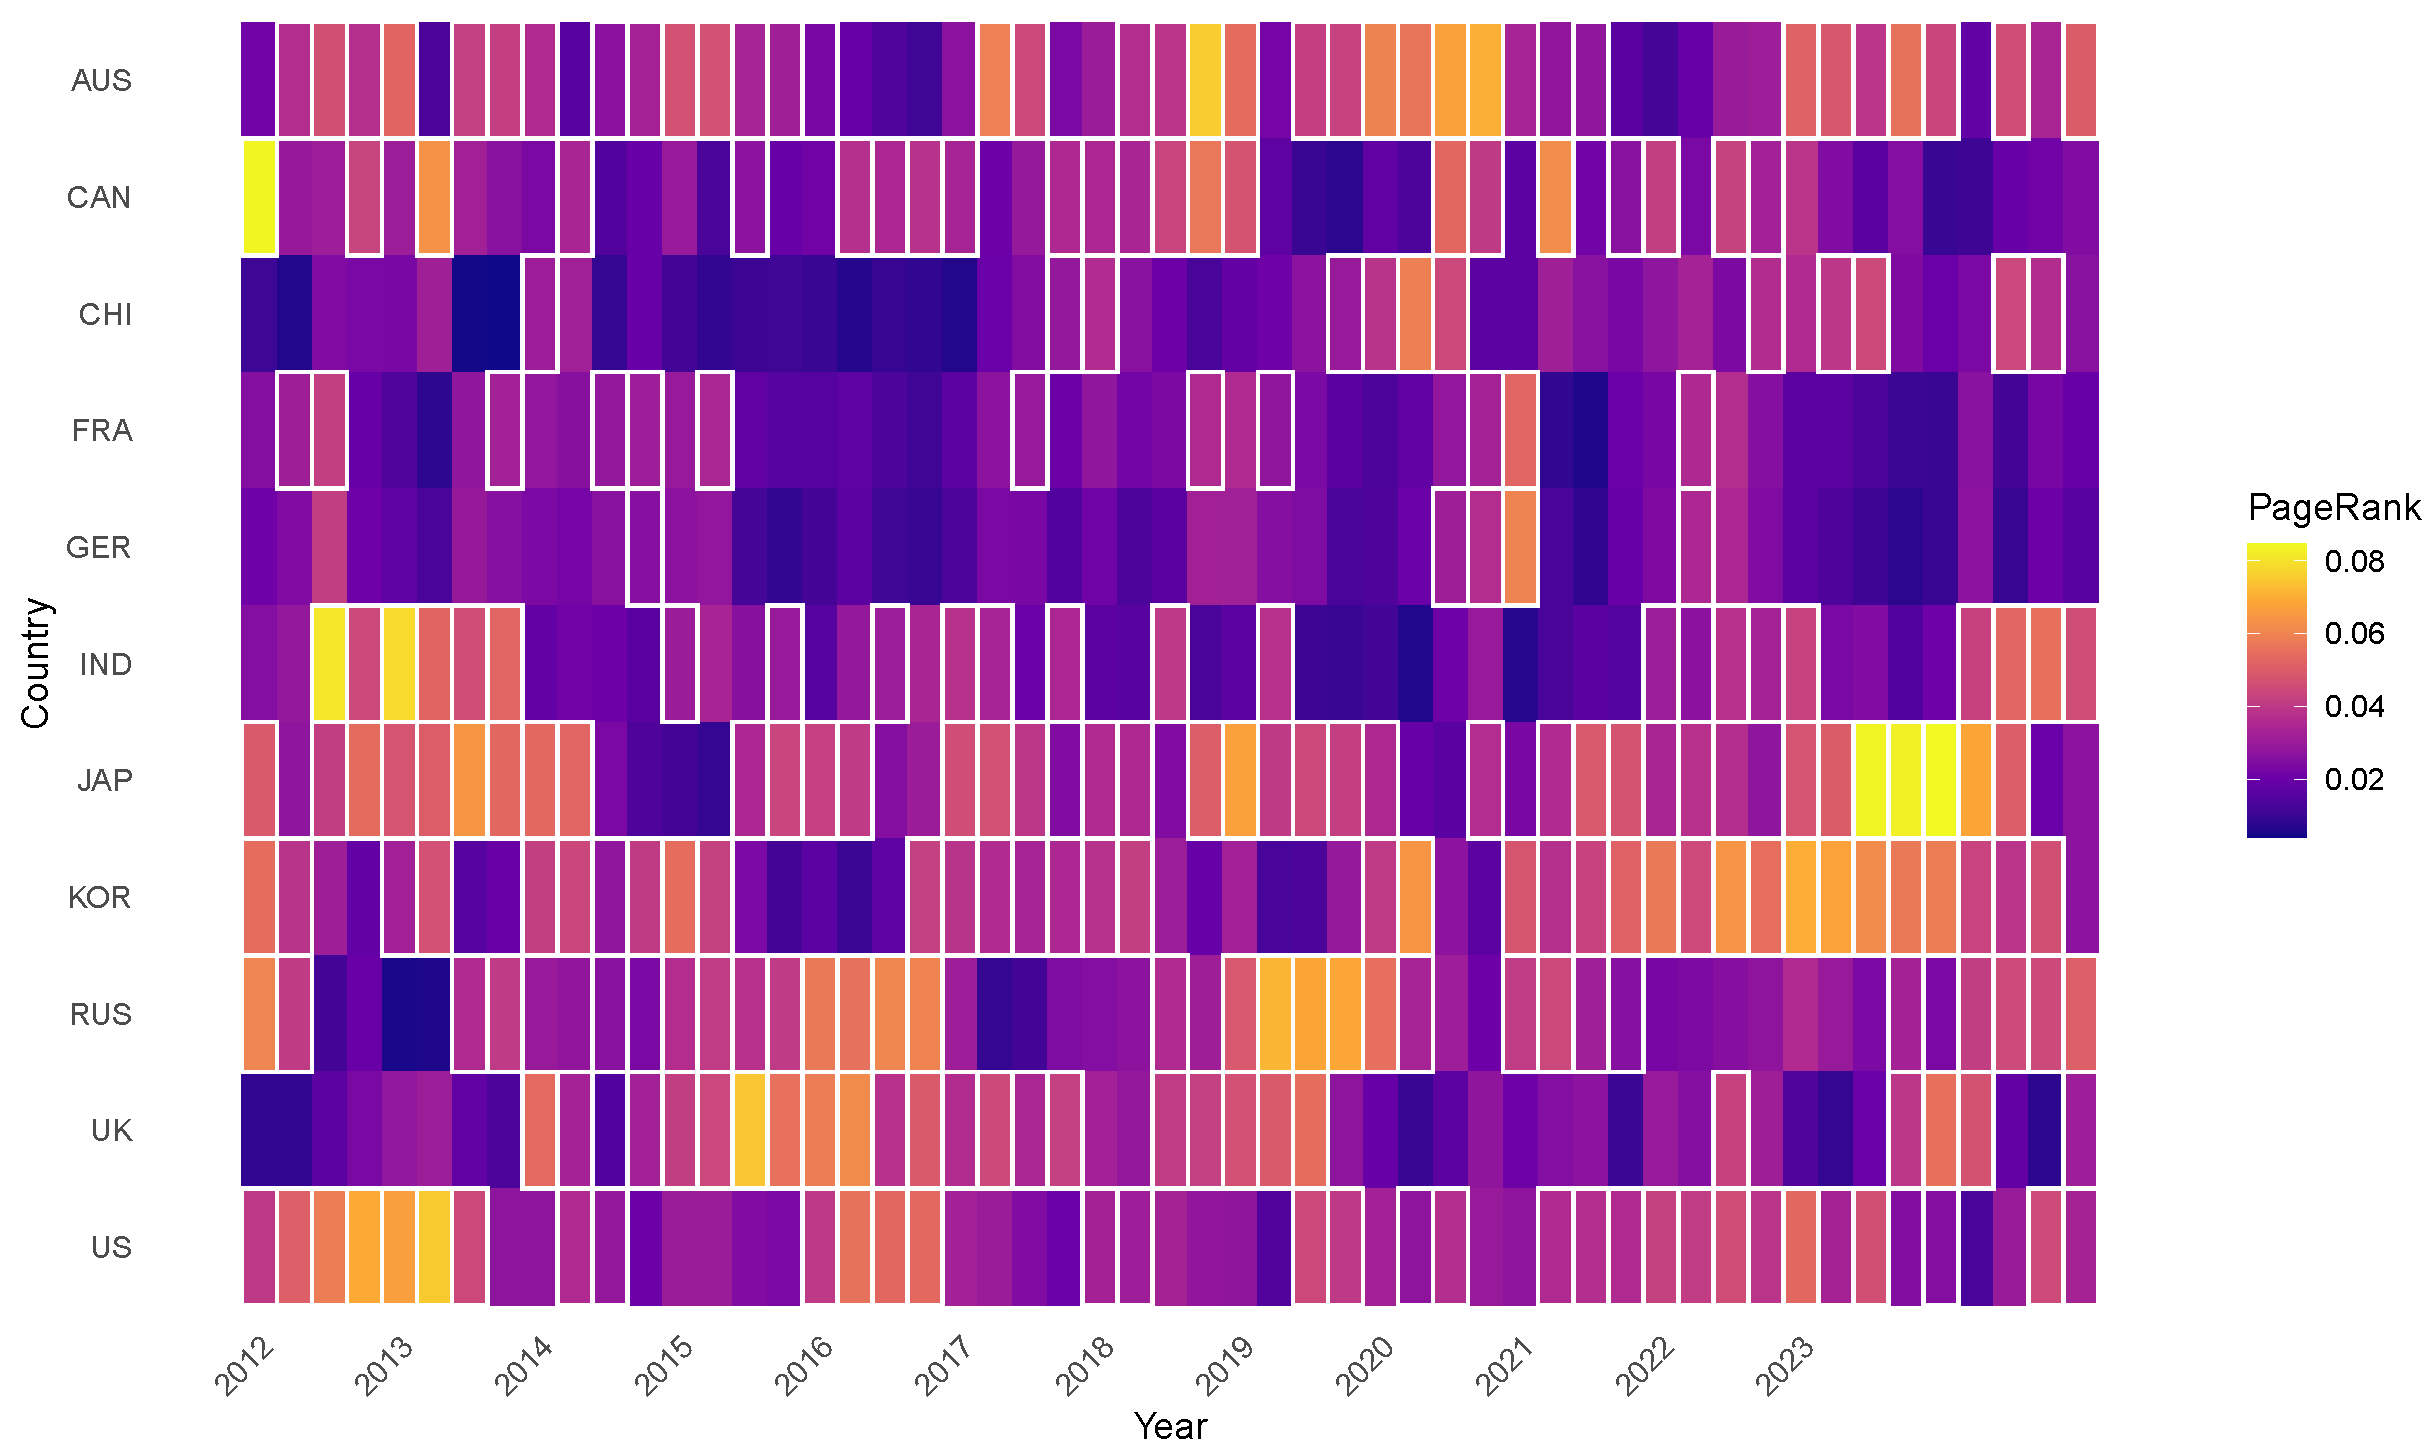
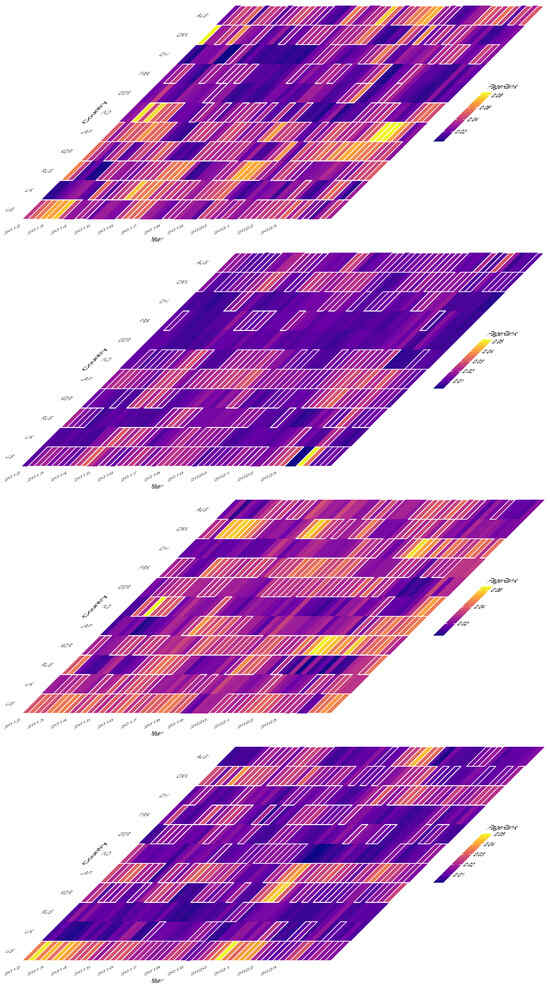
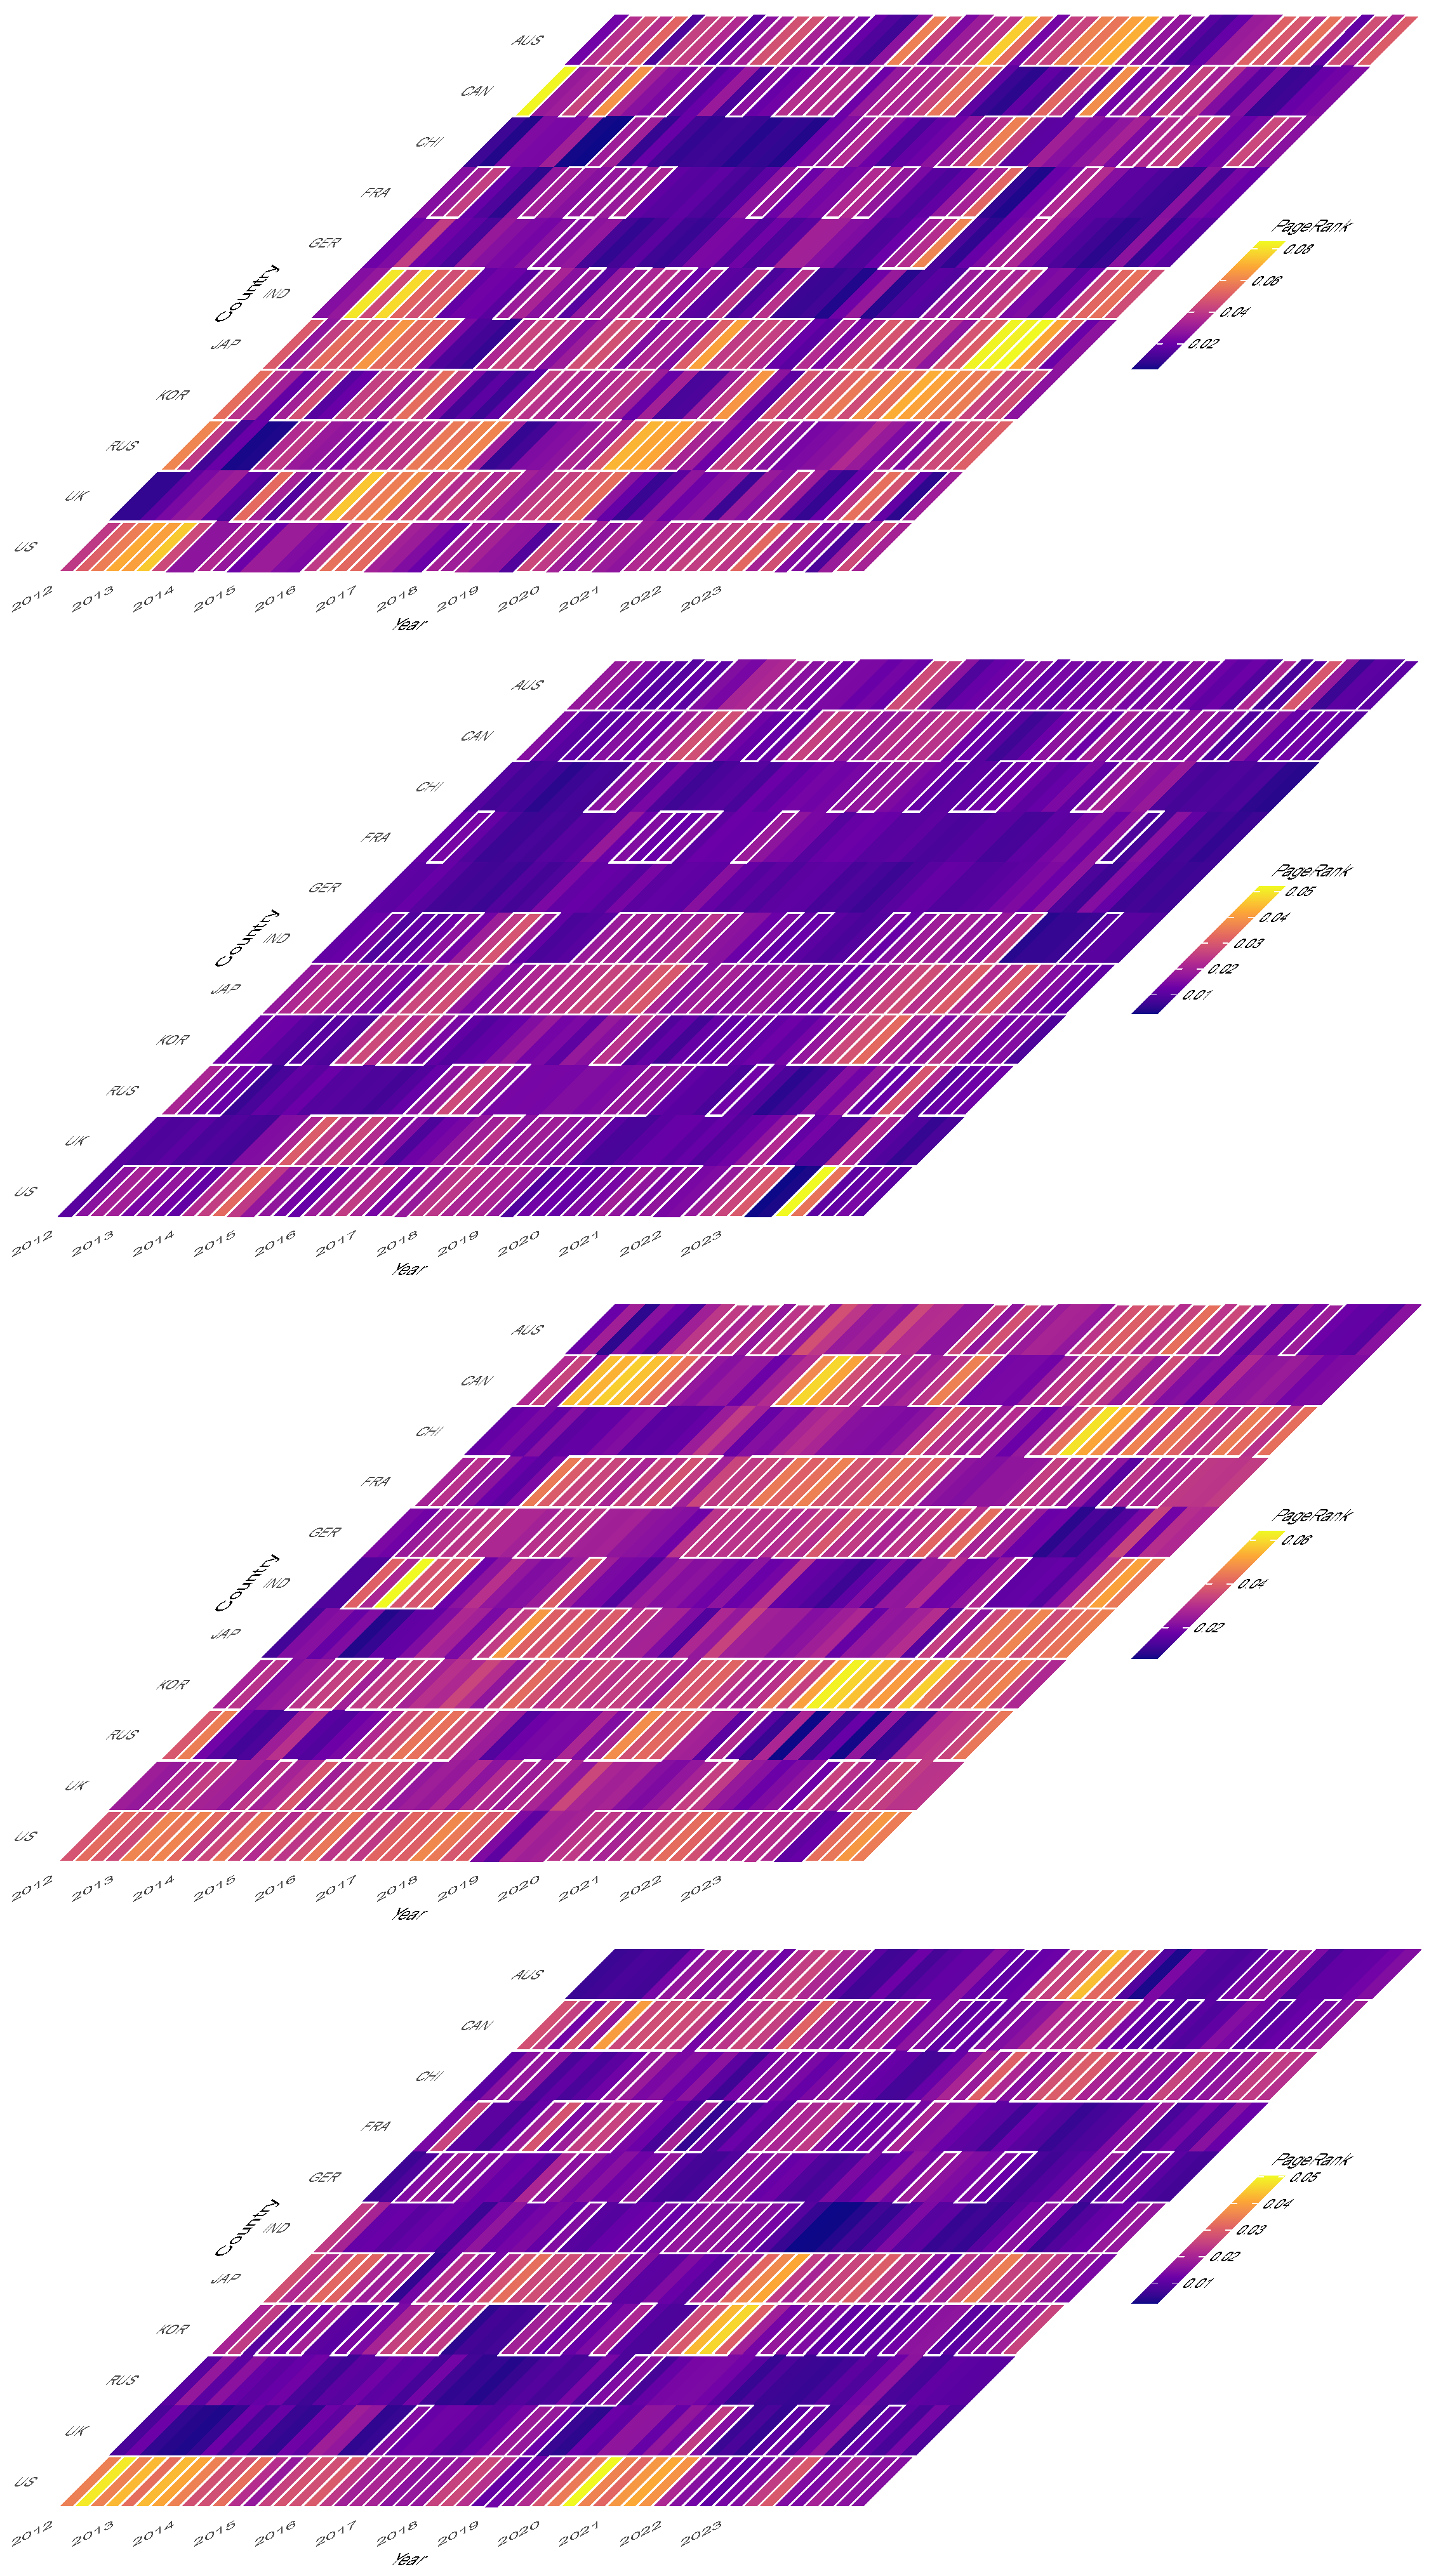
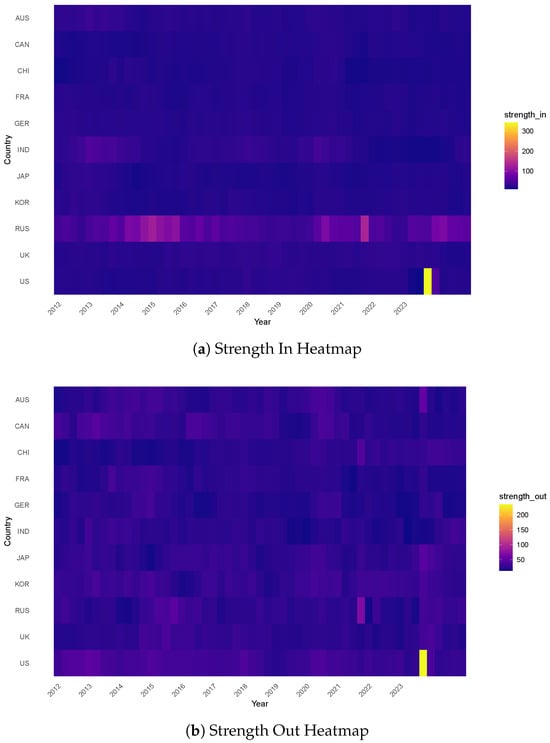
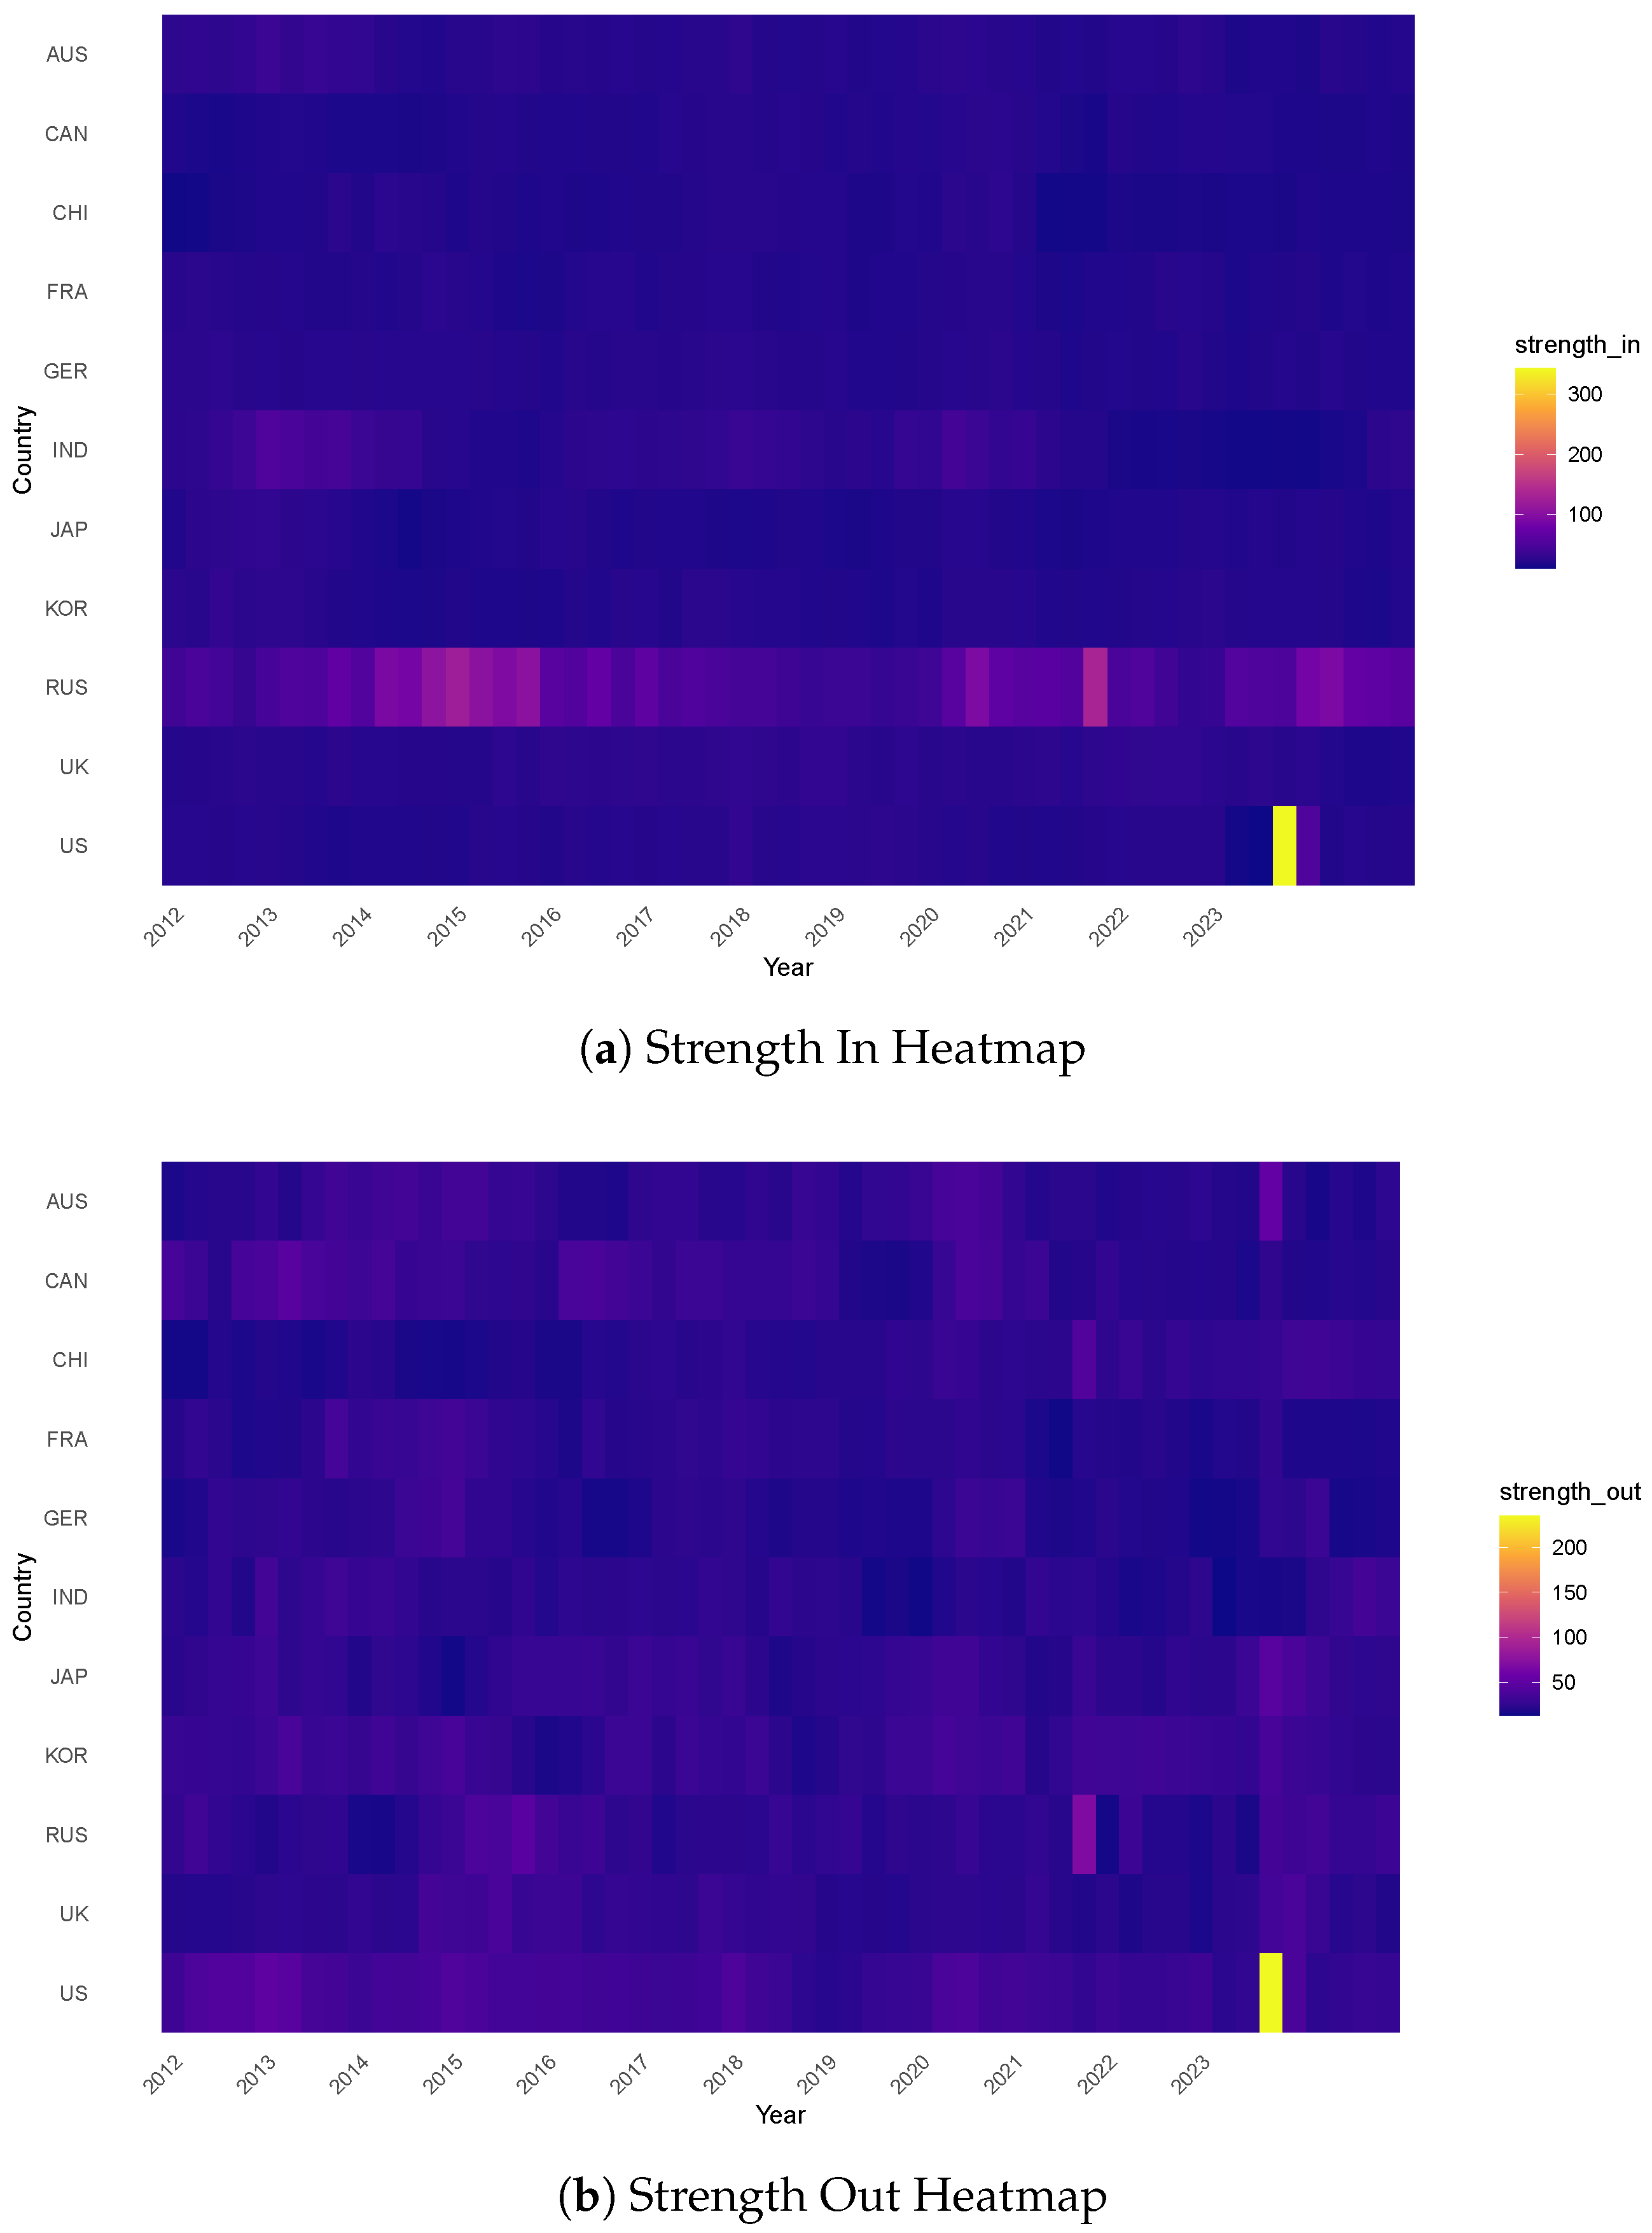
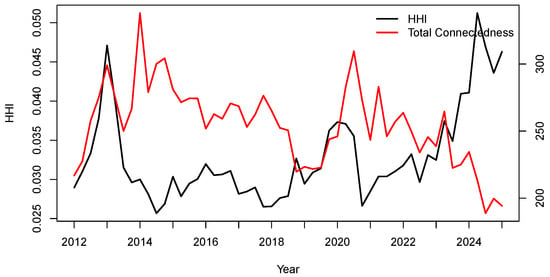
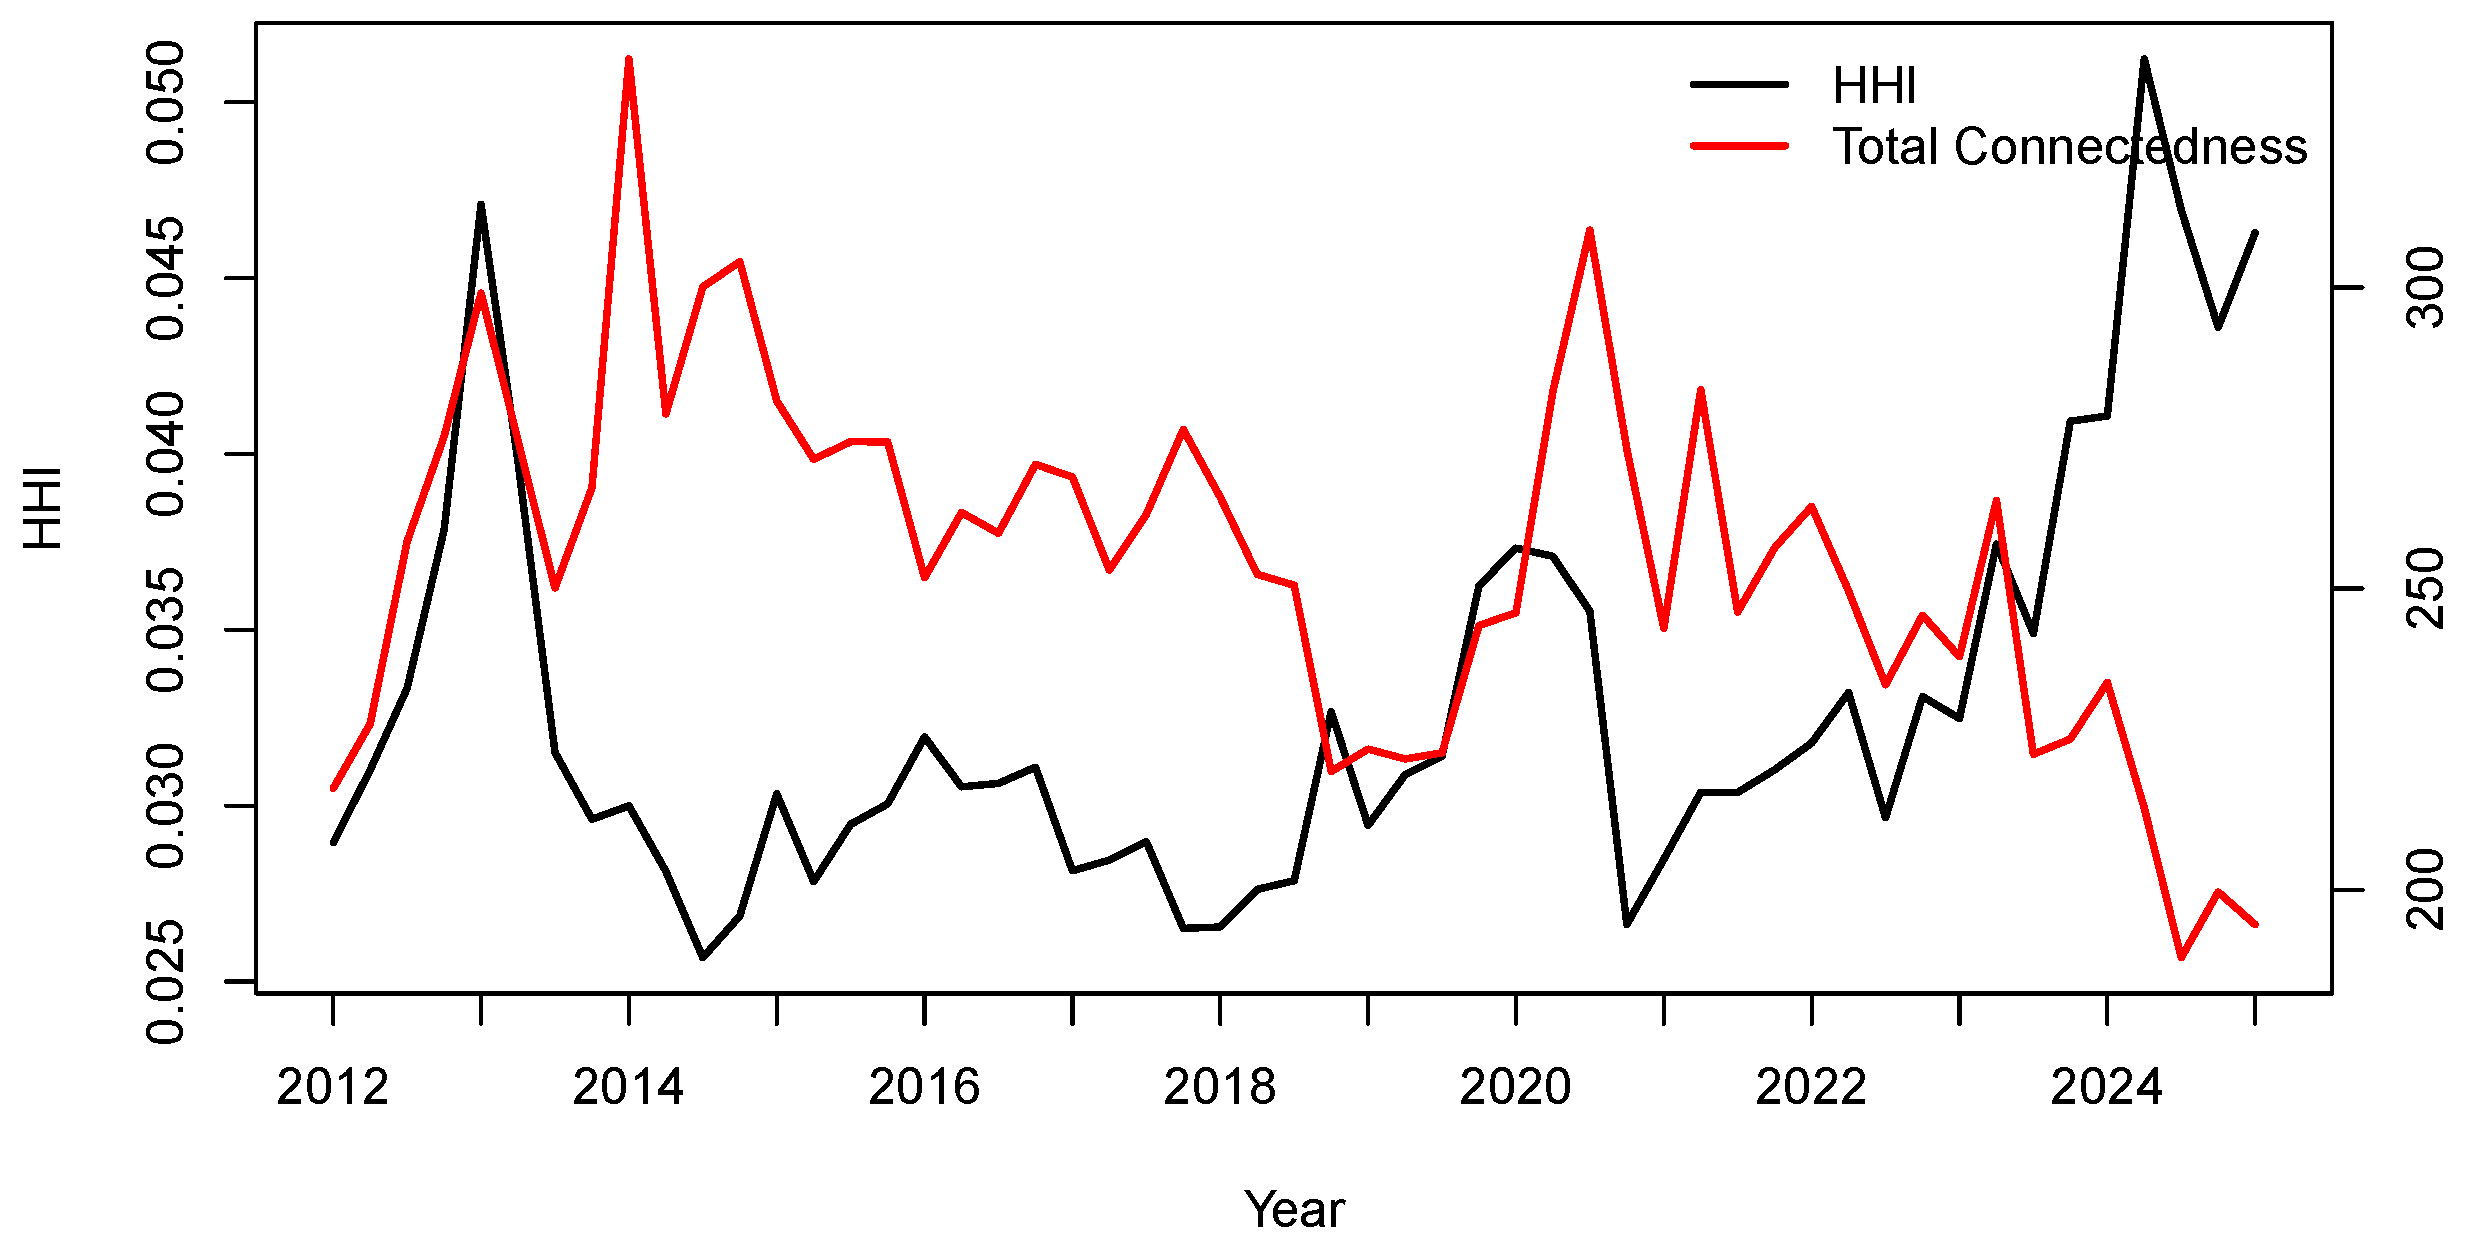
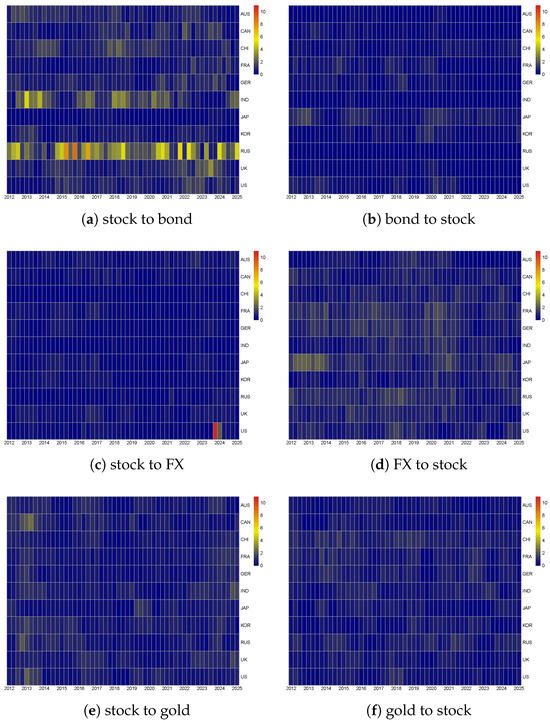
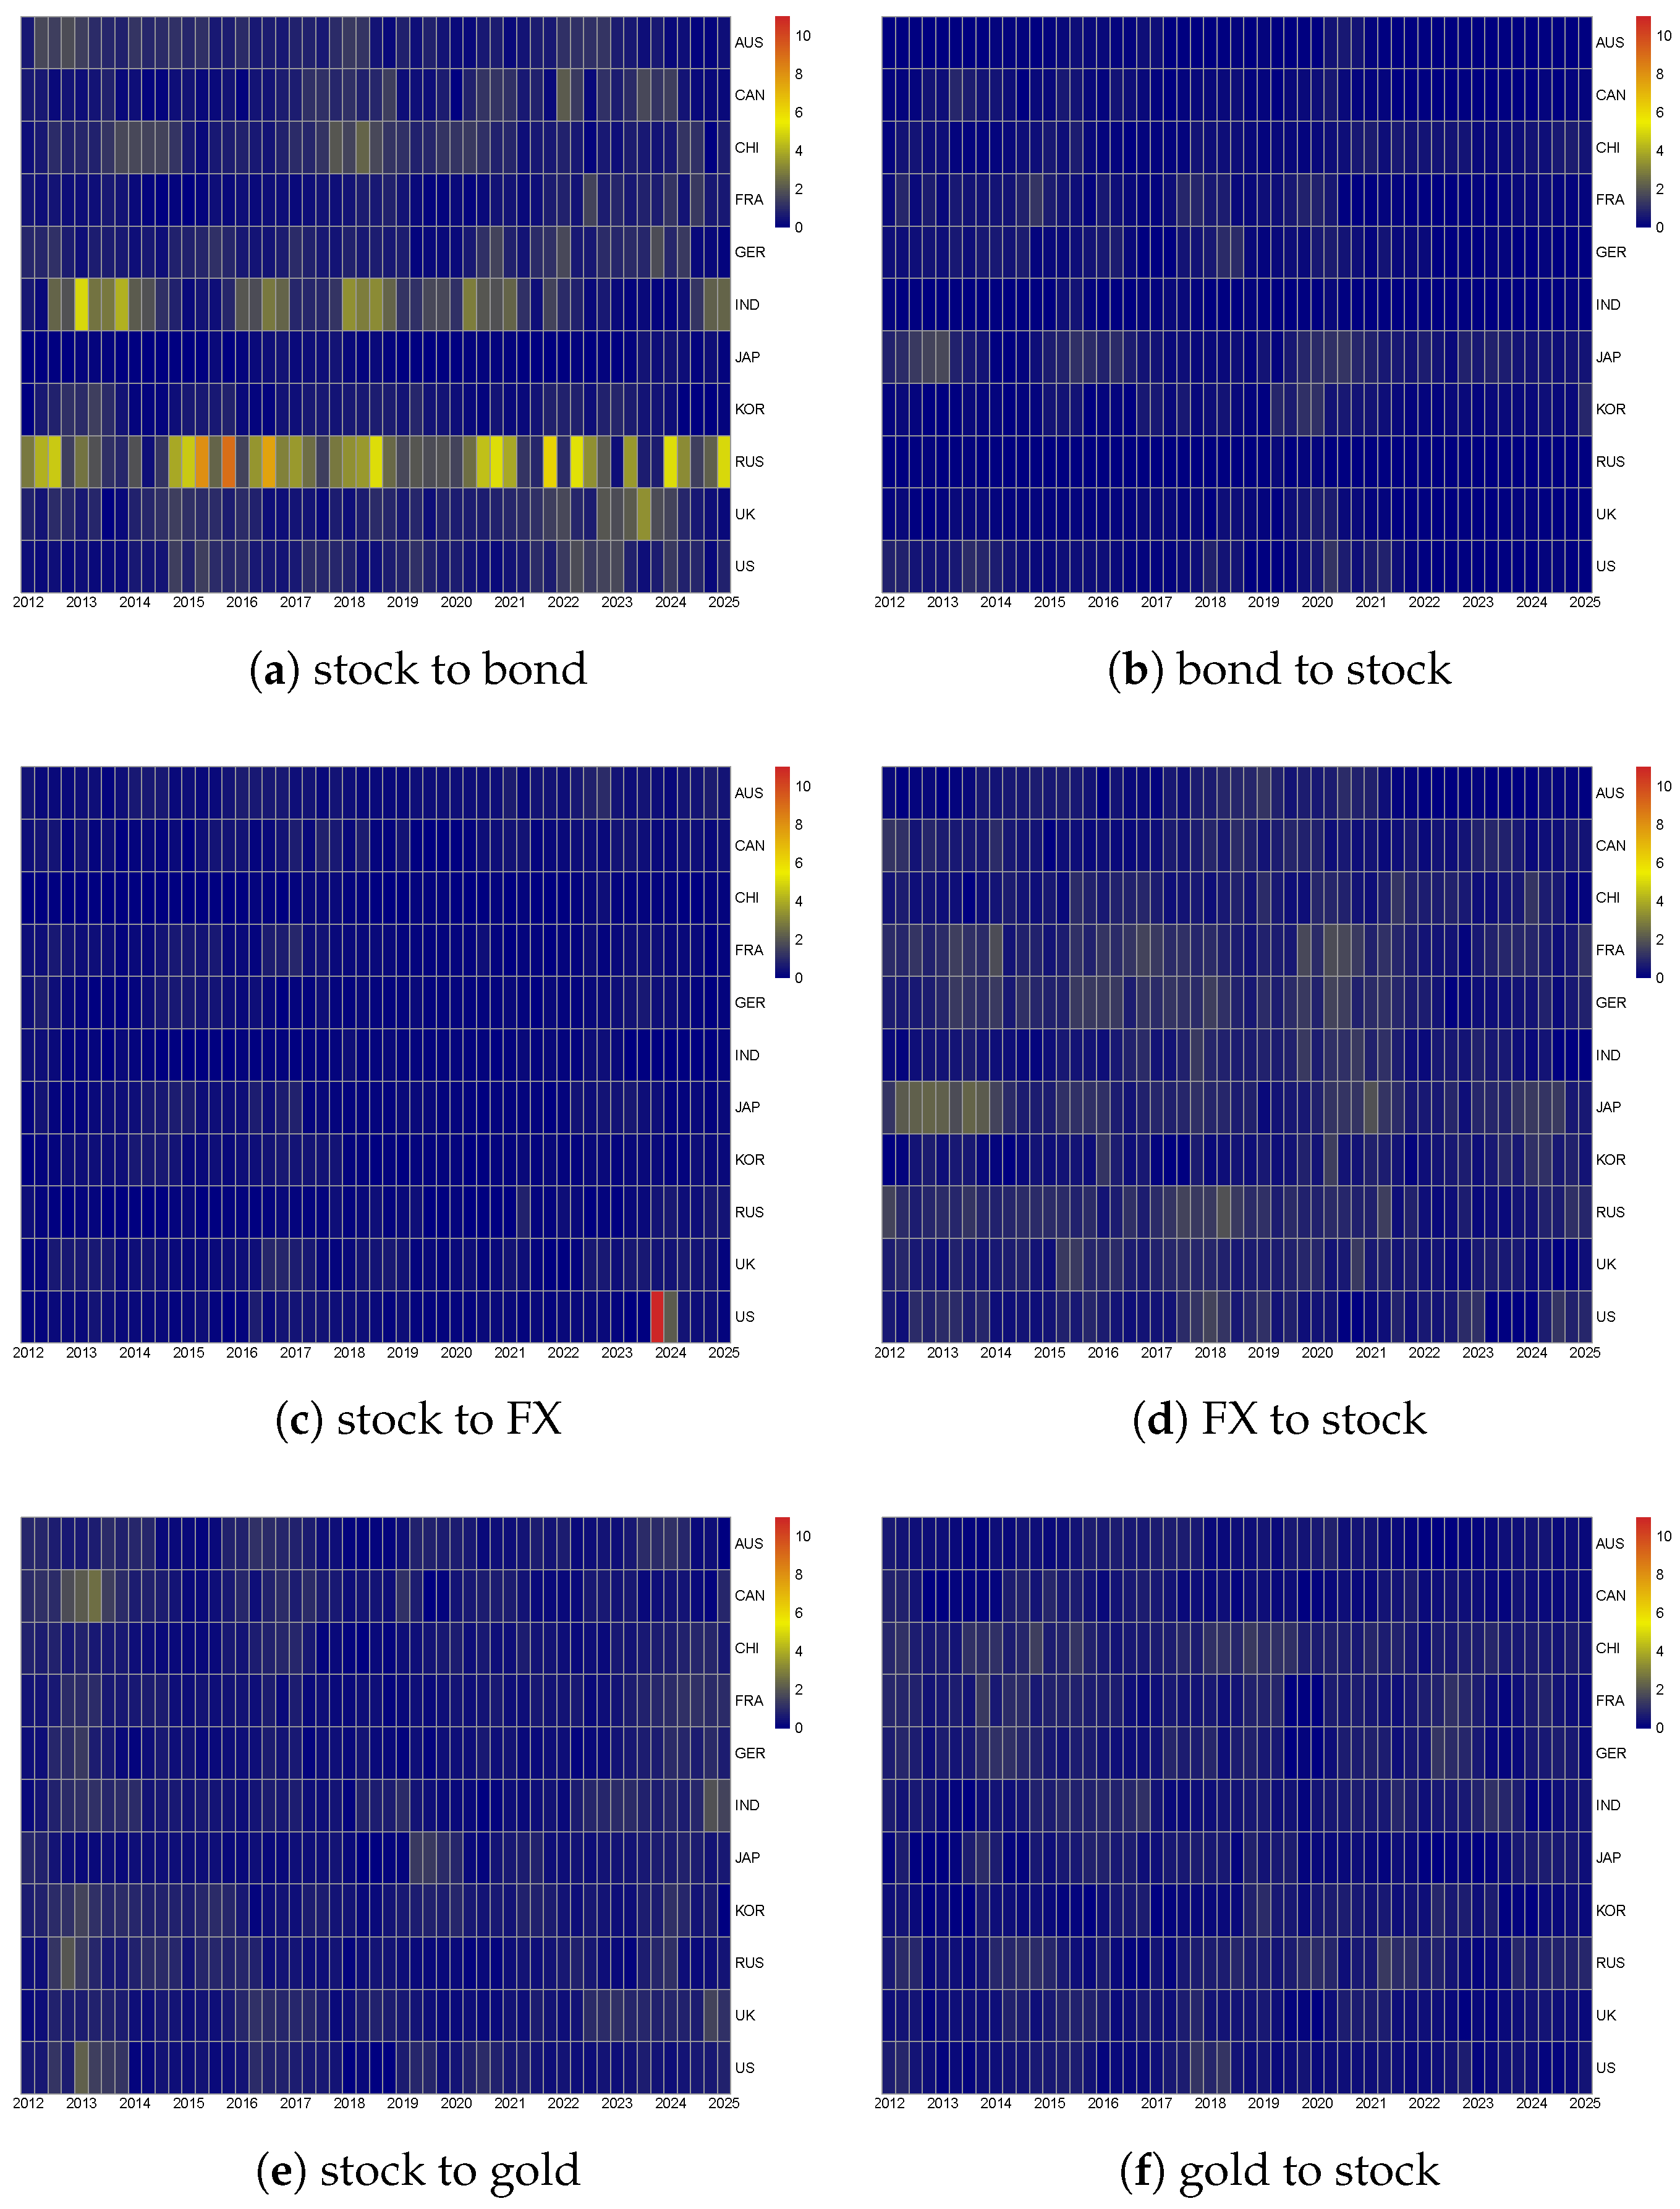
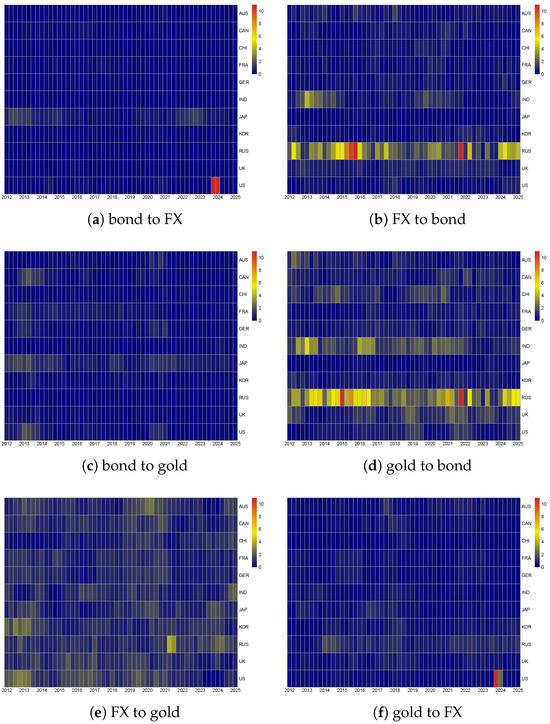
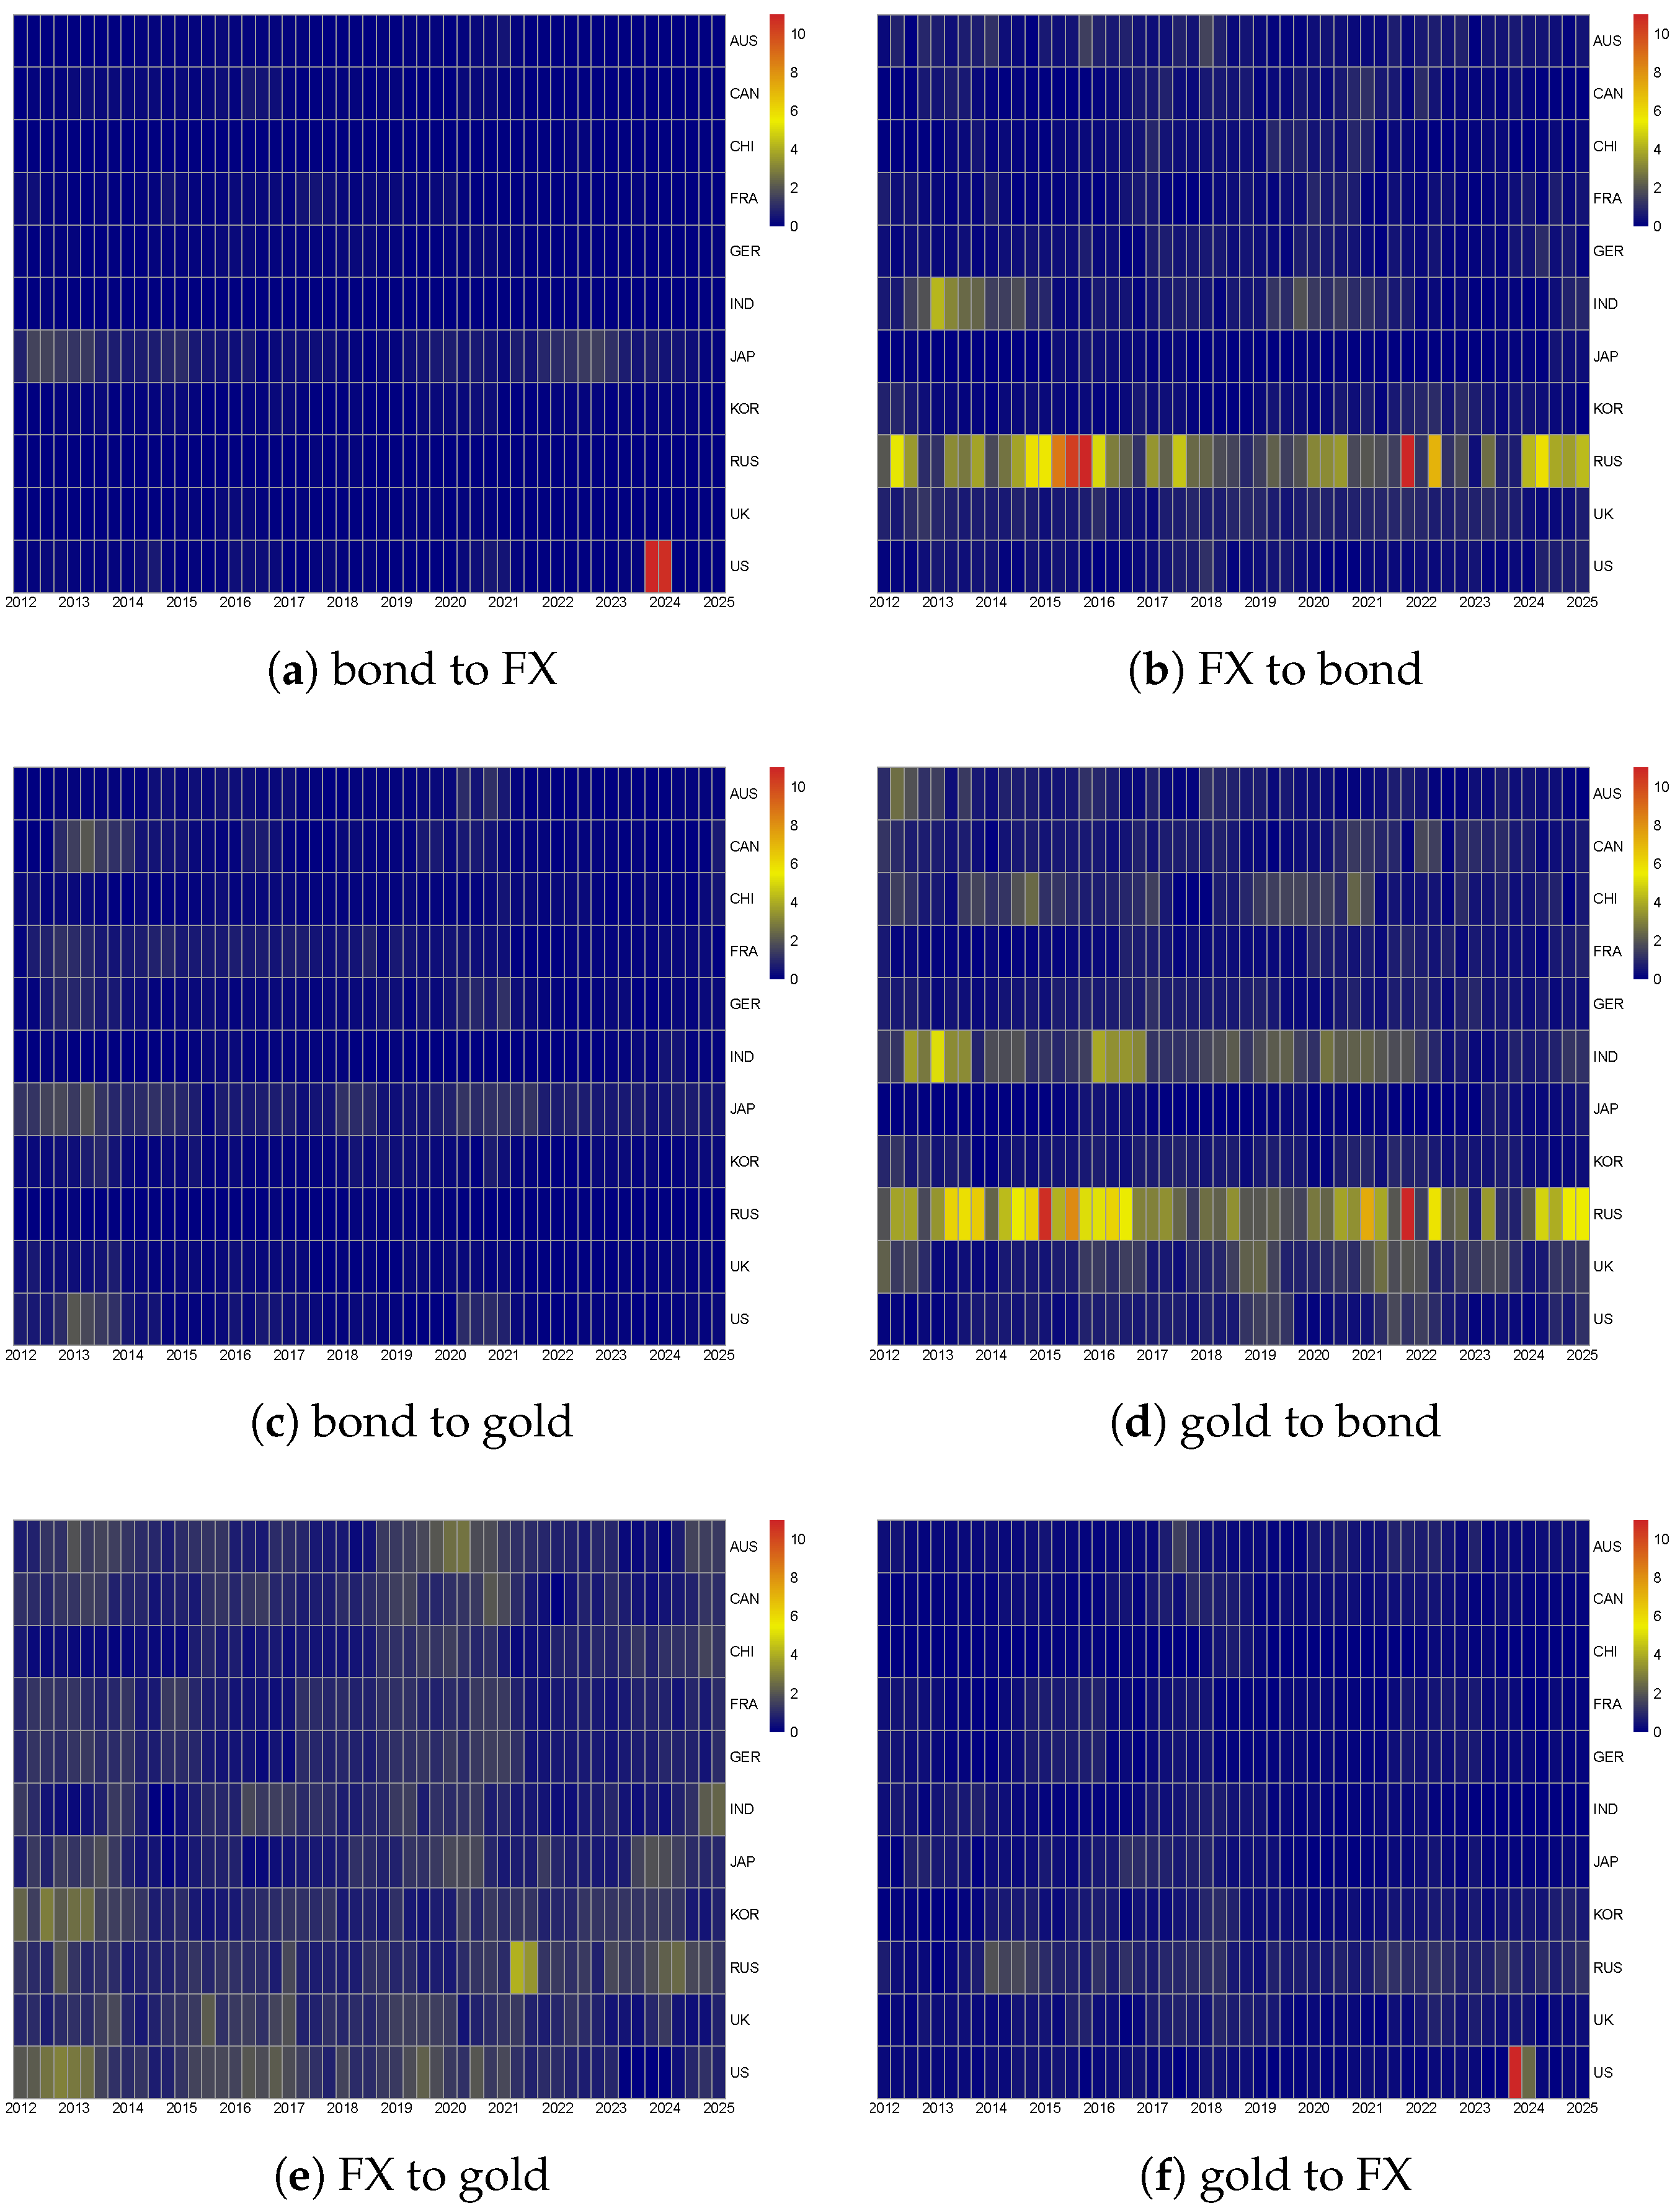
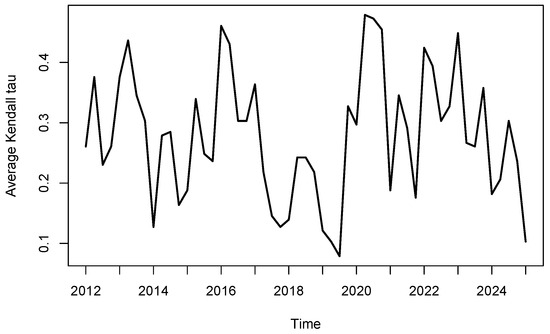
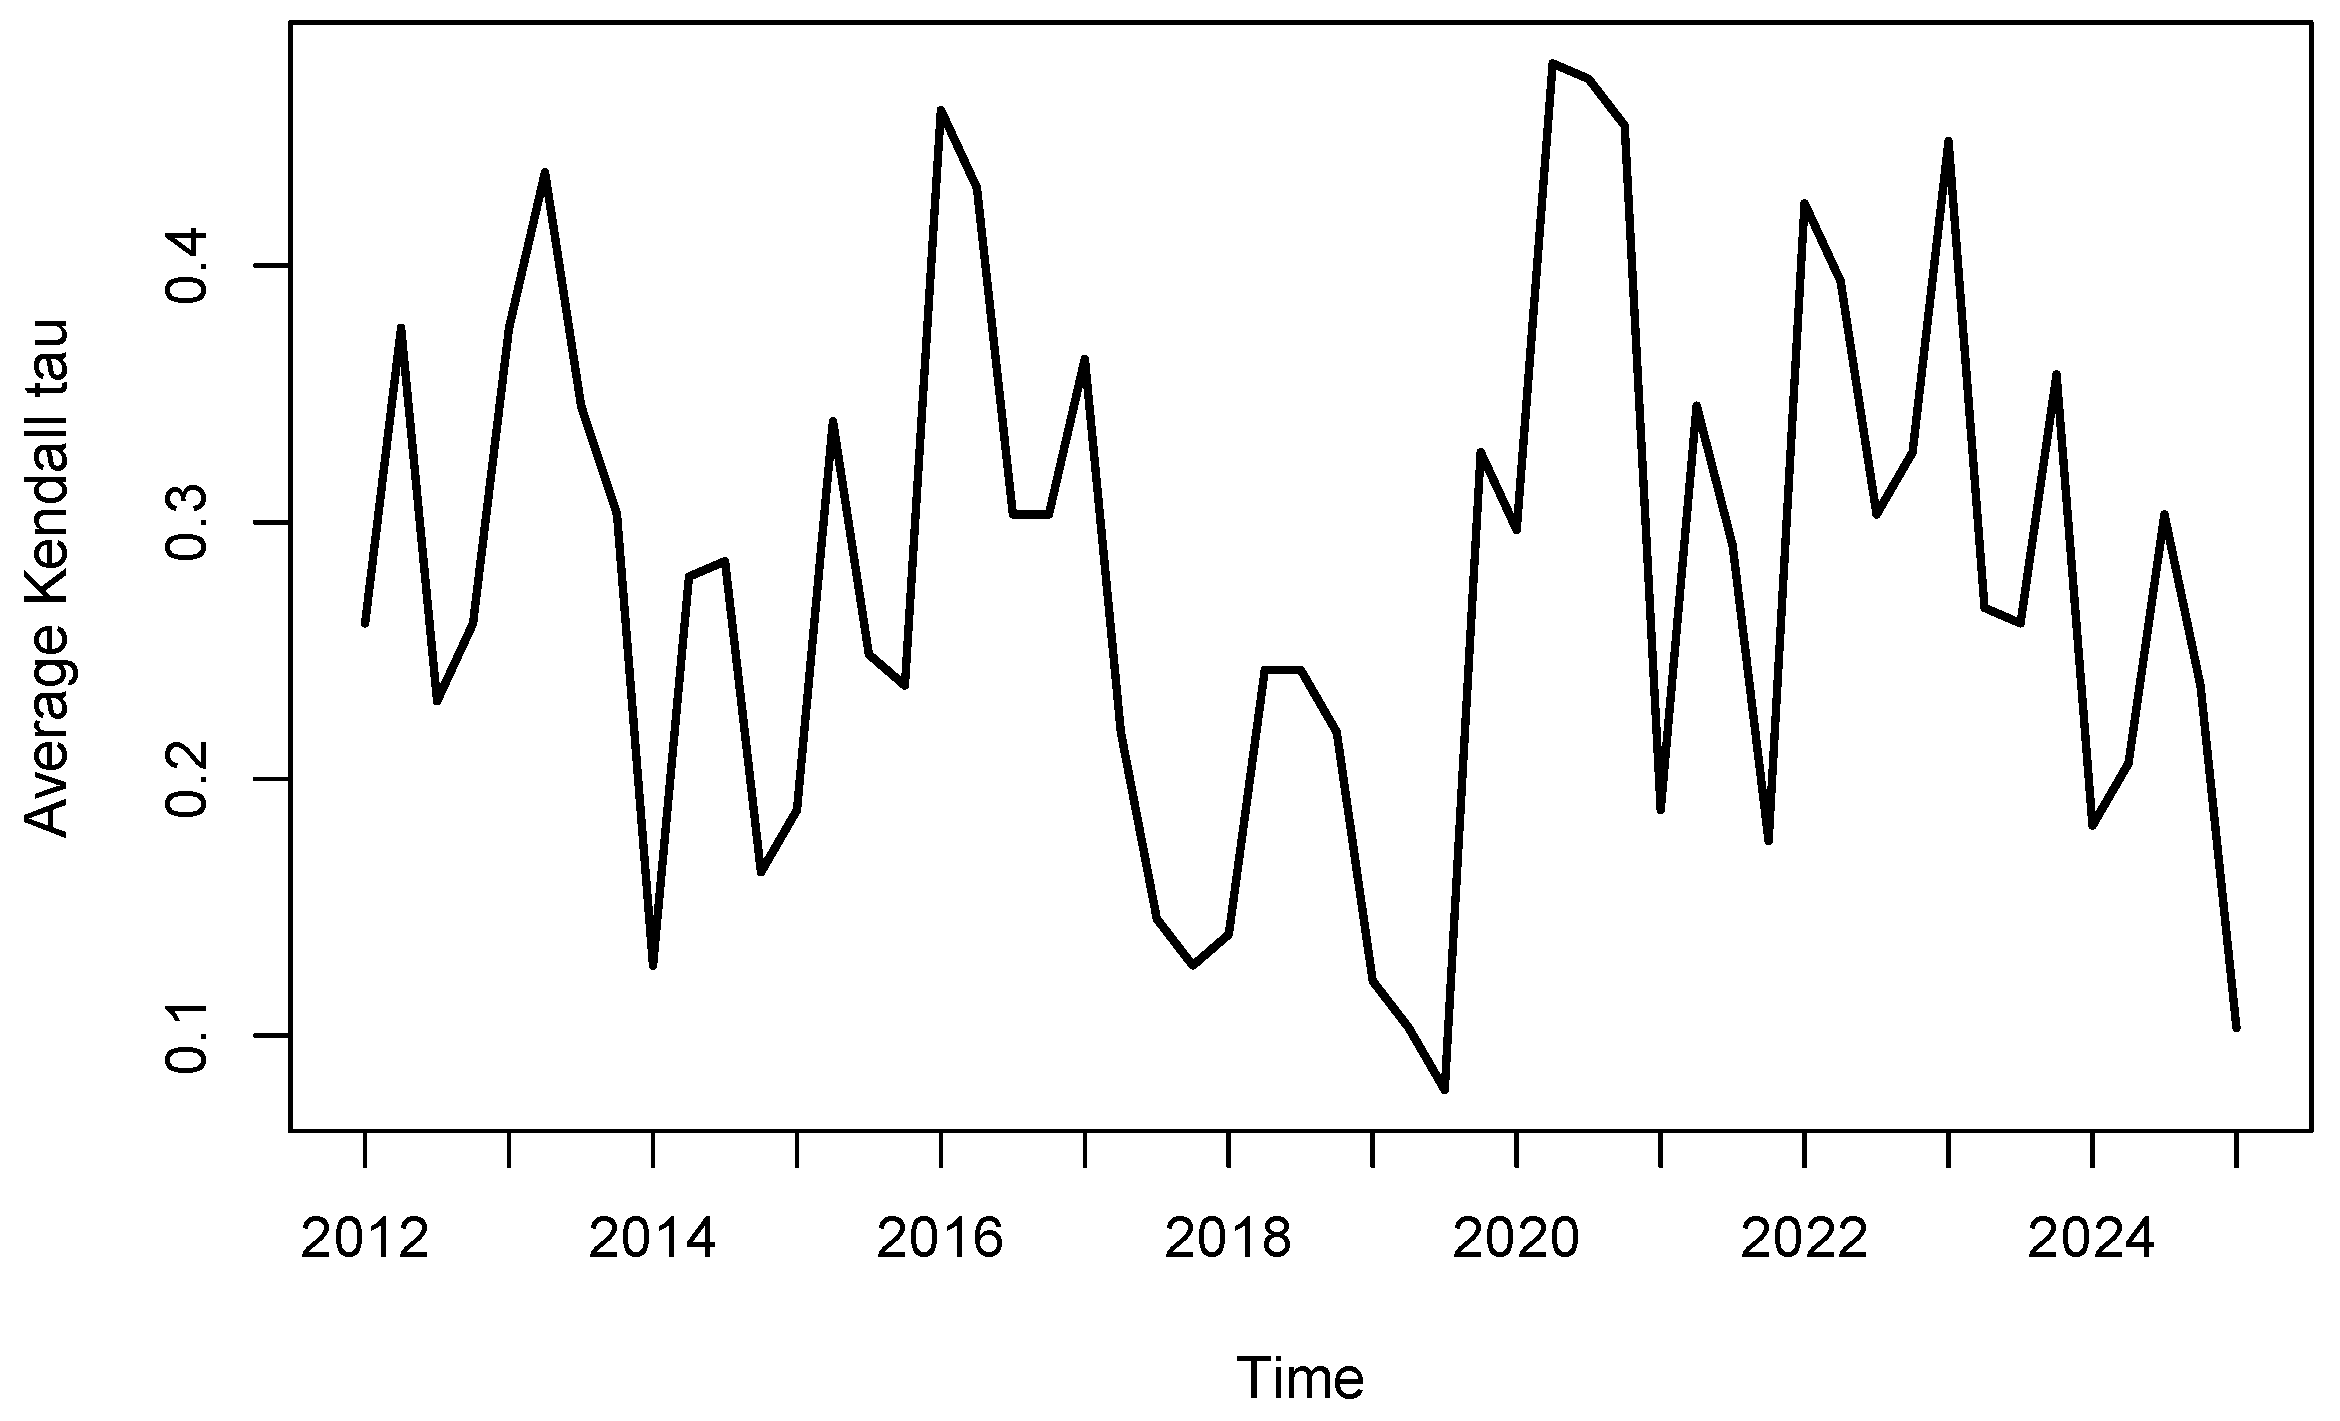

Disclaimer/Publisher’s Note: The statements, opinions and data contained in all publications are solely those of the individual author(s) and contributor(s) and not of MDPI and/or the editor(s). MDPI and/or the editor(s) disclaim responsibility for any injury to people or property resulting from any ideas, methods, instructions or products referred to in the content. |
© 2026 by the authors. Licensee MDPI, Basel, Switzerland. This article is an open access article distributed under the terms and conditions of the Creative Commons Attribution (CC BY) license.