1. Introduction
Inland waterway transport (IWT) has historically played a foundational role in the development of economic systems, trade networks, and urban settlements, particularly in regions structured around major river basins. From early commercial navigation to modern logistics chains, inland waterways have functioned as natural transport corridors, enabling the movement of large volumes of goods at relatively low cost and energy intensity. Major commercially navigable inland waterways exist across all continents, including the Rhine–Danube, Seine, Oder, and Elbe corridors in Europe; the Mississippi–Missouri, St. Lawrence, and Ohio river systems in North America; the Yangtze, Mekong, and Pearl River systems in Asia; the Amazon, Paraná–Paraguay, and Orinoco corridors in South America; the Congo, Nile, and Niger rivers in Africa; and the Murray–Darling river system in Australia, all of which support large-scale inland freight transport and multimodal logistics. In the contemporary context, IWT is increasingly recognized as a strategic component of a sustainable and resilient transport system, especially in light of growing congestion, environmental constraints, and climate policy objectives [
1,
2].
Despite its long-standing presence, the role of IWT has evolved substantially over recent decades, shaped by institutional harmonization, infrastructure modernization, and its integration into multimodal logistics networks. The evolution of IWT in Europe has been closely linked to coordinated policy efforts aimed at overcoming fragmentation across national waterways and regulatory regimes [
3,
4,
5]. However, despite its advantages, the modal share of IWT in Europe has remained modest, accounting for 1.6–1.8% of total freight transport at the continental level, and uneven across countries and regions [
6]. This divergence reflects not only geographical and hydrological conditions but also differences in national transport policies, infrastructure quality, and the economic structure of hinterland regions [
7]. Moreover, fluctuations in cargo volumes and the declining share of IWT observed in certain periods highlight ongoing challenges related to market volatility, climate-induced navigation constraints, and competition with more flexible transport modes.
While infrastructure and regulatory frameworks are necessary conditions, growing evidence suggests that hinterland socioeconomic characteristics, spatial interactions, and regional economic dynamics play a decisive role in determining the success of IWT and inland ports. Building on the framework proposed by Notteboom and Rodrigue [
8], port hinterlands can be interpreted as the interaction of three complementary sub-components: a macro-economic hinterland, a physical hinterland and a logistical hinterland. The macro-economic hinterland reflects the spatial distribution of production and consumption centers embedded in global value chains and determines freight transport demand through variables such as prices, interest rates, production structure and trade intensity. The physical hinterland represents the transport supply side, consisting of corridors, terminals and modal capacities that enable or constrain the spatial reach of ports. Finally, the logistical hinterland captures the organization of freight flows and logistics services, including service frequency, reliability, timing, information systems and value-added activities. The position and function of ports within complex hinterland systems can be more effectively examined by adopting the four-layer framework [
8,
9], which integrates both spatial and functional perspectives. The locational layer focuses on the geographical positioning of ports relative to hinterland economic centers and applies spatial concepts such as centrality and intermediacy to capture differences in accessibility and market reach. The infrastructural layer refers to the physical configuration and quality of freight transport networks. The transport layer concerns the organization and performance of freight transport services along multimodal port–hinterland corridors. The logistical layer addresses the coordination and management of transport chains and their integration into broader logistics and supply-chain structures.
The evaluation and forecasting of port development have evolved substantially over the past decades, reflecting both the growing strategic importance of ports and the increasing complexity of freight and logistics systems. Early studies relied predominantly on classical time-series and econometric techniques, which treated port throughput as a largely linear and stationary process. Traditional univariate approaches such as autoregressive integrated moving average (ARIMA), seasonal ARIMA, exponential smoothing and decomposition methods were widely applied because of their simplicity, transparency and relatively low data requirements [
10,
11,
12,
13,
14]. These methods proved particularly useful for short-term forecasting and for capturing seasonal patterns in container and cargo flows, and have therefore long served as benchmark models in port planning studies.
As research progressed, scholars increasingly recognized that port throughput dynamics are influenced by broader economic and structural drivers and are often characterized by non-stationarity and nonlinear behavior. Consequently, causal and multivariate econometric models were introduced to explicitly link throughput to macroeconomic and market indicators. These approaches incorporated variables such as Gross Domestic Product, trade volumes, industrial activity, exchange rates and oil prices, and allowed analysts to explore the sensitivity of port demand to economic fluctuations. Extensions such as ARIMAX, vector autoregression (VAR), autoregressive distributed lag models, and multi-scale geographically weighted regression (MGWR) improved predictive performance by integrating exogenous information and scenario assumptions, particularly for medium- and long-term assessments [
15,
16,
17,
18,
19].
Nonetheless, the ability of conventional econometric models to capture complex nonlinear patterns and structural breaks remains limited. This motivated the adoption of machine learning techniques in port throughput analysis. Artificial neural networks emerged as early data-driven alternatives capable of modeling nonlinear relationships directly from historical observations without explicit functional assumptions [
20,
21]. Empirical evidence shows that neural network models frequently outperform regression and classical time-series approaches, especially when throughput series display high volatility and irregular cycles [
20,
22]. Subsequent methodological developments introduced more advanced learning architectures. Recurrent neural networks (RNNs) and their variants, such as long short-term memory (LSTM) and gated recurrent units (GRU), were specifically designed to exploit temporal dependencies in sequential data. These models demonstrated superior performance in port throughput forecasting tasks, particularly for short and medium horizons [
23,
24,
25,
26,
27]. Convolutional neural networks were also adapted for time-series prediction [
28,
29], while other transformer-based architectures further enhanced modeling capacity through attention mechanisms and long-range dependency learning [
30,
31].
A parallel methodological trend concerns the explicit integration of explanatory factors and feature-selection mechanisms [
32]. Recent studies combine economic indicators and port-specific operational variables with learning models in order to improve both forecasting accuracy and interpretability. Grey relational analysis [
33], for example, has been used to identify the most influential drivers of throughput before feeding the selected variables into deep learning models, such as bidirectional long short-term memory networks [
34]. Jin et al. [
35] utilized XGBoost to forecast container volumes at Ningbo Terminal in China and obtained significantly accurate performance. Commodity diversification, hinterland economic features, and port-scale infrastructure exhibit large influence. The inclusion of inland shipping data, particularly road freight, in models like XGBoost [
36] reveals its significant impact on container forecasting, with truck transport showing a stronger correlation than rail due to its dominance in EU logistics, while the unemployment rate serves as a critical economic indicator, inversely correlating with freight demand as it drives consumer spending and industrial activity. This hybrid strategy allows analysts to reduce dimensionality, enhance robustness and better reflect the interaction between port activity and its economic environment.
In this broader context, understanding the drivers that shape the development and performance of inland transport systems is essential. The progress of port throughput evaluation methods reveals a clear transition from linear and univariate forecasting tools toward data-driven, hybrid and multi-source modeling frameworks. Contemporary research increasingly views throughput as the outcome of complex interactions between macroeconomic conditions, infrastructure capacity and logistics organization. Despite the extensive body of literature on port performance and hinterland relations, several important gaps remain. First, existing studies predominantly rely on linear or weakly nonlinear econometric frameworks to identify the determinants of port throughput and development, thereby focusing on average marginal effects and implicitly assuming homogeneous responses across ports and regions. Such approaches are limited in their ability to capture complex nonlinear responses, threshold effects and interaction mechanisms between socioeconomic and infrastructure drivers that are inherent to regional logistics systems. Second, although recent machine learning methods have been increasingly applied to port throughput forecasting, the dominant emphasis has been placed on improving predictive accuracy, while considerably less attention has been devoted to using these models as analytical tools for identifying and interpreting the structural drivers of inland port development. As a result, the explanatory and policy-oriented value of machine learning remains largely underexplored in the inland port and hinterland literature. Third, the empirical evidence on hinterland effects is still mainly derived from seaports and large coastal gateways, whereas inland ports—whose performance is intrinsically embedded in regional economic systems and multimodal hinterland networks—remain comparatively understudied. In particular, there is limited empirical work that jointly considers socioeconomic conditions, business structure and transport infrastructure within a unified analytical framework tailored to inland port systems. Consequently, there is a clear need for an integrated, data-driven and interpretable modeling framework that can simultaneously identify the most influential hinterland drivers of inland port development, uncover nonlinear and interaction effects among them, and reveal potential heterogeneity across ports and traffic segments. The present paper is positioned within this evolving debate, contributing to the analysis of inland waterway transport not merely as a technical mode, but as a complex system embedded in regional economic and logistics structures. Accordingly, this paper addresses the identified research gaps by developing an integrated and explainable machine learning framework (XGBoost) to systematically analyze the role of hinterland socioeconomic, infrastructure and spatial conditions in shaping inland port development. The proposed methodology explicitly captures nonlinear relationships and interaction effects among regional drivers, allowing threshold behavior and synergistic mechanisms between economic activity, business structure and transport infrastructure to be revealed. Moreover, the framework is designed to move beyond purely predictive applications of machine learning by providing an interpretable assessment of the relative importance and functional influence of hinterland factors on inland port growth.
The subsequent structure is as follows:
Section 2 details the methodology, including the study area, variable set-up, XGBoost model architecture, and evaluation metrics.
Section 3 presents the experimental results,
Section 4 discusses findings and their implications in driving inland port development, and finally
Section 5 concludes with key insights and future research.
2. Materials and Methods
The methodological design is structured to identify the most influential hinterland factors, to capture their nonlinear and interaction effects, and to examine the heterogeneity of these relationships across inland ports. The empirical approach is tailored to the panel structure of the data, covering multiple inland ports and hinterland regions over time. Through this integrated framework, the study directly addresses the following research questions:
RQ1—Which hinterland socioeconomic, infrastructure, and logistics-related factors are the most influential drivers of inland port development in terms of cargo throughput?
RQ2—To what extent do nonlinear effects and threshold behaviors in key hinterland variables (such as economic mass, business activity, and transport infrastructure) shape inland port development outcomes?
RQ3—How do interaction effects between hinterland features influence the development dynamics of inland ports?
RQ4—Do the effects of hinterland determinants on inland port development vary across different river sector administrations?
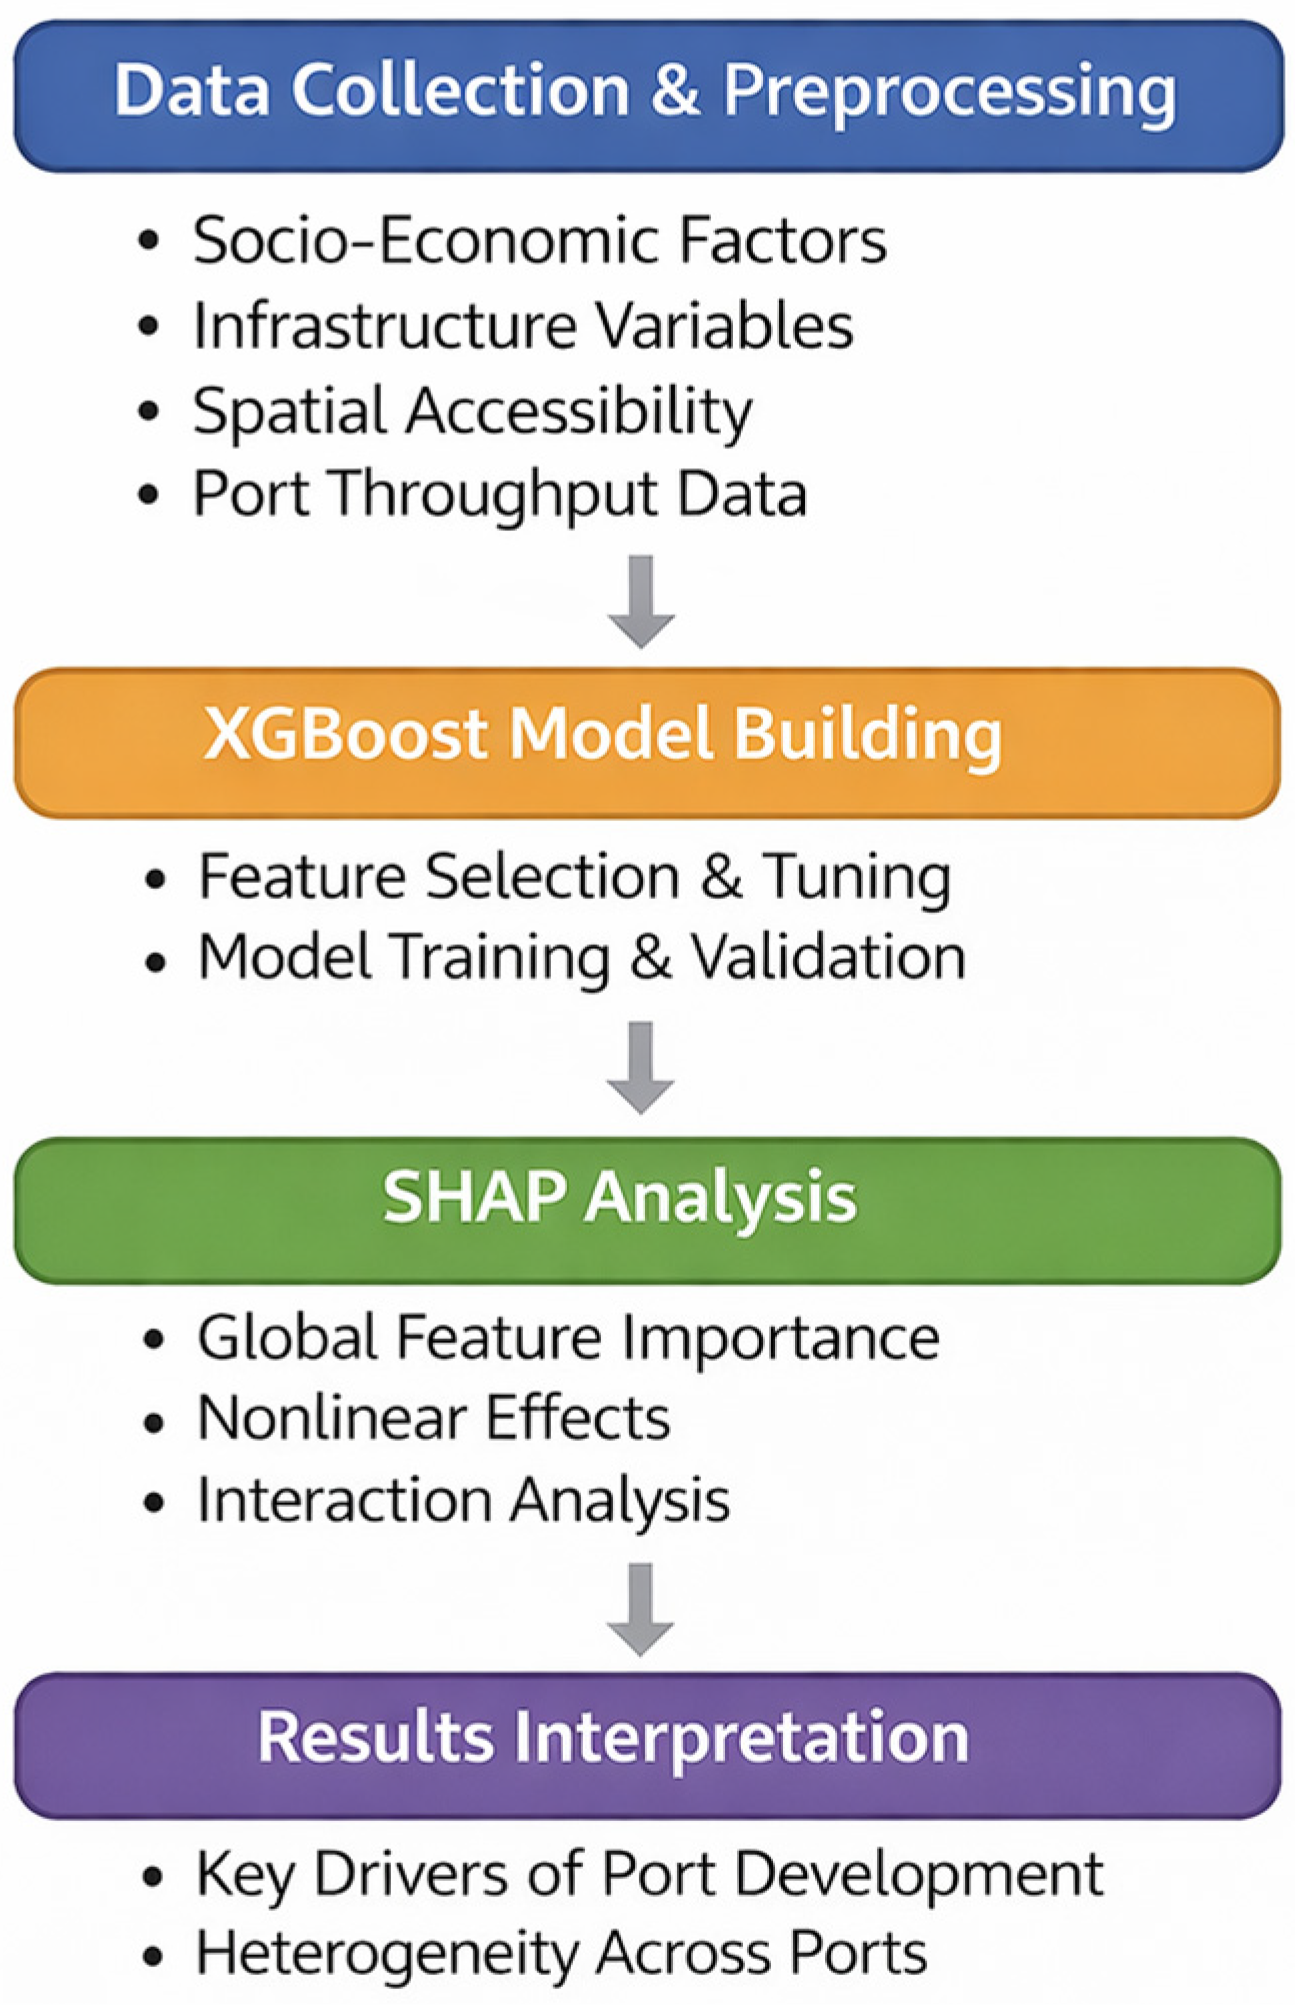
The logic of the research is depicted in
Figure 1.
2.1. Study Area—Ports and Hinterland
The Danube River constitutes one of Europe’s most strategic inland transport corridors and represents the backbone of the TEN-T Rhine–Danube Corridor, linking Central and Eastern Europe with the Black Sea and onward to Central Asia and Middle East. Extending approximately 2400 km across ten countries, the river plays a key role in facilitating both regional and international freight flows. Nevertheless, compared with the Rhine corridor, the Danube continues to exhibit substantially lower traffic volumes, reflecting a combination of long-standing structural and economic turmoil, hydrological constraints, regulatory and institutional fragmentation, and persistent gaps in multimodal connectivity, digitalization, and workforce availability [
37,
38,
39].
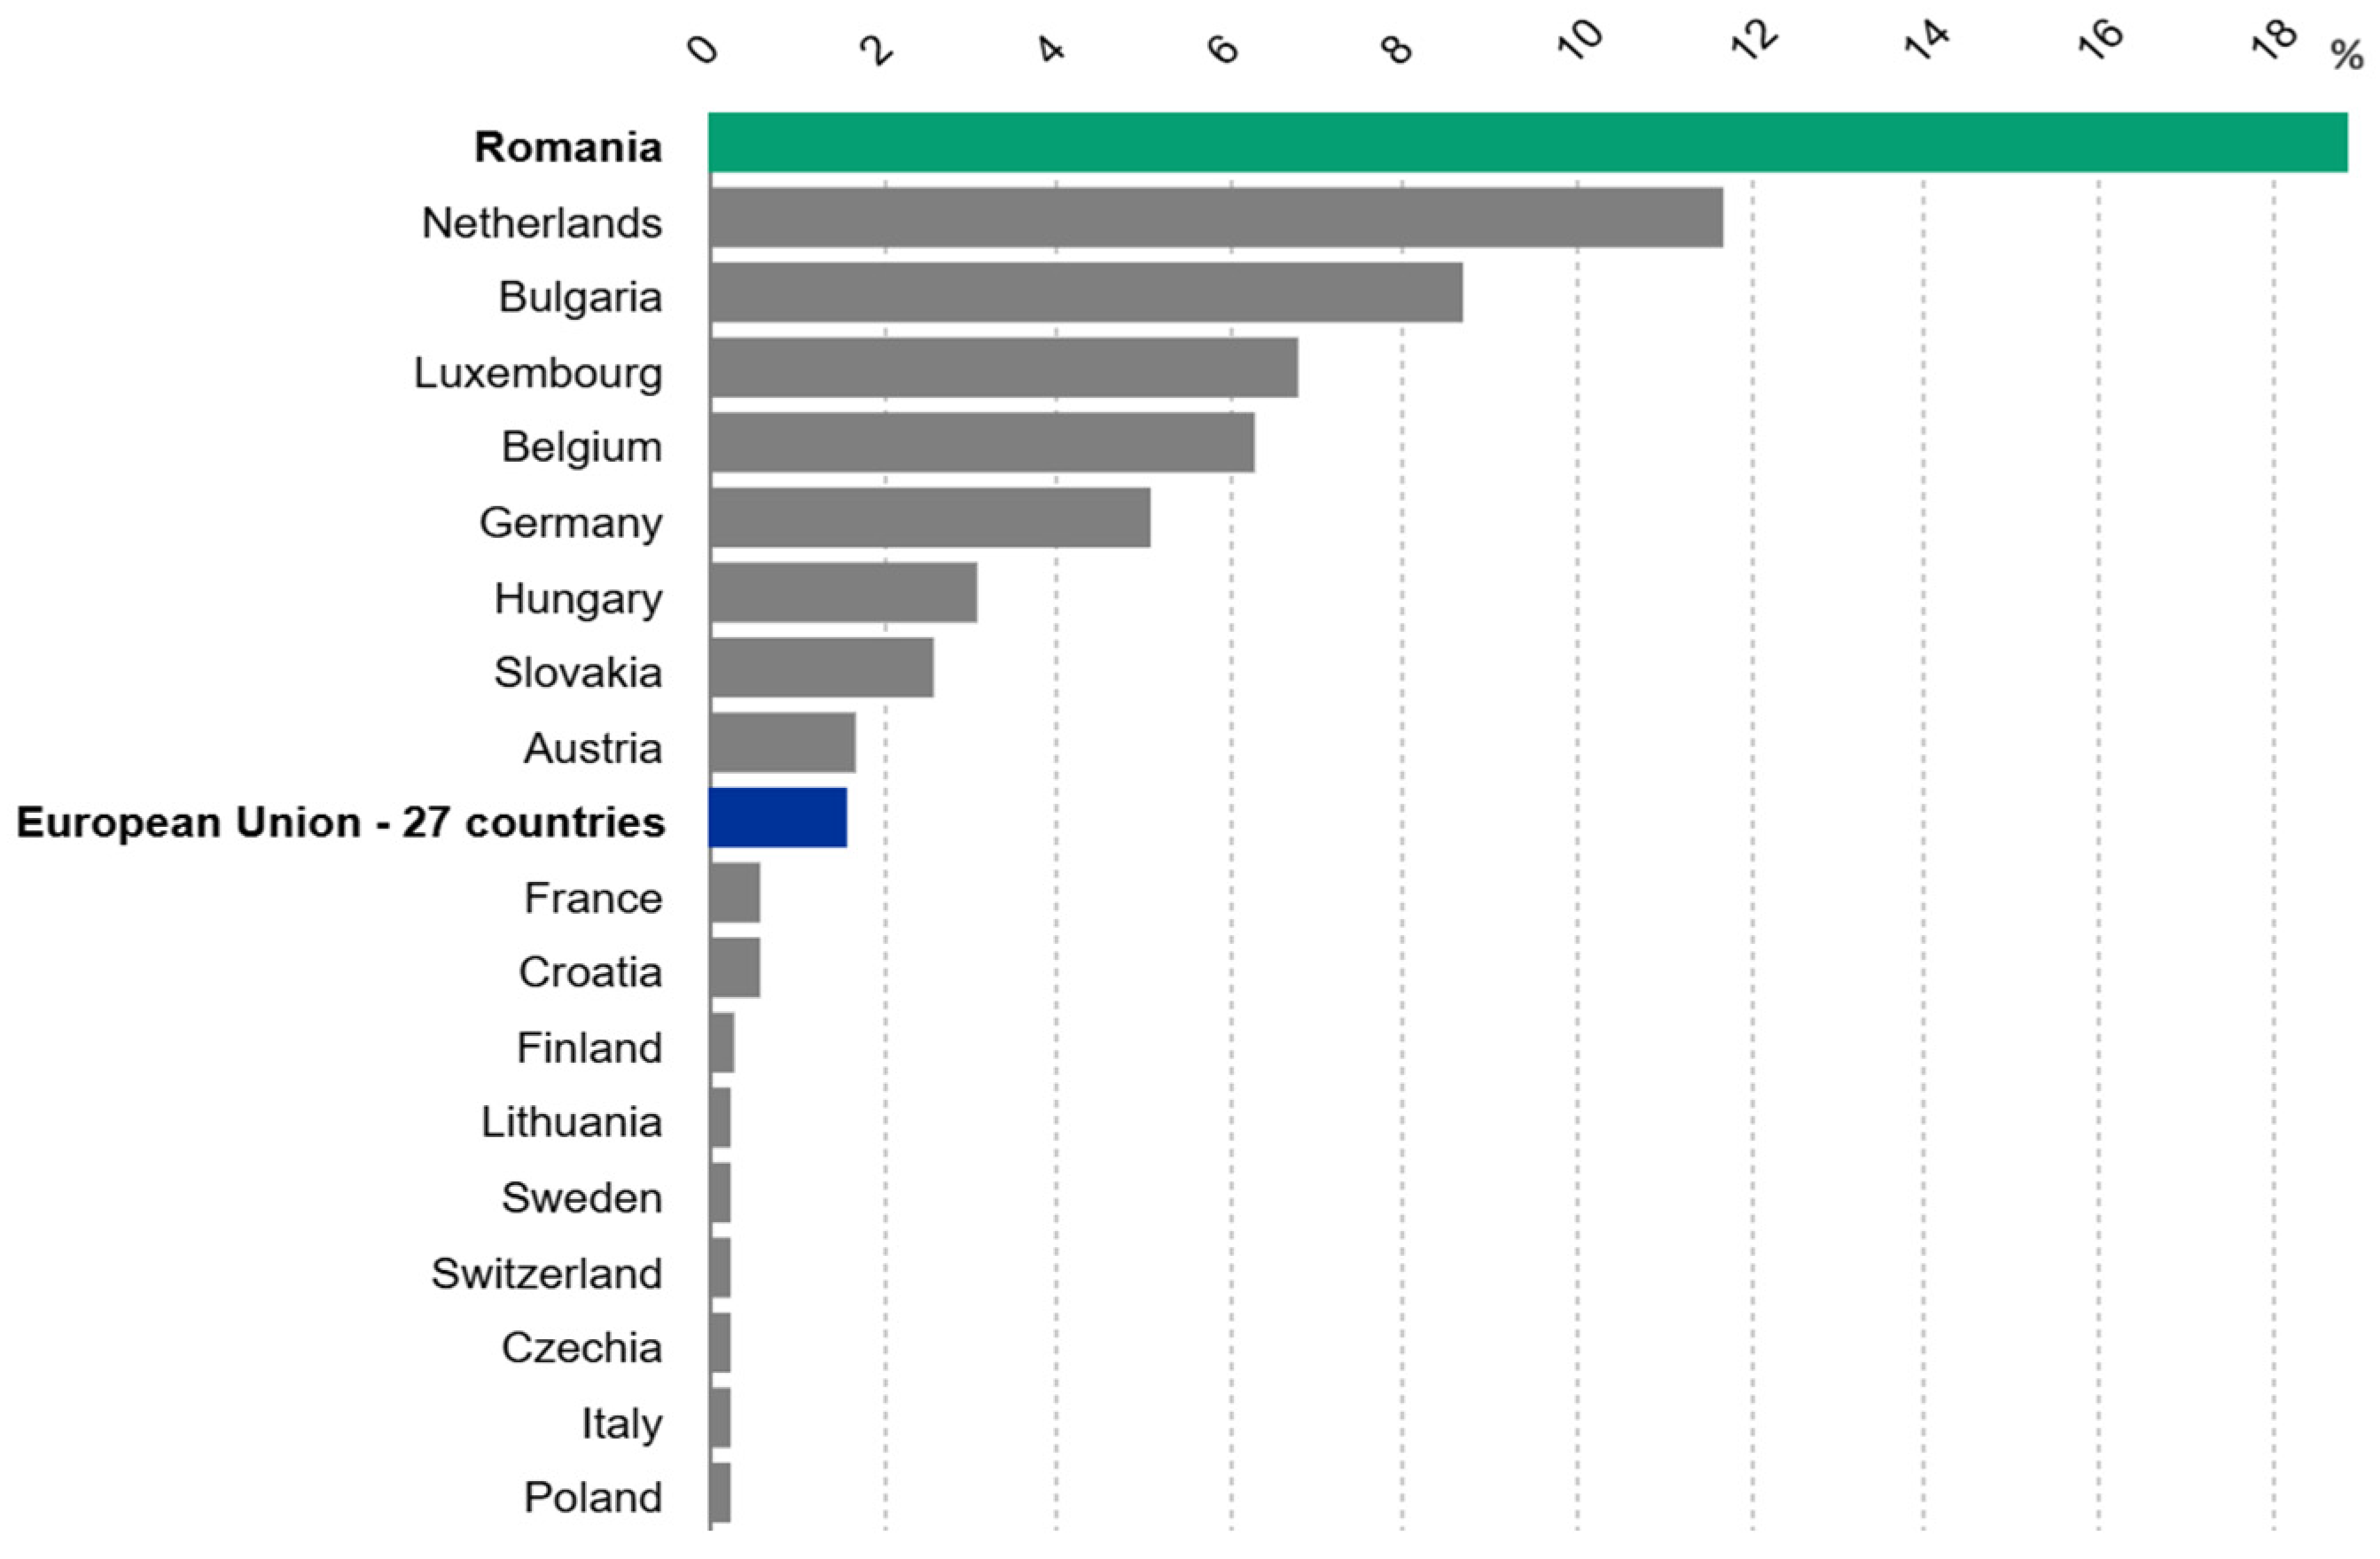
In Romania, the Danube River has long played a vital role in key economic sectors—industry, agriculture, and energy—by offering cost-efficient transport for heavy and bulk goods such as grains, minerals, coal, building materials, and chemicals. Within the European Union, Romania holds the fifth position for total freight volume moved on inland waterways. Notably, it has the highest share of inland water transport compared to other freight modes, reaching 18.9%, followed by the Netherlands and Bulgaria (
Figure 2).
Navigation along the Romanian Danube is organized through three regional administrations. This study considers 18 inland ports from the administrations:
The Upper Danube administration covers the river stretch from the Serbian border at Bazias to Cernavoda and includes the ports of Moldova Veche, Orsova, Drobeta-Turnu Severin, Calafat, Corabia, Turnu Magurele, Giurgiu, Oltenita, Calarasi, and Cernavoda.
The Lower Danube administration features a transitional zone where its status shifts from an inland waterway to a maritime route, resulting in a gradual harmonization of the respective regulatory regimes; within this sector, Braila and Galati operate as maritime–river ports subject to mixed-traffic regulatory regimes, together with the ports of Tulcea, Macin, and Mahmudia.
The Danube–Black Sea Canal administration controls the major artificial waterways linking the Danube River to the Black. The selected ports are Medgidia, Ovidiu, and Basarabi.
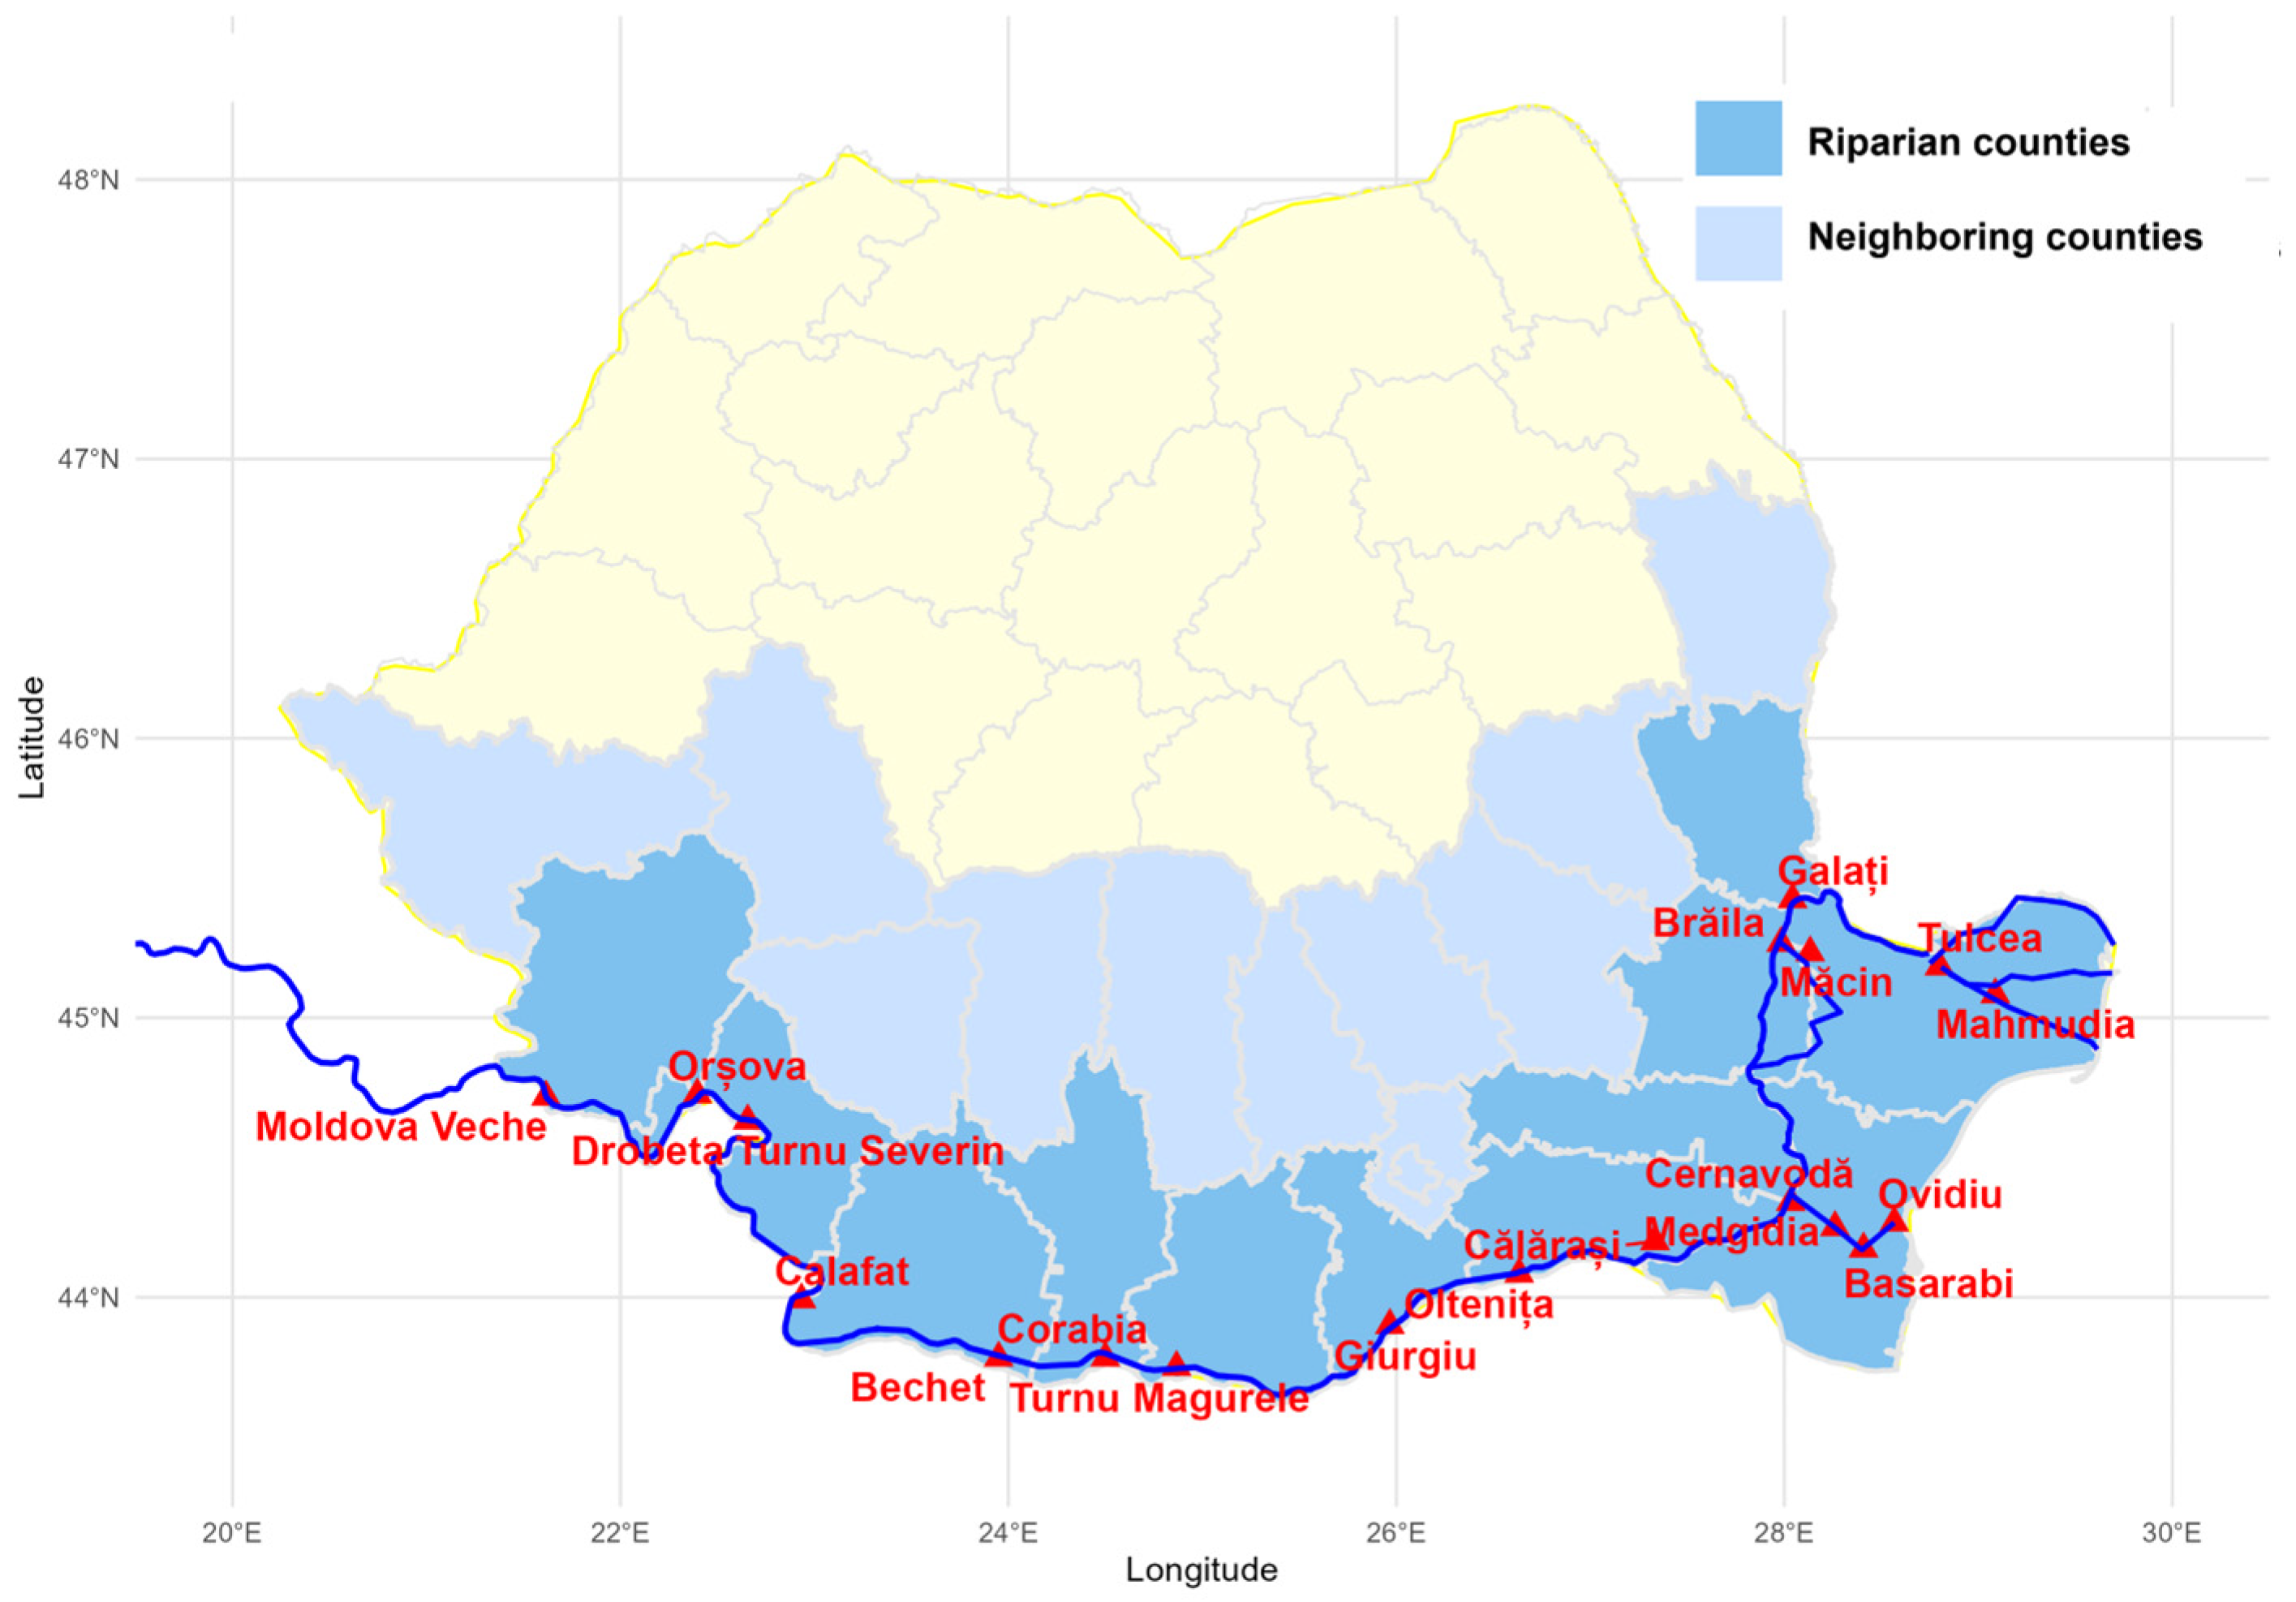
The ports’ hinterland is delineated into two concentric zones: (i) the first one includes the counties where ports are located; and (ii) the second zone encompasses all counties whose centroids lie within a radius of 150 km from the ports (
Figure 3). These distance thresholds represent alternative functional catchment areas capturing short- and medium-range hinterland interactions. This centroid-based proximity approach provides an estimate of spatial accessibility and potential port–region interaction intensity.
2.2. Variables and Data Set
Port throughput represents the most widely adopted and operationally meaningful indicator of port development and performance, as it directly reflects the intensity of freight flows handled by a port and its effective integration within regional and international logistics systems. Throughput is also consistently available over time and comparable across ports, which is essential for panel-based and machine learning analyses. As dependent variables, all throughputs are transformed using the natural logarithm in order to reduce scale effects, mitigate skewness, and stabilize variance across ports and time. This transformation also facilitates the interpretation of model outputs in relative terms and improves the numerical behavior of the learning algorithm. Consequently, port throughput provides a robust and policy-relevant measure of inland port development for the purposes of this study.
The literature highlights that port throughput forecasting relies on a heterogeneous feature set combining macroeconomic, trade-related, cost-based and system-level variables, allowing learning-based models to reflect both structural demand drivers and operational conditions affecting port activity [
9,
36,
40,
41]. Gross Domestic Product (GDP) serves as a key indicator of a country’s economic performance, shaping industrial output, consumer spending, and international trade [
36,
42,
43,
44]. A rising GDP typically stimulates greater trade activity, which in turn increases port throughput and inland waterway shipping volumes. Import and export freight levels are primary determinants of cargo movements, as they reflect the quantity of goods flowing into and out of the markets [
18,
42,
44,
45]. Elevated imports signal strong domestic demand, while growing exports point to a competitive production base—both of which boost containerized freight. Population and labor market conditions also affect trade dynamics [
36,
44,
46]. A healthy labor market strengthens industrial production, manufacturing capacity, and consumer demand, thereby supporting containerized trade growth. Conversely, high unemployment can signal economic slowdowns and weaker trade flows. Other variables considered alongside the influence on port throughput are waterway construction investments [
19], consumer price index [
36,
42,
44], retail sales [
19], fuel price [
18,
47], interest rates [
48], and water levels [
43].
The selection of explanatory variables (
Table 1) is guided by the objective of capturing the main structural mechanisms through which hinterland conditions influence inland port development, while remaining consistent with the spatial construction of port hinterlands and the requirements of an interpretable machine learning framework.
The retained variables represent complementary dimensions of regional economic potential (
GDP,
GDPPC), sectoral production structure (
TRWH,
MNF,
AGR,
CON), labor and market size (
POP,
EMP), transport infrastructure endowment (
ROAD,
RAIL), and spatial accessibility (
AIX,
HSIZE). All indicators are constructed at the port–year level for a period of 15 years (2010–2024) by aggregating county-level data over the corresponding hinterland of each port, as defined by the distance-based catchment areas (the county centroid within a radius area of 150 km from the port). For each port
and year
, all county-level variables
(excepting
AIX) are aggregated over the set of counties belonging to its hinterland:
where
denotes the set of counties
assigned to the hinterland of port
.
The Hansen-type accessibility index of port’s hinterland is computed as follows:
where
is the distance from the port to the county centroid. The accessibility index is constructed following a Hansen-type potential accessibility formulation, where accessibility is defined as the sum of economic opportunities weighted by a distance decay function. Specifically, the index captures the economic mass of surrounding regions (measured by
GDP) discounted by the squared distance to the port.
This design allows the model to reflect the economic and infrastructural environment effectively accessible to each inland port, rather than administrative boundaries alone. In line with the non-parametric nature of the XGBoost model, the variable set is intentionally broad in order to allow nonlinear effects and interaction mechanisms among hinterland drivers to emerge endogenously, without imposing a priori restrictions on functional forms.
2.3. XGBoost Model
Extreme Gradient Boosting (XGBoost) is a supervised machine learning algorithm, developed and released by Chen and Guestrin [
49]. It is a tree-based ensemble learning algorithm specifically designed to achieve high predictive accuracy while efficiently modeling complex, nonlinear relationships and interaction effects. In contrast to classical regression-based approaches commonly used in port and hinterland studies, XGBoost does not impose linearity or additivity assumptions and is therefore particularly suitable for analyzing inland port development, where throughput dynamics emerge from the interaction of multiple socio-economic, infrastructural and spatial drivers.
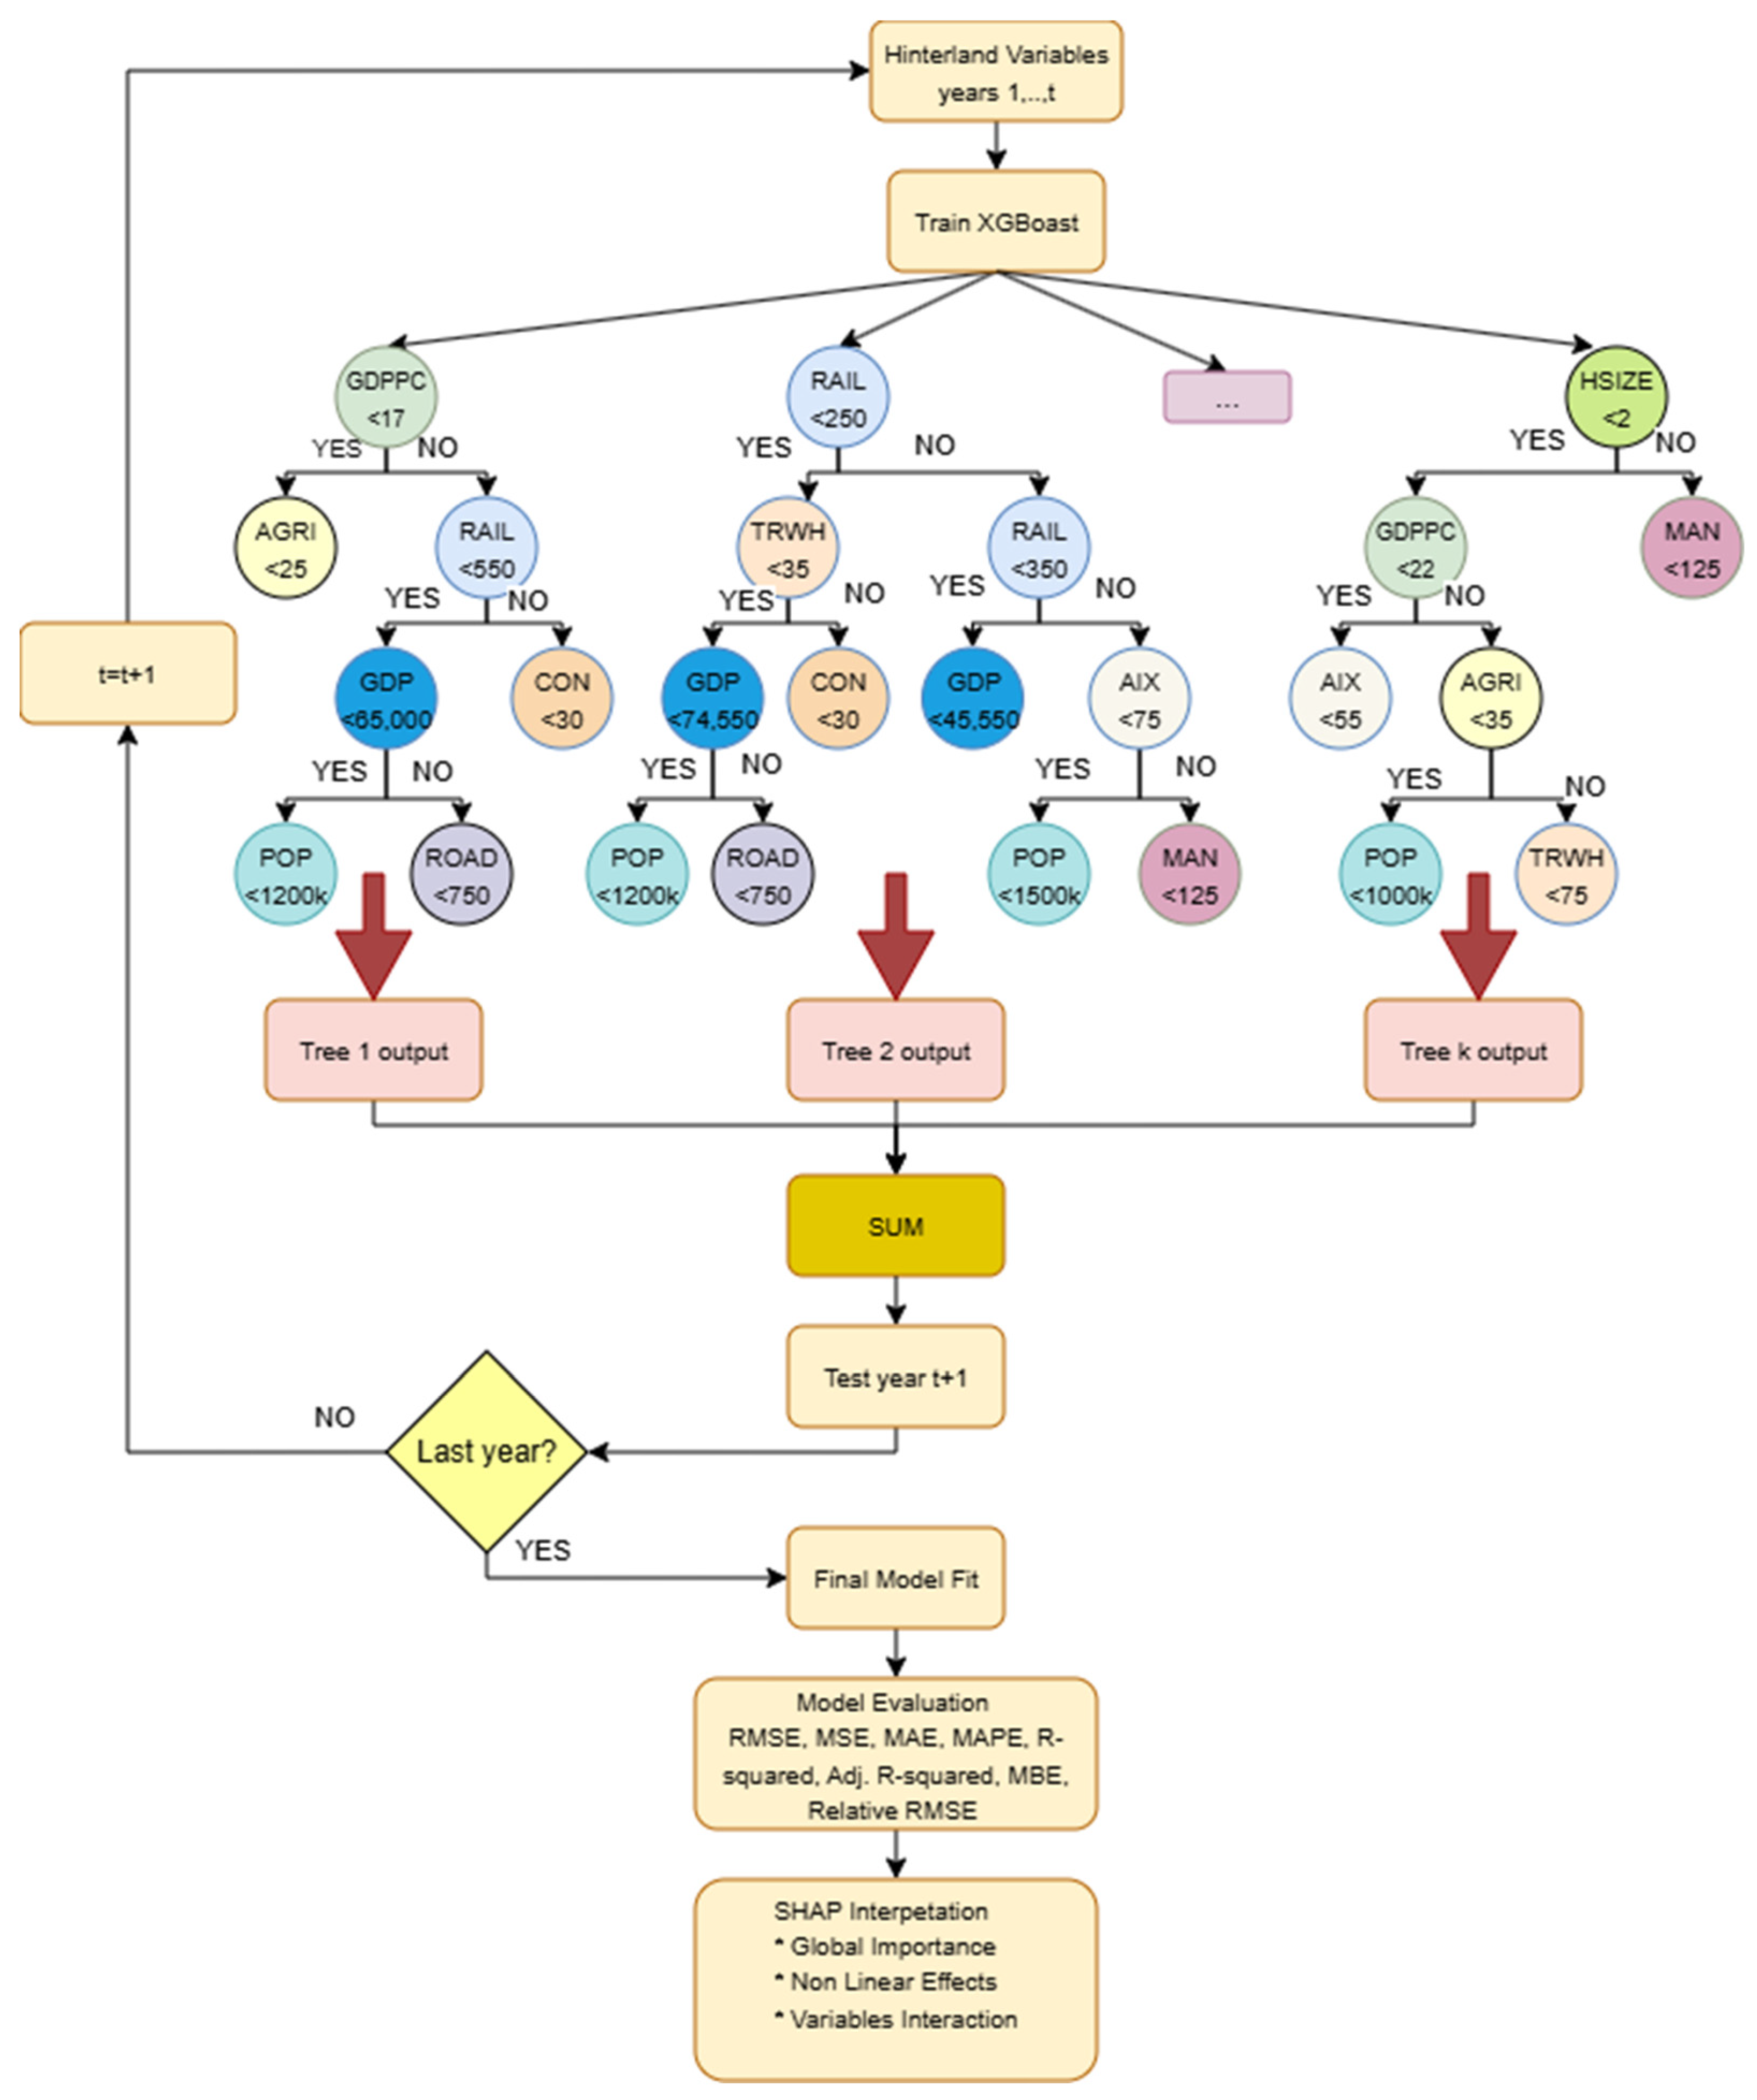
For this study, XGBoost is employed as the core modeling engine to uncover how hinterland characteristics jointly shape inland port throughput, while allowing these effects to vary across different ranges of the explanatory variables. XGBoost is formulated as a regularized additive tree ensemble in which inland port throughput is modeled as the sum of sequentially learned regression trees based on hinterland features (
Figure 4).
Figure 4 illustrates a simplified structure of the model’s decision process, highlighting key variables and threshold effects identified through the XGBoost algorithm. The split values correspond to data-driven partitioning points derived from the ensemble of regression trees, where changes in the marginal contribution of explanatory variables occur. Let
denote the logarithm of cargo throughput of port
in year
, and let
be the vector of hinterland explanatory variables defined in
Section 2.2. XGBoost approximates the unknown nonlinear mapping between hinterland characteristics and inland port development through an additive ensemble of regression trees:
where
is the space of regression trees. Each tree
maps an observation to a leaf index and assigns a constant score to that leaf. Formally, a tree can be written as
where
is a function assigning each observation to one of the
leaves and
is the vector of leaf weights.
The model is estimated by minimizing the following regularized empirical risk:
where
denotes the loss function and
penalizes model complexity. In this study, a squared error loss is adopted, consistent with a continuous dependent variable. The regularization term for a tree
is defined as
where
is the number of leaves,
penalizes excessive tree growth and
controls the magnitude of leaf weights.
XGBoost builds the model sequentially. At iteration
, the current prediction is
and a new tree
is added to improve fitness. The objective at iteration
becomes
To make the optimization tractable, XGBoost applies a second-order Taylor expansion of the loss function around the current prediction:
where
These values are computed for each port–year observation
and are referred to as the first- and second-order gradients. Ignoring constants that do not depend on
, the approximate objective for the new tree becomes
If a fixed tree structure is assumed, all observations assigned to the same leaf
share the same weight
. Let
be the set of observations that fall into leaf
. Define
The optimal weight for leaf
is obtained in closed form as
Substituting these optimal weights into the objective yields the optimal value of the tree:
For a candidate split that divides a parent node into a left and a right child, the improvement in the objective (the split gain) is computed as
where
and
are the gradient and Hessian sums in the left and right child nodes, respectively. Only splits with positive gain are retained, which ensures that each additional partition contributes to improving model fit after accounting for regularization.
In the present work, each observation corresponds to a port–year pair, and the gradients and Hessians reflect how strongly the prediction error of inland port throughput reacts to changes in the hinterland variables at that observation. The splitting rules constructed by the trees therefore identify regions of the hinterland feature space—defined by combinations of economic mass, sectoral structure, labor availability, infrastructure endowment and spatial accessibility—within which inland port growth dynamics behave similarly.
This second-order optimization framework allows XGBoost to efficiently capture nonlinear responses and high-order interactions between hinterland drivers, while the regularization terms explicitly control model complexity. Consequently, the estimated ensemble provides a flexible yet stable approximation of the complex functional relationship between hinterland conditions and inland port development outcomes. Hyperparameter tuning and model selection were conducted within this framework using early stopping based on validation performance. Importantly, predictions for each test fold are generated using models trained exclusively on past data, ensuring strict out-of-sample evaluation. Final performance metrics are computed by aggregating prediction errors across all test folds, thereby reflecting the model’s predictive capability under realistic forecasting conditions.
To ensure that XGBoost is used not only as a predictive tool but also as an analytical instrument, the fitted model is subsequently interpreted using feature attribution techniques. In particular, SHAP values are employed to decompose the predicted port throughput into additive contributions of each explanatory variable, allowing the relative importance, nonlinear response patterns and interaction effects of hinterland drivers to be examined in a transparent and policy-relevant manner. SHAP decomposes each prediction into additive feature contributions:
where
represents the marginal contribution of feature
to observation
. This decomposition enables identification of threshold effects, nonlinear responses, and interaction structures that cannot be captured by linear models.
3. Results
3.1. Ports and Hinterland Features
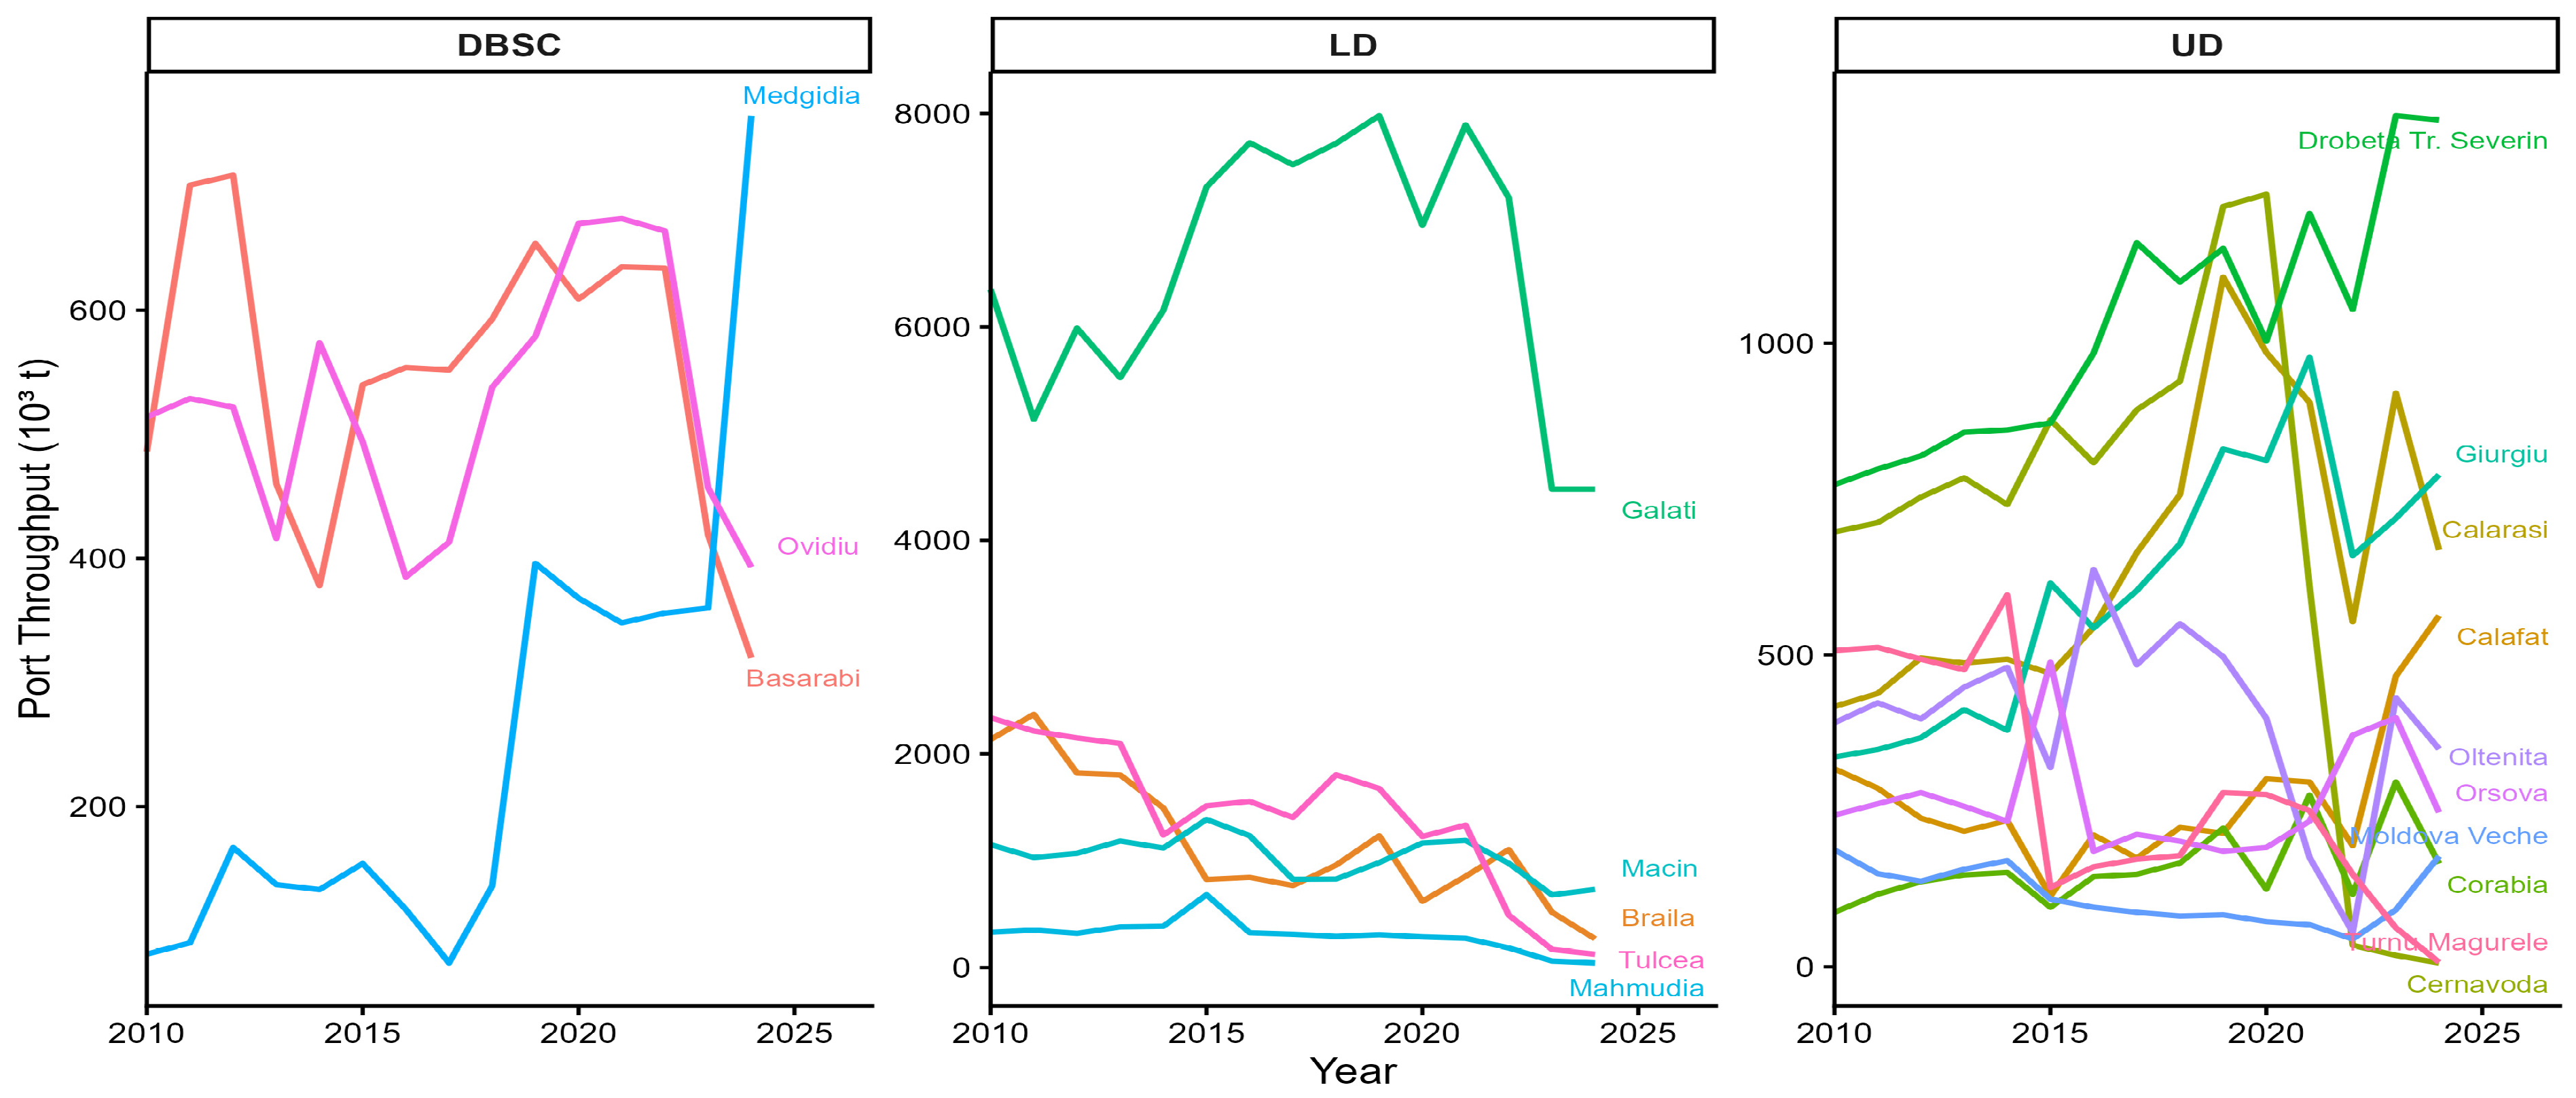
Figure 5 presents the temporal evolution (2010–2024) of throughput for each inland port, grouped by administration.
The analysis of inland port throughput over the 2010–2024 period reveals a structurally differentiated and increasingly polarized system. Although aggregate throughput displays a moderately increasing trajectory over time, this overall pattern conceals substantial cross-sectional divergence, volatility asymmetry, and administrative heterogeneity. At the port level, compound annual growth rates (CAGRs) vary considerably, indicating divergent long-term development paths. Several ports demonstrate sustained expansion, most notably Medgidia (17.3%), Giurgiu (6.3%), Corabia (4.7%), Calafat (4.2%), and Drobeta Turnu Severin (4.1%), suggesting strengthening hinterland integration and improved operational positioning. Conversely, significant contraction characterizes ports such as Cernavoda (−28.8%), Turnu Magurele (−26.4%), Tulcea (−19.0%), Braila (−13.8%), and Mahmudia (−13.6%). Other ports, including Moldova Veche (−0.4%) and Orsova (+0.1%), exhibit near-stagnant trajectories, indicating stable but non-expanding roles within the network. These divergent growth patterns point to cumulative structural differentiation rather than uniform system-wide expansion.
Volatility analysis reinforces this heterogeneity. The standard deviation of annual growth rates highlights considerable dispersion across ports. Drobeta Turnu Severin (σ = 0.12) and Galati (0.15) display relatively stable dynamics, suggesting structural resilience and diversified hinterland demand. In contrast, ports such as Oltenita (σ = 1.89), Medgidia (0.64), Corabia (0.61), and Calafat (0.50) exhibit high volatility, reflecting episodic throughput spikes and contractions. Notably, several high-growth ports also present elevated volatility, indicating that expansion may occur alongside instability rather than through smooth structural adjustment.
When aggregated by administrative regime, distinct concentration patterns emerge. The Lower Danube (LD) administration records the highest dispersion (coefficient of variation, CV = 1.13), indicating strong polarization and concentration of throughput in a limited number of dominant nodes. The Upper Danube (UD) administration exhibits moderate dispersion (CV = 0.74), suggesting differentiated but less extreme concentration dynamics. In contrast, the DBSC administration presents the lowest dispersion (CV = 0.44), indicating a comparatively balanced throughput distribution among its ports. These results reveal a hierarchical inland port system characterized by (i) dominant high-volume nodes, (ii) expanding but volatile secondary ports, and (iii) contracting or marginal peripheral ports. Structural polarization is therefore evident both across ports and across administrative regimes. The coexistence of concentration, divergence in long-term growth, and heterogeneous volatility patterns underscores the nonlinear nature of inland port development.
Table 2 reports descriptive statistics of hinterland characteristics, aggregated using Equations (1) and (2).
Hinterland GDP exhibits pronounced dispersion, with a wide range between minimum and maximum values and strong positive skewness. The skewness coefficient confirms the presence of a small number of economically dominant hinterlands alongside several lower-scale regional systems. This asymmetry indicates structural concentration of economic activity within a limited subset of counties. GDP per capita displays more moderate dispersion but still presents positive skewness, suggesting uneven income distribution across hinterland regions. The number of transport and storage firms and manufacturing firms shows substantial variability across hinterlands. These variables are positively skewed, indicating that certain ports are embedded within highly developed logistics and industrial ecosystems, while others serve regions with thinner productive bases. Agricultural and construction firms demonstrate comparatively lower dispersion but remain unevenly distributed. The distributional patterns suggest differentiated sectoral specialization across hinterlands, with some regions relying more heavily on industrial and logistics activities and others maintaining stronger agricultural profiles. At demographic and labor scales, population and employment variables reveal clear scale effects. The gap between minimum and maximum values indicates that some ports operate within densely populated and economically active hinterlands, while others serve smaller demographic systems. The positive skewness observed in these variables confirms the concentration of labor markets in a limited number of regions. The infrastructure endowment shows that road and rail network lengths vary significantly across hinterlands. Road infrastructure shows moderate dispersion, while rail length demonstrates slightly lower variability. The skewness statistics indicate that a subset of ports benefits from extensive multimodal connectivity, whereas others operate within more limited transport networks. Such infrastructural disparities likely influence both freight generation capacity and modal integration potential. The accessibility index exhibits meaningful variability, reflecting differences in effective market potential and spatially discounted economic mass. Hinterland size (measured by number of counties) also varies considerably, suggesting heterogeneity in spatial scope. Some ports serve compact, economically concentrated territories, while others operate within geographically dispersed hinterlands. The descriptive statistics confirm that inland port hinterlands are characterized by: (i) strong economic concentration, (ii) uneven firm density distribution, (iii) significant demographic scale differences, and (iv) infrastructure asymmetry and spatial economic heterogeneity.
These findings provide empirical justification for the nonlinear modeling framework adopted in the subsequent analysis, as linear assumptions would inadequately capture the asymmetric distribution and hierarchical differentiation of hinterland characteristics.
To identify the nonlinear and interaction effects of hinterland characteristics on inland port throughput, this study employs Extreme Gradient Boosting (XGBoost), a regularized ensemble learning method based on gradient-boosted decision trees. In the XGBoost model, all scale variables are expressed in logarithmic form, while spatial and structural variables (weighted distance, hinterland size and year) are kept in levels. For programming XGBoost algorithm the R version 4.6.0 was used.
3.2. XGBoost Predictive Performance
The XGBoost model was estimated using a regression objective function (squared error loss). Model complexity was controlled through tree depth (max_depth = 4), minimum child weight (min_child_weight = 3), and L2 regularization (
). A learning rate of
was adopted to ensure stable gradient updates. Subsampling of observations (0.8) and predictors (0.8) was implemented to enhance generalization performance. Model tuning was performed using an expanding-window time-based cross-validation procedure, with early stopping (30 rounds) applied to prevent overfitting. For each validation step, the model was trained using all observations up to year
and tested on year
. This approach preserves temporal ordering and avoids information leakage. The final number of boosting rounds was determined as the median optimal iteration across validation folds. The predictive measures of performance of the XGBoost model are provided in
Table 3.
The model achieved a Root Mean Squared Error (RMSE) of 0.645 and a Mean Absolute Error (MAE) of 0.44, indicating a relatively small average deviation between predicted and observed (log-transformed) throughput values. The Mean Squared Error (MSE) of 0.416 further confirms that extreme prediction errors are limited. From a relative accuracy perspective, the Mean Absolute Percentage Error (MAPE) of 8.17% indicates that, on average, predictions deviate by approximately 8% from actual values. In forecasting applications, a MAPE below 10% is generally considered to reflect high predictive accuracy, suggesting that the model performs well in capturing throughput dynamics. The model explains a substantial proportion of the variance in port throughput, with an R-squared of 0.674 and an Adjusted R-squared of 0.655. This implies that approximately 67% of the variability in throughput is accounted for by the selected explanatory variables. The relatively small difference between R-squared and Adjusted R-squared indicates that the model is not over-parameterized and that the included predictors contribute meaningfully to explanatory power. Bias analysis shows a Mean Bias Error (MBE) of 0.016, which is very close to zero. Thus, the model does not systematically overestimate or underestimate throughput, confirming the absence of structural prediction bias. Finally, the Relative RMSE of 0.105 suggests that the Root Mean Squared Error represents approximately 10.5% of the average observed value, reinforcing the conclusion that prediction errors are small relative to the scale of the dependent variable. The performance metrics consistently reveal that the XGBoost model demonstrates strong predictive capability, high explanatory power, and minimal bias.
3.3. Global Hinterland Features Importance (RQ1)
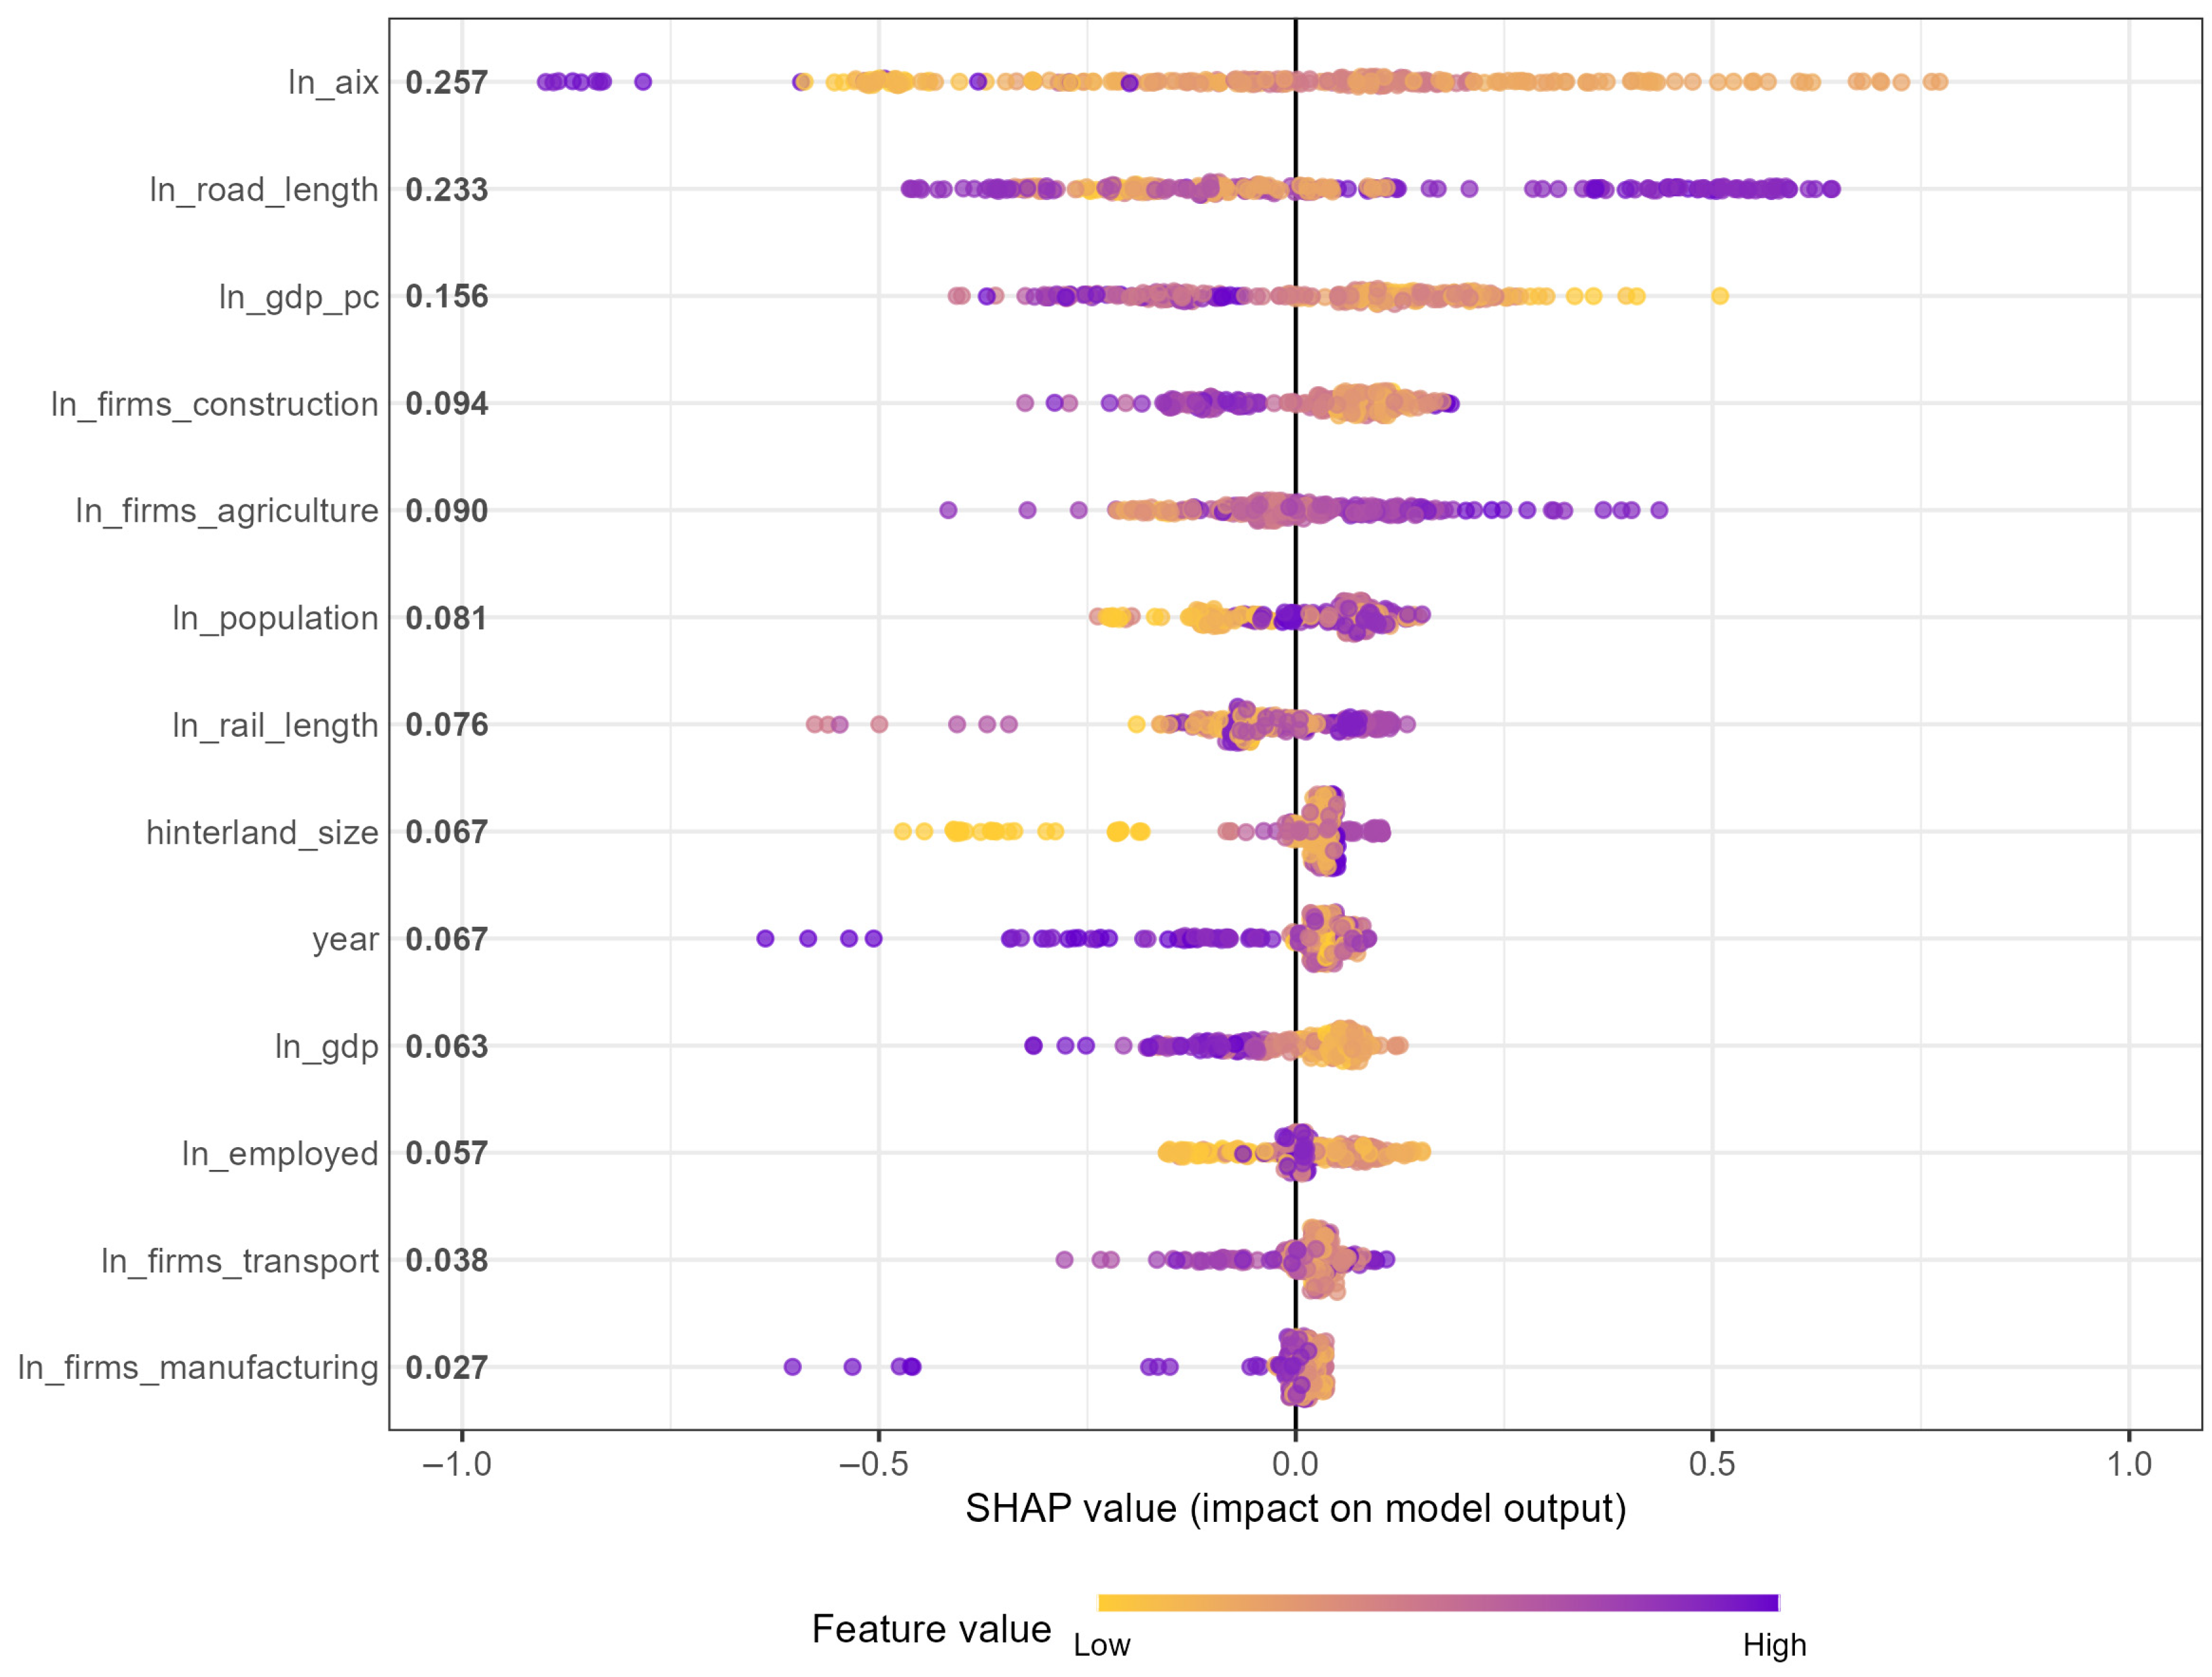
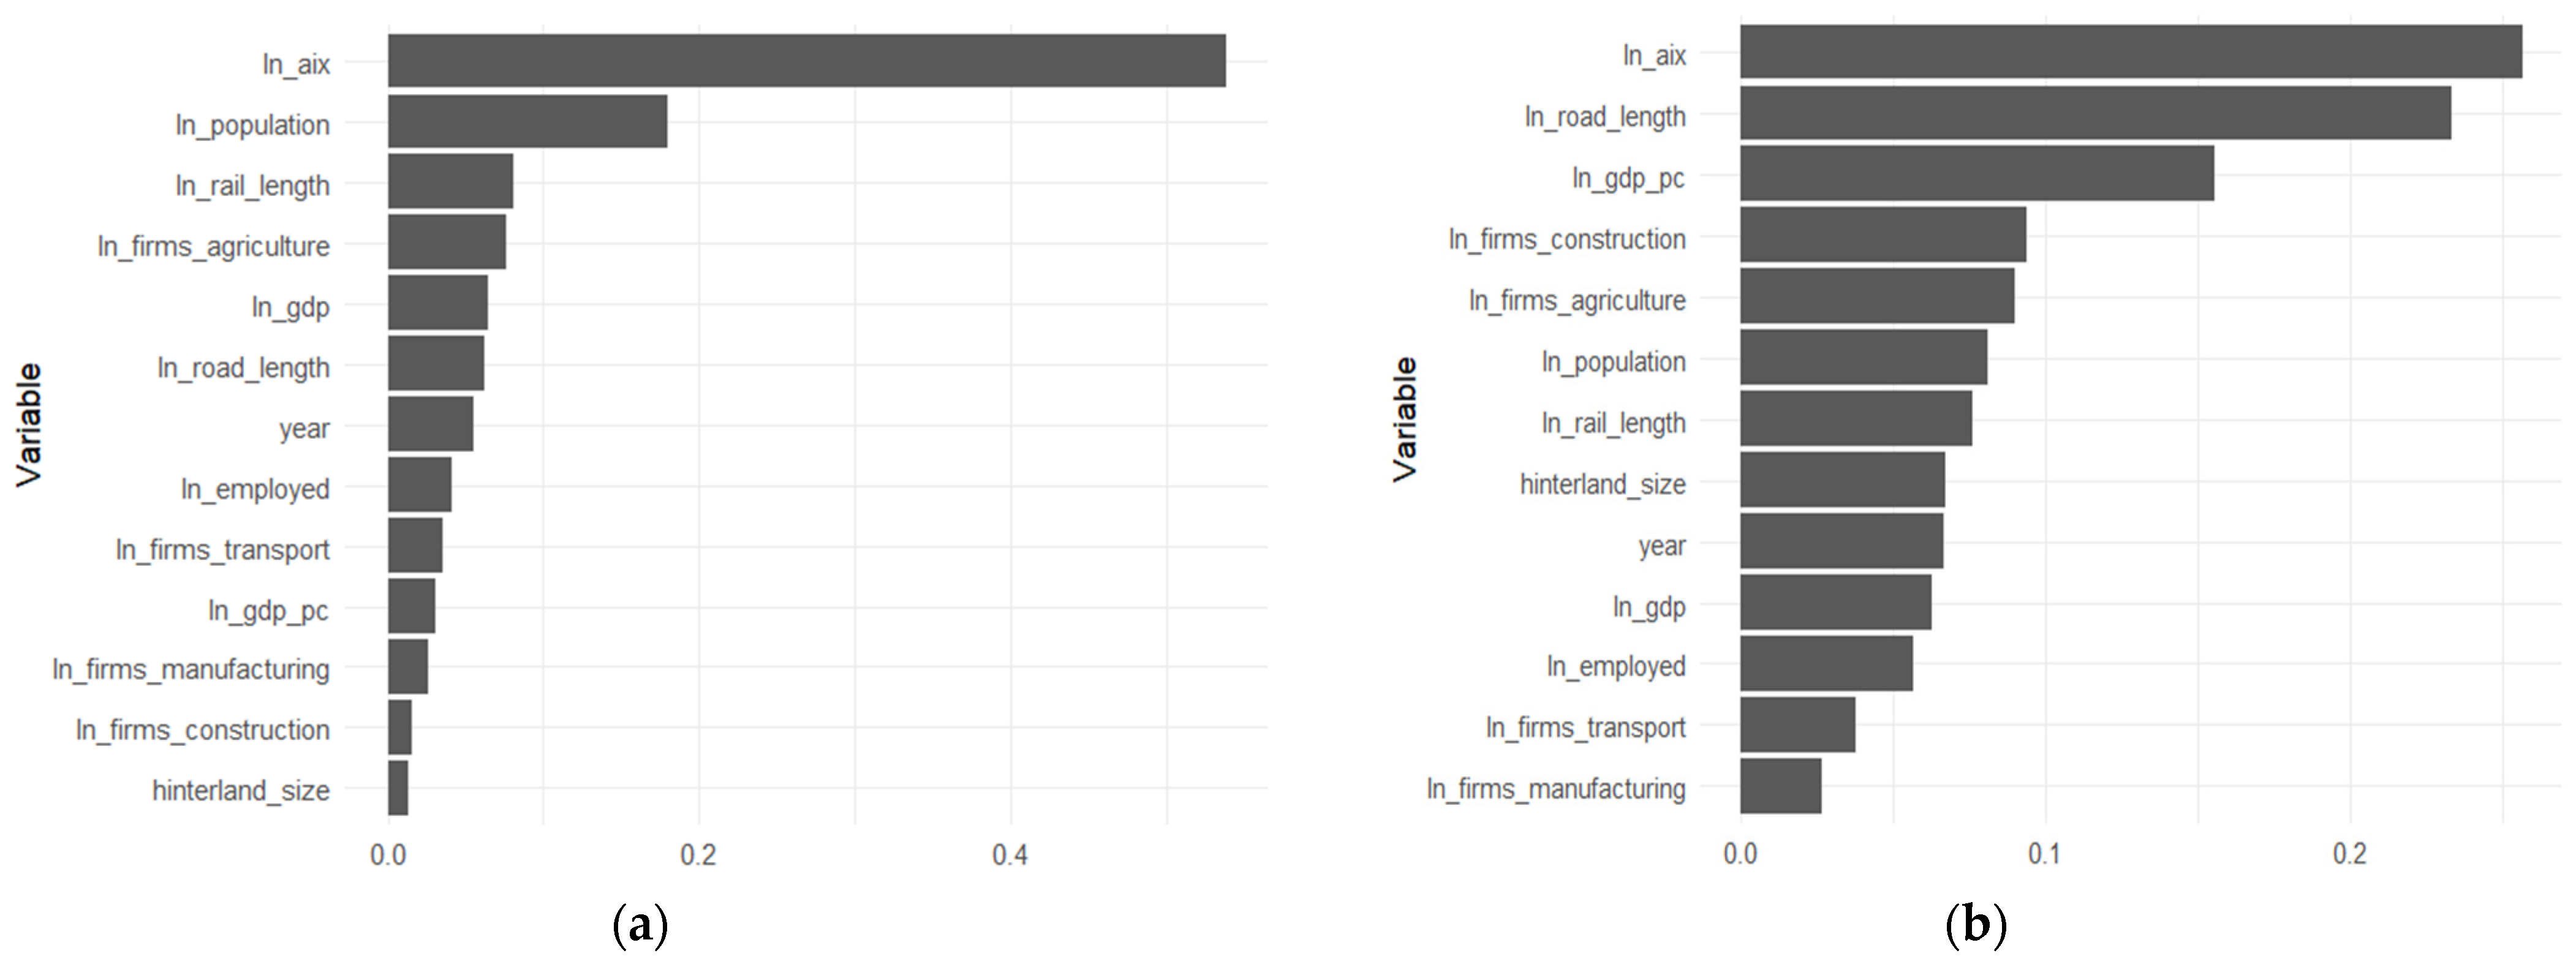
Global feature importance was evaluated using mean absolute SHAP values, which measure the average marginal contribution of each predictor to port throughput (
Figure 6). The results reveal a clear hierarchy among hinterland drivers of inland port throughput.
The most influential variable is the logarithm of the accessibility index (ln_aix, 0.257), indicating that effective economic potential accessible to the port constitutes the primary structural determinant of throughput. Unlike simple geographic proximity measures, the accessibility index captures the joint effect of economic mass and spatial friction by weighting regional GDP by the inverse squared distance. Its dominant importance confirms that inland port performance depends not merely on surrounding economic size, but on economically productive activity that is spatially reachable within friction-adjusted distance. This finding reinforces the interpretation of inland ports as nodes embedded within broader economic accessibility fields. Road infrastructure (ln_road_length, 0.233) ranks second, underscoring the importance of multimodal connectivity and regional freight consolidation capacity. Road networks facilitate short- and medium-distance freight consolidation, reinforcing the inland port’s function within regional logistics chains. The high importance of road length suggests that even when economic potential is accessible, its effective conversion into throughput depends on the quality of terrestrial transport integration. GDP per capita (ln_gdp_pc, 0.156) emerges as the third most influential driver, indicating that qualitative economic development and productivity levels matter more than aggregate economic scale. Regions characterized by higher income and economic sophistication appear to generate freight structures more compatible with inland waterway transport. Sectoral composition also plays a significant role. Construction firms (0.094) and agricultural firms (0.090) rank above several macroeconomic aggregates, reflecting the structural relevance of bulk and project-based cargo flows in inland waterway systems. The relatively stronger importance of construction and agricultural activity suggests that commodity structure shapes throughput responsiveness. Demographic scale (ln_population, 0.081) captures demand-side aggregation effects but remains secondary. Rail infrastructure (ln_rail_length, 0.076) displays moderate but meaningful contribution. The asymmetry between road and rail reflects differing integration levels between rail corridors and inland ports across regions, along with insufficient policy and market incentives to promote sustainable transport. Hinterland size (0.067) and year (0.067) exhibit moderate importance, indicating that spatial extent and temporal trends contribute to throughput variation but do not dominate structural dynamics. Aggregate GDP (0.063) ranks below GDP per capita, reinforcing the conclusion that economic quality outweighs economic quantity in explaining inland port performance. Labor market size (ln_employed, 0.057) and logistics-sector firms (0.038) contribute modestly, while manufacturing firms (0.027) show the lowest marginal impact among retained variables. This hierarchy suggests that inland waterway utilization remains more strongly linked to bulk-oriented and construction-related activities than to generalized manufacturing density. The SHAP ranking indicates that inland port throughput is primarily governed by spatially discounted economic potential and multimodal connectivity, while demographic scale, sectoral structure, and aggregate economic size play complementary but less dominant roles. The prominence of the accessibility index and road connectivity confirms that inland port development is fundamentally shaped by effective market reach rather than simple geographic proximity or administrative boundaries.
3.4. Nonlinear Effects and Threshold Dynamics (RQ2)
To formally assess nonlinear marginal effects, spline-based Generalized Additive Models (GAMs) were estimated for each SHAP–feature relationship and compared against linear specifications (
Table 4).
The nonlinear analysis indicates that only a limited subset of hinterland variables exhibits statistically significant departures from linearity. Specifically, agricultural firms (AGR), construction firms (CON), and road infrastructure (ROAD) display strong nonlinear marginal effects (), while all other variables exhibit approximately linear relationships with inland port throughput. The accessibility index (AIX) does not present statistically significant nonlinear behavior. This implies that throughput responds proportionally to changes in spatially discounted economic mass across the observed range. In practical terms, increases in effective market potential generate relatively constant marginal effects on port throughput, without evidence of abrupt thresholds or diminishing returns. Inland port systems therefore scale predictably with improvements in effective accessibility. The absence of nonlinearity strengthens the interpretation that accessibility functions as a backbone variable rather than a regime-switching determinant. In contrast, road infrastructure (ROAD) shows strong nonlinear effects. This suggests that the marginal impact of road connectivity changes across its distribution. At lower levels, improvements in road infrastructure significantly enhance connectivity and reduce generalized transport costs, facilitating hinterland integration. However, beyond the threshold, additional infrastructure contributes less to port throughput, reflecting possible saturation effects, redundancy in network coverage, or congestion-related inefficiencies. Accessibility provides economic potential, but infrastructure determines how efficiently that potential is converted into freight flows. Agricultural (AGR) and construction (CON) firms also exhibit strong nonlinear patterns. These sectors are structurally aligned with bulk and project-based cargo typical of inland waterways. For agricultural and construction activities, the nonlinear relationship indicates a transition from dispersed, small-scale production systems to more consolidated and commercially integrated structures. The nonlinear effect suggests that sectoral concentration matters more than proportional scaling. Notably, manufacturing firms (MNF) do not exhibit nonlinear behavior, reinforcing the view that inland port performance is more sensitive to bulk-oriented economic structures than to general industrial presence. GDP, GDPPC, population, and employment display approximately linear effects. This suggests that economic scale and demographic intensity contribute steadily to throughput growth without abrupt tipping points.
Inland port development therefore reflects a dual mechanism: (i) a stable accessibility-driven growth process, and (ii) a nonlinear amplification through infrastructure adequacy and commodity-specific economic concentration. This distinction reinforces the systemic interpretation of inland ports as accessibility-mediated economic nodes whose performance depends on both spatial economic reach and infrastructure-enabled flow conversion.
The threshold analysis reveals no evidence of sign-reversal effects in hinterland drivers. Instead, nonlinearities are characterized primarily by changes in marginal intensity rather than directional reversals. This pattern indicates that inland port development follows gradual, adaptive adjustment mechanisms rather than discontinuous structural breaks.
3.5. Interaction Effects (RQ3)
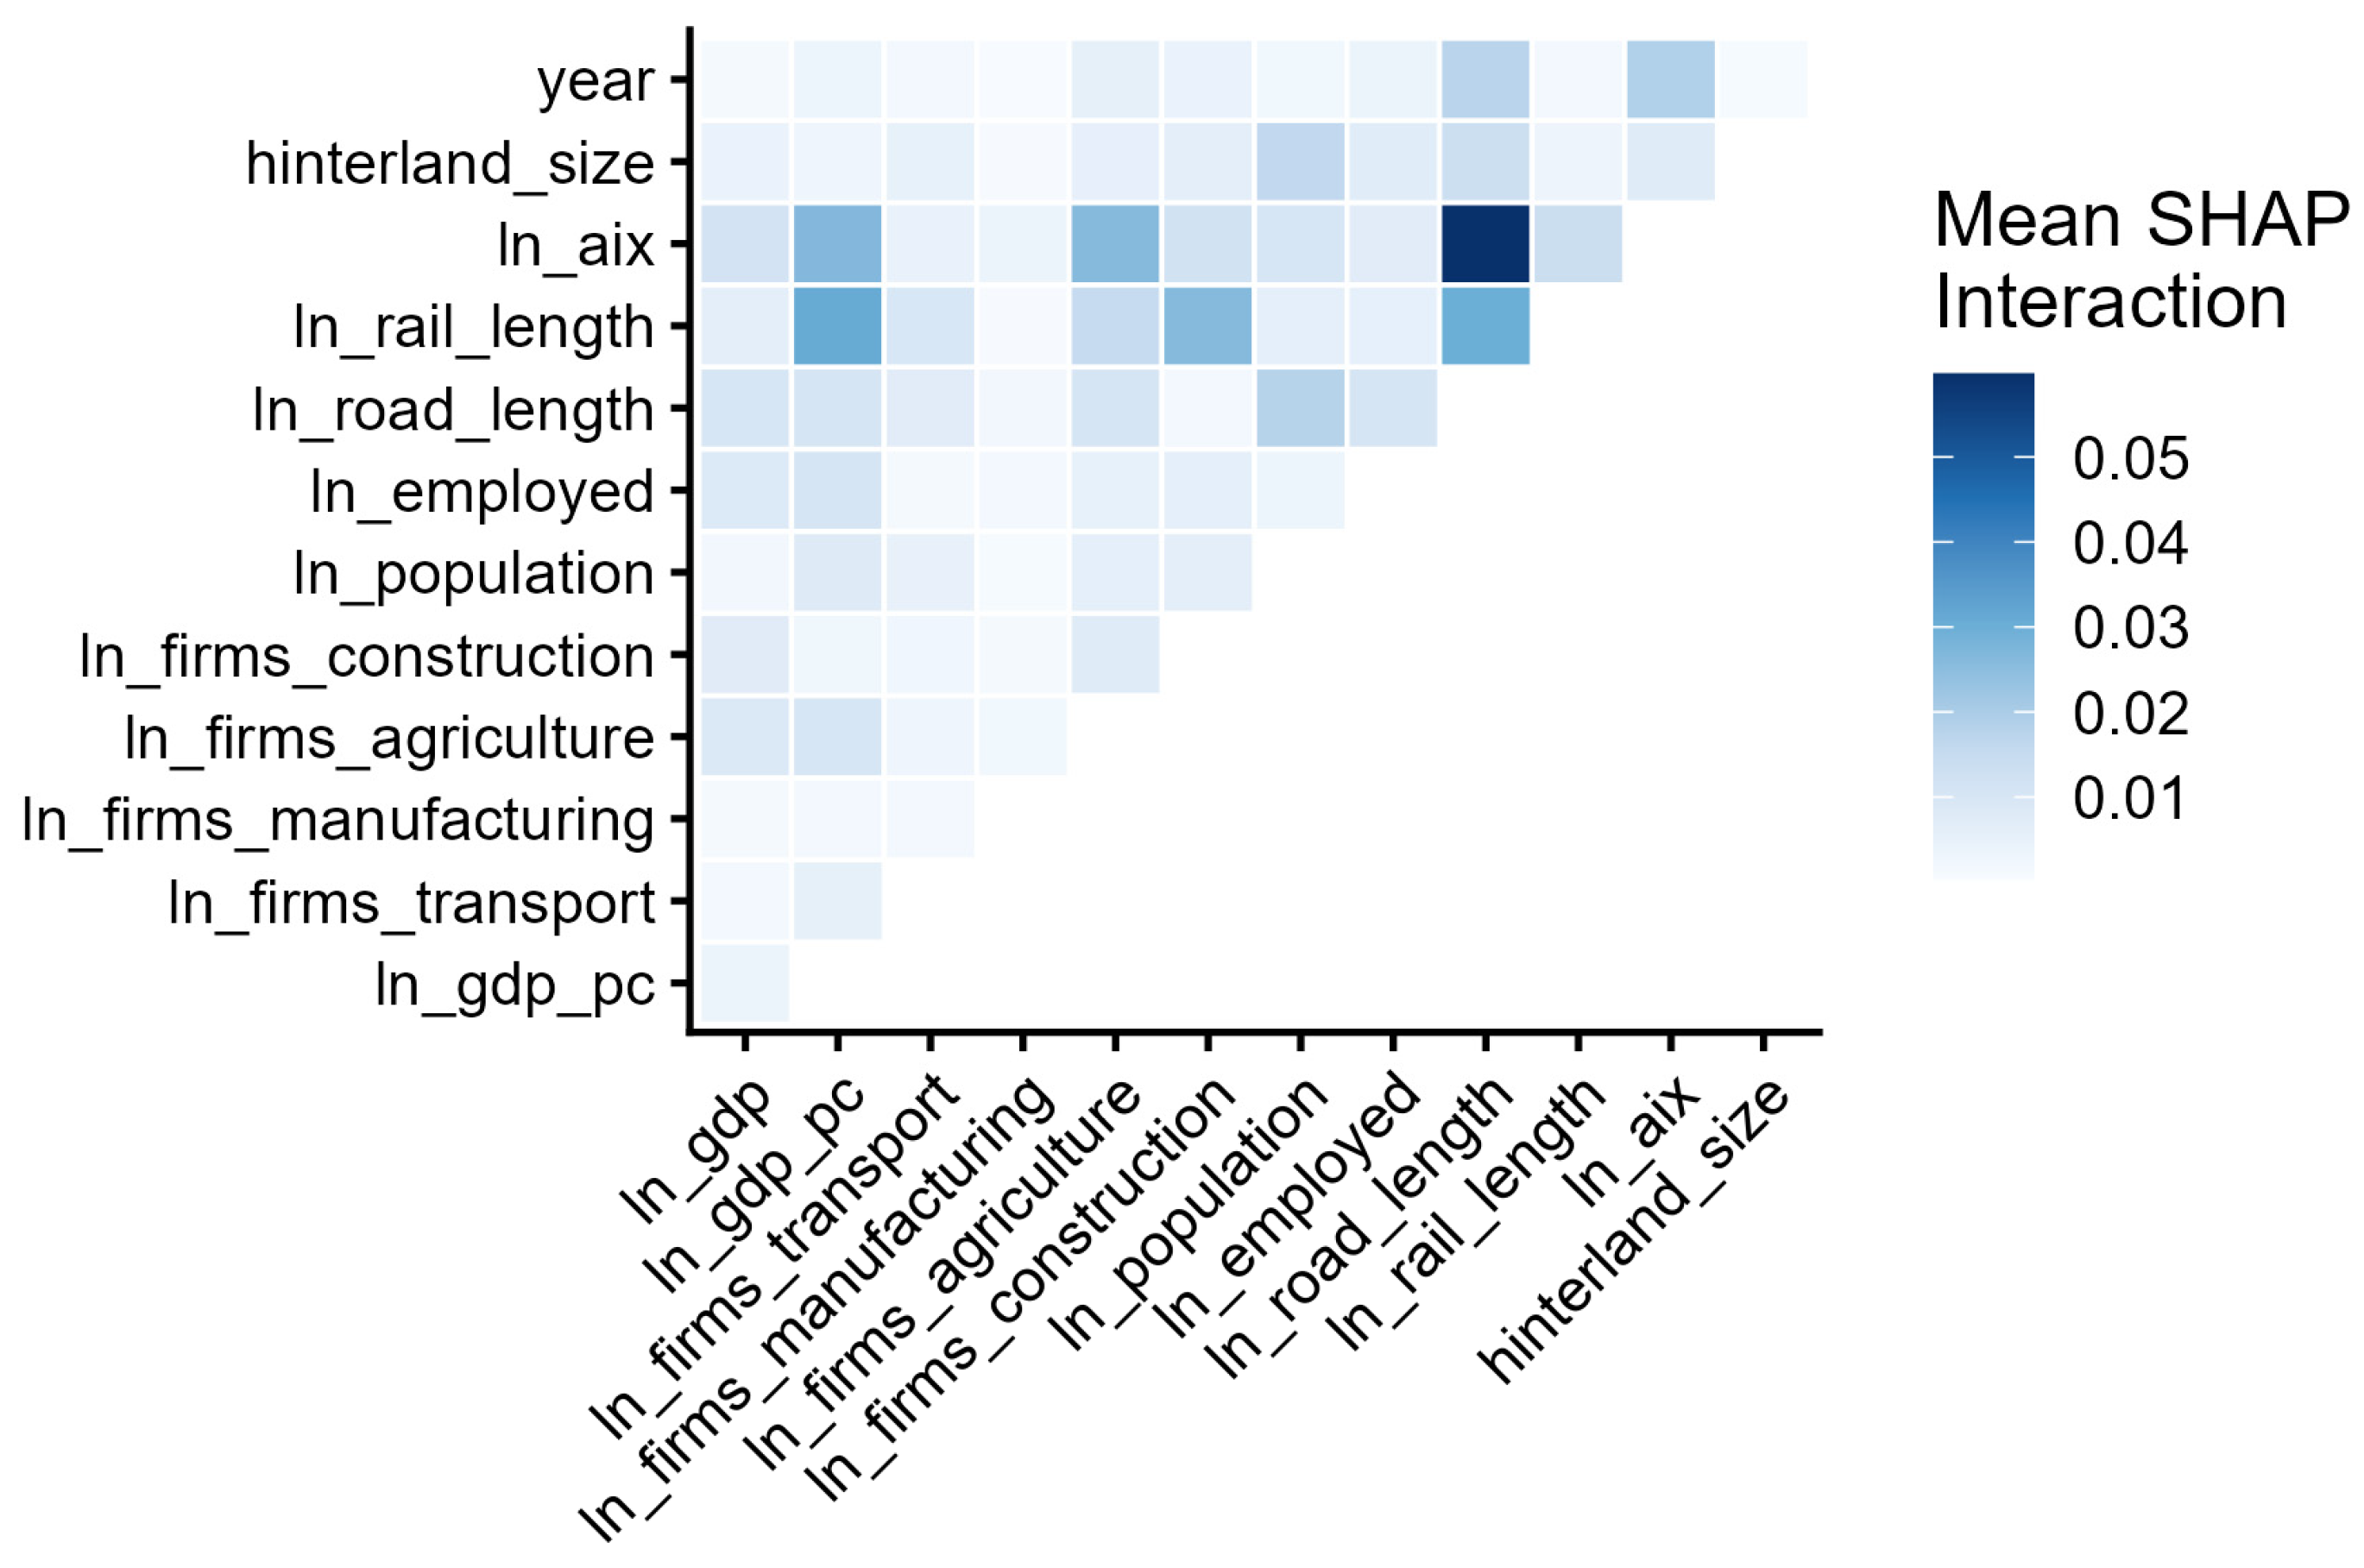
Beyond individual feature contributions, SHAP interaction values reveal how pairs of hinterland variables jointly influence inland port throughput (
Figure 7). The results indicate that port throughput is not determined solely by the independent contribution of individual hinterland variables, but by structured complementarities between accessibility, infrastructure, and economic composition.
The top six interactions indicate that infrastructure, spatial configuration and economic upgrading variables play a central integrative role in shaping port performance:
Road Infrastructure × Accessibility Index—The strongest interaction is observed between road infrastructure and the accessibility index (0.059). This confirms that accessibility and infrastructure operate jointly rather than independently. Accessibility represents the spatially discounted economic potential available to a port, while road infrastructure determines the efficiency with which that potential can be converted into actual freight flows. The magnitude of this interaction suggests that high accessibility generates substantially larger throughput gains when supported by adequate road connectivity. Conversely, strong economic accessibility alone is insufficient if road integration is weak. This finding supports a conversion complementarity mechanism: accessibility creates opportunity; infrastructure enables realization.
GDP per Capita × Rail Infrastructure—The second strongest interaction appears between GDP per capita and rail infrastructure (0.031). This indicates that rail connectivity becomes more effective in economically advanced regions. Higher-income hinterlands likely exhibit greater logistics coordination capacity, higher freight organization levels, and better integration of multimodal transport chains. Thus, rail infrastructure produces stronger throughput effects in structurally developed territories, highlighting the importance of economic sophistication in enhancing modal performance.
Road Infrastructure × Rail Infrastructure—A similar magnitude interaction is observed between road and rail infrastructure (0.03), revealing multimodal complementarity. Ports embedded in territories with both dense road and rail networks benefit from reduced generalized transport costs and improved corridor integration. This suggests that infrastructure density produces multiplicative rather than merely additive effects on throughput, reinforcing the systemic importance of network integration.
GDP per Capita × Accessibility Index—The interaction between GDP per capita and accessibility (0.027) further refines the interpretation of accessibility. It indicates that accessible economic mass generates stronger throughput effects in higher-productivity regions. In other words, not only the quantity of accessible GDP matters, but also its structural quality. Accessibility benefits are amplified in territories characterized by higher economic efficiency and value-added intensity.
Construction Firms × Rail Infrastructure—Sector-specific interactions also emerge. Construction firms interacting with rail infrastructure (0.026) suggest that rail connectivity enhances freight responsiveness in project-intensive hinterlands, where bulk and heavy cargo flows are prominent.
Agricultural Firms × Accessibility Index—Similarly, agricultural firms interacting with accessibility (0.026) indicate that accessibility gains are particularly valuable in commodity-oriented regions. These results show that sectoral composition conditions the magnitude of accessibility and infrastructure effects.
The interaction effects reveals a layered system architecture. Accessibility functions as the structural backbone. Infrastructure—especially road connectivity—acts as a conversion mechanism. Economic productivity and sectoral composition modulate the strength of these effects. Inland port throughput therefore emerges from the intersection of spatial economic potential, multimodal integration, and commodity-specific dynamics. The findings confirm that inland port development is governed by interactive spatial–economic mechanisms rather than independent linear drivers.
To assess the robustness of these interaction effects, a bootstrap resampling procedure was applied. The leading interactions exhibit moderate-to-high stability, with coefficients of variation ranging between 0.27 and 0.35 for the most important interactions, indicating consistent importance across resamples. The interaction between rail infrastructure and GDP per capita displays higher variability (CV ≈ 0.67), suggesting that its effect is more context-dependent. The results confirm that the main interaction patterns are structurally robust and not driven by sampling variability.
3.6. Variables Heterogeneity Across Port Administrations (RQ4)
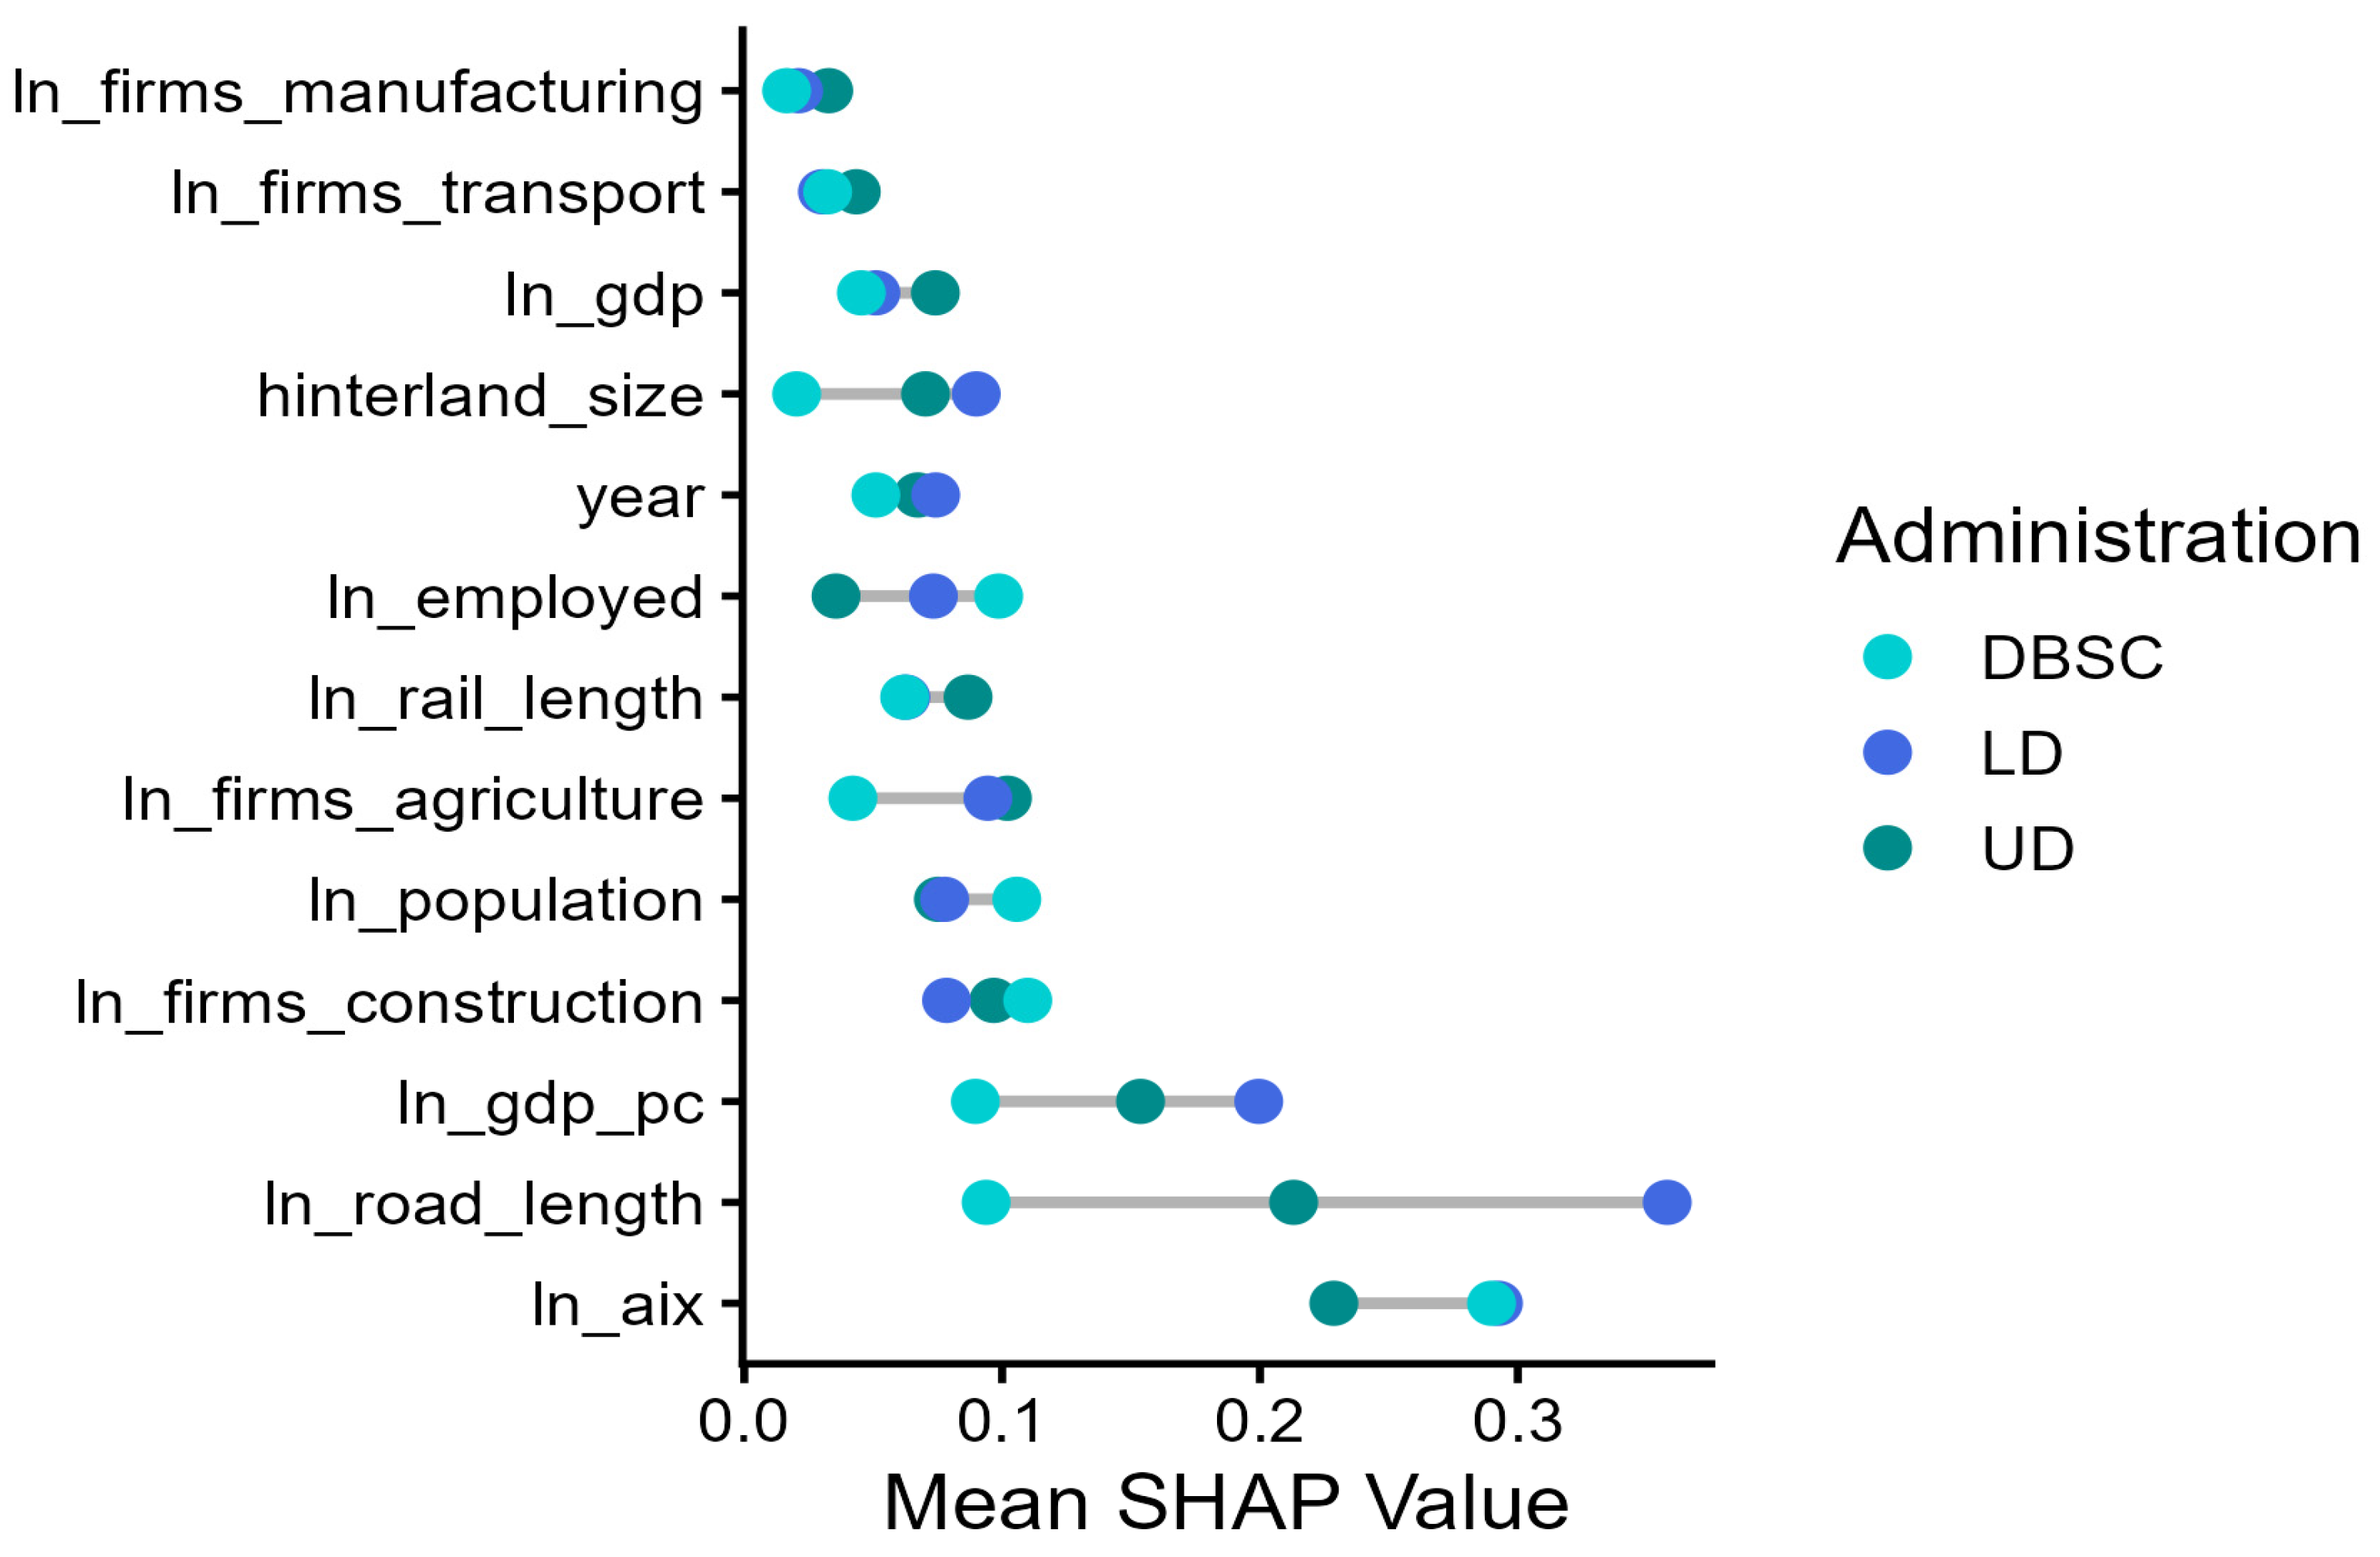
Although the XGBoost model is estimated globally, SHAP decomposition by port administration reveals several heterogeneous contribution patterns (
Figure 8).
The Kruskal–Wallis tests reveal statistically significant heterogeneity in SHAP contributions across administrations for infrastructure, sectoral composition, and economic intensity variables (
Table 5).
The accessibility index does not differ significantly across administrations (). This suggests that, despite institutional segmentation, ports operate within broadly comparable levels of spatially discounted economic potential. Road infrastructure exhibits extremely strong differences (), and rail infrastructure also shows statistically significant variation (). This indicates that administrations differ markedly in transport network density and multimodal integration capacity. Given the previously identified nonlinear and interaction effects of infrastructure, these differences likely translate into heterogeneous throughput conversion efficiencies. GDP per capita, aggregate GDP, employment, and population all show highly significant differences across administrations (), confirming that administrations are embedded in economically heterogeneous hinterlands, differing not only in scale but also in productivity and labor market intensity. Agricultural firms, construction firms, and manufacturing firms all differ significantly across administrations (). The commodity base of hinterlands varies across administrations. Given the nonlinear and interaction effects observed for agriculture and construction, these differences imply that administrations face distinct structural freight generation conditions. Interestingly, transport-sector firms do not differ significantly (). The logistics-sector density is relatively uniform across administrations, even though economic and infrastructure characteristics differ. Hinterland size differs significantly (), indicating that the spatial extent of economic integration varies by administration. However, since accessibility does not differ significantly, this suggests that spatial coverage does not necessarily translate into higher effective economic potential. The temporal trend variable is not significantly different (), confirming that the time dimension is uniformly distributed across administrations and does not bias structural comparisons.
3.7. Sensitivity Analysis
To assess the sensitivity of the results to the spatial delineation of hinterlands, an analysis was conducted using an alternative threshold of 100 km instead of the baseline 150 km. While the initial specification captures broader regional interactions and accessibility patterns, a reduced radius allows for the examination of more localized economic, social and infrastructural influences on inland port performance. This comparison is particularly relevant given the absence of a universally accepted hinterland boundary and the potential for spatial scale to influence model outcomes. This sensitivity analysis aims to determine whether there are (i) predictive stability and (ii) structural changes (SHAP importance) under a more restrictive spatial definition.
The model estimated using a 100 km radius achieves a lower RMSE (0.560 vs. 0.645) and MAE (0.371 vs. 0.440), indicating a reduction in both overall and average prediction errors. Similarly, the MAPE decreases from 8.17% to 7.05%, suggesting a higher level of relative predictive accuracy. These improvements are further confirmed by the increase in explanatory power, with R-squared rising from 0.674 to 0.753 and Adjusted R-squared from 0.655 to 0.740. From a bias perspective, both specifications perform well, with Mean Bias Error values close to zero. However, the 100 km model exhibits a slightly negative bias (−0.015), indicating a minor tendency to underestimate throughput, while the 150 km model shows a marginal positive bias (0.016). In both cases, the bias remains negligible, confirming the absence of systematic prediction errors. The Relative RMSE also improves from 0.105 to 0.091, indicating that prediction errors become smaller relative to the scale of the dependent variable when a more localized hinterland is considered. The broader hinterland captures extended accessibility and regional integration processes, while the 100 km specification emphasizes localized economic structure and immediate connectivity. The improvement in predictive performance at 100 km indicates that short-range interactions play a particularly strong role in shaping inland port activity.
Taken together, the sensitivity analysis confirms that the model has predictive stability and is not sensitive to the choice of a single spatial threshold. Instead, it reveals that inland port development is influenced by multi-scalar dynamics, where both local and regional factors are relevant, but operate with different intensities.
The comparison of SHAP-based feature importance across the two hinterland definitions reveals differences in the relative influence of explanatory variables, providing important insights into the spatial scale at which port–hinterland interactions operate (
Figure 9).
The most attaining result concerns the accessibility variable AIX which remains the most influent, but whose importance more than doubles when the hinterland is restricted to 100 km (0.582 vs. 0.257). This indicates that accessibility effects are significantly stronger at shorter spatial ranges, suggesting that port throughput is primarily driven by proximate economic mass. The Hansen-type accessibility index captures highly localized demand potential, which becomes diluted when broader areas are included. A similar pattern is observed for population, whose importance increases from 0.081 to 0.173. This reinforces the interpretation that local market size and demand density play a more critical role in shaping port activity than broader demographic aggregates. In contrast, infrastructure-related variables display a clear scale dependency. Most notably, road length experiences a sharp decline in importance (from 0.233 to 0.059) when moving to the 100 km specification. This suggests that road infrastructure exerts a stronger influence when considering extended hinterlands, where connectivity over longer distances becomes essential. Similarly, construction firms and hinterland size lose relevance in the 100 km model, indicating that these variables primarily capture broader regional development patterns rather than immediate port catchment dynamics. Rail infrastructure and agricultural activity remain relatively stable across specifications, suggesting that their effects are structurally embedded and less sensitive to spatial scale. This stability indicates that both variables represent fundamental components of inland port systems, particularly in bulk-oriented transport chains. Economic variables such as GDP and GDPPC exhibit moderate or reduced importance in the 100 km model, implying that aggregate economic output becomes less informative once the analysis focuses on highly localized hinterlands. Instead, more direct measures of activity (e.g., population, accessibility) dominate the explanatory structure. Temporal effects (year) also decline in importance under the 100 km specification, suggesting that spatial structure dominates over temporal variation when the hinterland is narrowly defined.
Generally, the SHAP comparison highlights a clear scale transition in the determinants of port performance. At 100 km, the model is dominated by local accessibility and demand-side factors (AIX, population), reflecting immediate economic interactions. At 150 km, the accessibility is also preeminent, but the model places greater emphasis on infrastructure and regional structure (road length, construction activity, hinterland size), capturing broader spatial integration processes. These findings confirm that inland port development is governed by multi-scalar mechanisms, where local accessibility drives core activity, while extended infrastructure networks shape the broader spatial organization of flows.
4. Discussion
Inland port development along the Romanian Danube is governed by a multilayered interaction between spatial accessibility, infrastructure endowment, economic structure, and administrative configuration. The discussion focuses on the hinterland defined by a 150 km radius, which encompasses the economies of both riparian and neighboring counties (
Figure 3), thereby constituting the macro-economic hinterland [
8]. A significant share of bulk commodities (e.g., ore, construction materials, and chemicals) originates from neighboring counties, whereas riparian counties are generally characterized by a predominance of agricultural activities. Rather than being driven by a single dominant determinant, port throughput emerges as the outcome of systemic interactions embedded in regional hinterland characteristics. The XGBoost results demonstrate that hinterland development drivers operate in an interactive and partially nonlinear manner, validating the use of machine learning techniques over traditional linear panel specifications. The XGBoost model achieves strong predictive capability, offers high explanatory power, and maintains minimal bias, as evidenced by its performance metrics.
4.1. Core Drivers
The ranking of SHAP values reveals four dominant dimensions of inland port development:
The SHAP results identify the logarithm of the Hansen-type accessibility index as the most influential determinant of inland port throughput. This confirms that the decisive factor is not territorial size or average distance, but the amount of economically productive activity that is accessible within friction-adjusted space. The accessibility index integrates two dimensions simultaneously: economic mass (GDP) and spatial impedance (distance squared). Its dominance indicates that inland port performance reflects a gravity-type spatial equilibrium: ports benefit most when they are positioned within dense and economically productive accessibility basins. This aligns with spatial economics models [
50,
51,
52], where accessibility captures the balance between market potential and transport cost. Importantly, the accessibility effect does not operate in isolation. It represents a structural backbone upon which infrastructure and economic structure exert complementary influences. Road infrastructure ranks second in importance, highlighting its role as a conversion mechanism. Accessibility provides potential, but infrastructure enables realization. Even when substantial economic mass is spatially reachable, throughput expansion depends on network connectivity and corridor integration [
36]. Rail infrastructure, although ranked lower, remains structurally relevant. Its moderate importance suggests that multimodal integration enhances accessibility effects but does not substitute for them. As the literature reveals, economic aggregates are also significant for port activity [
15,
43,
45].
GDP per capita ranks above aggregate
GDP, indicating that qualitative economic development exerts stronger influence than sheer economic scale. Higher-productivity regions likely generate freight structures better aligned with inland waterway transport, including organized logistics chains and value-added cargo flows. The lower ranking of aggregate
GDP suggests that economic mass alone is insufficient unless it is spatially accessible and structurally compatible with inland transport modes. Sectoral structure further clarifies this dynamic. Construction and agricultural firms display stronger contributions than manufacturing firms. This hierarchy reflects the commodity composition typical of inland waterways, where bulk, agricultural, and construction cargo dominate. Thus, accessibility effects are mediated by sectoral compatibility with river transport. Population and employment exhibit moderate importance, indicating that demand-side scale contributes to throughput variation but remains secondary to accessibility and infrastructure. These variables capture economic intensity but do not fundamentally reshape the accessibility-driven structure of the system. The findings are in line with the results provided in the literature [
44,
46]. Their role appears complementary: demographic concentration supports freight generation, yet its effect depends on the spatial and infrastructural capacity to channel flows toward inland ports.
This overall interpretation shifts the analytical focus from territorial coverage to economic integration. Ports located within economically dense but spatially cohesive regions (LD administration) benefit from compounding accessibility advantages. Conversely, ports embedded in economically weaker or spatially fragmented hinterlands (UD administration) face structural constraints that infrastructure alone may not fully overcome. The findings therefore extend port–hinterland models by demonstrating that inland port performance is governed by accessibility-driven systemic dynamics, where spatial friction, economic density, sectoral structure, and multimodal connectivity interact within a gravity-type structure.
Corridor integration and reduction in spatial friction are more impactful than simple territorial enlargement. Road and rail expansions in economically accessible zones are likely to yield stronger throughput responses than investments in structurally weak accessibility fields. Since GDP per capita exerts stronger influence than aggregate GDP, policies promoting economic upgrading and logistics sophistication may indirectly enhance inland waterway utilization. The prominence of the agricultural and construction sectors suggests that inland waterway strategies in Romania currently align more closely with commodity-specific development policies rather than with broad-based industrial expansion. Policy incentives aimed at promoting sustainable transport should therefore be strengthened to increase the share of manufactured products transported by inland waterways.
The sensitivity analysis further reinforces the multi-scalar nature of port–hinterland relationships by revealing how the relative importance of explanatory factors shifts with the spatial delineation of the hinterland. When the hinterland is restricted to 100 km, port performance becomes strongly driven by localized accessibility and demand-side conditions, as reflected in the dominant role of the Hansen accessibility index and population. This suggests that immediate economic proximity and market density constitute the primary drivers of throughput dynamics. In contrast, the 150 km specification assigns greater importance to transport infrastructure, particularly road networks, and broader structural characteristics such as construction activity and hinterland size, indicating that extended spatial integration relies more heavily on connectivity and regional development patterns. The decline in the importance of infrastructure variables at shorter distances implies that their role is primarily to facilitate longer-range interactions rather than local flows. At the same time, the relative stability of variables such as rail infrastructure and agricultural activity across both specifications points to their structural relevance within inland transport systems. These results highlight that accessibility-driven local effects and infrastructure-mediated regional effects are complementary rather than competing mechanisms, operating at different spatial scales to shape port development.
4.2. Nonlinear Effects and Threshold Dynamics
The nonlinear analysis shows that the accessibility index operates in a statistically linear manner. This implies that increases in spatially discounted economic mass generate proportionate increases in port throughput across the observed range. No abrupt tipping points or diminishing returns were detected. This finding aligns with gravity-based spatial models, where accessibility exerts a continuous and predictable structural influence. In contrast to accessibility, road infrastructure exhibits strong nonlinear effects. This indicates that the marginal contribution of road connectivity varies across its distribution, revealing threshold-sensitive dynamics. Rail infrastructure, by contrast, displays a linear relationship, suggesting that while multimodal integration matters, its marginal effects remain proportionate within the observed context. The nonlinear behavior of agricultural (AGR) and construction (CON) firms further clarifies the commodity-specific nature of inland waterway transport. Both sectors are closely associated with bulk and project cargo flows, which constitute a substantial share of Danube traffic. These results suggest that inland port performance is sensitive to structural clustering in commodity-compatible sectors rather than uniform industrial expansion. Notably, manufacturing firms do not display nonlinear effects, reinforcing the differentiated modal compatibility of sectoral activities. GDP, GDP per capita, population, and employment exhibit approximately linear effects. This indicates that economic scale and development quality influence throughput steadily rather than through abrupt regime shifts. In particular, the stronger role of GDP per capita relative to aggregate GDP suggests that economic productivity and structural sophistication matter more than sheer economic mass. The absence of nonlinear dynamics in these macroeconomic variables further emphasizes that systemic differentiation arises primarily from infrastructure adequacy and sectoral specialization rather than from economic size alone. The dual mechanism clarifies that inland port development is neither purely distance-driven nor purely infrastructure-driven. Instead, it reflects an accessibility-mediated economic system where structural potential and operational capacity interact nonlinearly.
4.3. Interaction Effects
The interaction between variables reveals that:
Accessibility and infrastructure operate jointly rather than independently. Accessibility provides economic potential, but road connectivity determines how efficiently that potential is converted into realized freight flows.
Multimodal complementarity enhances throughput more than single-mode expansion. Ports embedded in territories with both dense road and rail networks benefit from multiplicative connectivity effects and improved logistical flexibility.
Rail infrastructure also interacts with GDP per capita, indicating that its effectiveness increases in economically advanced regions. This suggests that modal integration requires structural economic sophistication. Infrastructure performance is therefore context-dependent, operating more efficiently in territories characterized by higher productivity and organizational capacity.
Sectoral structure further modulates accessibility dynamics. Inland waterway utilization depends not only on economic size but also on sectoral compatibility with river transport.
The results reveal structural mechanisms governing inland port development. First, the presence of nonlinear effects in infrastructure and sectoral variables suggests that inland port performance follows threshold-dependent dynamics, where marginal impacts vary across different levels of development. Second, the interaction effects reveal that inland port development is driven by complementarity mechanisms rather than independent contributions of individual factors. Accessibility, infrastructure, and economic structure operate jointly, forming a synergistic system in which the effect of one variable depends on the level of others. This indicates that inland ports function as embedded nodes within interdependent regional systems, where performance emerges from coordinated spatial and economic conditions rather than isolated drivers. All these findings support a systemic interpretation of inland port development as an interaction-driven and accessibility-mediated process, characterized by nonlinear responses, threshold effects, and interdependencies across spatial and economic dimensions. This perspective contributes to the theoretical understanding of port–hinterland relationships by moving beyond linear and additive frameworks toward a more integrated representation of regional transport systems.
4.4. Institutional Dimensions
The accessibility index does not differ significantly across port administrations. Despite institutional segmentation, ports appear embedded in broadly comparable accessibility fields. This suggests that structural economic reach is relatively balanced across administrations and does not alone explain performance heterogeneity. In contrast, infrastructure variables display both strong nonlinear effects and significant institutional heterogeneity. Road infrastructure exhibits highly significant differences across administrations and strong nonlinear behavior. Since road and rail infrastructure densities differ significantly across administrations, conversion capacity is regionally differentiated. Administrations with superior network integration are better positioned to capitalize on similar levels of accessibility. The Kruskal–Wallis results confirm that administrations differ primarily in amplification and modulation layers, not in structural accessibility. This institutional differentiation explains why ports embedded in similar economic basins may display divergent throughput outcomes. The integrated findings imply that inland port policy should prioritize coordinated accessibility–infrastructure alignment rather than territorial expansion alone.
4.5. Limitations and Future Research
While the present study provides a comprehensive analysis of hinterland drivers of inland port development, several limitations are presented. First, the dataset used in this study is characterized by a relatively limited number of cross-sectional units, reflecting the structural constraints of inland port systems. To mitigate potential overfitting and instability associated with small samples, the XGBoost model is carefully regularized through shallow tree depth, subsampling, and early stopping procedures. In addition, the panel structure of the data enhances the informational content by incorporating both spatial and temporal variation. The results should therefore be interpreted with appropriate caution, with emphasis on structural patterns rather than purely predictive accuracy. Second, inland port development is inherently multidimensional, encompassing operational efficiency, logistics services, connectivity, and value-added activities; this study adopts port throughput as a proxy for development and performance. Nevertheless, it is acknowledged that throughput does not capture all qualitative aspects of port development. Therefore, the results of this study should be interpreted as reflecting throughput-driven development dynamics rather than the full spectrum of port performance.
The present study opens several avenues for future research. First, the multi-scale dynamics identified in this analysis could be extended through cross-country comparative studies along the Rhine–Danube corridor or other European inland waterway systems. Comparing institutional configurations, infrastructure quality, and economic structures across countries would allow for deeper exploration of how governance regimes mediate hinterland effects. Second, future research may incorporate dynamic panel extensions or lagged dependency structures to capture temporal adjustment mechanisms. While the current model focuses on structural drivers, incorporating throughput inertia or investment lags could provide insights into path dependency and long-term equilibrium dynamics in inland port development. Third, commodity-level disaggregation represents a promising extension. Since agricultural, bulk, and construction material flows exhibit different sensitivity to infrastructure and spatial configuration, separating throughput by cargo type would allow identification of sector-specific nonlinearities and interaction effects. Fourth, integrating environmental performance indicators—such as emissions intensity, modal shift potential, or energy efficiency—would align the model more closely with sustainable development objectives. This could transform the framework from throughput prediction to sustainability-oriented performance modeling. Finally, the observed heterogeneity across port administrations suggests that institutional and governance factors play a role in shaping transport outcomes. Incorporating explicit institutional variables or comparative policy analysis would further enhance the explanatory power of the model and support more targeted policy recommendations.