


Abstract
Global, industrialization-driven environmental bottlenecks push manufacturing enterprises toward green transitions; yet, the information asymmetry between central and local governments, and between enterprises and banks, hinders this process. Adopting a systemic–synergistic perspective integrating decentralized governance and green credit, in this study, we investigate the green transition decisions of manufacturing enterprises. We construct a quadrilateral evolutionary game model involving the central government, local governments, enterprises, and banks, employing MATLAB R2022b to simulate the effects of the key parameters. Subject to the model’s structural assumptions and parameter boundaries, three core findings emerge: first, we find that punitive environmental policies outperform incentive-based instruments in driving enterprise emission reduction; second, we find that the adaptive adjustments made by decentralized governance can effectively facilitate green practices among enterprises; third, within this framework, we find that green credit exerts a non-monotonic impact on enterprises’ green transition behaviors; meanwhile banks’ assessments of enterprises’ environmental risks can indirectly promote enterprise abatement by motivating local governments through signal transmission. This study underscores the systemic synergy of decentralized governance and green credit, offering insights for multistakeholder coordination and policy optimization to advance organizational sustainability transitions for the green economy.
1. Introduction
The accelerating pace of global industrialization and the growing transgression of planetary boundaries by human activities, coupled with rampant energy overconsumption and soaring pollutant emissions, have emerged as pivotal environmental and climatic bottlenecks impeding global sustainable development [1,2]. These pressing challenges have further compelled enterprises to redefine their roles and responsibilities within the framework of a green economic system. Confronted with mounting regulatory stringency, explicit stakeholder expectations for sustainable development, and the imperative to align economic and social progress with ecological conservation, the green transition of enterprises has shifted from a voluntary strategic choice to a core strategic requirement for their long-term operation. This transition is not a unilateral technological upgrade, nor is it a case of enterprises optimizing their production processes; instead, it is a systematic endeavor involving the integration of external institutional mechanisms and the coordination of multistakeholder collaborative interactions. This transition is therefore a key factor that shapes the progress of the global economic system’s sustainable development.
In the context of driving enterprise green transition, governments worldwide have constructed external regulatory and guidance frameworks based on policy instruments, which can be broadly categorized into incentive-based strategies and punitive regulatory measures. The former centers on the provision of resource-oriented support for enterprises’ transition efforts—for instance, lowering the costs of green technology research and development (R&D) through government subsidies, and motivating enterprises to embed sustainable development principles into their strategic decision making via tax incentives [3]. The latter, by contrast, imposes mandatory compliance constraints through penalties, emission charges, etc., thereby compelling enterprises to optimize their production processes and phase out energy-intensive operational segments [4]; in turn, they advance their green transition at the operational level. However, the practical effectiveness of these policies in driving enterprises’ green transition has encountered challenges. Mild punitive measures tend to be ineffective in breaking enterprises’ path dependence on traditional high-carbon operational models; whereas excessively stringent punitive measures may exacerbate the transition-related burdens on enterprises—particularly small and medium-sized enterprises (SMEs) or those with limited transition capabilities—potentially even exposing them to bankruptcy risks, and thus impeding the overall green transition progress [5]. Concurrently, in cases where certain incentive-oriented policies are inadequately designed, they may erode enterprises’ endogenous incentives to proactively develop sustainable business models, and could even lead to the crowding-out effect, impacting enterprises’ green innovation initiatives [6].
Beyond the intrinsic design of policy instruments per se, enterprises’ decisions regarding green transition are heavily contingent on the synergistic interplay of external support systems and multistakeholder engagement. From the perspective of the external milieu for organizational transformation, local governments act as the primary enforcers of environmental policies [7], exerting a direct bearing on the efficacy of policy implementation and thus shaping enterprises’ willingness to pursue green transition initiatives. In terms of capital support, bank credit constitutes the core source of debt financing for enterprises. Leveraging green credit regulatory frameworks—such as restricting credit access to high-carbon projects and offering preferential interest rates for green investments—banks can incentivize enterprises to channel financial resources into emission reduction, clean energy substitution, and other eco-friendly endeavors [8], thereby facilitating corporate green transformation.
Nevertheless, information asymmetry in this multiagent collaborative process has become an important obstacle to enterprises’ green transition. On the one hand, asymmetric information between the central and local governments may induce non-compliant behaviors among local authorities [9], which in turn undermines the effectiveness of top–down policy support. On the other hand, information friction between enterprises and banks is prone to triggering moral hazard problems (e.g., enterprise greenwashing practices) and adverse selection issues (e.g., excessive risk aversion among banks toward transition projects) [10]. Collectively, these issues give rise to the misallocation of green resources, ultimately hindering the smooth progression of the green transformation processes.
The signal transmission mechanism provides a pivotal theoretical lens for analyzing the aforementioned dilemmas and the dynamics of enterprises’ green transitions, and its core tenet is the construction of a trusted collaborative system through information interactions among multiple stakeholders. On the one hand, government-implemented environmental penalties and subsidies do not merely serve as “constraint” or “incentive” instruments; they also function as credible certification signals that reflect enterprises’ commitment to green transition. Specifically, environmental penalties enable financial institutions to identify enterprises’ latent environmental risks, mitigate the information asymmetries inherent in green credit practices [11], and thereby alleviate the moral hazard problem among enterprise borrowers. In contrast, targeted subsidy policies signal the sustainable development potential of enterprises to the market [12], bolster investor confidence, mobilize additional external resources for enterprises’ green transition initiatives, and address the adverse selection problem in capital allocation. On the other hand, as critical stakeholders, commercial banks’ professional assessment of enterprises’ environmental risks can generate valuable feedback signals for the central government’s process of top–down governance optimization. Such assessments facilitate the central government’s accurate identification of the actual progress and core bottlenecks in local enterprises’ green transition endeavors, thereby prompting local governments to refine their targeted support strategies and enhance policy effectiveness.
Amidst these practical contexts and highlighting signal transmission in mitigating information asymmetry, in this study, we develop a four-party evolutionary game model encompassing the central government, local governments, enterprises, and banks. This area is approached from a systemic–synergistic perspective, integrating decentralized governance and green credit to investigate manufacturing firms’ green transition decisions. We address three core research questions: (1) How do punitive and incentive policies affect enterprises’ green transition under centralized governance? (2) How do adaptive adjustments in decentralized governance influence environmental policy effectiveness? (3) From a regulatory perspective, how does the green credit mechanism shape enterprises’ green transition decisions and synergize with decentralized governance?
Rooted in Kooiman’s system governance theory [13], this study regards the environmental governance of manufacturing enterprises’ green transition as a diverse, dynamic and complex system. In this system, central and local governments act as public governance subjects, while enterprises and banks are private ones; the four parties are interdependent, mutually shaping strategic actors with intentional interactions. The systemic dimension corresponds to the wholeness and cross-level nature of Kooiman’s governance system, and the synergistic dimension refers to the coupled interaction of hierarchical governance (central–local administrative control), collaborative governance (government-enterprise-bank cooperation), and self-governance (enterprise green transition decisions, bank green credit risk control). This analytical framework transcends the traditional limitation of focusing solely on internal enterprise factors or single policy tools; instead, it allows us to explore the transmission mechanism through which external support systems drive enterprises’ green transition decisions via collaborative interactions. Thus, in this study, we identify the evolutionary logic of multistakeholder collaboration in enterprise green transition and provide theoretical references for managerial decision making.
In this study, we make three key contributions to the extant literature as outlined below: (1) We fill the research gap that has been created by isolated analyses of decentralized governance and green credit in the field of environmental governance; for the first time, we integrate the two into a unified analytical framework from a systemic–synergistic perspective. By constructing a four-party evolutionary game model, we reveal the two-way synergistic mechanism between decentralized governance and green credit, breaking the research predicament of overreliance on single policy instruments or individual subject behaviors. (2) Based on signaling theory, we identify banks as the key signal intermediary for cross-level information transmission in environmental governance, and innovatively clarify the dual-dimensional (horizontal and vertical) signal transmission mechanism. We further expound the way in which banks’ environmental risk assessments drive the behavioral adjustment of local governments through vertical signal transmission, indirectly promoting enterprise emission reduction and elucidating the role of green credit in mitigating information asymmetry between central and local governments. (3) In this study, we incorporate the loss-aversion principle of behavioral economics into the multiagent evolutionary game framework. We verify the superiority of punitive policies over incentive policies in promoting enterprises’ green practices, uncover the non-monotonic relationship between environmental subsidies and corporate green transition decisions, and we define the boundary conditions for translating enterprises’ penalty-induced loss aversion into actual green transition behaviors under decentralized governance.
The rest of this study is organized as follows: in Section 2, we review the literature; in Section 3, we introduce the assumptions and construction of the evolutionary game model; in Section 4, we present the evolutionary game analysis; in Section 5, we conduct simulations to validate the model system, and discuss the results; finally, our research findings are summarized and policy implementations are proposed in Section 6.
2. Literature Review
2.1. Decentralization and Environmental Governance
In decentralized environmental governance, the central government establishes a monitoring and regulatory mechanism that incorporates both incentivizing measures and punitive actions. Meanwhile, local governments are entrusted with policy execution [14,15,16], as they are typically better positioned to manage and enforce emission control within their jurisdictions [17]. Previous studies have examined the positive influence of decentralization on environmental governance from various perspectives, including organizational settings [15], fiscal decentralization [18], and regulatory discretion [19].
However, information asymmetry impedes the central government’s acquisition of specific details concerning policy implementation at the local level [20,21]. Simultaneously, local governments lack a comprehensive perception of the governance objectives and determinations of the central government [22]. Under such circumstances, given the public goods nature of the environment, local governments may prioritize their interests over those of the central government by lowering environmental standards to attract business investments for economic development [18], or even collude with local enterprises to foster rent-seeking behaviors among businesses [22,23].
In an analysis of administrative decentralization in Portuguese coastal municipalities, Arroyave et al. developed a four-factor framework for high-performance local environmental governance, which includes institutional capacity, financial and political autonomy, multi-level collaboration, and local political willingness [24]. Their work reveals that uniform central mandates and heterogeneous municipal capacity frequently undermine the effectiveness of formal decentralization reforms, underscoring the need for context-specific institutional design for decentralized environmental governance. In a 25-year panel analysis (1991–2016) of 52 countries, Jin et al. identified an inverted U-shaped relationship between fiscal expenditure decentralization and sustainable development, defining an optimal decentralization range of 30.9% to 34.5% [25]. Their work demonstrates that both excessive and insufficient decentralization erode public goods provision efficiency, underscoring the critical need for institutional balance in decentralized environmental governance.
Recent international scholarship [24,25] has advanced understanding of decentralized environmental governance by defining its optimal institutional boundaries and core barriers (e.g., intergovernmental information asymmetry). However, this strand remains confined to hierarchical intergovernmental systems, with limited attention to interactions between decentralized governance and market-based instruments (notably green credit), and no exploration of how market actors can mitigate central–local information asymmetry via signal transmission.
2.2. Green Credit and Enterprise Green Practices
According to the guidance and requirements of green credit, banks should give priority to reviewing the environmental and climate risk information of enterprises in the credit assessment process [26]. By optimizing the allocation of credit resources, green credit can restrain the expansion of high-emission industries [8], thereby guiding enterprises to embrace green transitions and achieve the goals of environmental protection and energy conservation [27]. Previous research has examined the positive impact of green credit in various aspects, including corporate green innovation [28], and the efficiency of green investment and green production [29,30].
However, enterprises may deceive financial institutions and investors by fabricating reporting materials [10] and engage in “greenwashing” practices that involve concealing environmental pollution and presenting unrealistic environmental performance through artificially distorted disclosures [31]. This moral hazard exhibited by enterprises can undermine the effectiveness of green credit implementation [32]. Additionally, scholars have also identified adverse selection by banks. Banks generally show limited tolerance for the short-term innovation failures of enterprises [33] and tend to be cautious by reducing loans to high-emission enterprises, thereby constraining the funds available for these entities to invest in emission-reduction endeavors [34]. This can be attributed to the fact that green investments, which are characterized by a long investment cycle and high risks, impede banks’ lending capacity without generating immediate profit returns [35].
Recent studies have explored the dual impacts of green credit and operational mechanisms across different contexts. Abadie et al. conducted experimental research on UK SMEs and found that carbon offsetting, a key component of green credit practices, has a non-monotonic effect on corporate green behavior—affordable carbon credits promote genuine environmental innovation, while high-cost credits may induce greenwashing due to information asymmetry [36]. Dogah et al. examined listed companies in the global energy industry and revealed that green credit policies initially negatively impact corporate financial performance, but this effect is mitigated by technological innovation, highlighting the moderating role of innovation capacity in green credit implementation [37].
Cutting-edge studies [36,37] document the non-monotonic effects and heterogeneous boundary conditions of green credit, identifying information asymmetry as the core constraint on its effectiveness. Nevertheless, extant research is largely confined to horizontal bank-enterprise interactions, rarely embedding green credit within vertical decentralized governance frameworks, and has yet to clarify how banks’ environmental risk assessment functions as a cross-level signal intermediary, nor the two-way synergistic mechanism between decentralized governance and green credit.
2.3. The Application of Evolutionary Game Theory in Environmental Governance
The framework of evolutionary game theory is widely employed in environmental governance research to study dynamic interactions and decision making among stakeholders [11]. From a regulatory perspective, the pertinent literature primarily focuses on the relationship and strategies between polluters and environmental enforcers [38]. Some studies also examine interactions between the central and local governments [14,39], as well as non-government actors, such as the general public [1,40] and external stakeholders [41]. Research topics include the emission trading system [42], building environmental protection renovation [43], the impact of fiscal decentralization and fiscal policy [16,44], and the comparison of different regulatory policies [45].
From a financing perspective, the relevant research investigates enterprises’ greenwashing behavior and technological innovation by incorporating the strategic analysis of investors and banks [11,46]. By integrating credit financing with supply chains, Chen et al. investigated the relationships and strategies among commercial banks, suppliers, and manufacturers to explore the promoting effect of green credit on the green transition of China’s plastic supply chain [26]. Hong and Qin discussed the strategic choices of small and medium-sized enterprises, financial institutions, and core enterprises in green supply chain finance [47].
While evolutionary game theory provides a robust framework for dynamic multistakeholder interactions in environmental governance, two key limitations persist. First, most studies are trapped within the single evolutionary game paradigm, lacking cross-integration with relevant theories (systemic governance, signaling, loss aversion theory), weakening explanatory power for multiagent collaborative governance. Second, existing evolutionary game studies on environmental governance mostly focus on two-party or three-party game models, and even the few four-party models fail to integrate the hierarchical intergovernmental governance system and the market-based green credit system into a unified analytical framework, making it difficult to reveal the systemic–synergistic mechanism across public governance and private market subjects.
2.4. Research Gap
Extant literature lays a solid foundation for the present study, yet three distinct and interrelated theoretical gaps persist, which correspond directly to the core contributions of this research. Table 1 presents a focused comparison with the most closely related studies.
Table 1.
Comparison with the closest relevant literature.
First, research on decentralized governance and green credit has adopted isolated paradigms, with no unified systemic-synergistic analytical framework yet established. Recent international work has advanced two separate strands: Arroyave et al. and Jin et al. defined the optimal boundaries of decentralized environmental governance [24,25], while Abadie et al. and Dogah et al. clarified green credit’s heterogeneous effects [36,37]. However, these two strands remain theoretically segmented, with no unified analytical framework integrating hierarchical public governance and market-based financial regulation from a systemic governance perspective. Existing research [14,39,46] has not revealed the synergistic mechanism between the two instruments, nor broken the overreliance on single-policy analysis.
Second, the one-way application of signaling theory has resulted in the neglect of banks as cross-level signal intermediaries between governments. Extant studies widely recognize information asymmetry as the core barrier to the effectiveness of both decentralized governance and green credit [24,36]. However, signaling theory applications in this field are limited to one-way horizontal transmission, creating a critical gap: existing research [11,12] focuses solely on how government actions transmit corporate environmental risk signals to financial markets, but ignores banks’ role as cross-level signal intermediaries between the central and local governments. It has not clarified the dual-dimensional (horizontal and vertical) signal transmission mechanism, nor how banks’ environmental risk assessment alleviates principal–agent problems in decentralized governance.
Third, loss aversion theory remains poorly integrated with multiagent environmental governance research, leaving the boundary conditions of policy effects underexplored. Recent scholarship has identified the non-monotonic effects of environmental policy instruments [25,36], but has not provided a systematic micro-behavioral explanation for this phenomenon. Although C. Liu et al. applied the loss-aversion theory of behavioral economics to the interpretation of corporate greenwashing behaviors [11], they have not achieved deep cross-integration between loss aversion theory and the implementation scenarios, institutional constraints, and functional boundaries of multiagent environmental governance.
3. Model Development
3.1. Model Assumptions
3.1.1. Stakeholders and Strategies
This section constructs the evolutionary game model to explore enterprises’ decisions on green transition under the framework of decentralized governance and green credit. This study delineates the system within which enterprises make decisions related to the green transition, involving four types of stakeholders: the central government (serving as the top-level regulator), the local government (acting as the policy executor), the enterprise (functioning as the green transition implementer), and the bank (operating as the signal intermediary).
The system boundary excludes external factors, such as public supervision and international policies, so as to concentrate on the core synergy. This exclusion is a rational research design choice, enabling an accurate focus on the core research objective of this study: namely, analyzing manufacturing enterprises’ green transition decision making under the synergistic effect of decentralized governance and green credit mechanisms. Thus, the research subjects are strictly defined as the central government, local governments, enterprises, and banks; accordingly, we are able to avoid the interference of non-core external factors on the analysis of the game relationship and internal operation mechanism of the core system.
The relationships among the four participants are illustrated in Figure 1. The central government () can choose between centralized and decentralized environmental governance modes. In the centralized mode, it imposes strict penalties on local governments and banks for any misconduct and provides fiscal support and incentives for their active participation. In the decentralized mode, more responsibilities are delegated to local governments, and banks are encouraged to exercise financial supervisory duties. Local governments () can opt for either high or low participation in environmental governance. High participation means strict regulatory measures with incentives and penalties, while low participation means lenient regulations and penalties. When local governments adopt the high-participation strategy, stringent regulations act as a signal to mitigate the information asymmetry between enterprises and banks, thereby alleviating moral hazard from enterprises and adverse selection from banks. Banks () can assess or not assess the environmental risks of borrowing enterprises. Under the assessment strategy, banks offer green loans to enterprises with effective emissions management and deny loans to those without; under the non-assessment strategy, banks offer general loans to any enterprise. Banks’ assessments of environmental risks provide the central government with valuable insights into local environmental governance. Thus, the central government incentivizes local governments to implement regulations strictly through reward and punishment mechanisms, ultimately achieving effective emissions control by enterprises. Enterprises () need to determine whether or not they should embark on a green transition. Enterprises that opt for green transitions can effectively reduce their emissions, thereby qualifying for government subsidies and preferential credit terms; conversely, those that refrain from such transitions fail to curb emissions effectively and are thus subject to penalties imposed by local governments and credit-related constraints from banks.
Figure 1.
The relationship among the four stakeholders.
It is important to clarify that the scope of green credit within this study’s framework is defined as banks’ environmental risk assessment of enterprises. This focus centers on banks’ core roles as signal transmitters and information intermediaries, rather than elaborating on the complete financial dimensions of green credit (e.g., credit pricing, credit quota adjustment, and interbank competition). This narrow framing is made with the intention of ensuring a better focus on the core research objective of this study—analyzing the systemic synergistic mechanisms between decentralized governance and green credit. Notably, signal transmission serves as a crucial bridge underpinning the synergy between green credit and decentralized governance, with a detailed exposition of this mechanism provided in Section 3.1.3.
3.1.2. Parameter Description and Related Assumptions
Assuming a probability of for the central government’s choice of “centralized governance”, represents the probability of “decentralized governance”, where . Assuming that the probabilities of local governments, enterprises, and banks adopting the cooperative strategies (high participation, green transition, and environmental risk assessment) are , , and , respectively (where , , and ), the probabilities of these stakeholders choosing the defection strategies are represented by , , and . The relevant parameters involved in the evolutionary game model are summarized in Table 2.
Table 2.
Description of parameters in the game model.
The four types of stakeholders are assumed to formulate their respective strategies, subject to bounded rationality and limited information. Their revenue and expenditure structures are elaborated here:
(1) Under a centralized governance mode, the cost of the central government’s investment in environmental regulation is represented as . The central government offers fiscal support () and green credit incentives () to local governments and banks that adopt proactive strategies; conversely, punitive measures are imposed on those who take defensive actions ( and , respectively). Social welfare losses () due to environmental and climate change fall under the central government’s expenditure costs, and the share of the central government in enterprises’ comprehensive tax revenue is represented by .
In addition, we define the parameter () as the degree of centralized governance by the central government; this is a continuous endogenous parameter that quantifies the extent of the central government’s direct participation in environmental regulation and policy enforcement, and its reciprocal reflects the degree of decentralized governance. Conceptually, is a rights delegation coefficient that characterizes the principal–agent relationship between the central and local governments in environmental governance; the value of is negatively correlated with the degree of decentralized governance. When , the central government adopts a pure, centralized governance mode, taking full responsibility for environmental regulation, directly formulating and enforcing all environmental policies, and bearing the full environmental regulation cost, ; when , the central government adopts a pure decentralized governance mode, delegating most environmental governance execution rights to local governments, and only retaining the top-level design and supervision rights of environmental policies. In the evolutionary process of environmental governance, the central government gradually transfers governance power to local governments, which is reflected in .
Mathematically, serves as a scaling factor for the central government’s environmental regulation costs and punitive intensity under the decentralized governance mode; all variables pertaining to the central government’s direct enforcement in the centralized mode are adjusted by in the decentralized governance mode. Consequently, the central government’s environmental regulation costs and associated punitive measures are reduced under the decentralized governance mode, which are denoted as , , and with the condition of .
(2) When implementing “high participation”, local governments bear the costs of environmental supervision, denoted as , while simultaneously offering subsidies () and tax reductions (at a rate of ) to enterprises that reduce emissions through green transitions. However, a conflict of interest is likely to exist between the central government and local governments concerning environmental regulation [39]. The level of local government participation in environmental governance, denoted as , exerts an influence on the magnitude of their supervision costs and penalties imposed on enterprises, which consequently are denoted as and when . In addition, the environmental pollution and emissions generated by non-green-transition enterprises will undermine the reputations of local governments that fail to implement proactive environmental governance strategies (denoted as ).
(3) The strategic decision making of enterprises is primarily driven by economic interests. If an enterprise adopts the green transition strategy, it will secure an economic benefit of while incurring additional costs associated with emission abatement (), and will also qualify for government subsidies, tax reductions, and preferential credit terms. Conversely, if an enterprise refrains from undertaking green transitions, it will receive an economic benefit of , yet will incur penalties () imposed by the local government. The benefits derived from green technological innovation have the potential to offset the costs of emission reduction, as suggested by the strong Porter hypothesis [48]. However, empirical evidence indicates that the weak Porter hypothesis is more applicable to reality, especially in developing countries [40]. Therefore, we assume . In addition, the operating income of enterprises is subject to taxation at a rate of .
For most manufacturing enterprises, their green transition entails upfront sunk costs for emission reduction () as well as long-term R&D investment in green technologies, with the economic returns from green innovation exhibiting a significant temporal lag. By contrast, enterprises that forgo green transition avoid this additional cost burden of , retaining the economies of scale and low marginal costs inherent to traditional high-carbon production models, and thus securing greater short-term intrinsic economic benefits. Empirically, this theoretical assumption is validated by microlevel data from the sample of enterprises in this study—111 listed companies under key pollution monitoring (see Section 5.1.1). Here, the average total profit of enterprises with environmental violations (non-green-transition enterprises) is significantly higher than that of their non-violating counterparts (green transition enterprises), which directly corroborates the short-term economic advantage of abstaining from green transition.
(4) Banks incur additional assessment costs () when conducting environmental risk assessments on enterprises, but they are eligible for incentives from the central government (). Conversely, if a bank provides loans to enterprises without conducting assessments, it will incur penalties imposed by the central government (). Assuming that the general loan interest rate is denoted as and the preferential loan interest rate for green credit is denoted as , where .
3.1.3. Signal Transmission Mechanism
As shown in Figure 1, the signal transmission effect serves as the core mechanism for alleviating information asymmetry between the central and local governments, as well as between enterprises and banks, in the model constructed for this study. The key signal transmission mechanisms within the system can be divided into two core dimensions: horizontal and vertical. The interactive synergy of the two types of signals constitutes the systemic–synergistic mechanism of the multistakeholder, which is an application of Kooiman’s interactive governance theory [13] in the field of environmental governance.
- Horizontal Signal Transmission
Horizontal signal transmission refers to the process whereby local governments’ high participation in environmental governance acts as a credible supervisory signal, conveying the actual intensity of regional environmental regulation to enterprises and banks and thus mitigating the information asymmetry between the two parties. This signal transmission process is the embodiment of hierarchical governance behavior, shaping the self-governance context of private subjects in the environmental governance system [13]. In local governments, which are the executors of central hierarchical governance, high-participation environmental supervision behavior is a typical intentional governance action; the formation and transmission of the supervisory signal optimize the information interaction quality between enterprises and banks—two private subjects with self-governance attributes. When local governments adopt a high-participation strategy (), they enforce stringent environmental supervision and penalty measures, which can effectively curb enterprises’ greenwashing practices (moral hazard). Meanwhile, this stringent supervisory signal provides banks with authentic information on the environmental performance of borrowing enterprises, alleviating banks’ risk aversion to green credit (adverse selection).
Mathematically, we define the horizontal signal transmission efficiency function as , where denotes the horizontal signal transmission efficiency coefficient, capturing the capacity of local governments’ supervisory actions to convey valid information to the bank–enterprise system. is a strictly increasing function of , which denotes a higher probability of local governments adopting high-participation environmental governance strategies; this leads to a more credible supervisory signal, and thus a more pronounced mitigating effect on the information asymmetry between enterprises and banks. According to Kooiman’s theory [13], the improvement of signal transmission efficiency can enhance the interaction quality of the bank–enterprise subsystem, which is the core prerequisite for improving the overall governance capacity of the environmental governance system.
For enterprises, the likelihood of engaging in moral hazard (i.e., greenwashing) is inversely related to ; the higher the signal transmission efficiency, the lower the incentive for enterprises to conduct speculative behavior. For banks, the tendency toward adverse selection (manifested as excessive risk aversion to green credit) is also inversely related to ; the higher the signal transmission efficiency, the greater the willingness of banks to offer preferential green credit policies.
- Vertical Signal Transmission
Vertical signal transmission refers to the process whereby banks’ environmental risk assessments act as credible evaluation signals, conveying the actual environmental performance of local enterprises to the central government and thereby mitigating information asymmetry between the two levels of government. From the perspective of Kooiman (2003) [13], this signal transmission process realizes the feedback of private subjects’ self-governance behavior to the multilevel hierarchical governance system. This breaks the one-way information flow of traditional top–down hierarchical governance and forms a two-way interactive governance structure between public and private subjects. Owing to information frictions between central and local governments, local governments may engage in opportunistic behaviors, such as lowering environmental standards to attract investment. As financial intermediaries, banks can garner first-hand information regarding enterprises’ environmental risks through professional assessments, with the results serving as a third-party evaluation signal that enables the central government to accurately identify the actual effectiveness of local environmental governance.
Mathematically, we define the vertical signal transmission efficiency function as , where denotes the vertical signal transmission efficiency coefficient, capturing the capacity of banks’ environmental risk assessment behavior to transmit valid information to the central–local government system. is a strictly increasing function of , which denotes a higher probability that banks will adopt environmental risk assessment strategies; this generates a more credible evaluation signal, and thereby enables the central government to form a more precise judgment of the actual performance of local environmental governance.
For the central government, the efficiency of environmental governance is positively correlated with ; the higher the signal transmission efficiency, the lower the governance efficiency loss incurred by inaccurate judgments of local governance performance will be. For local governments, the probability that their opportunistic behaviors (i.e., low participation in environmental governance) are detected by the central government is positively correlated with ; the higher the signal transmission efficiency, the greater the risk of local governments being penalized for their opportunistic acts, and the stronger their incentives to engage in high participation in environmental governance.
- The Systemic–Synergistic Mechanism
The horizontal signal and vertical signal forge a two-way synergistic mechanism within the four-party evolutionary game system, which is the core embodiment of Kooiman’s systemic–synergistic governance logic [13] in the integrated framework of decentralized governance and green credit; this is also the key to realizing the overall governance capacity of the environmental governance system. Specifically, the horizontal signal lays a foundation for banks to conduct environmental risk assessments, thereby reducing banks’ assessment costs—this process is the coupling of the hierarchical governance subsystem and the bank–enterprise self-governance subsystem, and the improvement of the interaction quality of the lower-level subsystem provides a basis for the effective operation of the entire environmental governance system; meanwhile, banks’ vertical signal, in turn, bolsters the central government’s oversight of local governments and elevates local governments’ regulatory initiative. This process is the feedback of the private self-governance subsystem to the upper-level hierarchical governance subsystem.
This synergistic interplay serves as the core bridge linking the decentralized governance with green credit mechanisms; it constitutes the linchpin for achieving systemic synergy among the four players in the evolutionary game. In line with Kooiman’s core argument, the systemic synergy formed by the two types of signals is not a simple superposition of horizontal and vertical signal transmission effects, but an interactive effect generated by the coupling of each subsystem in the governance system [13]. The horizontal signal optimizes the micro foundation of green credit (bank–enterprise information symmetry), and the vertical signal optimizes the institutional foundation of decentralized governance (central–local government information symmetry); the two interact with each other to realize the organic integration of decentralized governance (hierarchical governance) and green credit (self-governance/collaborative governance), and ultimately promote the evolution of the entire environmental governance system toward the ideal equilibrium state. Notably, this systemic–synergistic mechanism embodies the dynamic adjustment of internal interaction rules within the governance system conceptualized by Kooiman (2003) [13]. Sustained improvements in signal transmission efficiency serve as the fundamental impetus for this adaptive rule adjustment, reconciling stakeholders’ strategic game choices with the holistic objectives of environmental governance and ultimately strengthening the system’s overall governability.
3.2. Model Construction
Based on the above assumptions, the payoff matrix of the stakeholders under different strategy combinations is calculated and displayed in Table 3. The expected payoffs for the central government adoption of “centralized governance” and “decentralized governance” are denoted as and respectively; the average expected payoff is denoted as .
Table 3.
Payoff matrix of the four parties.
Based on Equations (1)–(3), the replicator dynamic equation of the central government is as follows:
Similarly, the expected payoffs of the other participants can be obtained. Subsequently, the replicator dynamic equations for local governments, enterprises, and banks can be derived as Equation (5), Equation (6), and Equation (7), respectively. The specific details are provided in Appendix A.
4. Evolutionary Game Analysis
4.1. Unilateral Strategy Stability Analysis
4.1.1. Strategy Stability Analysis of the Central Government
According to the stability theorem of the replicated dynamic equation, if the strategy of the central government is in a stable state, it must satisfy the following conditions: and .
The first derivative of is:
Let .
When , —this implies that a stable state exists when the probability of local governments adopting the strategy of “high participation” is ; however, there remains uncertainty regarding the strategy choice made by the central government.
When , (according to the model assumptions, )—this indicates that the stable strategy for the central government is “centralized governance” (); when , —this implies that “decentralized governance” () becomes the stable strategy.
4.1.2. Strategy Stability Analysis of Local Governments
Similarly, the stable condition for the strategy of local governments is and . The first derivative of is
Let .
When , —this implies that a stable state exists when the probability of banks assessing environmental risks is ; however, there remains uncertainty regarding the strategy choice made by local governments.
When , let . (1) In the case where , . When , —this implies that the stable strategy for local governments is “high participation” (); when , —this indicates that “low participation” () becomes the stable strategy. (2) In the case where , . When , , which indicates that the stable strategy for local governments is “low participation” (); when , —this implies that “high participation” () becomes the stable strategy.
4.1.3. Strategy Stability Analysis of Enterprises
The stable condition for the strategy of enterprises is and . The first derivative of is
Let .
When , —this implies that a stable state exists when the probability of local governments adopting the strategy of “high participation” is ; however, there remains uncertainty regarding the strategy choice made by enterprises.
When , (according to the model assumptions, )—this indicates that the stable strategy for enterprises is “green transition” (); when , —this implies that “non-green transition” () becomes the stable strategy.
4.1.4. Strategy Stability Analysis of Banks
The stable condition for the strategy of banks is and . The first derivative of is
Let .
When , —this implies that a stable state exists when the probability of the central governments adopting centralized governance is ; however, there remains uncertainty regarding the strategy choice made by banks.
When , (according to the model assumptions, )—this indicates that the stable strategy for banks is assessing the environmental risks of enterprises (); when , —this implies that the stable strategy is not to assess the environmental risks ().
4.2. Analysis of Stable Equilibrium Points and Evolutionary Path
The preceding section discusses the stability of each stakeholder’s strategy. This section explores the evolutionary stability strategies (ESSs) of the system and discusses the evolutionary path. Based on the asymptotic stability conditions for evolutionary games [49], only 16 pure strategy equilibrium points (PSEP) require discussion: (1,1,1,1), (1,1,1,0), (1,1,0,1), (1,1,0,0), (1,0,1,1), (1,0,1,0), (1,0,0,1), (1,0,0,0), (0,1,1,1), (0,1,1,0), (0,1,0,1), (0,1,0,0), (0,0,1,1), (0,0,1,0), (0,0,0,1), and (0,0,0,0). The stability of PSEP is ensured only when all the eigenvalues of the Jacobian matrix are negative [50]. The Jacobian matrix can be constructed based on the first-order partial derivatives of the replicator dynamic equations. Then, the eigenvalues are obtained; these are shown in Table 4 (the details are presented in Appendix B and Table A1).
Table 4.
Eigenvalues at different equilibrium points.
From the perspective of system evolution, the 16 PSEPs correspond to the different states of the system. Among these, the state (0,0,0,0) represents the initial disordered state, where all stakeholders adopt passive strategies. In contrast, the state (0,1,1,1) represents the ideal target state of the system, in which the central government delegates governance, local governments conduct active supervision, enterprises carry out green transitions, and banks assess environmental risks. The evolutionary trajectory of the ESS is depicted in Figure 2.
Figure 2.
The evolutionary path of ESS.
We concentrate on analyzing the evolutionary paths of three core equilibrium states with substantial policy implications, corresponding to the three key stages of institutional change in environmental governance: from centralized administrative control, to local decentralized governance, and finally to the joint enforcement of administrative and financial supervision. Other equilibrium points that merely reflect theoretical transitions or initial disordered states are excluded from the core analysis, as they provide limited practical policy guidance. The three core equilibrium states and their evolutionary paths are detailed as follows.
- Centralized Governance Benchmark State (1,0,0,0)
During the nascent phase of environmental governance, local governments possess inadequate governance capacity, and the green financial system is yet to be established. As a result, the central government can only uphold the basic regulatory norms of environmental governance via unified administrative mandates and punitive actions. In this institutional context, decentralized governance lacks implementable conditions, and green financial instruments have no viable role to play. This centralized governance state (1,0,0,0) acts as a benchmark for subsequent analyses of the disparities in effectiveness between incentive and penalty instruments, and for determining whether decentralized governance is superior to its centralized counterpart. The ESS (1,0,0,0) may potentially evolve along paths (2), (3), (6), and (11).
Path (2) delineates the evolutionary trajectory that excludes any adjustments derived from decentralized governance or green credit mechanisms. Moving from the initial state (1,0,0,0) to the (1,0,1,0) state, this evolutionary pathway captures enterprises’ adoption of green transition strategies. The eigenvalue condition of enterprises’ strategy selection undergoes a corresponding shift, which is formally expressed as . This implies that, to steer the ESS toward the (1,0,1,0) state, enhanced local supervision and escalated penalties levied on enterprises ( and denote the intensity of supervision and the magnitude of penalties, respectively) are required, either individually or in tandem, assuming that enterprises’ abatement costs () remain constant. Conversely, if remains unchanged, then a reduction in enterprises’ abatement costs can also propel the evolution of the equilibrium point along Path (2) (The assumption is made that the economic benefit of enterprises remains constant and the tax rate imposed on enterprises remains stable over a specific period, thereby keeping variables , , and unchanged).
- Decentralized Governance Single Mechanism State (0,1,1,0)
In the intermediate stage of environmental governance evolution, the institutional framework shifted toward a decentralized model defined by “central authorization and local dominance”. With the gradual improvement of the environmental governance institutional system—including the formulation of standardized regulatory norms and the accumulation of practical experience in local environmental governance practices—local governments witness a notable decline in their environmental supervision costs. Local governments proactively enhance regulatory oversight and become active stakeholders in environmental governance. Under scenarios where local governments maintained high levels of governance participation, the costs of centralized top–down governance exceed the efficiency benefits of decentralized governance. As a result, the central government chooses to devolve environmental governance authority, enabling a strategic transition from centralized control to decentralized governance.
The ESS (0,1,1,0) represents the ideal equilibrium state under the single mechanism of decentralized governance. Analyzing this equilibrium state serves to verify the core research question: Can adaptive adjustments in decentralized governance improve the effectiveness of environmental policies?
Paths (3)–(4) demonstrate the evolution based on adjustments made through decentralized governance. The increased involvement of local governments in environmental governance will incentivize enterprises to prioritize a green transition strategy, which indicates a shift in ESS from (0,1,0,0) to (0,1,1,0). At this stage, the eigenvalue condition influencing enterprises’ strategy selection is , which adds subsidies () and tax reduction rate () in addition to penalties () and emission-reduction costs () compared to Path (2). According to the eigenvalue condition of , namely , the central government can adjust its control over local governments through a decentralization mechanism (such as penalties or the degree of centralized governance ), thereby enhancing the effectiveness of implementing environmental subsidies and tax incentives.
The evolutionary logic of this pathway indicates that the adaptive adjustments of decentralized governance can substantially enhance environmental policy effectiveness. The core of such decentralization is to devolve central authority to local governments, which stimulates their regulatory initiative and ensures that incentive and deterrence policies align more closely with enterprises’ practical operational realities.
- Synergistic Mechanism State of Decentralized Governance and Green Credit (0,1,1,1)
In the relatively mature phase of environmental governance, the green financial system has advanced toward institutionalization. In this context, commercial banks are integrated as key stakeholders into the environmental governance system, exerting regulatory influence through rigorous environmental risk evaluations of borrowing firms. By embedding financial supervision into the governance architecture, decentralized governance and green finance generate a synergistic effect, ultimately driving the high-quality advancement of environmental governance practices.
The synergistic mechanism state of decentralized governance and green credit, denoted as (0,1,1,1), represents the ideal target state of the system. Analyzing this equilibrium state helps us to answer the following core research questions: How does green credit affect enterprises’ green transition decisions? How does green credit collaborate with the decentralized governance mechanism to promote such a transition?
To realize the (0,1,1,0) state, Paths (3)–(4)–(5) demonstrate a higher likelihood of evolutionary convergence than Paths (6)–(7) or Paths (11)–(12) (For enterprises choosing a green transition strategy, the difficulty of meeting the corresponding eigenvalue conditions exhibits a clear hierarchy: poses the most stringent challenge, followed by , while represents the most attainable criterion. Conversely, from the perspective of banks assessing environmental risks, the eigenvalue conditions associated with and are identical and comparatively easier to satisfy than those corresponding to and . Notably, the eigenvalue condition driving the strategic decisions of local governments at both states (0,1,1,0) and (0,1,1,1) is uniformly expressed as ). According to the eigenvalue condition of , namely , the interest discrepancy for green credit is determined by and this indicates that the effectiveness of green credit mechanisms in promoting enterprise green transition can be enhanced by strengthening penalties on banks or reducing the costs associated with environmental risk assessments for banks.
This synergistic pathway illustrates that green credit fails to function independently without decentralized governance; decentralized governance, in turn, relies on green credit as a financial-level supplementary regulatory mechanism. The integration of these two instruments generates a dual governance effect, featuring “administrative supervision plus financial constraints”, laying theoretical groundwork for the coordinated design of environmental governance and green credit policies.
5. Simulation Analysis and Discussion
In this section, we perform numerical simulations using MATLAB to validate the ESS under the different scenarios delineated in Section 4.2. Subsequently, we systematically investigate the effects of key parameters on enterprises’ decisions regarding the green transition. Finally, a discussion of the simulation results is presented at the end of this section.
5.1. Simulation Data and Parameter Assignment
To ensure the rationality and transparency of the simulation analysis, all parameters in this study are categorized into two types according to their calibration basis: empirically anchored parameters (EAPs) and purely hypothetical parameters (PHPs).
5.1.1. Assignment of EAPs
China has achieved remarkable progress in its green transition endeavors, and the three core stable equilibrium points identified in Section 4.2 align with the evolutionary logic of environmental governance in China. Accordingly, the calibration of EAPs is anchored in the relative ratios of actual microlevel empirical data, as well as the institutional realities of China’s tax and green credit policies. This calibration approach ensures that the simulation results align with the actual operational dynamics of China’s environmental governance systems and green credit mechanisms in practice.
Notably, 2018 marks a pivotal milestone in the history of China’s ecological protection. Against this backdrop, we calculate the relative ratios of actual microlevel data from China for 2018 to determine the values of , , , , and . The specific calibration details are elaborated upon here:
(1) We selected listed companies under key pollution monitoring as the research sample, excluding those with revised financial data or incomplete information regarding environmental investment; ultimately, we obtained a final sample of 111 enterprises. This sample is deemed to be sufficiently rational and representative. It encompasses major heavily polluting manufacturing sectors (e.g., the chemical, steel, and electric power and heat production and supply industries), all of which are the core entities driving the green transition of the manufacturing sector and the primary targets of environmental policy and green credit regulation. In terms of geographical distribution, the sample firms are spread across regions characterized by divergent levels of economic development and environmental regulatory stringency. Furthermore, the data pertaining to listed companies under key pollution monitoring are highly accessible and accurate, thus guaranteeing the empirical feasibility of this study.
The sample enterprises were categorized according to whether they had incurred environmental violations, and the mean values of environmental investments and total profits were calculated separately for each group. All data were retrieved from the China Stock Market & Accounting Research Database (CSMAR). As presented in Table 5, five enterprises in the sample were identified as having committed environmental violations. The average environmental protection investment of these violating enterprises was CNY 675.38 million, which was substantially lower than that of non-violating counterparts (CNY 22,288.63 million). In contrast, the average total profit of violating enterprises (CNY 1459.341 million) exceeded that of non-violating enterprises (CNY 773.8949 million). The mean total profits of non-violating and violating enterprises were adopted as the basis for assigning values to the economic benefits of enterprises under green transition and non-green transition strategies, denoted as and respectively; profit difference effectively captures the short-term economic trade-off of enterprises’ green transition choices. Furthermore, the average environmental investment of non-violating enterprises served as the basis for determining the emission-reduction costs of enterprises (); this proxy directly reflects the actual resource input for enterprises’ green transition, ensuring the validity.
Table 5.
The environmental investments and total profits of listed companies under key pollution monitoring.
(2) We calculated the mean total bank borrowings of the 111 sample enterprises, which was CNY 4208.096 million. This value served as the basis for assigning the total loan amount (denoted as ), with the data sourced from CSMAR. This proxy directly reflects the actual credit financing demand of sample enterprises—bank borrowings are the core debt financing channel for their daily operations and green transition initiatives, ensuring the validity.
(3) Drawing on data from 21 listed Chinese banks, we first computed the average ratio of green credit balances to the net amount of loans and advances granted, which was determined to be 0.125681. Subsequently, we multiplied the total operating costs of these banks by this green credit ratio to derive the green credit costs, which amounted to CNY 7164.62 million. This figure was used as the basis for assigning banks’ environmental risk assessment costs (denoted as ) with the data retrieved from CSMAR. The green credit ratio reflects the proportion of banks’ resources allocated to environmental risk-related businesses, and multiplying it by total operating costs reasonably proxies the actual resource input for banks’ environmental risk assessment, aligning with the core connotation of .
In addition, we calibrate the parameters , , , , and based on the institutional realities of China’s tax and lending policies, as elaborated here: (1) In China, firms are primarily liable for value-added tax (VAT) and corporate income tax (CIT). Since industrial emissions originate predominantly from production processes rather than sales transactions, we anchor the tax rate parameter to China’s prevailing statutory CIT rate for general enterprises, setting as 0.25. The central government’s share of tax revenues () is derived from the official split of CIT revenues between central and local governments, yielding = 0.6. (2) Drawing on the tax incentive stipulations outlined in the Corporate Income Tax Law of the People’s Republic of China and its Implementing Regulations, we set the tax preferential rate for emission-reducing enterprises () at 10%, such that = 0.1. (3) China’s benchmark lending rates have exhibited temporal variation over the years. Given that our parameter calibration relies primarily on 2018 empirical data for China, we select the 1–5-year (inclusive) benchmark lending rate e, spanning 2015–2019, to calibrate , resulting in = 0.0475. (4) Preferential interest rates for green loans vary across commercial banks. We reference the Carbon Emission Reduction Support Tool introduced by the People’s Bank of China, which offers a 1.75% lending rate, and apply a moderate adjustment to calibrate = 0.02.
5.1.2. Assignment of PHPs
These parameters are adjusted with reference to the existing relevant literature [14,39,40,44,46] and the equilibrium stability conditions of the four-party evolutionary game model constructed in this study. The core purpose is to ensure that the parameter values are within a reasonable range, consistent with theoretical logic and practical experience. The specific parameter assignment for the benchmark scenario (1,0,0,0) (centralized governance mode) is shown in Table 6.
Table 6.
Parameter assignment.
The equilibrium stability condition of the evolutionary game (i.e., all eigenvalues of the Jacobian matrix being negative) acts as the theoretical boundary for parameter adjustment, ensuring the evolutionary path of the simulated system conforms to evolutionary game theory rather than arbitrary calibration. The evolutionary game model constructed in this study abstractly depicts the dynamic strategic interaction mechanisms among multiple stakeholders, and its equilibrium stability conditions represent an endogenous theoretical conclusion derived from such inter-agent interactions. These conditions embody the fundamental constraints on multiagent strategy selection and evolution, forming the core theoretical basis for the model to explain and predict practical environmental governance behaviors.
Furthermore, this model is applied to examine enterprises’ green transition under the framework of decentralized governance and green credit. The equilibrium stability conditions constitute a theoretical distillation of the core characteristics of environmental governance at distinct stages, and precisely capture the constraint relationships among the costs, penalties, and incentives of each stakeholder. Accordingly, taking these stability conditions as the guidance for PHP assignment essentially aligns quantitative parameter settings with both the theoretical logic and practical realities of different environmental governance stages, making parameter calibration not only consistent with evolutionary game theory but also capable of accurately mapping the actual strategic choices of each stakeholder across governance phases.
5.1.3. Parameter Adjustments for (0,1,1,0) and (0,1,1,1)
The ESS (0,1,1,0) is used to capture the independent effect of decentralized governance, under which local governments assume the primary responsibility for on-site environmental governance and enforcement; meanwhile, the central government fulfills a core regulatory and supervisory role in the governance system. With the gradual improvement in the national environmental institutional framework, the costs of local governments’ environmental supervision decrease. Concurrently, the central government has raised the intensity of penalties for local governments with inadequate environmental supervision, and the punitive intensity of environmental regulations on non-green-transition enterprises has also been further strengthened. On this basis, parameter values are adjusted based on the baseline calibration, with = 30, = 40, = 50, assigned for the ESS (0,1,1,0) scenario.
The ESS (0,1,1,1) represents the ideal target evolutionary state of the entire multistakeholder system, which focuses on the synergistic governance effect of decentralized governance and green credit mechanisms. Amid the escalating national focus on environmental governance, the central government has continuously intensified its targeted environmental inspections of local governments under the decentralized governance model (e.g., China launched the Central Environmental Protection Inspection process in late 2015). Concurrently, with the continuous development and refinement of the green financial system, the regulatory penalties imposed on banks that issue loans in violation of green credit norms have been further strengthened. In addition, the gradual improvement of the mandatory corporate environmental information disclosure regime has effectively reduced the information search and evaluation costs incurred by banks in conducting environmental risk assessments. Accordingly, parameter values are adjusted to = 0.8, = 15, and = 10 for the ESS (0,1,1,1), with all other parameters remaining consistent with those of the ESS (0,1,1,0).
This parameter setting not only effectively captures the interactive and synergistic mechanisms between decentralized governance and green credit but also facilitates a direct comparative analysis with the evolutionary outcomes under the standalone decentralized governance model; thereby, it enables the precise identification of the independent role and transmission channels of the green credit mechanism in driving corporate green transition.
5.2. Simulation of Stable Equilibrium Points and Impacts of Initial States
Figure 3 illustrates the attainment of the system’s stable equilibrium points under different scenarios. When the initial probabilities that the central government, local governments, industrial enterprises, and banks adopt the strategies of centralized governance, high participation, green transition, and environmental risk assessment (denoted as , , , and , respectively) are set at distinct values (0.1, 0.5, and 0.9, respectively), the final strategy choices of all stakeholders remain consistent. Nevertheless, the initial states exert an impact on the speed at which the system converges to a stable equilibrium.
Figure 3.
System convergence to stable equilibria under different initial states. (a) Centralized governance benchmark state (1,0,0,0); (b) decentralized governance single mechanism state (0,1,1,0); (c) synergistic mechanism state of decentralized governance and green credit. Note: The horizontal axis denotes evolutionary time, and the vertical axis represents probability values. Curves in different colors illustrate the dynamic changes in the probabilities that the central government selects “centralized governance” and that local governments, enterprises, and banks adopt their respective active strategies (i.e., g, l, e, b).
To further visualize the dynamic evolutionary trajectories of the strategies adopted by local governments, enterprises, and banks under the decentralized governance mode, Figure 4 employs a three-dimensional coordinate system with the axes denoted by , , and , respectively. The initial probabilities of proactive strategy adoption by the three stakeholder groups are assigned distinct values of 0.1, 0.5, and 0.9. Regardless of these divergent initial conditions, the strategy choices of all stakeholders consistently converge to the same stable equilibrium point, confirming the system’s strong robustness against initial probability variations.
Figure 4.
The evolutionary trajectory of local governments, enterprises, and banks under a decentralized governance mode. (a) Decentralized governance single mechanism state (0,1,1,0); (b) synergistic mechanism state of decentralized governance and green credit.
5.3. Sensitivity Analysis of Key Parameters
In this section, we conduct a sensitivity analysis of key parameters for Path (2), Paths (3)–(4), and Paths (3)–(4)–(5), as elaborated in Section 4.2. The analysis focuses on three scenarios (centralized governance, decentralized governance, and the collaboration between decentralized governance and green credit), corresponding to the subsections below.
5.3.1. Enterprise Green Transition Decisions Under Centralized Governance Mode
This section analyzes how enterprise strategy evolves under the centralized environmental governance mode, as indicated by Path (2)—discussed in Section 4.2—and the corresponding equilibrium shift from (1,0,0,0) to (1,0,1,0). Specifically, it concentrates on examining the impacts of environmental subsidies () and penalties () on enterprises’ strategic decisions regarding green transition. We take the equilibrium point (1,0,0,0) as the initial state and benchmark for parameter calibration, assign an initial strategy selection probability of 0.5 to each stakeholder, and adjust the values of key parameters to systematically analyze the strategic evolution outcomes of enterprises.
- Impacts of Subsidies and Penalties on Enterprise Emission Reduction
With respect to incentive policies, environmental subsidies () were sequentially set at 10, 20, 40, 60, and 80 to examine variations in enterprises’ decisions regarding green transition, as illustrated in Figure 5a. As subsidies granted to enterprises increased progressively to a level of , enterprises consistently refrained from adopting sustainable emission control strategies. This finding indicates that the direct disbursement of environmental protection subsidies to enterprises barely succeeds in incentivizing their engagement in green transitions.
Figure 5.
Impacts of subsidies () and penalties (). (a) The impact of ; (b) the impact of . Note: The horizontal axis denotes evolutionary time, and the vertical axis represents the probability of enterprises choosing the green transition strategy ().
With respect to penalty-related regulatory policies, we operationalized the intensity of environmental penalties () imposed on non-compliant enterprises into five graded numerical metrics, namely 10, 30, 50, 80, and 100, as illustrated in Figure 5b. As the penalty intensity escalates, enterprises’ propensity to implement proactive green transition initiatives is progressively reinforced. Specifically, once the magnitude of penalties surpasses a specific threshold (e.g., ), it incentivizes enterprises to adopt sustainable emission-reduction strategies and lock in a stable pattern of green compliance behaviors. This finding underscores a core insight that penalty measures must attain a critical intensity threshold to effectively catalyze enterprises’ green transition.
- Impacts of Subsidies and Penalties on Enterprises with Different Emission-Abatement Cost Levels
Figure 6 depicts the evolutionary trajectory of enterprises’ decisions regarding green transition under heterogeneous abatement cost levels, with parameter assigned values of 40, 30, 20, 10, and 5, respectively. As the abatement cost decreases progressively, the convergence time required for enterprises’ strategy to stabilize at the non-abatement equilibrium is prolonged continuously, while their propensity for green transitions is gradually strengthened. When abatement costs decline to a critical threshold value (e.g., = 5 in this simulation setting), emission-abatement behavior becomes dominant and green transition eventually evolves into the ESS for enterprises.
Figure 6.
The impact of enterprise emission-abatement costs (). Note: The horizontal axis denotes evolutionary time, and the vertical axis represents the probability of enterprises choosing the green transition strategy (e).
To investigate the impacts of environmental subsidies and penalties on enterprises with different emission-abatement cost levels, we examine various combinations of emission-abatement cost levels alongside subsidies and penalties. Figure 7a depicts the evolutionary trajectory of enterprises’ strategy selection regarding green transition under heterogeneous pairings of environmental subsidies () and abatement costs (). Despite the convergence of the final strategy choice toward non-green transition across all three configurational scenarios, enterprises exhibit a heightened propensity to adopt abatement-oriented strategies in cases where subsidy intensities are higher and abatement costs are lower (e.g., = 80, = 10). Figure 7b portrays the evolutionary dynamics of enterprises’ abatement strategy selection under heterogeneous combinations of environmental penalties () and abatement costs (). Notably, enterprises with lower abatement costs (e.g., = 10) demonstrate a stronger inclination toward green transitions; even moderate penalty intensities ( = 30) can incentivize them to implement emission abatement measures. This finding indicates that lower abatement costs not only directly elevate enterprises’ willingness to pursue green transitions but also amplify their responsiveness to both incentive-based and punitive regulatory instruments.
Figure 7.
Impacts of subsidies and penalties on enterprises with different emission-abatement cost levels. (a) The combined impact of and ; (b) The combined impact of and . Note: The three coordinate axes represent the strategy selection probabilities of local governments (), banks (), and enterprises (), respectively.
The foregoing analysis leads to a core conclusion that punitive policies outperform incentive policies in driving enterprises’ green transitions. According to the theory in the field of behavioral economics, individuals tend to exhibit a heightened aversion towards losses relative to their preference for commensurate gains, commonly known as loss aversion [51,52]. Consequently, penalties imposed on enterprises may generate a stronger impetus for behavioral changes compared to incentives of equal value (such as subsidies). Certainly, the effectiveness of punishment measures relies on their sufficient intensity, as enterprises weigh the additional costs of emission reduction against the economic losses incurred from penalties. Once the severity of punishment exceeds the cost associated with reducing emissions, enterprises would naturally opt for a green transition. Likewise, in a study on greenwashing behaviors in corporate environmental information disclosure, Liu et al. emphasized that punitive measures exhibit greater efficacy compared to incentives [11]. In addition, previous empirical studies have examined the limited impact of fiscal subsidies on green development and have even highlighted the potential crowding-out effect on enterprises’ green innovation activities [53]. This is probably attributed to rent-seeking behaviors and speculative practices adopted by enterprises to secure additional fiscal subsidies, thereby compromising the implementation of high-quality green innovations [54].
5.3.2. Enterprise Green Transition Decisions Under Decentralized Governance Mode
This section investigates enterprises’ decision making regarding green transition under a decentralized governance framework, with a particular focus on Paths (3)–(4). Consequently, the model parameters are calibrated to align with the ESS of (0,1,1,0). To isolate the confounding effects of alternative pathways, we focus on the core parameters driving local governments’ strategic decision making while excluding any adjustments mediated by green credit mechanisms. To more vividly illustrate the behavioral dynamics of stakeholders, we adopt a three-dimensional coordinate system where the axes are defined as , , and , respectively. We then systematically vary local governments’ environmental supervision costs () and the penalties imposed by the central government () to analyze the resulting evolutionary outcomes, as visualized in Figure 8. Under identical conditions, the evolutionary trajectory of banks’ strategies consistently converges on the non-assessment of enterprises’ environmental risks, as illustrated in Figure S1 of Supplementary Materials, which ensures that our evolutionary outcomes are free from the confounding influence of green credit mechanisms.
Figure 8.
Impacts of the decentralization mechanism ( and ). (a) The combined impact of and ; (b) the combined impact of and ; (c) the combined impact of and ; (d) the combined impact of and . Note: The three coordinate axes represent the strategy selection probabilities of the central government (), local governments (), and enterprises (), respectively.
Firstly, we examine the impact of decentralization on the effectiveness of punitive environmental policies (). Figure 8a and Figure 8c, respectively, show the evolutionary results of different combinations of supervision costs for local governments and penalties on enterprises (- combinations), as well as penalty combinations on both enterprises and local governments (- combinations). When the local government experiences high supervision costs () or low penalty intensity (), the evolutionary outcome fails to converge toward the expected equilibrium point (0,1,1,0). Even with variations in punishment intensity on enterprises (), there may exist situations where either local governments or enterprises unilaterally adopt the proactive strategy (with and respectively). Conversely, when the local government faces lower supervision costs () or higher penalty intensity (), both the local government and enterprises will adopt proactive strategies, except when the punishment for enterprises is extremely low ().
The aforementioned results indicate that the effectiveness of punitive measures in facilitating enterprise green transition can be enhanced through targeted calibration within a decentralized governance framework. As local governments proactively engage in environmental governance initiatives, desirable environmental governance outcomes are attainable by imposing moderate penalties on enterprises rather than resorting to overly harsh punitive instruments. Excessive severe penalties imposed on enterprises not only escalate their operational burden but also risk incentivizing local governments to rely exclusively on punitive instruments instead of proactively addressing environmental governance challenges. By contrast, unduly lenient penalties generate a negligible deterrent effect on enterprises’ strategic decisions regarding green transition.
The second aspect we examine is the influence of decentralization on the effectiveness of incentive-driven environmental policies (). Figure 8b and Figure 8d, respectively, depict the evolutionary outcomes arising from the combinations of environmental subsidies with various levels of local supervision costs (- combinations) and combinations with different intensities of penalties imposed on local governments (- combinations). Local governments and enterprises adopt proactive strategies only when the subsidies are lower (), in conjunction with reduced supervision costs () or increased penalties () for local governments. A mere increase in environmental subsidies (e.g., and ) does not yield the expected outcomes; instead, it has an adverse impact.
The above findings indicate that the active engagement of local governments—enabled by targeted calibration within a decentralized governance mode—coupled with moderate environmental subsidies, can ensure the effectiveness of incentive-based environmental policies in driving enterprises to pursue green transformation. Nevertheless, the effectiveness of such policies exhibits a declining trend with the escalation of incentive intensity and may even generate counterproductive outcomes. Excessive subsidies given to enterprises tend to exacerbate the fiscal burdens of local governments [1], thereby creating a trade-off dilemma between safeguarding local economic interests and advancing environmental protection goals. Furthermore, excessive subsidies are prone to eroding enterprises’ innovation motivation, inducing an overreliance on external fiscal support [55], and ultimately amplifying the risks of corporate rent-seeking behavior and collusive interactions between enterprises and local governments.
As illustrated in Figure 5, despite a continuous increase in environmental subsidies () and penalties () that attain magnitudes of up to 80, enterprises remain reluctant to pursue green transformation. Conversely, as depicted in Figure 8, targeted adjustments implemented under decentralized governance (for instance, by setting or ) can deliver the intended policy outcomes with only moderate levels of subsidies and penalties.
The preceding analysis leads to a key conclusion: adaptive adjustments within decentralized governance mode can enhance the effectiveness of environmental incentive and penalty policies. The decentralization system establishes a principal–agent relationship between the central government and local governments. The effective implementation of both punitive and incentive-based environmental policies relies heavily on the execution by local government authorities. However, information asymmetry prevails: local governments may lack comprehension regarding the intentions and determinations of the central government [22]. Meanwhile, the central government encounters challenges in detecting collusion and rent-seeking behaviors between local governments and enterprises. Therefore, strengthening penalties for inadequate governance by local governments serves to clarify their responsibilities within this principal–agent relationship, while also mitigating information asymmetry through signal transmission and exerting effective deterrence on local governments.
5.3.3. Enterprise Green Transition Decisions Under Collaboration Between Decentralized Governance and Green Credit
In this section, we empirically examine enterprises’ strategic decisions on green transition under the synergistic interplay of decentralized governance and green credit mechanisms. Accordingly, we calibrate the model parameters to align with the ESS of (0,1,1,1). To vividly depict the behavioral dynamics of stakeholders and the collaborative interactions between local governments and banks, we employ a three-dimensional coordinate system where the axes represent , , and , respectively. This design is justified by the observation that the central government’s strategic evolution consistently converges to “decentralized governance” under identical conditions (see Figure S2 in Supplementary Materials). Subsequently, we systematically vary banks’ environmental risk assessment costs () and the penalties levied by the central government (), with the corresponding evolutionary outcomes visualized in Figure 9.
Figure 9.
Impacts of the green credit mechanism ( and ). (a) The combined impact of and when = 50; (b) the combined impact of and when = 10; (c) the combined impact of and when = 50; (d) the combined impact of and when = 10. Note: The three coordinate axes represent the strategy selection probabilities of banks (), local governments (), and enterprises (), respectively.
Figure 9a,b depicts the evolutionary dynamics under distinct configurations of punishment intensity imposed on local governments and assessment costs borne by banks (denoted as - combinations). Figure 9c,d illustrates the evolutionary outcomes in response to paired variations in penalty intensities imposed on both local governments and banks (denoted as - combinations). To ensure comparability with the findings depicted in Figure 7 and Figure 8, we fix = 50 in Figure 9a,c, and set = 10 in Figure 9b,d.
When the assessment costs of banks are higher (, as illustrated in Figure 9a,b) or the penalties imposed on them are lower ( and , as shown in Figure 9c,d), banks consistently adopt a non-assessment strategy; conversely, both enterprises and local governments opt for proactive strategies, resulting in the convergence at point (0,1,1,0). Compared with the reference scenario () in Figure 8c, tuning banks’ assessment costs and penalty intensities via the green credit mechanism enables local governments and enterprises to evolve from an unstable state to the stable equilibrium state (0,1,1,0).
When banks face lower assessment costs ( and , in Figure 9a,b) or higher penalties (, in Figure 9c,d), they consistently opt for the assessment strategy. Under such circumstances, if the penalties imposed on local governments are relatively mild (e.g., ), the strategic choices of local governments and enterprises may exhibit evolutionary instability (in Figure 9b,d); whereas, if penalties on local governments are further strengthened (e.g., ), local governments, enterprises, and banks all switch to their respective proactive strategies, thereby converging to the desired stable equilibrium of the decentralized governance mode, namely (0,1,1,1).
The above results indicate that the green credit mechanism exerts a non-monotonic impact on enterprises’ decisions regarding green transition; specifically, a higher propensity of banks to conduct environmental risk assessments does not necessarily translate into enhanced enterprise emission abatement. As elaborated in Section 4.2, the green credit mechanism within the present framework functions more as an ex post punitive instrument rather than an ex ante proactive prevention mechanism. When the costs of environmental risk assessment decline (or the intensity of punitive measures is heightened), banks possess greater capacity (or willingness) to strengthen their scrutiny of enterprise environmental risks; this, however, does not ensure that enterprises take voluntary and proactive actions to advance their green transitions. Investments in low-carbon and green technological innovation entail long payback cycles and substantial inherent risks, which not only occupy a portion of banks’ lending capacity but also fail to generate immediate economic returns [35]. Consequently, banks may adopt a conservative lending stance by curbing credit supply to high-emission enterprises, which ultimately constrains the financial resources available for these enterprises to undertake green transition efforts [34]. As Guo et al. documented in their empirical investigation of green credit policies, the lack of tolerance for short-term failures in corporate green innovation not only fails to motivate enterprises to intensify their green innovation initiatives but also hinders the overall progress of green technological innovation [33].
Improvements in environmental policy effectiveness and the subsequent driving of enterprise green transition are closely related to the realization of collaborative coordination between decentralized governance and green credit mechanisms under a systemic–synergistic analytical framework. Information asymmetry between central and local governments may trigger local government–enterprise collusion; meanwhile, banks’ environmental risk assessments transmit local governance performance signals to the central government, improving its supervision accuracy and curbing such collusive behaviors. Concomitantly, the central government’s imposition of stricter penalties on local governments for non-compliance in environmental governance can increase the initiative of local governments in participating in environmental governance. This, in turn, mitigates the moral hazard of enterprises and the adverse selection on the part of banks, both of which stem from information asymmetry between the two parties.
5.4. Robustness Analysis
The core conclusion derived in Section 5.3.1—that punitive policies are more effective than incentive policies in driving enterprises’ green transition under the centralized governance mode—remains robust following the parameter adjustments detailed below: (1) Evolutionary outcomes remain consistent with Figure 5 when parameter is adjusted within the interval [0.48,1). A higher value of further strengthens the efficacy of punitive measures. (2) The evolutionary trajectories of enterprises’ strategies under IE adjustment (Figure 5a) remain robust following a ±50% change in . A higher slightly boosts enterprises’ willingness for green transition under increased but the final outcome still converges to the non-green transition strategy. (3) The evolutionary results with adjustment (Figure 5b) are also robust when is adjusted within [0,40], as only affects the evolutionary speed rather than the final outcome.
The core conclusion from Section 5.3.2—that adaptive adjustments under the decentralized governance mode can improve the efficacy of environmental incentive and punitive policies—remains robust following the subsequent parameter adjustments: (1) The system evolutionary outcomes align with Figure 8 when adjusting within [0.4,1) and within [0.48,1]. Higher values of and foster the adoption of cooperative strategies by local governments and enterprises. (2) The results depicted in Figure 8a,c remain robust when is varied within [0,15]; a lower facilitates the attainment of the equilibrium point (0,1,1,0), whereas an excessively high induces strategic instability between central and local governments. (3) The findings in Figure 8b,d retain robustness following a ±20% perturbation in , with a higher favoring the formation of the equilibrium point (0,1,1,0). (4) The results in Figure 8a,b remain robust following a ±25% adjustment to , while those in Figure 8c,d hold robustness under a ±33% perturbation of . A higher and lower are more favorable to the equilibrium point (0,1,1,0). Notably, punishment exerts a more sensitive influence on evolutionary outcomes; this finding aligns with the conclusion in Section 5.3.1.
The core conclusion regarding the synergistic mechanism between decentralized governance and green credit (Section 5.3.3) remains robust following the parameter adjustments outlined here: (1) Evolutionary outcomes remain consistent with Figure 9 when is adjusted within [0.75,1), within [0.4,1], and is perturbed by ±33%. Higher values of and , coupled with a lower , promote the formation of the equilibrium point (0,1,1,1). (2) The findings in Figure 9a,c retain validity when is varied within [0,15], while the results in Figure 9b,d maintain robustness following a ±20% perturbation in . (3) The results in Figure 9a,b remain robust following a ±6.7% adjustment to , with a higher facilitating the equilibrium point (0,1,1,1). (4) The outcomes in Figure 9c,d remain robust when is adjusted within [9,15]. A decline in exceeding 20% leads to banks being more inclined to adopt the assessment strategy, yet this variation does not alter the core conclusion.
5.5. Discussion
This section discusses the key findings of the current study in combination with the existing scholarly literature and analyzes the policy relevance of the core equilibrium states.
First, in this study, we elucidate that the advantage of punitive environmental policies stems from the underlying logic of loss aversion and critical intensity. Specifically, we confirm that, under the same intensity, punitive environmental policies—such as penalties imposed on enterprises that fail to reduce emissions and central government accountability mechanisms targeting local governments with low participation—exert a significantly stronger catalytic effect on the green transition of enterprises than incentive policies (e.g., subsidies). Notably, such punitive policies must reach a critical intensity to exert their effectiveness. The core logic underlying this differential effect originates from the theory of loss aversion in behavioral economics: enterprises exhibit far greater sensitivity to the definite losses incurred by penalties than they do inclination toward the potential gains from subsidies [51,52]. This conclusion is consistent with the findings of Liu et al., who demonstrated that penalties outperform incentives in curbing enterprises’ speculative behaviors in the governance of ESG disclosure greenwashing [11]. In contrast, incentive policies centered on subsidies exhibit notable limitations. On the one hand, excessive subsidies tend to weaken enterprises’ endogenous motivation for green innovation, leading enterprises to rely on external fiscal support [55] and even generating a crowding-out effect on green innovation [53]. On the other hand, high subsidy expenditures exacerbate the fiscal burden on local governments, thereby creating a trade-off dilemma between safeguarding local economic interests and promoting environmental protection objectives. This underscores that effective environmental policy design is associated with the calibration of punitive measures to a critical intensity and the constraint of subsidy scales, as inadequate penalty intensity or excessive subsidies are likely to lead to policy ineffectiveness.
Second, this study emphasizes that adaptive adjustments within decentralized governance mode can enhance the effectiveness of environmental incentive and penalty policies. Prior studies have identified that information asymmetry between central and local governments impairs the central government’s capacity to acquire granular details of local policy implementation [20,21]; meanwhile, local governments lack a holistic understanding of the central government’s governance objectives and policy resolve [22]. Such informational frictions give rise to deviations in policy execution [18] and may even foster collusive interactions between local governments and enterprises, which in turn incentivize corporate rent-seeking behaviors [22,23]. This study further finds that the core value of decentralized governance is not decentralization in itself, but adaptive adjustment: the central government’s dynamic incentive and penalty mechanisms (e.g., calibrating fiscal support and penalty intensity based on local environmental governance performance) can align local governments’ operational goals with national governance priorities; this, in turn, enhances the initiative of local governments in enterprise environmental supervision and drives the green transformation of enterprises through hierarchical governance transmission. Concurrently, the active participation of local governments in environmental governance can transmit a “credible supervision signal” to commercial banks, mitigating information asymmetry between banks and enterprises and safeguarding investors against corporate fraud in green credit activities. In contrast, government subsidies convey a “certification effect signal” to investors [12], which prevents banks from curtailing green credit provision due to risk aversion [34] and thus indirectly underpins the financial security of enterprises’ green transitions.
Third, in establishing that green credit exerts a non-monotonic impact on enterprises’ green transition, this study underscores banks’ role as a “signal intermediary”. Existing studies predominantly focus on the direct effects of green credit, such as low tolerance for short-term failures in corporate green innovation [33] and the potential credit contraction for high-carbon enterprises due to banks’ risk aversion [34]. Given the long cycle and high inherent risks associated with green innovation, banks tend to adopt conservative lending strategies; accordingly, the stringent environmental risk assessments implemented by banks do not invariably drive direct enterprise emission reductions [35]. Conversely, such assessments may constrain the financial resources accessible to enterprises for their green transition initiatives. Nonetheless, the environmental risk assessments conducted by banks can alleviate information asymmetry between central and local governments in environmental governance via a signal transmission mechanism: namely, the feedback of local environmental governance performance to the central government. This, in turn, empowers the central government to precisely calibrate incentive and punishment mechanisms for local governments, incentivizing the latter to strengthen environmental supervision and thereby indirectly facilitating enterprises’ green transitions. This mechanism fills the theoretical gap in the extant literature pertaining to the synergistic interplay between green credit and intergovernmental environmental governance.
Fourth, the three core evolutionary equilibrium states identified—(1,0,0,0), (0,1,1,0), and (0,1,1,1)—map to the phased evolution of environmental governance, with their policy relevance analyzed concisely as follows: (1) The centralized governance benchmark state (1,0,0,0) characterizes the initial governance phase with underdeveloped local regulatory capacity and an immature green financial system. Model analysis confirms its policy value as a regulatory bottom-line guarantee through central unified punitive measures, whose effectiveness relies on penalties surpassing a critical threshold to offset enterprises’ short-term economic gains from non-green transition, thus serving as a comparative benchmark for subsequent governance mechanisms. (2) The decentralized governance single mechanism state (0,1,1,0) corresponds to the intermediate governance phase, addressing environmental governance via delegated local supervision. Evolutionary outcomes indicate its policy relevance is contingent on curbing local supervision costs ( ≤ 40) and strengthening penalties for low-participation local governments ( ≥ 30), while also laying the groundwork for green credit integration by mitigating bank-enterprise information frictions. (3) The synergistic mechanism state (0,1,1,1) denotes the relatively mature governance phase, integrating decentralized governance and green credit to overcome the inherent limitations of single administrative regulation. Model analysis clarifies its policy significance in forming a closed-loop supervision system through the signal transmission of banks’ environmental risk assessments—an embodiment of the systemic value of multistakeholder collaborative governance—with its synergistic effect dependent on lowering banks’ assessment costs ( ≤ 15) and imposing stricter penalties on non-assessing banks ( ≥ 14).
5.6. External Validity
This study identifies three core evolutionary equilibrium states of environmental governance: (1,0,0,0), (0,1,1,0), and (0,1,1,1). These align with the universal law of institutional change in global environmental governance—evolving from administratively dominated centralized control to local government-led decentralized governance, and ultimately to the synergistic governance of administrative supervision and financial regulation. Accordingly, the core theoretical framework and evolutionary logic of this study feature cross-context theoretical generalizability, offering a universal analytical paradigm for exploring enterprise green transition under the interaction of multiple stakeholders.
Nevertheless, the parameter calibration of the evolutionary game model in this study is deeply embedded in the institutional context of China’s decentralized governance system and green credit policy framework, with the research conclusions and policy implications primarily targeting the green transition practices of Chinese manufacturing enterprises. This institutional embeddedness imposes contextual constraints on the direct application of the original model in other countries or regions, which necessitates the recalibration of the model’s core parameters in light of local institutional endowments, environmental governance modes, and market development characteristics. For instance, in countries with a more stringent environmental regulatory system, the intensity of penalties for corporate environmental violations and accountability for local government governance inefficiency are significantly higher than those in China, and the corresponding penalty parameters in the model need to be raised to match local regulatory realities. In countries with a highly mature capital market and a well-established mandatory environmental information disclosure system, commercial banks can obtain accurate and comprehensive corporate environmental information at a lower cost, reducing the actual cost of banks’ environmental risk assessment. In countries with a stronger market-oriented environmental governance, it is necessary to reconstruct the parameter settings and action mechanisms of policy tools in the original model.
In addition to parameter calibration, the composition of game subjects also requires situational adjustment according to the characteristics of local environmental governance subjects, such as the participation of public supervision and non-governmental organizations (NGOs). Although public supervision and NGOs have played an increasingly important role in China’s environmental governance system, their participation still operates within a government-led environmental governance framework, justifying their exclusion from the model in this study. In contrast, in countries where the public and NGOs have a high degree of participation in environmental governance, it is essential to incorporate them into the evolutionary game framework and further expand the subject composition, strategy sets, and interactive mechanisms of the model accordingly.
In summary—due to the significant heterogeneity in institutional background, market development level, governance subject structure, and policy tool preferences across countries and regions worldwide—the evolutionary paths and stage characteristics of environmental governance and enterprise green transition in different contexts are distinct. Therefore, when applying the theoretical framework of this study to other contexts, it is imperative to conduct a systematic and situational adjustment of the game subjects, core parameters, strategy sets, and interactive mechanisms of the evolutionary game model on the basis of a comprehensive analysis of local institutional and market contexts.
6. Conclusions and Implications
6.1. Conclusions
This study investigates enterprises’ green transition decision making and the effectiveness of punitive and incentive-based environmental regulatory policies within a framework of decentralized governance and green credit. A quadrilateral evolutionary game model involving the central government, local governments, enterprises, and banks is developed to analyze the strategy stability of each participant and the stable equilibrium points of the system. MATLAB simulations are employed to explore the impact and sensitivity of key parameters. This study develops an analytical framework for policy parameters to examine the intensity calibration of environmental reward-punishment instruments and their adaptive adjustments via decentralized governance and green credit mechanisms, within the constraints imposed by the model’s structural assumptions and parameter bounds. Accordingly, management insights are offered to encourage the active participation of all stakeholders in environmental governance, thereby facilitating the green transition of enterprises within similar institutional contexts and environmental governance frameworks. From this study, we derive the following key conclusions:
(1) The standalone implementation of either punitive or incentive policy instruments is insufficient to effectively drive enterprises’ green transition; instead, an externally collaborative regulatory framework underpinned by decentralized governance and green credit mechanisms is indispensable to this process. Specifically, when the level of local governments’ participation in environmental governance falls within the range of [0.48,1), a commensurate increase in the intensity of environmental subsidies () and punitive measures () for enterprises will result in targeted punitive measures exerting a significantly more pronounced guiding effect on enterprises’ green transition decision making than subsidy policies. In addition, within the rational interval of [0,15] for environmental subsidies to green transition enterprises, a non-monotonic relationship exists between the intensity of government subsidies and enterprises’ adoption of green practices.
(2) Adaptive adjustments of the decentralized governance framework can effectively incentivize local governments to engage proactively in environmental governance initiatives, provided that such adjustments are constrained by rational parameter ranges: the local government’s environmental supervision cost () does not exceed 40 (a 33% increase) and the central government’s punitive intensity on local governments with low governance participation () is no less than 30 (a 25% decrease). Meanwhile, when the punitive intensity on non-green-transition enterprises () is maintained at no less than 40 (a 20% decrease), with the degree of centralized governance coefficient () adjusted within [0.75,1) and the local government’s environmental governance participation degree () within [0.48,1), this decentralized governance adjustment not only elevates enterprises’ willingness to pursue green transition but also effectively alleviates the adverse selection problem faced by banks in the practice of green credit.
(3) The green credit mechanism exerts a non-monotonic impact on enterprises’ strategic choices regarding green transition when the central government’s punitive intensity on banks that fail to conduct environmental risk assessments () is lower than 14 (a 6.7% decrease) and banks’ environmental risk assessment cost () exceeds 15 (a 50% increase). In contrast, when is no less than 14 and is controlled within 15, banks’ professional environmental risk assessments of enterprises can motivate local governments to engage in environmental governance proactively through vertical signal transmission channels, thereby indirectly facilitating enterprises’ green transitions.
6.2. Theoretical Contributions
The theoretical significance of this study lies in supplementing and expanding the application of evolutionary game theory, signaling theory, and behavioral economics within the interdisciplinary domain of environmental governance.
First, we extend the evolutionary game theoretical framework for environmental governance from a multiagent synergy perspective. Existing studies have applied evolutionary game theory to analyzing decentralized environmental governance models [14,39] and the field of green credit financing [11,46]. However, most of these studies examine decentralized environmental governance and green credit in an isolated manner. This study is the first to integrate decentralized governance and green credit into a unified analytical framework. By constructing a four-party evolutionary game model encompassing the central government, local governments, enterprises, and banks, this study reveals that decentralized governance furnishes an institutional foundation for the efficacy of green credit by regulating the intensity of local environmental supervision; in turn, green credit provides informational support for the implementation of decentralized governance by enabling the central government to optimize the reward and punishment mechanisms for local governments through the signal transmission of banks. This framework transcends excessive reliance on single policy instruments or single organizational behavior adjustments, thereby presenting a novel analytical paradigm for the theorization of multiagent and multi-policy synergistic environmental governance.
Second, in this study, we broaden the scope of the application of signaling theory to cross-level and multidirectional information transmission in environmental governance. In the existing research, the application of signaling theory to environmental governance is predominantly restricted to a one-way transmission mode. For instance, government subsidies are utilized to convey enterprise certification signals to investors [12], and government supervision is employed to transmit enterprise risk signals to investors in order to protect them from green credit fraud [11]. Nevertheless, cross-level and multidirectional information flows have been largely neglected in the current literature. In this study, we recognize banks as a crucial intermediary in the cross-level information transmission between governments, and further elucidate two distinct signal transmission mechanisms: horizontal signaling (from local governments to banks and enterprises), whereby stringent local environmental supervision sends a signal of controllable corporate environmental risks to banks, mitigating information asymmetry between banks and enterprises; vertical signaling (from banks to the central government), whereby the outcomes of banks’ environmental risk assessments transmit a signal of local environmental governance performance to the central government, thereby alleviating information asymmetry between the central and local governments. These mechanisms expand the application of signaling theory to cross-level (central–local) and multidirectional (government–market) information transmission within the realm of environmental governance.
Third, in this study, we forge deeper cross-integration between behavioral economics and environmental policy design. Existing studies have applied the loss-aversion theory of behavioral economics to the analysis of environmental governance, such as the interpretation of corporate greenwashing practices. Yet, such applications have failed to integrate this theoretical lens with the implementation scenarios and functional boundaries of multiagent environmental policies. We incorporate the loss-aversion theory into the analytical framework of multiagent evolutionary games and expand the effective boundary conditions of corporate loss aversion. Specifically, enterprises’ loss aversion toward environmental penalties does not translate directly into incentives for green transformation; instead, this transformation is contingent upon adaptive adjustments under the framework of decentralized governance. By optimizing the central government’s reward and punishment mechanisms for local governments, the accountability of local administrative entities is strengthened. This, in turn, compels local governments to enforce regulatory oversight more rigorously, ultimately enabling enterprises to convert their motivation to avoid penalty-induced losses into green transformation actions. This finding advances the application of behavioral economics theory in the implementation of multiagent environmental policies and elucidates the logical connection between micro-behavioral preferences and macro-policy implementation.
6.3. Policy Implications
Drawing on the above conclusions, this study proposes the following policy implications to promote collaborative environmental governance and facilitate the green transition of enterprises. All policy recommendations presented herein are strictly bounded by the structural assumptions, parameter constraints, and evolutionary stability conditions of the four-party evolutionary game model constructed in this study, and the effectiveness of all policy instruments is subject to the conditions verified by the model simulation and equilibrium analysis.
First, the calibrated design of environmental reward and punishment mechanisms must be strictly aligned with the model-verified contingency conditions, with differentiated rules set for different governance stages corresponding to the model’s equilibrium states. On the one hand, for the initial centralized governance stage, the intensity of environmental penalties for non-green-transition enterprises should be set at no less than the model-verified critical threshold of 100, which can offset the short-term economic benefits of enterprises’ non-green transition practices, avoiding the ineffective regulation caused by insufficient penalty intensity. For the intermediate decentralized governance stage, penalty intensity can be adaptively reduced to a minimum threshold of 40, provided that local governments maintain high participation in environmental governance. On the other hand, environmental subsidies for green transition enterprises must be strictly confined to the model-verified rational range of [0,15], so as to avert the negative effect of excessive subsidies on corporate green behaviors (e.g., crowding-out effect on enterprise green innovation) and the accumulation of local fiscal burdens. Notably, model simulations confirm that incentive policies alone fail to drive enterprises’ green transition; instead, subsidies must be combined with adaptive adjustments (e.g., the central government’s punitive intensity targeting local governments), which constitutes a core contingency for the effectiveness of incentive policies.
Second, mitigating information asymmetry in environmental governance must strictly adhere to the model’s parameter constraints for the effective operation of horizontal and vertical signal transmission mechanisms, including central government punitive intensity, banks’ environmental risk assessment costs, and local governments’ environmental supervision costs. Accordingly, to ensure the effectiveness of the model’s vertical signal transmission channel, the central government’s punitive intensity on local governments with low governance participation must be set no less than the model-verified threshold of 30, and local governments’ environmental supervision cost must be controlled below the upper limit of 40. A sound vertical communication mechanism between the central and local governments should be established to curb rent-seeking and collusive behaviors between local governments and enterprises, laying an institutional foundation for the effective operation of the model’s horizontal signal transmission channel. Meanwhile, to satisfy the model’s contingency conditions for the effective operation of green credit (i.e., banks’ environmental risk assessment costs ≤ 15 and central government’s penalties on non-assessing banks ≥ 14), standardized and enforceable corporate environmental information disclosure regulations should be formulated to reduce the information search and environmental risk assessment costs of banks and the regulatory costs of government authorities. Furthermore, the model confirms that banks’ environmental risk assessments can indirectly drive enterprises’ green transition through vertical signal transmission only if the aforementioned parameter constraints are met, which constitutes a core boundary for designing green credit supporting policies.
Third, fostering cross-departmental collaboration and information-sharing mechanisms for environmental governance must be oriented toward the model’s ideal target equilibrium state (0,1,1,1), with implementation predicated on the satisfaction of all model-derived stability conditions for the synergistic operation of decentralized governance and green credit mechanisms. Accordingly, a green governance information-sharing platform that integrates local government supervision data, enterprise emission data, and bank risk assessment outcomes should be established to operationalize the model’s dual horizontal–vertical signal transmission mechanisms. Specifically, the platform should realize two core functions matching the model’s signal transmission logic: first, releasing local governments’ environmental supervision signals to the bank-enterprise system to alleviate horizontal information asymmetry; second, feeding back banks’ environmental risk assessment signals to the central-local government system to mitigate vertical information asymmetry. This platform enables targeted supervision by local governments, prevents enterprises from fraudulently acquiring green credit, and allows banks to efficiently assess environmental risks using authentic firm-level information, thereby achieving systemic synergy between decentralized environmental governance and green credit. Notably, the model confirms that such synergistic effects are contingent on the simultaneous satisfaction of parameter constraints for both the decentralized governance and green credit mechanisms, which constitutes the fundamental precondition for the effectiveness of cross-departmental environmental governance policies.
6.4. Limitations and Future Research
This study inevitably has several limitations that require explicit acknowledgment, and such constraints further delineate promising and targeted directions for the refinement and extension of subsequent research.
First, enterprise green transition is a multidimensional construct that encompasses strategic layout, technological upgrading, operational optimization, and other core facets. In the present study, however, we narrowed our focus to corporate emission reduction behaviors as the core outcome of green transition, thus overlooking the internal implementation mechanisms that underpin enterprises’ green transition practices. Future research can delve into the multilayered internal corporate mechanisms—such as corporate culture and operational management systems—that shape enterprises’ green transition decision-making processes and the persistence of their green behavioral choices.
Second, green credit represents a multifaceted financial instrument that encompasses core practices: credit quota allocation, differential interest rate pricing, balance sheet constraints, and post-loan environmental supervision. In the present study, we conceptualized green credit exclusively as a regulatory signaling mechanism, with the analysis confined to commercial banks’ environmental risk assessments of borrowing firms. This simplified operationalization enables a focused examination of banks’ core roles as signal transmitters and information intermediaries, yet it fails to capture the full spectrum of financial attributes inherent to green credit. Future research may expand the set of bank-related parameters within the evolutionary game framework, thereby enabling a more comprehensive investigation into the heterogeneous impacts of full-chain green credit practices on enterprises’ green transition behaviors.
Third, in this study, we faced data constraints in the parameter calibration of the evolutionary game model. The microlevel data used for parameter calibration are cross-sectional data from 2018, with the research sample comprising 111 listed companies under key pollution monitoring. Although this sample is considered sufficiently reasonable and representative of heavily polluting manufacturing enterprises in China, it still limits the robustness and generalizability of the results. Additionally, data constraints restricted the proxies to fully encompass all dimensions of the conceptual variables. For future research, adopting multi-period panel data and expanding the sample size to include more enterprises across different industries and regions will be a crucial improvement. Additionally, integrating empirical analysis with evolutionary game simulation can provide more rigorous empirical evidence to verify the theoretical conclusions of the game model.
Fourth, the external validity of this study is constrained by China’s institutional context. Although the three evolutionary equilibria identified conform to the universal logic of institutional change in global environmental governance, the model’s parameter calibration is tailored to China’s institutional setting, featuring decentralized governance and green credit policies. Accordingly, the research findings cannot be directly generalized to countries or regions with distinct institutional, economic, and cultural backgrounds, and their extrapolation requires caution. In future research, cross-country comparative analyses could be conducted by adapting the evolutionary game model to diverse economic systems (e.g., market-oriented governance in Western countries and government-led governance in emerging economies), to identify context-specific policy design principles for promoting enterprise green transition across heterogeneous institutional settings.
Supplementary Materials
The following supporting information can be downloaded at: https://www.mdpi.com/article/10.3390/systems14030289/s1, Figure S1: The evolutionary trajectory of banks’ strategies under the corresponding scenario in Figure 8, Figure S2: The evolutionary trajectory of the central government’s strategies under the corresponding scenario in Figure 9.
Author Contributions
Y.S. was responsible for conceptualization, methodology, software, validation, formal analysis, investigation, data curation, writing—original draft preparation, writing—review and editing, and visualization. H.H. was responsible for writing—review and editing, supervision, project administration, and funding acquisition. X.G. was responsible for software, validation, data curation, and visualization. All authors have read and agreed to the published version of the manuscript.
Funding
This research was funded by the National Natural Science Foundation of China (Grant No. 72063023), the Central Government Funds for Guiding Local Science and Technology Development of China (Grant No. YDZX20216200001876), and the Industrial Support Program for Higher Education Institutions in Gansu Province (Grant No. 2022CYZC55).
Data Availability Statement
Data is contained within the article. Further inquiries can be directed to the corresponding author.
Conflicts of Interest
The authors declare no conflicts of interest.
Abbreviations
The following abbreviations are used in this manuscript:
| R&D | Research and development |
| SMEs | Small and medium-sized enterprises |
| ESS | Evolutionary stability strategies |
| PSEP | Pure strategy equilibrium point |
| EAPs | Empirically Anchored Parameters |
| PHPs | Purely Hypothetical Parameters |
| CSMAR | China Stock Market & Accounting Research Database |
| CNY | Chinese Yuan |
| VAT | Value-added tax |
| CIT | Corporate income tax |
| NGOs | Non-governmental organizations |
Appendix A. Expected Payoffs and Replicator Dynamic Equations
- 1.
- Replicator Dynamic Equation of Local Governments
The expected payoffs for local government adoption of “high participation” and “low participation” are denoted as and respectively; the average expected payoff is denoted as .
Based on Equations (A1)–(A3), the replicator dynamic equation of local governments is presented as follows:
- 2.
- Replicator Dynamic Equation of Enterprises
The expected payoffs for enterprise adoption of “green transition” and “non- green transition” are denoted as and respectively; the average expected payoff is denoted as .
Based on Equations (A5)–(A7), the replicator dynamic equation of enterprises is presented as follows:
- 3.
- Replicator Dynamic Equation of Banks
The expected payoffs for bank adoption of “assess environmental risks” and not assess environmental risks” are denoted as and respectively; the average expected payoff is denoted as .
Based on Equations (A9)–(A11), the replicator dynamic equation of banks is presented as follows:
Appendix B. Jacobian Matrix and Eigenvalues
Based on the first-order partial derivative of the replicator dynamic equations, the Jacobian matrix of the quadrilateral evolutionary game model is constructed as follows:
This can be simplified as follows:
where
Table A1.
Eigenvalues and stability conditions.
References
- Liu, D.; Feng, M.; Liu, Y.; Wang, L.; Hu, J.; Wang, G.; Zhang, J. A Tripartite Evolutionary Game Study of Low-Carbon Innovation System from the Perspective of Dynamic Subsidies and Taxes. J. Environ. Manag. 2024, 356, 120651. [Google Scholar] [CrossRef] [Scilit]
- Zhang, D.; Guo, K.; Ji, Q. Resolve Climate-Policy Uncertainties in the US and China. Nature 2024, 625, 663. [Google Scholar] [CrossRef] [Scilit]
- Porter, M.E.; van der Linde, C. Toward a New Conception of the Environment-Competitiveness Relationship. J. Econ. Perspect. 1995, 9, 97–118. [Google Scholar] [CrossRef] [Scilit]
- Gollop, F.M.; Roberts, M.J. Environmental Regulations and Productivity Growth: The Case of Fossil-Fueled Electric Power Generation. J. Political Econ. 1983, 91, 654–674. [Google Scholar] [CrossRef] [Scilit]
- Zhao, C.; Guo, Q.; Jia, R.; Dong, K.; Wang, K. How Does Clean Energy Transition Promote Original Design Manufacturers? A Three-Party Evolutionary Game Analysis. Energy Econ. 2023, 126, 106965. [Google Scholar] [CrossRef] [Scilit]
- Wu, Z.; Fan, X.; Zhu, B.; Xia, J.; Zhang, L.; Wang, P. Do Government Subsidies Improve Innovation Investment for New Energy Firms: A Quasi-Natural Experiment of China’s Listed Companies. Technol. Forecast. Soc. Change 2022, 175, 121418. [Google Scholar] [CrossRef] [Scilit]
- Oates, W. A Reconsideration of Environmental Federalism; RFF Working Paper Series; Resources for the Future: Washington, DC, USA, 2001. [Google Scholar]
- Liu, X.; Wang, E.; Cai, D. Green Credit Policy, Property Rights and Debt Financing: Quasi-Natural Experimental Evidence from China. Financ. Res. Lett. 2019, 29, 129–135. [Google Scholar] [CrossRef] [Scilit]
- Xiao, S.; Zhu, X. Bureaucratic Control and Strategic Compliance: How Do Subnational Governments Implement Central Guidelines in China? J. Public Adm. Res. Theory 2022, 32, 342–359. [Google Scholar] [CrossRef] [Scilit]
- Huang, H.; Xing, X.; He, Y.; Gu, X. Combating Greenwashers in Emerging Markets: A Game-Theoretical Exploration of Firms, Customers and Government Regulations. Transp. Res. Part E Logist. Transp. Rev. 2020, 140, 101976. [Google Scholar] [CrossRef] [Scilit]
- Liu, C.; Gong, W.; Dong, G.; Ji, Q. Regulation of Environmental, Social and Governance Disclosure Greenwashing Behaviors Considering the Risk Preference of Enterprises. Energy Econ. 2024, 135, 107637. [Google Scholar] [CrossRef] [Scilit]
- Wu, A. The Signal Effect of Government R&D Subsidies in China: Does Ownership Matter? Technol. Forecast. Soc. Change 2017, 117, 339–345. [Google Scholar] [CrossRef] [Scilit]
- Kooiman, J. Governing as Governance; SAGE Publications Ltd.: London, UK, 2003. [Google Scholar]
- Sun, X.; Wang, W.; Pang, J.; Liu, X.; Zhang, M. Study on the Evolutionary Game of Central Government and Local Governments Under Central Environmental Supervision System. J. Clean. Prod. 2021, 296, 126574. [Google Scholar] [CrossRef] [Scilit]
- Chen, G.; Xu, J.; Qi, Y. Environmental (de)Centralization and Local Environmental Governance: Evidence from a Natural Experiment in China. China Econ. Rev. 2022, 72, 101755. [Google Scholar] [CrossRef] [Scilit]
- Feng, N.; Ge, J. How Does Fiscal Policy Affect the Green Low-Carbon Transition from the Perspective of the Evolutionary Game? Energy Econ. 2024, 134, 107578. [Google Scholar] [CrossRef] [Scilit]
- Alm, J.; Banzhaf, H.S. Designing Economic Instruments for the Environment in a Decentralized Fiscal System. J. Econ. Surv. 2012, 26, 177–202. [Google Scholar] [CrossRef] [Scilit]
- Khan, Z.; Ali, S.; Dong, K.; Li, R.Y.M. How Does Fiscal Decentralization Affect CO2 Emissions? The Roles of Institutions and Human Capital. Energy Econ. 2021, 94, 105060. [Google Scholar] [CrossRef] [Scilit]
- Duflo, E.; Greenstone, M.; Pande, R.; Ryan, N. The Value of Regulatory Discretion: Estimates from Environmental Inspections in India. Econometrica 2018, 86, 2123–2160. [Google Scholar] [CrossRef] [Scilit]
- Malesky, E.J.; Nguyen, C.V.; Tran, A. The Impact of Recentralization on Public Services: A Difference-in-Differences Analysis of the Abolition of Elected Councils in Vietnam. Am. Polit. Sci. Rev. 2014, 108, 144–168. [Google Scholar] [CrossRef] [Scilit]
- Boffa, F.; Piolatto, A.; Ponzetto, G.A.M. Political Centralization and Government Accountability. Q. J. Econ. 2016, 131, 381–422. [Google Scholar] [CrossRef] [Scilit]
- Zhu, X.; Wang, Y. Credible Signaling to Promote Local Compliance: Evidence from China’s Multiwave Inspection of Environmental Protection. Public Adm. 2024, 103, 47–65. [Google Scholar] [CrossRef] [Scilit]
- Anderson, S.E.; Buntaine, M.T.; Liu, M.; Zhang, B. Non-Governmental Monitoring of Local Governments Increases Compliance with Central Mandates: A National-Scale Field Experiment in China. Am. J. Political Sci. 2019, 63, 626–643. [Google Scholar] [CrossRef] [Scilit]
- Arroyave, L.O.; Lopes, R.; Santos, R. Leveraging Local Environmental Management in the Scope of an Administrative Decentralization Process: The Case of Portuguese Coastal Municipalities. J. Environ. Manag. 2025, 394, 127052. [Google Scholar] [CrossRef] [Scilit]
- Jin, H.; Tsai, F.-S.; Martinez-Vazquez, J. Optimal Expenditure Decentralization for Sustainable Development: Evidence from a 52-Country Panel Analysis. Financ. Innov. 2025, 11, 111. [Google Scholar] [CrossRef] [Scilit]
- Chen, G.; Lim, M.K.; Tseng, M.-L. Green Credit and Transformation to Enhance the Plastic Supply Chain in China: A Three-Player Evolutionary Game Perspective Approach under Dynamic Green Awareness. J. Clean. Prod. 2024, 448, 141416. [Google Scholar] [CrossRef] [Scilit]
- Hu, G.; Wang, X.; Wang, Y. Can the Green Credit Policy Stimulate Green Innovation in Heavily Polluting Enterprises? Evidence from a Quasi-Natural Experiment in China. Energy Econ. 2021, 98, 105134. [Google Scholar] [CrossRef] [Scilit]
- Chen, Y.; Zhang, Y.; Wang, M. Green Credit, Financial Regulation and Corporate Green Innovation: Evidence from China. Financ. Res. Lett. 2024, 59, 104768. [Google Scholar] [CrossRef] [Scilit]
- Lv, C.; Fan, J.; Lee, C.-C. Can Green Credit Policies Improve Corporate Green Production Efficiency? J. Clean. Prod. 2023, 397, 136573. [Google Scholar] [CrossRef] [Scilit]
- Li, L.; Qiu, L.; Xu, F.; Zheng, X. The Impact of Green Credit on Firms’ Green Investment Efficiency: Evidence from China. Pac.-Basin Financ. J. 2023, 79, 101995. [Google Scholar] [CrossRef] [Scilit]
- Zhang, D. Does Green Finance Really Inhibit Extreme Hypocritical ESG Risk? A Greenwashing Perspective Exploration. Energy Econ. 2023, 121, 106688. [Google Scholar] [CrossRef] [Scilit]
- Xu, L.; Tian, T. Blockchain-Enabled Enterprise Bleaching Green Regulation Banking Evolution Game Analysis. Environ. Dev. Sustain. 2023, 26, 27457–27483. [Google Scholar] [CrossRef] [Scilit]
- Guo, J.; Fang, Y.; Guo, Y. Environmental regulation, short-term failure tolerance and firm green innovation: Evidence from the practice of green credit policy. Econ. Res. J. 2024, 59, 112–129. (In Chinese) [Google Scholar]
- Ma, Y.; Sha, Y.; Wang, Z.; Zhang, W. The Effect of the Policy Mix of Green Credit and Government Subsidy on Environmental Innovation. Energy Econ. 2023, 118, 106512. [Google Scholar] [CrossRef] [Scilit]
- Ding, N.; Ren, Y.; Zuo, Y. Do the losses of the green credit policy outweigh the gains? A PSM-DID cost-efficiency analysis based on resource allocation. J. Financ. Res. 2020, 4, 112–130. (In Chinese) [Google Scholar]
- Abadie, A.; Chowdhury, S.; Mangla, S.K.; Malik, S. Impact of Carbon Offset Perceptions on Greenwashing: Revealing Intentions and Strategies through an Experimental Approach. Ind. Mark. Manag. 2024, 117, 304–320. [Google Scholar] [CrossRef] [Scilit]
- Dogah, K.E.; Wesseh, P.K.; Adomako, S. Green Credit Policy, Technological Innovation, and Corporate Financial Performance: Evidence from the Energy Industry. Bus. Strategy Environ. 2025, 34, 1171–1188. [Google Scholar] [CrossRef] [Scilit]
- Fan, W.; Wang, S.; Gu, X.; Zhou, Z.; Zhao, Y.; Huo, W. Evolutionary Game Analysis on Industrial Pollution Control of Local Government in China. J. Environ. Manag. 2021, 298, 113499. [Google Scholar] [CrossRef] [Scilit]
- Sheng, J.; Zhou, W.; Zhu, B. The Coordination of Stakeholder Interests in Environmental Regulation: Lessons from China’s Environmental Regulation Policies from the Perspective of the Evolutionary Game Theory. J. Clean. Prod. 2020, 249, 119385. [Google Scholar] [CrossRef] [Scilit]
- Wang, J.; Jia, L.; He, P.; Wang, P.; Huang, L. Engaging Stakeholders in Collaborative Control of Air Pollution: A Tripartite Evolutionary Game of Enterprises, Public and Government. J. Clean. Prod. 2023, 418, 138074. [Google Scholar] [CrossRef] [Scilit]
- Zhan, W.; Lv, P. An Evolutionary Game Analysis of CSR Governance in Multinational Enterprises Under External Stakeholder Monitoring. Systems 2025, 13, 1077. [Google Scholar] [CrossRef] [Scilit]
- Antoci, A.; Borghesi, S.; Iannucci, G.; Russu, P. Emission Permits, Innovation and Sanction in an Evolutionary Game. Econ. Polit. 2020, 37, 525–546. [Google Scholar] [CrossRef] [Scilit]
- Kim, H.; Choi, H.; Hong, T.; Ji, C.; Lee, J. Evolutionary Game Analysis of Green Loans Program to Achieve the National Carbon Emissions Reduction Target in South Korea. J. Manag. Eng. 2022, 38, 04022018. [Google Scholar] [CrossRef] [Scilit]
- Jiang, K.; You, D.; Merrill, R.; Li, Z. Implementation of a Multi-Agent Environmental Regulation Strategy under Chinese Fiscal Decentralization: An Evolutionary Game Theoretical Approach. J. Clean. Prod. 2019, 214, 902–915. [Google Scholar] [CrossRef] [Scilit]
- Nersesian, L.; Hafezalkotob, A.; Reza-Gharehbagh, R. Alternative Governmental Carbon Policies on Populations of Green and Non-Green Supply Chains in a Competitive Market. Environ. Dev. Sustain. 2023, 25, 4139–4172. [Google Scholar] [CrossRef] [Scilit]
- Li, M.; Gao, X. Implementation of Enterprises’ Green Technology Innovation under Market-Based Environmental Regulation: An Evolutionary Game Approach. J. Environ. Manag. 2022, 308, 114570. [Google Scholar] [CrossRef] [Scilit]
- Hong, Y.; Qin, C. Game Analysis of the Behavior of Participants in Green Supply Chain Finance Based on Digital Technology Platforms. Comput. Econ. 2024, 65, 3475–3502. [Google Scholar] [CrossRef] [Scilit]
- Jaffe, A.B.; Palmer, K. Environmental Regulation and Innovation: A Panel Data Study. Rev. Econ. Stat. 1997, 79, 610–619. [Google Scholar] [CrossRef] [Scilit]
- Friedman, D. Evolutionary Games in Economics. Econometrica 1991, 59, 637–666. [Google Scholar] [CrossRef] [Scilit]
- Lyapunov, A.M. The General Problem of the Stability of Motion. Int. J. Control 1992, 55, 531–534. [Google Scholar] [CrossRef] [Scilit]
- Kahneman, D.; Tversky, A. Prospect Theory: An Analysis of Decision under Risk. Econometrica 1979, 47, 263–291. [Google Scholar] [CrossRef] [Scilit]
- Li, Q.; Qian, T.; Zhang, X.; Long, R.; Chen, H.; Huang, H.; Liu, L.; Zhu, L.; Jiang, H.; Zhu, H. How Does Stakeholder Loss Aversion Affect the Promotion of Green Housing? Econ. Anal. Policy 2023, 80, 647–668. [Google Scholar] [CrossRef] [Scilit]
- Xia, L.; Gao, S.; Wei, J.; Ding, Q. Government Subsidy and Corporate Green Innovation—Does Board Governance Play a Role? Energy Policy 2022, 161, 112720. [Google Scholar] [CrossRef] [Scilit]
- Blanes, J.V.; Busom, I. Who Participates in R&D Subsidy Programs?: The Case of Spanish Manufacturing Firms. Res. Policy 2004, 33, 1459–1476. [Google Scholar] [CrossRef] [Scilit]
- Murphy, K.; Shleifer, A.; Vishny, R. Why Is Rent-Seeking so Costly to Growth? Am. Econ. Rev. 1993, 83, 409–414. [Google Scholar]
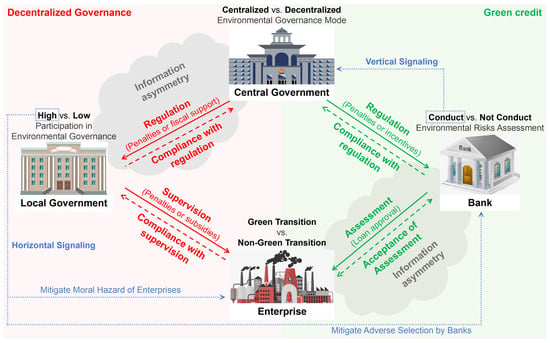
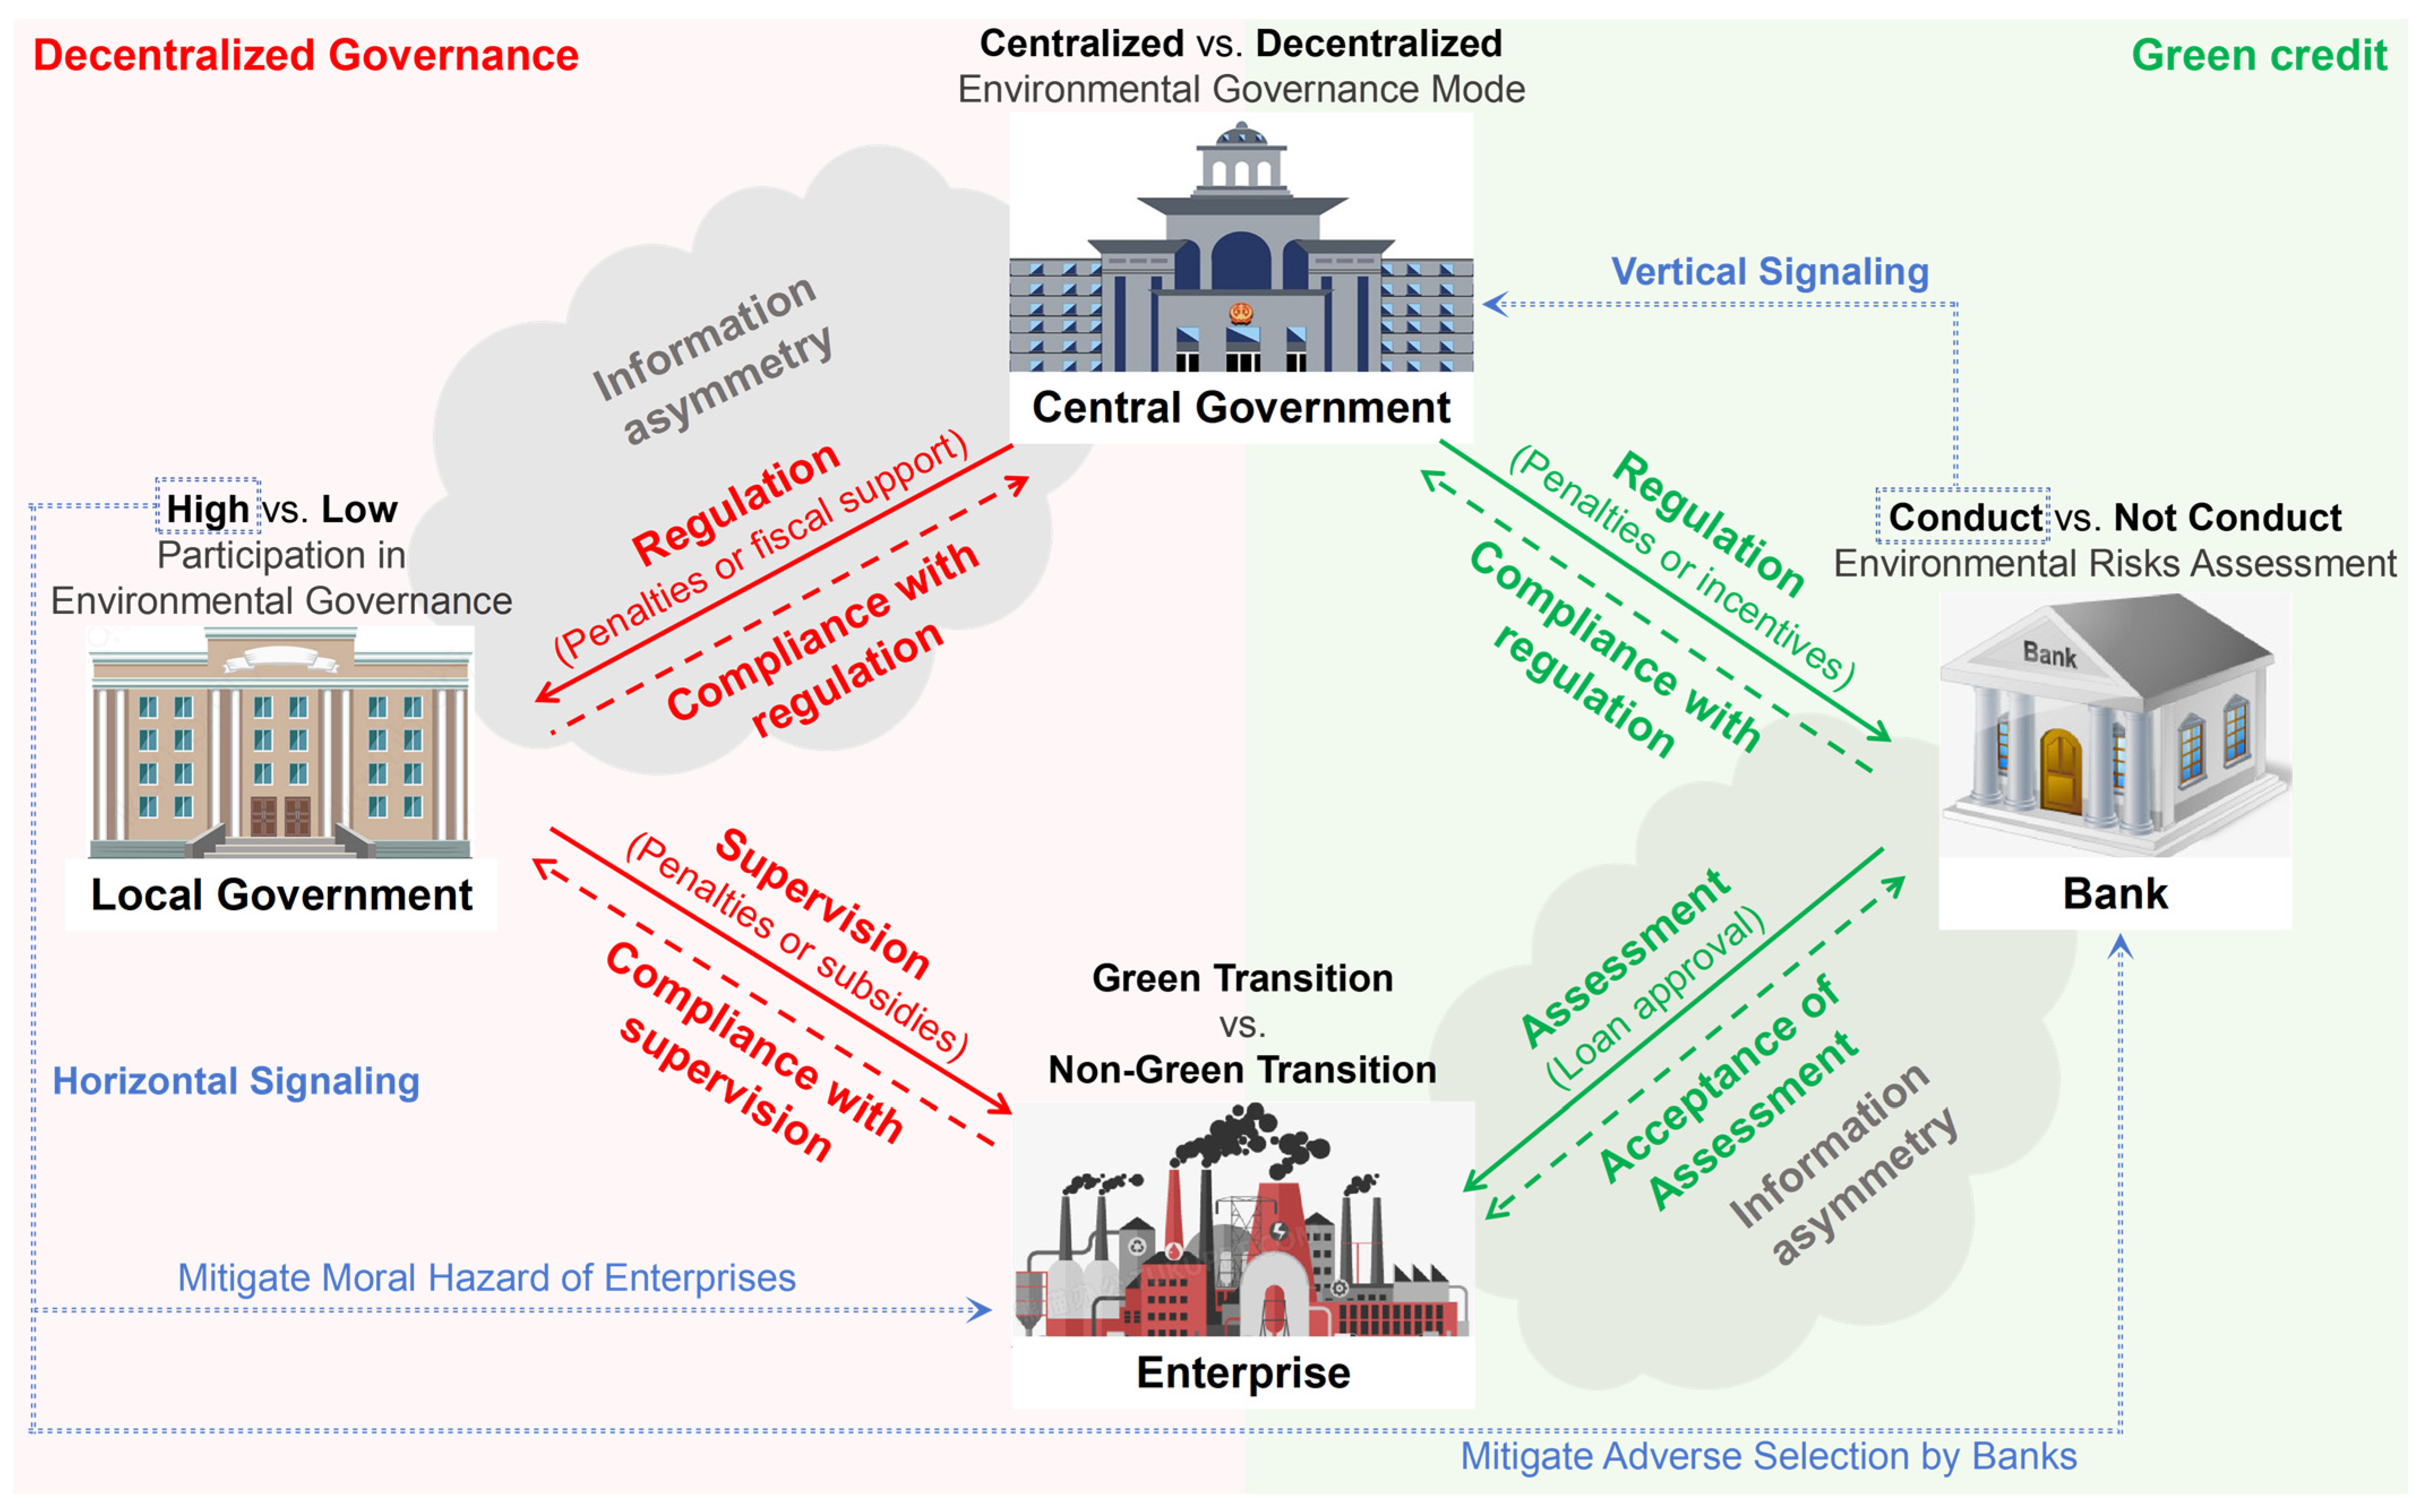
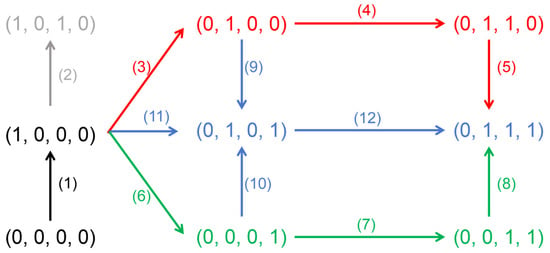
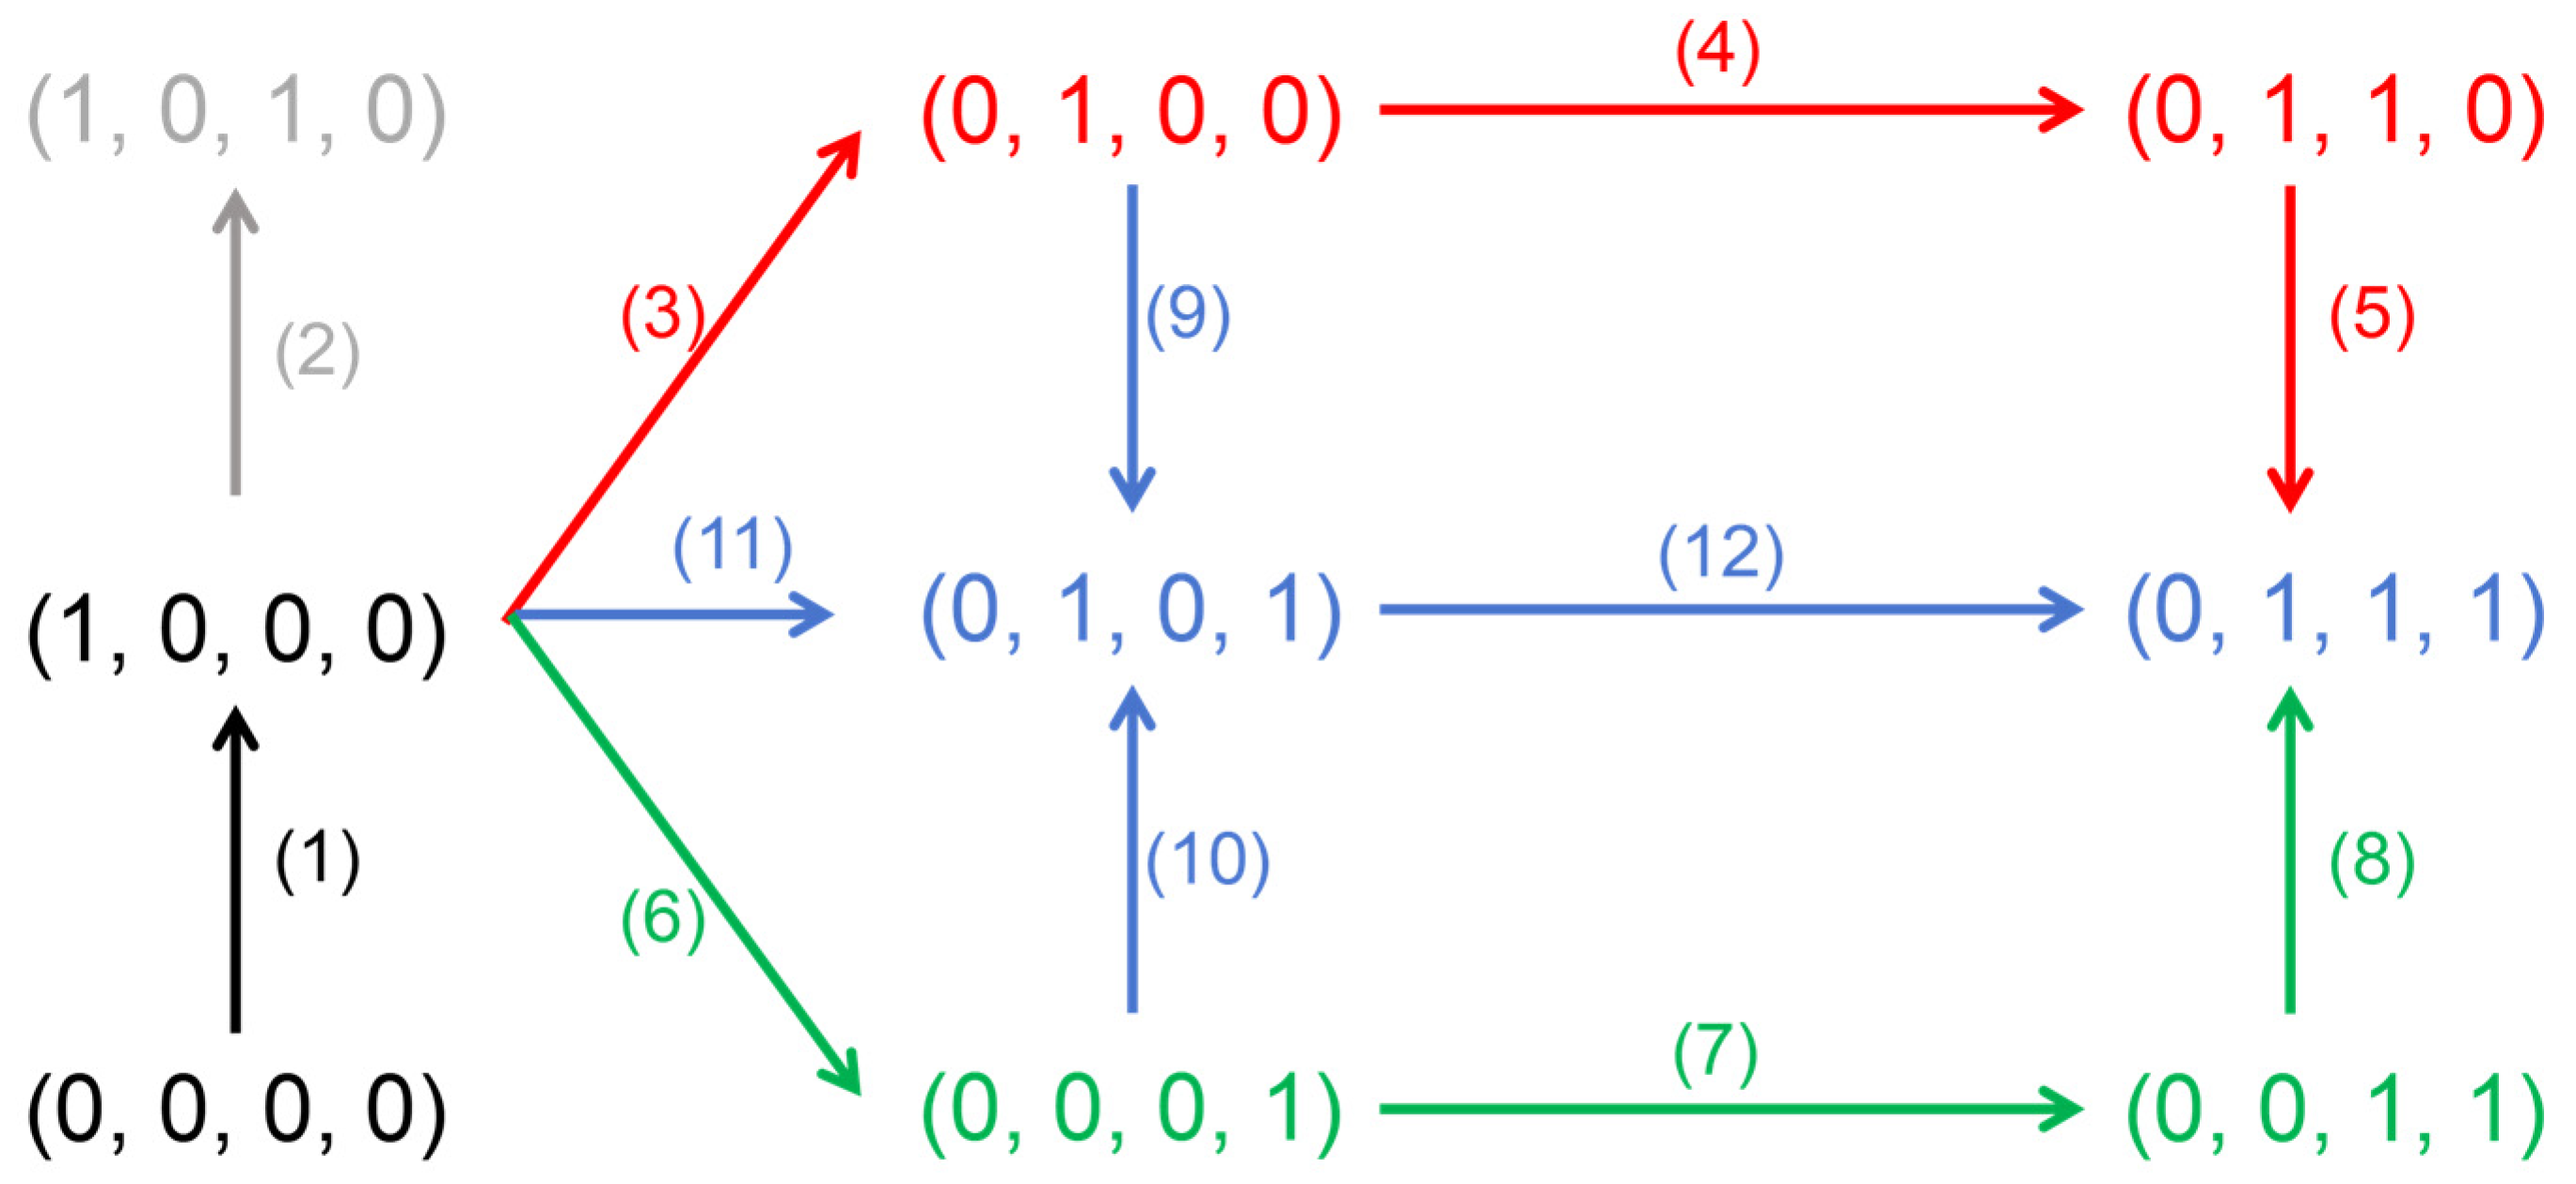
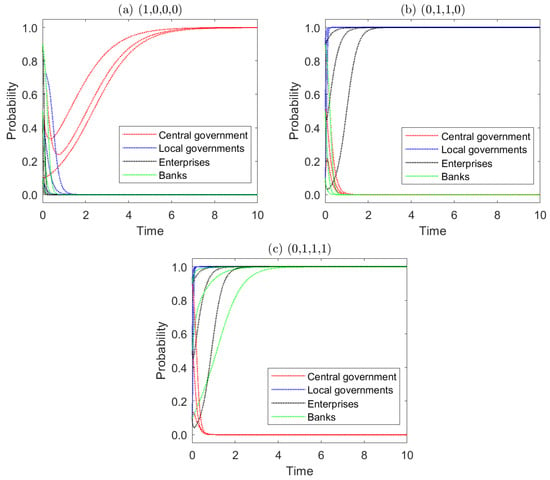
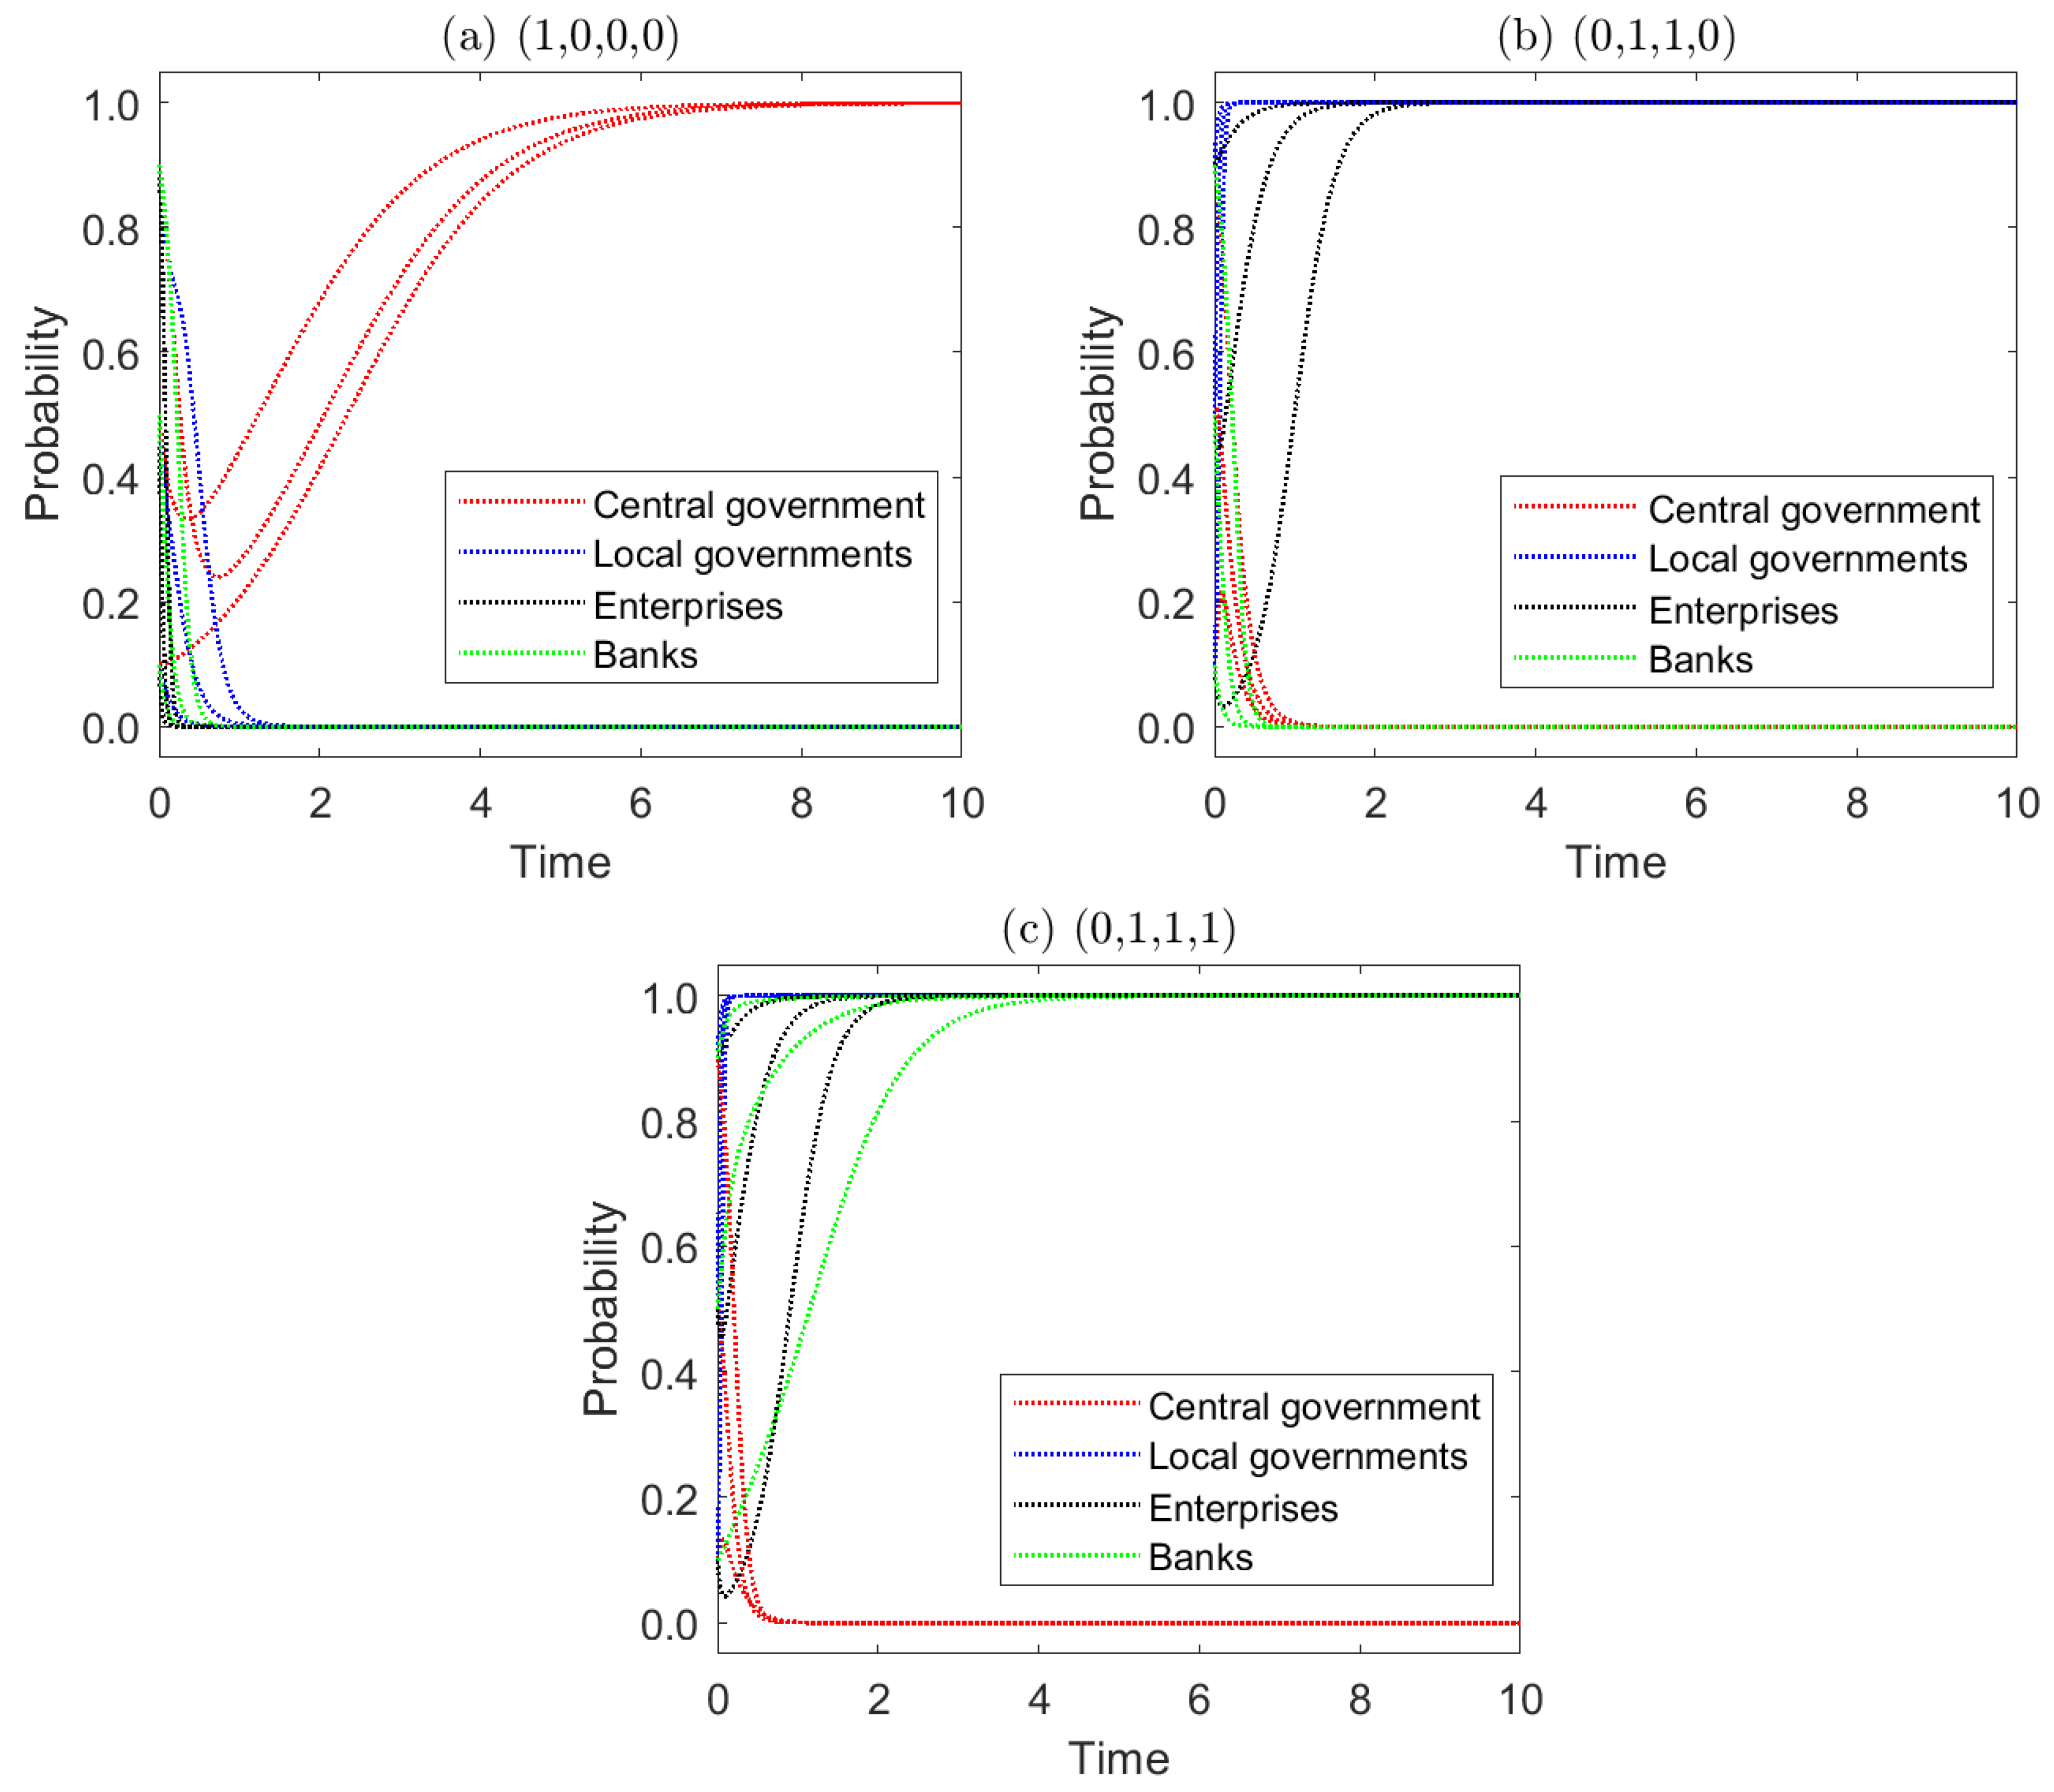
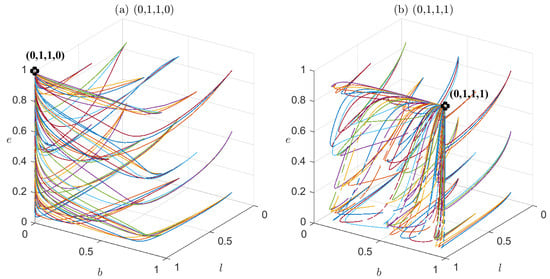
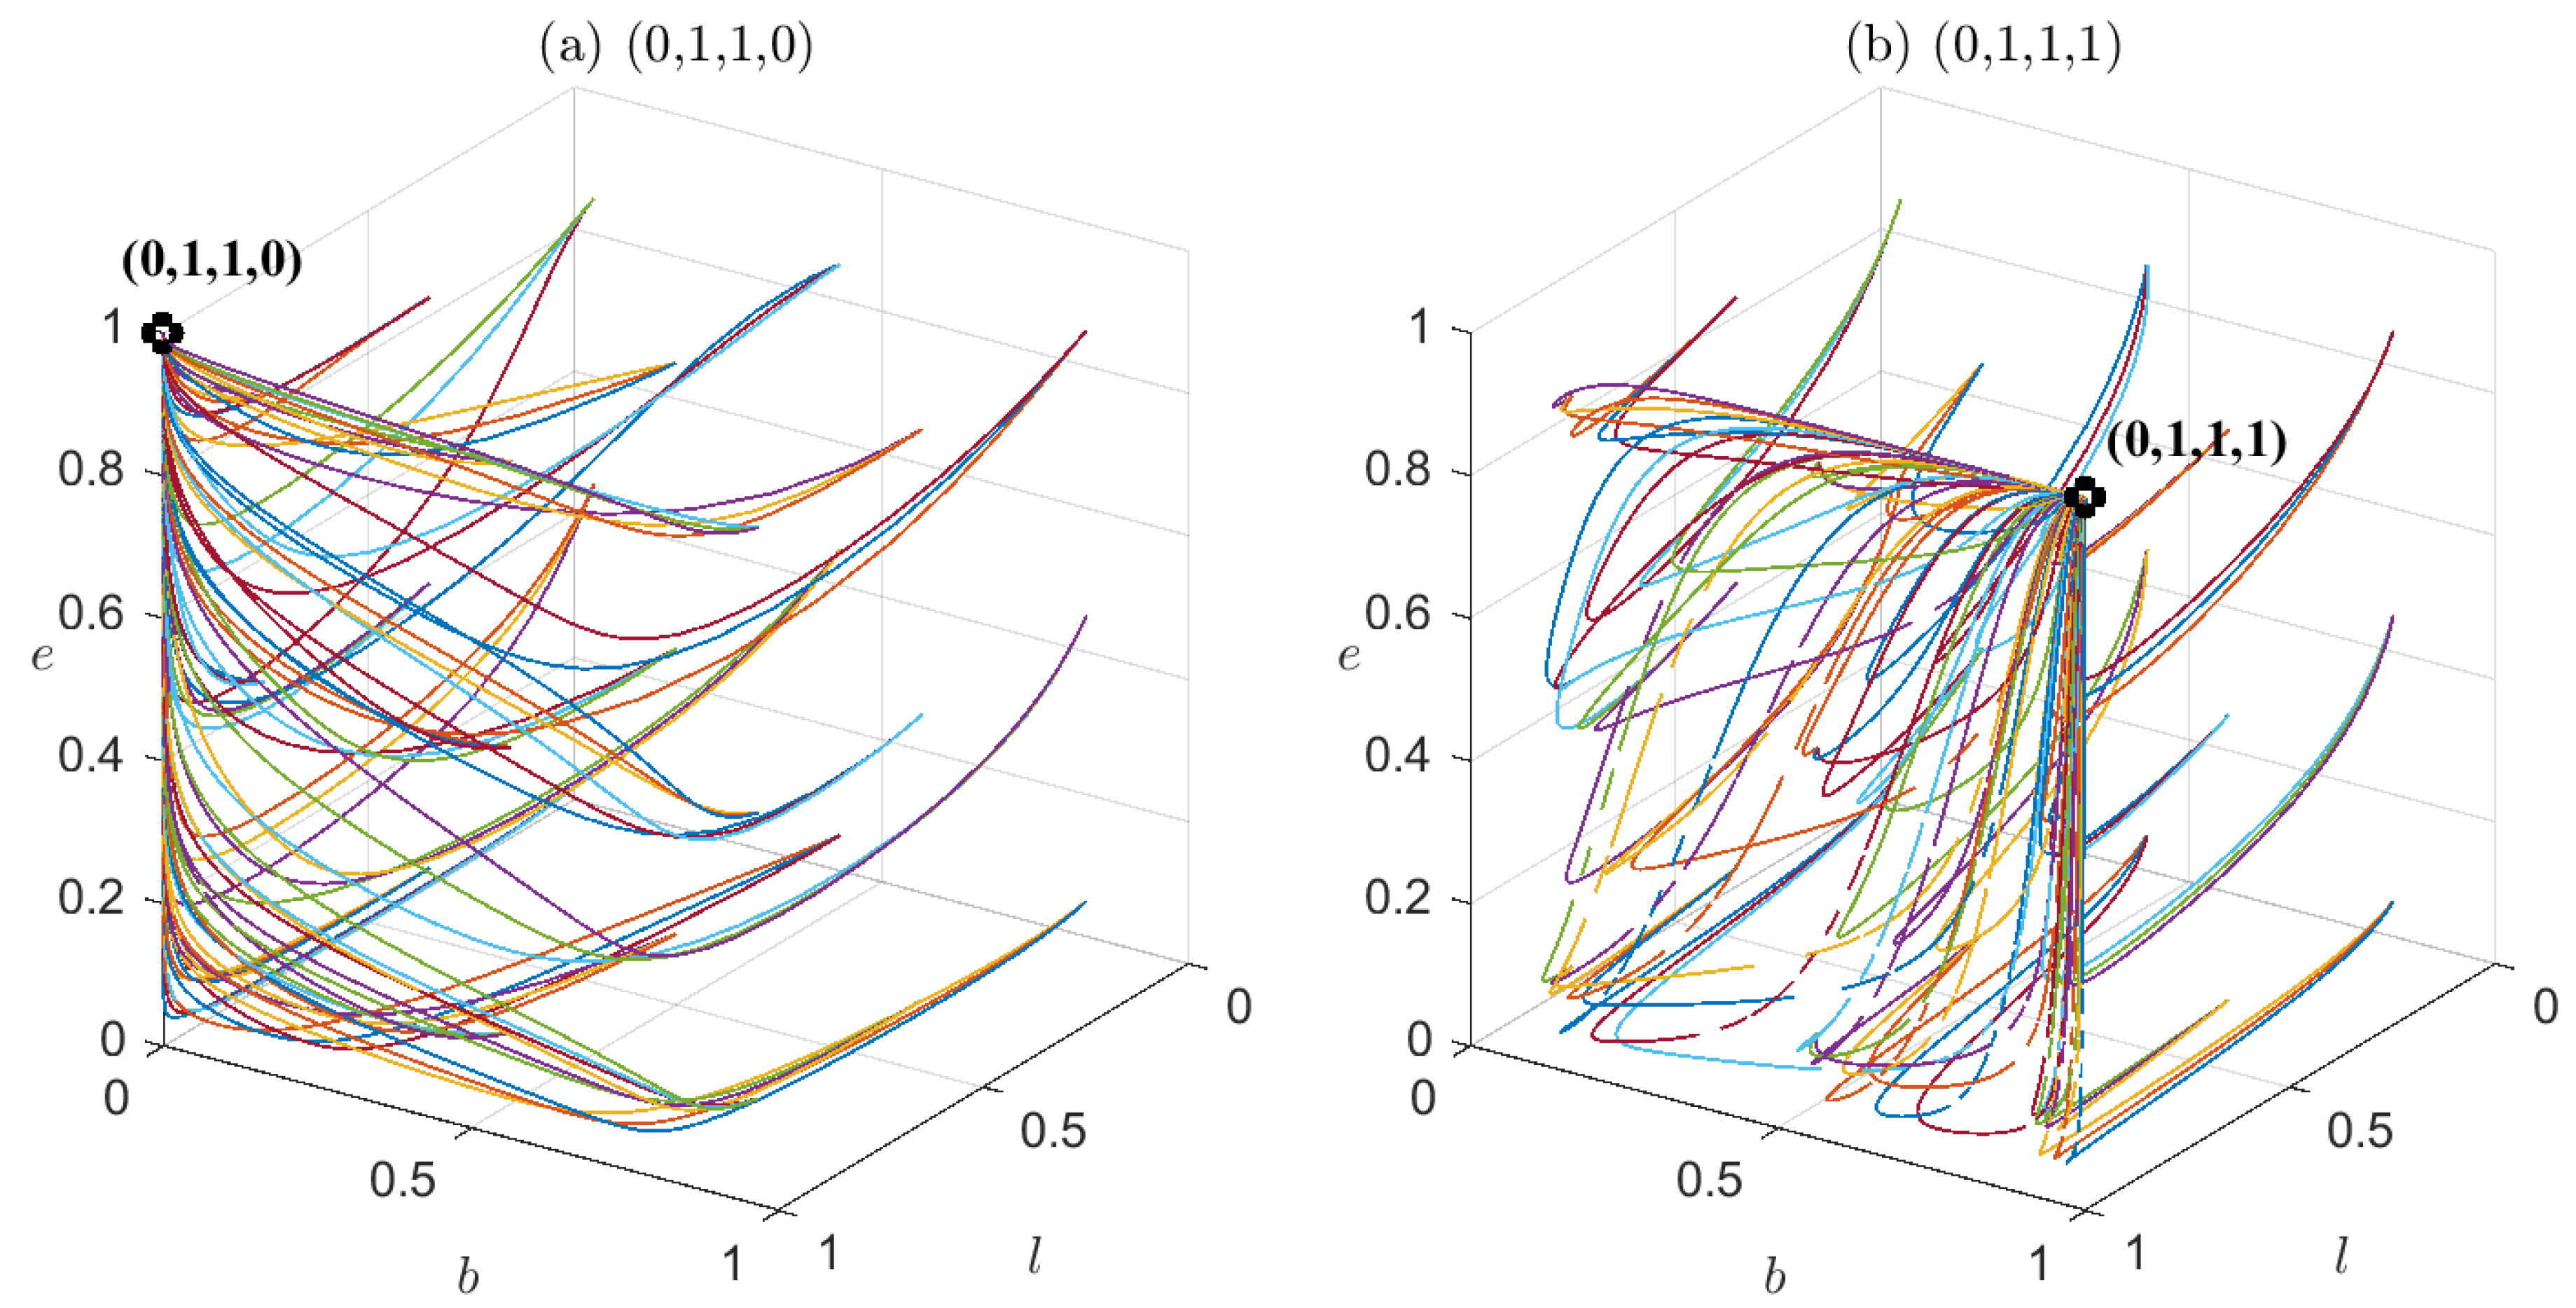
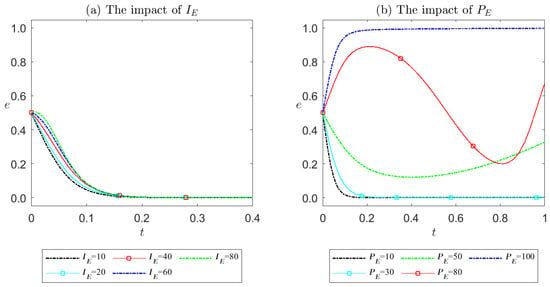
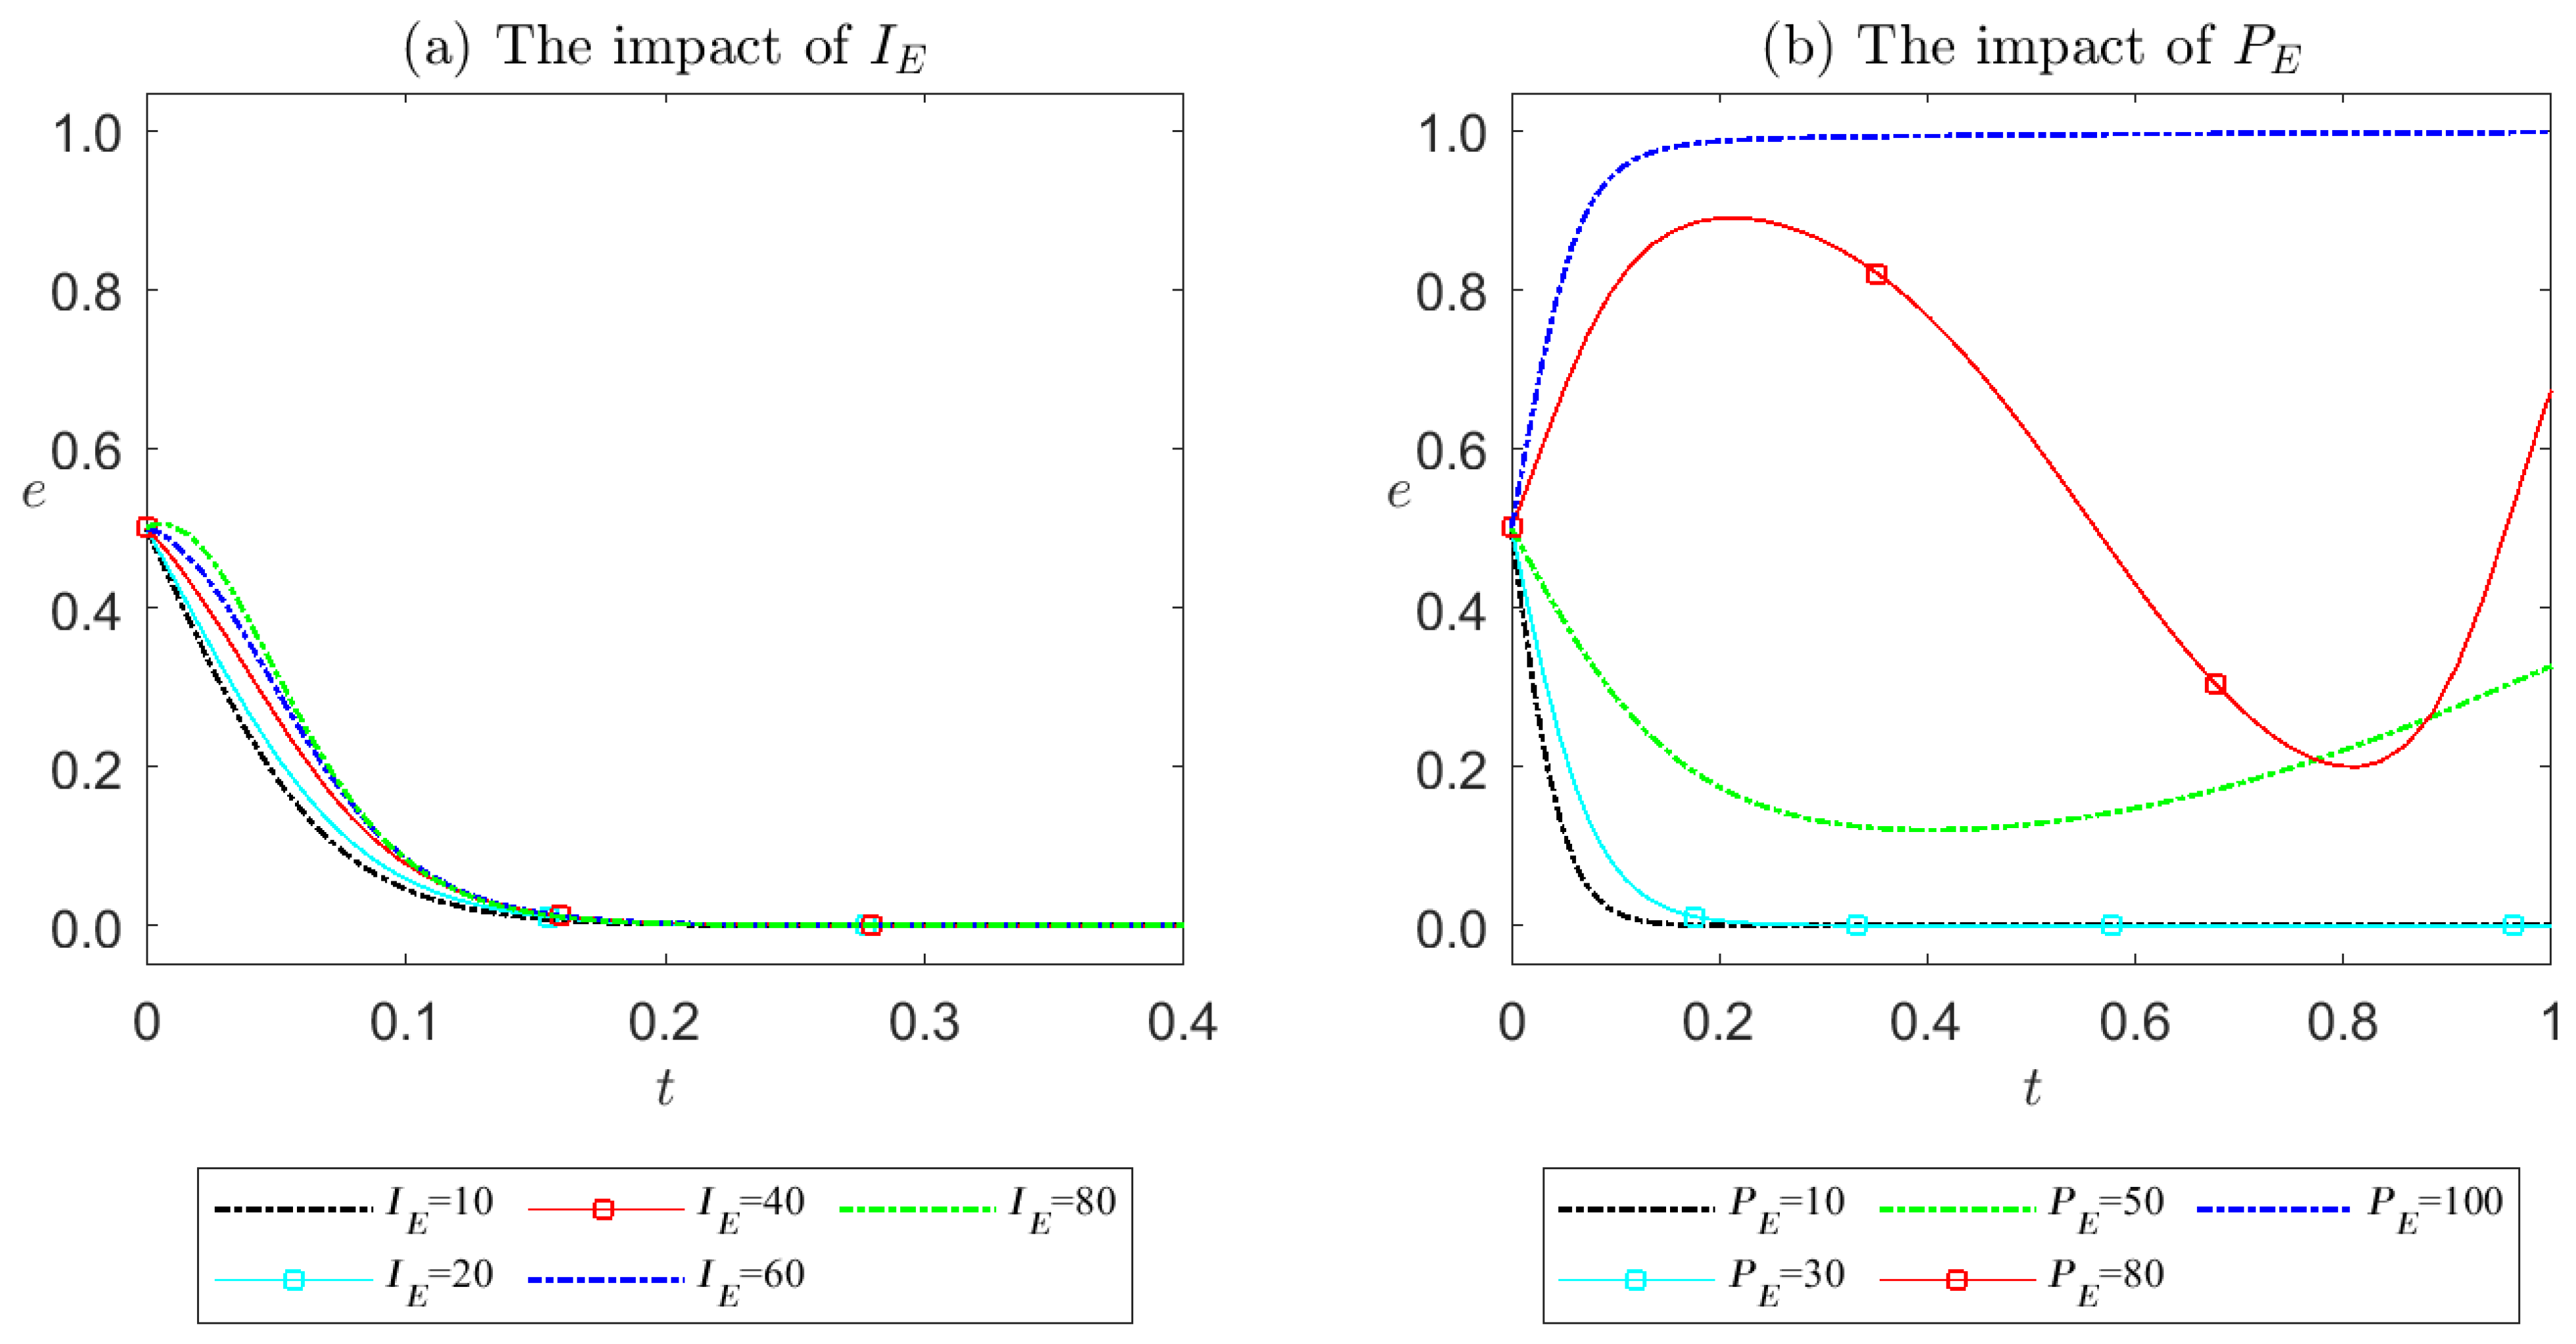
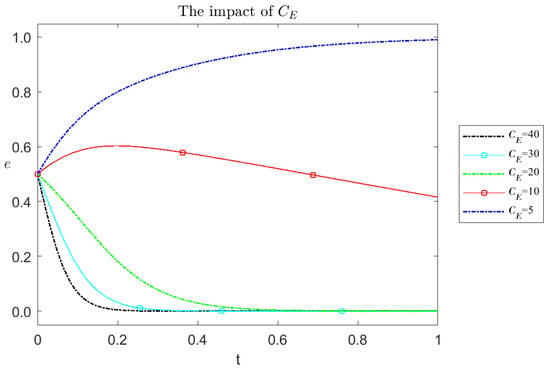
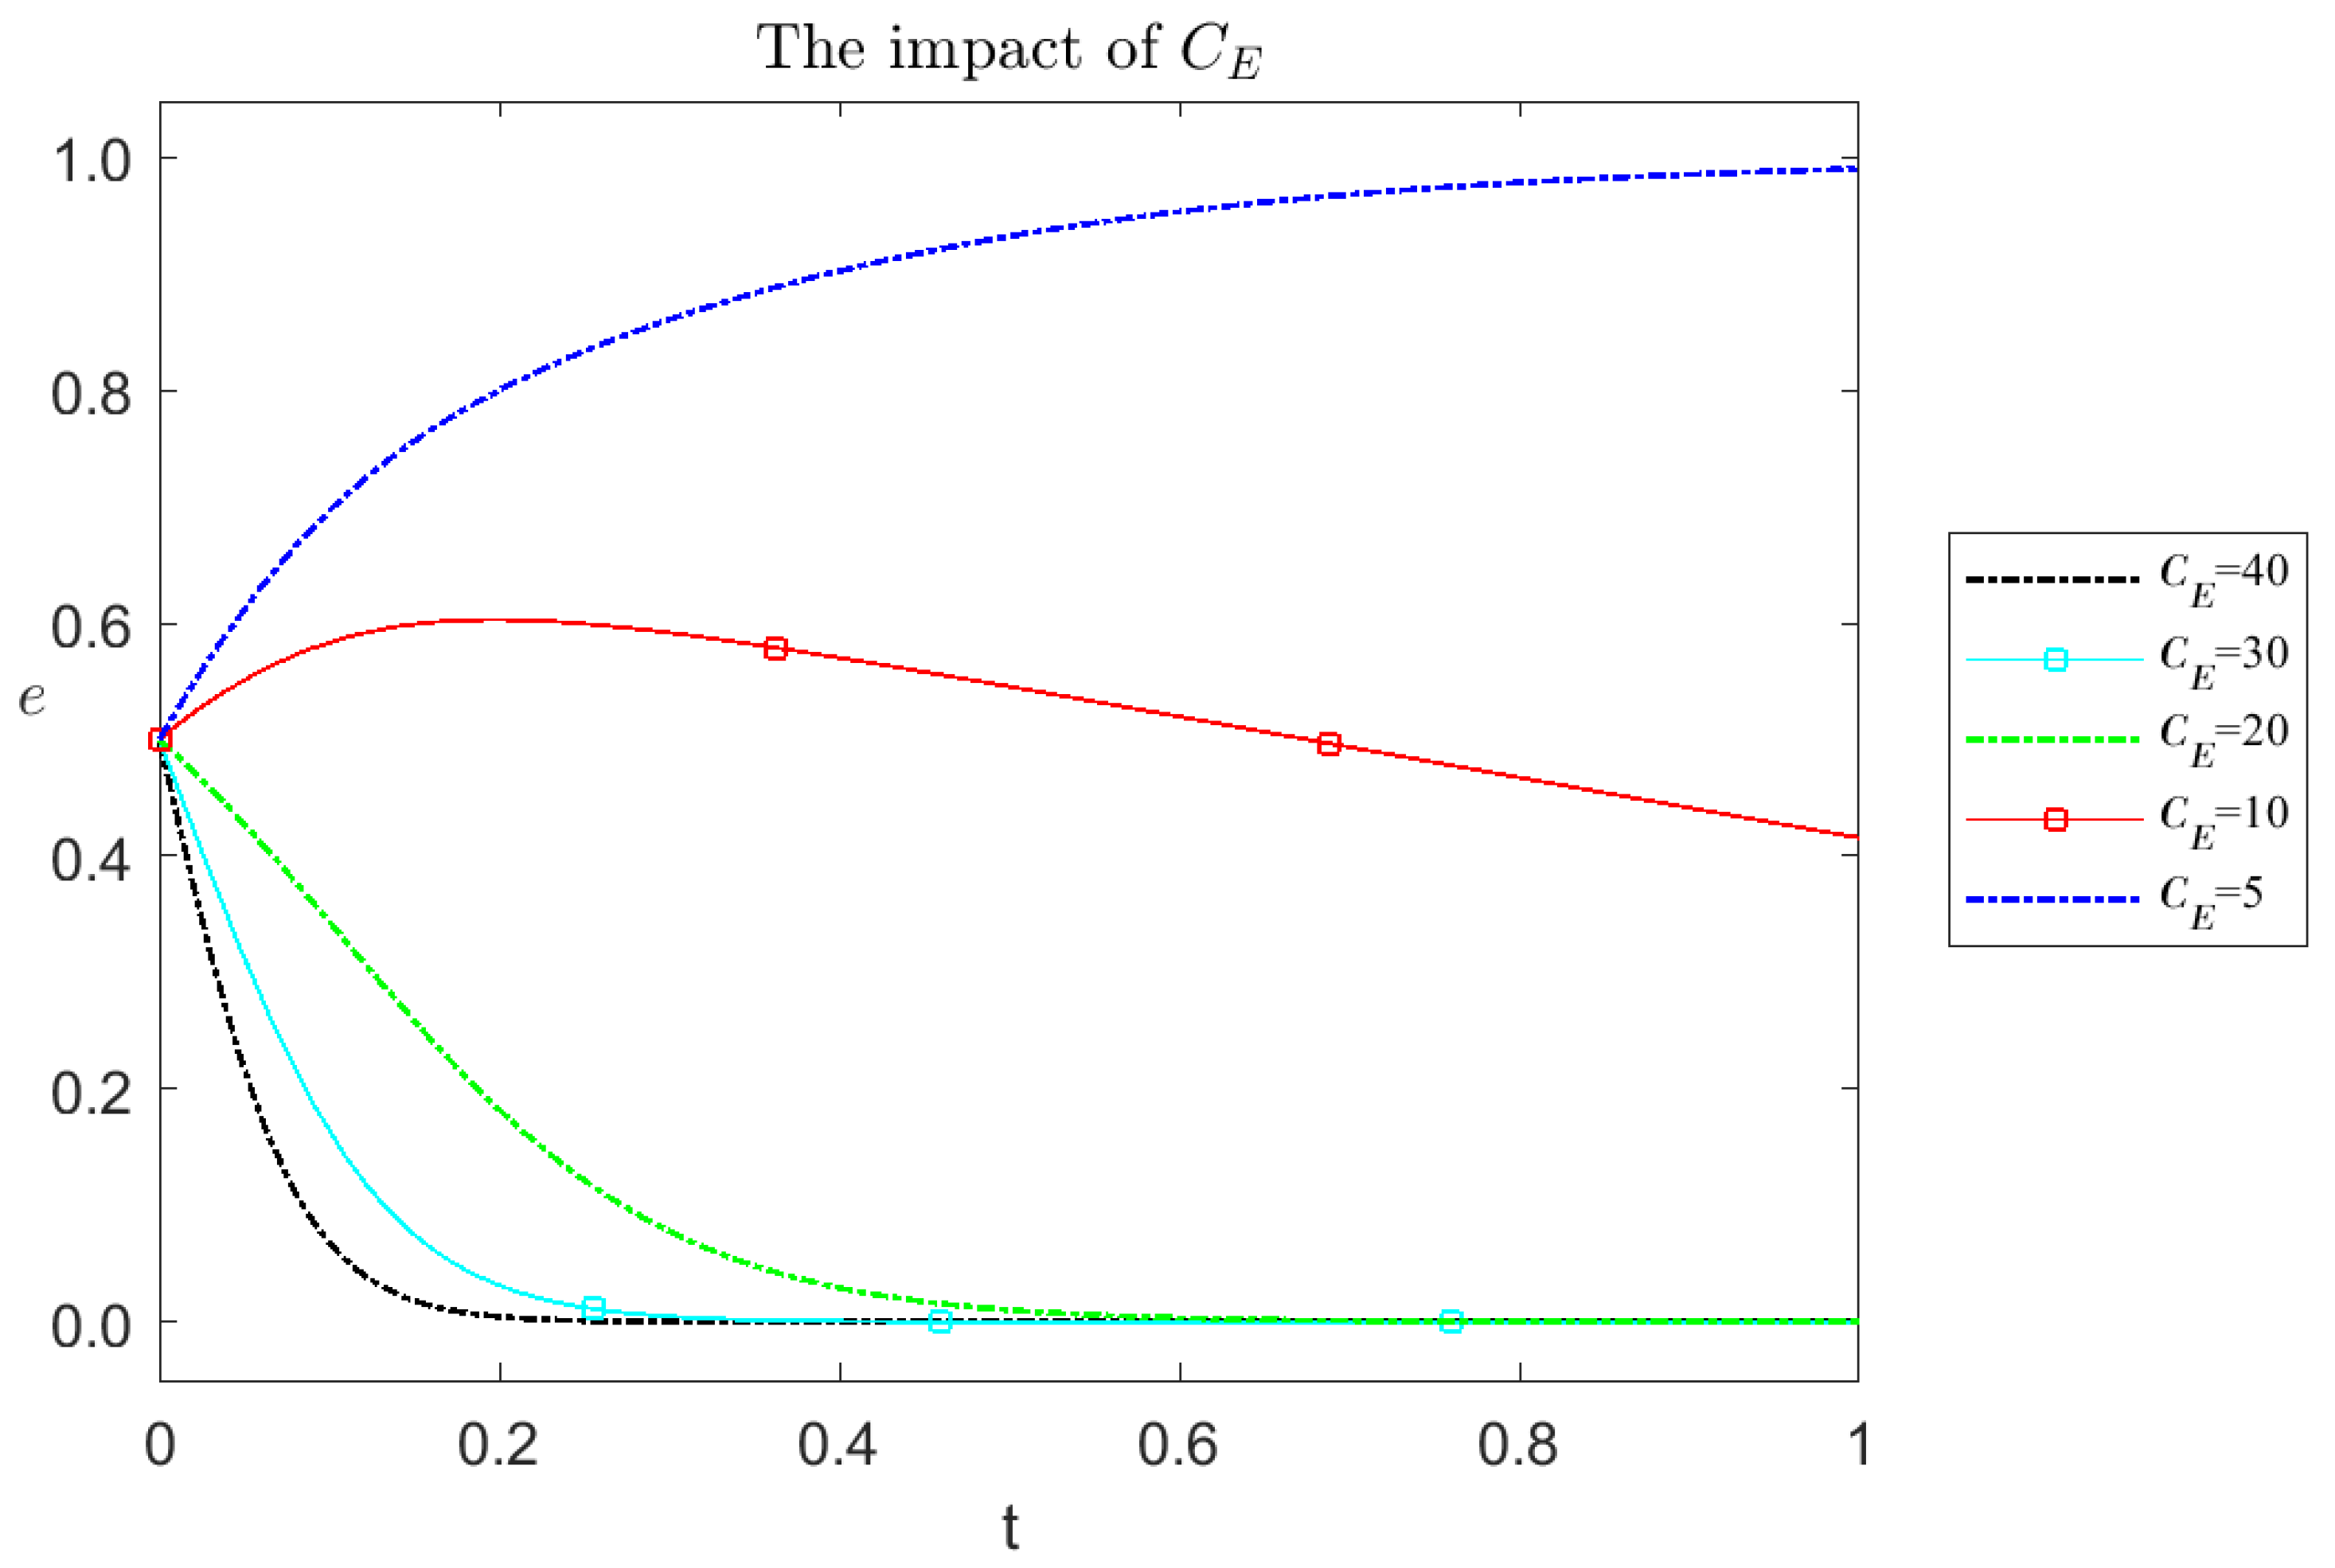
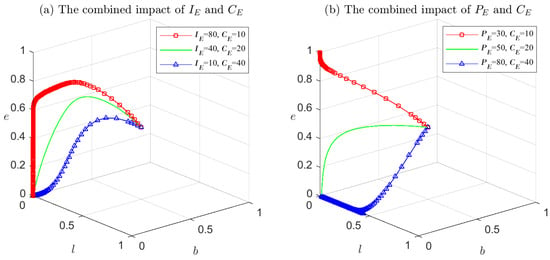
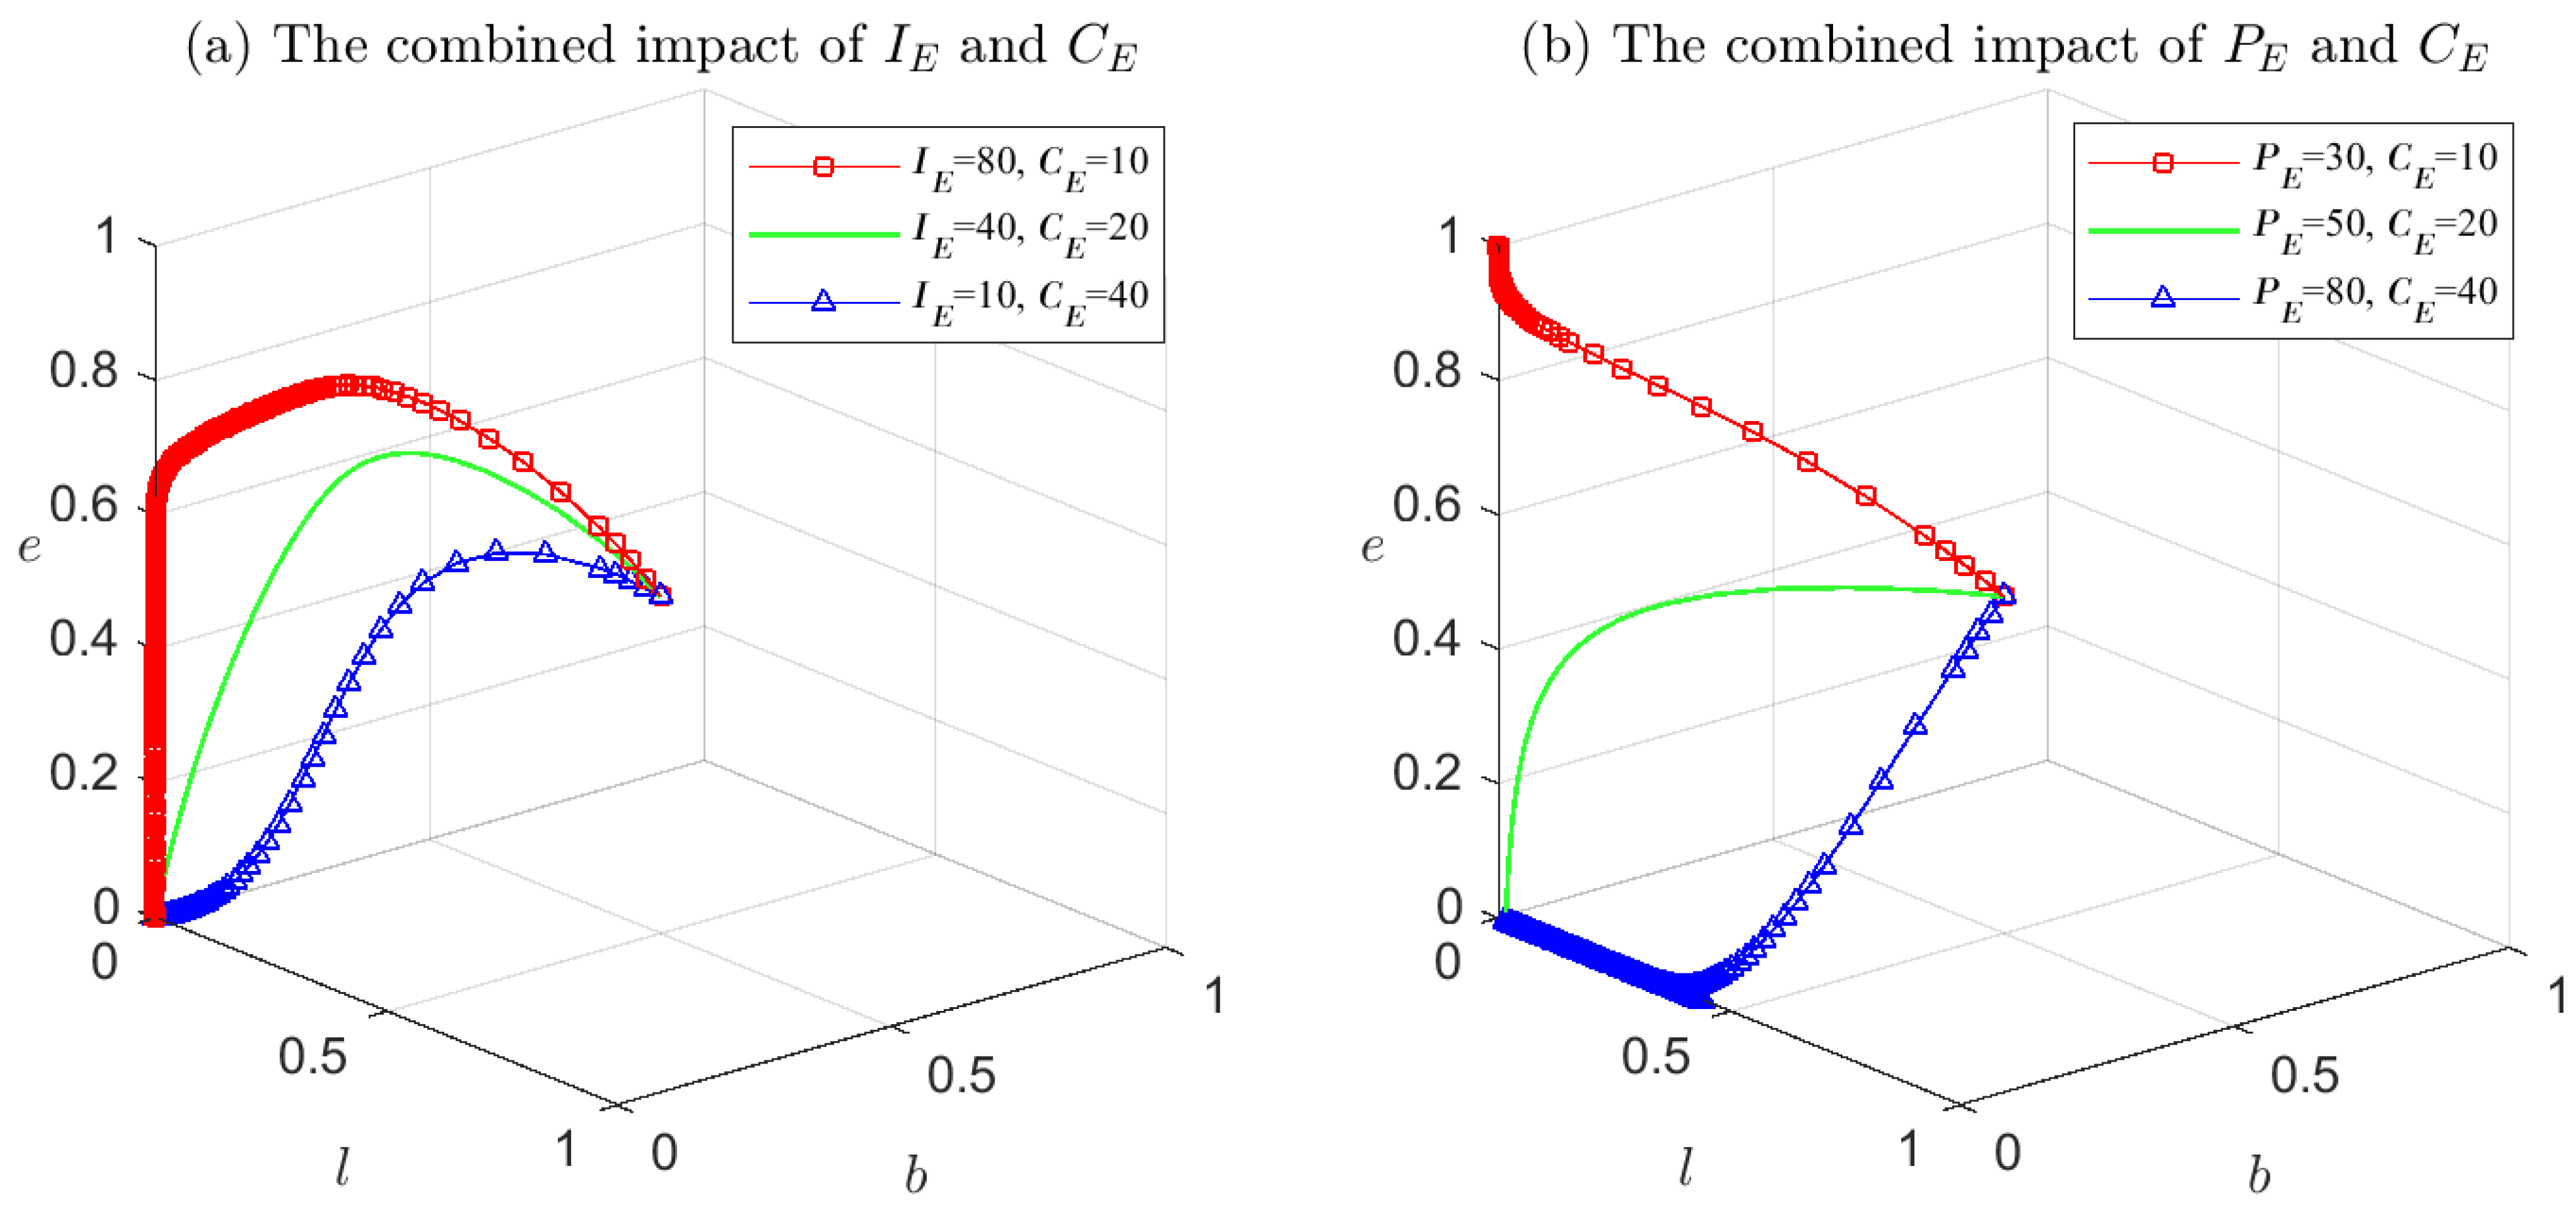
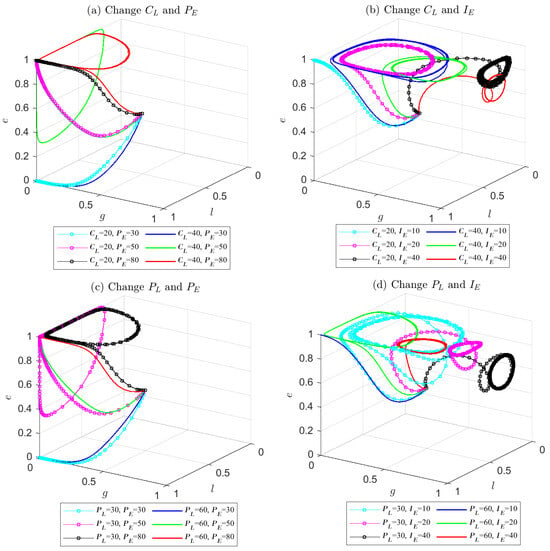
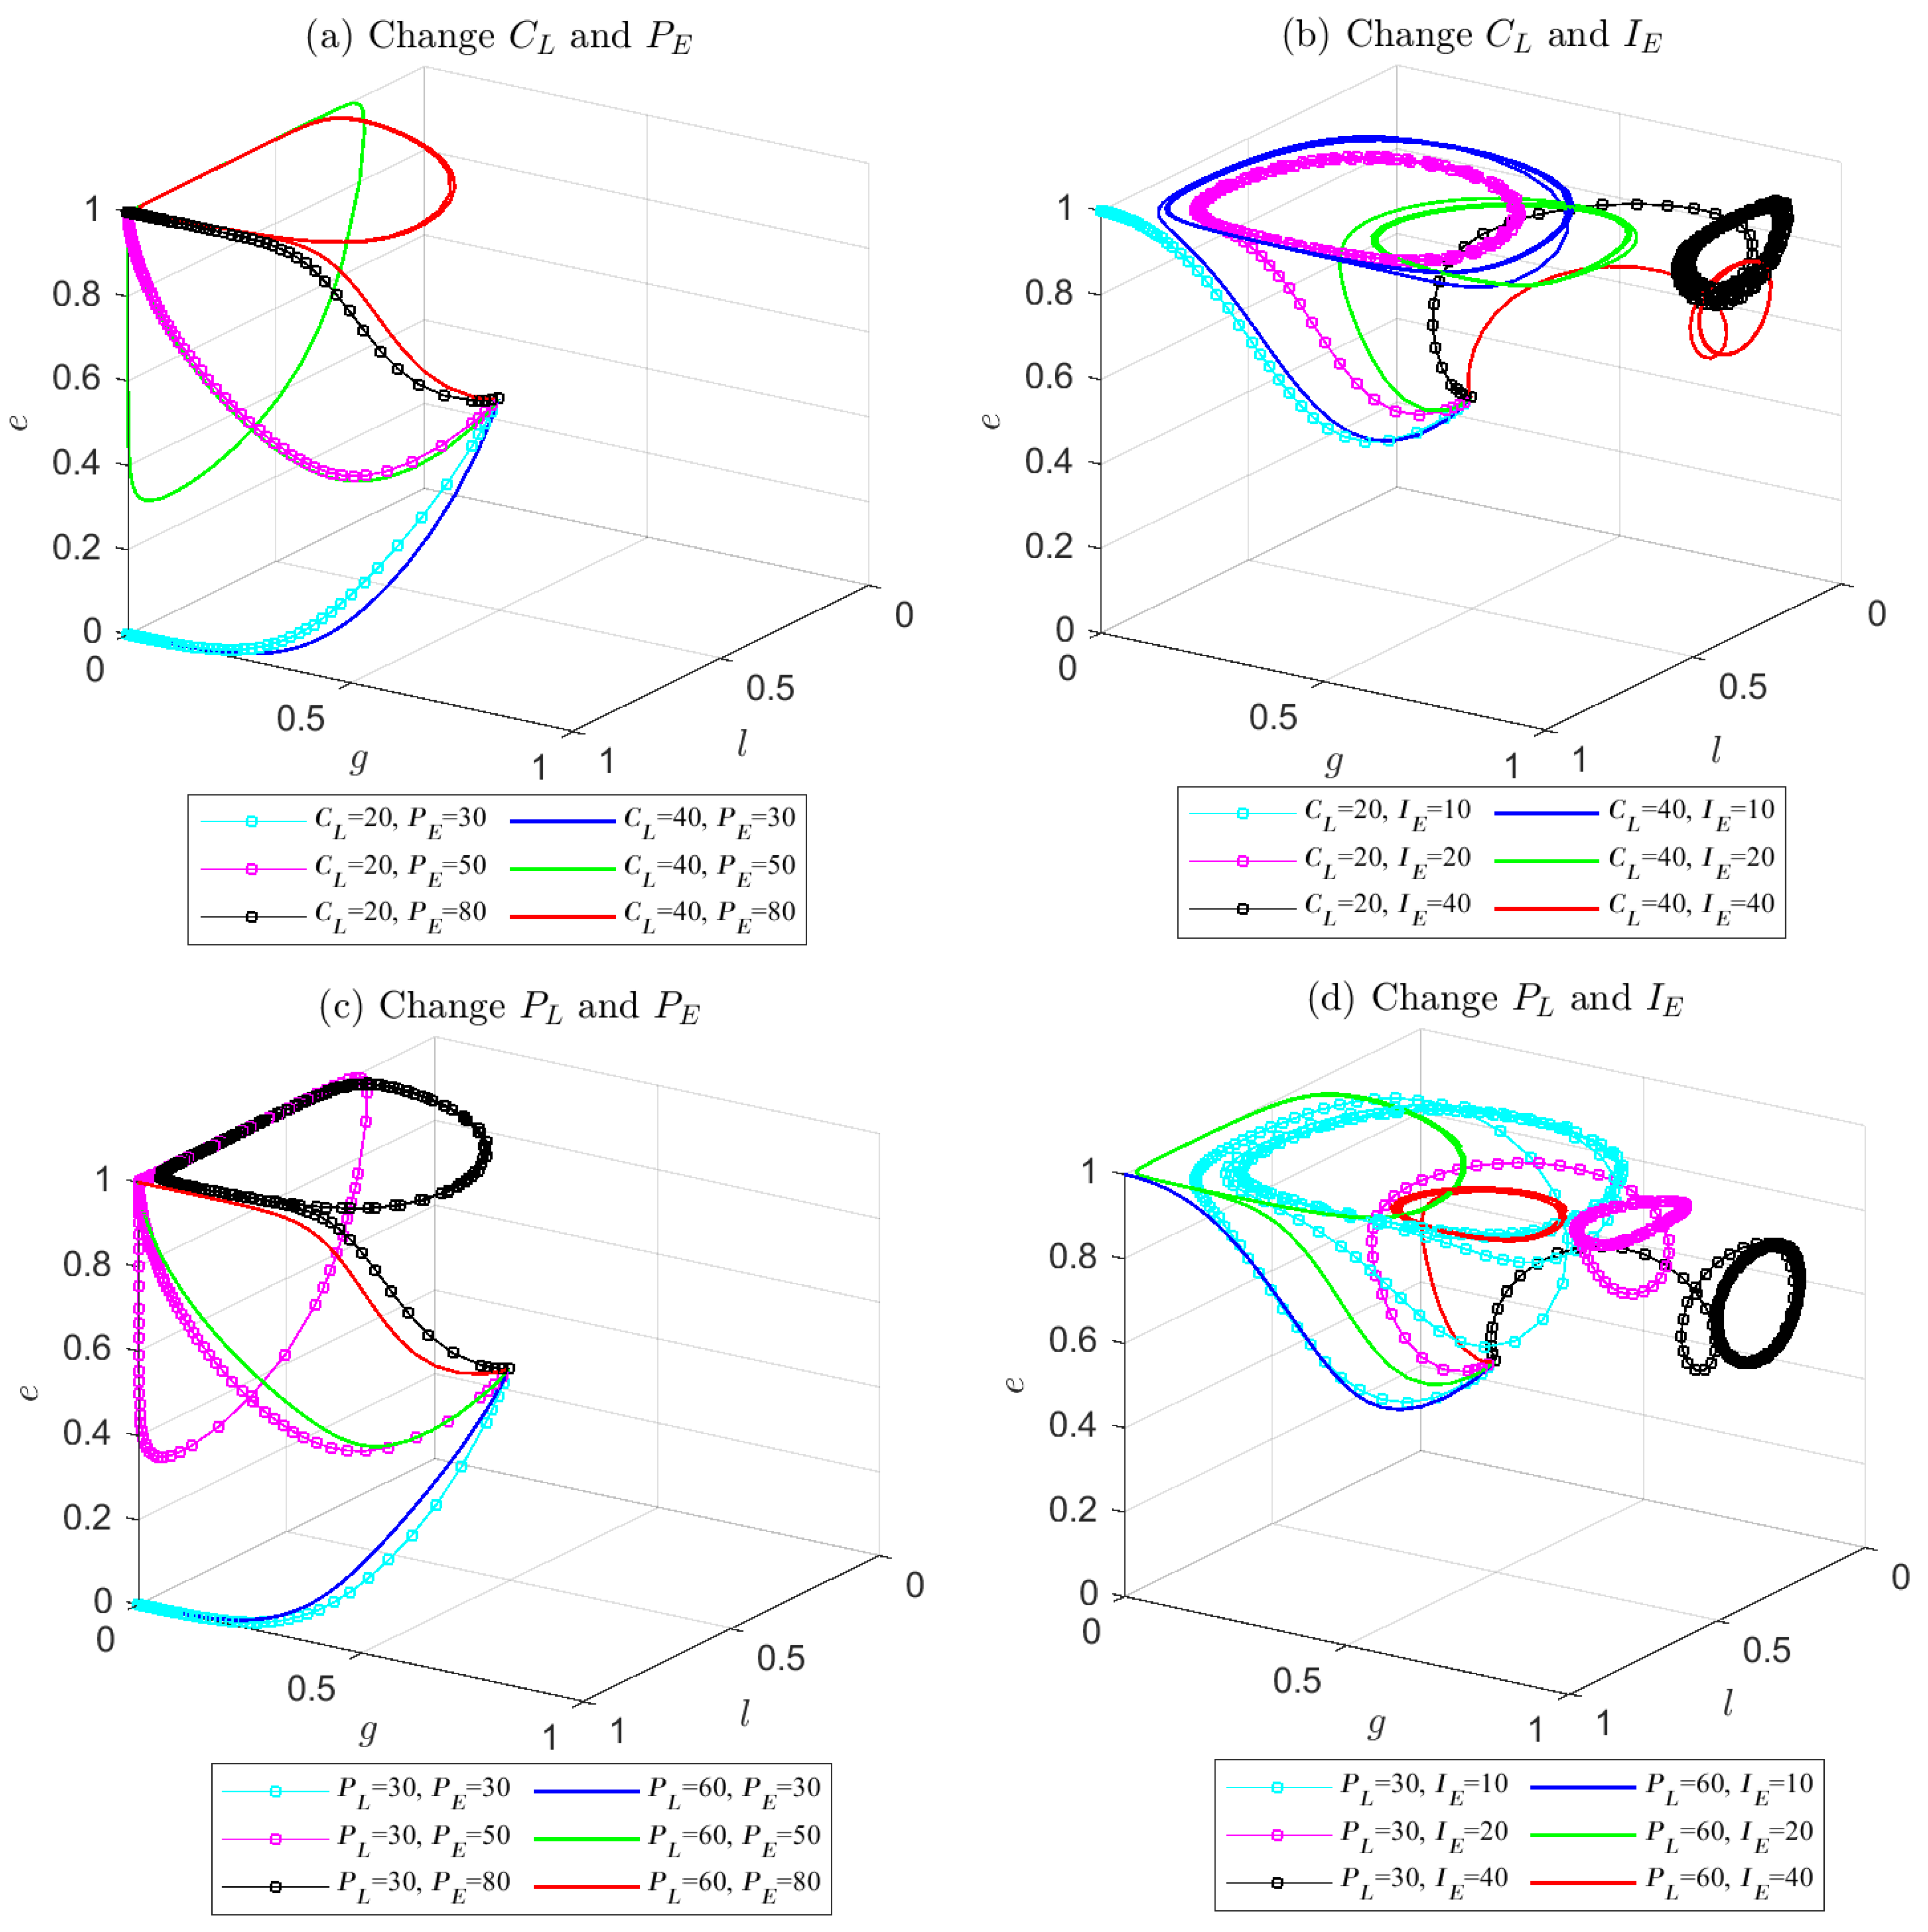
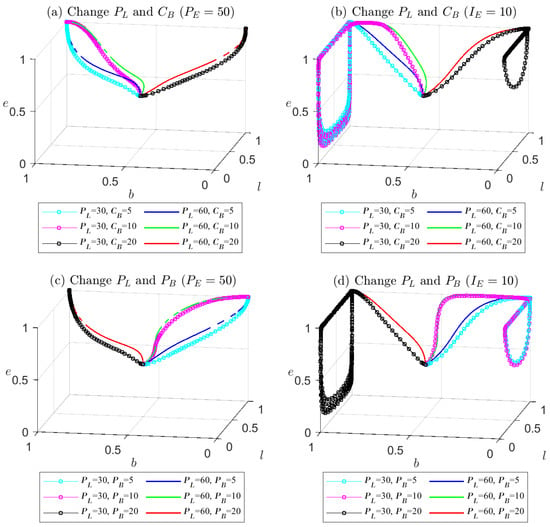
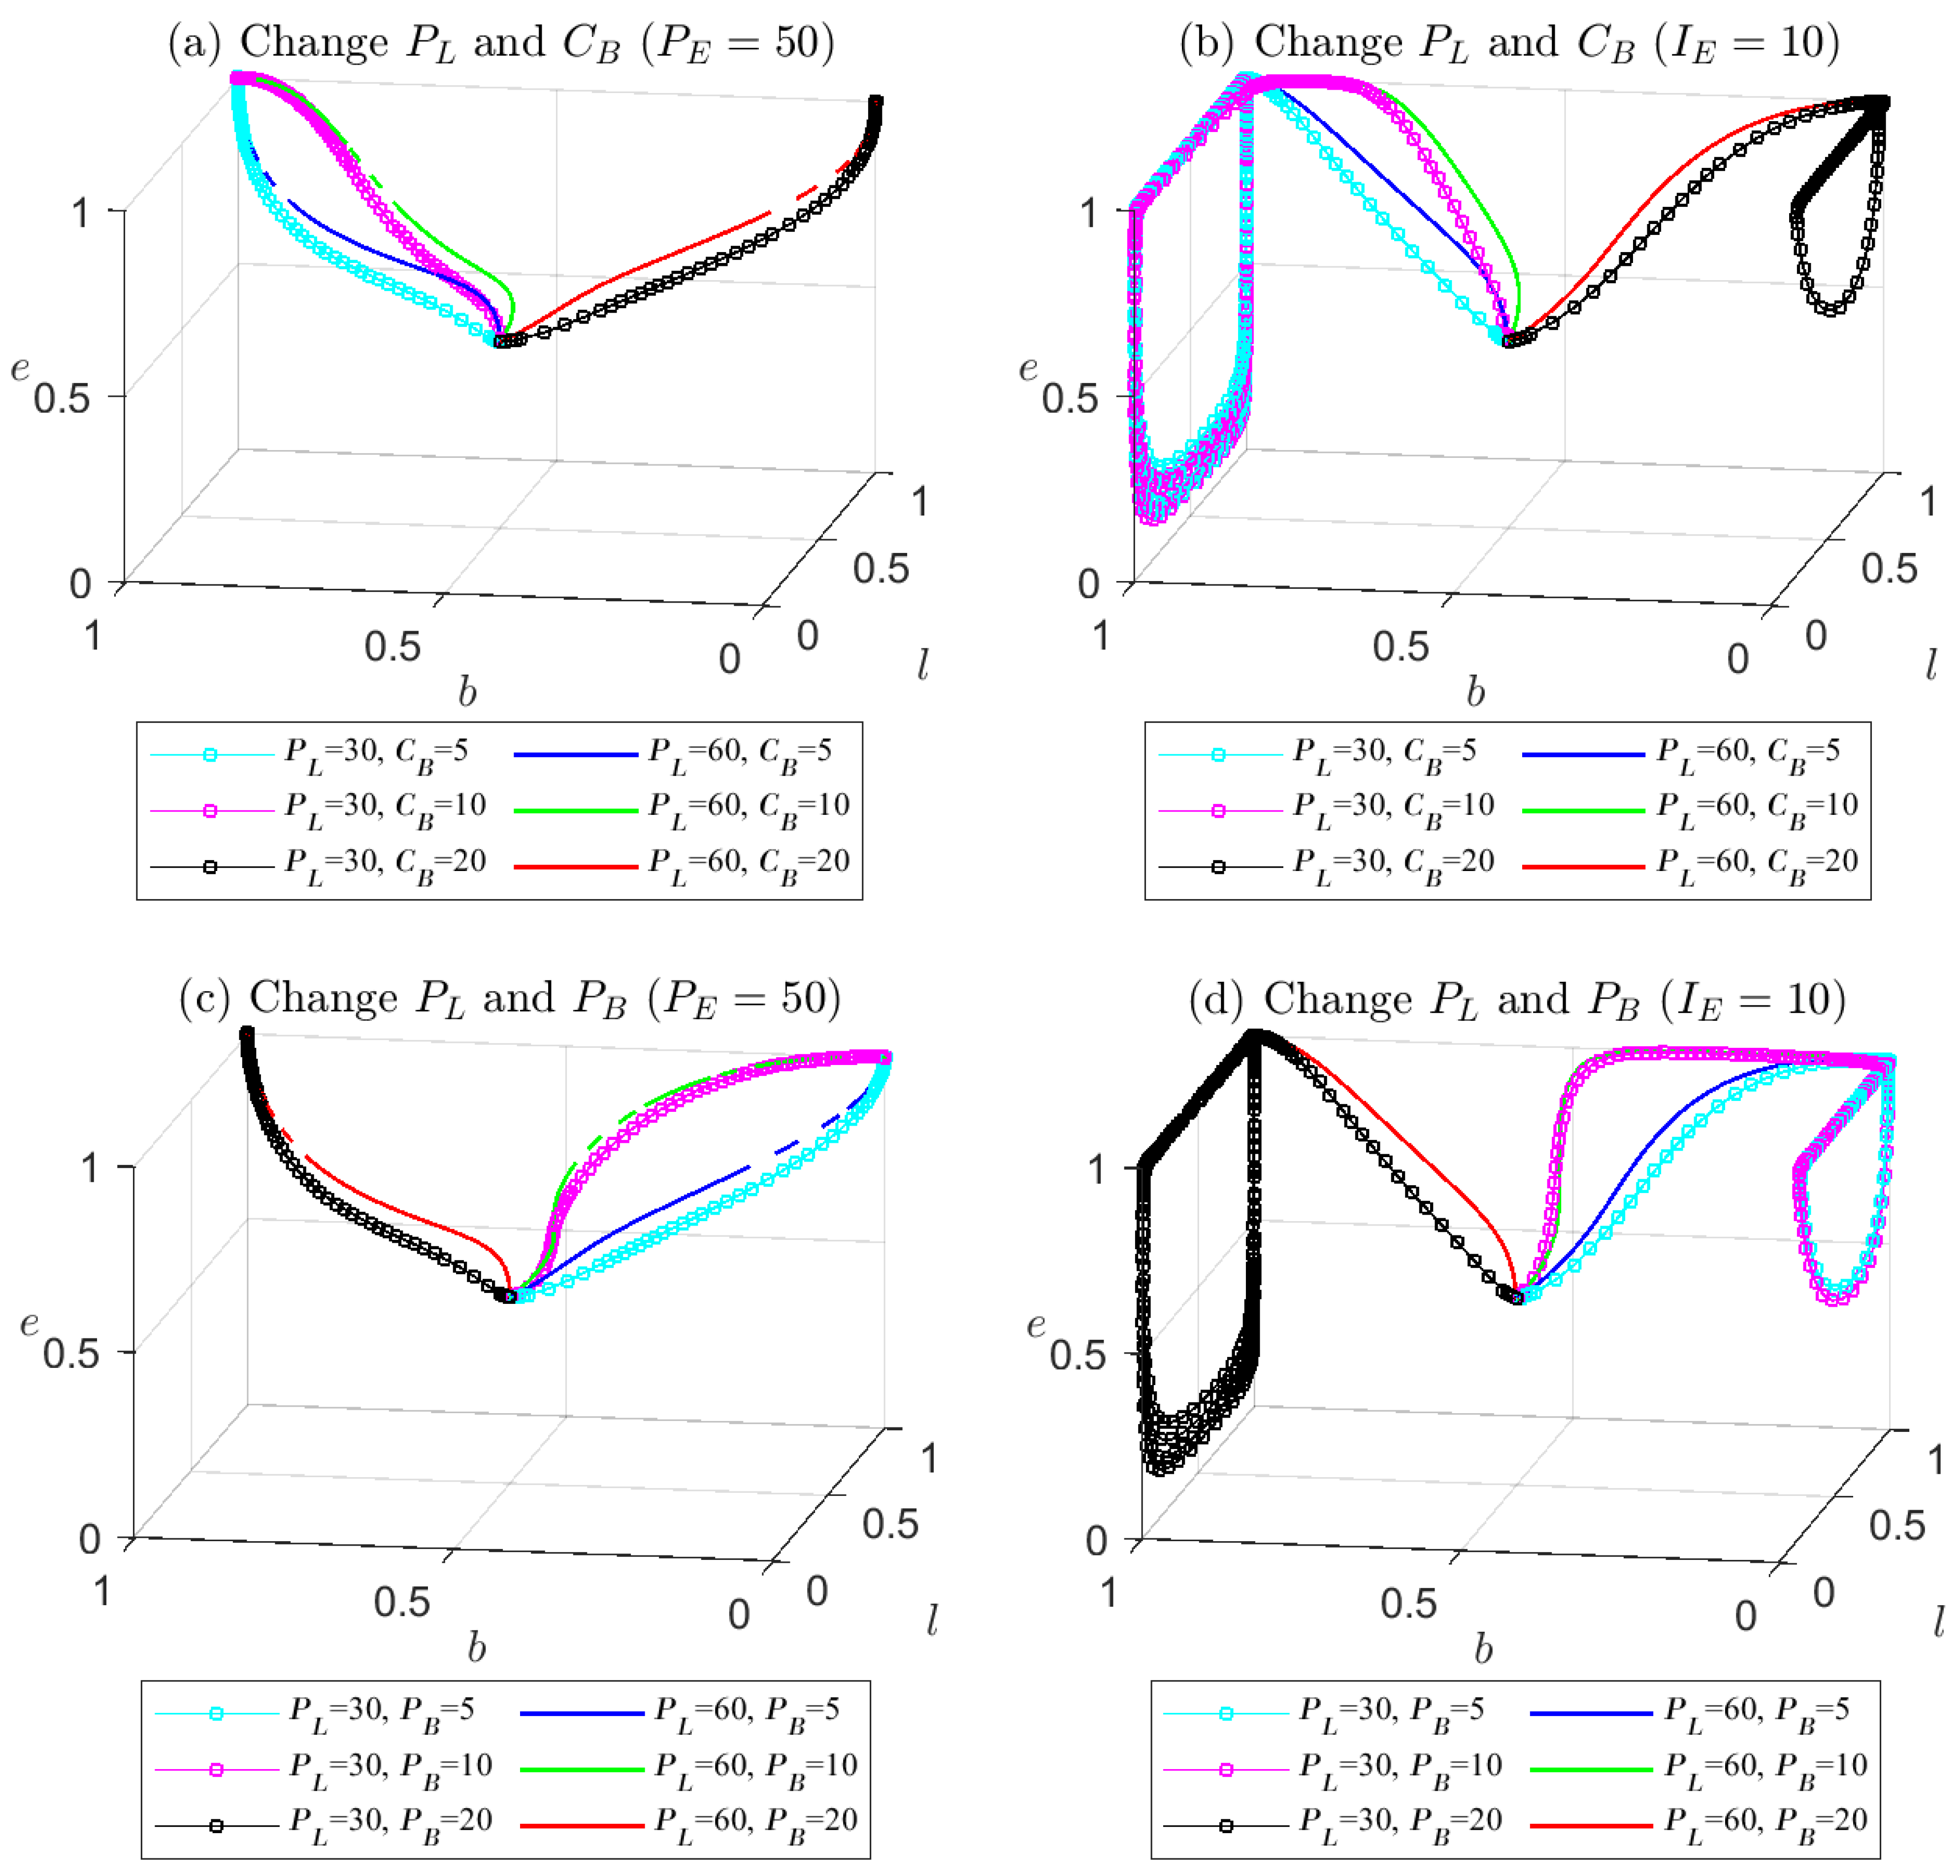

Disclaimer/Publisher’s Note: The statements, opinions and data contained in all publications are solely those of the individual author(s) and contributor(s) and not of MDPI and/or the editor(s). MDPI and/or the editor(s) disclaim responsibility for any injury to people or property resulting from any ideas, methods, instructions or products referred to in the content. |
© 2026 by the authors. Licensee MDPI, Basel, Switzerland. This article is an open access article distributed under the terms and conditions of the Creative Commons Attribution (CC BY) license.