


Abstract
The paper introduces a novel intelligent modeling system of a railway cargo delivery which combines queuing theory and station-level technological activities to model the manner in which re-handling and waiting processes produce delivery delays. The proposed model is in contrast to the available literature, which focuses more on routing or time management; it clearly connects processing of the stations, queue behavior, and reliability of the delivery in one decision system. When applied to a real-life railway route, the optimization of technological sequences is demonstrated to decrease delivery time and congestion rates significantly, as well as decrease the possibility of punishment in case of late deliveries. These findings show that the study is original in terms of the presentation of a data-driven and operationally based approach on the enhancement of railway freight performance. This study introduces a shipment-type-specific intelligent delivery model that integrates queuing theory with real station technological processes. Unlike existing approaches focused mainly on routing or average travel time, the proposed framework explicitly accounts for wagon processing sequences, re-handling operations, and delay-risk assessment. Validation on the Khamza–Bukhara corridor demonstrates a reduction in intermediate re-handlings from four to two and total delivery time from 68 h to 54 h, confirming the operational and economic effectiveness of the model.
1. Introduction
Railway freight transport is one of the fundamental pillars in modern logistic systems, as it boasts high carrying capacity in addition to energy efficiency and environmental sustainability. However, rail systems still face the constant issues of delivery delays, overcrowding in between stations and ineffective use of infrastructure, especially where the transportation of goods of differing kinds and technology demands different technological processing and routes [1]. It has been operationally demonstrated that reliability of delivery depends more on station wagon processing and re-handling than route length alone [2].
Train formation, station processing, and traffic control determine the performance of the railway freight systems to a significant extent. Mesoscopic simulation and analytical models have proven that interaction between train movements and terminal operations creates bottlenecks that greatly constrain network capacity [3]. Station operations can be viewed as mass-service processes where queue dynamics prevails in terms of performance, and waiting time explodes as arrival rates approach the service capacity [4,5].
Recent studies affirm that the causes of the delays in a railway are a complex interplay of technological, operational, and stochastic factors. Any small interruption in station processing will spread across the network and have a substantial negative impact on the reliability of delivery [6,7]. This effect is further enhanced by constraints in yard and track capacity, which cause conflicts and queue formation with high utilization, even when the schedules of the trains are not impossible [8].
The real-time optimization and rescheduling techniques that have been designed to manage delay propagation are primarily focused on train conflicts instead of wagon-level technological processing in the various types of shipments [9,10]. Logistics-wise, it can be seen that delivery performance is not merely based on the length of the route but also the number of intermediary handling operations. Intermodal and containerized transportation studies indicate that minimization of re-handling steps leads to great enhancement in delivery time and dependability, even with a greater distance [11]. Poor scheduling of railways thus has a direct impact of increasing the cost of transport and losses through delayed delivery [12].
Although these improvements have been made, the current research and the information systems used in railroads are insufficient to consider the various kinds of goods needing different technological steps and priority decisions in the stations, including route shipments, wagon consignments, group shipments, small loads, and containers [1,2]. The use of technological chains and delivery-deadline risk are not intensively optimized in current systems and are mostly only captured as wagon movements.
This disparity drives the creation of a smart delivery infrastructure model that unites queuing behavior, technological procedures at a station, and variation of shipment types. The current study offers this kind of framework to minimize needless re-handling, minimize the number of wagons, and make railway freight delivery more reliable, faster, and cost-effective.
2. Literature Review
Performance in railway freight delivery is largely influenced by the way wagons are handled at the stations by means of inspection, sorting, marshaling and train formation. Such technological processes generate stochastic waiting times that usually surpass the line’s pure running time. Consequently, the corresponding railway freight system can be viewed as a queue-based service network where the congestion in transit stations can have a strong influence on the overall time of delivery.
Recent research has further strengthened the view that rail freight reliability must be evaluated beyond train punctuality, incorporating logistics-chain performance using simulation-based approaches. Agent-based models combining microscopic rail simulation with freight network logistics show that reliability can deviate substantially from operator-centric punctuality indicators, highlighting the need for integrated operational–logistical modeling frameworks [13]. In marshaling yard contexts, recent computational studies demonstrate that sorting strategies and classification-track constraints strongly influence dwell time and system robustness, reinforcing the importance of modeling station-level technological chains rather than focusing solely on line-haul routing [14]. Real-time traffic management research confirms that rerouting, reordering, and rescheduling can be decomposed into efficient sub-problems to reduce delay propagation, but such methods typically address train-level conflicts and do not explicitly model wagon technological processing sequences at stations—motivating the present paper’s station–technology integration [15]. From an infrastructure and decision-support perspective, multi-criteria evaluation methods have been applied to identify critical railway stations (peaks/bottlenecks) for freight transport and to prioritize operational interventions, complementing simulation and queuing approaches used for capacity and delay reduction [16].
Ref. [17] elaborated a mesoscopic modeling framework of freight train activities and proved that yard operation and train formation processes were significant causes of transport delay and inefficiency. Their publication demonstrates that the modeling of the railway logistics should also cover both network movement and terminal processing, which is the approach that this study takes.
The value of technological processes within the railway systems has also been emphasized through [18], who used queuing theory on service and manufacturing systems including transport operations. This theory forms the basis of the idea of modeling wagon flows as service systems, where the rate of arrival, service rate and waiting time are the variables that determine the stability of the system. The following theoretical foundation can be used directly in the current paper to examine the accumulation and delay of wagons at stations.
Ref. [19] reviewed the models of transport management of railway transport and highlighted the importance of the operational coordination and real-time control of wagon flows to reduce delays. Their results support that intelligent and data-driven systems are needed in order to handle freight transportation effectively across a railway network, creating the motivation behind the smart delivery system suggested in this article.
Sorting and re-handling activities in particular are key contributors to delays [20], and research on sorting techniques in marshaling yards revealed that inefficient sorting rules and limited track capacity are the key contributors to wagon dwell time. This is directly related to the necessity to reduce unproductive reprocessing and optimize the workflows in stations to enhance delivery performance, which is the point of this paper,
Lastly, Ref. [21] has shown that multimodal freight systems based on railways can be successfully used to achieve operational stability and safety through mathematical modeling. Their study demonstrates the applicability of mathematical and system-level modeling methods to the resolution of real-life railway logistics issues, in accordance with the framework that has been constructed in this paper.
Research Gap and Positioning
Despite extensive research on railway network optimization and yard operations, existing studies predominantly address either routing problems or station-level processes in isolation. Limited attention has been paid to integrating technological station sequences, shipment-type differentiation, and delivery-deadline risks within a unified modeling framework. Moreover, most current approaches rely on average travel times without explicitly accounting for wagon re-handling intensity and queue-induced delays. This study addresses these gaps by proposing a queuing-based intelligent delivery model that simultaneously considers shipment categories, technological processing chains, and operational congestion, providing a practical decision-support tool for improving railway freight reliability.
3. Material and Methods
This study uses real operational data from “O‘zbekiston temir yo‘llari” JSC Uzbekistan (UZ), obtained from its digital freight systems (e-nakl), including wagon locations, station processing times, train movement data, and contractual delivery deadlines. These data describe how wagons move and are processed at stations along their routes.
Each railway station is represented as a queuing system where the wagons come to undergo technological treatment and are attended to by the scarce resources (tracks, inspector teams, sorting plants). Let
If
the station is stably running; in the event that
line trucks increase and there is delay in delivery.
For each of the routes, wagon, group, small and container shipments will be characterized by separate technological chains. The following is used to determine the complete delivery time of each delivery:
In which Td represents dispatch time, Ts represents station waiting and processing time (through the queuing model), Tm is the section travel time, and Ta indicates the extra operations.
A time consumption matrix of every possible combination of station operations and section motions is constructed on each shipment type. The optimization process is linear, where the path with the shortest overall delivery time T is chosen under station capacity and operations limitations.
The model is applied in a simulation setting with the real distance between stations and processing time. The comparisons of actual wagon flows with optimized wagon flows are conducted to assess the decrease in the delivery time and wagon congestion.
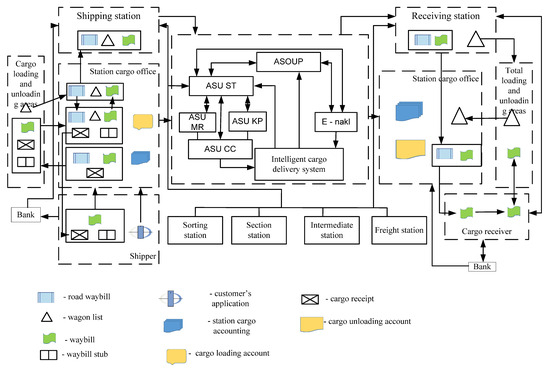
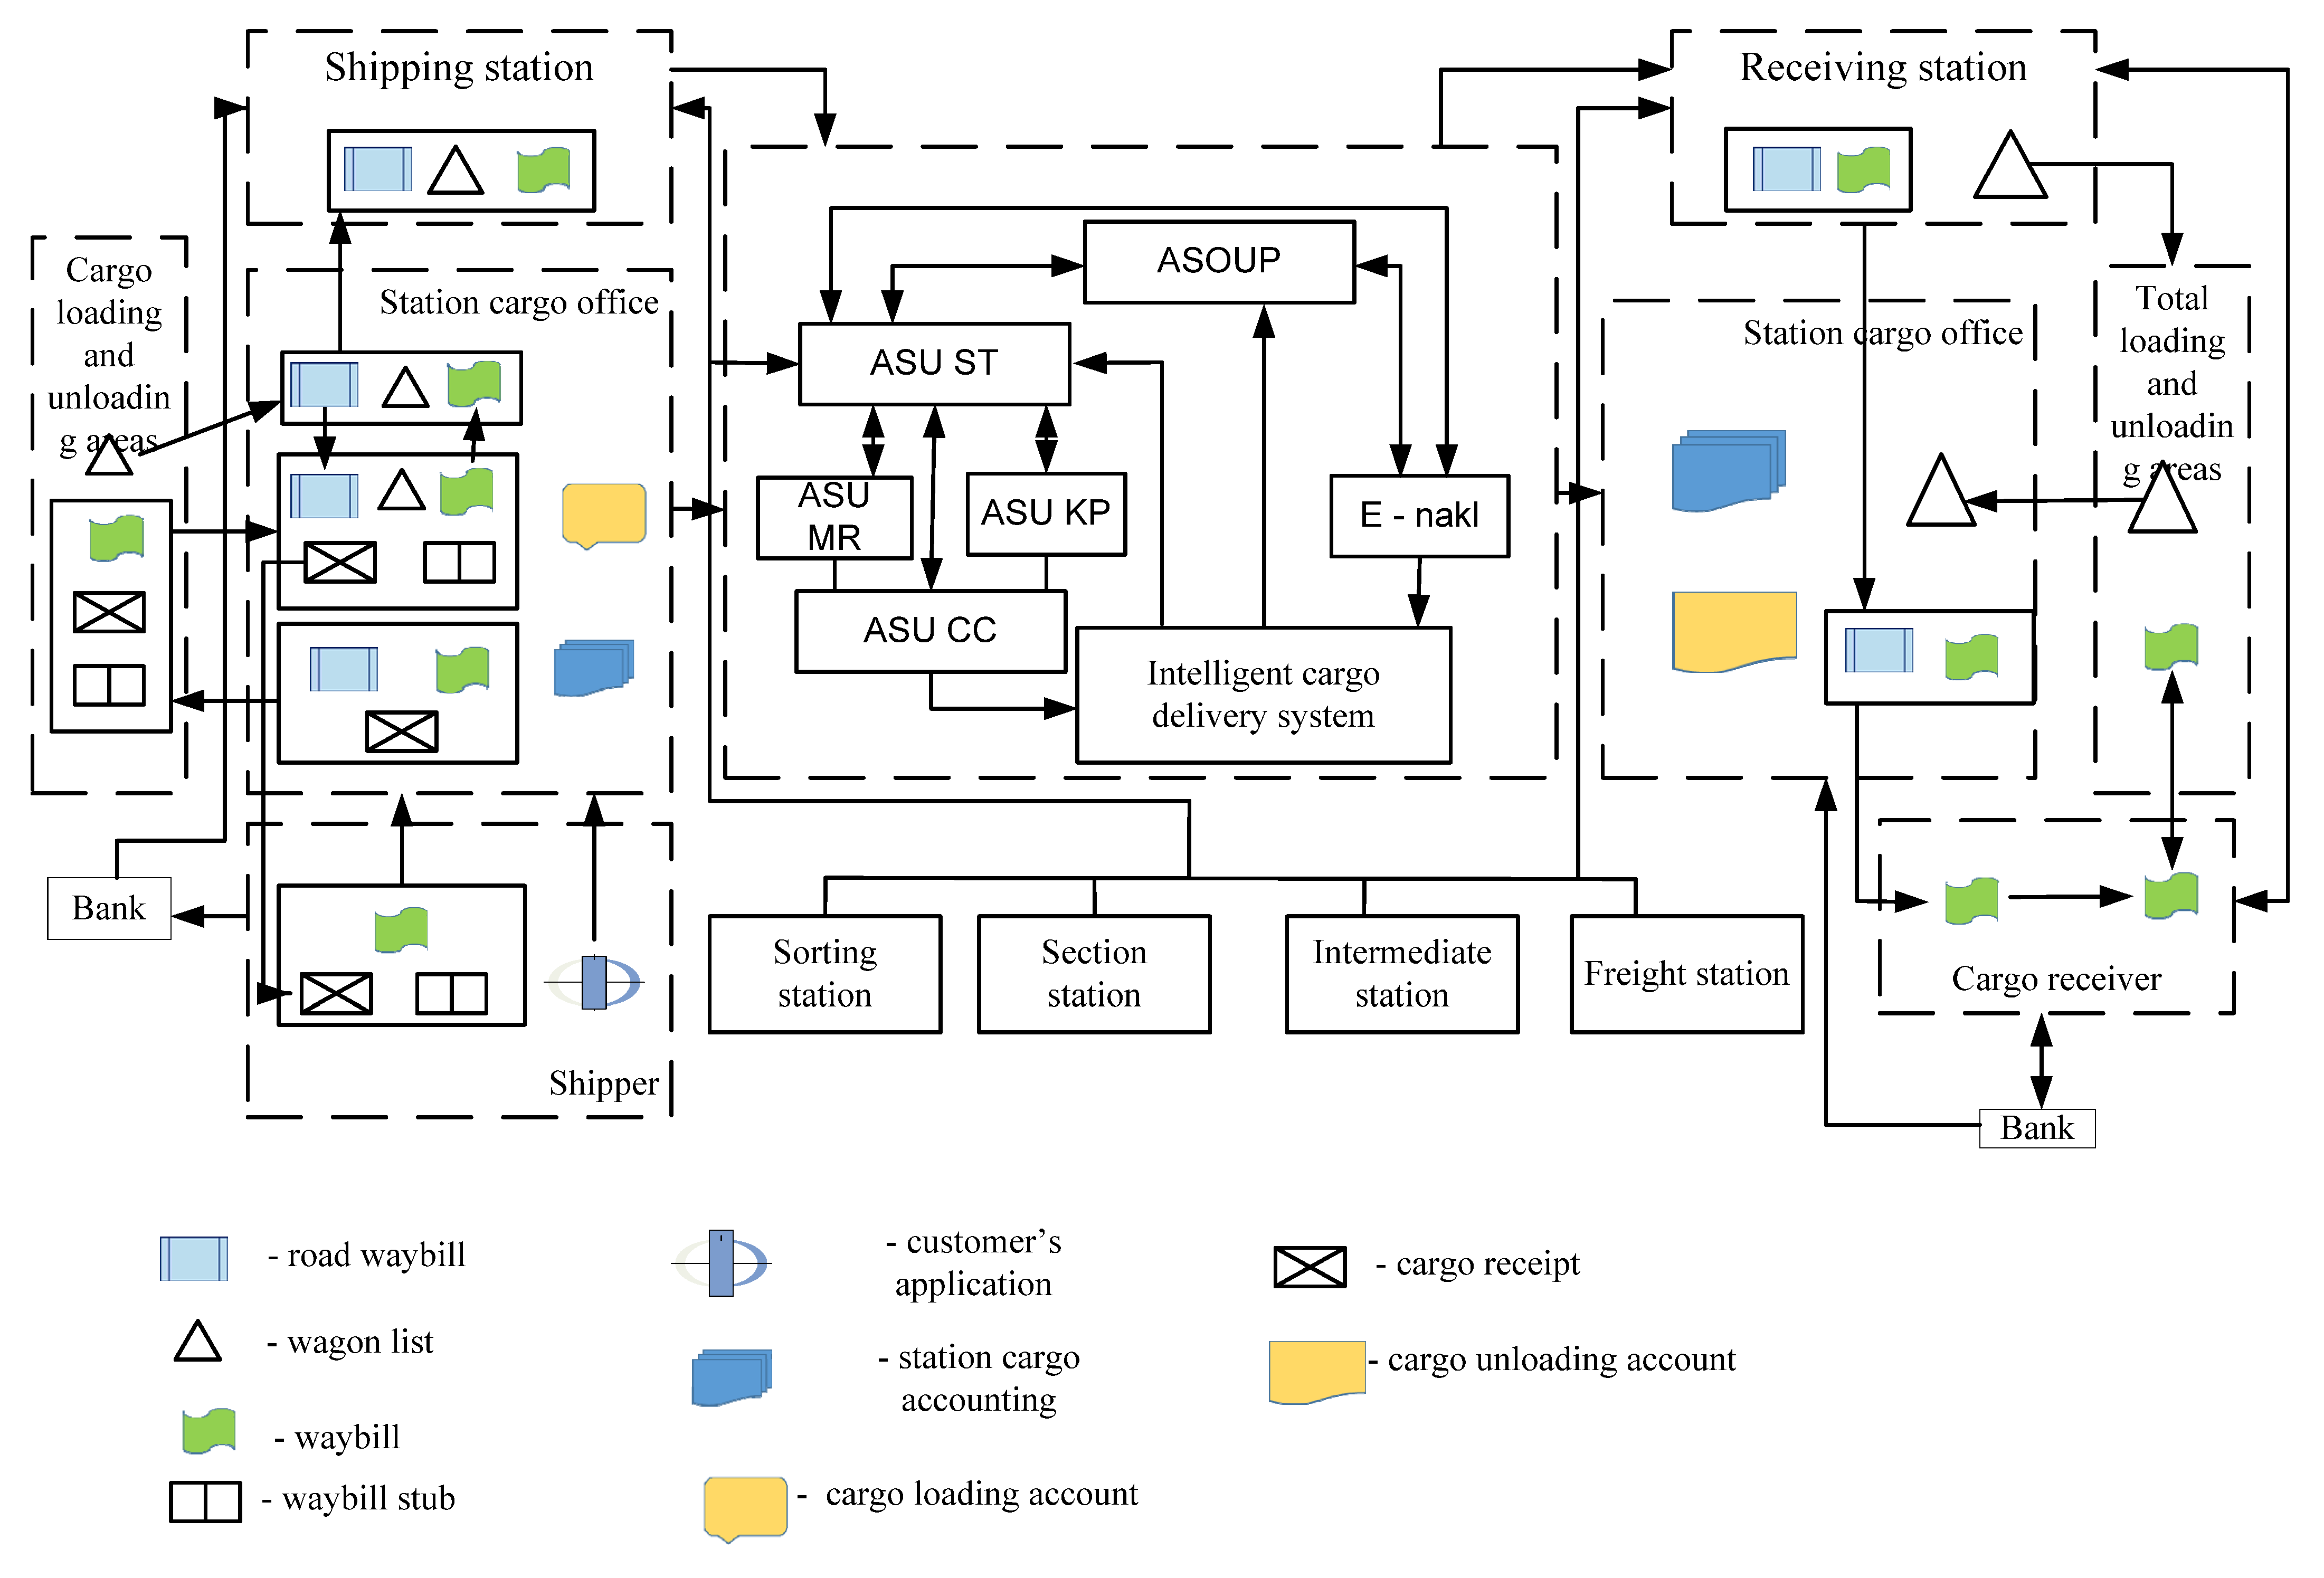
The information flow of the proposed intelligent cargo delivery system between the receiving station and shipping station is shown in Figure 1. Electronic documents (waybill/road waybill, wagon list, receipts) and operating events in the station cargo office and loading/unloading areas are created and sent to the central digital environment at the shipping side. The core block is used to integrate the information of the operational management modules (ASU ST/MR/KP and ASOUP) with the e-nakl electronic consignment note to create a single and timely flow of data. Using these inputs, the intelligent system will assess the status of the wagons, station activities, and route progress using intermediate/sorting/section stations and assist in the routing and sequencing decisions of operations. An identical digital loop is achieved at the receiving end, as the unloading/receipt confirmation and the financial/accounting records are updated, allowing for complete tracing from dispatch to delivery.
Figure 1.
Information flow chart of the smart system depending on the types of shipment.
4. Research Methodology
Using the types of shipments in railway transport, we will provide a separate analysis.
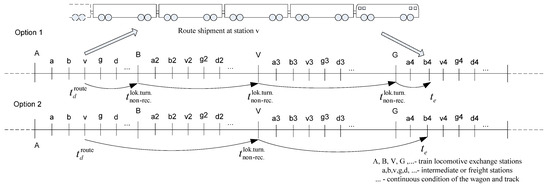
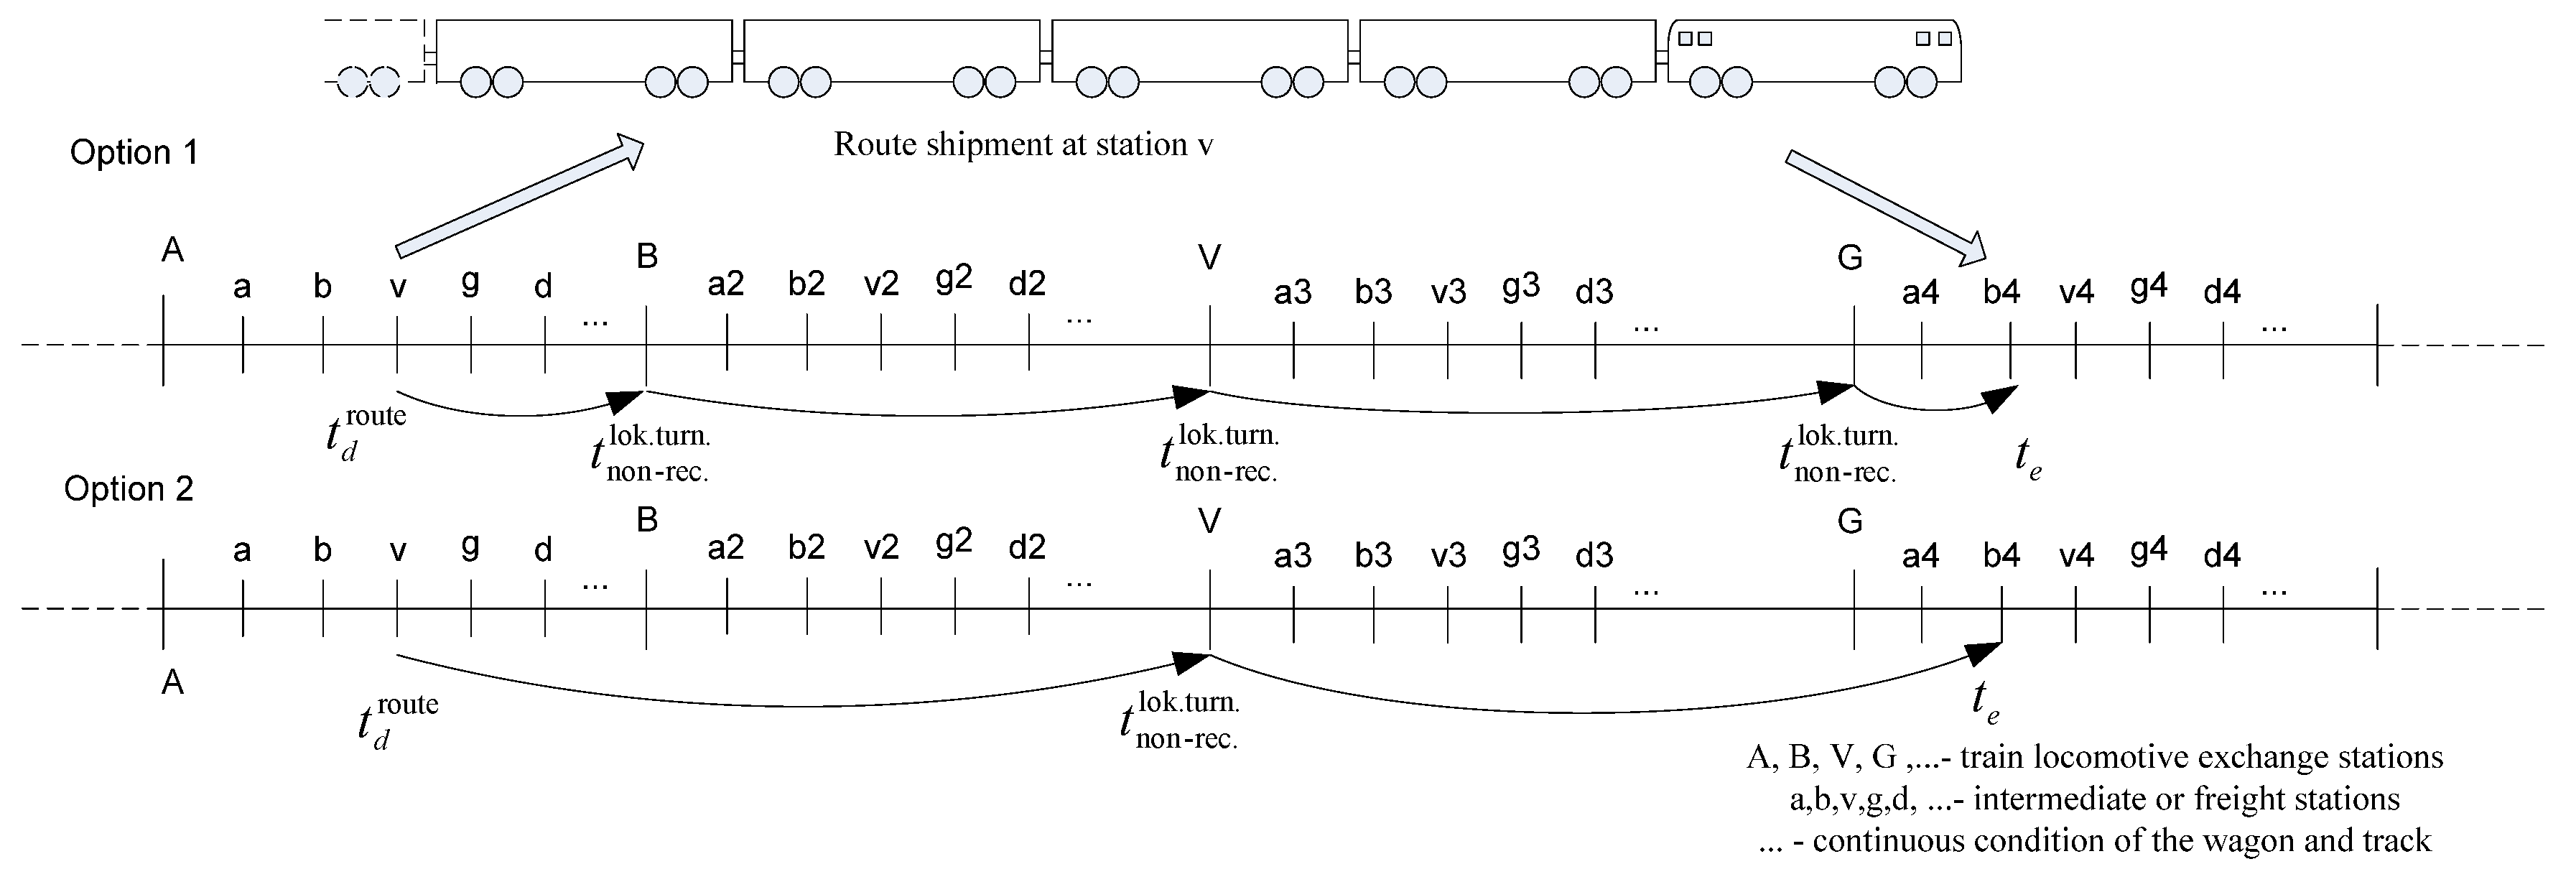
Figure 2 demonstrates two possible routes of the same shipment using different technologies. In Option 1, there are more intermediate station operations/re-handling (more stops and more processing points), which increase the total station time and delays; in Option 2, there is less intermediate processing and the wagon flow is more continuous; therefore, the total delivery time will be shorter. It is important to note that the figure shows that the performance of the delivery can depend not only on the distance, but primarily on the number and order of the technological processes along the route.
Figure 2.
Route shipment scheme.
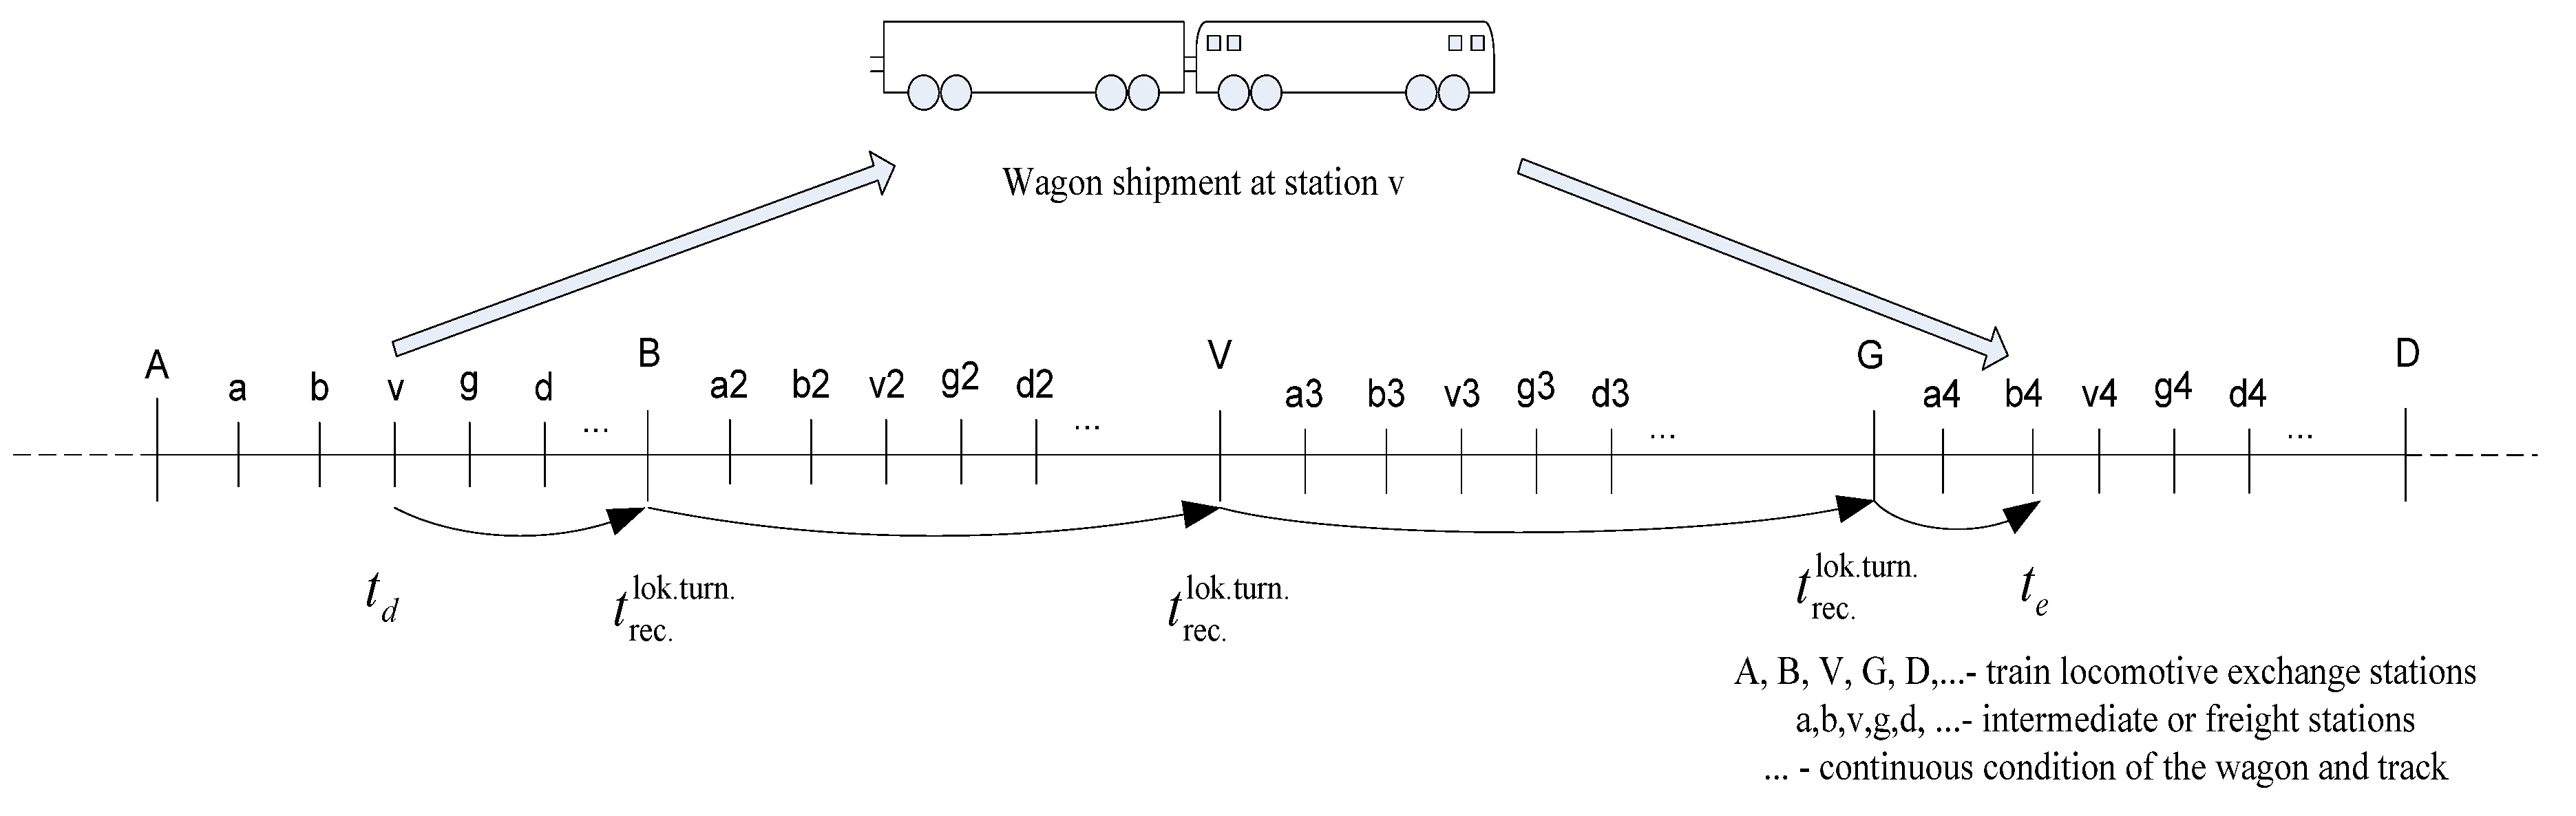
Figure 3 represents the wagon shipment path as a sequence of section rotation (ti) between stations and technological activities of the stations at the middle points. As highlighted in the diagram, the total delivery time is composed of the sum of the time spent traveling and the time spent undergoing repetitive re-handling and processing, through which queues and delays can be accumulated. It also shows how the constant control of the location and state of operations of wagons contributes to the choice of a more effective technological chain.
Figure 3.
Wagon shipment scheme.
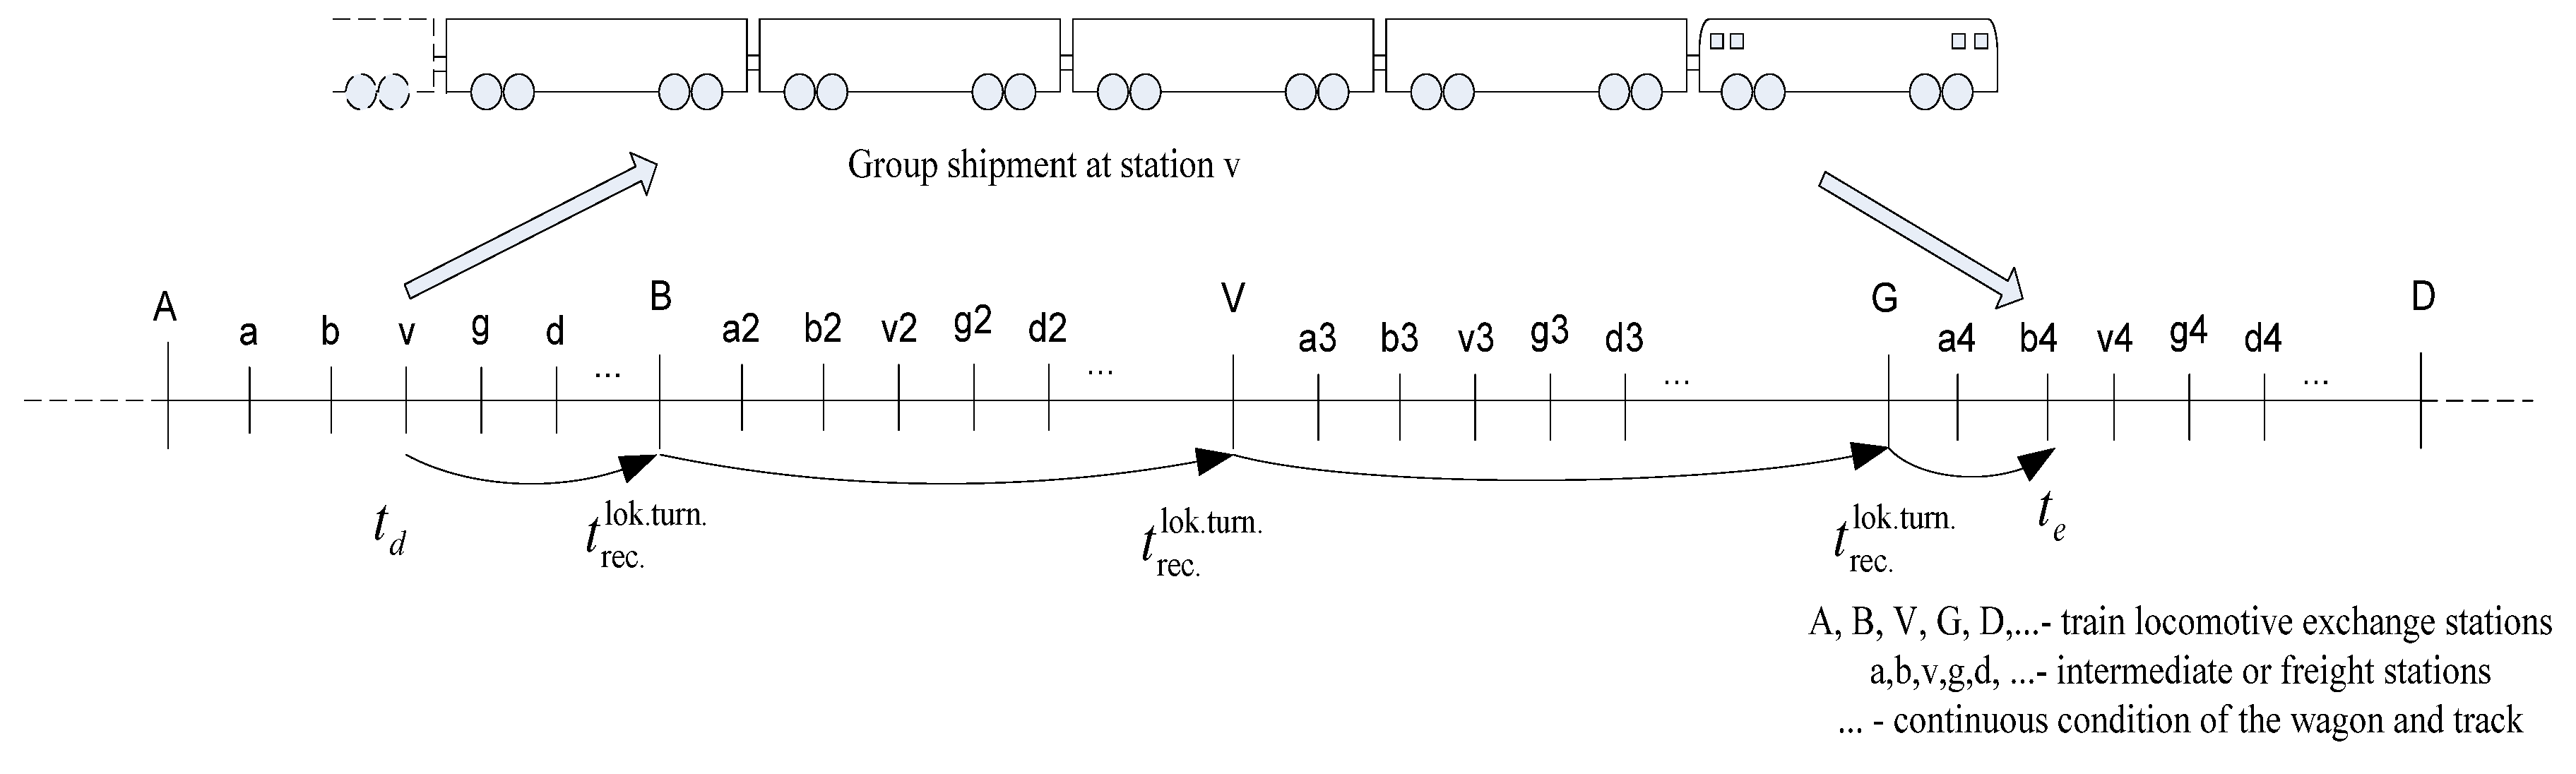
Figure 4 shows the operational logic of group shipment, in which two or more wagons are combined under one waybill and as such, they are treated as a single batch in dispatching and in intermediate processing. The group shipment is a continuation of the single-wagon shipment, in that unlike the single-wagon shipment (usually reclassified and grouped on an individual-wagon basis at each successive station), the group is the unit on which the planning of the key operations (marshaling, train formation, and dispatching) is performed. This eliminates the repetitive re-handling of shipments and lessens the cumulative waiting time in technical stations; the reason behind this is that group shipments might be given priority when it comes to delivery deadlines. As a result, unit of control is the primary operational difference: single-wagon transport is controlled on a per wagon basis, and group transport is controlled on a per grouped consignment basis, with fewer splits allowed in the route.
Figure 4.
Group shipment scheme.
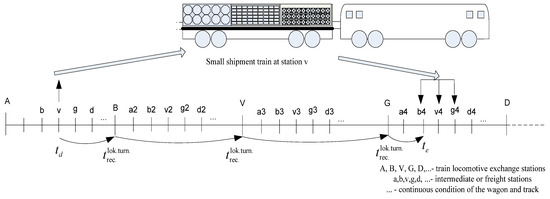
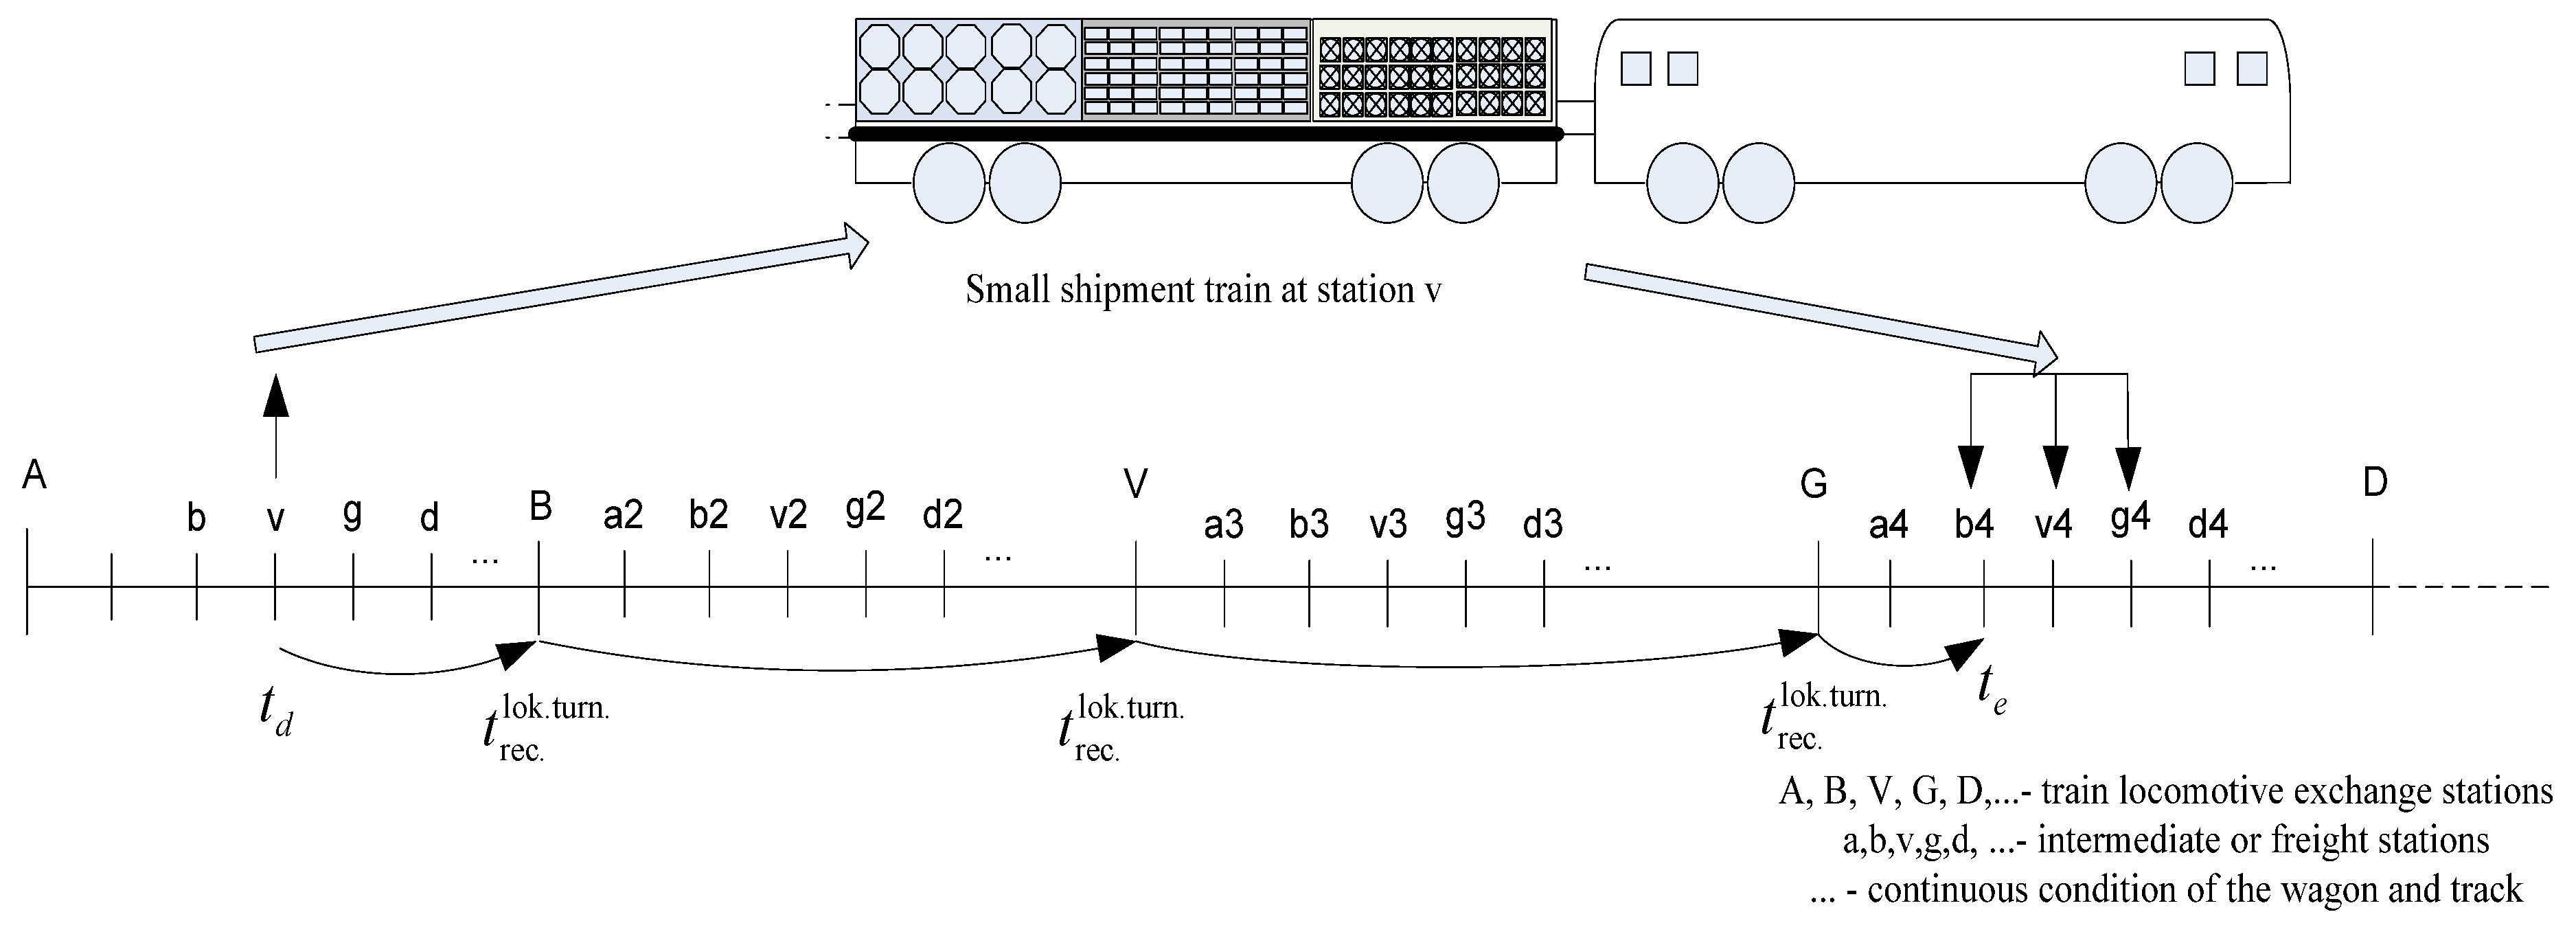
Figure 5 depicts the working scheme in the case of small shipment transportation, where multiple small consignments are grouped together and transported under the main line as one stream of transport. As opposed to wagon or group deliveries, the most significant feature is the further consolidation and further distribution at intermediate nodes, which is presented by the divergence to numerous unloading/loading points at the destination station. Thus, the overall time of delivery comprises not only line-haul movement and standard station processing, but also includes additional handling required during sorting, assembling and assigning small lots to various receivers. This is why small freights generally involve more operations in the terminals and are more susceptible to delays at stations.
Figure 5.
Small shipment scheme.
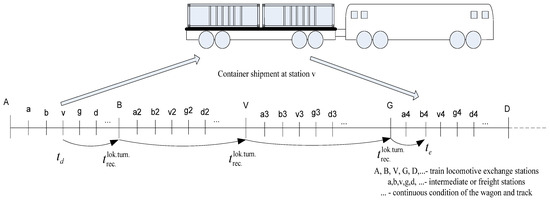
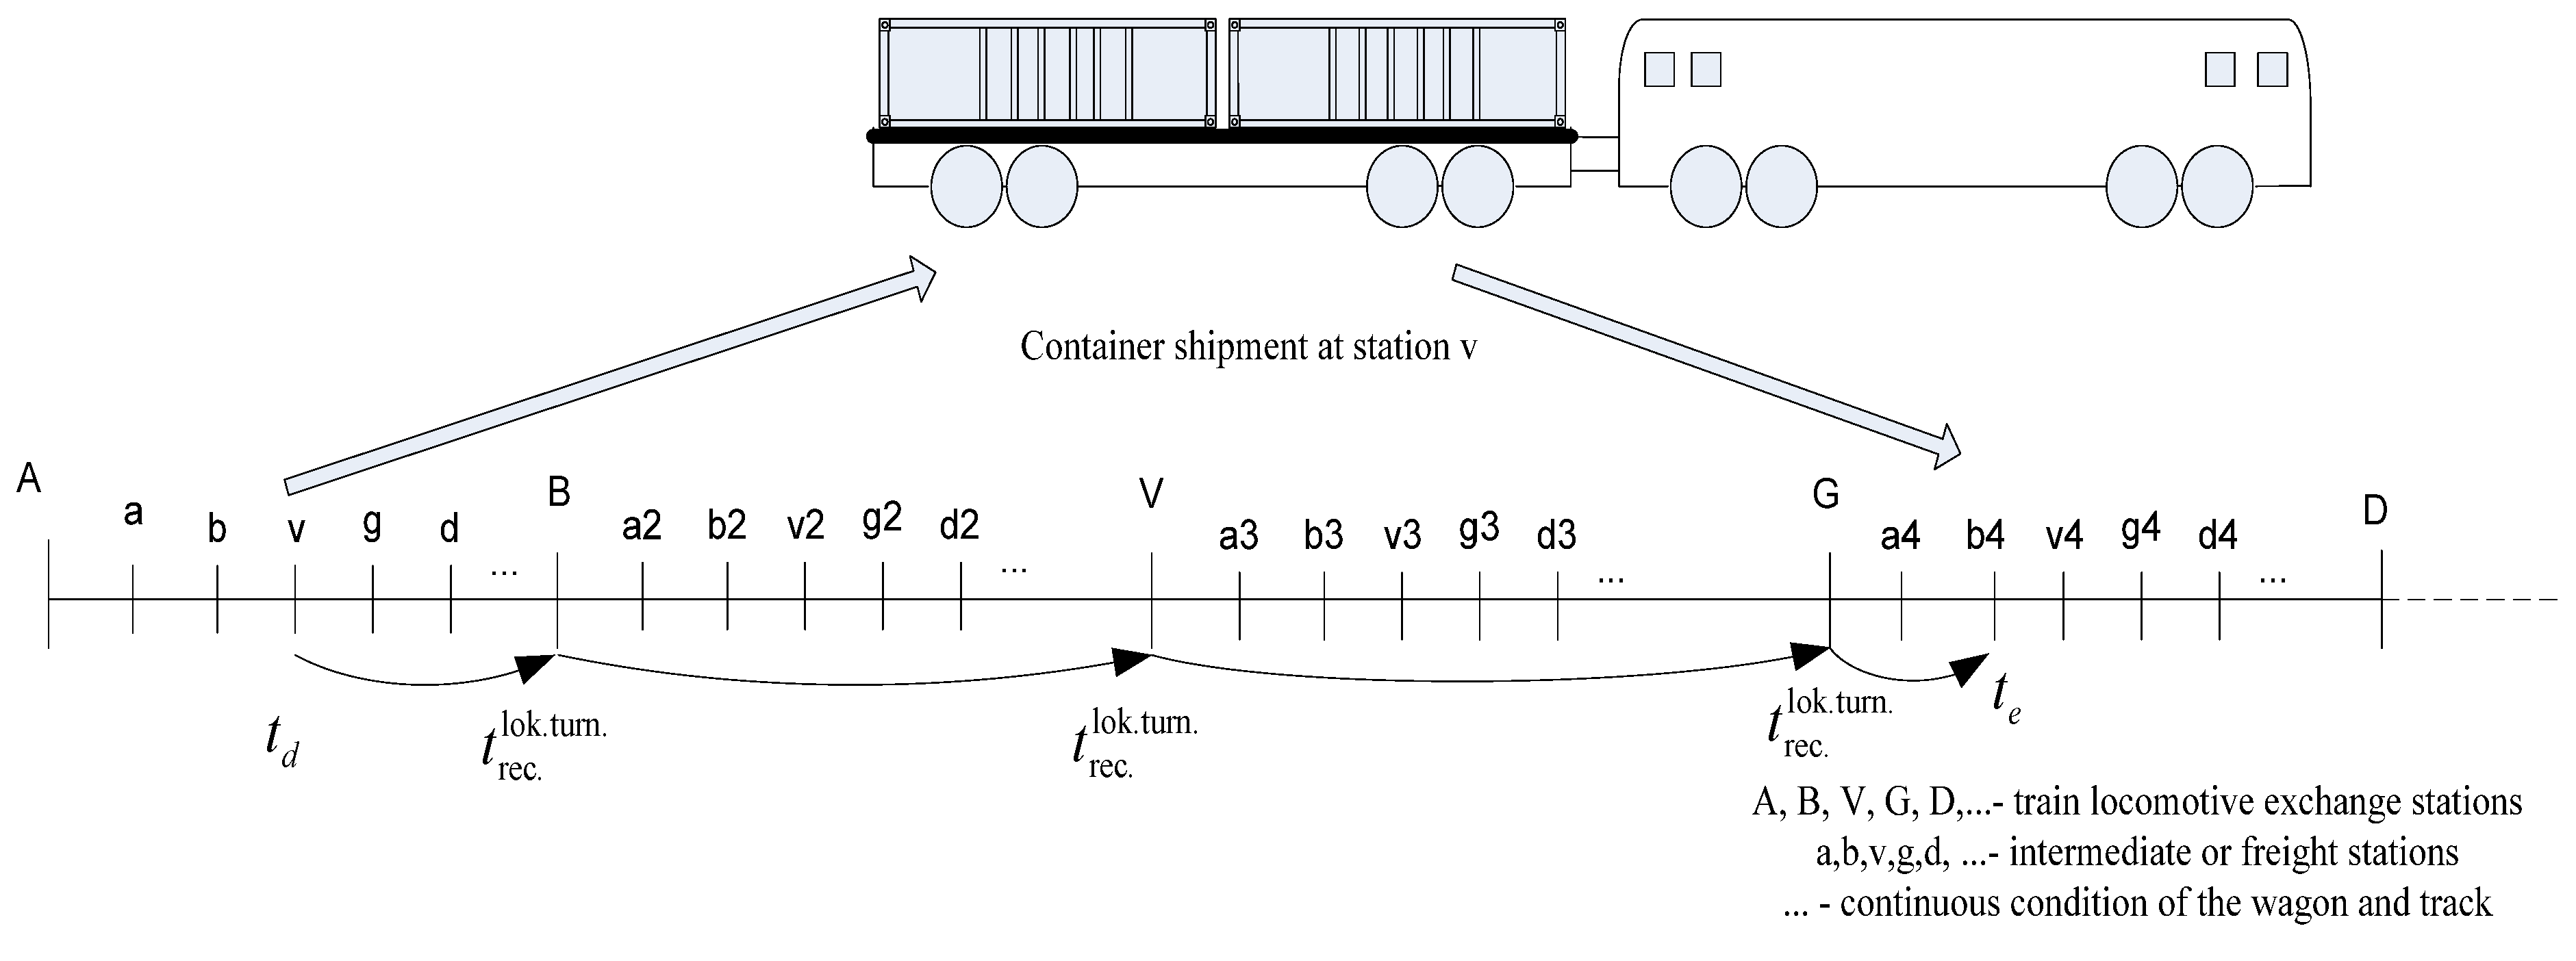
Figure 6 shows the process of container shipment along the rail line with the cargo staying in the container; the key time elements are composed of terminal-based handling (loading/unloading on the flatcars, inspections, and possible interchange between trains) and the running time of the line-haul between intermediate nodes. In terms of wagon, group and small shipments, the distinguishing characteristic is that, in the container-terminal operations, the intermediate delays are dictated, to a greater extent, by repetitive wagon sorting and train reformation, which tend to decrease the number of re-handling steps and stabilize dwell-time variability. To have a better visual comparison between the shipment types, the figure is read based on an identical logic of having station sequencing and time-marking as with the other diagrams; therefore, the difference in the figure of the handling point and its contribution to the overall delivery time can be directly compared.
Figure 6.
Container shipment scheme.
4.1. Conceptual Framework
The freight delivery is conceptualized as a chain of technological activities in the stations and section movement. In every type of shipment (i.e., route, wagon, group, small, and container), a wagon is delivered to a set of stations, where it is inspected, sorted and loaded onto outgoing trains (Figure 2, Figure 3, Figure 4, Figure 5 and Figure 6).
Waiting and processing delays are introduced in each station and added to form the overall delivery time. The analytical modeling of this process presupposes modeling the transportation route as a system of queuing systems; each station is a service node, and each segment of the railway is a transport link.
4.2. Queuing-Theoretic Model and Assumptions
A single-stage queuing system is used to represent each station and is managed under the following assumptions:
- Arrivals of wagons are stochastic and have a constant mean rate of λ (wagons/hour);
- The rate of operation of technological operations (inspection, classification, train formation) is mean service rate μ (wagons/hour);
- The wagons are processed under the discipline of FIFO (first-in first-out);
- When λ < 2 the system is stable; when 2 = 2, the queues increase and the time taken to deliver is longer;
- The processing times of the various stations are independent of each other.
Through these assumptions, it is possible to estimate the congestion of the station analytically and define the bottlenecks on the delivery route.
4.3. Total Delivery Time Model
The overall delivery time T of each wagon is calculated based on Equation (1), using dispatch time, station processing and waiting time, section travel time and the auxiliary operations.
4.4. Technological Sequence Matrix
In order to define the most efficient technological cycle of wagon processing, a binary precedence matrix is created:
The technological operations (arrival, inspection, sorting, section movement, and departure) are represented by each row and column. As shown in Equation (2), implies that operation (j) will be performed right after operation (i), whereas implies that such a technological transition is not possible.
To have a valid technological chain, every operation has to be employed as either predecessor or successor:
The relationships in both Equations (3) and (4) are used to guarantee that every technological operation is represented in the process of delivery at least once as a prerequisite and once as a successor. N is the number of operational activities in the delivery process. A combination of these equations ensures one viable and logically consistent technological chain of wagon arrival to final dispatch.
4.5. Optimization and Simulation
The algorithm that chooses the matrix xij that will minimize total delivery time T is created by a linear programming that satisfies the following:
- Technological precedence regulations;
- Station and track capacity limits;
- Availability of train services.
Based on observed processing times and distances of stations of the wagon flows, the model is applied to real wagon flows in the Khamza–Bukhara corridor. The optimized schedule was checked against the actual operations to test:
- Total delivery time;
- Station queue lengths;
- Number of re-handling operations.
5. Results
In this section, the final outputs of the intelligent delivery model are presented, along with their implications on the performance of rail freight.
5.1. Operational Performance of the Intelligent System
The simulation environment combines the real-time wagon location, station capacity and shipment attributes to produce optimal routing and processing routes. Based on the outputs, station congestion, as opposed to line-haul distance, is the most significant factor that determines the reliability of delivery. The model determines key points of processing at which the queues build up and reorganizes technological sequences to eliminate saturation.
These findings indicate that as technological intensity heads towards the capacity of the system, the waiting time of wagons jumps exponentially, leading to cascading congestion along the path. The intelligent system eliminates this impact through the redistribution of flows and elimination of unwarranted re-handling processes.
5.2. Corridor-Level Delivery Outcomes
The Khamza–Bukhara corridor is utilized as a case study. Table 1 provides the results on the key performance indicators of the simulation.
Table 1.
Delivery performance on the Khamza–Bukhara corridor.
As indicated in Table 1, even though the two systems are operated within the same corridor of operation, which is 604 km long, operational efficiency is highly enhanced by the intelligent system, in which re-handling of the intermediate is minimized from four to two. This has a direct effect of reducing the average station dwell time, meaning that there is less blockage of technology processing and reduced queues. Consequently, the time of total delivery can be reduced to 54 h from 68 h, which proves that the coordination of the work of the stations is more effective than the use of distance or speed. As a result, the total risk of delay changes from high to low, proving that the intelligent model increases the reliability of the delivery and stability of the service.
5.3. Economic Effects of Delivery Reliability
Table 2 presents a summary of the financial risk of delivery delays.
Table 2.
Penalty-risk indicators.
The results in Table 2 indicate that delay risk creates high expected financial losses. The intelligent system directly decreases the probability of delay and the exposure to penalties by reducing queues and enhancing the level of technological sequencing.
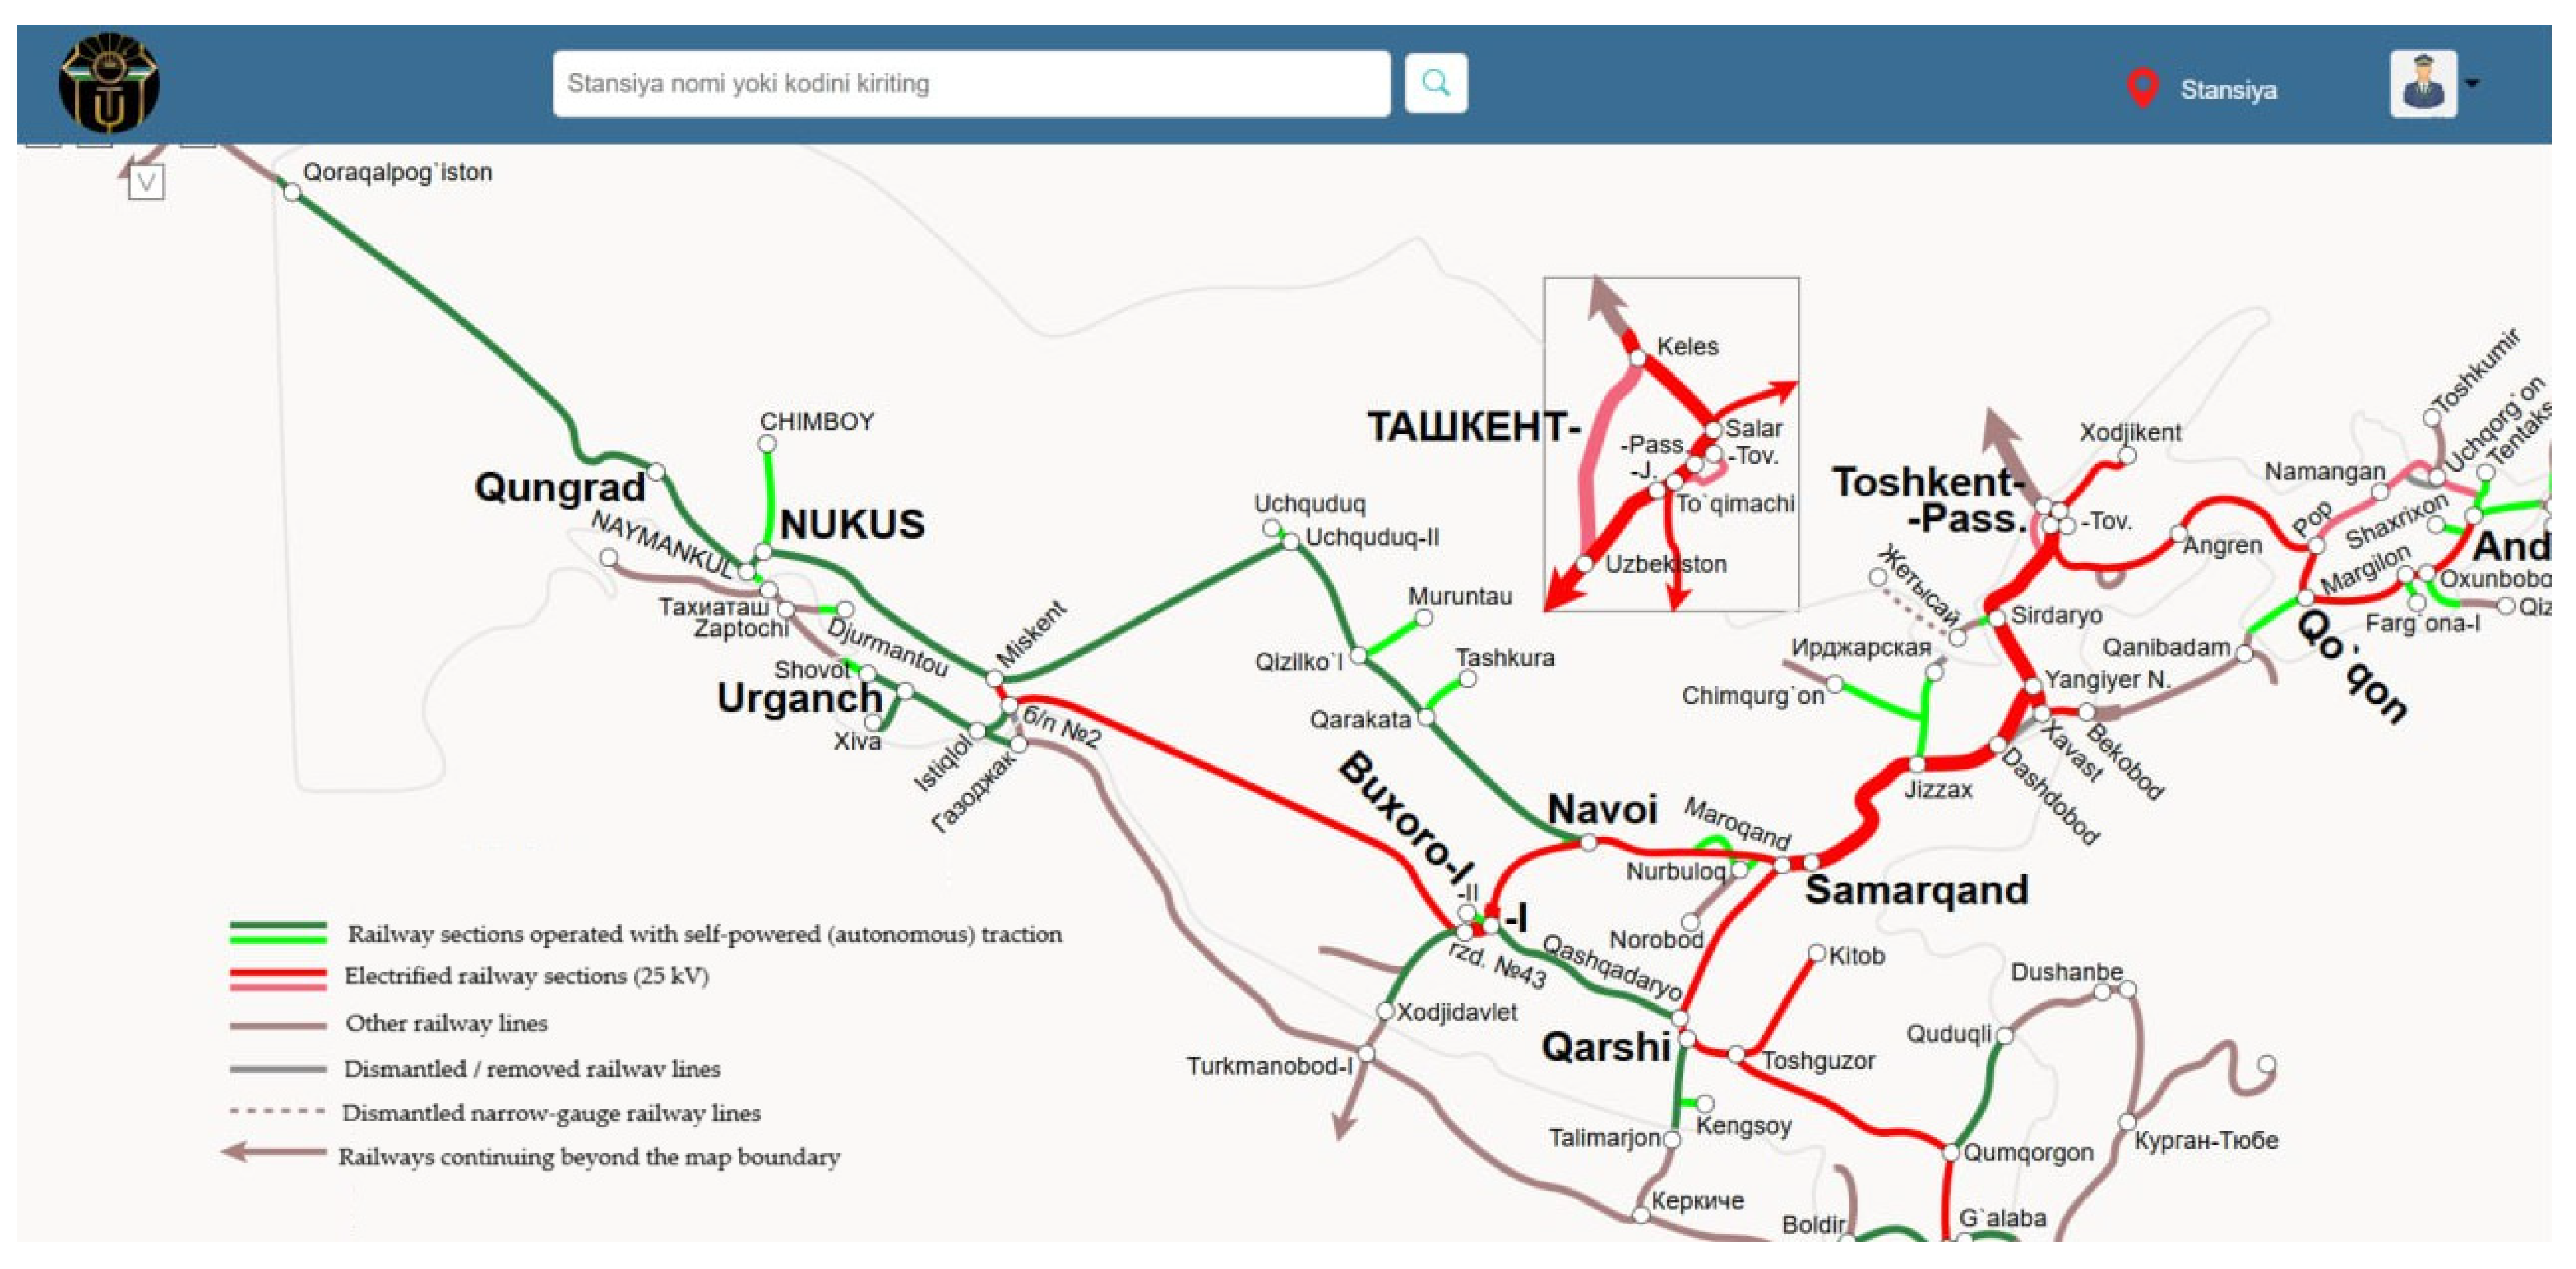
Figure 7 below shows the network map of spatial distribution of the main railway corridors and operation centers adopted in the simulation. It establishes the fact that the chosen route between Khamza and Bukhara is integrated into a dense freight network between the western, central and eastern parts. The visualization confirms that the intelligent system is used in a realistic infrastructure setting, and shows how the routing choices are limited by real network topology, as opposed to the hypothetical straight-line distances. The better resolution and labeling facilitate the clarification of the station positions and flow directions, which encourages reproducibility and practical interpretation.
Figure 7.
Interface window for distributing empty wagons to loading and unloading points.
The non-English-language entries listed in Figure 7 are existing station names in Uzbekistan, which were used to mark stations on a real rail network map in a practical software interface.
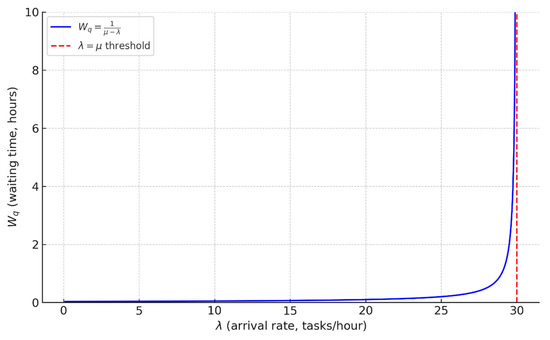
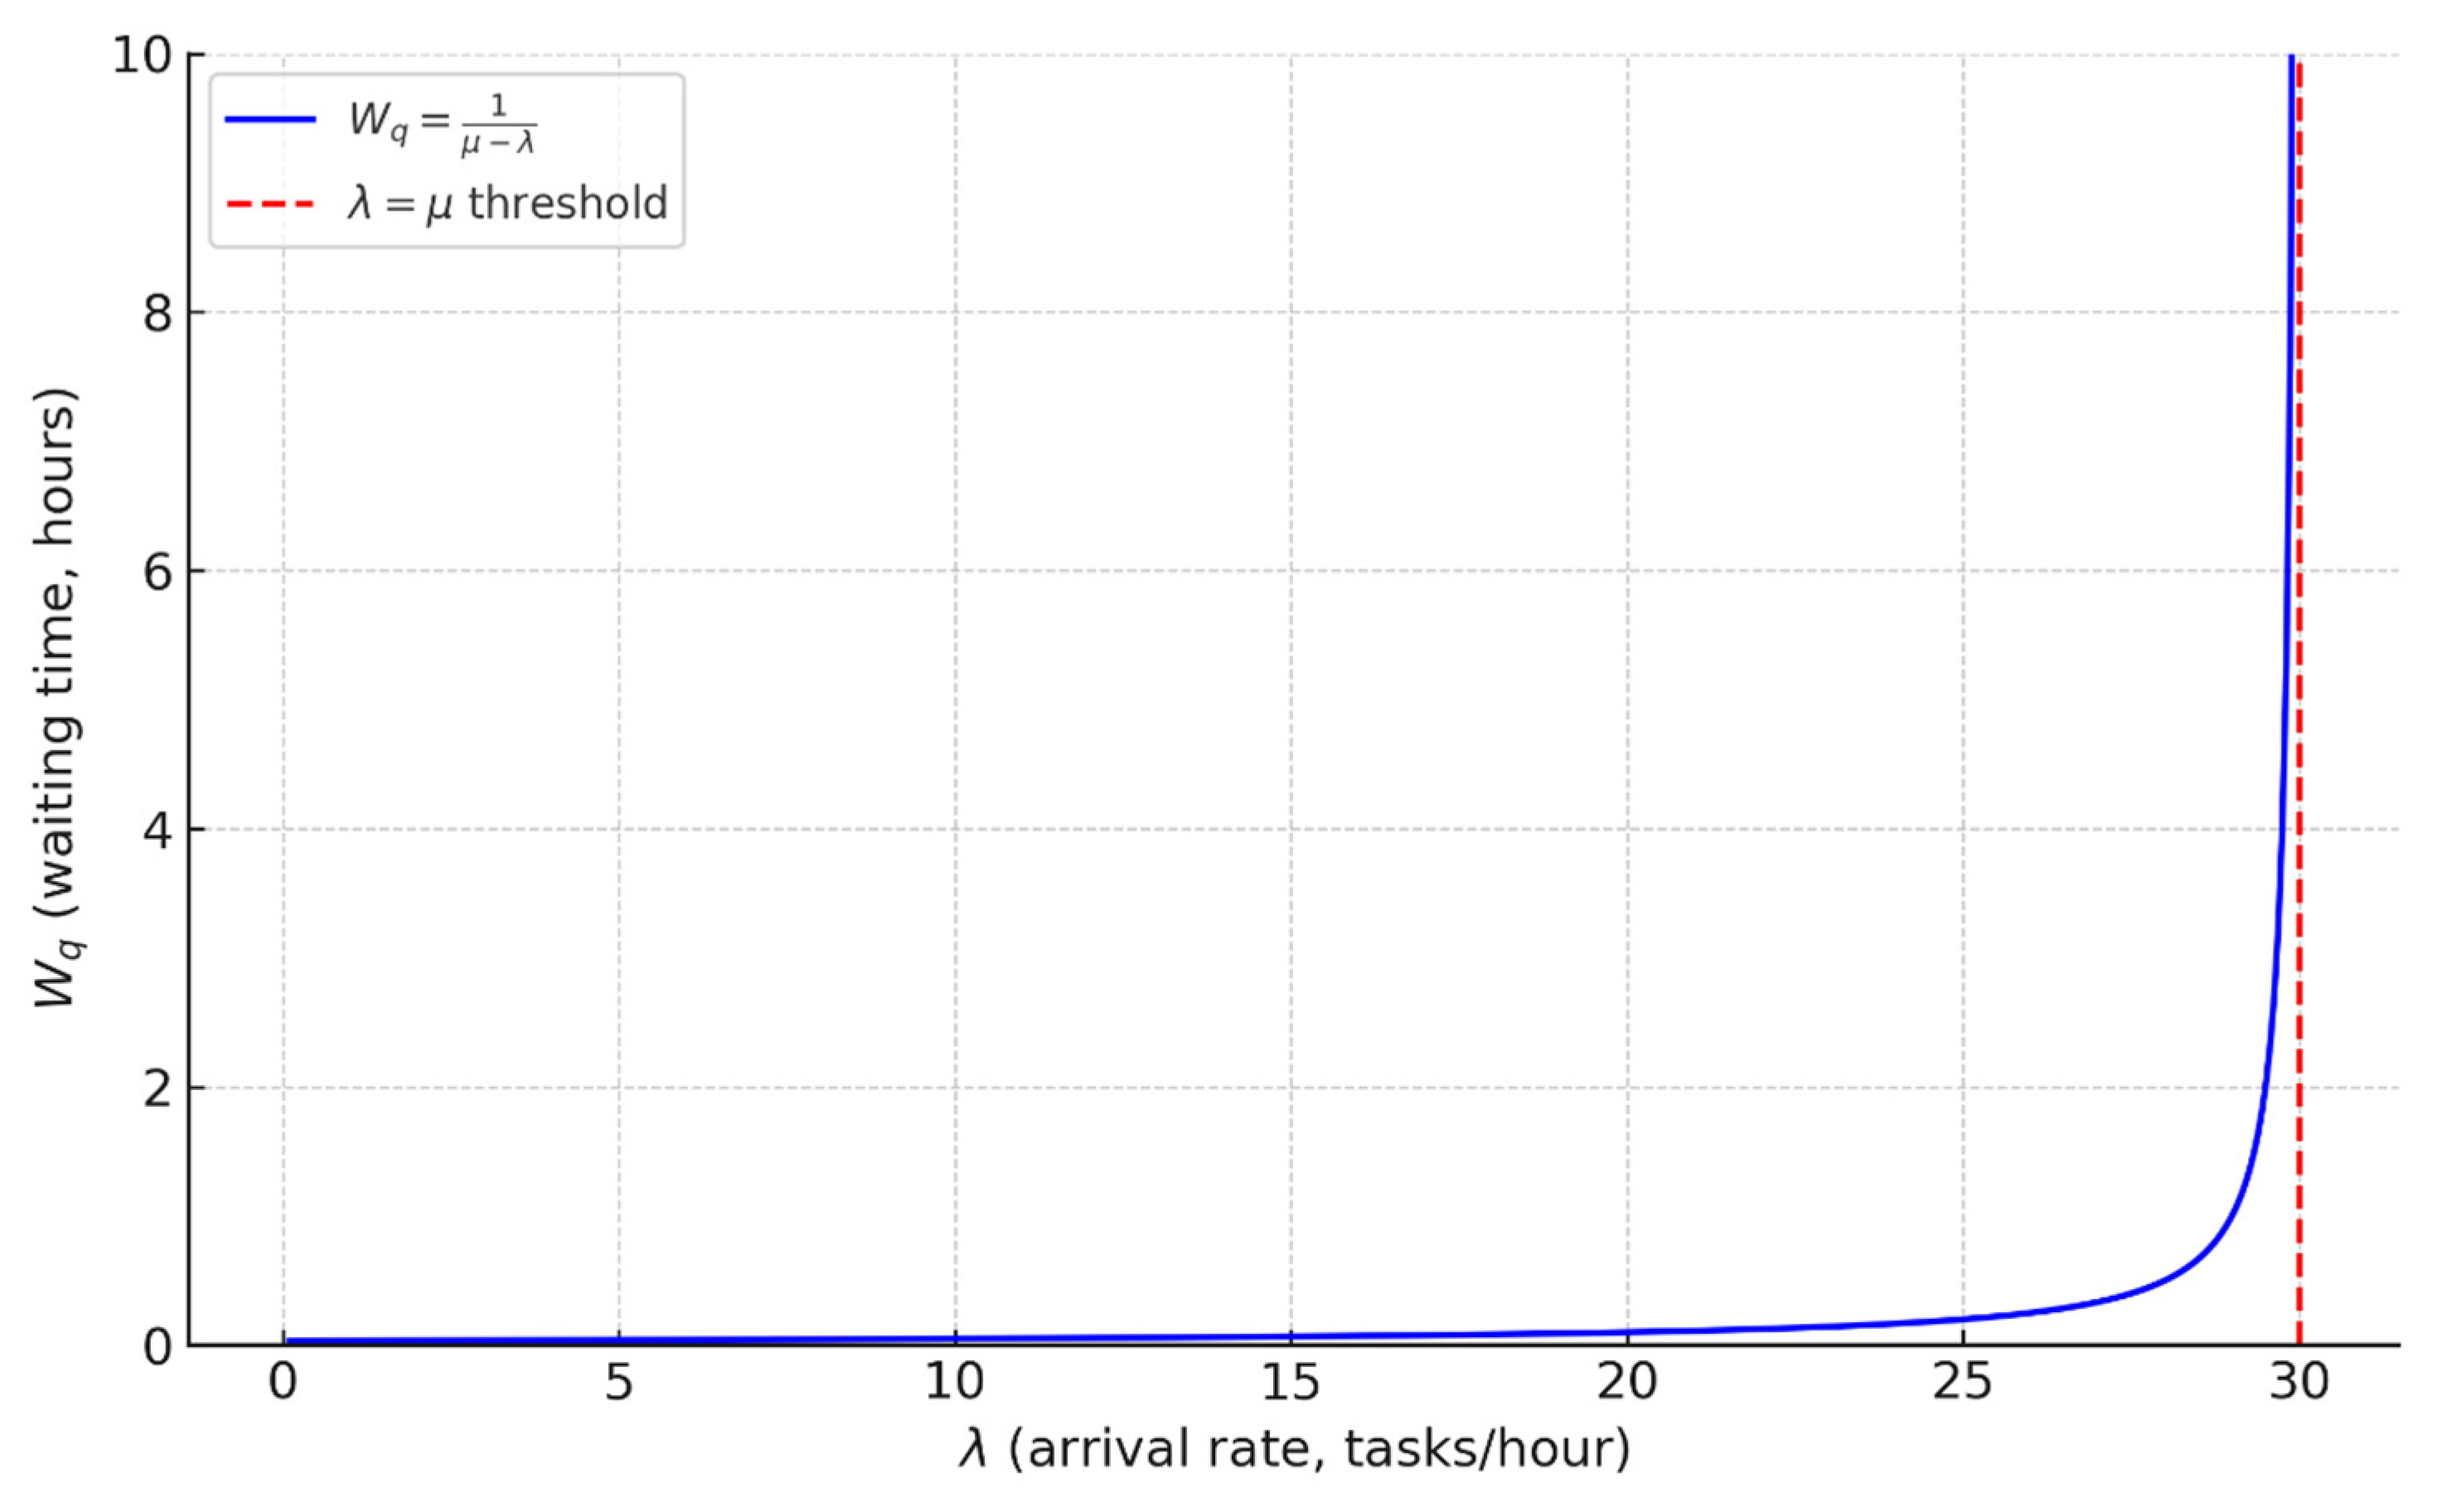
Figure 8 reveals that the waiting time is slow when there is low traffic, but there is a steep rise in the system when it is heavily loaded. At or close to capacity level, even minor changes in the wagon inflow lead to high congestion and delays. That is why the usual operations cannot be maintained under heavy traffic, whereas the intelligent system can be maintained with stable processes, as overloading of the most crucial stations is prevented. The outcome shows that the regulation of traffic intensity is better than an increase in the speed of processing itself.
Figure 8.
Dependence of the speed of the technological process on the waiting time.
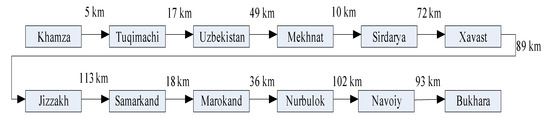
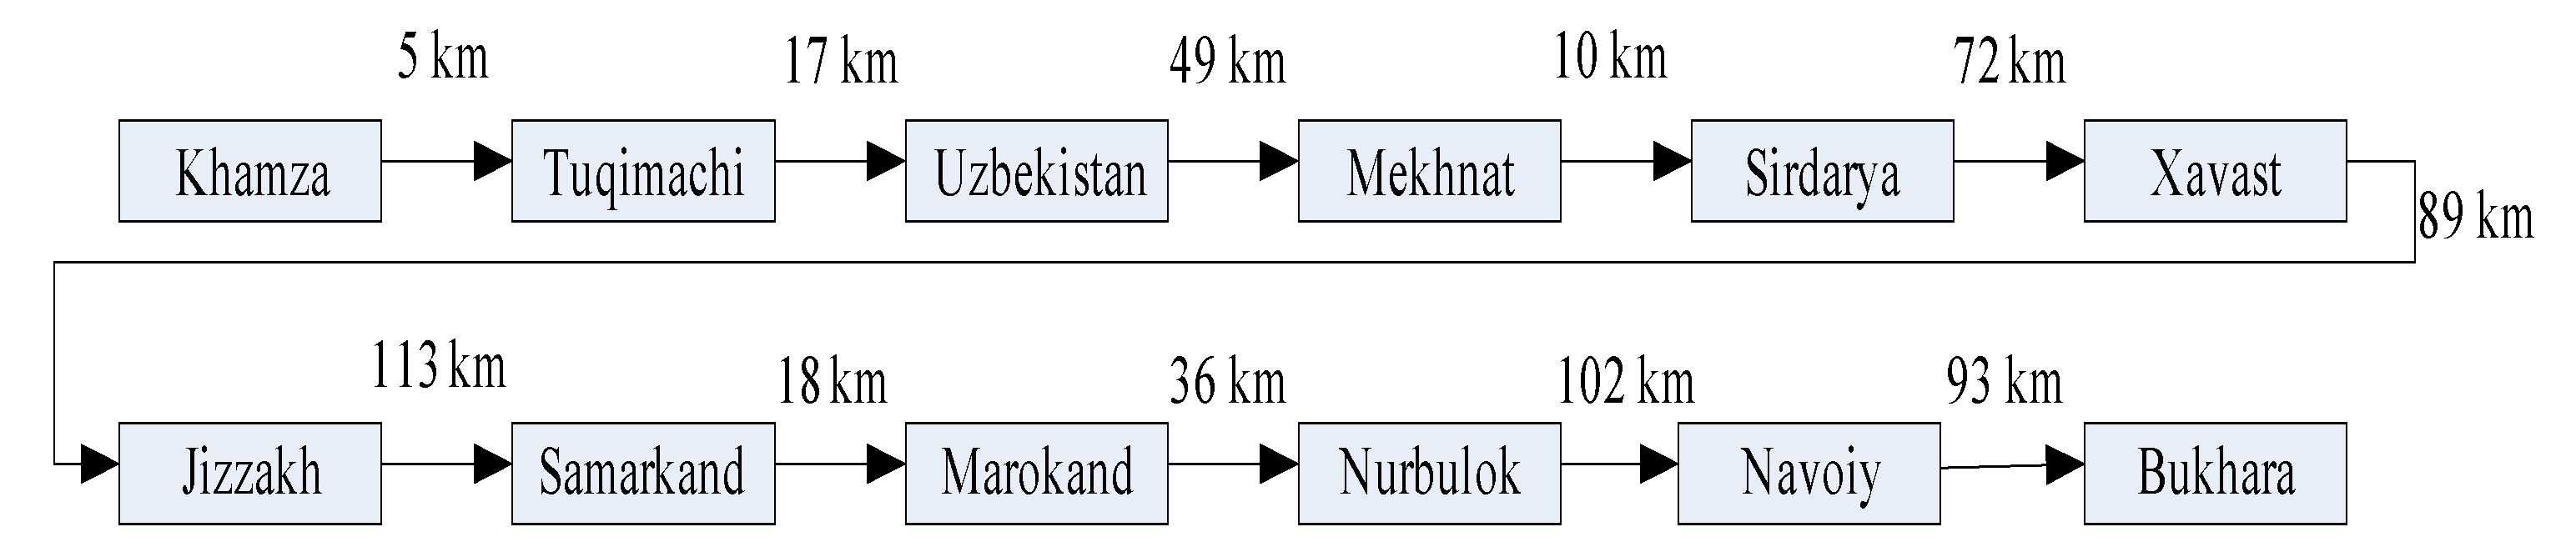
The route scheme below, Figure 9, indicates the order of stations and distances between Khamza and Bukhara. It shows that the delivery process has several short and long stages, with varying characteristics of operations, and that it is re-handling and not distance that extends delivery time. The fact that it names every intermediate node, as a result, supports the modeling method that is based on queuing and justifies the necessity to optimize the process of technological sequences, rather than minimize the kilometers covered.
Figure 9.
Distance between Khamza and Bukhara stations.
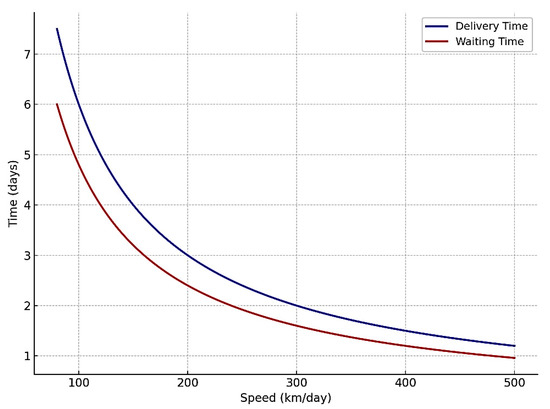
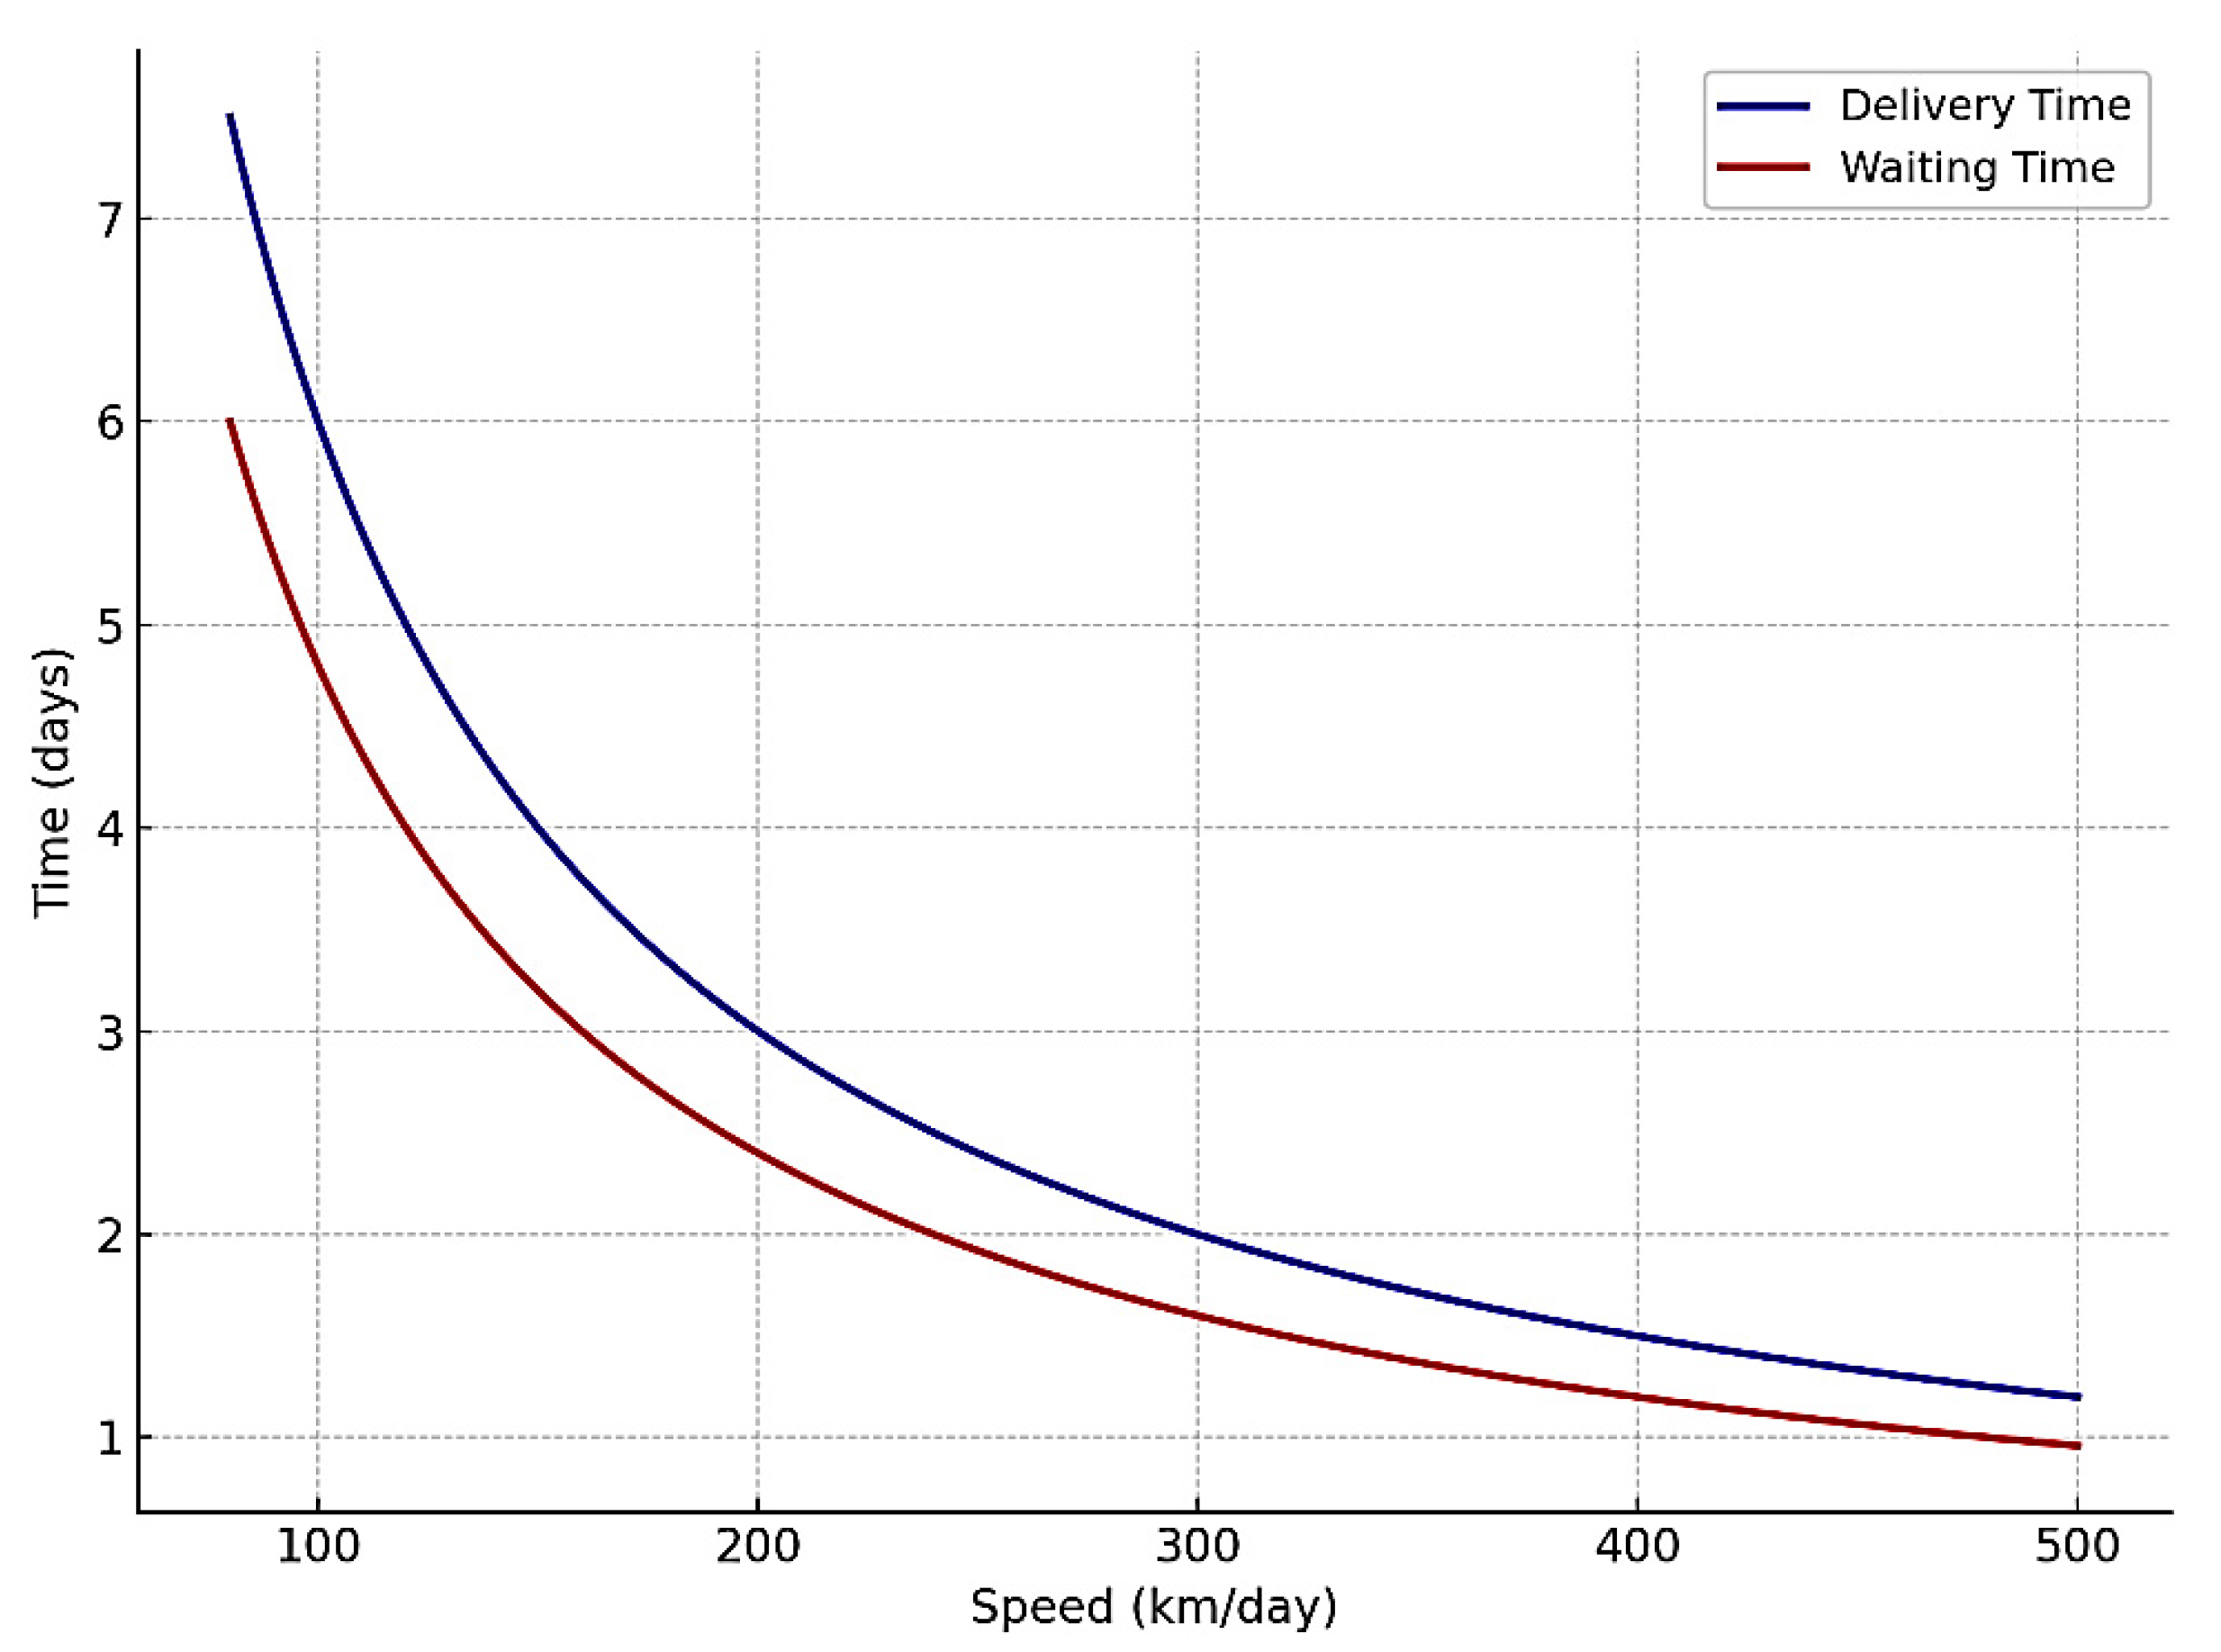
Figure 10 reveals that increased average wagon speed leads to a reduction in the waiting time and the total delivery time but at a decreasing rate. At low speed, most of the time is wasted in queues and re-handling, but at higher speeds the role of movement time takes a leading role. The smart model changes the system performance to a lower waiting-time section without having to accelerate the speed, which proves that operational coordination and less re-processing are more effective than infrastructure-based acceleration.
Figure 10.
Effect of average wagon speed on total delivery time.
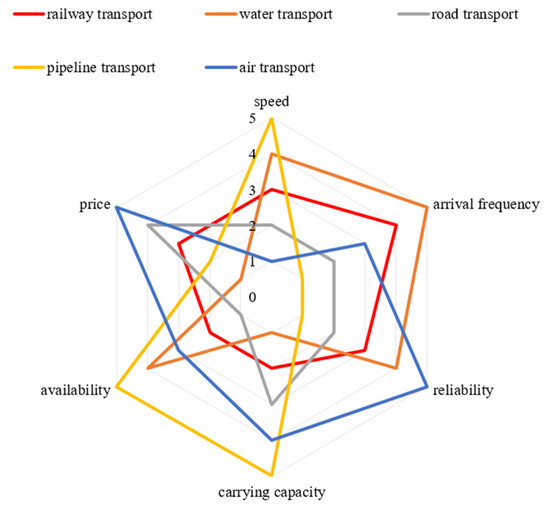
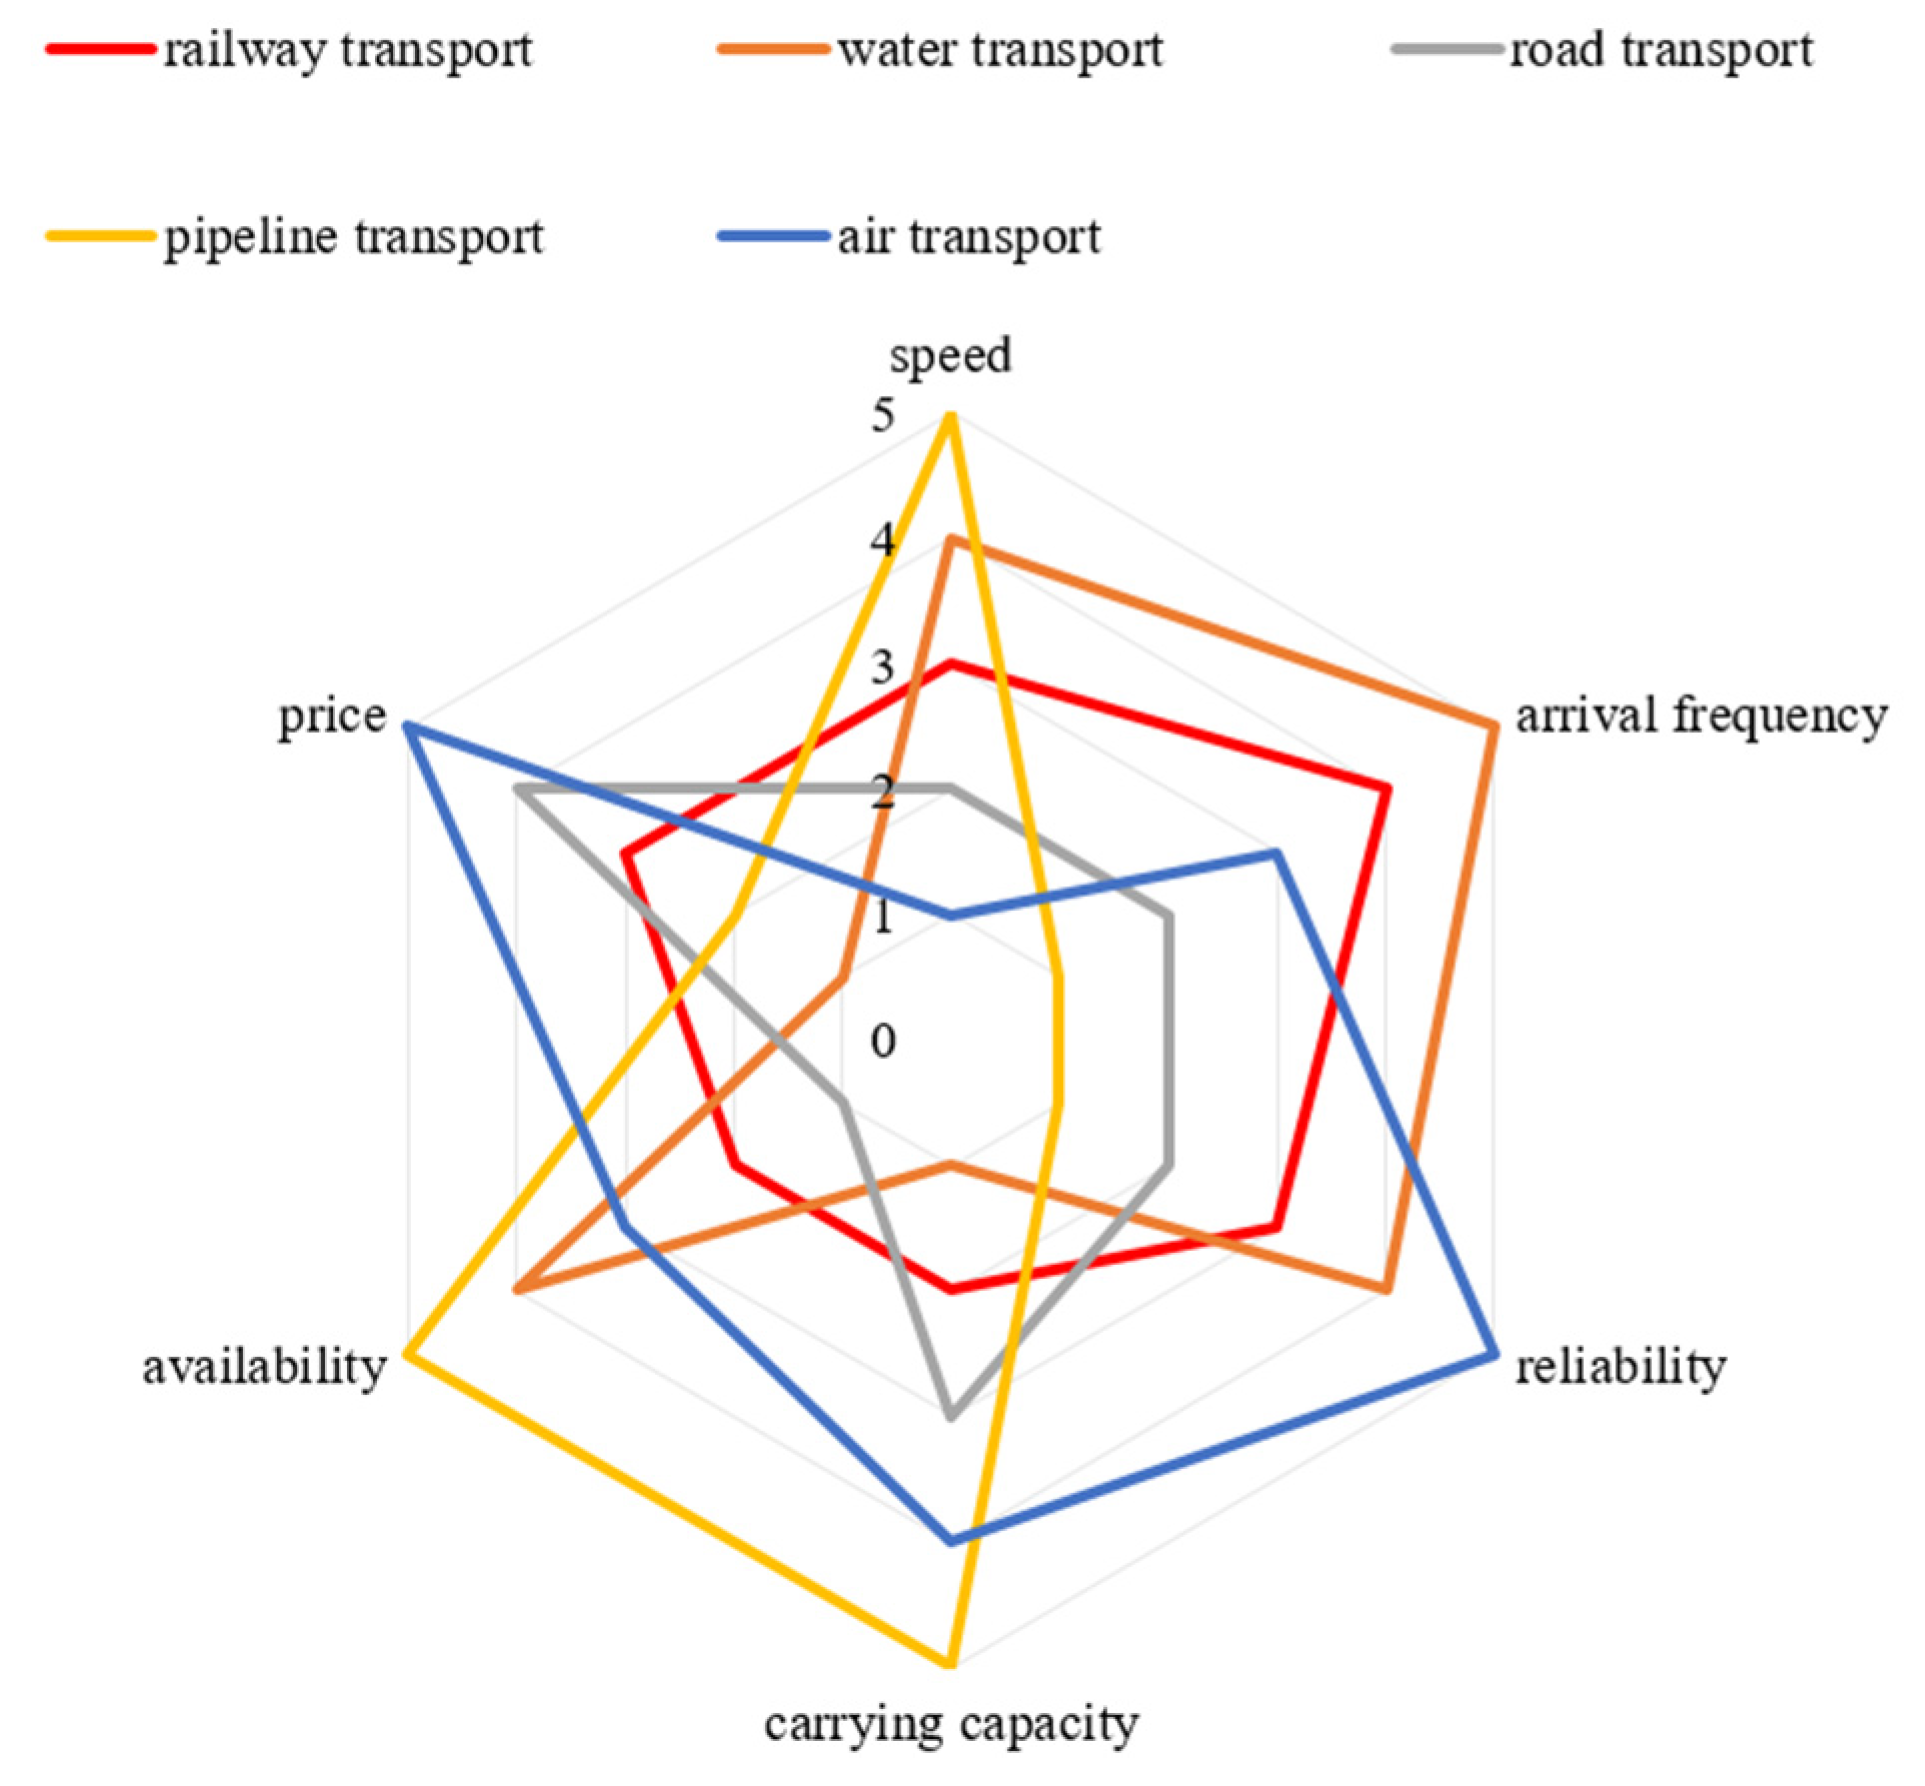
The average rating of the railway transport is low, which helps to note its current competitive deficit, yet Figure 11 makes it clear that major causes of this deficit are the long routes with several intermediate stops that result in greater exposure to delays. Railway transport can be brought to the ultimate level of performance, enhancing the speed of deliveries and cost-effectiveness by optimizing the actions of the station on the given paths, which means eliminating re-handling that has no sense and leads to a decrease in delivery rates.
Figure 11.
Diagram of assessing the quality of different transport modes using a five-level rating system.
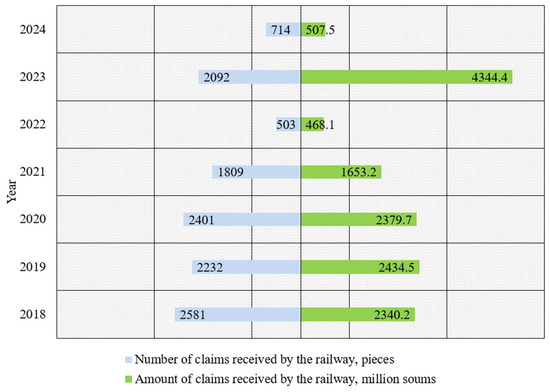
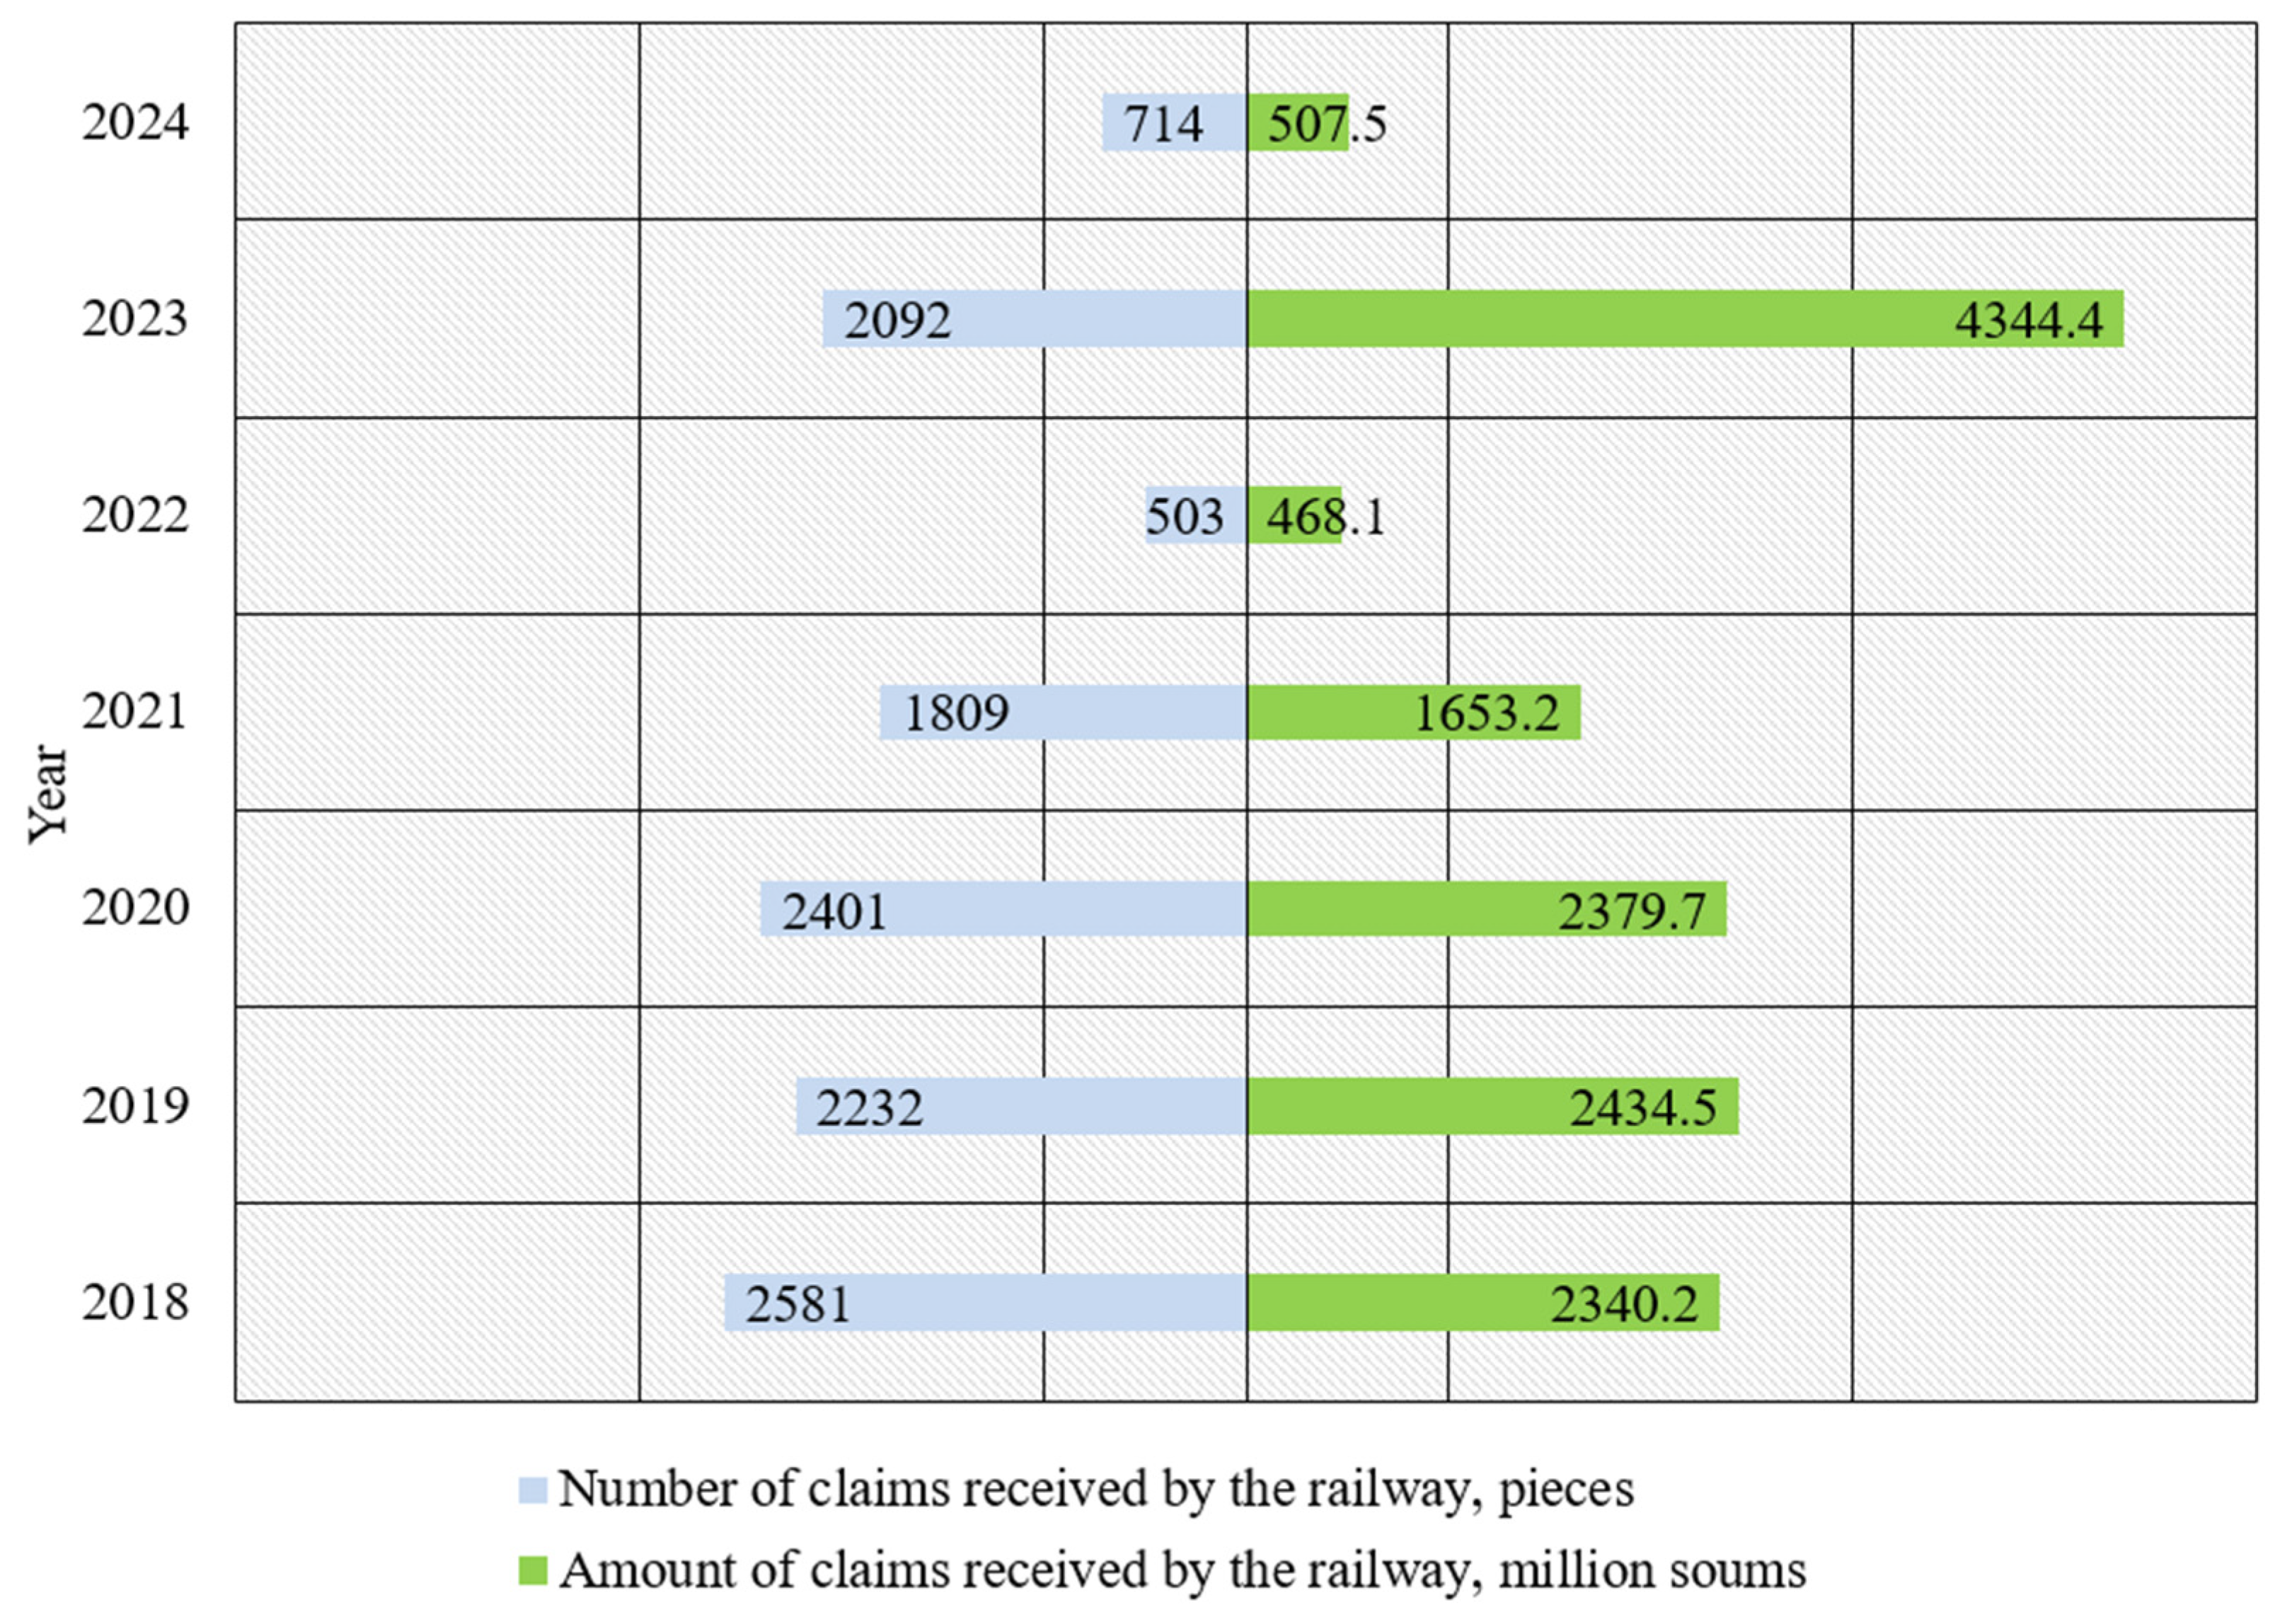
The high fluctuation of the delay claims in addition to the steep increase in penalties in 2023 depicts the presence of severe delay unreliability. This is supported by Figure 12, which indicates that long routes with several intermediate stations suffer exposure to cumulative delays, proving that repeated re-handling of cargo is one of the fundamental sources of poor performance and customer dissatisfaction.
Figure 12.
The number and total value of claims received by the local railway system.
5.4. Scientific Contribution of the Results
The scientific contribution of this study lies in integrating queuing theory with real technological station operations to create a shipment-type-specific intelligent freight delivery model. Unlike traditional railway planning methods based primarily on distance or timetable optimization, the proposed approach explicitly models wagon processing sequences, re-handling intensity, and congestion-driven delays. The introduction of a technological precedence matrix enables the systematic optimization of operational chains for different shipment types. Corridor-level validation demonstrates that reducing intermediate technological operations has a greater impact on delivery reliability than increasing train speed alone. Additionally, the incorporation of penalty-risk assessment provides an economic dimension to operational decision-making. Together, these elements form an adaptive decision-support framework that actively regulates delivery reliability rather than passively recording delays.
6. Conclusions
This paper proposed and confirmed a data-driven, intelligent model of optimization of cargo transportation in railways based on the type of shipment by combining the queuing theory with technological process modeling and actual operational data. The findings prove that the duration of delivery time is the leading factor not due to the length of the routes but the amount of the technological processes that are conducted on the intermediate stations. Utilization of the proposed intelligent model minimized avoidable re-handling, decreased the dwell time of the station and reduced the cumulative delivery time in the Khamza–Bukhara corridor dramatically compared to traditional operations.
The queuing analysis showed that the congestion increases exponentially as the wagon inflow approaches the station processing capacity, and this is the reason behind high congestion and delays during traditional dispatching. The intelligent model is able to reduce operation in unsteady congestion regimes and to have more reliable delivery performance by dynamically redistributing wagon flows and choosing technologically optimal processing sequences.
Economic analysis also revealed that the mitigation of delivery delays directly reduces the exposure of penalty and financial risk by both the railway operators and their customers. The proposed methodology, unlike traditional planning methods which do not distinguish between the type of shipments, allows for more accurate prediction, prioritization and control of wagon movements, since not all shipments are treated alike.
Application of the model reduced intermediate re-handlings by 50% and total delivery time by approximately 21%, demonstrating practical feasibility for operational deployment.
In general, the novelty of the study is based on the integration of the queuing theory and real-time technological process modeling to develop an adaptive decision-support system that actively regulates the reliability of deliveries instead of recording delays. This offers a scientifically based and necessary tool for enhancing the efficiency, predictability, and economic viability of railway freight transport.
7. Limitations of the Study
The limitations of the present study are the following:
1. Single-corridor validation—The model was tested on one key railway line (Khamza–Bukhara), and therefore the results cannot be considered applicable to other areas with varying traffic patterns and infrastructure features;
2. Limited real-time integration—Although the framework is geared towards making intelligent decisions, contemporary real-time utilization of the framework is based on historical and partially static data on operations and not on fully real-time system inputs;
3. Simplified queuing assumptions—Queuing model assumes that the arrival and service patterns are constant, unlike the reality in railway operation, which is that it is influenced by all kinds of disruptions, weather conditions, machine failures, and human elements that cannot be fully described;
4. Restricted economic scope—The economic analysis is primarily limited to the delay penalties and does not encompass the wider cost aspects of fuel consumption, crew costs, or infrastructure wear;
5. Lack of comparison with alternative optimization models—The study only compares the intelligent system primarily with standard operations; the study does not compare it to other advanced methods of optimization- or simulation-based railway planning.
These constraints specify major guidelines for future research and system development.
Author Contributions
Conceptualization, J.B. and R.A.; methodology, S.S.; software, Z.M.; validation, J.K., R.T. and Z.M.; formal analysis, R.A.; investigation, D.B.; resources, Z.M.; data curation, J.K.; writing-original draft preparation, D.B.; writing-review and editing, S.S.; visualization, Z.M.; supervision, R.T.; project administration, J.B.; funding acquisition, R.A. All authors have read and agreed to the published version of the manuscript.
Funding
This research was funded by Agency of Innovative Development under the Ministry of Higher Education of the Republic of Uzbekistan [grant number AL-8624042442-R4] and the APC was funded by authors.
Institutional Review Board Statement
Not applicable.
Informed Consent Statement
Not applicable.
Data Availability Statement
Data is unavailable due to privacy or ethical restrictions.
Conflicts of Interest
The authors declare no conflict of interest.
References
- Naumov, V.; Starczewski, J. Approach to simulations of goods deliveries with the use of cargo bicycles. In AIP Conference Proceedings; AIP Publishing LLC: Melville, NY, USA, 2019. [Google Scholar]
- Vasin, A.; Grigoryeva, O.; Tsyganov, N. A model for optimization of transport infrastructure for some homogeneous goods markets. J. Glob. Optim. 2020, 76, 499–518. [Google Scholar] [CrossRef] [Scilit]
- Moura, J.L.; Ibeas, A.; dell’Olio, L. Optimization–simulation model for planning supply transport to large infrastructure public works located in congested urban areas. Netw. Spat. Econ. 2010, 10, 487–507. [Google Scholar] [CrossRef] [Scilit]
- Makhova, L.; Haykin, M.; Glazkova, I.; Domnina, O. Development of mathematical models for trucks and cargo. Infrastructures 2023, 8, 17. [Google Scholar] [CrossRef] [Scilit]
- Zabielska, A.; Jacyna, M.; Lasota, M.; Nehring, K. Evaluation of the efficiency of the delivery process in the technical object of transport infrastructure with the application of a simulation model. Eksploat. Niezawodn. 2023, 25, 1. [Google Scholar] [CrossRef] [Scilit]
- Yanchuk, V.M.; Tkachuk, A.G.; Antoniuk, D.S.; Vakaliuk, T.A.; Humeniuk, A.A. Mathematical simulation of package delivery optimization using a combination of carriers. arXiv 2020, arXiv:2011.01200. [Google Scholar] [CrossRef] [Scilit]
- Mukunzi, G.; Palmqvist, C.-W. The impact of railway incidents on train delays: A case of the Swedish Railway Network. J. Rail Transp. Plan. Manag. 2024, 30, 100445. [Google Scholar] [CrossRef] [Scilit]
- Kavička, A.; Diviš, R.; Veselý, P. Railway station capacity assessment utilizing simulation-based techniques and the UIC406 method. In Proceedings of the 32nd European Modeling & Simulation Symposium (EMSS 2020), Online, 16–18 September 2020. [Google Scholar]
- Shramenko, N.; Shramenko, V. Simulation Model of the Process of Delivering Small Consignments in International Traffic Through the Terminal System. In Proceedings of the ICST, Yogyakarta, Indonesia, 7–8 September 2020. [Google Scholar]
- Lövétei, I.F.; Lindenmaier, L.; Aradi, S. Efficient real-time rail traffic optimization: Decomposition of rerouting, reordering, and rescheduling problems. J. Rail Transp. Plan. Manag. 2025, 33, 100496. [Google Scholar] [CrossRef] [Scilit]
- Lebid, I.; Luzhanska, N.; Lebid, I.; Mazurenko, A.; Halona, I.; Horban, A.; Mykhailenko, I.; Medvediev, I.; Sotnikova, T. Construction of a simulation model of goods delivery in international road transportation taking into account the functioning efficiency of logistics supply chain. East.-Eur. J. Enterp. Technol. 2023, 3, 57–67. [Google Scholar]
- Ab Rahman, F. Transportation Model in Delivery Goods Using Railway Systems. In Proceedings of the Global Conference on Economics and Management Science 2015 (GEMS 2015), Penang, Malaysia, 12–13 October 2015. [Google Scholar]
- Šperka, A.; Čamaj, J.; Dedík, M.; Bulková, Z. Evaluation Methodology of the Railway Stations Using Multi-Criteria Decision-Making Methods. Infrastructures 2023, 8, 177. [Google Scholar] [CrossRef] [Scilit]
- Geischberger, J.; Weik, N.; Pannek, J. Reliability evaluation of rail freight transport processes—An agent-based approach combining microscopic rail simulation and freight network logistics. J. Rail Transp. Plan. Manag. 2025, 37, 100558. [Google Scholar] [CrossRef] [Scilit]
- Zien, M.; Kirschstein, T.; Bierwirth, C. A study on sorting strategies in marshaling yards with a limited number of tracks and track capacity. J. Rail Transp. Plan. Manag. 2025, 33, 100498. [Google Scholar] [CrossRef] [Scilit]
- Pascariu, B.; Flensburg, J.V.; Pellegrini, P.; Azevedo, C.M.L. Formulation and solution framework for real-time railway traffic optimization. IET Intell. Transp. Syst. 2025, 19, e12610. [Google Scholar] [CrossRef] [Scilit]
- Marinov, M.; Viegas, J. A mesoscopic simulation modelling methodology for analyzing and evaluating freight train operations in a rail network. Simul. Model. Pract. Theory 2011, 19, 516–539. [Google Scholar] [CrossRef] [Scilit]
- Hall, R.W. Queueing Methods: For Services and Manufacturing; Prentice Hall: Hoboken, NJ, USA, 1991. [Google Scholar]
- Bykadorov, S.; Arpabekov, M.; Khudayberganov, S.; Suyunbayev, S.; Khusenov, U.; Makhmudovna, M. About the model of railway transport management in Russia. In E3S Web of Conferences; EDP Sciences: Les Ulis, France, 2023. [Google Scholar]
- Preis, H.; Pollehn, T.; Ruf, M. Optimal resource rescheduling in classification yards considering flexible skill patterns. J. Rail Transp. Plan. Manag. 2023, 26, 100390. [Google Scholar] [CrossRef] [Scilit]
- Mukhamedova, Z.; Boboyev, D.; Saidivaliev, S.; Abdullaev, R.; Kobulov, J.; Akhmedov, S.; Fayzibayev, S. Mathematical modeling of fastening conditions in piggyback transport: Ensuring safety and stability across different transport modes. Discov. Appl. Sci. 2025, 7, 619. [Google Scholar] [CrossRef] [Scilit]

Disclaimer/Publisher’s Note: The statements, opinions and data contained in all publications are solely those of the individual author(s) and contributor(s) and not of MDPI and/or the editor(s). MDPI and/or the editor(s) disclaim responsibility for any injury to people or property resulting from any ideas, methods, instructions or products referred to in the content. |
© 2026 by the authors. Licensee MDPI, Basel, Switzerland. This article is an open access article distributed under the terms and conditions of the Creative Commons Attribution (CC BY) license.