


Abstract
To explore the relationships among factors influencing overall comfort in aircraft cabins, a scale-based method was developed. First, a weighted multi-level measurement model was used to determine the hierarchical relationships between comfort factors. Second, a hybrid path analysis model was constructed to analyze the relationships between comfort factors and their impact on overall comfort. Finally, the validity and stability of the results were evaluated using multigroup analyses. The results show that service experience has the greatest impact on overall comfort, with food and beverage being the most influential. Additionally, both service experience and the physical environment affect passengers’ perception of cabin facilities. This study identifies key factors for optimizing overall comfort. Furthermore, the methods used are applicable for analyzing overall comfort in public transportation systems in general.
1. Introduction
Service quality has become a crucial factor in influencing the choice of public transportation [1,2,3]. Comfort is a key determinant of passengers’ acceptance of transportation systems, impacting their satisfaction and willingness to use the service again [4,5,6]. Research on comfort has evolved to consider both physiological and psychological aspects, influenced by the physical and social environment within the cabin [7]. The high-quality market positioning of air travel and the unique characteristics of the operating environment make factors affecting cabin comfort more complex, thus creating a multifaceted impact mechanism on overall comfort. Understanding these influencing factors and their relationships can provide insights into optimizing the comfort of civilian aircraft cabins, clarifying the paths and effects of both direct and indirect influences.
1.1. Concept of Comfort and Factors Affecting Cabin Comfort
Comfort and discomfort reflect passengers’ physiological and psychological perceptions of their surrounding physical and social environment [8,9]. The number of factors influencing comfort has grown, much like Maslow’s Hierarchy of Needs [10]. Once basic security needs are satisfied, individuals seek higher-level needs, such as quality service and social interaction [11,12,13]. Helander and Zhang et al. [14] suggest that discomfort is often related to the physical environment, such as seating posture and fatigue, while comfort stems from experiences that exceed expectations, such as additional services and the quality of meals.
Several studies have examined the factors affecting cabin comfort. Chen [15] identified onboard staff service and facilities as the most significant determinants of airline service quality, followed by service products. Vink [16] found that factors like legroom, hygiene, crew attentiveness, and personal space impact ride comfort. An [17] and Messner [18] noted that catering is a key factor that affects the satisfaction of aviation service quality. Additionally, Li et al. [19] emphasized that facilities, especially the in-flight entertainment system, significantly affect cabin comfort, while Wang et al. [20] identified various factors including physical environment, seats, interior layout, services, catering, and entertainment systems as contributors to comfort.
To differentiate specific aspects such as seat comfort, environmental comfort, and service comfort, the concept of “overall comfort” is introduced in this work. Overall comfort refers to the passengers’ holistic subjective evaluation of comfort, encompassing the cabin’s physical environment, seating, interior layout, food and beverages, crew service, and in-flight entertainment (IFE). This concept aligns more closely with passengers’ overall cabin experience. However, it lacks detailed suggestions for improving comfort, making it essential to identify key factors through studying the relationships between these comfort elements.
1.2. Methods of Investigating Overall Comfort
Unlike single-factor comfort studies, research on overall comfort acknowledges the interconnectedness and interaction of various influencing factors. Examining how these factors interact may reveal the degree of their influence and clarify the mechanisms behind overall comfort. However, the diversity of these factors, the ambiguity surrounding them, and the complexity of their interrelations make studying overall comfort challenging.
Previous studies have decomposed comfort factors into indicators to help respondents understand complex comfort dimensions and translate evaluation results into actionable design suggestions [20,21]. However, deconstructing comfort into numerous variables increases research complexity. Some studies have employed factor analysis to reduce dimensionality, grouping related indicators based on subjective judgments or statistical relationships, which results in latent variables [22,23]. These latent variables are crucial for building multi-level measurement models that help simplify overall comfort research.
Here are two primary approaches for modeling the impact of overall comfort: one involves linear regression or correlation analysis to examine individual factors [24,25]. However, comfort factors are rarely independent; they interact synergistically. Hence, research on overall comfort faces significant challenges in simultaneously modeling multiple determinants and analyzing multi-path mechanisms (direct and indirect effects). This issue can be addressed using advanced path analysis techniques, which analyze complex relationships and their collective impact on overall comfort [7,22,26].
1.3. Modeling the Relationship Between Factors Influencing Overall Comfort
Several studies have developed models to explore how various factors influence comfort in public transport. Lee et al. [16] used structural equation modeling (SEM) to examine the overall impact of physical environmental factors on the subjective ride experience in high-speed trains. Chen [15] used SEM to develop an aviation service quality model to explore the relationships between subjective factors such as service quality, perceived value, satisfaction, and behavioral intention. Cheng [27] applied SEM to analyze the impact of convenience, comfort, safety, service, and economy on bus transfer service quality. These studies, while varying in their assumptions, demonstrate the feasibility of using SEM to model causal relationships between comfort factors.
Before constructing a model, it is essential to clarify ambiguous concepts such as “overall comfort” and simulate the hierarchical relationships among influencing factors. Furthermore, after model construction, its validity must be assessed. Comfort surveys often cover diverse subgroups, but it remains unclear whether differences in data structure across these groups affect the model’s reliability [28]. Few studies have explored model invariance across specific aviation contexts. Differences in cabin configurations (wide-body versus narrow-body layouts) and flight distances (short versus long-haul) can significantly influence the structure and paths of passenger perception [29,30]. Consequently, a robust overall comfort model must undergo cross-group testing to ensure its validity and stability across different aircraft types and flight distances [31].
1.4. Current Study
This study aims to identify the interrelationships between factors influencing overall passenger comfort and to determine their relative importance using civil aircraft cabins as an empirical case. The study is organized around three primary research objectives:
- (1)
- To establish a hierarchical measurement model by decomposing complex comfort factors into quantifiable indicators;
- (2)
- To construct a hybrid path analysis model to estimate both the direct and indirect effects of internal environment, facilities, and service experience on overall comfort; and
- (3)
- To validate the model’s effectiveness and stability across different aircraft types and flight distances through multigroup analysis.
2. Materials and Methods
2.1. Description of Method
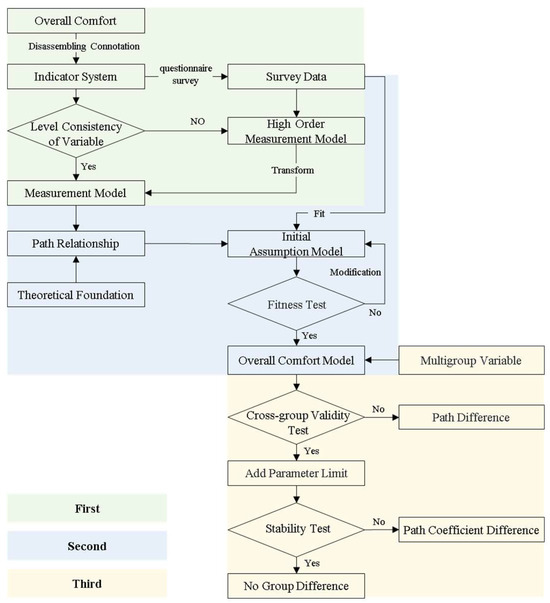
In this study, a method is proposed to identify the relationships between factors influencing overall comfort and to assess the relative importance of these factors through the analysis of subjective survey-scale data. The method is divided into three main parts (Figure 1). First, the factors influencing overall comfort were decomposed into distinct indicators. A weighted multi-level measurement model was used to define the hierarchical relationships between the factors that affect overall comfort. Second, based on the hybrid path analysis model, the potential paths of relationships between the model variables were proposed, and an initial hypothesized model of overall comfort was constructed. The Maximum Likelihood method was employed to fit the initial hypothesized model using survey data, and the model’s fit was tested. Third, multi-group analysis was used to assess the path invariance of the overall comfort model across different groups, validating the model’s robustness and stability.
Figure 1.
Method for researching overall comfort in civil aircraft cabin.
This study uses civil aircraft cabins as an example to demonstrate the steps of the methodology and explore the interrelationships and relative importance of factors influencing overall comfort.
2.2. Hierarchical Relationship of Factors Influencing Overall Comfort
2.2.1. Decomposing Factors Affecting Overall Comfort in Civilian Aircraft
- (1)
- Decomposing factors into indicators
Previous studies have identified that factors affecting passengers’ physical and psychological comfort in the cabin include both physical factors (such as the environment, seating, interior layout, food, and beverages) and social factors (such as crew service and IFE). To provide a clearer understanding of overall comfort, these cabin factors were disassembled into measurable indicators. The indicators were refined based on expert opinions [32]. Experts included five frequent fliers and three transportation facility human-factor design specialists. Among the specialists, two were from the civil aviation industry’s cabin business departments, and one was from the cabin services department of an airline. The frequent fliers were from academic institutions focused on human-factor research in transportation.
- (2)
- Questionnaire design and indicator optimization
Two types of questionnaires were designed: a satisfaction questionnaire and an importance questionnaire. The satisfaction questionnaire assessed passengers’ satisfaction with each indicator and with the overall comfort on a five-point scale, ranging from “1 = very dissatisfied” to “5 = very satisfied” [33,34]. The importance questionnaire asked respondents to rate the importance of each factor on a scale of “1 = very unimportant” to “5 = very important.”
SPSS Statistics 24 was used to analyze the reliability of each questionnaire. Cronbach’s Alpha was used to assess the internal consistency of the items in each questionnaire. The rationality of the items was tested, and 93 wide-body aircraft indicators and 80 narrow-body aircraft indicators affecting overall comfort were identified (Table 1).
Table 1.
Reliability statistics of scale.
- (3)
- Questionnaire
The study involved data collection from three major full-service airlines in China (excluding low-cost carriers), covering six flights on wide-body aircraft and eight flights on narrow-body aircraft, totaling 14 flights. Narrow-body aircraft flights ranged from 1 to 2 h, during which snacks, drinks, and limited IFE were provided. Wide-body aircraft flights ranged from 2 to 5 h and provided optional meals, beverages, and personal IFE. There were no significant flight delays. To ensure informed consent, the chief flight attendant announced to passengers, within 10–20 min after meals and beverages were distributed, that a questionnaire would be handed out. Crew members assisted in distributing questionnaires and pens to each adult passenger, excluding those who did not wish to participate or were asleep. Ethical approval was obtained from the University Ethics Committee, and all procedures followed relevant regulations.
To minimize respondent fatigue and ensure data quality, strict screening rules were applied. Questionnaires with “straight-lining” (choosing the same answer for all items), significant missing data (more than 10% of items unanswered), or inconsistent responses were excluded from analysis [35]. For wide-body aircraft surveys, 749 satisfaction questionnaires were distributed, with 444 returned. For narrow-body aircraft, 591 satisfaction questionnaires were distributed, with 396 returned. For importance questionnaires, a total of 799 were distributed, with 530 returned.
2.2.2. Hierarchical Structure Model of Factors Influencing Overall Comfort in Civil Aircraft Cabins
- (1)
- Construction of measurement model
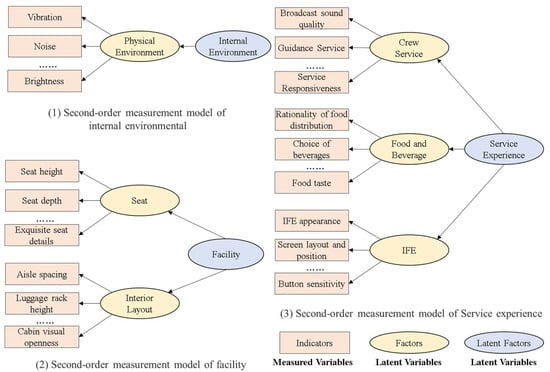
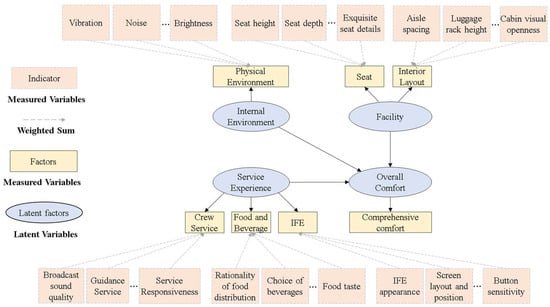
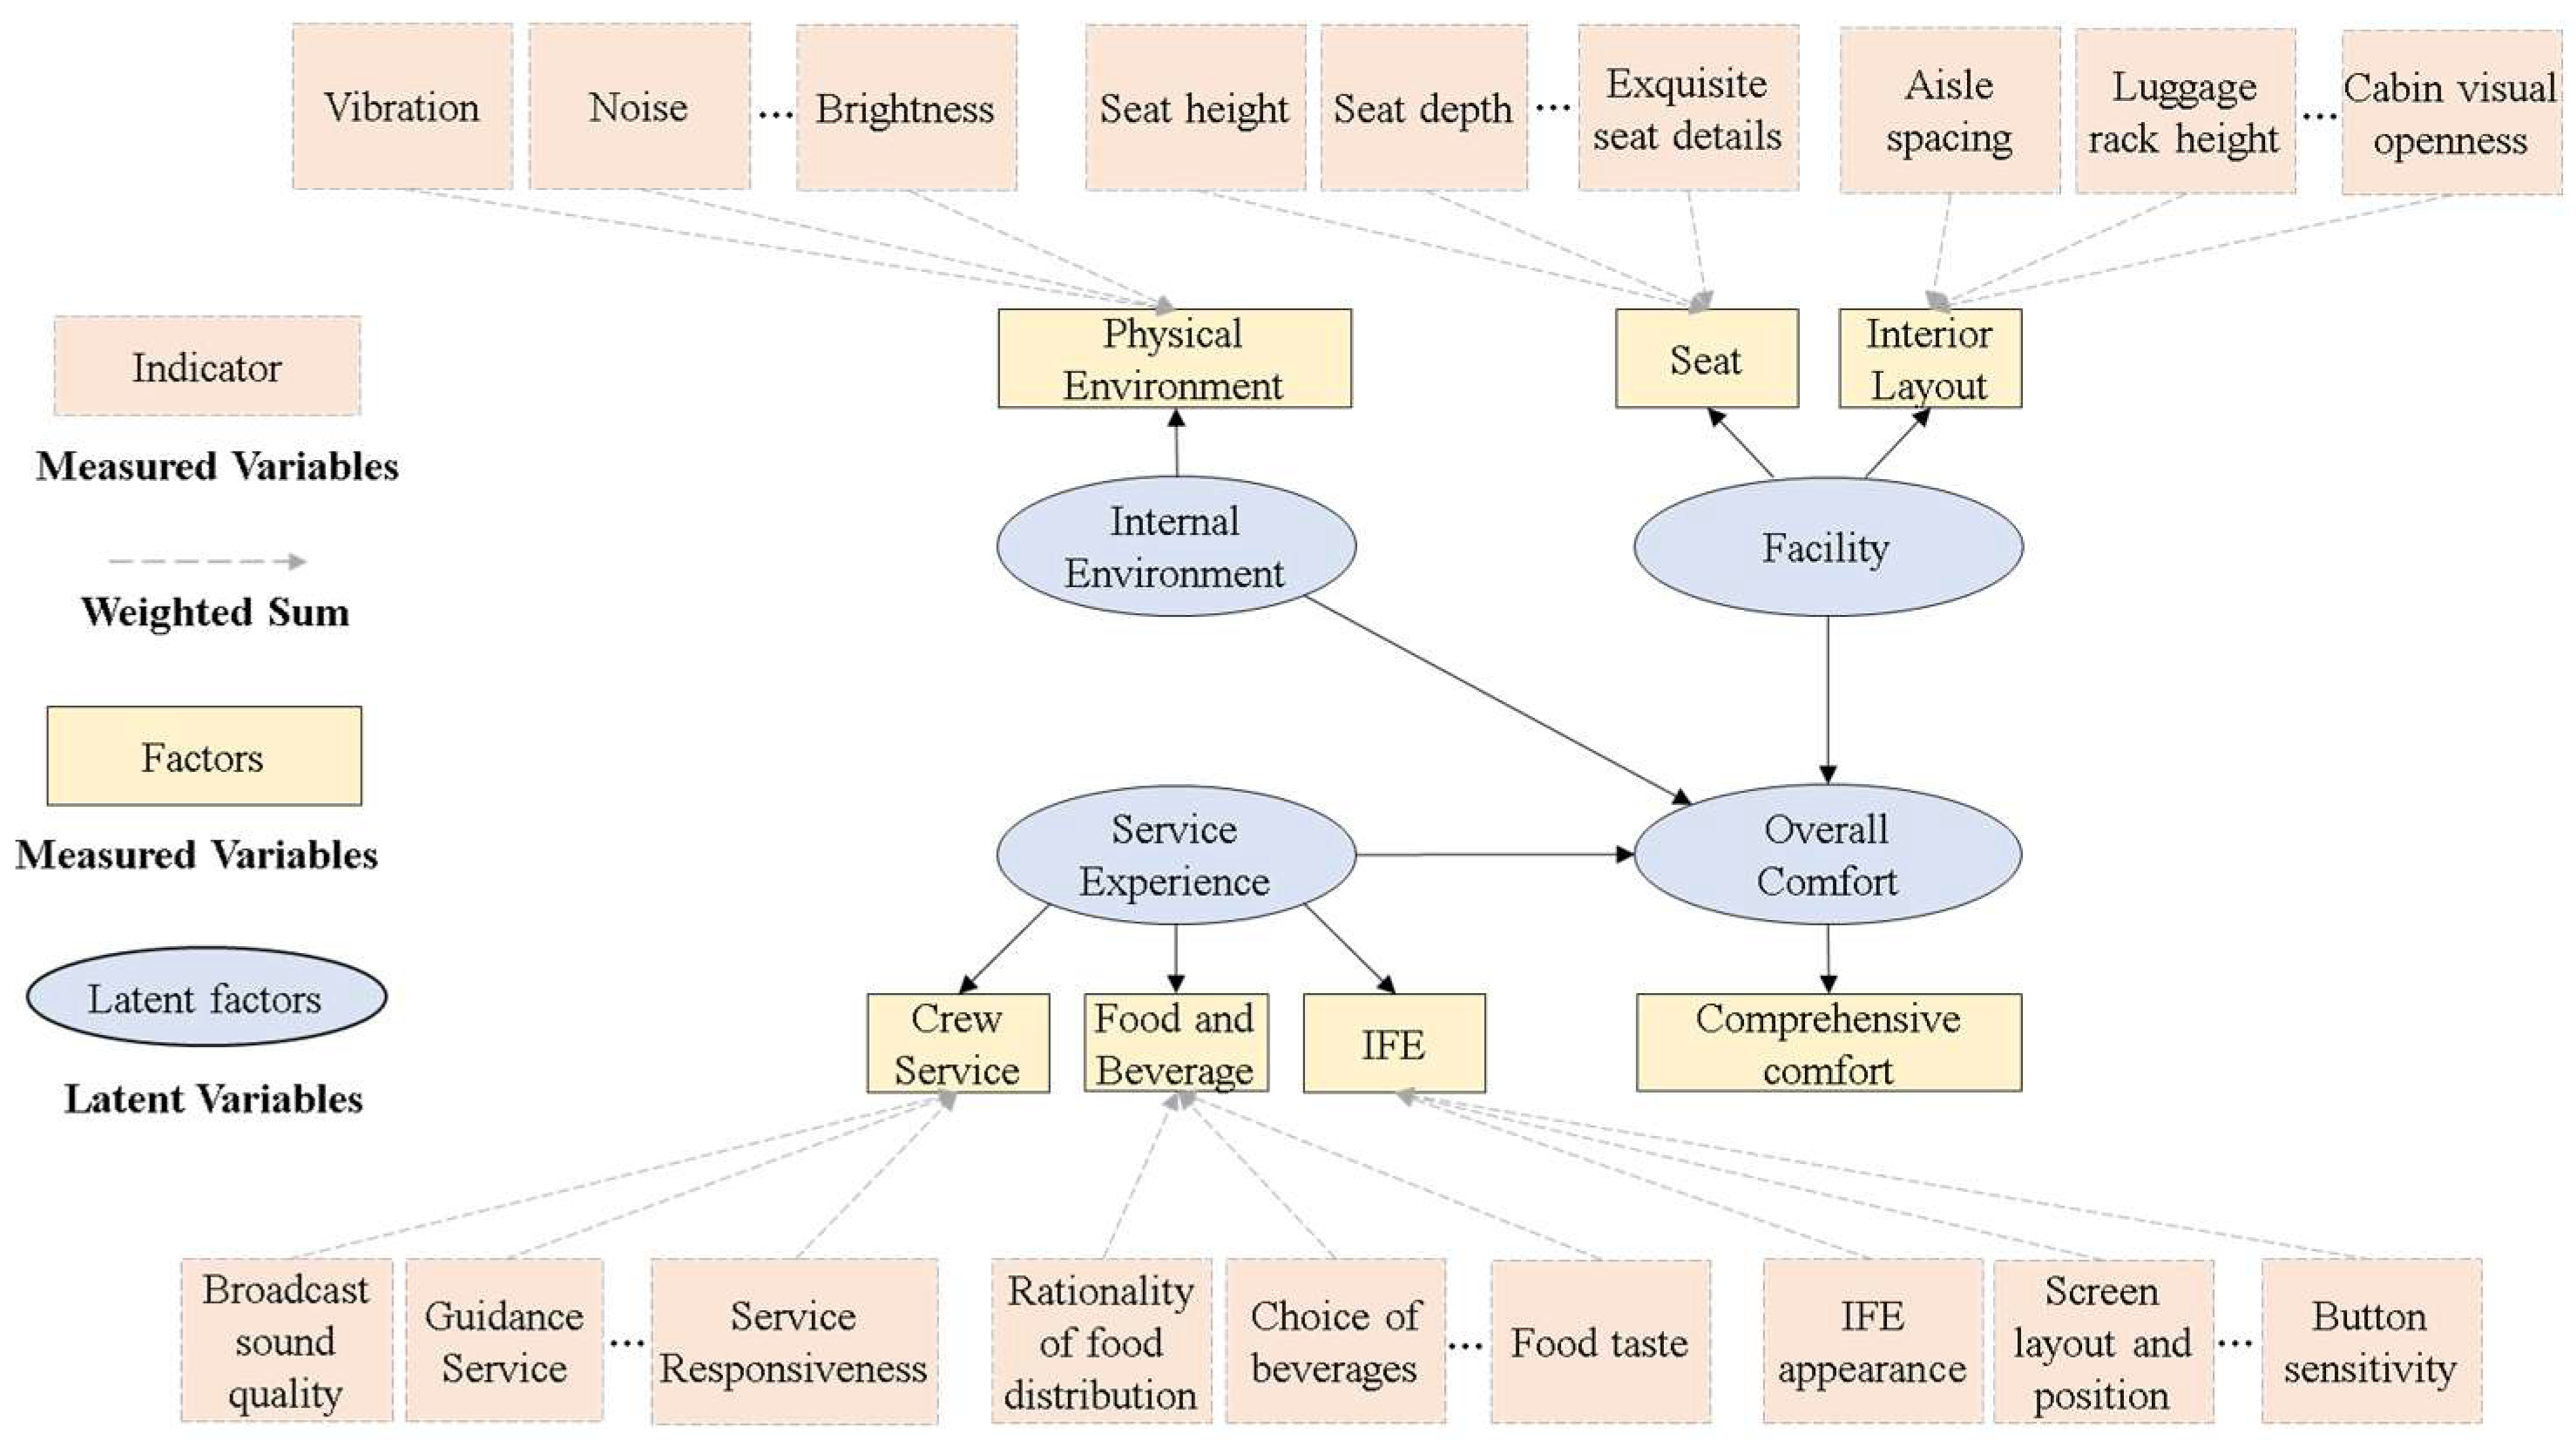
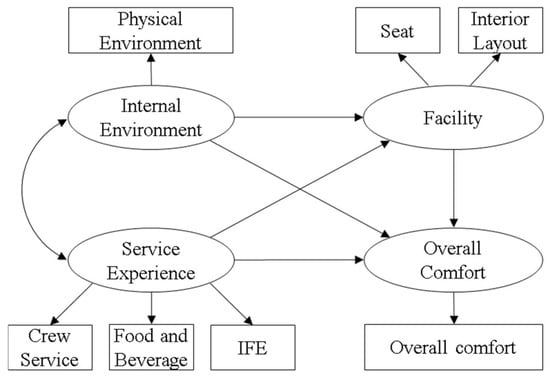
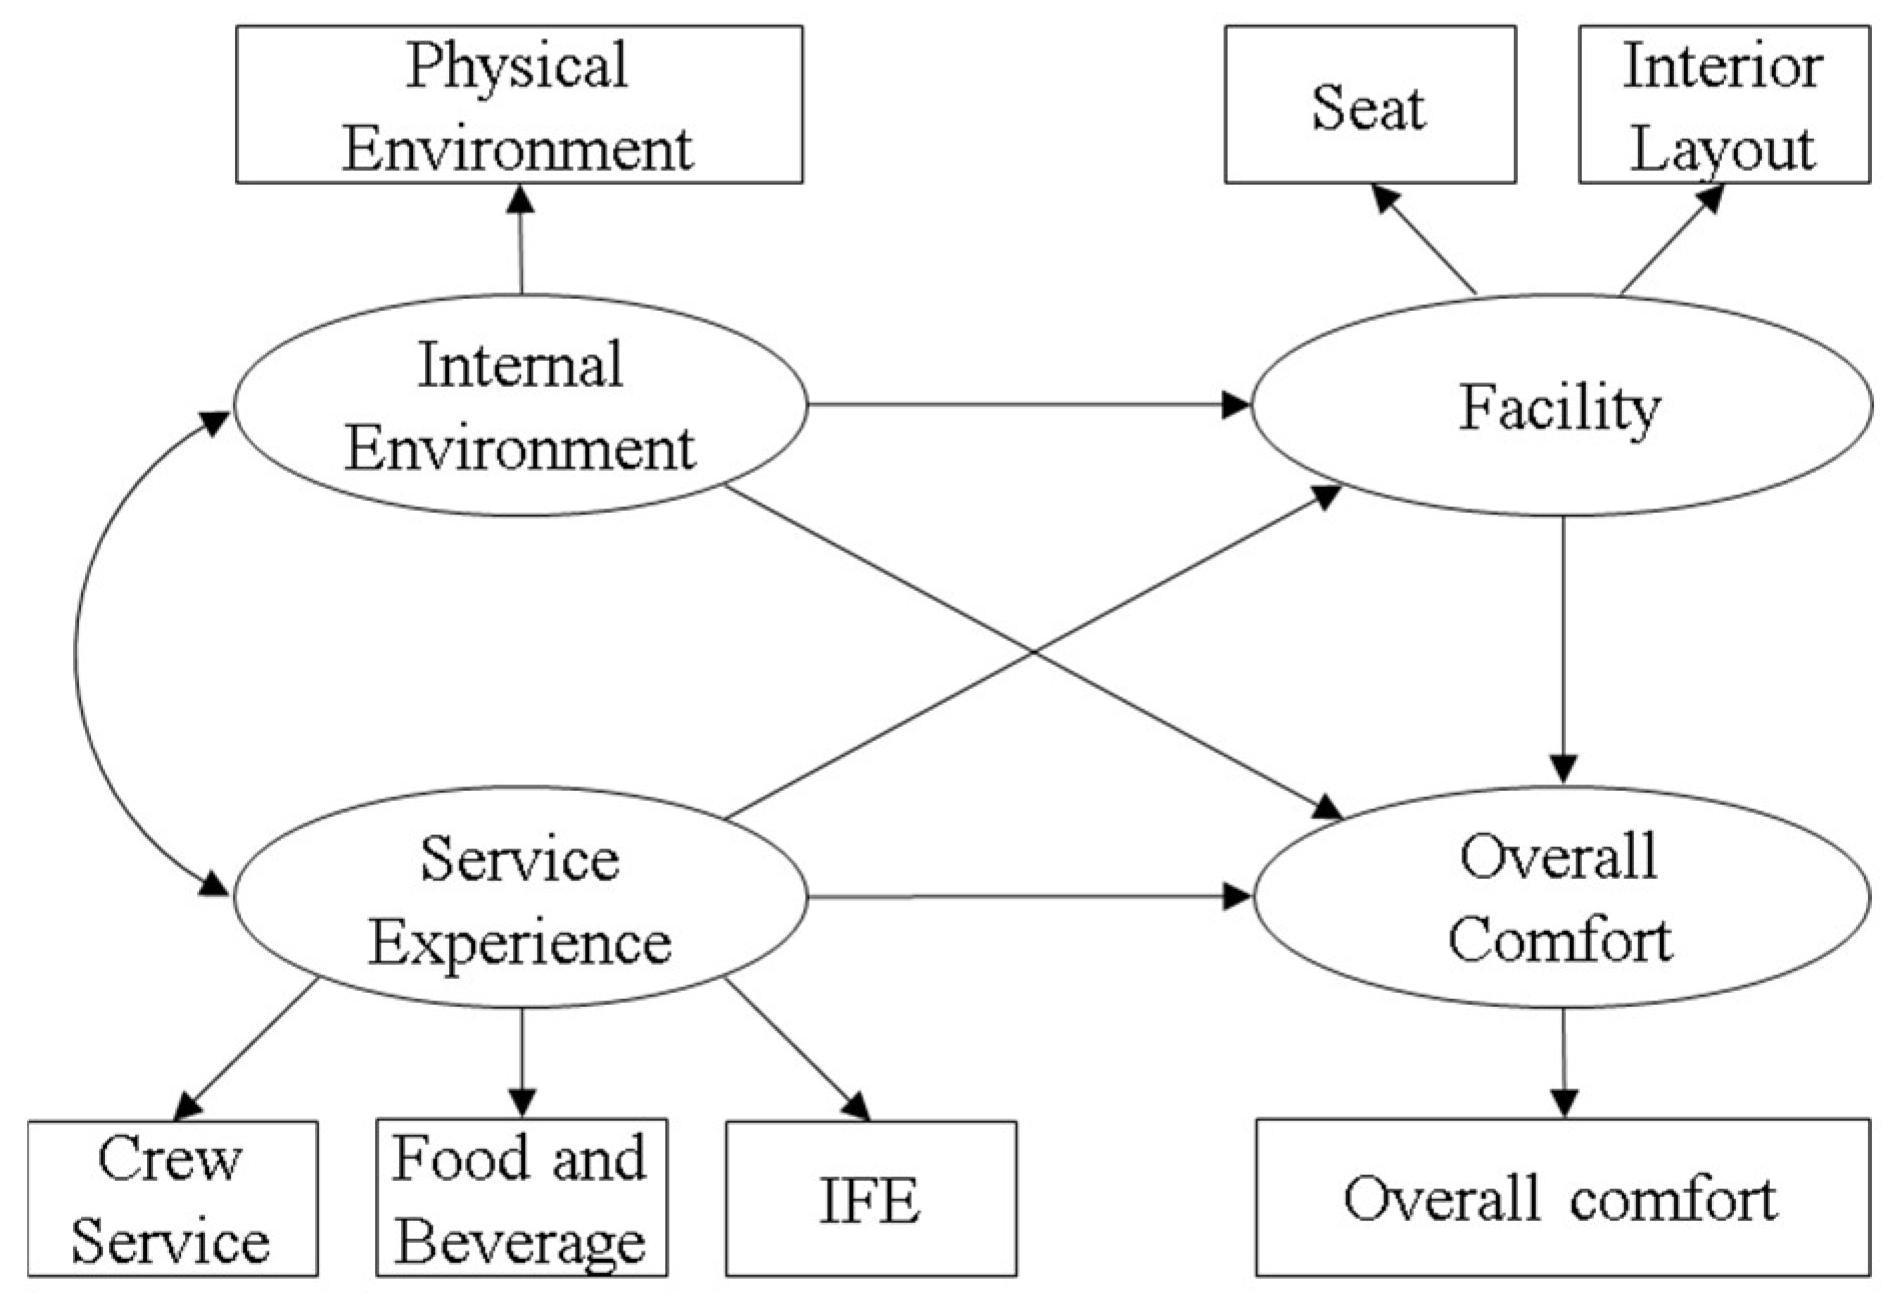
Constructing a model for overall comfort based on disassembled indicators would result in several variables and a complex structure. Some first-order measurement model factors (such as food and beverage, crew service, and IFE) are highly correlated. To simplify the model and ensure theoretical consistency, a second-order measurement model was proposed, incorporating indicator-factor-latent factors. Latent factors included internal environment, facilities, and service experience (Figure 2). In this model, indicators are the directly measured variables, while factors and latent variables are inferred and cannot be directly observed through the questionnaire. A list of cabin indicators, factors, and latent factors are shown in Appendix A.
Figure 2.
Second-order measurement model of the overall comfort of civilian aircraft cabins.
- (2)
- Transformation of latent variables into measurement variables
To simplify the structure, second-order measurement indicators were weighted and aggregated to form composite scores for each factor. Passengers perceive overall comfort as a holistic psychological state, with varying contributions from different cabin attributes. According to Expectancy-Value Theory, the impact of each attribute on overall satisfaction is a function of both its performance (satisfaction score) and its subjective importance to the individual [7,23]. This method ensures that critical factors (e.g., legroom) influence the overall comfort score more than less important factors. Thus, we employed a weighting procedure based on importance scores. This transformation ensures that the resulting composite variables accurately reflect the passenger’s value system, thereby enhancing the ecological validity of the subsequent SEM analysis. The aggregation procedure is defined as follows:
Let denote the m-th latent factor which contains measurement indicators, denoted as I. The set is defined as = {, …, }. Let W denote the weight derived from the importance survey, and P denote the satisfaction score from the survey.
First, the weight of each measurement indicator () is calculated based on its mean importance score () relative to the sum of importance scores for all indicators in that factor:
Next, the composite comfort score () for the latent factor for each respondent is calculated by summing the weighted satisfaction scores of the indicators:
Following this procedure, the internal environment and other specific sub-factors were transformed into observed composite variables. Consequently, the second-order measurement model was simplified into a first-order structure comprising factors and latent constructs.
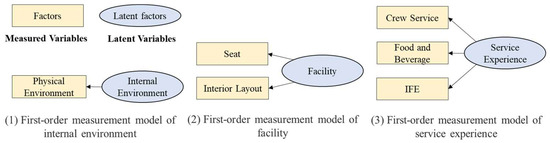
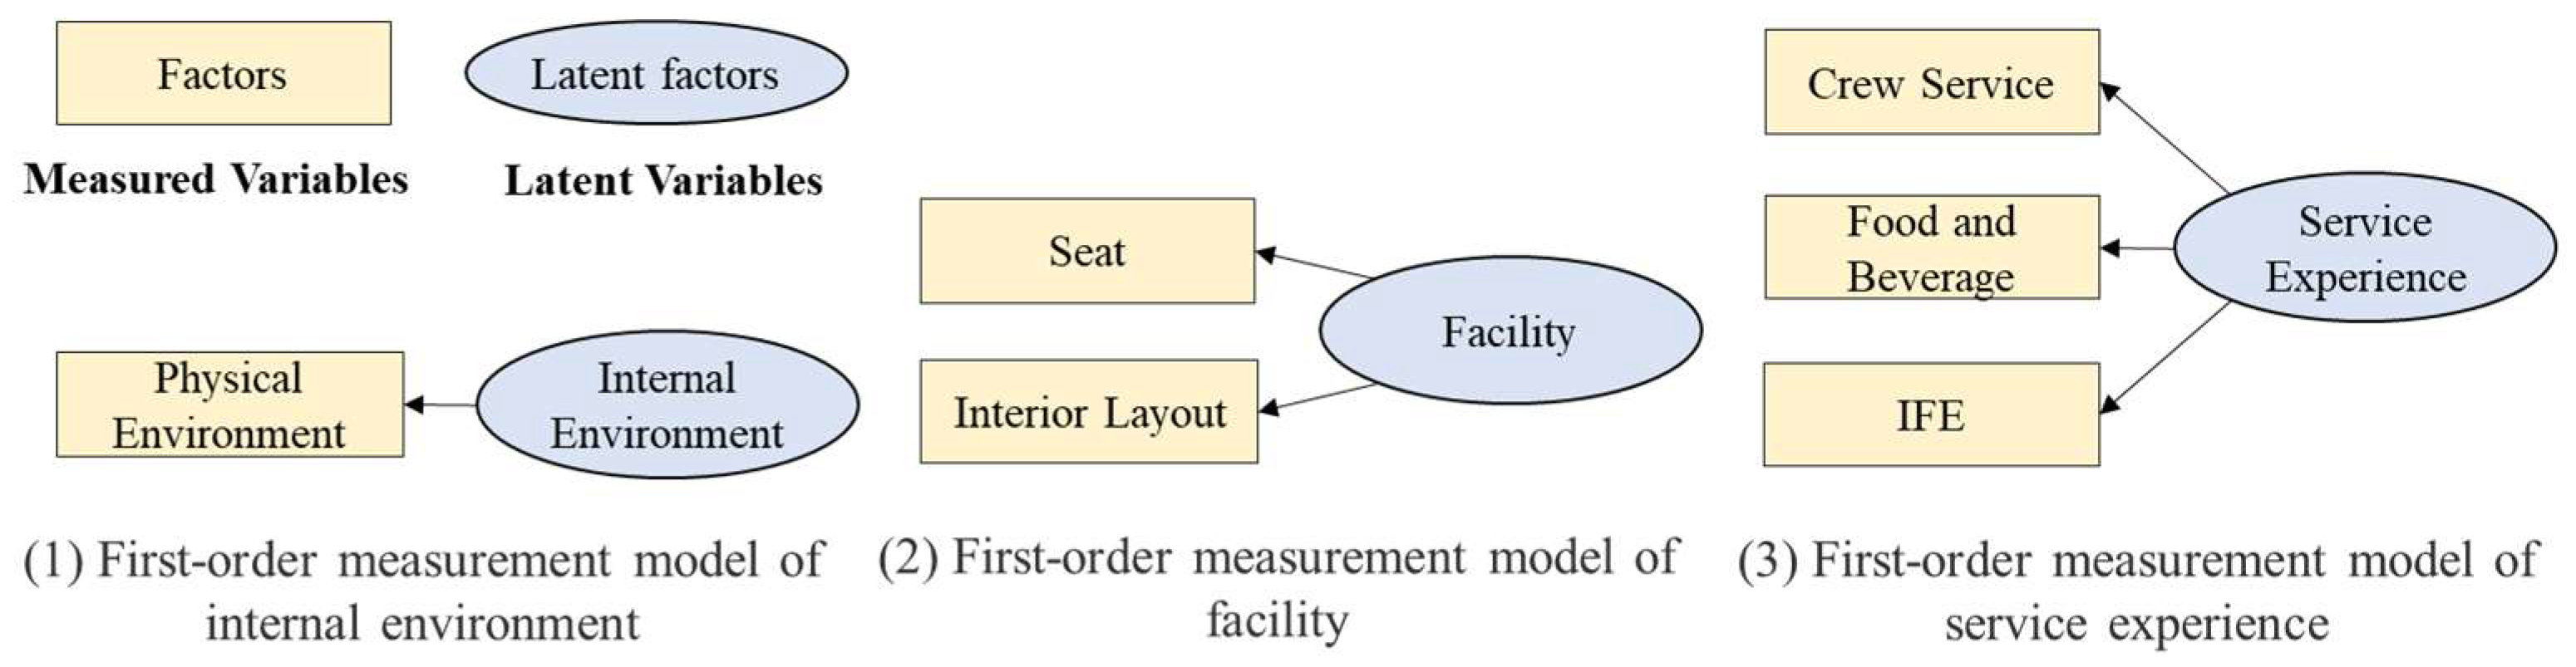
After the factors in the second-order measurement model were transformed from latent variables into measurement variables, the second-order measurement model was transformed into the first-order measurement model factor-latent factor, whereas the internal environment of the latent variables only included one measurement variable: physical environment. The latent variable facility includes two measurement variables: seat and interior layout. The latent variable service experience includes three measurement variables: crew service, foods and beverages, and IFE (Figure 3). The measurement model in Figure 3 includes basic characteristics of overall comfort. The hierarchical structure model of factors influencing overall comfort in civil aircraft is shown in Figure 4.
Figure 3.
Variables of the overall comfort model.
Figure 4.
Hierarchical structure model of factors influencing overall comfort in civil aircraft.
2.3. Construction of Overall Comfort Model for Civilian Aircraft Cabin
2.3.1. Initial Model Construction
SEM is a statistical method used to analyze the relationships between variables based on their covariance matrix [36,37]. It allows for the examination of complex relationships, incorporating both measurement and structural models. The measurement model uses factor analysis to explore latent variables among the observed indicators, while the structural model uses path analysis (including multiple regression) to examine causal relationships between variables [38,39].
In this study, the overall comfort model for civilian aircraft cabins was developed by combining the weighted multi-level measurement model and path analysis methods. The primary objective was to construct relationships between the internal environment, facilities, and service experience, and their impact on overall comfort. The initial hypothesized model was proposed based on these relationships (Figure 5). This model, which integrates both latent variables and observed variables, serves as the foundation for understanding how various factors contribute to overall comfort.
Figure 5.
Initial hypothetical model of the overall comfort of civilian aircraft cabins.
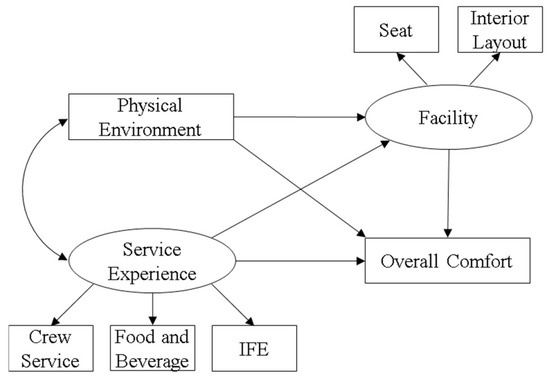
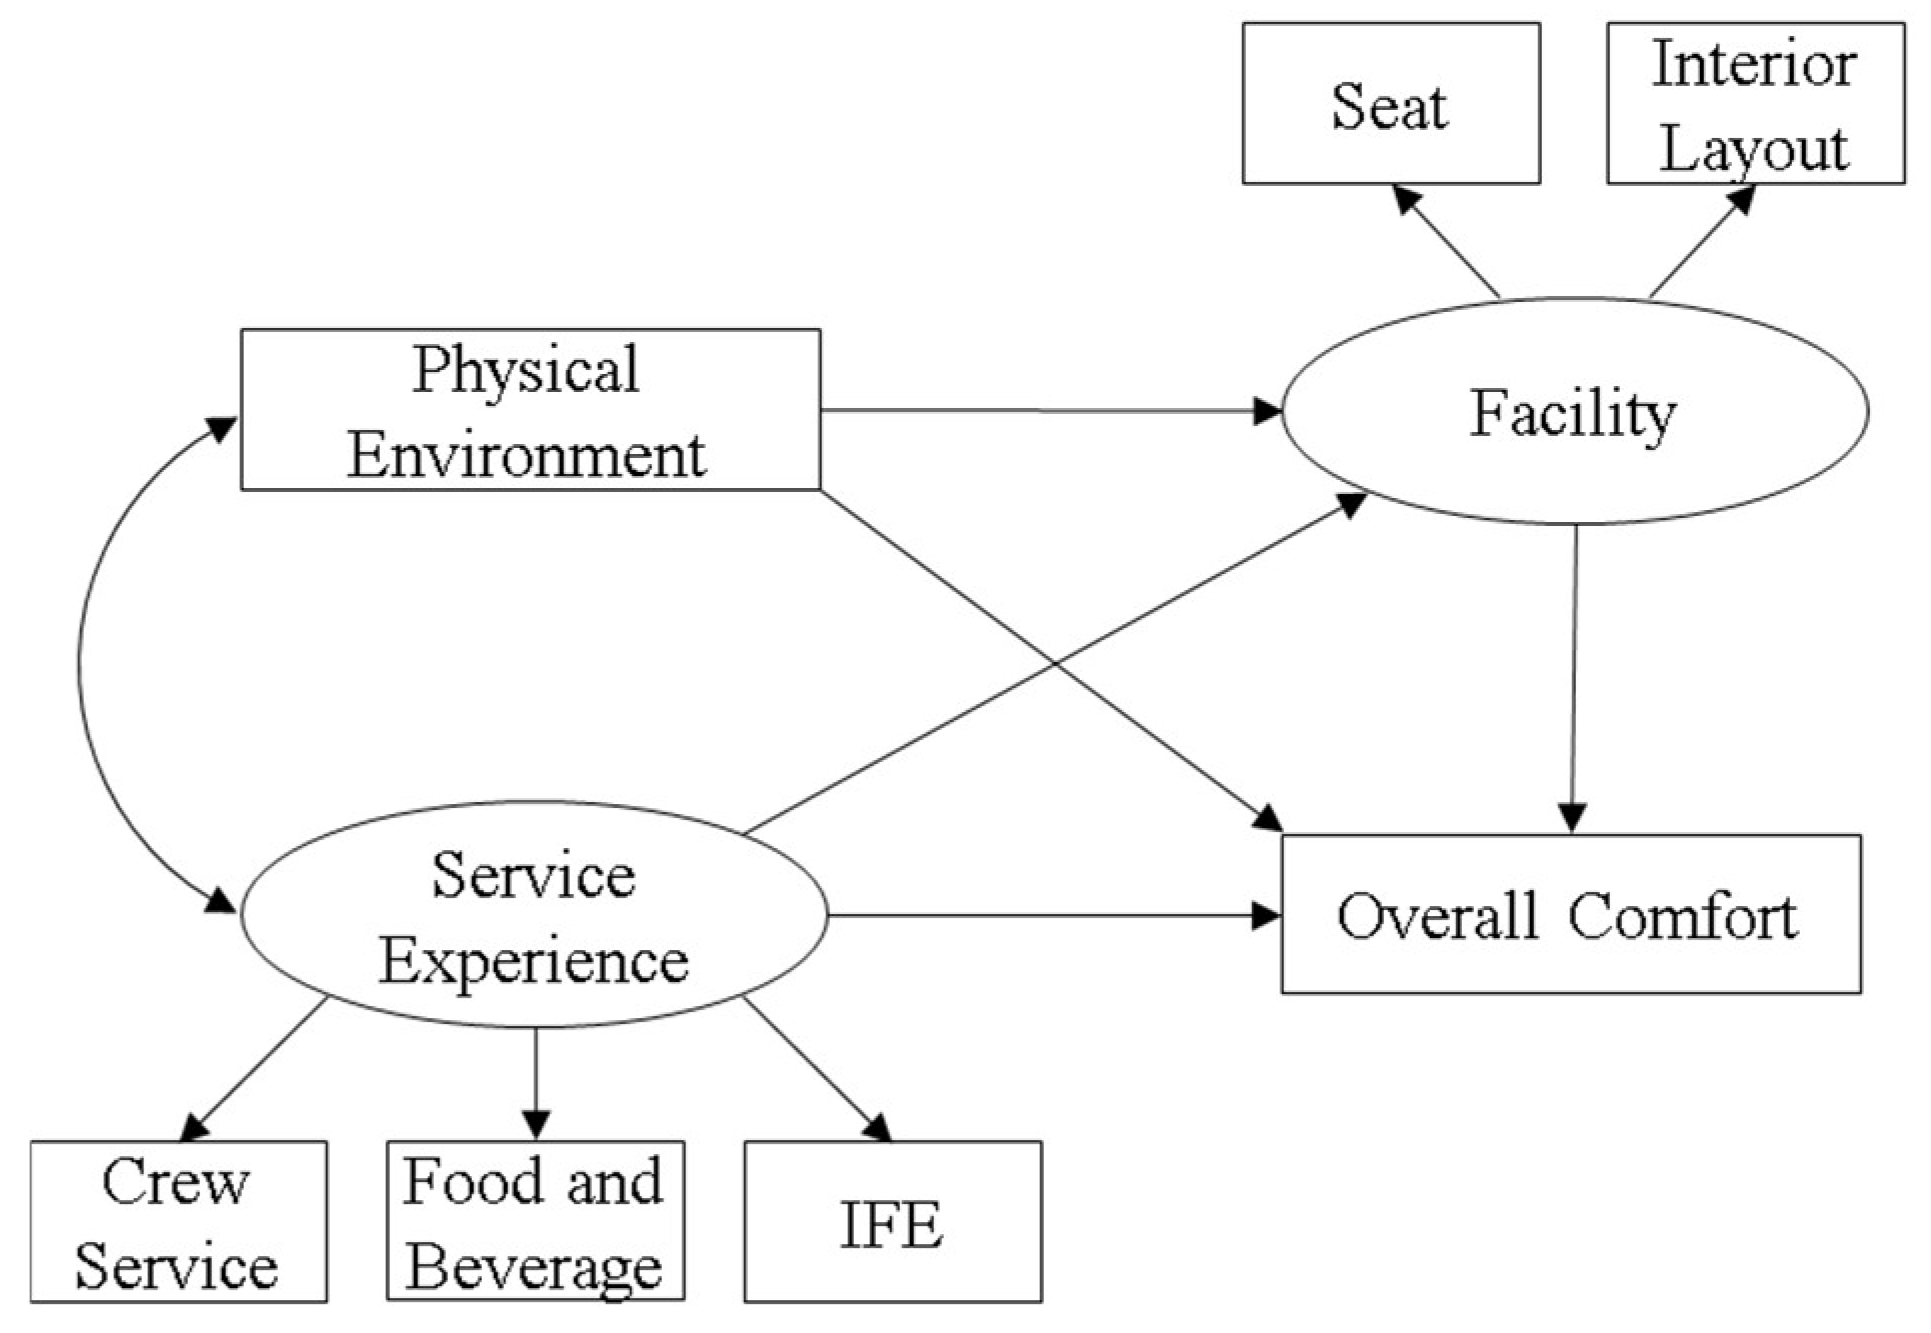
In this model, the internal environment is treated as an observed composite variable derived from weighted indicators (as described in Section 2.2.2). Facilities and service experience are modeled as latent constructs, measured by their respective sub-factors (Such as facilities are measured by seat and interior layout). Overall comfort is treated as a single-item observed variable directly obtained from the overall satisfaction question in the survey. This hybrid approach (Figure 6) allows for a comprehensive yet parsimonious estimation of the structural relationships among comfort factors.
Figure 6.
Hybrid path analysis model for the overall comfort of civilian aircraft cabins.
2.3.2. Model Test
Once the measurement model was validated, the structural relationships within the overall comfort model were tested. The model fit was evaluated using several fit indices, including Chi-square (χ2), the ratio of Chi-square to degrees of freedom (χ2/df), Goodness-of-Fit Index (GFI), Comparative Fit Index (CFI), and Root Mean Square Error of Approximation (RMSEA). The following criteria were used to assess the model fit: χ2 should not be statistically significant (p > 0.05), χ2/df should be less than 2, GFI and CFI should be greater than 0.9, and RMSEA should be less than 0.08 [40,41].
Following the measurement model validation, the structural relationships within the overall comfort model were tested. Model fit was evaluated using multiple indices: Chi-square (χ2), the ratio of Chi-square to degrees of freedom (χ2/df), Goodness-of-Fit Index (GFI), Comparative Fit Index (CFI), and Root Mean Square Error of Approximation (RMSEA). The criteria for an acceptable fit are listed in Table 2. The structural model analysis focused on decomposing effects into direct, indirect, and total effects to elucidate the mechanisms influencing overall comfort.
Table 2.
Fitting indices of the model.
2.4. Multigroup Analysis of Overall Comfort Model
The overall fit of the model reflects the survey data, but the imbalance in sample sizes and survey items presents challenges in assessing the generalizability of the model. Therefore, it was necessary to determine whether the model applies to various subgroups, such as different aircraft types (wide-body and narrow-body) and flight distances (short, medium, and long haul). In the present study, multigroup analysis was conducted to evaluate the validity and stability of the overall comfort model across these groups. Multigroup analysis allows for evaluating whether a model suitable for one group is also applicable to other groups. By comparing groups based on aircraft types and flight distances, this analysis helps to assess whether the model can be generalized across different conditions [42,43].
2.4.1. Model Cross-Group Validity Test
The path map of the overall comfort model was created using AMOS Graphics™ 22, with group variables added to form a multigroup model with unrestricted parameters. Several restricted models were tested, including models with equal measurement weights, structural weights, structural variables, and structural residuals. These parameter restrictions helped assess the validity of the model across different groups. The maximum likelihood method was used to fit the multigroup models, and model fit was assessed using the same indices as for the initial model. If the fit indices meet the recommended criteria (Table 3), the hypothesis of cross-group invariance is supported, indicating that the model structure is valid across different subgroups.
Table 3.
Overall fit index and standards of the multi-group model.
2.4.2. Model Cross-Group Stability Test
After confirming the validity of the parameter-unrestricted model, the stability of the model was tested by comparing it with restricted models (e.g., models with equal measurement weights, structural weights, and residuals). The significance of Chi-square differences (Δχ2) between the baseline and restricted models, along with the absolute difference in incremental fit indices, was analyzed to test model stability. If no significant differences were found, the model path coefficients across groups were considered stable. The test indicators and standards are shown in Table 4.
Table 4.
Stability evaluation index of the multi-group model.
3. Results
3.1. Overall Comfort Model of Civilian Aircraft Cabin
3.1.1. Reliability and Validity Analysis of Second-Order Measurement Model
The reliability and validity of the second-order measurement model were evaluated using the reliability index (Composite Reliability, CR) and the validity index (Average Variance Extracted, AVE). The CR and AVE values for the latent variables and their respective measurement variables met the standard requirements (Table 5), indicating that the second-order measurement model is reliable and valid.
Table 5.
Reliability and validity of the second-order measurement model.
3.1.2. Fitting Quality Analysis of Overall Comfort Model
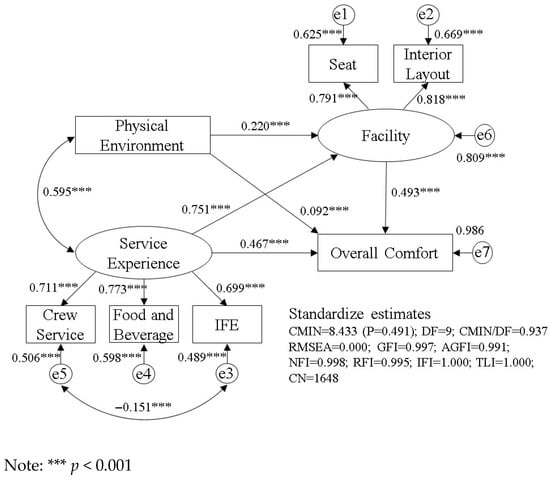
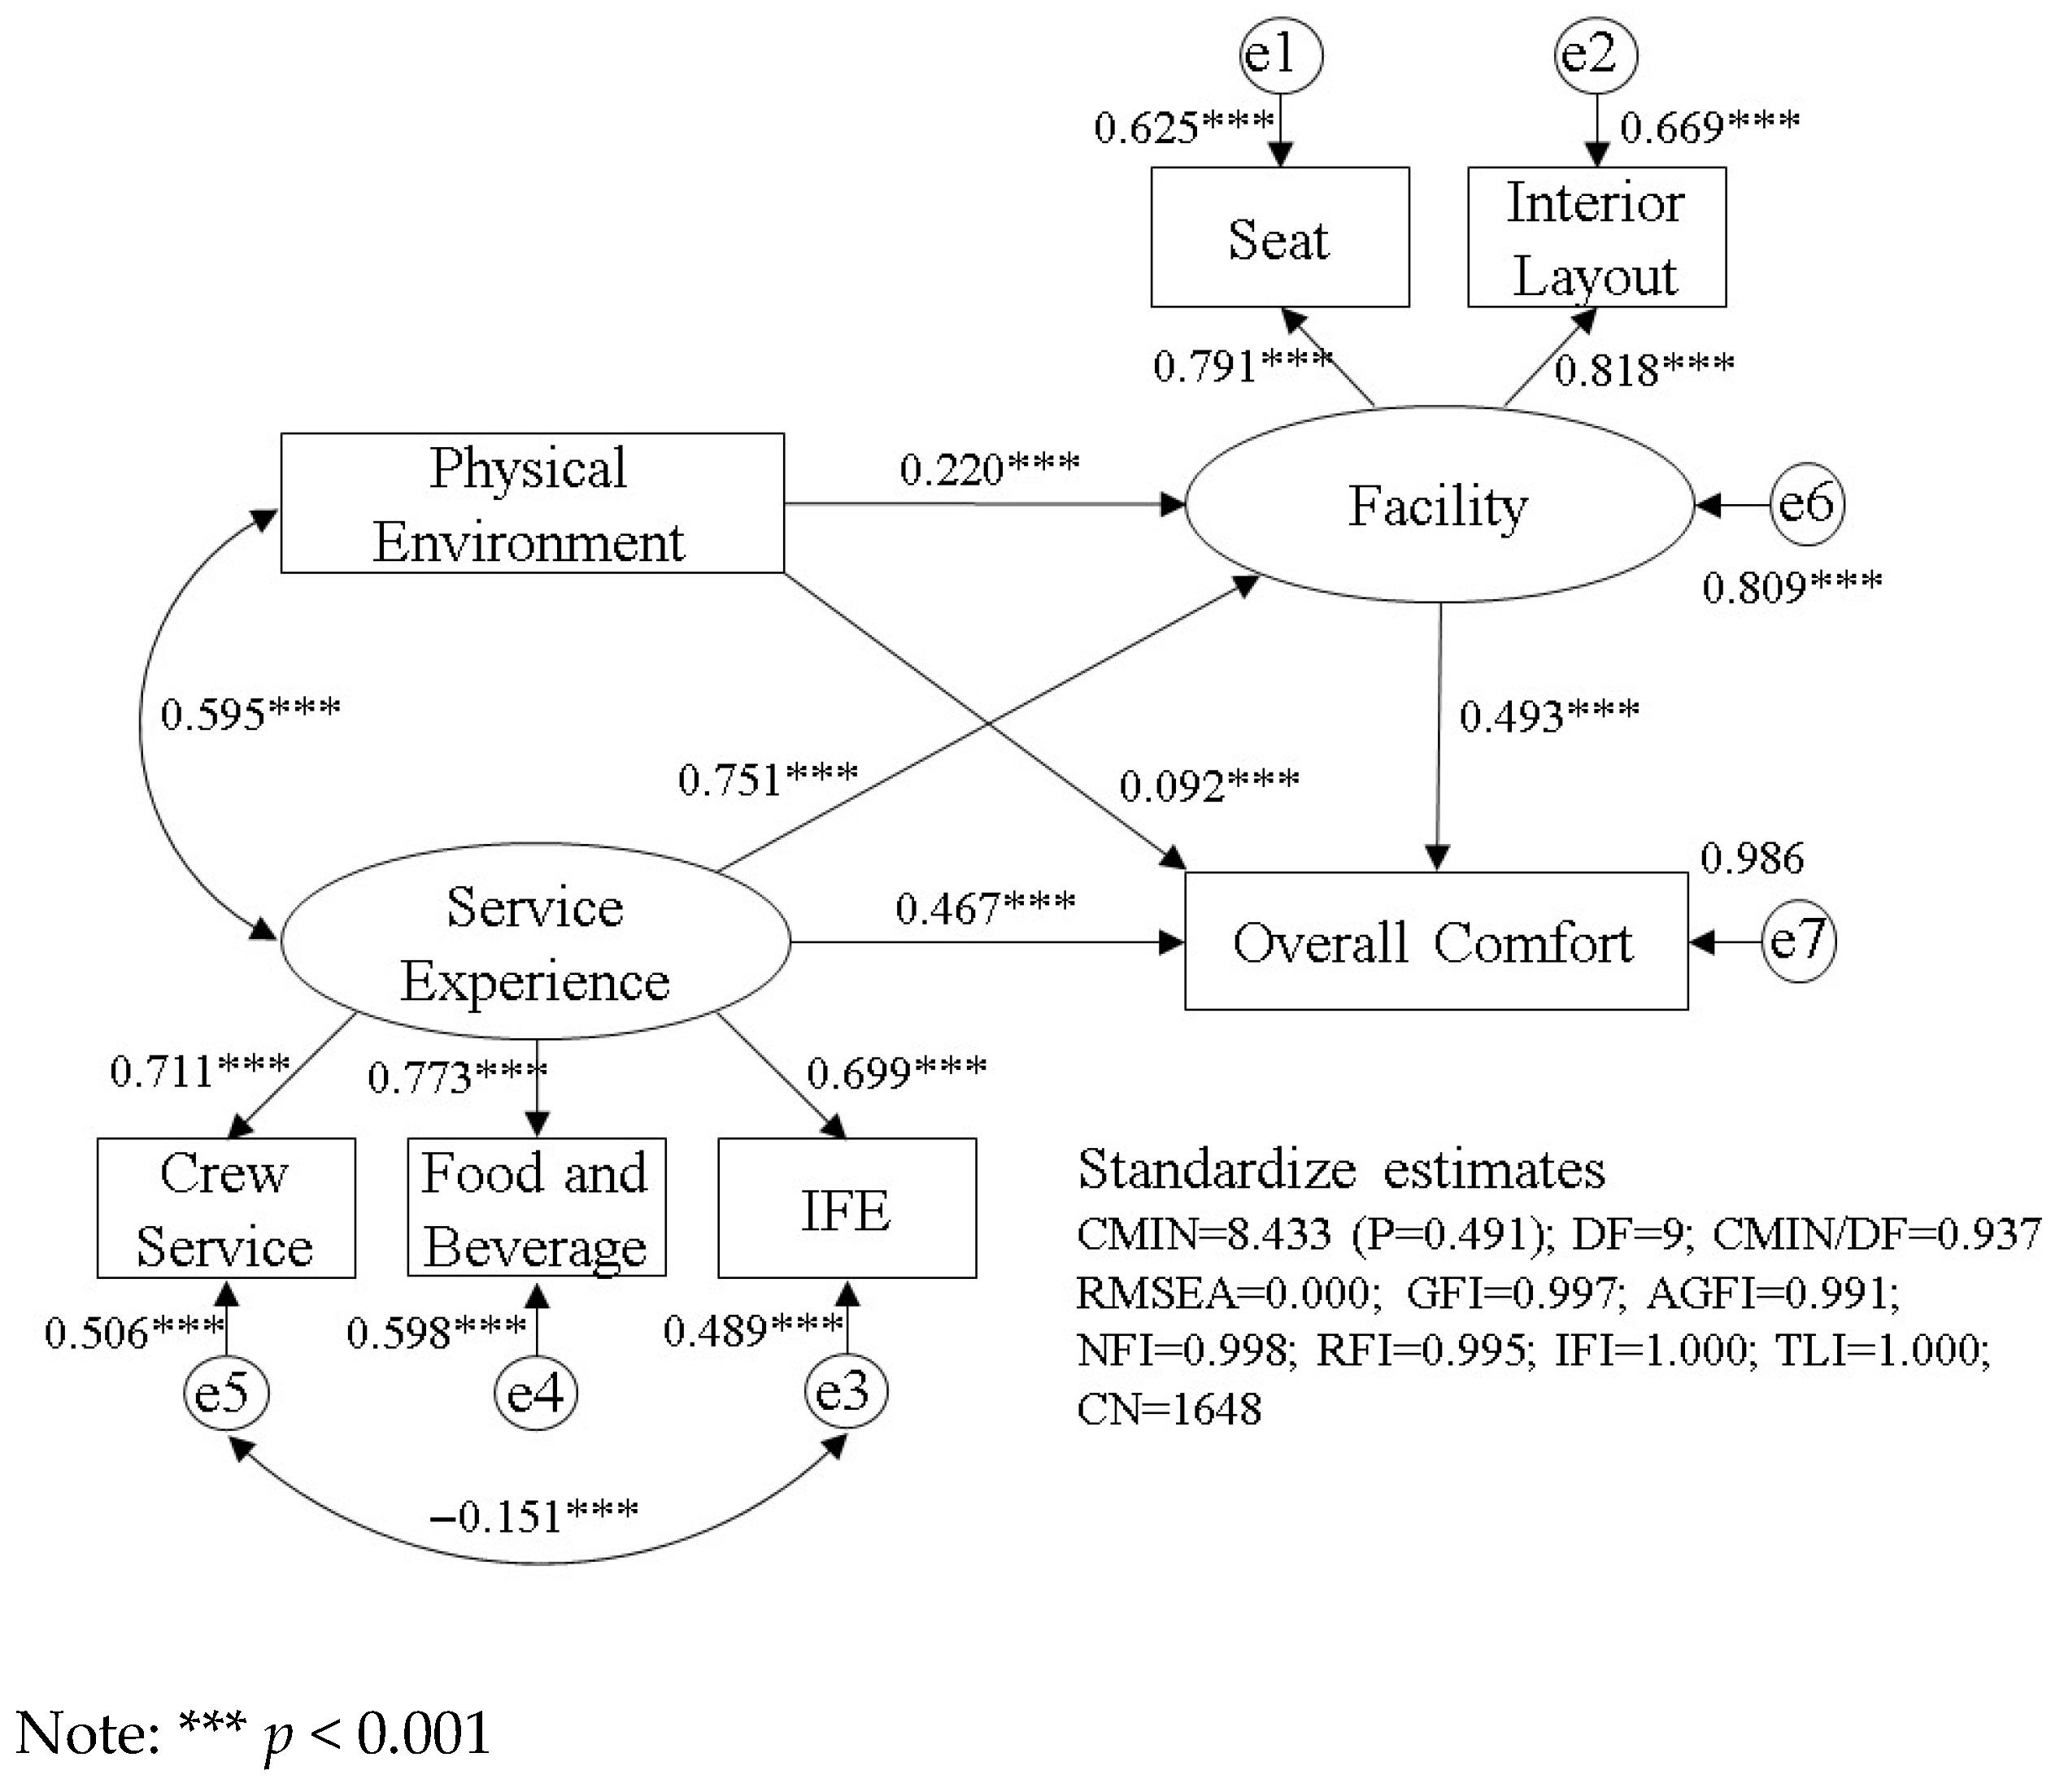
The model was fitted using the Maximum Likelihood (ML) estimation method. The fit indices showed that the model had a good fit with the data (Figure 7). Specifically, the Chi-square test (χ2) was not statistically significant (p = 0.491), and the ratio of Chi-square to degrees of freedom (χ2/df) was 1.23, which is below the acceptable threshold of 2. The Goodness-of-Fit Index (GFI) and Comparative Fit Index (CFI) were both greater than 0.95, while the Root Mean Square Error of Approximation (RMSEA) was less than 0.05, indicating that the fit between the model and the data was ideal.
Figure 7.
Comprehensive cabin comfort model and its path coefficient.
In the model, internal environment, facilities, and service experience jointly explained 98.6% of the variation in overall comfort. Further, internal environment and service experience jointly explained 80.9% of the variation in facility.
The analysis of the model’s effects shows that Facilities have the greatest direct effect on overall comfort (0.493), while Service experience has the greatest total effect (0.837). The substantial indirect effect of service experience on overall comfort, mediated by facilities (indirect effect = 0.370), indicates the importance of service-related factors in enhancing passenger comfort Table 6). Among service experience factors, food and beverage had the most significant contribution, followed by crew service and IFE.
Table 6.
Effect values of latent variables of overall comfort of the civilian aircraft cabin.
3.2. Test of Overall-Comfort-Model Validity and Stability
3.2.1. Cross-Aircraft Type Validity and Stability Analyses of Overall Comfort Model
Aircraft type (wide-body aircraft, narrow-body aircraft) was used as the group variable. The overall fitness index of the multigroup model is shown in Table 7.
Table 7.
Summary of overall fit index of the cross-aircraft validity test of the comprehensive cabin comfort model.
The fitting index statistics of the parameter-unrestricted model showed that χ2 was not statistically significant (p = 0.484), GFI, AGFI, NFI, RFI, IFI, TLI and CFI were greater than 0.95, and RMSEA was less than 0.05, suggesting that the fitting quality of the aircraft-type-unrestricted model is ideal. Specifically, the parameter-unrestricted model has cross-aircraft validity. The fitting index statistics of four parameter-restricted models—the measurement weights model, structural weights model, structural covariances model, and structural residuals model—all meet the model adaptation standards, suggesting that four parameter-restricted models have a good fit with the sample data. However, the fitting index statistics of the measurement residuals model showed that χ2 was statistically significant, and χ2/df was greater than 2, which does not meet the adaptation standard.
The unrestricted model was used as the baseline model. The stability of this model was tested by comparing it with the four parameter-restricted models that met the adaptation criteria. The significance of Δχ2 in all four parameter-restricted models was not significant. The absolute value of the difference in the incremental fit indices (ΔNFI, ΔRFI, ΔIFI, ΔTLI) was less than 0.05 (Table 8). Results suggest that there was no significant difference between the four parameter-restricted models and the parameter-unrestricted model. Therefore, the overall comfort model is the same for wide-body and narrow-body aircraft.
Table 8.
Summary of differences between parameter restricted and unrestricted models.
3.2.2. Cross-Distance Validity and Stability Analyses of Overall Comfort Model
The flight distance (short distance, medium distance, and long distance) was used as a group variable to determine whether the overall comfort model differed by flight distance. The overall fitness index between the multigroup model and the sample data is shown in Table 9.
Table 9.
Summary of overall fit index of cross-distance validity test of the comprehensive cabin comfort model.
The fitting index statistics of the parameter-unrestricted model showed that χ2 was not statistically significant (p = 0.083), GFI, AGFI, NFI, RFI, IFI, TLI and CFI were greater than 0.95, and RMSEA was less than 0.05, indicating that the fitting quality of the unrestricted model to the sample data is very ideal. Specifically, the parameter-unrestricted model has cross-distance validity. However, among the five parameter-restricted models, χ2 was significant (p < 0.05). Because the significance of χ2 is affected by the sample size, further examination is conducted to determine if other fitting indices meet the criteria. Among the parameter-restricted models, the measurement residuals model (χ2/df > 2, AGFI < 0.95) and the structural weights model (AGFI < 0.95) fail to meet the fitting criteria. Consequently, these two models are excluded from consideration. The fitting indices of the other three models all satisfy the fitting criteria.
The parameter-unrestricted model was used as the baseline model. The stability of this model was tested by comparing it with the three parameter-restricted models that met the adaptation criteria. In all three parameter-restricted models, Δχ2 was significant (p < 0.05). However, as the significance of Δχ2 is affected by the sample size, like the significance of χ2, the absolute value of the difference in the value of the incremental fitting index between parameter-restricted model and parameter-unrestricted model, which is not affected by the model complexity, is considered to be the main assessment criterion. The results show that ΔNFI, ΔRFI, ΔIFI, and ΔTLI of measurement weights, structural covariances, and structural residuals are all less than 0.05 (Table 10). That is, these three parameters limit the model to be no different from the baseline model. Therefore, the model is stable. The AIC and ECVI values of the measurement weights model are the smallest, so it is identified as the best model.
Table 10.
Summary of differences between parameter restricted and unrestricted models.
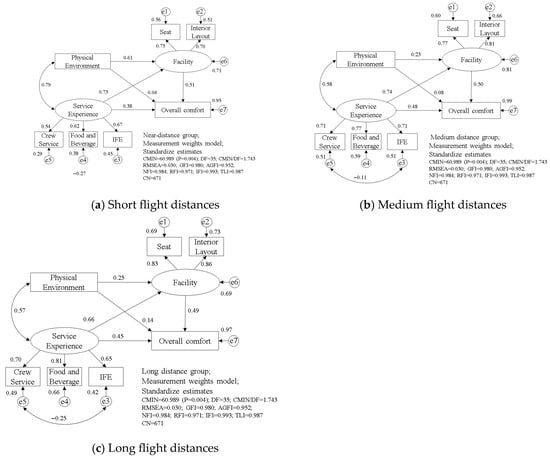
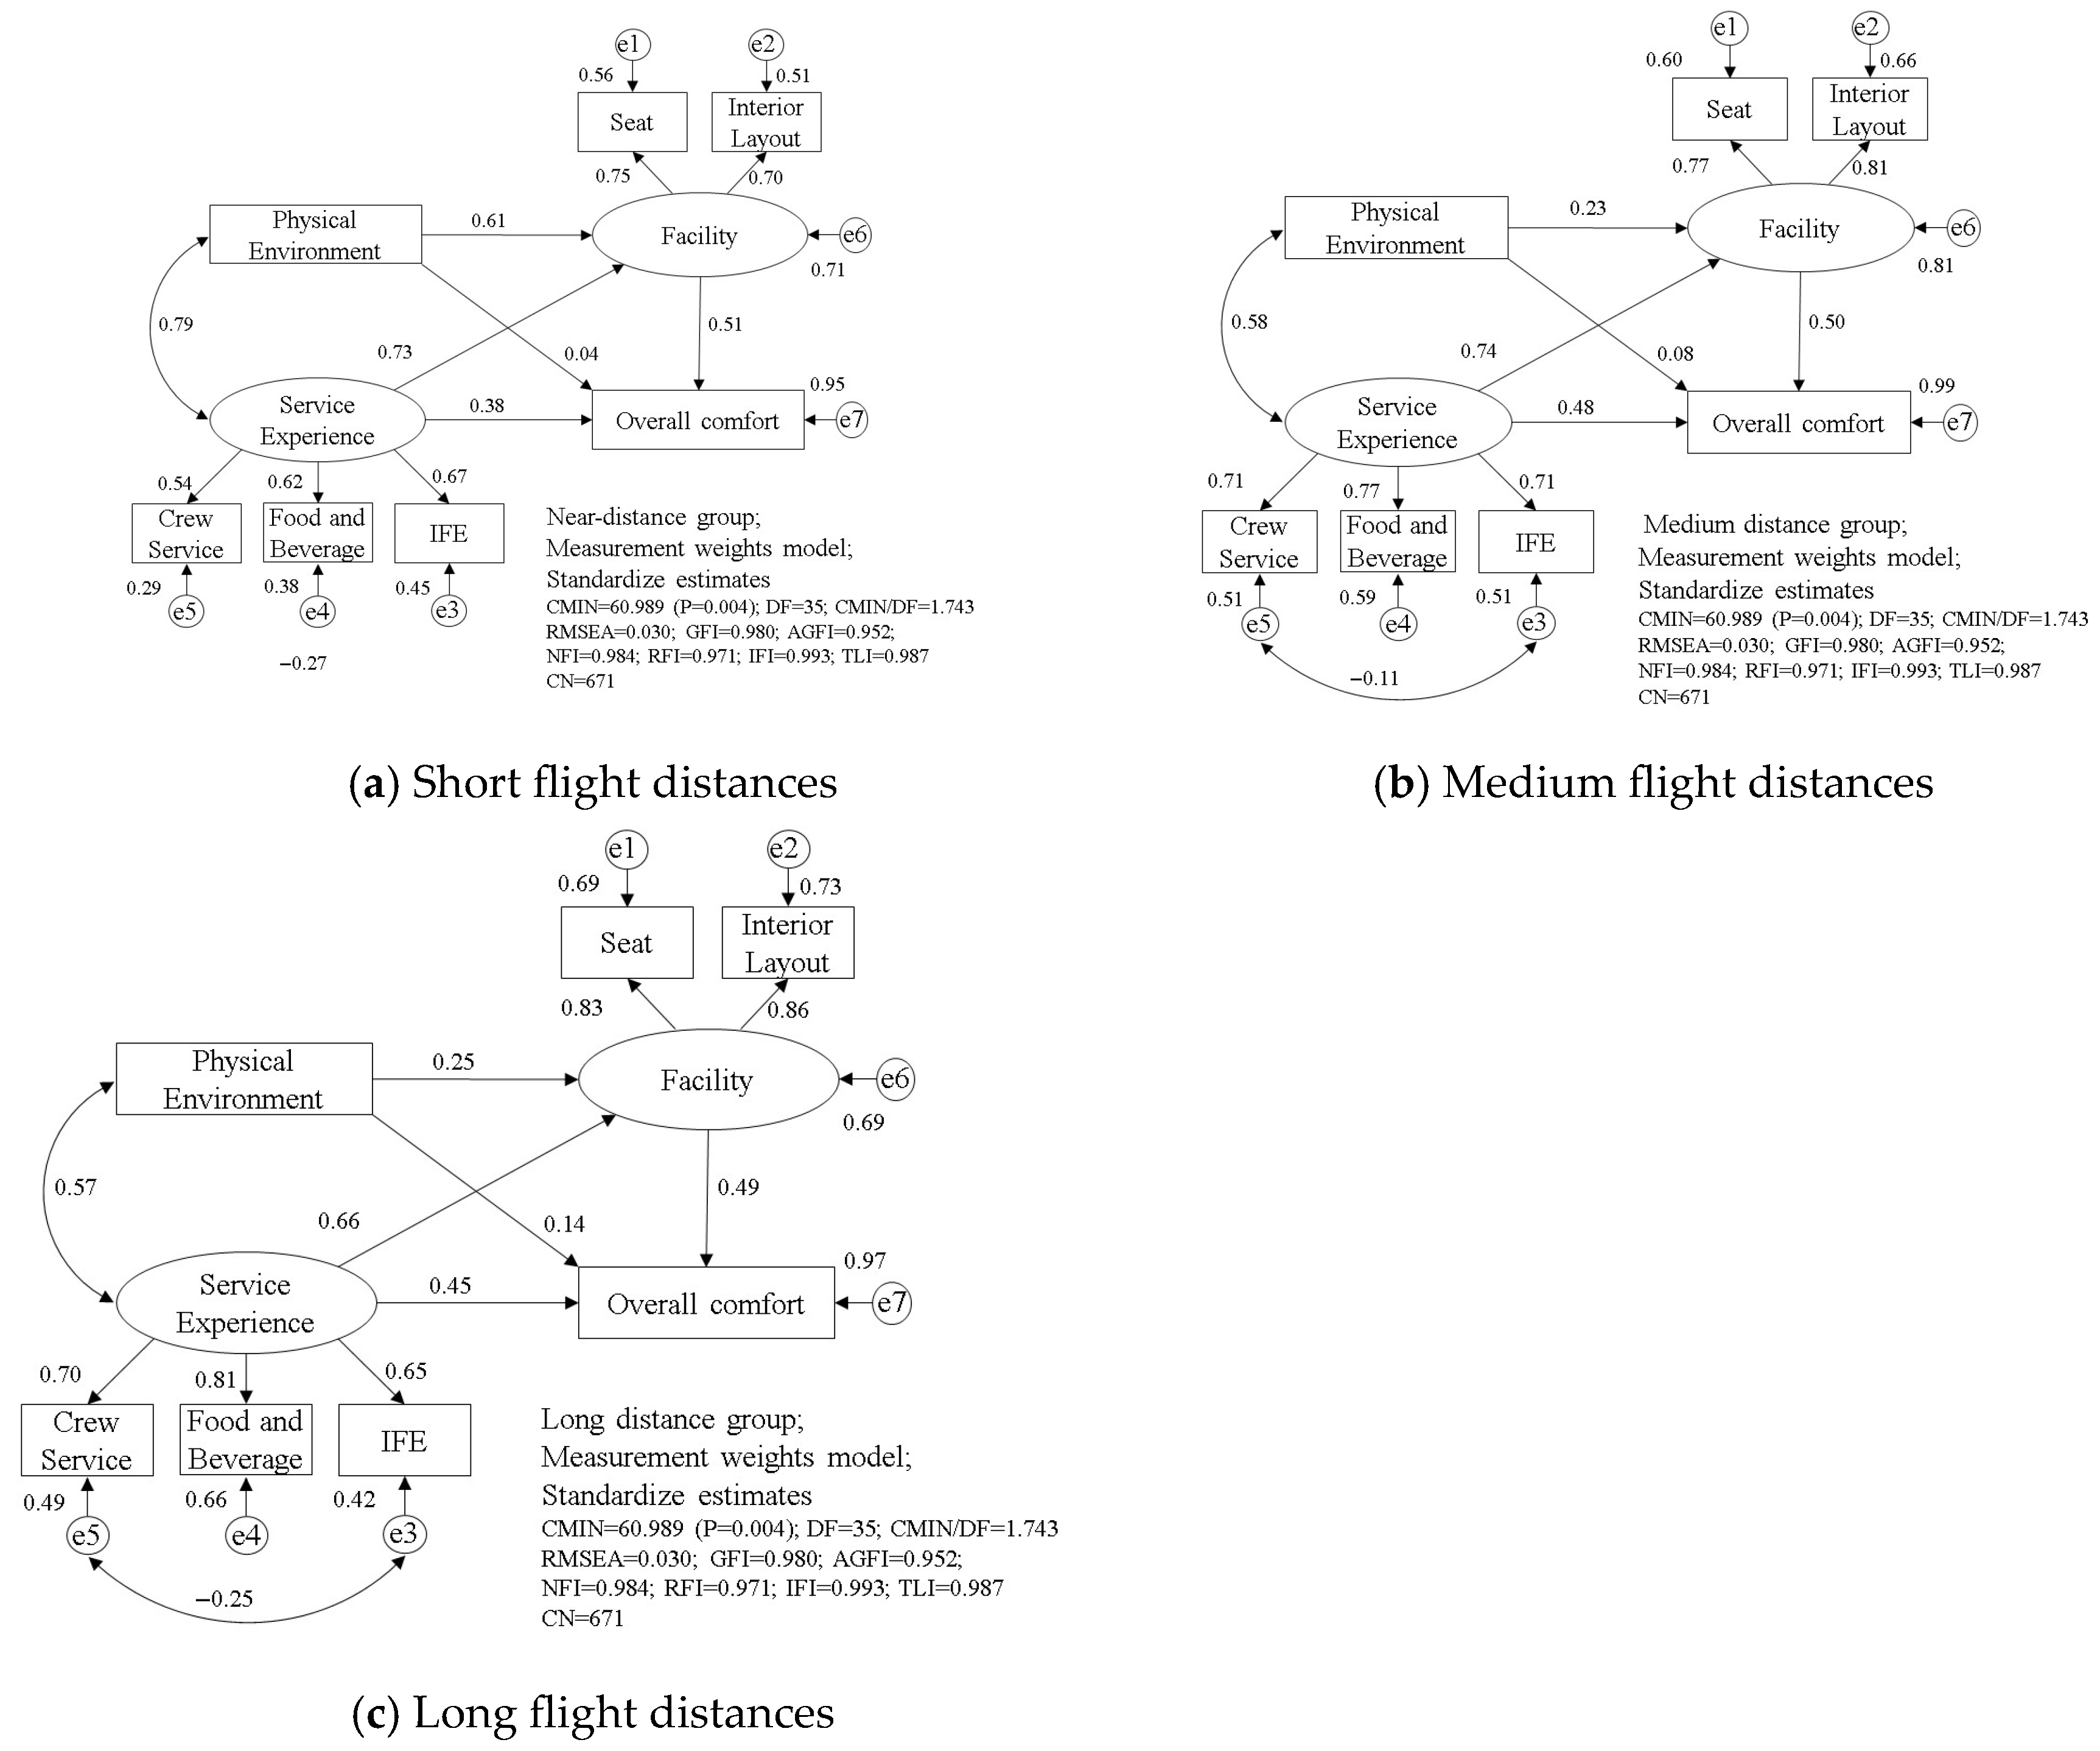
In the cross-distance group analysis, because χ2 and Δχ2 are significant, a loose cross-group stability test standard is adopted. In order to verify whether the models of the three groups of short distance, medium distance, and long distance are stable, we analyzed the short-distance, medium-distance, and long-distance grouping models in the measurement weights model, as shown in Figure 8. In addition, based on the direct effects, indirect effects, and total effects, the effects of factors influencing the overall comfort for different flight distances are compared (Table 11).
Figure 8.
Model of overall comfort across different flight distances.
Table 11.
Effect values of latent variables of overall comfort of the civilian aircraft cabin.
The results indicate that in the short-, medium-, and long-haul models, although there are differences in the direct and total effect values of cabin factors on the overall comfort, the degree of influence of cabin factors on the overall comfort, i.e., the relative importance of different cabin factors, remains unchanged. Therefore, the overall comfort model of aircraft cabins exhibits validity and stability across flight distances.
4. Discussion
4.1. Contribution and Significance of Research
This study contributes significantly to the literature on public transport comfort by making three key contributions. First, it introduces a weighted hierarchical measurement structure that simplifies complex comfort indicators into manageable constructs, offering a clearer framework for understanding the factors that influence overall comfort. Second, by employing a hybrid path analysis model, the study quantifies not only the direct impacts but also the indirect pathways through which comfort factors influence overall comfort. The results reveal that service experience significantly enhances overall comfort by positively influencing passengers’ perceptions of cabin facilities. Third, the study provides a robust cross-group validation, confirming the model’s stability across different aircraft types (wide-body and narrow-body) and flight distances (short, medium, and long haul). This methodological framework offers a replicable tool for identifying key optimization points in both aircraft cabin design and service management.
Furthermore, the proposed methodology is equally applicable to studies on comfort in general public transportation, including at the pre-travel, travel, and post-travel stages. It helps identify the key factors for optimizing travel comfort across various transport modes. Notably, in addition to assessing the validity and stability of the model, the cross-group analysis helps identify variations in the model’s structure and path coefficients across different subgroups, thereby enabling the development of differentiated strategies to enhance comfort for distinct passenger groups.
The method employed in this study was used to develop a comfort model for civilian aircraft cabins and to identify the critical factors influencing overall comfort. The model’s applicability can be evaluated from at least four perspectives: foundational theory, mathematical modeling techniques, empirical model characteristics, and parameter values [29,44]. The results of this study elucidate the basic features of comfort in civilian aircraft cabins by identifying the hierarchical relationships between factors and indicators that influence comfort. The study also explores the mathematical framework used to model comfort, employing a combined weighted multi-level measurement model and a hybrid path analysis model. Moreover, based on survey data, the relationships between comfort factors and their pathways were explored and verified, quantifying the effect of these factors on comfort by combining both direct and indirect effects. Ultimately, this study highlights the operational mechanisms influencing overall comfort and identifies the key factors for optimizing the passenger comfort experience.
4.2. Relationships Among Factors
The findings of this study indicate that facilities have the greatest direct impact on passenger comfort in civilian aircraft cabins, followed by service experience, with internal environmental factors having the least direct influence. However, when both direct and indirect effects are considered, service experience emerges as the most significant factor influencing passenger comfort. Specifically, service experience—which encompasses elements such as food and beverage quality, crew service, and in-flight entertainment (IFE)—has a substantial impact, surpassing the physical environment and facilities in terms of overall comfort [45]. Cabin facilities including seats and interior layout are factors with which passengers interact most frequently. This is consistent with earlier studies that emphasized the direct influence of physical factors on comfort [21,46]. However, it is important to note that internal environmental factors (such as temperature, noise, and air quality), which reflect fundamental comfort needs, are typically already standardized in air travel [11]. The transition in modern transportation, from space-oriented travel to an experience-oriented one, has led to a greater emphasis on service experience in both airline operations and passenger expectations [3].
The analysis also reveals an important mechanism: service experience and internal environment together explain 80.9% of the variance in perceived facilities. The high explanatory power of this model can be partly attributed to the weighting procedure that integrates importance scores. By incorporating these importance scores, the analysis moves beyond raw satisfaction ratings to focus on importance-weighted perceptions, amplifying the effect of high-priority factors (like service experience) and reducing the influence of less critical attributes. This approach helps provide a more accurate representation of passengers’ psychological value system compared to unweighted models. This suggests a psychological “halo effect”, where high-quality service can enhance passengers’ subjective evaluation of the physical environment. For instance, excellent catering (food and beverages) [18] and engaging IFE [47,48] can distract passengers from physical discomfort, such as from seats or cabin layout. The substantial path coefficient from service experience to facilities (0.751) quantitatively supports this interaction. Therefore, when physical optimization of facilities (such as seat pitch) is limited by economic factors, airlines can still effectively enhance overall comfort by improving service aspects—such as food quality and crew interactions—that compensate for physical constraints.
4.3. Main Influencing Factors
This study affirms that service experience has become the most important factor influencing overall comfort in civilian aircraft cabins. This result confirms the growing recognition that service-related factors now play a central role in shaping passengers’ perceptions of comfort, surpassing the impact of physical environmental factors [49]. Historically, research on cabin comfort focused on physical factors like vibration, air quality, and seating arrangement [11]. However, the anthropometry and human–machine adaptability of the cabin are increasingly being studied in current investigations. The evolution of comfort research can be conceptualized using the discomfort pyramid theory, which posits that satisfying low-level comfort needs leads to the development of higher-level comfort needs [11]. Vink and Brauer [12] also demonstrated that, in modern business competition, service factors might become the most important element.
Among the service experience factors, food and beverage had the most substantial impact on comfort, followed by crew service and IFE. The distinction between comfort and discomfort emphasizes that comfort is an additional experience—one that can be enhanced by factors like the quality of food and beverages [14]. Food and beverage services can also serve as a means of compensating for discomfort caused by other factors, such as seat discomfort. Furthermore, dining activities help alleviate the discomfort associated with prolonged sitting. Cabin crew service fulfills higher-level needs in Maslow’s hierarchy, and it plays a critical role in improving satisfaction at low cost. As competition in the airline industry intensifies, excellent crew service remains a key factor for improving passenger satisfaction [3].
With the increasing use of mobile devices, traditional IFE systems, primarily focused on audiovisual resources, have lost some of their competitive edge. However, personal IFE systems still play a crucial role in diverting passengers’ attention and alleviating boredom, especially in flights that do not offer Wi-Fi. The continuous enrichment and updating of entertainment sources are vital to keeping this service effective and engaging for passengers [47,48].
4.4. Limitations
In the multigroup analysis of the overall comfort model, the model had cross-types and cross-distance validity and stability, so it can be considered that the relationship between the comfort factors of different subgroups is the same. In fact, the comfort models had different path coefficients; however, the differences were not significant.
This study explores the comfort in current traditional full-service flights, and analyzes the validity and stability of models across aircraft types and flight distances. However, the research sample does not include small aircraft used for low-cost flights or regional flights, nor does it cover flights with significant time delays. In addition, when there are upgrades or major changes to cabin facilities and services, it is necessary to use the aforementioned method to reassess the validity and stability of the model.
5. Conclusions
Comfort is a key factor in passengers’ acceptance of transportation systems. Cabin comfort has become a comprehensive experience that includes both the physiological and psychological aspects of the cabin’s physical and social environment. A thorough analysis of cabin comfort is crucial for understanding the influence of various comfort factors. This study presents a method for researching comfort based on survey-scale data analysis. The factors influencing comfort in aircraft cabins, along with their pathways and degrees of impact, were examined. The results indicate that service experience, particularly food and beverage, IFE, and crew service, has the greatest impact on cabin comfort, surpassing the influence of facilities and the physical environment. Additionally, service experience plays a substantial role in shaping overall comfort. Furthermore, the results demonstrate cross-group validity and stability for different aircraft types and flight distances. This study explains the overall comfort in civilian aircraft cabins and quantitatively models the relationships among the factors influencing comfort, providing key insights for cabin comfort design and optimization. The methodology presented also offers a valuable approach for studying comfort in public transport more broadly.
Author Contributions
Conceptualization, J.W. and J.-Y.Z.; methodology, J.W.; validation, J.-Y.Z.; formal analysis, J.W.; investigation, J.W.; data curation, J.W.; writing—original draft preparation, J.W.; writing—review and editing, J.W. and J.-Y.Z.; supervision, J.-Y.Z.; project administration, J.-Y.Z. All authors have read and agreed to the published version of the manuscript.
Funding
The study was conducted with financial support from CAAC Security Capacity Building Programs (award no. TDSA0047) and 2024 theme case (Advanced Industrial Design Cases for Intercity Transportation, ZT-2410613005).
Data Availability Statement
Restrictions apply to the availability of these data. Data were obtained from the Second Research Institute of the Civil Aviation Administration of China and are available from the first authors with the permission of the Second Research Institute of the Civil Aviation Administration of China.
Acknowledgments
The sponsors gave expert advice on the design of the questionnaire and helped coordinate the onboard questionnaire investigation.
Conflicts of Interest
The authors declare no conflicts of interest.
Abbreviations
The following abbreviations are used in this manuscript:
| IFE | In-flight entertainment |
| SEM | Structural equation model |
| CR | Composite reliability |
| AVE | Average variance extracted |
| NFI | Normed fit index |
| RFI | Relative Fit Index |
| IFI | Incremental Fit Index |
| TLI | Tucker–Lewis Index |
| GFI | Goodness-of-fit index |
| AGFI | Adjusted Goodness-of-Fit Index |
| RMSEA | Root mean square error of approximation |
| AIC | Akaike Information Criterion |
| ECVI | Expected Cross-Validation Index |
Appendix A
A List of Cabin Indicators, Factors, and Latent Factors
| Latent Variables | Measured Variables | ||
| Latent Factors | Factor | Indicators | |
| Wide-Body Aircraft | Narrow-Body Aircraft | ||
| Internal environment | Physical environment | Vibration | Vibration |
| Noise | Noise | ||
| Air pressure | Air pressure | ||
| Temperature | Temperature | ||
| Humidity | Humidity | ||
| Brightness | Brightness | ||
| Facilities | Seat | Seat height | Seat height |
| Seat depth | Seat depth | ||
| Seat width | Seat width | ||
| Backrest height | Backrest height | ||
| Backrest width | Backrest width | ||
| Maximum backrest inclination | Maximum backrest inclination | ||
| Seat pan inclination | Seat pan inclination | ||
| Leg room | Leg room | ||
| Lumbar support | Lumbar support | ||
| Neck support | Neck support | ||
| Suitable seat softness | Suitable seat softness | ||
| Handrail size | Handrail size | ||
| Small table size | Small table size | ||
| Cross profile of seat cushion surface | Cross profile of seat cushion surface | ||
| Cross profile of seat backrest surface | Cross profile of seat backrest surface | ||
| Fabric breathability | Fabric breathability | ||
| Tactile comfort of surface material | Tactile comfort of surface material | ||
| Safety belt usage | Safety belt usage | ||
| Seat gap safety | Seat gap safety | ||
| Rounded seat corners | Rounded seat corners | ||
| Structural stability of seat support | Structural stability of seat support | ||
| Small table operation | Small table operation | ||
| Handrail operation | Handrail operation | ||
| Books and newspapers rack | Books and newspapers rack | ||
| USB power supply on seat | Integral seat harmony modeling | ||
| Mobile phone and pad holder | Seat color coordination | ||
| Integral seat harmony modeling | Exquisite seat details | ||
| Seat color coordination | |||
| Exquisite seat details | |||
| Interior layout | Seat lineup | Seat lineup | |
| Spacing between front and rear seats | Spacing between front and rear seats | ||
| Aisle spacing | Aisle spacing | ||
| Luggage rack spacing | Luggage rack spacing | ||
| Luggage rack height | Luggage rack height | ||
| Easy to tow, place and retrieve luggage | Easy to tow, place and retrieve luggage | ||
| Shading plates setup and utilization | Shading plates setup and utilization | ||
| Garbage collection | Garbage collection | ||
| Cabin hygiene | Cabin hygiene | ||
| Cabin visual openness | Cabin visual openness | ||
| Cabin E-screen information tips | Cabin E-screen information tips | ||
| Conspicuous guidance information | Conspicuous guidance information | ||
| Easy identification of toilet tips | Easy identification of toilet tips | ||
| Washroom door handler height | Washroom door handler height | ||
| Washroom layout | Washroom layout | ||
| Usage of washroom toilet | Usage of washroom toilet | ||
| Washroom mirror position | Washroom mirror position | ||
| Toilet paper acquisition and discard | Toilet paper acquisition and discard | ||
| Barrier-free toilet assistance | Barrier-free toilet assistance | ||
| Integral cabin harmony modeling | Integral cabin harmony modeling | ||
| cabin color coordination | cabin color coordination | ||
| Exquisite cabin details | Exquisite cabin details | ||
| Service experience | Crew service | Newspapers & Magazines | Newspapers & Magazines |
| Broadcast Sound Quality | Broadcast Sound Quality | ||
| Captain Announcement Quality | Captain Announcement Quality | ||
| Crew Announcement Quality | Crew Announcement Quality | ||
| Guidance Service | Guidance Service | ||
| Language Affinity | Language Affinity | ||
| Active Care from Attendants | Active Care from Attendants | ||
| Service Responsiveness | Service Responsiveness | ||
| Food and beverage | Rationality of food distribution | Rationality of food distribution | |
| Rationality of food recycling | Rationality of food recycling | ||
| Food taste | Food taste | ||
| Choice of food | Choice of food | ||
| Quantity of food & beverages | Quantity of food & beverages | ||
| Choice of beverages | Choice of beverages | ||
| Dietary hygiene | Dietary hygiene | ||
| Convenience of dietary tools | Convenience of dietary tools | ||
| IFE | Intact device | Intact device | |
| IFE appearance | IFE appearance | ||
| Screen layout and position | Screen layout and position | ||
| Accessibility | Abundant video resources | ||
| Touch screen sensitivity | Updating of video resources | ||
| Button sensitivity | Resources quality | ||
| IFE response speed | Output quality of IFE | ||
| Reasonability of function layout | Emergency call service | ||
| Abundant entertainment APPs | Geographic location information | ||
| Abundant video resources | |||
| Updating of video resources | |||
| Resources quality | |||
| Output quality of IFE | |||
| Emergency call service | |||
| Geographic location information | |||
| In-flight online shopping | |||
| In-flight social media | |||
| Smart information service | |||
| Stability of WIFI | |||
| convenience of WIFI connection | |||
References
- Bakır, M.; Atalık, Ö.; Itani, N. Service quality and repurchase intentions in the airline industry: A multiple mediation analysis through customer citizenship behaviour. Curr. Issues Tour. 2025, 28, 4025–4046. [Google Scholar] [CrossRef] [Scilit]
- Shiwakoti, N.; Jiang, H.; Nguyen, A.D. Passengers’ perception of safety and its relationship with demographics, service quality, satisfaction and loyalty in airlines sector—A case study of Vietnam to Australia route. Transp. Policy 2022, 124, 194–202. [Google Scholar] [CrossRef] [Scilit]
- Zaki Ahmed, A.; Rodríguez-Díaz, M. Significant Labels in Sentiment Analysis of Online Customer Reviews of Airlines. Sustainability 2020, 12, 8683. [Google Scholar] [CrossRef] [Scilit]
- Richards, L.G. On the Psychology of Passenger Comfort; Acad Press: Swansea, UK, 1980. [Google Scholar]
- Lewis, L.; Patel, H.; Cobb, S.; D’Cruz, M.; Bues, M.; Stefani, O.; Grobler, T. Distracting people from sources of discomfort in a simulated aircraft environment. Work 2016, 54, 963–979. [Google Scholar] [CrossRef] [Scilit]
- Hussain, R.; Nasser, A.A.; Hussain, Y.K. Service quality and customer satisfaction of a UAE-based airline: An empirical investigation. J. Air Transp. Manag. 2015, 42, 167–175. [Google Scholar] [CrossRef] [Scilit]
- Wang, J.; Zhi, J.Y.; Xiang, Z.R.; Du, J.; Chen, J.; He, S.; Du, Y. Enhancing aircraft cabin comfort to compete with high-speed trains: A survey in China. Hum. Factors Ergon. Manuf. Serv. Ind. 2021, 31, 300–315. [Google Scholar] [CrossRef] [Scilit]
- Eshaghi, M.S.; Afshardoost, M.; Lohmann, G.; Moyle, B.D. Drivers and outcomes of airline passenger satisfaction: A Meta-analysis. J. Air Transp. Res. Soc. 2024, 3, 100034. [Google Scholar] [CrossRef] [Scilit]
- Wang, S.; Cao, X.; Miao, D.; Pang, L.; Li, J. A Review of In-Flight Thermal Comfort and Air Quality Status in Civil Aircraft Cabin Environments. Buildings 2024, 14, 2001. [Google Scholar] [CrossRef] [Scilit]
- Lopez-Valpuesta, L.; Casas-Albala, D. Has passenger satisfaction at airports changed with the onset of COVID-19? The case of Seville Airport (Spain). J. Air Transp. Manag. 2023, 108, 102361. [Google Scholar] [CrossRef] [Scilit] [PubMed]
- Bubb, R. Sitting Comfort; IQPC: Hamburg, Germany, 2008. [Google Scholar]
- Vink, P.; Brauer, K. Aircraft Interior Comfort and Design; CRC Press: Abingdon, UK, 2011. [Google Scholar]
- Samanci, S.; Atalay, K.D.; Isin, F.B. Focusing on the big picture while observing the concerns of both managers and passengers in the post-covid era. J. Air Transp. Manag. 2021, 90, 101970. [Google Scholar] [CrossRef] [Scilit]
- Zhang, L.; Helander, M.G.; Drury, C.G. Identifying Factors of Comfort and Discomfort in Sitting. Hum. Factors 1996, 38, 377–389. [Google Scholar] [CrossRef] [Scilit]
- Chen, C.F. Investigating structural relationships between service quality, perceived value, satisfaction, and behavioral intentions for air passengers: Evidence from Taiwan. Transp. Res. Part A 2008, 42, 709–717. [Google Scholar] [CrossRef] [Scilit]
- Vink, P.; Bazley, C.; Kamp, I.; Blok, M. Possibilities to improve the aircraft interior comfort experience. Appl. Ergon. 2012, 43, 354–359. [Google Scholar] [CrossRef] [Scilit] [PubMed]
- An, M.; Noh, Y. Airline customer satisfaction and loyalty: Impact of in-flight service quality. Serv. Bus. 2009, 3, 293–307. [Google Scholar] [CrossRef] [Scilit]
- Messner, W. The impact of an aircraft’s service environment on perceptions of in-flight food quality. J. Air Transp. Manag. 2016, 53, 123–130. [Google Scholar] [CrossRef] [Scilit]
- Li, W.; Yu, S.; Pei, H.; Zhao, C.; Tian, B. A hybrid approach based on fuzzy AHP and 2-tuple fuzzy linguistic method for evaluation in-flight service quality. J. Air Transp. Manag. 2017, 60, 49–64. [Google Scholar] [CrossRef] [Scilit]
- Wang, J.; Xiang, Z.R.; Zhi, J.Y.; Chen, J.-P.; He, S.-J.; Du, Y. Assessment method for civil aircraft cabin comfort: Contributing factors, dissatisfaction indicators, and degrees of influence. Int. J. Ind. Ergon. 2021, 81, 103045. [Google Scholar] [CrossRef] [Scilit]
- Ahmadpour, N.; Lindgaard, G.; Robert, J.M.; Pownall, B. The thematic structure of passenger comfort experience and its relationship to the context features in the aircraft cabin. Ergonomics 2014, 57, 801–815. [Google Scholar] [CrossRef] [Scilit] [PubMed]
- Lee, J.H.; Jin, B.S.; Ji, Y. Development of a Structural Equation Model for ride comfort of the Korean high-speed railway. Int. J. Ind. Ergon. 2009, 39, 7–14. [Google Scholar] [CrossRef] [Scilit]
- Wang, J.; Zhi, J.; Du, Y.; Xiang, Z.-R.; Feng, S.; Chen, J.-P. A method identifying key optimisation points for aircraft seat comfort. Ergonomics 2021, 64, 287–304. [Google Scholar] [CrossRef] [Scilit]
- Yakut, I.; Turkoglu, T.; Yakut, F. Understanding Customers’ Evaluations Through Mining Airline Reviews. arXiv 2015, arXiv:1512.03632. [Google Scholar] [CrossRef] [Scilit]
- Tsafarakis, S.; Kokotas, T.; Pantouvakis, A. A multiple criteria approach for airline passenger satisfaction measurement and service quality improvement. J. Air Transp. Manag. 2018, 68, 61–75. [Google Scholar] [CrossRef] [Scilit]
- Konieczny, G. Die Messung und Steigerung der Qualität von Dienstleistungen in der Flugzeugkabine—Ein Beitrag zur kundenorientierten Flugzeugentwicklung. Ph.D. Thesis, Technical University, Berlin, Germany, 2001. [Google Scholar]
- Cheng, X.; Cao, Y.; Huang, K.; Wang, Y. Modeling the Satisfaction of Bus Traffic Transfer Service Quality at a High-Speed Railway Station. J. Adv. Transp. 2018, 2018, 7051789. [Google Scholar] [CrossRef] [Scilit]
- Antonucci, L.; Crocetta, C.; D’Ovidio, F.D. Passenger satisfaction: A multi-group analysis. Qual. Quant. 2014, 48, 337–345. [Google Scholar] [CrossRef] [Scilit]
- Soltanpour, A.; Mesbah, M.; Habibian, M. Customer satisfaction in urban rail: A study on transferability of structural equation models. Public Transp. 2020, 12, 123–146. [Google Scholar] [CrossRef] [Scilit]
- Bellizzi, M.G.; Dell Olio, L.; Eboli, L.; Mazzulla, G. Detecting passengers’ heterogeneity on airlines’ services using SP data. J. Air Transp. Manag. 2021, 96, 102123. [Google Scholar] [CrossRef] [Scilit]
- Byrne, B.M. Structural Equation Modeling with Mplus: Basic Concepts, Applications, and Programming; Routledge: Abingdon-on-Thames, UK, 2013. [Google Scholar]
- Lawshe, C.H. A quantitative approach to content validity. Pers. Psychol. 1975, 28, 563–575. [Google Scholar] [CrossRef] [Scilit]
- Park, S.; Lee, J.; Nicolau, J.L. Understanding the dynamics of the quality of airline service attributes: Satisfiers and dissatisfiers. Tour. Manag. 2020, 81, 104163. [Google Scholar] [CrossRef] [Scilit]
- Eboli, L.; Bellizzi, M.G.; Mazzulla, G. A Literature Review of Studies Analysing Air Transport Service Quality from the Passengers’ Point of View. Promet-Traffic Transp. 2022, 34, 253–269. [Google Scholar] [CrossRef] [Scilit]
- Mansouri, S.; Moradpour, S.; Prentice, C. An alternative approach to understanding airline customers’ attitudes and behaviors. J. Air Transp. Manag. 2026, 133, 102960. [Google Scholar] [CrossRef] [Scilit]
- Peng, Y.; Peng, Z.; Feng, T.; Zhong, C.; Wang, W. Assessing Comfort in Urban Public Spaces: A Structural Equation Model Involving Environmental Attitude and Perception. Int. J. Environ. Res. Public Health 2021, 18, 1287. [Google Scholar] [CrossRef] [Scilit]
- Tanwar, R.; Agarwal, P.K. Analysis of the determinants of service quality in the multimodal public transport system of Bhopal city using structural equation modelling (SEM) and factor analysis. Expert Syst. Appl. 2024, 256, 124931. [Google Scholar] [CrossRef] [Scilit]
- Qureshi, S.M.; Kang, C. Analysing the organizational factors of project complexity using structural equation modelling. Int. J. Proj. Manag. 2015, 33, 165–176. [Google Scholar] [CrossRef] [Scilit]
- Güneri, Ö.İ.; Göktaş, A.; Kayalı, U. Path analysis and determining the distribution of indirect effects via simulation. J. Appl. Stat. 2016, 44, 1181–1210. [Google Scholar] [CrossRef] [Scilit]
- Black, W.C.; Babin, B.J.; Anderson, R.E. Multivariate Data Analysis: A Global Perspective; Pearson: London, UK, 2010. [Google Scholar]
- Hair, J.F.; Tatham, R.L.; Anderson, R.E.; Black, B.C. Multivariate Data Analysis, 5th ed.; Technometrics; Pearson: London, UK, 1998; Volume 30, pp. 130–131. [Google Scholar]
- Allen, J.; Munoz, J.C.; Juan, D. Understanding public transport satisfaction: Using Maslow’s hierarchy of (transit) needs. Transp. Policy 2019, 81, 75–94. [Google Scholar] [CrossRef] [Scilit]
- Kim, S.; Lee, S.; Kim, J.; Whittaker, T.A. Investigating Latent Interaction Effects in Multiple-Group Analysis in the Structural Equation Modeling Framework. Struct. Equ. Model. 2024, 31, 1043–1055. [Google Scholar] [CrossRef] [Scilit]
- Sikder, S.; Pinjari, A.R.; Srinivasan, S.; Nowrouzian, R. Spatial transferability of travel forecasting models: A review and synthesis. Int. J. Adv. Eng. Sci. Appl. Math. 2013, 5, 104–128. [Google Scholar] [CrossRef] [Scilit]
- Chandra Mahapatra, S.; Bellamkonda, R.S. Higher expectations of passengers do really sense: Development and validation a multiple scale-FliQual for air transport service quality. J. Retail. Consum. Serv. 2023, 70, 103162. [Google Scholar] [CrossRef] [Scilit]
- Blok, M.; Vink, P.; Kamp, I. Comfortable flying: Comfort in aircraft interiors seen through the eyes of the passengers. Tijdschr. Voor Ergon. 2007, 4, 4–11. [Google Scholar]
- Mastrigt, H.V.; Meyenborg, I.; Hoogenhout, M. The influence of activities and duration on comfort and discomfort development in time of aircraft passengers. Work 2016, 54, 955–961. [Google Scholar] [CrossRef] [Scilit]
- Jin, M.; Kim, J.K. Customer adoption factors for in-flight entertainment and connectivity. Res. Transp. Bus. Manag. 2022, 43, 100759. [Google Scholar] [CrossRef] [Scilit]
- Lucini, F.R.; Tonetto, L.M.; Fogliatto, F.S.; Anzanello, M.J. Text mining approach to explore dimensions of airline customer satisfaction using online customer reviews. J. Air Transp. Manag. 2020, 83, 101760. [Google Scholar] [CrossRef] [Scilit]

Disclaimer/Publisher’s Note: The statements, opinions and data contained in all publications are solely those of the individual author(s) and contributor(s) and not of MDPI and/or the editor(s). MDPI and/or the editor(s) disclaim responsibility for any injury to people or property resulting from any ideas, methods, instructions or products referred to in the content. |
© 2026 by the authors. Licensee MDPI, Basel, Switzerland. This article is an open access article distributed under the terms and conditions of the Creative Commons Attribution (CC BY) license.