


Abstract
In the face of mounting complexity in container terminal operations, the selection of an effective information system is paramount. The TOS (Terminal Operating System) is the most significant of all the information systems in existence for terminals. The objective of this study is to establish a set of criteria for selecting container TOS, determine the priority weights of these criteria and investigate their interactions. To the author’s knowledge, this is the first study to address this topic in such a detailed context. The hybrid FAHP (Fuzzy Analytic Hierarchy Process) and F-DEMATEL (Fuzzy Decision-Making Trial and Evaluation Laboratory) methodology was employed for the 18 criteria that were identified through the academic literature and expert views. The findings demonstrated that container terminal operators have expressed an expectation for a TOS structure that integrates complex business processes, provides effective decision support, increases traceability, works in harmony with advanced technologies, supports smart port transformation processes, enhances digital maturity and enables rapid intervention in bottlenecks. Furthermore, the fact that TOSs should support integration with external stakeholders is also critical in terms of collaboration and transparency, which are of great importance in supply chain management. It is hoped that the present study will contribute to the relevant literature and also provide a structural framework for terminal operators to select the most suitable TOS and for providers to design the most effective product.
1. Introduction
Globalisation and increasing trade volumes have led to a growing importance of maritime transport [1] and ports [2]. As the hub of logistics and the main gateway for international trade [3], ports are critical to the global economy [4]. In this context, ports are facilities that should be integrated into global supply chains [5,6] and their high performance affects both their own efficiency and competitiveness, as well as that of the supply chains [7,8]. The digitalisation and modernisation of ports is imperative [3] in such contexts, where complex logistics activities are conducted and competitive pressures are prevalent [9,10]. According to [11], the most significant factors that will influence the future of ports are sustainability, intense competition and technological developments. In this context, the impact of Industry 4.0 (which is currently affecting many sectors) on ports has been realised through the Port 4.0 (smart port) concept [12]. The concepts of Industry 4.0 and smart ports, which are based on digitalisation and autonomy, require the use of advanced technologies [13]. In this context, the increasing volume of business, the complexity of logistics processes and the significant role of ports in supply chain management [14] have brought ICT (Information and Communication Technologies), MIS (management information systems), automation and smartisation to the forefront in port management [15,16]. According to [17], the size of the relevant market is expected to reach USD 39.34 billion by 2034.
Hervás-Peralta et al. (2019) emphasised that ICT usage is an indicator of development for ports [18]. In contemporary ports, especially those with container terminals, a plethora of advanced technologies are employed [19,20], including EDI—Electronic Data Interchange [21], PCS—Port Communication System [22,23], automatic gate systems [24], AR—Augmented Reality and VR—Virtual Reality [11], digital twins [25,26,27], OCR—Optical Character Recognition [28], blockchain [29], RFID—Radio Frequency Identification [30], robots [31], AGV—Automatic Guided Vehicles [32], GPS—Global Positioning System [24,33], big data [34,35], cloud computing [33], drone [5,36], sensors [37,38], ERP—Enterprise Resource Planning [39], IoT—Internet of Things [40,41,42,43], AI—Artificial Intelligence [11,18,44,45] and TOS—Terminal Operating System [1,5]. The technologies utilised in ports and their respective domains of application are shown in Table 1.
Table 1.
Emerging technologies and their use in ports.
Container terminals represent a pivotal element within the domain of maritime transport [46], characterised by a multitude of challenging operational processes [47]. In the context of this rapidly expanding sector, characterised by a multitude of stakeholders [48], the utilisation of ICT and MIS is important for achieving cost-effectiveness and optimal management [4]. It can be stated with ease that container terminals, which exhibit a high degree of standardisation and specialisation, are the foremost proponents of automation [49]. In this context, one of the most prominent information systems used in container terminals is TOS [19]. Inutsuka et al. (2024) defined TOS as a management information system responsible for all processes based on different components (equipment, IT systems, infrastructure) at the terminal [5]. In the contemporary context, TOSs for container terminals have undergone a transformation, evolving from supporting tools that facilitated office operations to sophisticated e-platforms [8]. It is evident that TOSs are instrumental in facilitating the seamless operations of container terminals, thereby ensuring the benefits of these systems are distributed among all stakeholders [47]. TOSs play a pivotal role in real-time planning, management, monitoring and control activities, contributing to the efficiency and effectiveness of terminal operations [50,51]. In this context, the selection of a TOS for container terminals is of great importance for effective and efficient terminal management, as well as for terminal stakeholders and, indirectly, supply chain management. As Weerasinghe et al. (2024) have observed, errors in the selection of a TOS have been demonstrated to have a detrimental effect on terminal productivity [10]. Moreover, investment and project decisions pertaining to TOSs represent a significant challenge for terminals, primarily due to the associated costs and the challenges in implementation and integration [18].
In light of this information, the study investigated the criteria to be considered in selecting a TOS for container terminals, their relative importances and the interactions between these criteria. In this context, the objective was to ascertain the answers to three research questions. The following are provided:
- Research Question (RQ) 1: In the context of current developments (technological and sectoral), what criteria should be considered in the selection of TOS for container terminals?
- RQ 2: What are the priorities of the criteria considered in TOS selection?
- RQ 3: What interactions exist between the criteria considered in TOS selection?
A set of criteria were established based on the academic literature and expert opinions. A series of face-to-face interviews were conducted with eight experts, including TOS software developers, TOS consultants, container terminal managers and academics. The findings were obtained by applying the FAHP and F-DEMATEL hybrid model to data collected from surveys administered to experts in the field. To the author’s knowledge, this study is the first to identify a set of selection criteria for container TOSs, determine the importance of these criteria and the relationships between them. It is hoped that this study will contribute to the extant literature on the subject and provide useful insights for container operators, TOS providers and stakeholders in the industry. This paper is structured as follows. Section 2 reviews the TOS including definitions, functionalities and benefits of it. Section 3 includes literature review, Section 4 reports the research methodology and provides definitions of criteria. In Section 5, the main findings are detailed. Finally, Section 6 discusses the results of analysis and summarises the main conclusions.
2. An Important Information System for Seaports: TOS
Increasing ship sizes [52], diversifying customer demands [53], shorter delivery times [54,55] and increasingly complex logistics processes [8,56], problems with real-time information sharing and integration with internal and external stakeholders [1,39,57], increasing amount of circulating cargo [58], planning and scheduling difficulties [39] have increased the need for information systems and technologies in ports (especially container ports) which are striving to integrate into global supply chains and gain a competitive advantage. In this context, cargo tracking [46], operators’ integration [59], automation [47], determining stacking areas for cargo [18], equipment synchronisation [57], optimisation and decision support [10] are of great importance in container terminals, where the TOS stands out [8,60]. Various TOS definitions in the literature are outlined in Table 2.
Table 2.
Various TOS Definitions.
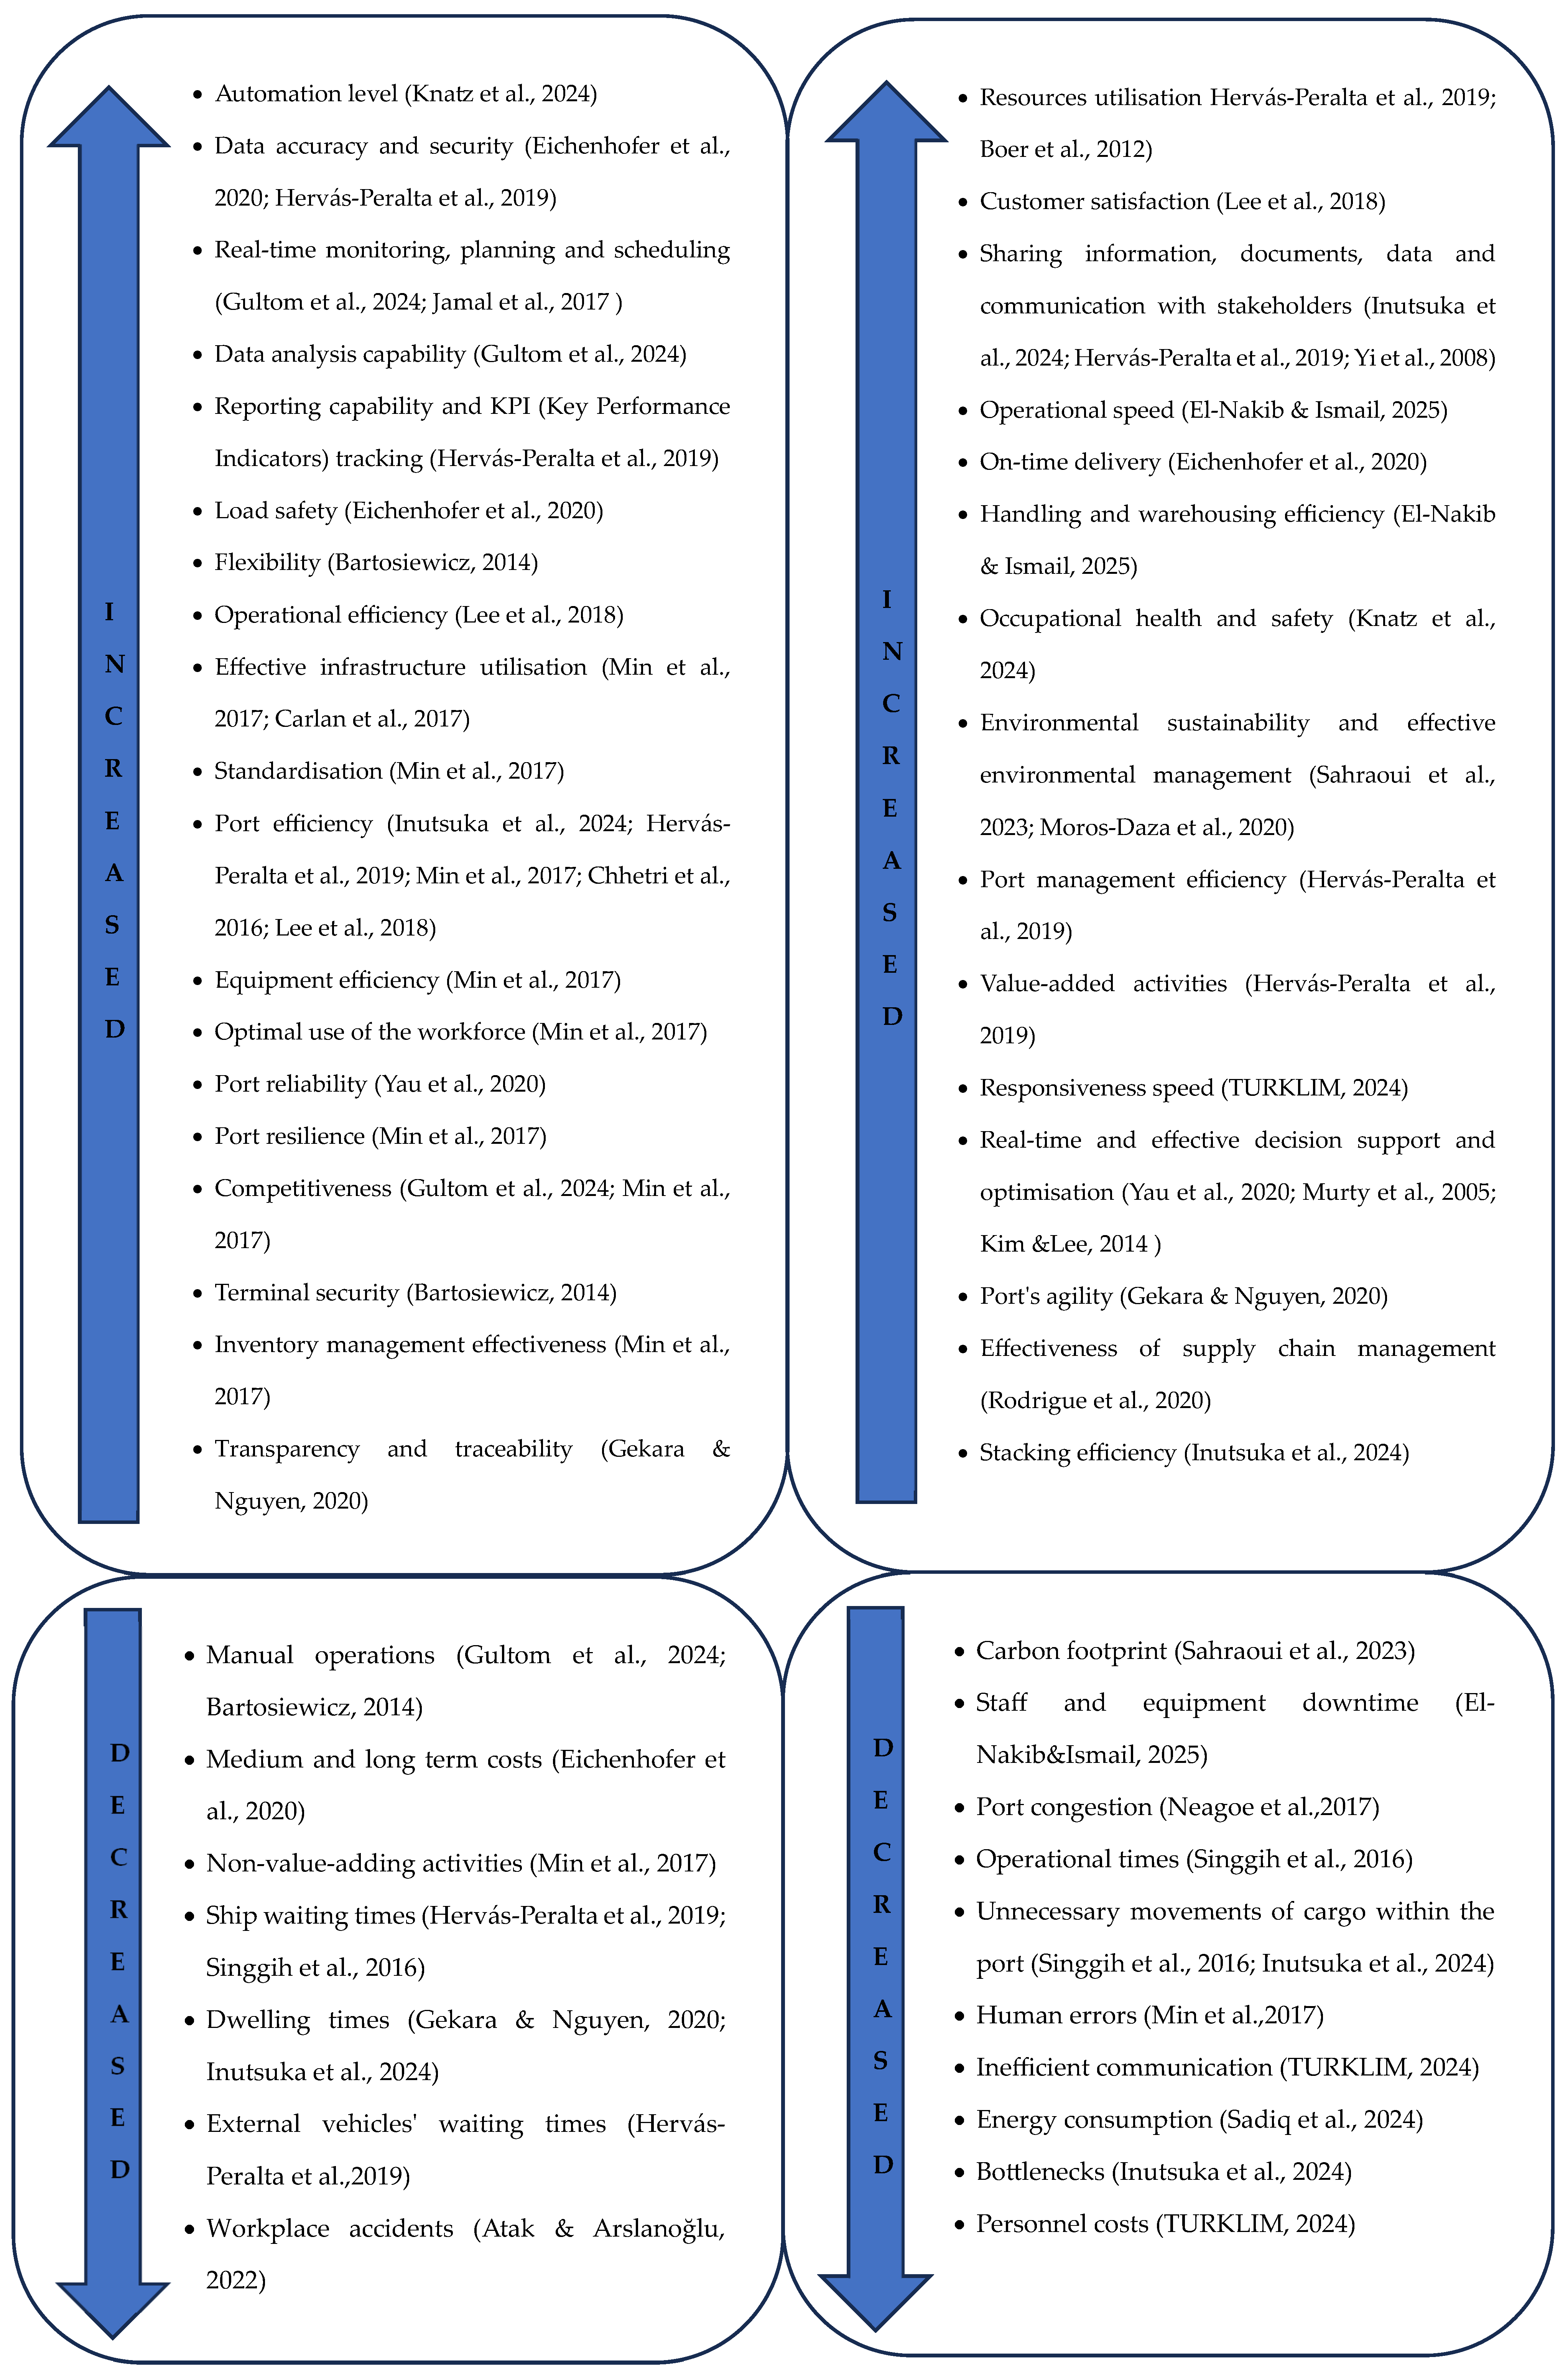
TOSs, which consist of numerous modules (e.g., vessel management, quay management, equipment management, warehousing, invoicing, reporting, gate management, damage check, intermodal operations, yard management, communication) [18,39,59], are essential for terminal efficiency, productivity, process facilitation, optimisation and automation [46]. Hervás-Peralta et al. (2019) described the TOS as the terminal’s central nervous system, on the grounds that it automates many activities at the terminal [18]. Yau et al. (2020) defined the TOS as the brain of the smart port [62], while Boer et al. (2012) defined it as the heart of ports [64]. The fundamental functions of TOSs employed in container terminals are delineated in Table 3. TOSs with the functions specified in Table 3 can provide numerous benefits for container terminals, as outlined in Figure 1. However, it should be noted that selecting an appropriate and effective TOS is crucial in realising these benefits.
Table 3.
Functionalities of TOS.
Figure 1.
Direct and indirect benefits of efficient TOSs. [1,3,4,5,8,11,18,23,41,46,47,57,59,60,62,64,68,69,70,71,72,73,74,75,76,77].
3. Literature Review
Despite the increase in the number of studies on TOS in the literature since 2015 [78], this remains a niche topic with very few studies available. Despite the fact that the system is also applicable to a variety of cargo terminals, research on TOSs has been undertaken principally in the context of container terminals. In their study investigating the usability of ERP in conjunction with TOS, Choi et al. (2003) indicated that ERP could be particularly beneficial in data integration, quay and yard planning [39]. It has been posited that ensuring the interoperability of these two technologies could contribute to resolving the issues experienced in terminals. Gultom et al. (2024) conducted a study to ascertain the impact of the TOS utilised at the Tanjung Priok port in Indonesia on handling efficiency [3]. This investigation employed qualitative analysis as the primary methodological approach. The findings demonstrated that efficiency had increased by 116 per cent, while the ship waiting times in port had decreased. Eichenhofer et al. (2020) conducted an examination of data flows occurring via the TOS at container terminals and provided an assessment of potential security vulnerabilities [4]. The findings confirmed the existence of security vulnerabilities and revealed that TOS performance affects cargo security and on-time delivery. Min et al. (2017) conducted an examination of operational practices at a port in Korea [59]. The study’s findings led to the proposal of a TOS that was deemed to have the potential to enhance terminal efficiency. The present study emphasised the importance of terminal operators integrating with the system and compared the efficiency of two operators, one of which had integrated with the system and one which had not. Furthermore, the critical success factors of terminal operators were evaluated using the AHP method. The study posited a TOS comprising six modules (quay, ship, resources, site, communication and interface), with the operator’s cargo attraction identified as the paramount success factor. Singgih et al. (2016) emphasised the importance of synchronisation and data transfer between equipment used in automated container terminals and proposed a TOS that provides real-time decision support and reduces the berthing times of incoming ships [57]. In their study on the utilisation of information technologies in smart ports, Yau et al. (2020) categorised the features that TOSs should possess into three distinct categories [62]. These are defined as autonomous decision-making, the ability to work with different devices and equipment and real-time information sharing. Furthermore, emphasis was placed on the significance of features such as stability, scalability, reliability, accuracy and availability. Gekara & Nguyen (2020) conducted an examination of the issues experienced with the TOS application that had been implemented at the Port of Mombasa [8]. The findings indicated that the challenges experienced in the adoption and implementation of a TOS stemmed from deficiencies in ICT infrastructure and a lack of employee preparedness. Inutsuka et al. (2024) conducted a comparative analysis of the TOSs (CTMS and OPUS Terminal) utilised in Japan, along with the challenges encountered [5]. The study put forward a series of recommendations for the enhancement of the smart port concept. In their evaluations, the researchers identified six functions that should be present in TOSs in the context of the smart port concept. These are communication with the equipment control system; AI and digital twins-supported operational planning and control; mobile terminal-based work order instruction; information exchange with stakeholders via PCS; smart gate management and IoT-based data collection and sharing with other systems. Boer & Saanen (2012) identified a testing and tuning method that could positively impact the increased functionality of TOSs and the reduction in interruptions [64]. Yi et al. (2008) proposed a TOS consisting of seven main modules (basic data, entry and exit gates, internal transporting, warehousing, unloading and loading) in the context of container terminal business processes and emphasised the most important functions of the TOS as equipment control, handling, ship stowage and yard planning [47]. El Nakib & Ismail (2025) conducted a comprehensive examination of the TOS implemented at Alexandria Port, employing SWOT analysis to assess its effectiveness [46]. The study yielded actionable recommendations for enhancing the TOS’s efficacy. A comparison was also made between the efficiency levels of the pre- and post-TOS periods, with the Data Envelopment Analysis (DEA) method. The findings confirmed that the use of TOS increased efficiency. Hervás-Peralta et al. (2019) identified the critical functions that TOSs should possess in the context of seaports and dry ports [18]. The 107 identified functions were grouped into six main categories: warehouse, ERP control panel, master data, maritime operations, communication and gate. The findings from their analysis, which employed the AHP method, indicated that the most significant functions were “ship time tracking”, “development of loading/unloading lists” and “optimisation of space and cargo locations”. Sahraoui et al. (2023) investigated the impact of TOS on port operations based on KPIs (collaboration, efficiency, productivity, reputation, reliability) specifically at the Port of Rhodes in Tunisia [1]. In this particular context, the results obtained from the surveys revealed that operational efficiency was higher after TOS implementation, but there were problems with adaptation.
4. Research Methodology
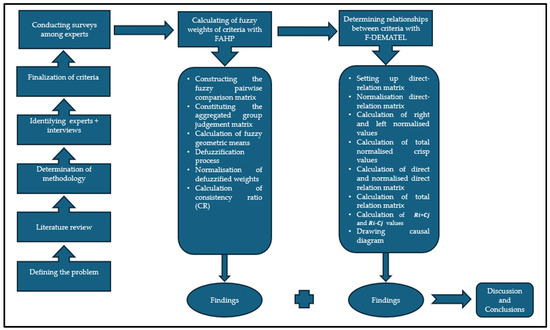
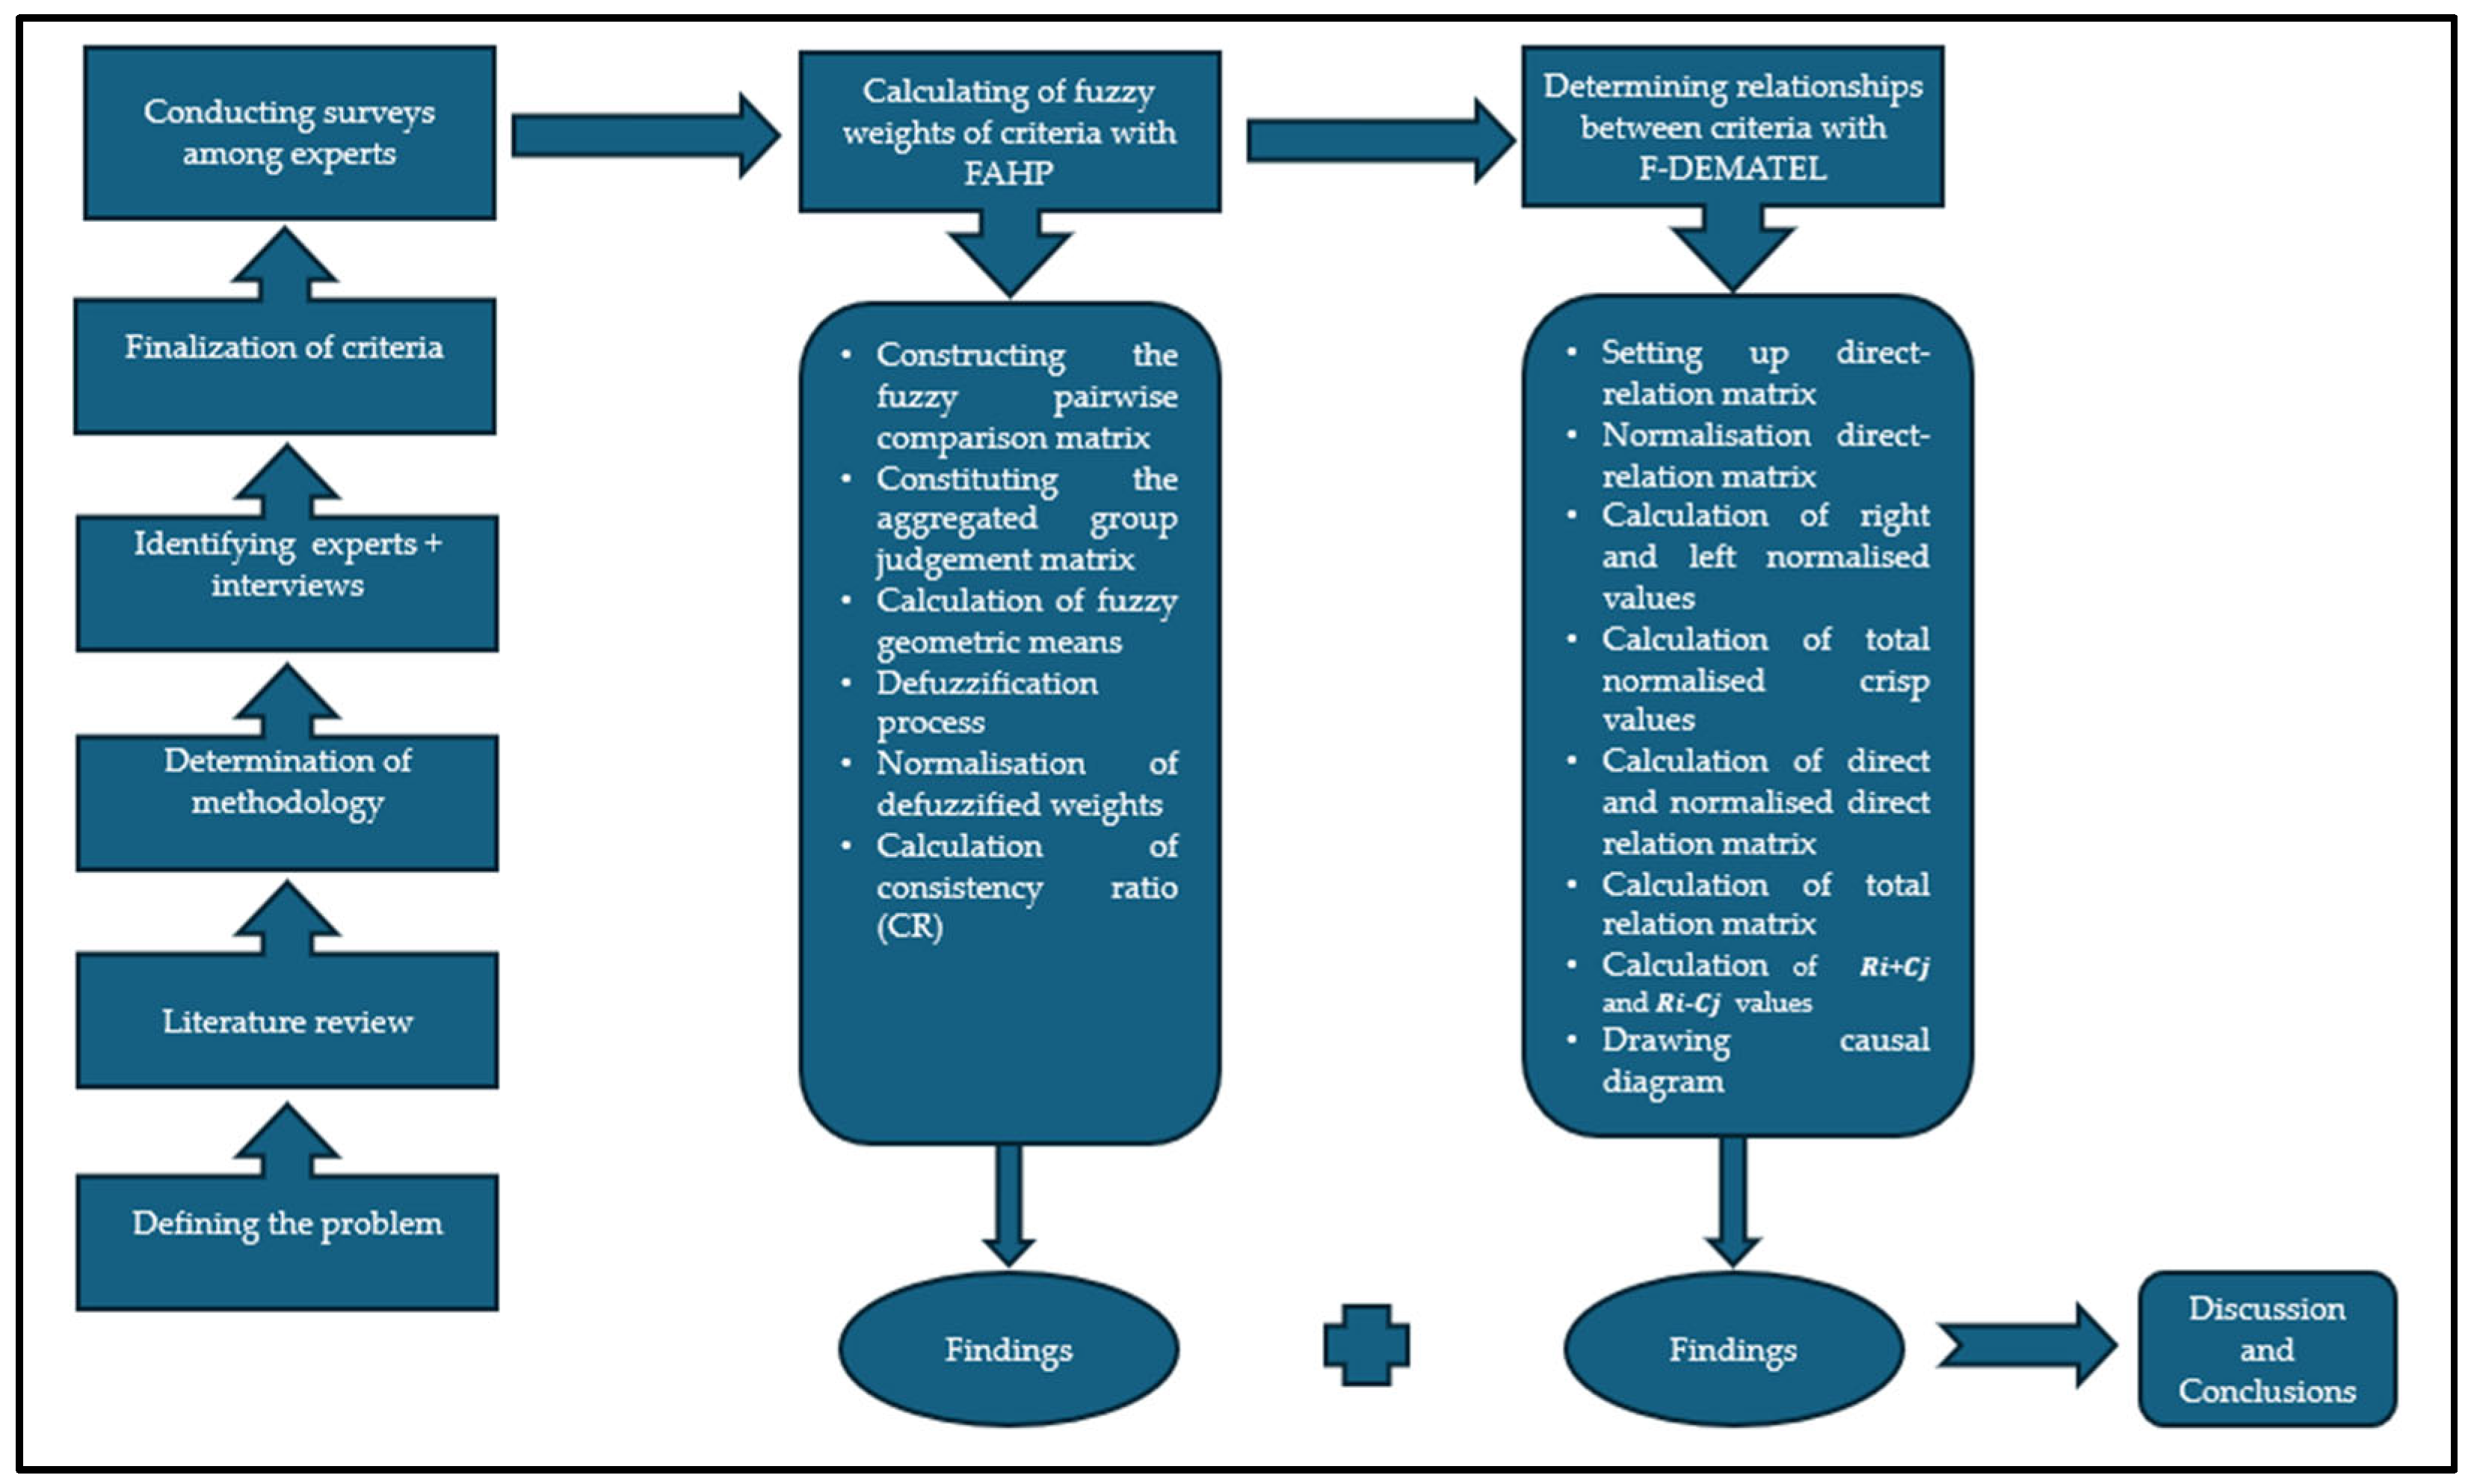
To the author’s knowledge, no study has been found in the literature where the set of selection criteria for a container TOS has been determined, weighted and the interactions between the criteria analysed. The establishment of the set of criteria is predicated on a comprehensive review of studies on the selection of different information technologies and the use of the TOS in all terminal types, as well as a synthesis of expert opinions. The framework of the research methodology is illustrated in Figure 2.
Figure 2.
Framework of research methodology.
4.1. Determination and Definitions of Criteria
The selection of experts for the TOS selection process at the container terminal was based on two fundamental criteria: direct decision-making authority and familiarity with the process. This enhancement in the methodology’s applicability and reliability is further substantiated by [79]. In-person interviews were conducted with pertinent individuals during this process. Given that the process is expected to be lengthy and that meetings will be held frequently, specialists in accessible and nearby locations (İstanbul and Kocaeli) have been preferred. Following extensive consultation with the relevant experts, a consensus was reached on all criteria. In this study, the FAHP method was employed to assign weights to the criteria, while the F-DEMATEL method was used to determine the interactions between the criteria. The surveys for both methodologies were administered to the same experts and conducted face-to-face. The qualifications of the experts are shown in Table 4. The interviews were conducted in 2025. The 18 criteria that were determined for the study, along with the relevant details, are shown in Table 5.
Table 4.
Qualifications of the experts.
Table 5.
TOS selection criteria for container terminals.
4.2. Fuzzy AHP Methodology
AHP (Analytical Hierarchy Process) is a multi-criteria decision-making method that was introduced to the academic literature by Saaty in 1977. It is characterised by a hierarchical and subjective structure and is based on pairwise comparisons of criteria. This approach, utilised in the context of both criterion weighting and the evaluation of alternatives, employs Saaty’s ((1)–(9)) rating scale [93]. The FAHP method is a hybrid approach that integrates the principals of the AHP method with fuzzy logic concepts. The objective of this integration is to minimise uncertainty and subjectivity in the decision-making process. Triangular fuzzy numbers (Equation (1)) are a common mathematical construct employed in this methodology [94].
One of the applications developed is Buckley’s approach, introduced to the literature in 1985, which uses the geometric mean method in a fuzzy environment. This method, utilised in numerous studies within the extant literature [95,96,97,98,99], comprises the following steps.
In the initial phase of the method, a hierarchical structure is established, comprising objectives and criteria, sub-criteria (if applicable) and alternatives (if applicable). In the subsequent stage of the process, experts are tasked with the generation of pairwise comparisons between criteria, utilising the linguistic terms shown in Table 6 [93].
Table 6.
Fuzzy AHP scale of relative importance.
These comparisons are then formalised within pairwise comparison matrices, which are created for each individual decision maker. Equation (2) presents the pairwise comparison matrix (), which belongs to decision maker .
In the subsequent stage, the values constituting the aggregated group judgement matrix are obtained using geometric mean, with the consideration of the pairwise comparison matrices of all experts ( experts).
Subsequently, the fuzzy geometric means are calculated for each criterion using Equation (4). The sum of the found values is taken and the weight values based on the criteria are calculated using Equation (5) [93].
In the subsequent step, the total vector of each is found, its (−1)st power is taken and it is multiplied by each s inverse vector to ascertain the fuzzy weight () of the i-th criterion. In this context, given that the values () remain fuzzy values, the defuzzification process is conducted in accordance with Equation (6). In the final stage of the process, the values obtained through utilisation of Equation (6) are normalised through application of Equation (7) [98,100,101].
In order to calculate the consistency of the comparison matrices of expert judgments, it is necessary to undertake the process of defuzzification of the elements contained within the fuzzy decision matrices. This will result in the creation of a crisp pairwise comparison matrix. For the defuzzification process, the median value with the highest membership degree among the fuzzy numbers in the pairwise comparison matrix is adopted and in accordance with Saaty’s proposal, the consistency checks are to be implemented. The calculation of criterion weights can then proceed, provided that consistency is ensured. In this context, Saaty (1980) asserts that results are deemed reliable if the consistency ratio (CR) is less than 0.1 [102]. The following equations are employed to verify the consistency ratio:
where means consistency index and shows random index [101].
4.3. Fuzzy DEMATEL
The Fuzzy DEMATEL method, which emerged from the combination of the DEMATEL method introduced to the literature by Gabus and Fontela with fuzzy set theory, can be used to analyse cause–effect relationships between criteria and to weight criteria [103]. The method under discussion has been employed in numerous studies [103,104,105,106,107,108,109] and consists of the following steps.
Subsequent to the determination of the criteria and the experts to be evaluated, the experts are to evaluate the criteria in pairs. At this stage, the expert evaluations are converted into triangular fuzzy numbers according to Table 7 and set up direct relation matrix for each expert [106,110].
Table 7.
Triangular fuzzy numbers of expert linguistic variables.
Following this stage, the direct-relation-matrixes should be normalised (see Equations (10)–(13)) [107].
Subsequent to these operations, calculation of the right () and left () normalised values is conducted in accordance with Equations (14) and (15).
In the following step it is obtained crisp values () by using Equation (16) and then it is created total normalized crisp values () by Equation (17).
Subsequent to the execution of all operations, the normalised crisp values obtained from all experts are integrated to obtain the direct relation matrix () as in Equation (18). Furthermore, the normalised direct matrix () is derived using Equations (19) and (20) [106].
After the identity matrix () is created, the normalised direct matrix () is substracted from this matrix. The obtained matrix is inversed ((. The final operation of this stage is the multiplication of the matrix (() and normalised direct matrix () as Equation (21). This operation yields the total relation matrix ().
The final stage of the methodology is the calculation of and values. It can be demonstrated that is equivalent to the sum of the rows of the matrix, whilst is the sum of its columns. In addition, is the importance and is the net effect of criteria . In this context, a high value of signifies that the criterion possesses significant importance within the system, while a positive value of indicates that the criterion functions as a cause and a negative value denotes that the criterion is a result criterion. In the context of drawing causal diagrams, the terms and are utilised to denote specific values. is horizontal, while forms the vertical axis. The horizontal axis of the graph represents the importance degrees of the criteria, while the vertical axis shows the effect of the relationship. In the event of the axis being positive, the factor is deemed to be in the cause group; conversely, the factor is classified as being in the effect group. Furthermore, it is imperative to calculate the threshold value from the matrix in order to facilitate the process of diagrammatic representation. To this end, the mean of the values comprising the matrix is calculated [106,110].
5. Case Study
5.1. FAHP Application and Findings
The consistency ratios for the pairwise comparison matrices created based on the assessments of eight experts within the context of the FAHP methodology are shown in Table 8. The RI value was accepted as 1.615, as there were 18 criteria [111]. The Excel programme was utilised for the execution of all subsequent calculations.
Table 8.
Consistency ratios of expert judgements.
In the subsequent stage of the method, the aggregated fuzzy judgement matrix shown in Table 9 was obtained by using Equation (3) on the values of the pairwise comparison matrices formed by expert evaluations.
Table 9.
Aggregated fuzzy judgement matrix.
As illustrated in Table 10, the fuzzy geometric mean values have been calculated for each criterion using Equation (4).
Table 10.
Fuzzy geometric means of criteria.
In the subsequent stage, the column totals of the values displayed in Table 10 were calculated and fuzzy weight values for each criterion were obtained using Equation (5). The values under consideration are triangular fuzzy numbers and the defuzzified values () should be calculated using Equation (6).The normalisation of the defuzzified values was calculated using Equation (7) and the weight values () for each criterion were obtained. The values obtained from these analyses are collectively displayed in Table 11. The overall CR of the expert group’s judgement is 0.0249.
Table 11.
Defuzzification values and weights of criteria.
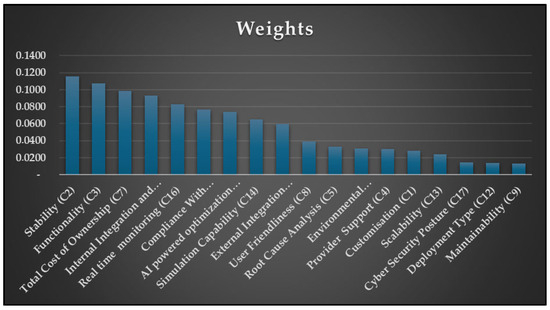
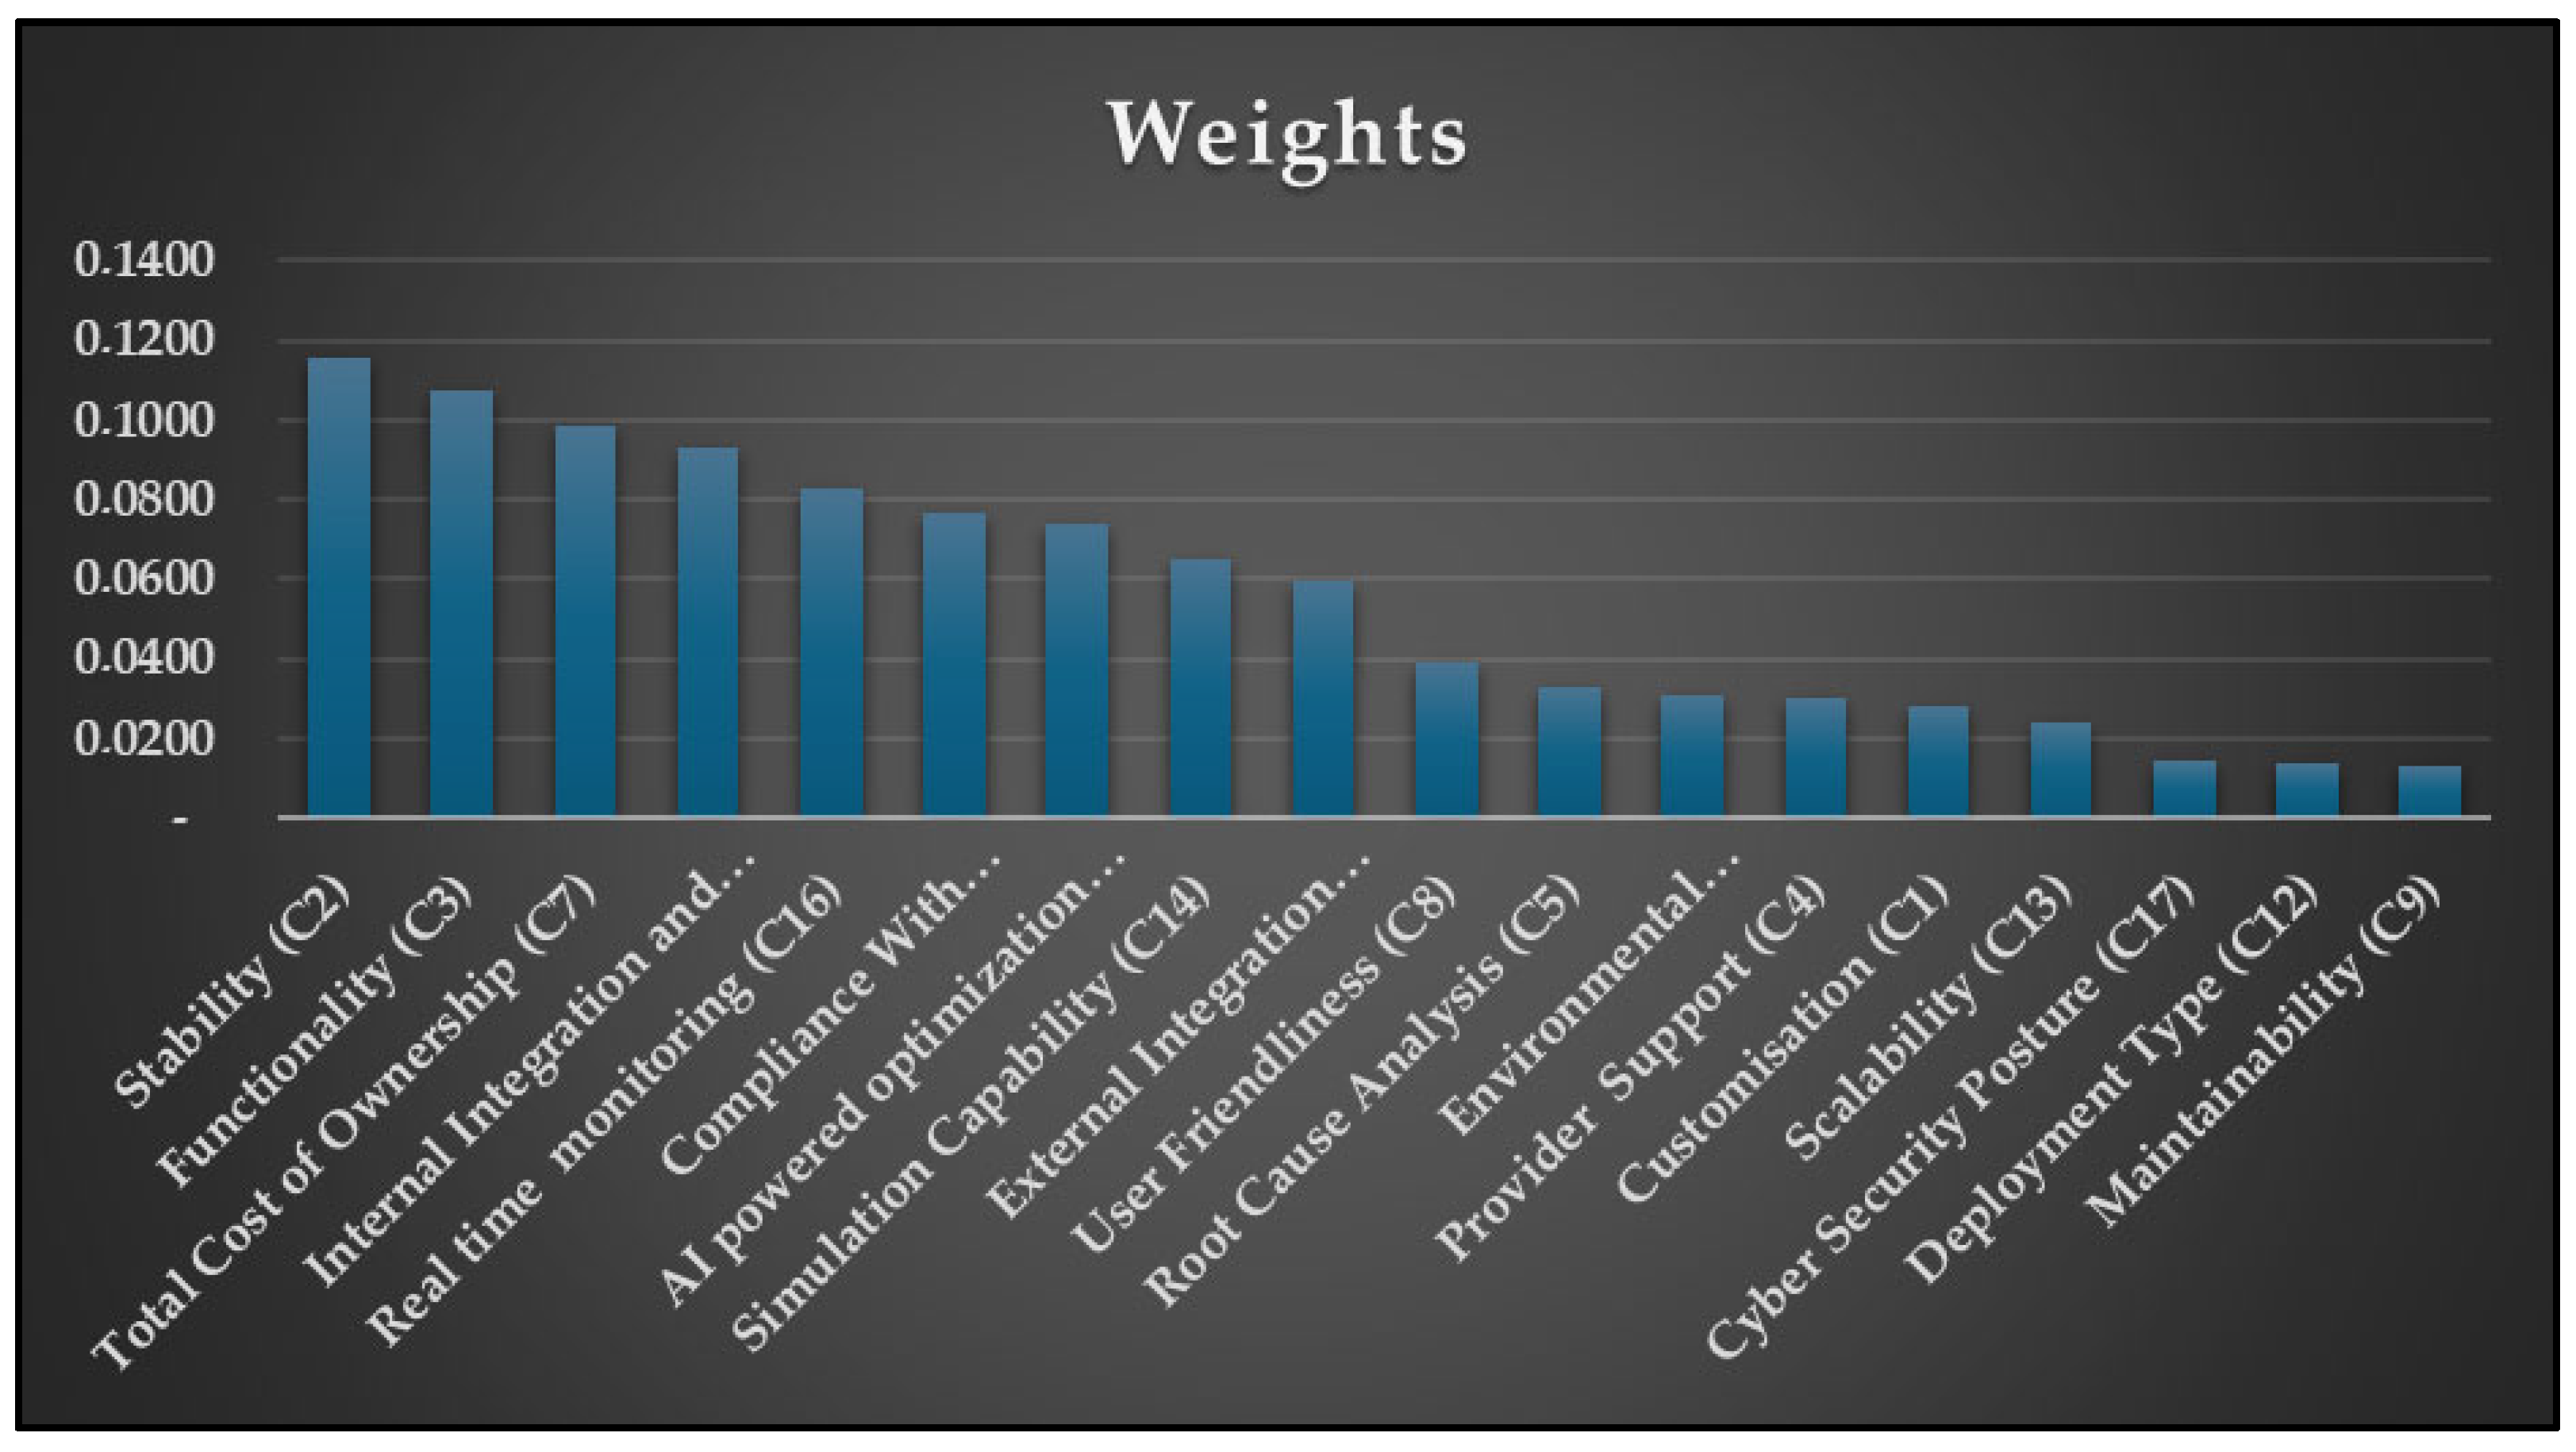
The weightings () of the criteria are presented in Figure 3, with the ranking from highest to lowest. Accordingly, the top five most important criteria are, in order: stability, functionality, TCO, internal integration and automation capability and real-time monitoring. The criterion of maintainability is of least importance. In this context, the uninterrupted operation of the TOS, its error-free performance, consistent performance and its ability to meet functional requirements are of great importance. This situation is consistent with the complexity of processes at container terminals. It is evident that TOSs are costly and investment decisions are contingent on terminal budgets. The criteria of internal integration and automation capability and real-time monitoring, which follow in order of importance, demonstrate the high need for integration and automation of terminal business processes. In this particular context, it is evident that container terminal operators assign significant importance to concepts such as operational efficiency, process integration and real-time control. This is closely related to the need for close monitoring of container terminal operations, rapid intervention and transparency. Furthermore, it is imperative to adhere to the regulatory frameworks that govern container terminals. From this standpoint, it is important that the TOS functions in accordance with these stipulations. Furthermore, the high ranking of optimisation and simulation capability criteria demonstrates the importance that container terminals place on becoming smarter. The subsequent two most significant criteria, following user-friendliness, are root cause analysis and environmental sustainability tracking criteria. It is important to note that these criteria take precedence over criteria such as provider support and customisation. The initial situation indicates that terminal operators encounter difficulties in identifying the underlying causes of certain problems experienced at terminals. The latter situation demonstrates that terminal operators have a growing awareness of environmental sustainability and wish to achieve this goal through technological and digitalisation solutions facilitated by the TOS.
Figure 3.
Graphical representation of criterion weights.
5.2. F-DEMATEL Application and Findings
In the second part of the application phase of the study, interactions between criteria were examined. The F-DEMATEL method was utilised for this purpose. To this end, F-DEMATEL questionnaires were also administered to the experts consulted for the FAHP application. In view of the fact that there were eight experts and 18 criteria, the results obtained by applying the steps up to the creation of the direct relation matrix are shown only for Expert 1. The results are presented in Table 12.
Table 12.
Corresponding triangular fuzzy values for Expert 1.
The matrix formed by the normalisation of the values in Table 12, utilising Equations (10)–(13), is presented in Table 13.
Table 13.
Normalised triangular fuzzy values for E1.
The right and left normalised values for the criteria are obtained by applying Equations (14) and (15) to the values specified in Table 13. These values are shown in Table 14. Crisp and total normalised crisp values were found using Equations (16) and (17), respectively. Total normalised crisp is shown in Table 15.
Table 14.
Left and right normalised values for E1.
Table 15.
Total normalised crisp values for E1.
The total normalised crisp values calculated for all experts are gathered and aggregated using Equation (18). These operations create the direct relation matrix shown in Table 16.
Table 16.
Direct relation matrix.
The values of the direct relationship matrix are then normalised by dividing them by the largest value of the row and column totals of the same matrix (see Table 17). In the subsequent step, an 18 × 18 unit matrix is created and the normalised direct matrix values are subtracted from this matrix and inverted. The inverse matrix is demonstrated in Table 18.
Table 17.
Normalised direct relation matrix.
Table 18.
Inversing matrix.
The multiplication of this obtained matrix by the normalised direct matrix (see Equation (21)) gives rise to the total relation matrix, as presented in Table 19.
Table 19.
Total relation matrix.
The row totals of the matrix shown in Table 19 provide the values, while the column totals provide the values. In addition, is the importance and is the net effect of criteria .
The obtained values and identities of the criteria are shown in Table 20. The calculated threshold value, which is the average of the total relation matrix values, is 0.1757.
Table 20.
Calculations of effect and cause values.
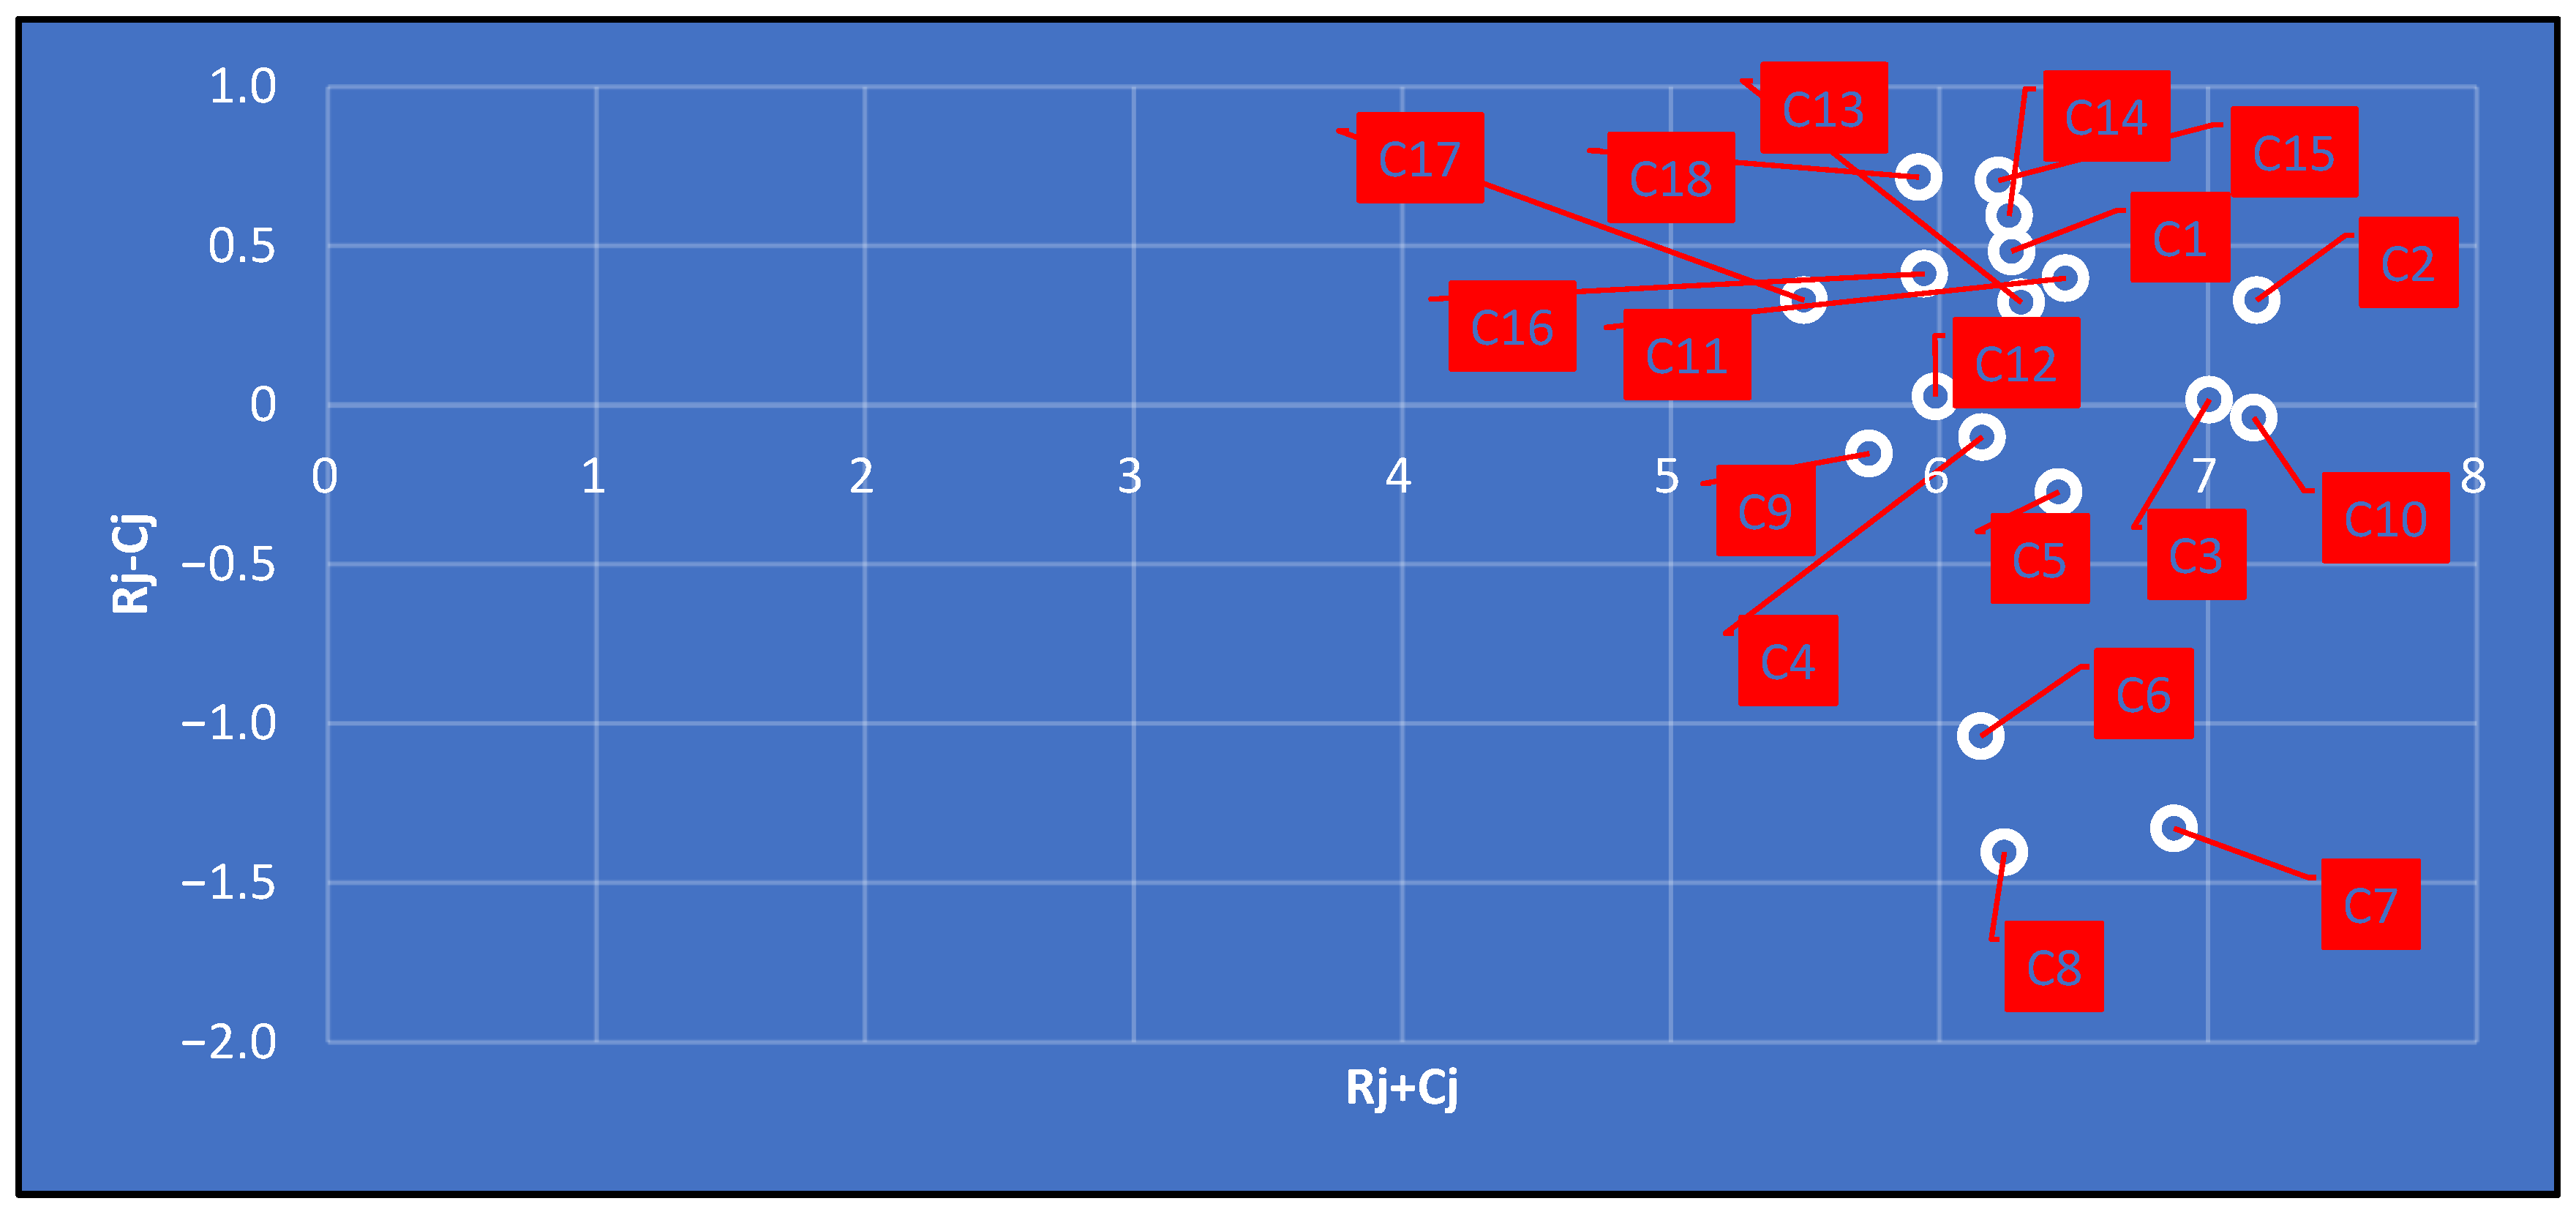
As demonstrated in Table 20, the influenced factors are C4, C5, C6, C7, C8, C9 and C10, while the others are influential factors. Furthermore, the top three criteria with the highest overall importance in the system are C2, C10 and C3, respectively. In this context, while the various features of the TOS are important, their effectiveness is contingent on the stability of the system. Moreover, the fact that integration with external stakeholders ranks second can be linked to the importance of container terminals’ integration into supply chains. The significance of functionality suggests that TOS is anticipated to be employed across a range of domains and processes within the terminal. C2 is the most influential factor, while C7 is the most influenced criterion. It is important to note that costs are inherently volatile, sensitive and dependent on a number of other factors. Within this paradigm, the magnitude of these effects is directly proportional to the augmentation of the system’s capabilities.
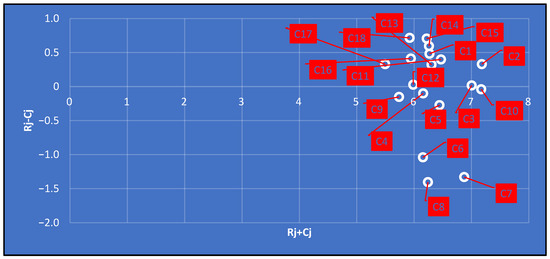
The causal relations map of criteria, created according to the values specified in Table 20, is shown in Figure 4.
Figure 4.
Causal relations map of criteria.
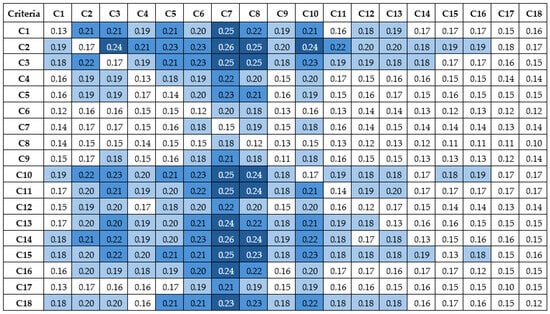
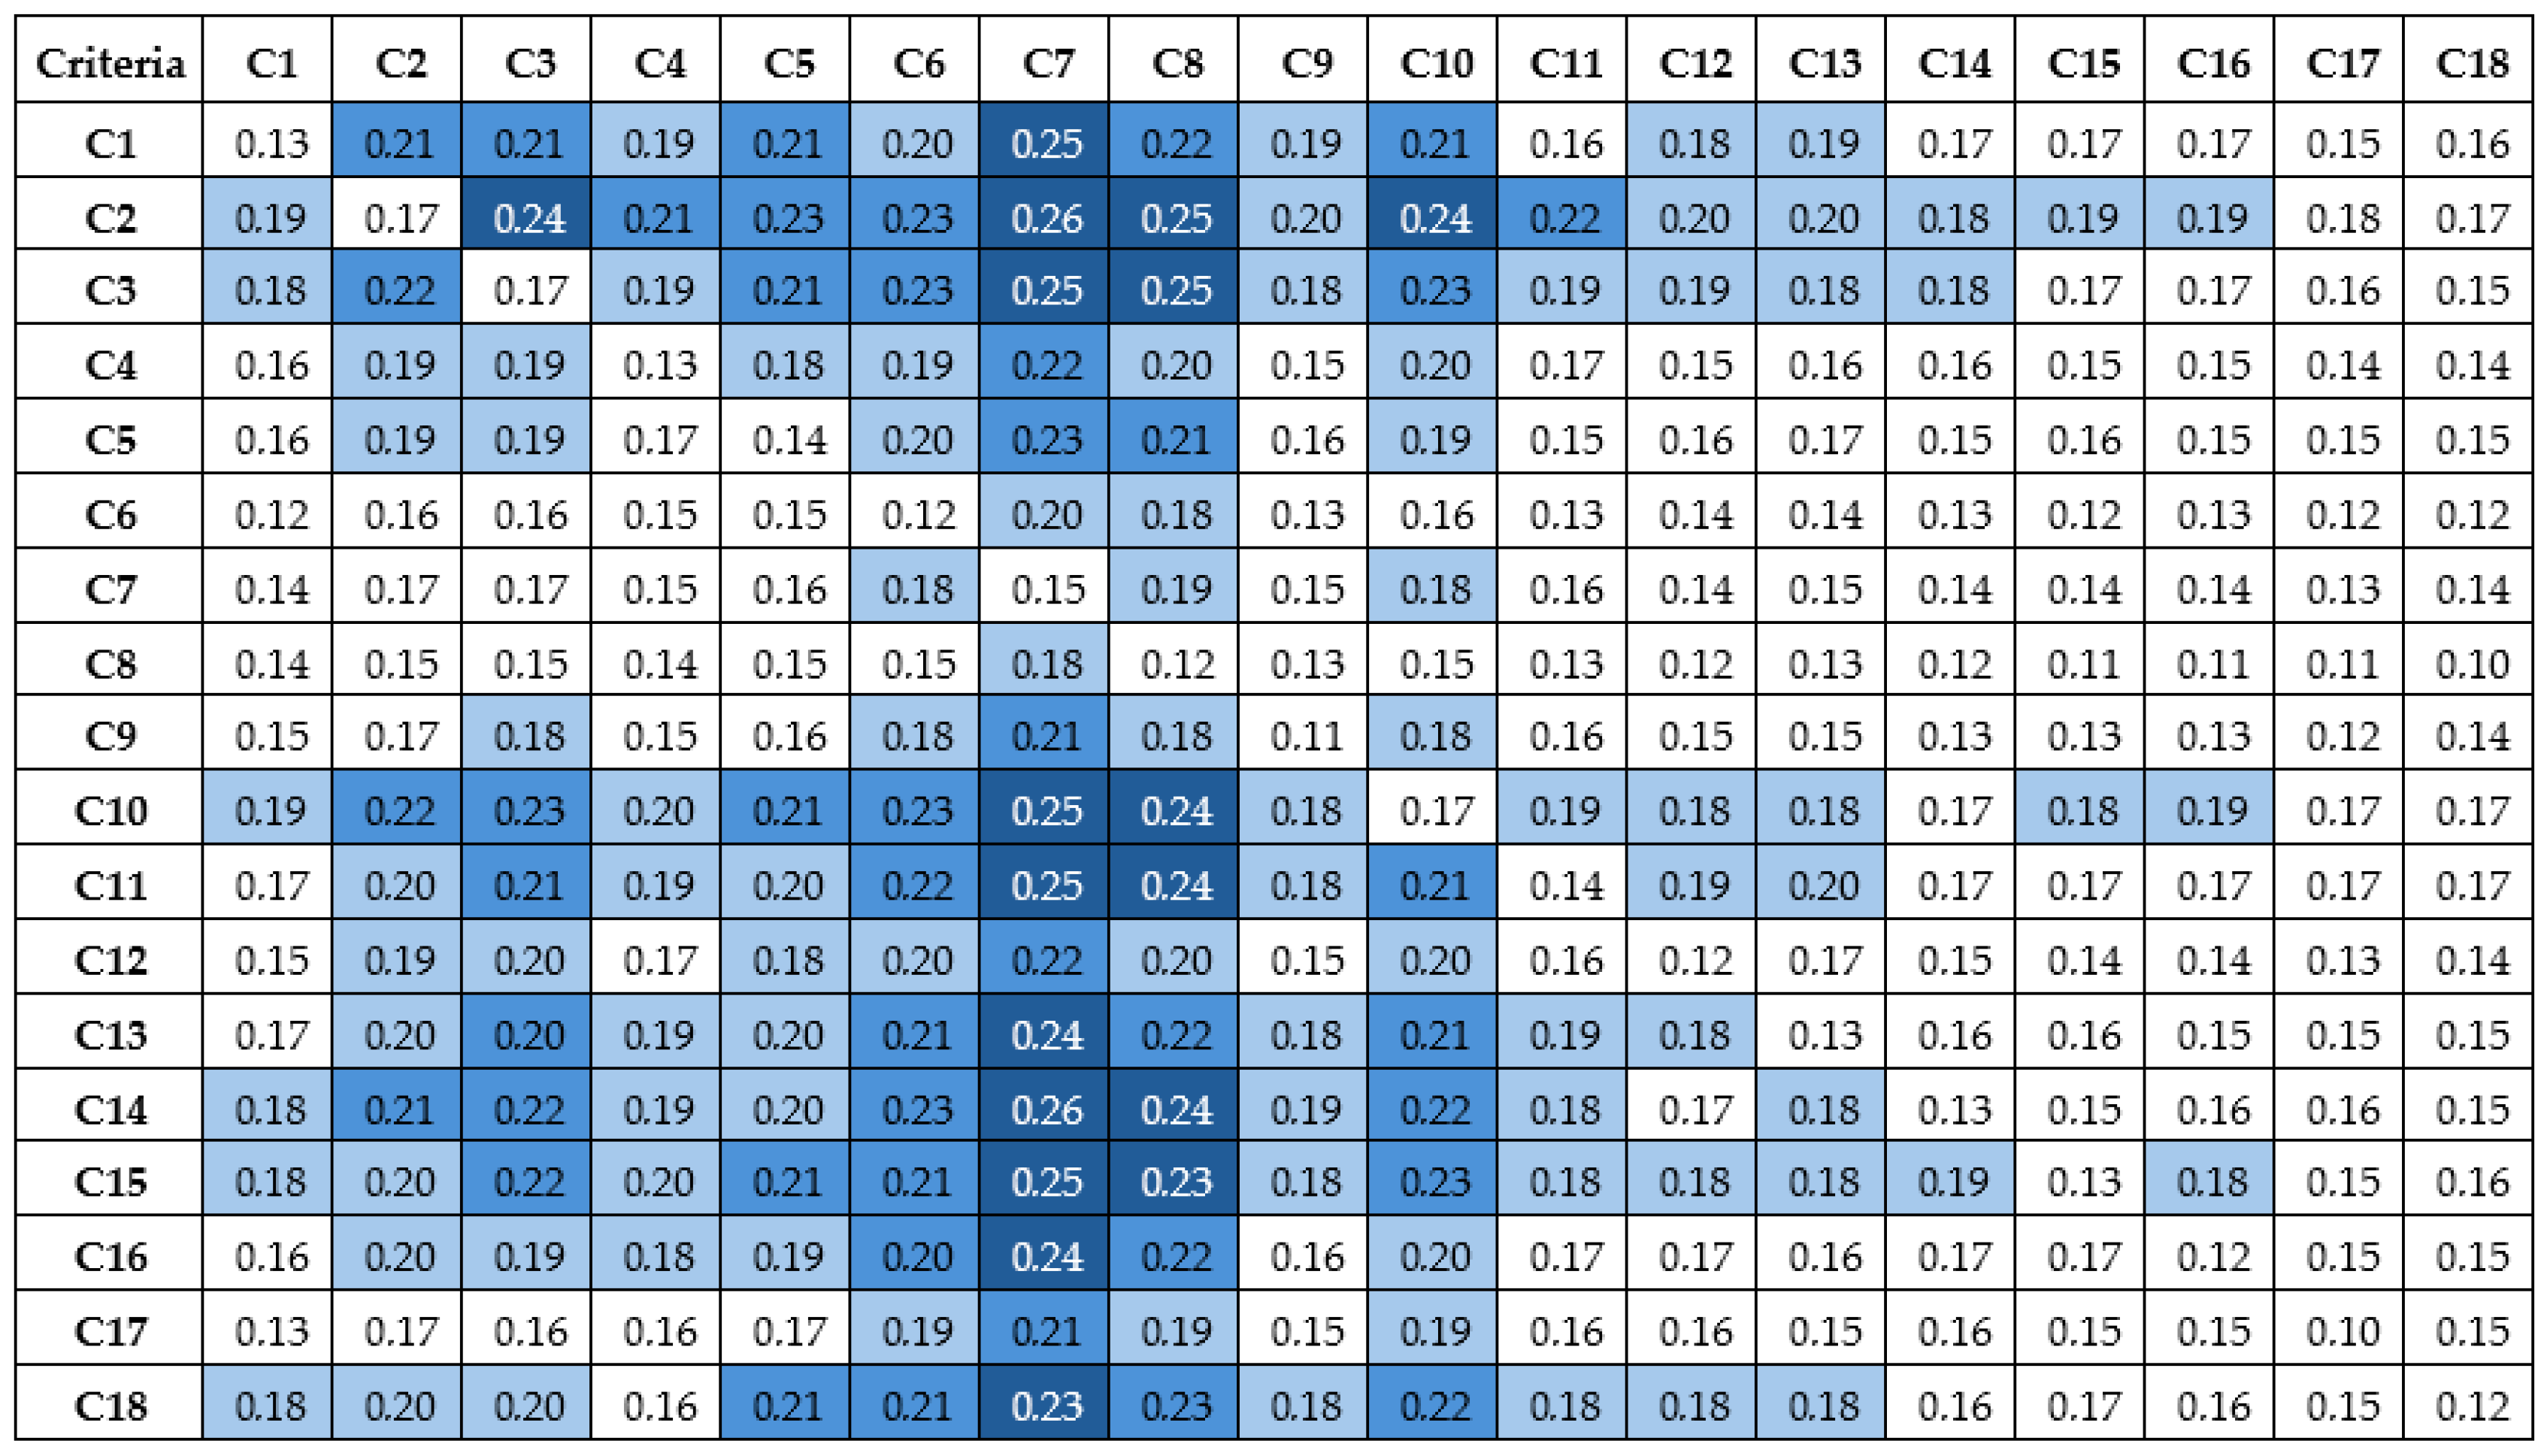
The threshold value and strength of the interactions between criteria are of great importance for interpreting the obtained values. Figure 5 was created using the total relation matrix, with the threshold value as a reference. The strength of the interactions was categorised through division of the range from the threshold (0.1757) to the maximum value (0.2627) of total relation matrix. According to this, the following applies:
Figure 5.
Strength of the interactions between criteria.
Consequently, the C1, C2, C3, C10, C11, C13, C14, C15 and C18 criteria have a strong influence on C7. In a similar manner, C2, C3, C10, C11, C14 and C15 have been demonstrated to exert significant influence on C8. It is evident that the system’s fundamental functions and its compliance with regulatory frameworks, in conjunction with the optimisation, integration and advanced technology capabilities of the TOS, have a considerable impact on costs and user-friendliness. Furthermore, it is evident that stability exerts a substantial influence on functionality and external integration capability. In conclusion, the findings indicate that the system’s features and capabilities will remain theoretical as long as they remain unrealised and interrupted. In this context, although TOS features such as stability, functionality, integration, optimisation and simulation will particularly influence terminal operators’ investment decisions and increase costs, they will enhance the advantages provided to users.
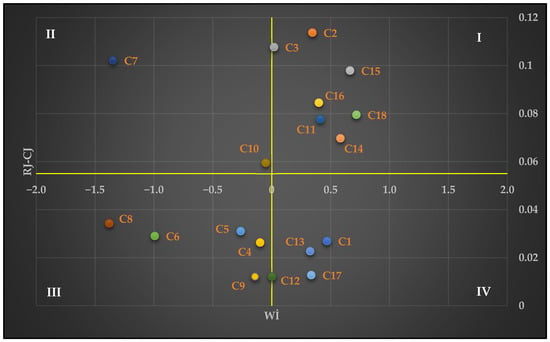
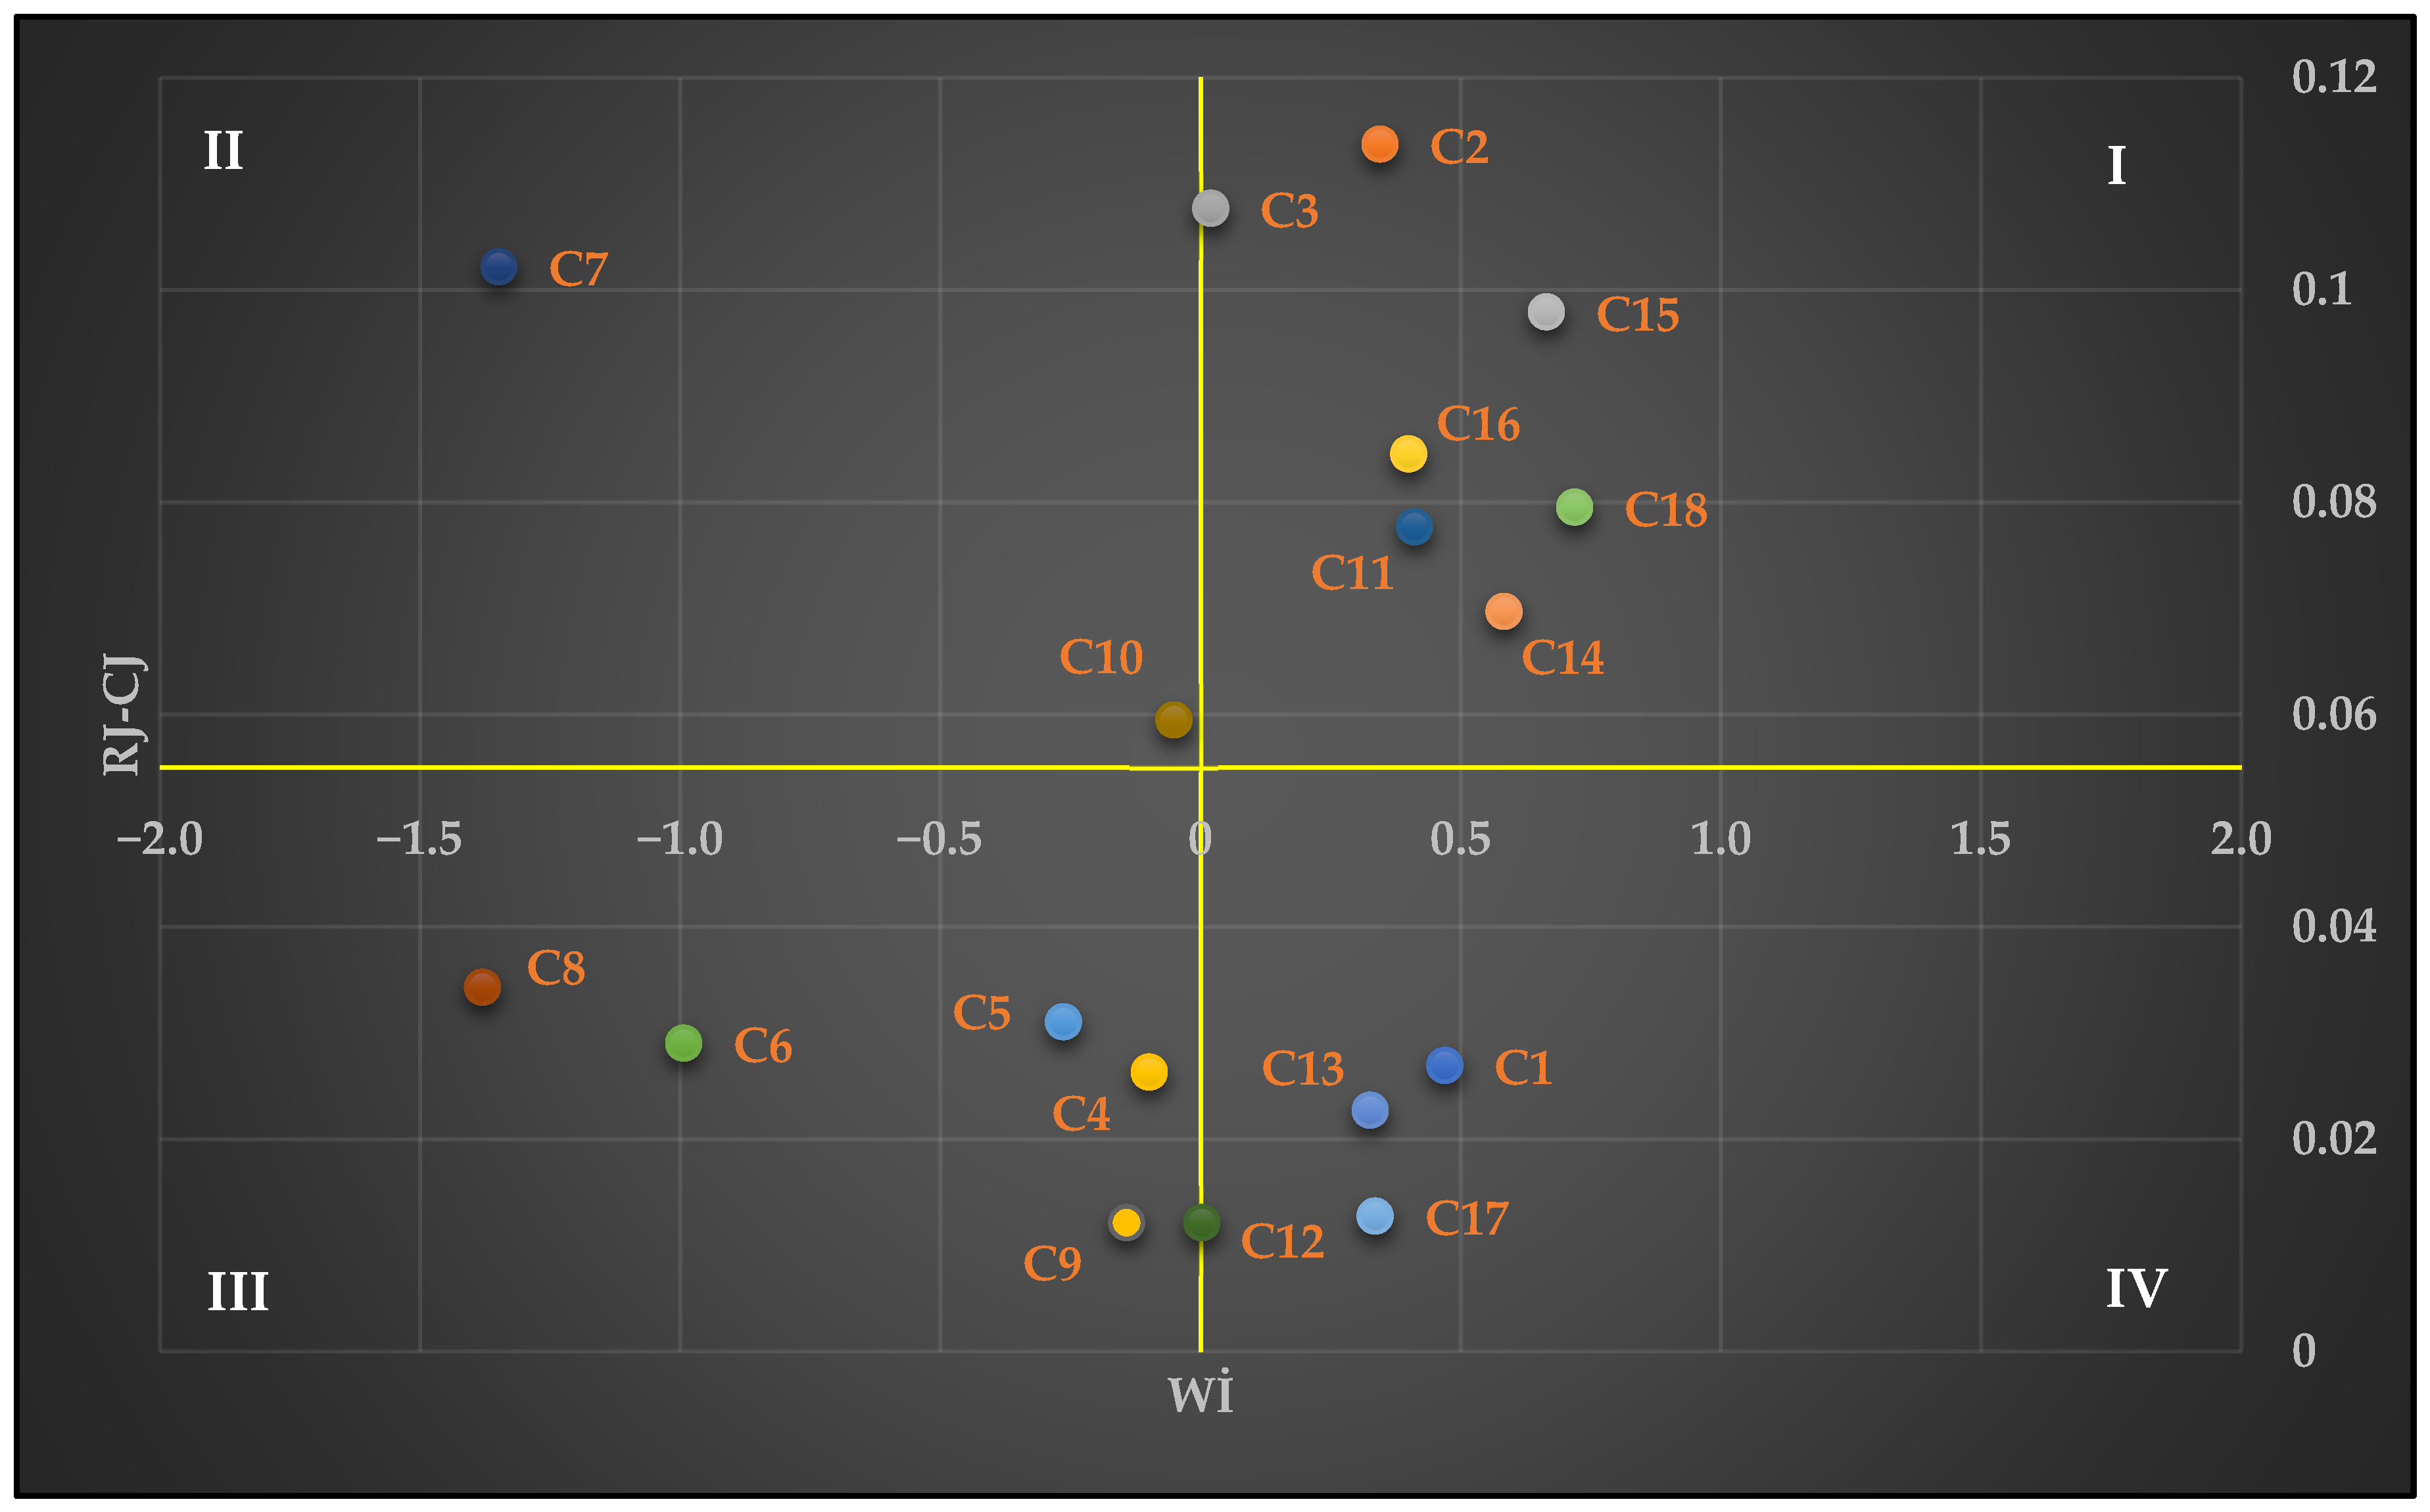
The weights and causal centrality-based graphical representation, created in accordance with the findings obtained using the FAHP and F-DEMATEL methods, is shown in Figure 6. The x-axis of the graph is composed of ( − ) values, while the y-axis is composed of () values. The reference point for the y-axis is 0.055, which is the average of the criterion weights. The delineation of the regions constituting the graph, along with the pertinent criteria, is elucidated in Table 21.
Figure 6.
Quadrant graph based on weights and causal centrality of criteria.
Table 21.
Definitions of quadrant regions.
The selection of a TOS is a management decision that is linked to operational strategy rather than an IT decision. Incorrect decisions in this issue, characterised by a substantial financial investment, have the potential to precipitate a sequence of challenging complications. As demonstrated in Table 21 and Figure 6, from the perspective of terminal operators, TOS investment decisions are predominantly influenced by stability, functionality, AI-based decision support, simulation, internal integration, real-time monitoring and legal compliance. These criteria are fundamental to the success of TOS investment decisions. TCO and external integration are more influenced by these criteria and improve as the cause criteria are enhanced. In the third quarter, these criteria are of lesser importance than other criteria and are subject to influence. While these factors constitute a secondary group of criteria in investment decisions, they ought to be evaluated as performance outputs linked to the cause criteria. The criteria in the fourth quarter are of relatively low importance, have a causal effect, and are the triggering characteristics of the system’s success.
6. Discussion and Conclusions
The volume of international trade, increasing cargo volumes, growing ship sizes and complex logistics networks have made the management of port processes even more challenging. In this context, the utilisation of advanced technology-based systems has become imperative for seaports, which are pivotal to supply chains. Despite the majority of ports yet to achieve a high level of digital maturity, Industry 4.0 technologies are changing port business models. It is particularly noteworthy that a number of prominent ports, both large and medium-sized, are allocating substantial resources to the development of infrastructure, technological equipment, information technologies and automation systems. These investments are being made with a view to achieving environmental sustainability, digitalisation, integration, modernisation, safety and security. In this context, Terminal Operating Systems (TOSs) play a pivotal role in the management of all operations and systems utilised. Comprising numerous modules and usable for different types of cargo terminals, TOSs are defined as the brain of ports and are considered to be strategic for advanced port operations. In view of the information presented, a comprehensive set of TOS selection criteria (18 criteria) for container terminals has been established and their importance levels have been calculated. Furthermore, the interactions between the criteria have been determined in the present study. To the author’s knowledge, this is the first study conducted on this subject with this scope. The establishment of the set of criteria was informed by academic literature and expert opinions. In this particular context, the study was conducted by a team of eight experts directly related to the subject matter, which significantly strengthens the reliability and applicability of the methodology.
The defined TOS selection criteria set was weighted using FAHP and the interactions between these criteria were examined using F-DEMATEL. The findings indicate that, in addition to certain fundamental characteristics (stability, functionality, TCO and compliance with legal requirements) expected from all information systems, internal and external integration, automation, real-time monitoring, AI-powered optimisation and simulation capabilities are of similar importance. Indeed, factors such as these take precedence over user-friendliness, provider support and customisation. This suggests that TOSs should be structured in a manner that facilitates the smartisation process of ports and enhances their digital maturity. In this particular context, it is evident that container terminal operators anticipate a TOS structure that can collaborate effectively with advanced technologies and also provide automation and decision support. Furthermore, the fact that TOSs should support real-time monitoring and integration with external stakeholders is also critical in terms of collaboration and transparency, which are of great importance in supply chain management. The findings of this study are consistent with and parallel to those of the studies by [5,18,57,62] A further crucial point pertains to the rankings of root cause analysis and environmental sustainability tracking criteria. The rankings indicate that terminal operators anticipate TOS support for the issues they face in identifying the root causes of specific problems, resolving them and monitoring environmental sustainability. It is interesting to note that cybersecurity posture is one of the relatively less important criteria. Terminals are not merely facilities for cargo transfers; they are also sites for intensive data transfer. In addition, it is important to note that terminal systems have the capacity to function in conjunction with a multitude of systems for the purpose of data sharing. This renders terminals susceptible to cyber threats. The relatively low importance value of this criterion indicates that, although experts consider TOS cyber security important, they view basic protection against cyber threats as the terminal’s primary multi-layered security architecture. It is evident that the cost criterion is a pivotal factor in investment decision-making. The findings of the present study lend support to this hypothesis. This finding is also consistent with the studies by [4,18]. Furthermore, it has been determined that the cost criterion is the most affected by other criteria. The findings of the F-DEMATEL analysis indicate that the integration with external stakeholders is of paramount importance, once again emphasising the pivotal role these terminals play in supply chains. Terminal operators anticipate that TOSs should contribute to the mitigation of specific deficiencies within this domain. In conclusion, container terminal operators expect TOSs to integrate complex business processes, provide effective decision support, enhance traceability, work seamlessly with advanced technologies and external systems and enable rapid intervention in bottlenecks.
The present study is expected to contribute to the TOS literature and provide benefits to container terminal managers in making more effective TOS investment decisions, thereby gaining a competitive advantage. It is hypothesised that the study will furnish port authorities and public institutions in the sector with the necessary insight to facilitate the development of effective port digitalisation policies. Furthermore, it is hoped that it will provide a framework for TOS providers to better understand their customers’ expectations and prioritise their product designs by examining the interactions of different criteria. Nevertheless, the present study is subject to various limitations. The analyses in the relevant study were conducted based on the assessments of experts located in Turkey who were easily accessible and the study is subject to geographical limitations. In this context, the study exclusively encompasses the opinions of experts in Turkey, thereby restricting its generalisability. It is important to note that the results obtained from interviews and surveys conducted with experts located in different countries may vary. In addition, it is anticipated that TOSs to be utilised in autonomous ports, which are projected to be managed exclusively by software and machinery in the near future, will be developed. These TOSs, which are likely to be based on deep learning, will offer more advanced functions and respond to different needs. In this context, the criteria to be determined will change and expand. In future studies, it is recommended that evaluations be conducted utilising novel sets of criteria and methodologies. In addition, the evaluation of TOSs currently in use in ports, using various sets of criteria or the performance of cost–benefit analyses, will also contribute to the extant literature. While the present study could also be of benefit to terminals handling other types of cargo, it has been conducted specifically for container terminals. In this context, further studies on other types of cargo (e.g., liquid bulk cargo, dry bulk cargo, neo-bulks) terminals would also be beneficial. It is evident that the efficiency and effectiveness of container and other cargo terminals, as a result of their investment in these systems and technologies, is of significant importance to ports, stakeholders and national economies. However, it should be noted that such investments require substantial financial resources. In this context, the provision of support through the implementation of incentives is likely to facilitate this process. It is imperative to acknowledge that, despite the technological underpinnings of these advancements, the demand for qualified and skilled workers remains paramount.
Funding
This research received no external funding.
Institutional Review Board Statement
The study was conducted in accordance with the Declaration of Helsinki and approved by the Ethics Committee of Istanbul Nisantasi University.
Data Availability Statement
The data that support the findings of this study are available from the corresponding author, upon reasonable request.
Conflicts of Interest
The author declares no conflicts of interest.
References
- Sahraoui, A.; Tran, N.K.; Tliche, Y.; Kacem, A.; Taghipour, A. Examining ICT Innovation for Sustainable Terminal Operations in Developing Countries: A Case Study of the Port of Radès in Tunisia. Sustainability 2023, 15, 9123. [Google Scholar] [CrossRef] [Scilit]
- Zhen, W. The evaluation of soft power investment effect on Shanghai Port competitiveness using DEA method. J. Marit. Res. 2015, 12, 45–52. [Google Scholar]
- Gultom, S.; Pasaribu, B.K.; Aishah, S.N.; Sirait, D.P. Terminal Operating System (TOS) Analysıs in Loading and Unloading Queue Productivity at PT IPC TPK Tanjung Priok. Adv. Transp. Logist. Res. 2024, 7, 544–557. [Google Scholar]
- Eichenhofer, J.O.; Heymann, E.; Miller, B.P.; Kang, A. An in-depth security assessment of maritime container terminal software systems. IEEE Access 2020, 8, 128050–128067. [Google Scholar] [CrossRef] [Scilit]
- Inutsuka, H.; Ichimura, K.; Sugimura, Y.; Yoshie, M.; Shinoda, T. Study on the Relationship between Port Governance and Terminal Operation System for Smart Port: Japan Case. Logistics 2024, 8, 59. [Google Scholar] [CrossRef] [Scilit]
- Notteboom, T.; Neyens, K. The Future of Port Logistics: Meeting the Challenges of Supply Chain Integration; ING Bannk: Bruselas, Belgium, 2017. [Google Scholar]
- Elgazzar, S.; Ismail, A. Enhancing Egyptian container terminals performance through managing efficiency and competitiveness. Mar. Econ. Manag. 2021, 4, 59–75. [Google Scholar] [CrossRef] [Scilit]
- Gekara, V.O.; Nguyen, X.V.T. Challenges of implementing container terminal operating system: The case of the port of Mombasa from the Belt and Road Initiative (BRI) perspective. J. Int. Logist. Trade 2020, 18, 49–60. [Google Scholar] [CrossRef] [Scilit]
- Stahlbock, R.; Voß, S. Operations research at container terminals: A literature update. OR Spectr. 2008, 30, 1–52. [Google Scholar] [CrossRef] [Scilit]
- Weerasinghe, B.A.; Perera, H.N.; Bai, X. Optimizing container terminal operations: A systematic review of operations research applications. Marit. Econ. Logist. 2024, 26, 307–341. [Google Scholar] [CrossRef] [Scilit]
- Turklim. Türkiye Limancılık Sektörü 2024 Raporu: Limanlarda Dijital Teknolojiler ve Akıllı Limanlar. 2024. Available online: https://www.turklim.org/turklim-sektor-raporu-2024/ (accessed on 1 August 2025).
- De la Peña Zarzuelo, I.; Soeane, M.J.F.; Bermúdez, B.L. Industry 4.0 in the port and maritime industry: A literature review. J. Ind. Inf. Integr. 2020, 20, 100173. [Google Scholar] [CrossRef] [Scilit]
- Lasi, H.; Fettke, P.; Kemper, H.G.; Feld, T.; Hoffmann, M. Industry 4.0. Bus. Inf. Syst. Eng. 2014, 6, 239–242. [Google Scholar] [CrossRef] [Scilit]
- Zhou, C.; Zhu, S.; Bell, M.G.; Lee, L.H.; Chew, E.P. Emerging technology and management research in the container terminals: Trends and the COVID-19 pandemic impacts. Ocean Coast. Manag. 2022, 230, 106318. [Google Scholar] [CrossRef] [Scilit]
- Yen, B.T.; Huang, M.J.; Lai, H.J.; Cho, H.H.; Huang, Y.L. How smart port design influences port efficiency—A DEA-Tobit approach. Res. Transp. Bus. Manag. 2023, 46, 100862. [Google Scholar] [CrossRef] [Scilit]
- Paraskevas, A.; Madas, M.; Zeimpekis, V.; Fouskas, K. Smart ports in industry 4.0: A systematic literature review. Logistics 2024, 8, 28. [Google Scholar] [CrossRef] [Scilit]
- Zoting, S. Smart Port Market Size and Forecast 2025 to 2034. Available online: https://www.precedenceresearch.com/smart-port-market (accessed on 1 August 2025).
- Hervás-Peralta, M.; Poveda-Reyes, S.; Molero, G.D.; Santarremigia, F.E.; Pastor-Ferrando, J.P. Improving the Performance of Dry and Maritime Ports by Increasing Knowledge about the Most Relevant Functionalities of the Terminal Operating System (TOS). Sustainability 2019, 11, 1648. [Google Scholar] [CrossRef] [Scilit]
- Attia, T.M. Importance of communication and information technology and its applications in the development and integration of performance in seaports. Renew. Energy Sustain. Dev. 2016, 2, 137–146. [Google Scholar] [CrossRef] [Scilit]
- Mondragon, A.E.C.; Mondragon, C.E.C.; Coronado, E.S. ICT adoption in multimodal transport sites: Investigating institutional-related influences in international seaports terminals. Transp. Res. Part A Policy Pract. 2017, 97, 69–88. [Google Scholar] [CrossRef] [Scilit]
- Kopczewski, M.; Grobelny, Z.; Płucienniczak, M. Telematics–electronic data interchange/EDI/in port transport logistics. J. Decis. Syst. 2020, 29, 301–311. [Google Scholar] [CrossRef] [Scilit]
- Russo, F.; Musolino, G. The role of emerging ICT in the ports: Increasing utilities according to shared decisions. Front. Future Transp. 2021, 2, 722812. [Google Scholar] [CrossRef] [Scilit]
- Moros-Daza, A.; Amaya-Mier, R.; Paternina-Arboleda, C. Port Community Systems: A structured literature review. Transp. Res. Part A Policy Pract. 2020, 133, 27–46. [Google Scholar] [CrossRef] [Scilit]
- Heilig, L.; Voß, S. Information systems in seaports: A categorization and overview. Inf. Technol. Manag. 2017, 18, 179–201. [Google Scholar] [CrossRef] [Scilit]
- Neugebauer, J.; Heilig, L.; Voß, S. Digital twins in the context of seaports and terminal facilities. Flex. Serv. Manuf. J. 2024, 36, 283–379. [Google Scholar] [CrossRef] [Scilit]
- Kastner, M.; Saporiti, N.; Lange, A.K.; Rossi, T. Insights into how to enhance container terminal operations with digital twins. Computers 2024, 13, 138. [Google Scholar] [CrossRef] [Scilit]
- Homayouni, S.M.; Pinho de Sousa, J.; Moreira Marques, C. Unlocking the potential of digital twins to achieve sustainability in seaports: The state of practice and future outlook. WMU J. Marit. Aff. 2025, 24, 59–98. [Google Scholar] [CrossRef] [Scilit]
- Owusu-Oware, E.; Effah, J.; Adam, I.O.; Amankwah-Sarfo, F. Actualizing the affordances of seaport smart container terminal system in a developing country. J. Inf. Technol. Case Appl. Res. 2023, 25, 339–367. [Google Scholar] [CrossRef] [Scilit]
- Guan, P.; Wood, L.C.; Wang, J.X.; Duong, L.N. Blockchain adoption in the port industry: A systematic literature review. Cogent Bus. Manag. 2024, 11, 2431650. [Google Scholar] [CrossRef] [Scilit]
- Bauk, S.; Schmeink, A.; Colomer, J. An RFID model for improving workers’ safety at the seaport in transitional environment. Transport 2018, 33, 353–363. [Google Scholar] [CrossRef] [Scilit]
- Mejri, E.; Andy, J.F. Exploring the Potential Adoption of Collaborative Autonomous Material Handling Vehicles/Robots in Non-Containerized Cargo Ports. In Proceedings of the IISE Annual Conference and Expo, Montreal, QC, Canada, 18–21 May 2024; Institute of Industrial and Systems Engineers (IISE): Norcross, GA, USA, 2024; pp. 1–6. [Google Scholar]
- Torsoli, G.; Stracca, S.; Puleri, M.; Win, M.Z.; Conti, A. Beyond 5G-assisted automatic guided vehicles in seaport environments. In Proceedings of the 2023 IEEE International Conference on Communications Workshops (ICC Workshops), Rome, Italy, 28 May–1 June 2023; pp. 1038–1043. [Google Scholar]
- Pavlić Skender, H.; Ribarić, E.; Jović, M. An overview of modern technologies in leading global seaports. Pomor. Zb. 2020, 59, 35–49. [Google Scholar] [CrossRef] [Scilit]
- Nikolakopoulos, A.; Julian Segui, M.; Pellicer, A.B.; Kefalogiannis, M.; Gizelis, C.A.; Marinakis, A.; Nestorakis, K.; Varvarigou, T. BigDaM: Efficient big data management and interoperability middleware for seaports as critical infrastructures. Computers 2023, 12, 218. [Google Scholar] [CrossRef] [Scilit]
- Peng, P.; Yang, Y.; Lu, F.; Cheng, S.; Mou, N.; Yang, R. Modelling the competitiveness of the ports along the Maritime Silk Road with big data. Transp. Res. Part A Policy Pract. 2018, 118, 852–867. [Google Scholar] [CrossRef] [Scilit]
- Agatic, A.; Kolanovic, I. Improving the seaport service quality by implementing digital technologies. Pomorstvo 2020, 34, 93–101. [Google Scholar] [CrossRef] [Scilit]
- Mi, C.; Chen, J.; Zhang, Z.; Huang, S.; Postolache, O. Visual sensor network task scheduling algorithm at automated container terminal. IEEE Sens. J. 2021, 22, 6042–6051. [Google Scholar] [CrossRef] [Scilit]
- Fernandez, P.; Santana, J.M.; Ortega, S.; Trujillo, A.; Suárez, J.P.; Domínguez, C.; Sánchez, A. SmartPort: A platform for sensor data monitoring in a seaport based on FIWARE. Sensors 2016, 16, 417. [Google Scholar] [CrossRef] [Scilit]
- Choi, H.R.; Kim, H.S.; Park, B.J.; Park, N.K.; Lee, S.W. An ERP approach for container terminal operating systems. Marit. Policy Manag. 2003, 30, 197–210. [Google Scholar] [CrossRef] [Scilit]
- Bouhlal, A.; Aitabdelouahid, R.; Marzak, A. The internet of things for smart ports. Procedia Comput. Sci. 2022, 203, 819–824. [Google Scholar] [CrossRef] [Scilit]
- Sadiq, M.; Su, C.L.; Terriche, Y.; Aragon, C.A.; Ali, S.W.; Buzna, L.U.; Parise, G. Toward next-generation smart ports: A case study on seaport microgrids customized for islands. IEEE Trans. Ind. Appl. 2024, 60, 7681–7692. [Google Scholar] [CrossRef] [Scilit]
- Jović, M.; Tijan, E.; Aksentijević, S.; Čišić, D. An overview of security challenges of seaport IoT systems. In Proceedings of the 2019 42nd International Convention on Information and Communication Technology, Electronics and Microelectronics (MIPRO), Opatija, Croatia, 20–24 May 2019; pp. 1349–1354. [Google Scholar]
- Ferretti, M.; Schiavone, F. Internet of Things and business processes redesign in seaports: The case of Hamburg. Bus. Process Manag. J. 2016, 22, 271–284. [Google Scholar] [CrossRef] [Scilit]
- Liu, X.; Yuen, K.F. A systematic review on artificial intelligence applications in seaports—A network analysis approach. Expert Syst. Appl. 2025, 259, 128309. [Google Scholar] [CrossRef] [Scilit]
- Kuo, S.Y.; Huang, X.R.; Chen, L.B. Smart ports: Sustainable smart business port operation schemes based on the Artificial Intelligence of Things and blockchain technologies. IEEE Potentials 2022, 41, 32–37. [Google Scholar] [CrossRef] [Scilit]
- El-Nakib, I.; Ismail, A. Analyzing the Implementation of Terminal Operating System on Enhancing the Efficiency of Alexandria Container Terminal. In Proceedings of the International Maritime and Logistics Conference, Online, 27–28 February 2025; pp. 1–14. [Google Scholar]
- Yi, S.; Yao, J.; Hui, Z. Design and implementation of the container terminal operating system based on service-oriented architecture (SOA). In Proceedings of the 2008 International Conference on Cyberworlds, Hangzhou, China, 22–24 September 2008; pp. 794–799. [Google Scholar]
- Kuznietsova, K.; Holiuk, V.; Voloshynovska, I. Modern trends in the development of container transportation in the world. Econ. Synerg. 2022, 1–2, 69–80. [Google Scholar]
- Martín-Soberón, A.M.; Monfort, A.; Sapiña, R.; Monterde, N.; Calduch, D. Automation in port container terminals. Procedia Soc. Behav. Sci. 2014, 160, 195–204. [Google Scholar] [CrossRef] [Scilit]
- Ding, Y.; Zhang, Z.; Chen, K.; Ding, H.; Voss, S.; Heilig, L.; Chen, X. Real-Time Monitoring and Optimal Resource Allocation for Automated Container Terminals: A Digital Twin Application at the Yangshan Port. J. Adv. Transp. 2023, 2023, 6909801. [Google Scholar] [CrossRef] [Scilit]
- Gonçalves, M.; Teixeira, L. Decision support system for port terminals: Design and development of a business intelligence tool. Procedia Comput. Sci. 2025, 253, 2438–2447. [Google Scholar] [CrossRef] [Scilit]
- Sadiq, M.; Ali, S.W.; Terriche, Y.; Mutarraf, M.U.; Hassan, M.A.; Hamid, K.; Ali, Z.; Sze, J.Y.; Su, C.L.; Guerrero, J.M. Future greener seaports: A review of new infrastructure, challenges, and energy efficiency measures. IEEE Access 2021, 9, 75568–75587. [Google Scholar] [CrossRef] [Scilit]
- Notteboom, T. Strategic challenges to container ports in a changing market environment. Res. Transp. Econ. 2006, 17, 29–52. [Google Scholar] [CrossRef] [Scilit]
- Sarkar, B.D.; Shankar, R.; Kar, A.K. Port logistic issues and challenges in the Industry 4.0 era for emerging economies: An India perspective. Benchmarking 2023, 30, 50–74. [Google Scholar] [CrossRef] [Scilit]
- Johnson, H.; Styhre, L. Increased energy efficiency in short sea shipping through decreased time in port. Transp. Res. Part A Policy Pract. 2015, 71, 167–178. [Google Scholar] [CrossRef] [Scilit]
- Alavi, A.; Nguyen, H.O.; Fei, J.; Sayareh, J. Port logistics integration: Challenges and approaches. Int. J. Supply Chain Manag. 2018, 7, 389–402. [Google Scholar]
- Singgih, I.K.; Jin, X.; Hong, S.; Kim, K.H. Architectural design of terminal operating system for a container terminal based on a new concept. Ind. Eng. Manag. Syst. 2016, 15, 278–288. [Google Scholar] [CrossRef] [Scilit]
- Olusegun Onifade, A. New seaport development-prospects and challenges: Perspectives from Apapa and Calabar Seaports, Nigeria. Logistics 2020, 4, 8. [Google Scholar] [CrossRef] [Scilit]
- Min, H.; Ahn, S.B.; Lee, H.S.; Park, H. An integrated terminal operating system for enhancing the efficiency of seaport terminal operators. Marit. Econ. Logist. 2017, 19, 428–450. [Google Scholar] [CrossRef] [Scilit]
- Chhetri, P.; Jayatilleke, G.B.; Gekara, V.O.; Manzoni, A.; Corbitt, B. Container terminal operations simulator (CTOS)—Simulating the impact of extreme weather events on port operation. Eur. J. Transp. Infrastruct. Res. 2016, 16, 195–214. [Google Scholar] [CrossRef] [Scilit]
- Buhl, R.S.; Schwientek, A. A Terminal Operating Systems 2016: An International Market Review of Current Software Applications for Terminal Operators; Jahn, C., Ed.; Fraunhofer Center for Maritime Logistics and Services: Stuttgart, Germany, 2016; ISBN 978-3-8396-1034-3. [Google Scholar]
- Yau, K.L.A.; Peng, S.; Qadir, J.; Low, Y.C.; Ling, M.H. Towards smart port infrastructures: Enhancing port activities using information and communications technology. IEEE Access 2020, 8, 83387–83404. [Google Scholar] [CrossRef] [Scilit]
- Quoc, V.P.; Quoc, T.L. Operational efficiency for container terminal operators with undesirable outputs: Slacks-based measures. Transp. Plan. Technol. 2024, 47, 284–301. [Google Scholar] [CrossRef] [Scilit]
- Boer, C.A.; Saanen, Y.A.; Gunther, H.O.; Kim, K.H.; Kopfer, H. Testing, tuning and training terminal operating systems. A modern approach. In Proceedings of the International Conference on Logistics and Maritime Systems (LOGMS), Hamburg, Germany, 28–30 August 2012; pp. 25–35. [Google Scholar]
- Acciaro, M.; Serra, P. Strategic determinants of terminal operating system choice: An empirical approach using multinomial analysis. Transp. Res. Procedia 2014, 3, 592–601. [Google Scholar] [CrossRef] [Scilit]
- Breskin, I.; Pandey, A. Marine terminal operating systems: Connecting ports into the digital world. In The Digital Transformation of Logistics: Demystifying Impacts of the Fourth Industrial Revolution; Wiley Online Library: Hoboken, NJ, USA, 2021; pp. 197–208. [Google Scholar]
- Ngai, E.W.T.; Li, C.L.; Cheng, T.C.E.; Lun, Y.V.; Lai, K.H.; Cao, J.; Lee, M.C.M. Design and development of an intelligent context-aware decision support system for real-time monitoring of container terminal operations. Int. J. Prod. Res. 2011, 49, 3501–3526. [Google Scholar] [CrossRef] [Scilit]
- Knatz, G.; Notteboom, T.; Pallis, A.A. Container terminal automation: Assessment of drivers and benefits. Marit. Policy Manag. 2024, 51, 1252–1276. [Google Scholar] [CrossRef] [Scilit]
- Jamal, A.; Sarno, R.; Ginardi, H. Analyzing the benefit of implementing integrated dgps and terminal operating system at yard terminal Surabaya. J. Theor. Appl. Inf. Technol. 2017, 95, 948–959. [Google Scholar]
- Bartosiewicz, A. Terminal operating systems as a tool to support entrepreneurship and competitiveness of sea ports. Przedsiębiorczość I Zarządzanie 2014, 15, 175–187. [Google Scholar]
- Lee, P.T.W.; Lam, J.S.L.; Lin, C.W.; Hu, K.C.; Cheong, I. Developing the fifth generation port concept model: An empirical test. Int. J. Logist. Manag. 2018, 29, 1098–1120. [Google Scholar] [CrossRef] [Scilit]
- Carlan, V.; Sys, C.; Vanelslander, T.; Roumboutsos, A. Digital innovation in the port sector: Barriers and facilitators. Compet. Regul. Netw. Ind. 2017, 18, 71–93. [Google Scholar] [CrossRef] [Scilit]
- Murty, K.G.; Liu, J.; Wan, Y.; Linn, R. A decision support system for operations in a container terminal. Decis. Support Syst. 2005, 39, 309–332. [Google Scholar] [CrossRef] [Scilit]
- Kim, K.H.; Lee, H. Container terminal operation: Current trends and future challenges. In Handbook of Ocean Container Transport Logistics: Making Global Supply Chains Effective; Springer: Cham, Switzerland, 2014; pp. 43–73. [Google Scholar]
- Rodrigue, J.P.; Notteboom, T.E.; Pallis, A.A. The COVID-19 pandemic and the transformation of the shipping and port industries. Marit. Econ. Logist. 2020, 22, 185–210. [Google Scholar]
- Atak, Ü.; Arslanoğlu, Y. Machine learning methods for predicting marine port accidents: A case study in container terminal. Ships Offshore Struct. 2022, 17, 2480–2487. [Google Scholar] [CrossRef] [Scilit]
- Neagoe, M.; Turner, P.; Nguyen, H.-O.; Taskhiri, M.S. Port terminal congestion management. An integrated information systems approach for improving supply chain value. In Proceedings of the Australasian Conference on Information Systems (ACIS 2017), Hobart, Australia, 4–6 December 2017; p. 72. [Google Scholar]
- Renken, K.; Zander, K.O.; Brümmerstedt, K. Terminal Operation Software: A Saturated Market? In Proceedings of the Transport Research Arena Conference (TRA), Vienna, Austria, 16–19 April 2018. [Google Scholar]
- Yalcin, S.; Ayyildiz, E. Prioritizing Vulnerability Factors of Global Food Supply Chains by Fermatean Fuzzy Analytical Hierarchy Process. Found. Comput. Decis. Sci. 2024, 49, 295–319. [Google Scholar] [CrossRef] [Scilit]
- Hansen, K.; Haddara, M.; Langseth, M. Exploring multi-criteria decision-making methods in ERP selection. Procedia Comput. Sci. 2023, 219, 879–888. [Google Scholar] [CrossRef] [Scilit]
- Costa, J.P.; Lacalle, I.; Llorente, M.A.; O Le Brun, L.P.; Ptsikas, L.; de Marco, G.; Garnier, C.; Simon, E.; Gherghina, A.; Tsolakis, O.; et al. Advantage of a green and smart port of the future. WIT Trans. Built Environ. 2021, 204, 203–217. [Google Scholar] [CrossRef] [Scilit]
- Degraeve, Z.; Roodhooft, F.; van Doveren, B. The use of total cost of ownership for strategic procurement: A company-wide management information system. J. Oper. Res. Soc. 2005, 56, 51–59. [Google Scholar] [CrossRef] [Scilit]
- Santhanam, R.; Kyparisis, J. A multiple criteria decision model for information system project selection. Comput. Oper. Res. 1995, 22, 807–818. [Google Scholar] [CrossRef] [Scilit]
- Ahmed, R.; Oliver, G.; Rahim, M. Understanding potentials of cloud ERP adoption by large organisations: A case study. In Proceedings of the Twenty-Third Pacific Asia Conference on Information Systems, Dubai, United Arab Emirates, 10–12 July 2020. [Google Scholar]
- Ward, T. Terminal operating system selection. Port Technol. 2013, 58, 46–48. Available online: https://www.porttechnology.org/wp-content/uploads/2019/05/Terminal_operating_system_selection.pdf (accessed on 5 August 2025).
- Dragović, B.; Tzannatos, E.; Park, N.K. Simulation modelling in ports and container terminals: Literature overview and analysis by research field, application area and tool. Flex. Serv. Manuf. J. 2017, 29, 4–34. [Google Scholar] [CrossRef] [Scilit]
- Carvalho, C.C.; de Sousa, J.P.; Santos, R.; Marques, C.M. A simulation tool for container operations management at seaport terminals. Transp. Res. Procedia 2025, 86, 604–611. [Google Scholar] [CrossRef] [Scilit]
- Yang, Y.; Zhong, M.; Yao, H.; Yu, F.; Fu, X.; Postolache, O. Internet of things for smart ports: Technologies and challenges. IEEE Instrum. Meas. Mag. 2018, 21, 34–43. [Google Scholar] [CrossRef] [Scilit]
- Turklim. Türkiye Limancılık Sektörü 2025 Raporu: Emniyetli ve Güvenli Limanlar. 2025. Available online: https://www.turklim.org/turkiye-limancilik-sektoru-2025-raporu/ (accessed on 5 August 2025).
- Amornkitvikai, Y.; Tham, S.Y.; Tangpoolcharoen, J. Barriers and factors affecting E-commerce utilization of Thai small and medium-sized enterprises in food and beverage and retail services. Glob. Bus. Rev. 2025, 26, 707–730. [Google Scholar] [CrossRef] [Scilit]
- Yeboah-Boateng, E.O.; Essandoh, K.A. Factors influencing the adoption of cloud computing by small and medium enterprises in developing economies. Int. J. Emerg. Sci. Eng. 2014, 2, 13–20. [Google Scholar]
- Gaete, M.; González-Araya, M.C.; González-Ramírez, R.G.; Astudillo, C. A dwell time-based container positioning decision support system at a port terminal. In Proceedings of the International Conference on Operations Research and Enterprise Systems, Porto, Portugal, 23–25 February 2017; pp. 128–139. [Google Scholar]
- Çebi, S.; İlkbahar, E. Bulanık Analitik Hiyerarşi Prosesi: Buckley AHP ve Proje Risk Yönetimine Uygulanması. In Bulanık Çok Kriterli Karar Verme Yöntemleri; Kabak, M., Erdebilli, B., Eds.; Nobel Akademik Yayıncılık: Ankara, Turkey, 2017; pp. 27–46. [Google Scholar]
- Malinic, V.; Durlević, U.; Brašanac-Bosanac, L.; Novković, I.; Joksimović, M.; Golić, R.; Krstić, F. A Hybrid Fuzzy AHP–MULTIMOORA Approach for Solar Energy Development on Rural Brownfield Sites in Serbia. Sustainability 2025, 17, 7988. [Google Scholar] [CrossRef] [Scilit]
- Yang, Q.; Huang, J.; Pan, W. Assessing the Sustainable Development of the Tourism Industry Based on Fuzzy AHP and Grey Relational TOPSIS. Sustainability 2025, 17, 9799. [Google Scholar] [CrossRef] [Scilit]
- Zuldekra; Hasbullah, R.; Asikin, Z.; Novianti, T. Prioritizing Sustainable Marketing Innovation for Pharmaceutical Firms in Indonesia. Sustainability 2025, 17, 9917. [Google Scholar] [CrossRef] [Scilit]
- Alqahtani, F.M.; Noman, M.A. An Integrated Fuzzy Delphi and Fuzzy AHP Model for Evaluating Factors Affecting Human Errors in Manual Assembly Processes. Systems 2024, 12, 479. [Google Scholar] [CrossRef] [Scilit]
- Gupta, S.; Raj, S.; Gupta, S.; Sharma, A. Prioritising crowdfunding benefits: A fuzzy-AHP approach. Qual. Quant. 2023, 57, 379–400. [Google Scholar] [CrossRef] [Scilit]
- Jewpanya, P.; Nuangpirom, P.; Nakkiew, W.; Pitjamit, S.; Jaichomphu, P. Optimizing Tourist Destination Selection Using AHP and Fuzzy AHP Based on Individual Preferences for Personalized Tourism. Sustainability 2025, 17, 1116. [Google Scholar] [CrossRef] [Scilit]
- Saraçoğlu, İ.; Dağıstanlı, H.A. Tedarikçi Seçiminde Bulanik Mantik-Ahp Ve Vikor Yönteminin Bağlanti Elemanlari Firmasinda Uygulanmasi. Yaşar Üniversitesi E-Derg. 2017, 12, 40–54. [Google Scholar]
- Kaur, S.; Singh, S.; Gupta, S.; Wats, S. Risk analysis in decentralized finance (DeFi): A fuzzy-AHP approach. Risk Manag. 2023, 25, 13–31. [Google Scholar]
- Saaty, R.W. The Analytic Hierarchy Process, Planning, Priority Setting, Resources Allocation; McGraw-Hill: New York, NY, USA, 1980; ISSN 2367–8941. [Google Scholar]
- Tang, N.; Quan, X.; Guo, X.; Song, Y.; Zhang, S. Research on Safety Assessment of Coal Mine Gas Outburst Based on Fuzzy DEMATEL-TOPSIS Method. Processes 2025, 13, 3464. [Google Scholar] [CrossRef] [Scilit]
- Kuzu, A.C. Application of fuzzy DEMATEL approach in maritime transportation: A risk analysis of anchor loss. Ocean Eng. 2023, 273, 113786. [Google Scholar] [CrossRef] [Scilit]
- Khatun, M.; Wagner, F.; Jung, R.; Glaß, M. An application of DEMATEL and fuzzy DEMATEL to evaluate the interaction of safety management system and cybersecurity management system in automated vehicles. Eng. Appl. Artif. Intell. 2023, 124, 106566. [Google Scholar] [CrossRef] [Scilit]
- Magableh, G.M. A Developed Model for Measuring Supply Chain Nervousness, Using Fuzzy-DEMATEL to Analyze the Correlation Between Measurement Factors. Systems 2025, 13, 1009. [Google Scholar] [CrossRef] [Scilit]
- Chang, B.; Chang, C.W.; Wu, C.H. Fuzzy DEMATEL method for developing supplier selection criteria. Expert Syst. Appl. 2011, 38, 1850–1858. [Google Scholar] [CrossRef] [Scilit]
- Luthra, S.; Govindan, K.; Kharb, R.K.; Mangla, S.K. Evaluating the enablers in solar power developments in the current scenario using fuzzy DEMATEL: An Indian perspective. Renew. Sustain. Energy Rev. 2016, 63, 379–397. [Google Scholar] [CrossRef] [Scilit]
- Muravev, D.; Hu, H.; Zhou, H.; Pamucar, D. Location optimization of CR express international logistics centers. Symmetry 2020, 12, 143. [Google Scholar] [CrossRef] [Scilit]
- Garg, S.; Bhardwaj, R. Exploring the influence of factors causing stress among doctoral students by combining fuzzy DEMATEL-ANP with a triangular approach. Scientometrics 2024, 129, 4695–4719. [Google Scholar] [CrossRef] [Scilit]
- Hayrapetyan, L.R. Random Consıstency Indıces For Analytıc Hıerarchy Processes. Int. J. Bus. Mark. Decis. Sci. 2019, 12, 50–68. [Google Scholar]

Disclaimer/Publisher’s Note: The statements, opinions and data contained in all publications are solely those of the individual author(s) and contributor(s) and not of MDPI and/or the editor(s). MDPI and/or the editor(s) disclaim responsibility for any injury to people or property resulting from any ideas, methods, instructions or products referred to in the content. |
© 2026 by the author. Licensee MDPI, Basel, Switzerland. This article is an open access article distributed under the terms and conditions of the Creative Commons Attribution (CC BY) license.