


Highlights
Please indicate how your work links to systems science via your contributions to systems practice, theory, and/or methodology.
- This paper proposes an integrated self-assessment framework of three composite indices: the Digital Transformation Readiness Index (DTRI), the Integration Maturity Index (IMI), and the Sustainability Orientation Index (SOI). Together, they treat digitalization and sustainability as a single measurement problem observed in the same organization at the same time.
- The framework draws on dynamic capabilities and socio-technical systems reasoning, pairing a technical and a social subsystem within each index. It also specifies a multilevel measurement architecture that links organization-level readiness and sustainability governance to process-level integration maturity.
What are the main findings and/or the implications of the main findings?
- We provide complete pre-validation specifications of all three instruments, including item inventories, 0–100 normalization and equal-weighting rules, bottleneck flags, and interpretive maturity bands. These specifications are accompanied by a validation protocol that distinguishes between reflective and formative levels of measurement.
- We position integration maturity as the connective construct between digital readiness and sustainability governance and formulate testable cross-level propositions (P1–P3). This provides a basis for detecting twin-transition trade-offs that single-domain maturity models cannot capture.
Abstract
Contemporary enterprises must pursue digitalization while satisfying increasingly formalized expectations of verifiable sustainability performance, and compact diagnostic instruments capable of evaluating these agendas jointly are still scarce. This article develops such an instrument in the form of three composite self-assessment indices: the Digital Transformation Readiness Index (DTRI), the Integration Maturity Index (IMI), and the Sustainability Orientation Index (SOI). Building on research streams in digital transformation, Business Process Management (BPM), intelligent process automation, and ESG governance, we position the three indices within an explicit conceptual framework—grounded in dynamic capabilities and socio-technical reasoning—in which the DTRI represents enabling conditions, the IMI the process-level transmission mechanism, and the SOI the directional governance layer. Each index aggregates several subdimensions—captured through Likert-scale survey items and ordinal maturity checklists—into an interpretable score on a 0–100 scale. The construction procedure adheres to established methodological guidance for composite indicators, documenting the instrument development pathway from literature-derived construct definitions through item generation to refinement, and making the unit of analysis, normalization, and equal-weighting choices explicit. The paper is positioned explicitly as an instrument-development protocol rather than as an already validated measurement model. It reports the complete pre-validation specification of all three instruments—full item inventories, the exact normalization and aggregation rules, and interpretive maturity bands—with the complete batteries, scoring keys and anchor rubrics, and it sets out a validation protocol that separates reflective from formative levels of measurement, specifies the multilevel procedures required by the cross-level propositions, and covers content validity, reliability, discriminant validity, weighting sensitivity and common method bias. By treating digitalization and sustainability as a single measurement problem observed on the same organization at the same time, the framework also responds to the operationalization gap identified in the twin transition literature. The framework is presented as a theoretically anchored measurement proposal whose empirical validation constitutes the immediate next research step. On that basis it offers scholars and practitioners a coherent starting point for gauging an organization’s capacity to coordinate digital transformation, orchestrated automation, and sustainability governance within a single assessment exercise.
1. Introduction
Two structural demands currently shape managerial agendas at the same time: firms are expected to digitalize their operating models and, in parallel, to document credible sustainability performance to regulators, investors, and customers [1,2]. What most organizations lack, however, is a compact and defensible way of checking whether their internal capabilities, technological foundations, and governance arrangements can actually carry both ambitions [3,4]. Business Process Management (BPM) offers the managerial discipline through which strategic intent is converted into designed, executed, and monitored processes, and it therefore constitutes a natural anchor for such an assessment [5,6]. The recent diffusion of intelligent, multi-technology process automation—combining Robotic Process Automation (RPA), machine learning, process mining, workflow engines, and integration services—has further raised the stakes, because the value of these technologies depends on how coherently they are embedded in process architectures and governance systems rather than on their isolated deployment [7,8,9].
Although sustainable development, ESG frameworks, and BPM capabilities are each conceptually well developed, organization-level metrics that jointly quantify digital transformation readiness, automation integration maturity, and sustainability orientation remain rare [4,6,10]. The sustainability literature stresses the multidimensional character of economic, environmental, and social performance and the growing weight of governance, measurement, and mandatory reporting [2,11,12]. BPM research, for its part, documents how process-oriented capabilities, modeling standards, and digital technologies enable systematic change, yet it typically treats digital readiness and sustainability as background context instead of as measurable constructs embedded in process governance [13,14,15].
A further development sharpens the urgency of such measurement. The rapid diffusion of generative artificial intelligence is beginning to alter how organizations process information, allocate analytical effort, and compete: quasi-experimental evidence from the temporary ban of a widely used generative model in Italy documents measurable effects on information processing in the firms that lost access to it [16], and related work traces the economic consequences of disrupted adoption [17]. These effects matter disproportionately for small and medium-sized enterprises, for which such tools lower the cost of analysis and narrow the information asymmetry with larger counterparts, but which are also least likely to possess the skills, data foundations, and governance arrangements that decide whether the technology delivers value rather than risk. The instruments developed here are deliberately scaled so that smaller organizations can administer them without consulting support, and the DTRI treats automation and AI literacy as an explicit facet of workforce readiness rather than as an advanced extension of it.
The present article responds to this deficit by constructing three composite indices. The Digital Transformation Readiness Index (DTRI) gauges an organization’s preparedness for digital transformation through indicators of workforce digital skills, employee attitudes toward change, and the maturity of the supporting technical infrastructure. The Integration Maturity Index (IMI) evaluates how far BPM governance and intelligent automation technologies have been consolidated into an orchestrated, end-to-end operating model, covering process documentation, technology synergy, governance, and architectural components. The Sustainability Orientation Index (SOI) captures the depth to which sustainability principles are anchored in strategy, translated into process-level practice, and operationalized through governance and reporting routines. Together, the three indices form a pragmatic self-assessment framework that can be administered through surveys and checklists at both the organizational and the process level.
The objective of the article is threefold:
- to articulate the conceptual foundations and construction logic of the DTRI, the IMI, and the SOI based on established research in digital transformation, BPM, and sustainability;
- to position the three indices within an explicit theoretical framework that clarifies whether and how they operate as separate yet architecturally integrated constructs; and
- to document the methodology used to build these composite indices and to prepare their operationalization—including a concrete validation protocol—for empirical deployment in organizations.
At this stage the study deliberately refrains from estimating complex causal models. Its ambition is to deliver a self-assessment measurement framework whose outputs are directly interpretable—revealing which facets of readiness, integration, and sustainability governance are most critical in a given organization—and which can inform both managerial decision-making and the iterative refinement of the indices in follow-up research [18,19]. Accordingly, the present article should be read as an instrument-development protocol: it specifies constructs, items, scoring rules, and the analytical plan by which their psychometric properties will be established, and it does not claim that the indices are yet validated, comparable across organizations, or suitable for benchmarking or classification. Every statement about interpretability, diagnostic value, and managerial usefulness in what follows is therefore to be read as a property to be demonstrated, not as a property already demonstrated.
2. Literature Review
2.1. Digital Transformation and Business Process Management
Digital transformation is commonly framed as a socio-technical change trajectory in which digital technologies are woven into strategy, structures, and day-to-day operations so that the organization can perform and adapt in volatile environments [1,3]. BPM supplies the managerial machinery that turns such strategic intent into concrete process designs, execution routines, and monitoring loops, thereby coordinating technologies, data, and governance around end-to-end value creation [5,20]. A growing body of work argues that digitalization reshapes the capability set BPM itself requires: Delphi evidence indicates that established BPM capability frameworks must be extended with data-driven, continuously evolving, and platform-enabled capability areas [6], while strategy-oriented studies show that organizations pursue distinct digital transformation archetypes whose meta-objectives are best defined and steered through process management [13].
2.2. Sustainability, ESG, and the Twin Transition
The sustainability discourse is conventionally organized around three mutually reinforcing pillars—economic, environmental, and social—whose conceptual lineage has been traced in detail by sustainability scholars [11,21,22]. ESG frameworks translate these pillars into governance and reporting systems, turning sustainability performance into an element of formal corporate accountability [4,12], a shift reinforced by the transition from voluntary disclosure toward mandatory sustainability reporting regimes [2]. A substantial evidence base links the systematic integration of sustainability into strategy and governance with superior long-term financial performance, more effective risk management, and durable competitive advantage [23,24,25].
Recent European policy and scholarly discourse no longer treat the digital and the sustainable agendas as parallel programs but as a single interdependent “twin transition”, in which digital technologies are expected to enable decarbonization while the sustainability agenda sets the direction and the constraints for digitalization [26,27]. That literature is explicit that the two transitions do not reinforce one another automatically: regional evidence indicates that green and digital transitions are only partially complementary and can diverge [28], and research on digital rebound effects shows that efficiency gains from digitalization are frequently offset by increased energy demand and by expanded activity elsewhere [29]. The practical corollary is a measurement problem. Detecting such trade-offs—an automation program that raises throughput while raising energy consumption, or a sustainability strategy that is announced but never reaches process execution—requires instruments that observe digital capability, process-level integration, and sustainability governance in the same organization at the same time. It is this joint observation, rather than the invention of new single-domain constructs, that the three-index architecture proposed here is designed to make feasible, and it is on this point that the framework connects directly to the operationalization challenge the twin transition literature identifies.
2.3. Intelligent Automation and the Fragmentation Problem
Hyperautomation—often discussed under the umbrella of intelligent or cognitive process automation—denotes the coordinated use of RPA, AI and machine learning, process mining, workflow engines, and integration technologies to automate and optimize entire processes rather than single tasks [8,9,30]. RPA has served as the entry technology for many organizations, but reviews consistently conclude that its benefits scale only when it is combined with cognitive components and orchestrated at the process level [7,31].
A recurring diagnosis in this literature concerns fragmentation. Conceptual syntheses of cognitive automation show that machine-learning-enabled bots are predominantly rolled out as stand-alone point solutions, disconnected from any unifying orchestration or architectural layer, which confines the resulting gains to individual tasks and prevents them from compounding into system-level improvement [7,8]. RPA programs likewise tend to evolve in parallel to—rather than inside—broader BPM and transformation initiatives, entrenching siloed automation instead of integrated process redesign [31].
Systematic mappings of BPM and emerging automation technologies confirm that most initiatives target cost and productivity within single processes or departments, while cross-process integration and governance receive comparatively little attention [30]. Orchestrating a portfolio of interdependent technologies requires dedicated management mechanisms—covering tool interoperability, workforce adaptation, and cultural change—together with architectural building blocks such as orchestrators, API gateways, and event-driven middleware, yet such mechanisms are rarely institutionalized [8,9,15]. The resulting gap is structural: technology adoption outpaces the integration, governance, and capability structures needed to convert local automation wins into sustained, organization-wide benefit [7,8,30].
2.4. Green and Sustainable Business Process Management
Green BPM emerged as the research stream that injects environmental objectives into BPM capabilities, targeting reductions in energy consumption, emissions, and waste through deliberate process redesign and optimization [10,32]. Sustainable BPM widens the lens to encompass the environmental, social, and governance dimensions of processes, aligning process management with ESG and circular-economy principles [33,34].
Sectoral evidence indicates that green process practices—energy-efficient process configurations, waste-reduction routines, and lean-green combinations—generate measurable improvements in resource efficiency and environmental performance in manufacturing and related industries [32,33,35]. Infrastructure case studies further illustrate how BPM can simultaneously support decarbonization, waste reduction, and regulatory compliance, positioning process management as a backbone for complex sustainability transformations [36].
At the same time, critical reviews expose important limitations. Many Green BPM approaches rest on a narrow selection of environmental indicators, which risk optimizing visible metrics while displacing impacts elsewhere along the value chain [10,37]. This concern has motivated proposals to couple Life Cycle Assessment (LCA) with process analysis and process mining, so that environmental effects can be evaluated holistically across the full process lifecycle [34,37]. More generally, BPM systems are expected to internalize sustainability-oriented performance indicators and governance mechanisms, ensuring that automation and process change contribute to organizational resilience and sustainable value creation rather than to local efficiency alone [15,36].
2.5. Digital Readiness and Maturity Models
Digital transformation readiness denotes an organization’s ability to initiate, absorb, and scale digital initiatives, and is typically decomposed into digital skills, infrastructure maturity, organizational culture, and change-management capability [3,38]. Maturity models for digitalization and process automation differentiate capability levels across areas such as infrastructure (data centralization and quality, system availability and reliability), workforce skills and attitudes, governance, and strategic alignment [14,39]. Reviews of digital maturity models nevertheless note that governance anchoring, and cultural dimensions are unevenly represented across existing instruments, which complicates their use as integrated diagnostics [38].
2.6. ESG Governance, Composite Indices, and Measurement Practice
ESG frameworks and the associated regulatory apparatus have converted sustainability from a voluntary initiative into a structured governance domain with codified metrics and reporting duties [2,12]. Corporate sustainability research shows that firms which systematically institutionalize sustainability in governance structures tend to outperform matched peers on financial as well as non-financial dimensions [23,40,41,42]. In parallel, research on digitally enabled operations emphasizes process-level KPIs and real-time dashboards for jointly steering performance and sustainability, particularly where digital twins, IoT, and analytics monitor resource use and emissions [43]. Complementary scale-development work shows that the sustainability of an organization’s digital activity is itself a measurable construct, although one directed at digital content and services rather than at process governance [44], and firm-level evidence links digital transformation to operational resilience outcomes such as supply chain robustness [45].
Composite indices are the standard vehicle for condensing such multidimensional phenomena into interpretable scores: ESG ratings aggregate heterogeneous environmental, social, and governance indicators for investors and regulators [4,12], while digital maturity and readiness instruments combine infrastructure, skills, and institutional factors at the organization level [38,39]. The relationship between digital transformation and ESG performance has in turn been studied as a substantive question in its own right [46]. Methodological scholarship insists that credible composite indicators require transparent indicator selection, defensible normalization, and explicitly reasoned weighting and aggregation choices, with sensitivity of results to those choices openly acknowledged [18,19].
2.7. Research Gap and Positioning Against Existing Instruments
The gap motivating this study is not merely asserted. It emerges consistently from recent systematic evidence. Systematic reviews of RPA research document the absence of governance- and integration-oriented measurement [7]. Systematic and tertiary reviews of Green BPM conclude that sustainability is rarely operationalized at process level beyond narrow environmental indicators [10,37]. Systematic reviews of digital maturity models find that existing instruments remain single domain, with governance and cultural dimensions unevenly covered [38]. Systematic mappings of BPM and emerging automation technologies confirm the dominance of local, single-process optimization studies [30] and the broader systematic review of digital transformation as organizational change identifies the operational mechanisms linking digital capability to strategic outcomes as an open research question [47]. Taken together, these reviews indicate that compact organization-level instruments jointly capturing the following three constructs are still missing [6,15]:
- digital transformation readiness,
- integration maturity between BPM governance and intelligent automation technologies, and
- sustainability orientation embedded in governance and process KPIs.
Existing models address one domain at a time, leaving practitioners without an integrated diagnostic that connects readiness, integration, and sustainability orientation within a single measurement logic [24]. Closing this gap motivates the three composite indices developed below, which offer a pragmatic, survey-based route to assessing these interrelated dimensions in organizational practice.
To make this gap concrete rather than asserted, Table 1 compares the proposed framework with representative instruments from each adjacent stream. The comparison is deliberately restricted to the dimensions that the three indices claim to cover jointly, and to what each instrument measures rather than to what it mentions. It shows that existing instruments treat digital readiness, process and automation integration, or sustainability orientation with considerable sophistication, but that none of them observes all three on the same organization at the same time, and that the process-level orchestration layer—identified as the decisive gap in the automation literature—is named in several streams yet operationalized as a measured construct in none of them.
Table 1.
Coverage comparison of representative existing instruments and the proposed three-index framework.
2.8. Conceptual Framework and Propositions
Before specifying the instruments, the relationship between the three indices—and the theoretical claim behind their joint construction—requires explicit articulation. The DTRI, the IMI, and the SOI are conceptually distinct, formatively specified constructs measured by separate instruments. They are not subscales of one latent variable and are not summed into a single super-index. Their integration is architectural rather than psychometric: they are designed to be administered together, scaled identically (0–100), and interpreted as a joint diagnostic profile within a shared nomological structure.
That structure draws on three theoretical anchors. From the dynamic capabilities perspective [48], the DTRI approximates the resource and cognitive preconditions of sensing (skills, attitudes, infrastructure that allow an organization to detect and absorb digital opportunity), the IMI corresponds to seizing and reconfiguring (the orchestration routines through which technological options are converted into integrated process operations), and the SOI expresses the transforming and directional layer that steers reconfiguration toward sustainable value rather than local efficiency. From socio-technical systems reasoning [49], each index deliberately pairs a technical subsystem (infrastructure; automation architecture; measurement and reporting systems) with a social subsystem (attitudes and skills; governance roles and ownership; leadership commitment and stakeholder engagement), reflecting the premise that transformation outcomes arise from the joint optimization of both. Finally, the organizational-change reading of digital transformation [1,47] situates the framework at the process-management layer that recent reviews identify as the underspecified link between digital capability and strategic outcomes. Two qualifications belong with this mapping. First, it is an organizing analogy rather than a derivation: the indices measure the conditions and routines that dynamic-capability processes are held to require, not the sensing, seizing, and transforming processes themselves, and no item asks respondents about those processes directly. Second, sustainability orientation is treated as a directional and governance layer that shapes which reconfigurations are pursued, not as a dynamic capability in its own right—an orientation is not by itself a capacity to reconfigure—and the term “transforming” is used in that restricted sense throughout.
Figure 1 depicts the resulting conceptual framework and the anticipated relationships, formulated here as propositions to be tested rather than as validated paths: readiness enables integration (P1), sustainability orientation directs and reinforces integration through shared governance routines (P2), and integration maturity transmits both toward process performance and sustainable value creation (P3), with organizational context (size, industry, regulatory exposure, process criticality) expected to moderate these links.
Figure 1.
Conceptual framework linking the DTRI, the IMI, and the SOI (P1–P3 denote anticipated relationships pending empirical testing). Solid arrows denote the hypothesized direct effects (P1, P2, P3). The dashed arrow denotes the indirect path from the SOI to outcomes that is transmitted through the IMI (P3b). Contextual variables (size, industry, regulatory exposure, process criticality) are modeled as moderators of the P1, P2 and P3 paths and are therefore drawn on those paths rather than as predictors of the indices.
The propositions are stated formally below, each with its independent and dependent construct, its levels of analysis, the expected direction, the mechanism assumed, and the boundary condition under which it is expected to weaken.
- P1 (cross-level: organization to process). Organization-level digital transformation readiness (DTRI) is positively associated with process-level integration maturity (IMI). Mechanism: workforce skills, supportive attitudes, and a reliable technical foundation lower the cost and raise the feasibility of orchestrating automation around documented processes. Boundary condition: the association is expected to be stronger for processes of high transactional volume and weaker where the process is executed largely in systems the organization does not control.
- P2 (cross-level: organization to process). Organization-level sustainability orientation (SOI) is positively associated with process-level integration maturity (IMI). Mechanism: ESG governance institutionalizes KPI definition, review rhythms, documentation, and assurance, and these routines are partly transferable to automation governance. Boundary condition: the association is expected to weaken where sustainability reporting is decoupled from operations and maintained as a compliance exercise.
- P3 (process to organization, mediated). Process-level integration maturity (IMI) is positively associated with process performance and with sustainable value creation, and it mediates the associations of the DTRI (P3a) and of the SOI (P3b, the dashed path in Figure 1) with those outcomes. Mechanism: orchestration is the layer at which capability and governance intent become executable. Boundary condition: mediation is expected to be partial rather than complete, since both readiness and sustainability governance may act on outcomes through channels outside the assessed processes.
- Moderation. Organizational context—size, industry, regulatory exposure, and process criticality—is modeled as a moderator of the P1, P2 and P3 paths, not as a direct predictor of any index.
The outcome constructs are defined here so that P3 is testable rather than illustrative. Process performance comprises cycle time, rework and exception rates, and unit processing cost for the assessed process. Sustainable value creation comprises reported or assured ESG indicators attributable to the assessed process domain (for example energy intensity, material and paper consumption, and emissions) together with retention and reskilling outcomes for employees affected by automation. Both are to be collected from operational records and sustainability reporting rather than from the respondents who supply the index scores. The analytical strategy for estimating P1–P3 is specified in Section 5.1.
This positioning also clarifies what is theoretically new. The contribution does not lie in inventing previously unknown constructs—readiness, maturity, and sustainability orientation each have established lineages [14,23,38], but in three moves that existing maturity models do not make. First, whereas prior models assess one domain at a time [14,39], the framework specifies a joint measurement architecture in which the three domains are placed on a common 0–100 metric and observed on the same organization at the same time. The common metric makes the three scores commensurable in presentation—they can be profiled, plotted, and tracked together—but it does not make them substantively equivalent, and no claim of measurement equivalence across the three constructs is made or implied (Section 3.8 and Section 5.1). Second, it introduces integration maturity as the connective construct: the IMI explicitly measures the process-level orchestration layer through which digital readiness is hypothesized to be converted into performance and through which sustainability governance reaches operations—a mechanism named but not measured in prior work [8,15]. Third, by embedding the three indices in a dynamic-capabilities and socio-technical frame, the framework turns a set of descriptive maturity scores into a testable theory of how readiness, orchestration, and sustainability governance jointly shape transformation outcomes—thereby extending, rather than replicating, existing single-domain maturity models.
3. Methodology
This section documents the systematic procedure used to construct the DTRI, the IMI, and the SOI. The procedure follows recognized methodological guidance for composite indicator development—notably the stepwise logic of framework definition, indicator selection, normalization, weighting, and aggregation, while preserving practical applicability in organizational settings.
3.1. Conceptual Design Principles
Grounded in the gaps identified in Section 2, the three indices were designed according to six principles. First, subdimensions and items were derived from established frameworks in digital transformation readiness, BPM maturity, automation orchestration, and ESG governance [8,14,23,39]. Second, each index comprises three to four subdimensions, which is sufficient to capture distinct yet complementary facets of the construct without sacrificing interpretability. Third, all indices are expressed on 0–100 scales so that results can be read intuitively through maturity bands and tracked over time within an organization. Comparison across organizations is treated as an objective of the validation program rather than as a property conferred by the common scale itself. Fourth, subdimensions are weighted equally in this first version—a transparent, practitioner-oriented specification whose robustness implications are made explicit rather than hidden [19]. Fifth, empirical recalibration of items and weights is planned for subsequent iterations based on pilot data. Sixth, the compensatory arithmetic of the composite is complemented by an explicit non-compensatory safeguard: because an arithmetic mean permits strength in one subdimension to offset weakness in another, any subdimension scoring below 40 is reported as a bottleneck flag alongside the index, so that a critical deficiency remains visible in the diagnostic output instead of being absorbed by the average (Section 3.8).
3.2. Instrument Development Procedure
Item development followed a staged deductive procedure. In the first stage, construct definitions and candidate content domains were extracted from the literature streams reviewed in Section 2—digital maturity models for the DTRI [14,38,39], automation orchestration and RPA challenge inventories for the IMI [7,8,30], and ESG governance and Green BPM research for the SOI [2,10,23]. In the second stage, an initial item pool was generated by translating each content domain into candidate statements, deliberately over-sampling the domain so that weaker items could later be discarded. In the third stage, the pool was refined through iterative review within the author team against four criteria: content coverage of the intended subdimension, answerability by the targeted respondent role, absence of double-barreled or leading formulations, and terminological consistency across indices. Attitude items additionally follow the wording conventions of established technology acceptance instruments [50,51]. The retained items were then assigned to the subdimensions and response formats documented in Section 4. The development record is reported in full in Supplementary Material File S4, which documents the size of the initial item pool, the source-to-construct-to-item mapping for every retained item, the persons involved in each screening round, the rule used to resolve disagreement (retention required the agreement of both authors. Contested items were rewritten and re-screened rather than carried by majority), and every item that was removed, merged, or rewritten together with the reason recorded for it. Two further steps are planned rather than completed: structured expert validation and pilot-based psychometric screening, as detailed in Section 5.1. The instruments should therefore be read as literature-derived and internally refined, but not yet externally validated.
Two further external steps are planned as the immediate next stage of the work. First, a structured content-validity study will be conducted with an independent panel of academic experts in business process management, measurement, and sustainability management, together with an equal number of practitioners (process owners, automation leads, sustainability officers). Each panelist rates every item for relevance and clarity. Content validity ratios and scale-level content validity indices are computed, and items falling below the panel-size-adjusted threshold are revised or discarded, with the revisions documented [52]. Second, cognitive interviews using think-aloud and verbal-probing techniques [53] will be conducted with respondents drawn from each target role group, to verify that items are understood as intended, that the “do not know” option is used as designed, and that the five maturity anchors are discriminable in practice. Because a formatively specified index derives its validity primarily from content coverage rather than from internal consistency [54,55], these two steps—not the factor-analytic screening of the pilot—constitute the principal validity evidence at the index level, and the manuscript makes no claim of validated status until they are complete.
3.3. Unit of Analysis, Levels of Measurement, and Measurement-Model Specification
Because the framework spans phenomena at several organizational levels, the unit of analysis is defined per index. The DTRI is an organization-level construct measured through individual-level informants: skills and attitudes are properties of employees, and organizational readiness is operationalized as their aggregate, following a referent-shift logic in which individual responses are averaged to characterize the collective. The infrastructure checklist, by contrast, is completed by a small number of expert informants describing a genuinely organization-level property. The IMI is a process-level construct: each assessed process receives its own score, informed by respondents involved in that process, so that within-organization variation across processes is a designed feature of the instrument rather than noise. The SOI is an organization-level construct assessed by designated key informants (senior managers, sustainability officers, process owners). This explicit level structure has two methodological consequences that the planned analysis must respect: aggregation from individuals to collectives will be justified empirically through within-unit agreement and reliability statistics (e.g., intraclass correlations) before organization- or process-level scores are interpreted, and cross-level comparisons (e.g., relating an organization-level DTRI to process-level IMI scores) will be treated as multi-level associations rather than same-level correlations.
The measurement model is specified at every level of the hierarchy, since a single label cannot describe all of them. At the lowest level, items are reflective indicators of the facet they belong to: the items of Digital Skills, for example, are interchangeable indicators of a common underlying competence, so internal consistency, item–total correlations, and factor structure are meaningful and are reported. Where a subdimension comprises more than one conceptually distinct facet—Attitudes is the only such case and is specified in Section 3.4—the facets are reflective at item level and are combined formatively into the subdimension, so reflective criteria are computed within each facet and never across the facets of that subdimension. Between subdimensions and the index, measurement is formative: digital skills, attitudes, and infrastructure are not interchangeable manifestations of readiness but constitutive components of it, and removing one changes the meaning of the construct rather than merely reducing the precision with which it is estimated. The same logic applies to the IMI and to the SOI. This specification has direct consequences for validation, which Section 5.1 implements: reflective criteria (alpha, omega, loadings, average variance extracted) are applied at the subdimension level only, whereas the index level is evaluated through content validity, indicator collinearity among subdimensions (variance inflation factors, with the conventional ceiling of 3.3 applied to formative indicators), indicator relevance and redundancy, and external validity against criterion measures [54,55]. Cronbach’s alpha and average variance extracted are accordingly not computed for the indices as wholes. The maturity checklists are formative by construction—an organization does not possess “more” architecture in a way that makes an orchestrator and an event bus interchangeable—and are evaluated through interrater agreement between expert informants rather than through internal consistency.
A boundary risk arises between the DTRI infrastructure checklist and the IMI architecture checklist, both of which touch data quality, interfaces, and monitoring. The boundary is drawn by referent and scope rather than by topic. The DTRI checklist assesses the general enterprise IT foundation as an organization-wide property: whether data are centralized and of adequate quality, whether systems are available and secure, whether APIs and middleware exist at all. The IMI checklist assesses the automation-specific orchestration layer as it applies to the process being scored: whether an orchestrator sequences that process end to end, whether exception handling exists for its automated steps, whether its automation coverage is tracked. The two therefore differ both in the unit they describe and in the object they describe. Because a conceptual boundary can nevertheless blur in practice, the pilot will estimate the correlation between the two checklists and inspect it for redundancy, if the observed association approaches the level at which the two cease to be separable, the overlapping items will be reassigned to one instrument.
Aggregation from individuals to collectives requires justification rather than assumption. Before any organization- or process-level score is computed, within-group agreement will be assessed with rwg(j) against a uniform null distribution and, for items with expected skew, against a slightly skewed null [56,57], and the reliability of the aggregate with ICC(1) and ICC(2). Conventional thresholds (rwg(j) of at least 0.70 and ICC(2) of at least 0.70) will be applied. Where a unit fails them, the dispersion is reported as a diagnostic finding rather than suppressed by averaging, since disagreement about the state of a capability itself is informative. Unequal numbers of respondents per unit are handled by weighting unit means by the inverse of their standard error rather than treating all unit means as equally precise, and units falling below the minimum informed-respondent count defined in Section 3.7 do not receive a unit-level score.
3.4. Construction of the Digital Transformation Readiness Index (DTRI)
The DTRI operationalizes digital transformation readiness as a multi-faceted construct spanning workforce capability, cultural disposition, and technological infrastructure. Drawing on digital maturity model reviews, BPM maturity research, and technology acceptance theory [14,38,51], three subdimensions were specified.
Digital Skills: Twelve Likert-scale items (1–5), adapted from digital competency and automation literacy research, measure foundational proficiency with enterprise systems (ERP/CRM/DMS), adaptability to new technologies, comprehension of automation concepts, and data literacy. Items were phrased so that employees in any role can answer them meaningfully. Three factual items are administered alongside the twelve Likert items and reported separately from the subdimension—whether the respondent has completed formal training in automation or AI tools, whether they have consulted learning material on their own initiative within the past twelve months, and whether they have submitted a process-improvement or automation proposal in that period. They are included because a battery consisting only of self-evaluative statements risks measuring general self-regard rather than distributed capability, scored dichotomously and rescaled to the common metric, they form a behavioral anchor against which the evaluative items are checked. Where the skills subdimension exceeds the behavioral anchor by more than 25 points, the subdimension is flagged as potentially inflated by self-perception. The battery also does not assume that every role requires the same proficiency with every technology. Items are phrased relative to the demands of the respondent’s own work, and the organization is asked, as a preparatory step documented in Supplementary Material File S4, to record which of the assessed competences are expected of which role group. The subdimension is then reported both unconditionally and relative to that expected profile, so that a low aggregate driven by roles for which a competence is not required is not misread as a capability gap.
Attitudes Toward Digital Transformation: Nine items, informed by technology acceptance and change-management research [50,51,58], capture perceived benefits of automation, concerns and resistance (reverse-coded), and perceived organizational support for digital initiatives, thereby addressing the cultural dimension on which transformation success hinges. The subdimension is a formative bundle of two conceptually distinct facets: individual dispositions toward automation (perceived benefit, confidence, concern about replacement, perceived complexity) and perceived organizational climate (support for digital change, availability of training, perceived fairness of automation decisions). They are retained within one subdimension because both bear directly on whether an individual will engage with transformation, but they are not treated as interchangeable indicators of a single attitude. The hierarchy defined in Section 3.3 applies, and the scoring and validation procedures follow it: each facet is reflective at item level, and the two facets are combined formatively into the subdimension with equal weight per item, so the subdimension score remains the mean of the nine normalized responses. Reliability and factor structure are reported for each facet separately and are not computed across the nine items as though they formed a single scale, and the two facet scores are reported alongside the subdimension score. The pilot’s exploratory factor analysis tests the two-facet structure explicitly, and if the facets separate, they will be reported as distinct subdimensions and the DTRI formula adjusted accordingly.
Infrastructure Readiness: A twelve-item maturity checklist evaluates the technical backbone required for scalable automation: data centralization and quality, accessibility, security (encryption, identity and access management), system reliability (availability, disaster recovery, scalability), API availability, integration middleware, and monitoring capability. Each item uses a five-level maturity scale ranging from “non-existent/chaotic” to “optimized/AI-supported”. Each of the five levels is defined by a written anchor rubric rather than by a numeric label alone, so that a judgment of “level 3” is tied to observable conditions (the full rubrics are supplied in Supplementary Materials File S1). Because the checklist is completed by a small number of expert informants, at least two informants are required per organization, interrater agreement is reported, and items on which informants differ by more than one level are resolved by documented discussion with the initial disagreement recorded.
Responses are averaged per respondent and then aggregated to the organizational level. All subdimensions are normalized to 0–100 via min–max transformation, and the overall index is computed as:
DTRI = (Digital Skills0–100 + Attitudes0–100 + Infrastructure0–100)/3
Five maturity bands support interpretation: 0–20 (very low), >20–40 (low), >40–60 (medium), >60–80 (high), and >80–100 (excellent). The interval boundaries are stated as half-open ranges so that continuous scores falling between the printed integers are classified unambiguously. The cut points are judgmental design choices rather than empirically derived thresholds, and they are treated as provisional until criterion evidence is available (Section 5.1).
3.5. Construction of the Integration Maturity Index (IMI)
The IMI responds to the fragmentation problem documented in the automation literature [7,8,30,31]. It quantifies the degree to which an organization has consolidated its process governance and its portfolio of automation technologies into a coherently orchestrated, end-to-end operating model. Four subdimensions were derived from BPM standards, orchestration frameworks, and governance research.
BPM–Automation Integration: Ten Likert items assess how firmly automation is anchored in formal process management: currency of BPMN models and standard operating procedures, alignment of automation design with documented processes rather than ad hoc scripting, data centralization and quality, and integration between modeling tools and automation platforms. This operationalizes the process-level integration emphasized in BPM research [5,20].
Technology Synergy: Eight items measure the convergence of automation technologies (RPA with intelligent document processing, API integration, machine learning, process mining), event-driven and asynchronous workflows, the presence of a central orchestration platform, the systematic use of process data to identify further automation opportunities, and built-in monitoring and alerting—the multi-technology coordination at the core of hyperautomation [8,9,30].
Governance: Nine items cover process ownership, defined roles and responsibilities (RACI), escalation procedures, KPI review cadences, root-cause analysis, management reporting, risk registers, change approval, and business continuity planning—the mechanisms that translate technical potential into controlled, repeatable practice [7,15].
Architecture Checklist: A fourteen-item maturity assessment evaluates the presence and sophistication of architectural components: orchestrators, workflow engines, task and queue management, exception handling, API gateways, event buses, document management integration, integration catalogs, performance monitoring, Centers of Excellence, and technology standardization, each rated on a five-level scale.
The overall index is computed as:
IMI = (BPM Integration0–100 + Technology Synergy0–100 + Governance0–100 + Architecture0–100)/4
Maturity bands: 0–20 (fragmented), >20–40 (initial), >40–60 (developing), >60–80 (mature), >80–100 (advanced).
3.6. Construction of the Sustainability Orientation Index (SOI)
The SOI operationalizes the extent to which sustainability (ESG) principles are embedded in strategy, processes, and governance. Building on corporate sustainability research, ESG reporting scholarship, and Green BPM literature [2,10,15,23], four subdimensions were defined.
Strategic Sustainability Orientation: Seven Likert items assess the inclusion of ESG in corporate strategy, leadership communication, formally assigned coordination roles, measurable targets, sustainability impact appraisal of investments, sustainability criteria in managerial evaluation, and stakeholder reporting.
Process Integration of Sustainability: Nine items measure whether sustainability KPIs are defined and tracked in processes with the same rigor as financial metrics, whether process improvements are explicitly mapped to sustainability outcomes, whether environmental and social impacts are appraised in digitalization projects (including carbon-footprint effects), whether stakeholders are involved in digital project design, and whether social aspects of automation—retraining and support for affected employees, workforce engagement—are systematically addressed.
Sustainability Governance and Reporting: Nine items cover board-approved policies, implementation plans with milestones, documentation and auditing, centralized data collection, regular reporting cycles, communication of results, concrete follow-up actions, employee idea mechanisms, and management review with target-setting.
Sustainability Checklist: A four-item maturity assessment provides a condensed view of ESG integration across strategy and policies, process integration in key functions (procurement, HR, production, finance), measurement/reporting/assurance systems, and stakeholder engagement and culture, on a five-level scale from “none/chaotic” to “transformational/cultural movement”. The checklist is not included in the SOI composite because its four domains overlap with content already captured by the three Likert subdimensions. Including both measures in the composite could therefore result in double counting of the same underlying variance. Moreover, assigning the four checklist items the same weight as a nine-item Likert subdimension could distort the effective contribution of individual indicators. The checklist is consequently retained as a separate, evidence-based triangulation instrument. It is completed by a senior informant based on documentary evidence, such as approved policies, reporting and assurance records, and procurement criteria, rather than on perceptions. The checklist is reported alongside the SOI as a convergence check. A material divergence between the perception-based SOI and the evidence-based checklist can itself provide a diagnostic signal, for example, indicating that sustainability commitments are documented but not enacted, or enacted but not formally documented. Accordingly, the validation protocol treats the association between the SOI and the checklist as a known-groups criterion rather than as redundant information to be eliminated.
The SOI is measured at the organizational level with input from senior managers, sustainability officers, and process owners, and is computed as:
SOI = (Strategy0–100 + Process Integration0–100 + Governance0–100)/3
Maturity bands: 0–20 (minimal), >20–40 (weak), >40–60 (medium), >60–80 (strong), >80–100 (excellent). The sustainability checklist is reported separately from these bands, as a documentary convergence check rather than as a fourth term of the composite.
One consequence of this informant structure requires an explicit safeguard. The checklist domain concerning stakeholder engagement and culture describes employee-level experience while being assessed only by management, which invites key-informant and social-desirability bias. The three employee-facing items of the Process Integration subdimension—workforce engagement in sustainability initiatives, consideration of social aspects of automation, and support for employees affected by automation—are therefore now administered to the DTRI employee sample as well, and the difference between the management and the employee reading is reported as a perception-gap indicator rather than averaged away. Where the divergence exceeds one scale point, the management-reported SOI is flagged as potentially biased in the diagnostic output.
3.7. Data Collection Design
The indices are administered through structured electronic surveys and checklists, with target respondents differentiated by index. For the DTRI survey, a census of all employees is realistic only in small organizations; in medium-sized and large organizations the survey is instead administered to a stratified random sample of employees, with strata defined by function and hierarchical level and minimum quotas per stratum, so that the distribution of skills and attitudes is represented without imposing an impractical response burden. The DTRI checklist is directed at roles responsible for digital infrastructure. The IMI survey addresses participants in selected key processes (process owners, key account managers), and the IMI checklist targets those accountable for system and process architecture (solution architects, solution analysts). The SOI survey and checklist address roles responsible for innovation, sustainability, and organizational governance. Role-specific survey sections ensure that items are answered by appropriately informed respondents, and open-ended questions supplement the quantitative items with qualitative insight into integration challenges and perceived synergies.
Because all three instruments rely on self-reports, the design incorporates explicit safeguards against common method bias and low-quality responding [59]. Procedural remedies include confidentiality with pseudonymous role-level coding—full anonymity is deliberately not used, because a capability diagnostic that cannot say which function lacks which competence has no diagnostic value, and because respondents must be re-approachable for the open-ended follow-up. Responses are identified by role and organizational unit, never by individual, and no individual-level output is returned to the organization—together with non-evaluative framing to reduce social desirability. The use of different informant groups for different constructs (broad workforce for DTRI attitudes, architecture specialists for IMI checklists, governance informants for the SOI), which separates the sources of predictor and criterion measures. Psychological separation of questionnaire sections and mixed item polarity through reverse-coded items and “do not know” options were added so that uninformed respondents are not forced into substantive answers. Data quality controls comprise screening for straight-lining and implausibly short completion times, predefined thresholds for item- and respondent-level missingness, and minimum informed-respondent counts per unit before a unit-level score is computed. Statistical diagnostics for method variance (single-factor tests and, where feasible, marker-variable checks) are part of the planned pilot analysis described in Section 5.1.
Two features of this design are specific to the present instrument rather than generic survey hygiene and are adopted for reasons that would not transfer to other organizational surveys. The first is the departure from full anonymity just described. A satisfaction or engagement survey derives much of its validity from the respondent’s confidence that no answer can be traced back, and its subject matter is personally sensitive. A capability diagnostic asks far fewer sensitive questions and is useless if its findings cannot be attached to a role group that can then be supported. The trade-off is therefore resolved differently here, and the residual social-desirability risk is addressed by other means: the factual items described in Section 3.4, the evidence-based checklists, and the employee management comparison introduced in Section 3.6. The second is the separation of informant groups by construct, adopted not only as a common-method remedy but because the constructs genuinely have different competent informants—an employee cannot assess integration middleware, and a solution architect cannot assess the distribution of skills across the workforce. Requirements that are genuinely generic to any organizational survey—platform choice, invitation and reminder scheduling, response-rate monitoring, and incentive administration—are documented in the field protocol in Supplementary Material File S4 rather than in this section.
3.8. Aggregation, Normalization, and Weighting
For each index, Likert items within a subdimension are averaged at the respondent level and then aggregated to the organizational (DTRI, SOI) or process (IMI) level by taking means across respondents, conditional on the agreement checks described in Section 3.3. Reverse-coded items are inverted to preserve directional consistency. Ordinal checklist items are normalized to 0–100 via min–max transformation. This choice is deliberate rather than default. Because all constituent scales are bounded and ordinal with known theoretical minima and maxima, min–max rescaling anchors scores to substantively meaningful endpoints (“non-existent” versus “optimized”) and yields the common 0–100 range on which the maturity bands are defined. Standardization alternatives such as z-scores would tie every score to the distribution of the particular sample, making the bands sample-dependent and complicating benchmarking and longitudinal tracking [18]. The transformation is stated explicitly to remove any ambiguity. For a five-point item or checklist level x in {1,…, 5}, the normalized score is 100 × (x − 1)/4, so that 1 maps to 0 and 5 maps to 100. For a subdimension mean between 1 and 5 the same transformation is applied after averaging, so that every subdimension enters the index already on the common metric. Averaging ordinal responses treats the scale intervals as equal, which is an assumption rather than a property of the data. It is adopted because the interpretability of composite indicators of this kind rests on it, and it is checked in the validation protocol by re-estimating every index score under a rank-based ordinal treatment and reporting the rank correlation between the two solutions. “Do not know” responses and missing items are excluded from the respondent’s subdimension mean rather than imputed, provided the respondent answered at least 70% of that subdimension’s items. Below that threshold the subdimension is not scored for that respondent. A subdimension receives a unit-level score only if at least three informed respondents contributed to it, or at least two informants in the case of the expert checklists. Scores falling exactly on a band boundary are resolved by the half-open intervals defined in Section 3.4, Section 3.5 and Section 3.6.
Subdimension scores are simple averages of their normalized components, and overall index scores apply equal weights across subdimensions. This specification is justified on three grounds rather than convenience alone. Theoretically, the literature offers no established ordering of the relative importance of, for example, skills versus infrastructure, or governance versus architecture, and any differential weighting imposed now would be arbitrary. Under such prior ignorance, equal weighting is the standard defensible baseline in composite indicator methodology [18,19]. Practically, equal weights keep the diagnostic transparent for the practitioners who are its primary users. Methodologically, the equal-weighting assumption is treated as provisional: the validation protocol includes sensitivity analysis of index scores and rankings to alternative weighting schemes, and empirically calibrated weights (regression-, factor-, or expert-based) are an explicit refinement path once pilot data are available [19]. The known risk of equal weighting—implicit reweighting when subdimensions are strongly correlated—will accordingly be examined through inter-subdimension correlations in the pilot. One property of this specification deserves explicit statement: linear additive aggregation with equal weights assumes perfect compensability among subdimensions. Under that assumption an organization with an exceptionally skilled workforce can offset a critically weak infrastructure and still record an acceptable DTRI, and a strong sustainability strategy can offset near-absent process integration in the SOI—even though the systemic logic of the framework holds that the weak component is precisely what constrains the outcome. Equal linear weighting is defensible where subdimensions are genuinely substitutable at the margin and where the purpose is comparative description. It is not defensible where one component is a necessary condition for the others to have any effect. The specification therefore retains the arithmetic mean as the headline score, for transparency and for longitudinal tracking, but attaches to it the non-compensatory diagnostic layer announced in Section 3.1: any subdimension below 40 is reported as a bottleneck flag, and an index accompanied by a bottleneck flag is not to be interpreted through its maturity band alone. Partially and fully non-compensatory alternatives—conjunctive rules requiring every subdimension to exceed a minimum threshold, and outranking approaches such as ELECTRE that abandon full substitutability altogether [60]—are named here as explicit candidates for post-pilot calibration. The pilot will compare the organizational rankings produced by the arithmetic mean, by the geometric mean (which penalizes imbalance), and by a threshold-constrained rule, and will report the rank correlations among them as part of the sensitivity analysis [61].
4. Instrument Specification
This section reports the final pre-validation specification of the three composite indices produced by the development procedure of Section 3. Consistent with the status of the study as a measurement proposal, the section documents instruments rather than empirical findings: each index is described through its subdimensions, measurement items, calculation formula, and interpretation guidelines, while descriptive statistics, reliability coefficients, and validity evidence will be reported once the pilot described in Section 5.1 has been completed. Table 2 provides an overview of the full measurement architecture. The subsections that follow unpack each instrument in turn. The complete instruments—exact item wording, response anchors, reverse-coding indications, “do not know” options, the five written anchor rubrics for every checklist item, the scoring key, the missing-data rules, and the respondent instructions—are provided in the Supplementary Materials as S1 (dtri), S2 (imi), and S3 (soi), with the development record and field protocol in S4. the lists in the subsections below are abbreviated topics included for readability. the item counts stated in Table 2 refer to the full batteries in the Supplementary Materials, and the discrepancies between the stated counts and the displayed lists.
Table 2.
Overview of constructs, subdimensions, and measurement formats.
4.1. Digital Transformation Readiness Index (DTRI)
Digital transformation readiness reflects an organization’s preparedness to launch and absorb digital initiatives, spanning workforce capability, attitudes toward change, and supporting infrastructure [3,38,39]. Organizations entering transformation with stronger readiness—digitally literate workforces, robust infrastructure, adaptive cultures—realize larger benefits from digital investment and clear implementation hurdles more effectively [23,62].
Digital Skills (12-item Likert scale, 1–5). This subdimension captures employees’ ability to work productively with digital technologies and data in their daily roles. It is included because even sophisticated tooling remains underused when basic and intermediate skills are unevenly distributed. Items cover:
- Proficiency with basic digital tools required by the role (office suite, HR and self-service systems)
- Proficiency with enterprise systems (ERP, CRM, DMS)
- Ability to search for information effectively in internal and external sources
- Ability to resolve routine technical problems without IT support
- Adaptability to newly introduced digital tools
- Comfort in using new technologies at work
- Proactive search for digital improvements to one’s own work
- Understanding process automation and RPA concepts
- Ability to identify automatable tasks in one’s own work
- Ability to work with the IT team on the design and testing of automated solutions
- Data literacy (interpreting reports and dashboards, charts, tables, KPIs)
- Ability to use basic analytical tools (pivot tables, filters, visualizations)
Digital skills are foundational because they determine whether employees can participate in—and benefit from—transformation initiatives instead of experiencing them as imposed change.
Attitudes Toward Digital Transformation (9-item Likert scale, 1–5). This subdimension reflects cultural and psychological readiness for change; perceived usefulness, perceived support, and low resistance are established antecedents of adoption behavior [50,51]. Items capture:
- Digital transformation and automation add value to the organization
- Automation improves the quality and speed of work in processes
- Digital tools allow the respondent to concentrate on more important tasks
- Concern that automation will replace the respondent’s job (reverse-coded)
- Concern that new digital tools will be too complex (reverse-coded)
- Belief that new technologies bring more problems than benefits (reverse-coded)
- Adequate training has been received for the digital tools in use
- Management and colleagues support the learning of new digital skills
- Access to resources (manuals, helpdesk) that help resolve problems
Attitudes are measured separately from skills because technically capable employees may still resist or slow transformation when they feel threatened, unsupported, or overburdened [58]. The twelve skills listed above are the complete battery as deposited in Supplementary Material File S1. Three further items are administered alongside them but reported separately rather than averaged into the subdimension: whether the respondent has completed formal training in automation or AI tools, whether they have consulted learning material on their own initiative in the past twelve months, and whether they have submitted a process-improvement or automation proposal in that period. Scored dichotomously and rescaled to the common metric, these three form a behavioral anchor against which the self-evaluative battery is checked; they are kept outside the subdimension because averaging dichotomous and five-point ordinal responses into one mean would not be defensible.
Infrastructure Readiness (12-item maturity checklist, 5-level scale). This subdimension assesses the robustness of the digital backbone on which scalable, reliable, and secure transformation depends. Weak infrastructure can nullify strong skills and positive attitudes by rendering digital solutions unreliable or hard to integrate. Checklist items assess:
- Data centralization and quality (1 = chaotic, 5 = AI-optimized)
- Data accessibility across systems
- Identity and access management (SSO, IAM)
- Data encryption and security protocols
- System availability and disaster recovery
- Performance and scalability
- API availability and documentation
- Presence of integration middleware
- Monitoring and incident management systems
- Cloud infrastructure maturity
- Network reliability
- IT service management processes
Calculation:
DTRI = (Digital Skills0–100 + Attitudes0–100 + Infrastructure0–100)/3
Table 3 summarizes the interpretive maturity bands for the DTRI. The complete DTRI survey, infrastructure checklist, five-level anchor rubrics, and scoring key are provided in Supplementary Material Files S1.
Table 3.
DTRI maturity bands.
4.2. Integration Maturity Index (IMI)
Integration maturity expresses how coherently an organization fuses BPM governance with intelligent automation technologies into end-to-end process management [8,9]. The literature is unambiguous that siloed deployment yields only localized gains, whereas systematic, governance-backed integration produces durable organization-wide benefit [7,30,31].
BPM–Automation Integration (10-item Likert scale, 1–5). This subdimension captures the degree to which automation initiatives are grounded in formal process management rather than ad hoc scripting; automation detached from BPMN models, SOPs, and process ownership tends to be brittle, opaque, and hard to scale. The ten items listed below are the complete battery as deposited in Supplementary Material File S2. Items assess:
- The process is documented in a standardized process notation (BPMN) or an equivalent formal form
- Process documentation is updated after significant changes and at defined intervals
- The standard operating procedure corresponds to how the process runs
- The standard operating procedure is available to all relevant staff and is used
- Automation of the process is deployed in production and used in normal operation, not only piloted
- Automation solutions are derived from a formal process model or process analysis
- Automation is connected to surrounding systems through interfaces or an integration layer rather than through manual data transfers
- A clear mapping exists between process-model steps and the way they are automated
- Process modeling tools are connected to the automation platform, so that model and automation are not maintained separately
- Data quality is sufficient for the automation to run reliably
Technology Synergy (8-item Likert scale, 1–5): This subdimension evaluates whether technologies are combined into coherent solutions rather than deployed as stand-alone tools, since hyperautomation value arises from tools working in concert. Items cover:
- Technologies are deliberately combined to complement each other according to process needs, rather than coinciding as independently introduced tools
- Automation is integrated with other systems through standard interfaces such as APIs
- The automation flow is directed by a central orchestrator or workflow engine
- Combining the technologies yields a measurable benefit over using them separately (fewer manual transfers, shorter cycle time, lower error rate)
- Collected process and operational data are used to identify improvement or further automation opportunities
- Systematic process analytics (process mining or an equivalent analytical approach) is used to locate bottlenecks and deviations
- Automated steps have built-in monitoring (logging, alerting)
- Advanced analytical or decision-making components are functionally connected to the rest of the automation and deliver a demonstrable benefit (scored N/A where not used)
Governance (9-item Likert scale, 1–5): This subdimension captures the management structures that steer automation efforts, manage risk, and secure accountability. Without clear roles, decision rights, and review mechanisms even sophisticated technology underperforms. Items assess:
- Clear process ownership and KPI accountability
- Defined roles and responsibilities (RACI matrix)
- Escalation procedures for automation failures
- Regular KPI review meetings
- Systematic root-cause analysis when KPIs deteriorate
- Management reporting on process and automation performance
- A formal risk register for automation risks
- Change approval processes for automation modifications
- Business continuity planning for automation failures
Architecture Checklist (14-item maturity checklist, 5-level scale): This subdimension assesses the presence and maturity of the architectural components underpinning orchestrated automation, which determines how easily solutions scale, are monitored, and adapt over time. Checklist items cover:
- RPA/BPM orchestrator presence and maturity
- Workflow/BPM engine sophistication
- Task management and queue systems
- Exception handling and error recovery mechanisms
- API gateway implementation
- Event bus/message queue infrastructure
- Document management system integration
- Integration catalog maintenance
- Performance monitoring dashboards
- End-to-end process orchestration capability
- Process mining tool integration
- Automation coverage tracking
- Center of Excellence (CoE) establishment
- Technology stack standardization
Calculation:
IMI = (BPM Integration0–100 + Technology Synergy0–100 + Governance0–100 + Architecture0–100)/4
Table 4 summarizes the interpretive maturity bands for the IMI. The complete IMI survey, architecture checklist, and anchor rubrics are provided in Supplementary Material File S2.
Table 4.
IMI maturity bands.
4.3. Sustainability Orientation Index (SOI)
Sustainability orientation captures how deeply environmental, social, and governance principles are embedded in strategy, linked to processes, and operationalized through governance and reporting mechanisms [2,4,15]. The evidence indicates that firms which institutionalize sustainability in governance outperform peers on financial and non-financial criteria alike [23,40,41].
Strategic Sustainability Orientation (7-item Likert scale, 1–5): This subdimension assesses how explicitly sustainability is anchored in formal strategy and leadership practice—strategic commitment and clearly assigned responsibility are prerequisites for consistent action at process and project level. Items examine:
- Explicit inclusion of sustainability/ESG in corporate strategy
- Regular leadership communication on sustainability
- Formally assigned sustainability coordinator or team
- Measurable and ambitious sustainability targets
- Systematic sustainability impact assessment for investments
- Sustainability goals in managerial evaluation criteria
- Active stakeholder reporting on sustainability progress
Process Integration of Sustainability (9-item Likert scale, 1–5): This subdimension captures how far sustainability considerations are translated into concrete process design and improvement routines, since strategy without process-level integration seldom yields measurable outcomes. Items capture:
- Sustainability KPIs defined in processes (energy, paper use, emissions)
- Sustainability KPIs measured with the same rigor as financial metrics
- Clear mapping between process improvements and sustainability outcomes
- Environmental/social impact appraisal in digitalization projects
- Post-implementation evaluation of how digital solutions affected sustainability indicators, including carbon footprint
- Involvement of sustainability stakeholders in digital project design
- Social aspects considered in automation (retraining, support)
- Support plans for employees affected by automation
- Workforce engagement in sustainability initiatives
Sustainability Governance and Reporting (9-item Likert scale, 1–5): This subdimension evaluates the structures and routines that ensure sustainability is monitored, reported, and acted upon, closing the loop between strategy, implementation, and learning. Items assess:
- Formal sustainability policy approved by board or management
- Implementation plan with milestones and responsibilities
- Documentation and auditing of sustainability processes
- Centralized system for sustainability data collection
- Regular sustainability data collection and reporting
- Communication of sustainability results to stakeholders
- Concrete actions resulting from sustainability findings
- Mechanism for employee sustainability improvement ideas
- Management review of sustainability progress with target-setting
Sustainability Checklist (4-item maturity assessment, 5-level scale). The checklist is not a subdimension of the SOI and is not a scored component of the composite (Section 3.6); it is administered and reported separately as a documentary triangulation instrument. It delivers a concise, holistic reading of ESG integration across four domains, helping organizations rapidly distinguish isolated initiatives from a fully integrated sustainability system. Checklist items cover:
- ESG strategy and policies (formal documents, targets, budget, leadership)
- Process integration (ESG in procurement, HR, production, finance)
- Measurement, reporting and auditing (KPIs, internal/external reporting, assurance)
- Stakeholder engagement and culture (employee programs, supplier engagement)
Calculation:
SOI = (Strategy0–100 + Process Integration0–100 + Governance0–100)/3
Table 5 summarizes the interpretive maturity bands for the SOI. The complete SOI survey, triangulation checklist, and anchor rubrics are provided in Supplementary Material File S3.
Table 5.
SOI maturity bands.
5. Discussion
5.1. Proposed Validation Study and Analysis Plan
The indices are designed for deployment in organizational practice through a planned pilot phase, and the study explicitly presents itself as pre-validation: the specification in Section 4 constitutes the hypothesis to be tested, not a validated measurement model. The pilot will adopt an exploratory, cross-sectional survey design aimed at generating initial profiles of digital transformation readiness, integration maturity, and sustainability orientation. Purposive sampling will target eight to twelve organizations engaged in (or preparing for) digital transformation and process automation, possessing at least elementary BPM structures and some exposure to sustainability or ESG requirements. The sample will span manufacturing and service sectors, small and medium-sized as well as large enterprises, and will initially be drawn from Central European economies, with recruitment through professional associations, industry contacts, and executive education networks. Within each organization, one to three automation-relevant processes will be selected for IMI assessment. Data collection is planned as a single wave per organization over approximately three to four months, preceded by a brief instrument walkthrough with the local coordinator. Participating organizations receive structured feedback reports as the participation incentive. The target respondent volume—a stratified employee sample for the DTRI (Section 3.7) plus role-specific informants for the IMI and the SOI—is set with the requirements of factor-analytic screening in mind, aiming for a pooled respondent base of at least 150–200 for the DTRI item set. A single pooled respondent target cannot, however, serve three instruments measured at three different levels, and the sample requirements are therefore stated separately for each. At the DTRI item level, where the unit of observation is the individual employee, 150–200 respondents support exploratory screening of the employee-answered battery at a subject-to-item ratio above five to one for each subdimension analyzed on its own. For the IMI the unit is the process, and 8–12 organizations with one to three processes each yield roughly 16–30 process observations—sufficient for descriptive profiling, item-level screening of the process-answered battery, checklist interrater comparison, and burden assessment, but not for structural estimation. For the SOI the unit is the organization, and 8–12 observations cannot support factor analysis at all. The SOI component of the pilot is therefore explicitly a content-validity and feasibility exercise rather than a psychometric validation and is reported as such. The empirical program is consequently staged. The pilot establishes feasibility, item performance at the individual level, interrater agreement for the expert checklists, and administration burden. A second wave, targeting in the order of 150–250 organizations and 400–700 processes recruited through industry associations and sector panels, is required before any organization-level or cross-level claim can be tested, and the propositions P1-P3 are deferred to that wave. Power for the cross-level tests will be established by simulation under plausible intraclass correlations and effect sizes rather than by rule of thumb, and the simulation code will be deposited with the second-wave protocol.
The validation protocol proceeds in four steps. First, data quality screening applies the controls defined in Section 3.7 (missingness thresholds, straight-lining and completion-time checks, minimum informed-respondent counts per unit). Second, reliability analysis reports Cronbach’s alpha and corrected item–total correlations for every Likert subdimension [63]—at subdimension level only, in line with the measurement-model specification of Section 3.3, with within-unit agreement statistics (intraclass correlations) computed before individual responses are aggregated to unit level, as required by the level structure defined in Section 3.3. Third, construct validity is examined through exploratory factor analysis conducted separately within each respondent-specific battery rather than on a pooled item set. Confirmatory factor analysis, and the average variance extracted computed from it, belong to the second and larger wave rather than to the initial pilot; convergent and discriminant validity are assessed there, verifying that the DTRI, the IMI, and the SOI behave as related but distinct constructs, as the conceptual framework in Section 2.8 asserts. Fourth, common method variance diagnostics (single-factor test and, where feasible, a marker variable) complement the procedural remedies built into the design [59]. Descriptive statistics, reliability coefficients, factor loadings, and correlation matrices from this protocol will populate the empirical results of the follow-up study. Insights from these analyses (including the weighting sensitivity checks defined in Section 3.8) will drive the refinement of items, subdimensions, and weights.
Each procedure below is assigned to the wave whose design can support it. The pilot—with roughly 16 to 30 process observations and 8 to 12 organizations—supports data-quality screening, item-level descriptive and reliability analysis within each employee-answered battery, interrater agreement for the expert checklists, content evaluation, and feasibility and burden assessment. It supports nothing beyond that. Stable exploratory factor analysis at organization level, confirmatory factor analysis and the average variance extracted computed from it, measurement invariance, confirmatory known-groups testing, cross-validation on a holdout subsample, and the mediation and moderation analyses of P1–P3 are assigned to the second wave, whose organization- and process-level samples are large enough to sustain them. Because the items are ordinal, factor analysis is based on polychoric correlations with robust weighted least squares estimation rather than on Pearson correlations. Factor retention follows parallel analysis supported by the scree criterion rather than the eigenvalue-greater-than-one rule. Oblique rotation (geomin) is used, since the subdimensions are expected to correlate and an item counts as cross-loading, and is flagged for revision, if its secondary loading exceeds 0.32 or falls within 0.15 of its primary loading. Reliability is reported as McDonald’s omega alongside Cronbach’s alpha [64], since alpha assumes an essentially tau-equivalent structure that these batteries are unlikely to satisfy. Temporal stability is assessed by re-administering the checklists to a subsample after four to six weeks. Interrater agreement for the expert-completed checklists is reported as the intraclass correlation for absolute agreement and as the proportion of items on which informants differ by more than one maturity level. Known-groups validity is examined by testing whether organizations already within the scope of mandatory sustainability reporting score higher on the SOI than those not yet in scope, and whether organizations with an established automation Center of Excellence score higher on the IMI. Measurement invariance across organization size and sector is tested before any cross-organizational comparison is reported [65], and the retained factor solution is cross-validated on a holdout subsample. Discriminant validity is assessed where these criteria apply, namely among the reflective first-order subdimensions. The Fornell–Larcker criterion and the heterotrait–monotrait ratio [66] are computed across subdimensions—testing, for example, whether Digital Skills and Attitudes are empirically separable rather than two readings of the same disposition—using the loadings and average variance extracted that Section 3.3 already specifies at that level. They are not applied to the DTRI, the IMI or the SOI as wholes: these are formative composites, for which average variance extracted is undefined, and which, being built from heterogeneous item sets, would pass such a test uninformatively. Separability of the three indices is instead evaluated by the criteria appropriate to composite measurement—content validity, indicator collinearity among subdimensions, indicator redundancy, and external validity against criterion measures [54,55]—as set out in Section 3.3. The single-factor test is retained only as a weak screening device. The marker-variable technique and, where the design permits, a measured latent method factor provide the substantive common-method diagnostics [59].
Because processes are nested within organizations, and because the DTRI and the SOI are organization-level constructs while the IMI is process-level, the cross-level paths cannot be estimated by ordinary regression on aggregated or disaggregated data without incurring aggregation bias in the one direction or ecological fallacy in the other. P1 and P2 are therefore estimated as cross-level (2 to 1) effects in a hierarchical linear model with processes at level 1 and organizations at level 2, with random intercepts by default and random slopes admitted where a likelihood-ratio test supports the assumption that organizations differ in the strength of the readiness-integration link. P3 involves a mediator measured at level 1 and outcomes measured at both levels, and is estimated in a multilevel structural equation model, which avoids the conflation of within- and between-organization components that affects conventional multilevel mediation [67]. Indirect effects are tested by Monte Carlo confidence intervals rather than by the Sobel test. Moderation by organizational context enters as level-2 predictors of the level-1 slopes for the P1 path, and as cross-level interactions for the P3 path. The outcome measures are those defined in Section 2.8 and are collected from process performance records and sustainability reporting rather than from the respondents who supply the index scores, so that predictors and criterion do not share a source of method. All of this belongs to the second empirical wave; the present article states the propositions and the procedure for testing them and claims no test of either.
5.2. Provisional Managerial Uses
From a managerial standpoint, the three indices are designed to supply actionable diagnostic information for transformation planning and prioritization—subject to the important qualification that, until the validation protocol of Section 5.1 has been executed, the framework should be used as a structured self-reflection and discussion tool rather than as a validated benchmarking instrument. Within that boundary, organizations can use the profiles to surface candidate capability gaps: the need for digital skills training, infrastructure investment, or cultural interventions before scaling automation. Requirements for tighter BPM–automation alignment, stronger governance mechanisms, or architectural investment in orchestration platforms or the need to formalize sustainability strategy, embed ESG metrics in process KPIs, and reinforce governance and reporting. The framework anticipates heterogeneous profiles—an organization may be digitally ready yet weakly sustainability-oriented, or strongly ESG-committed yet lacking the maturity of integration to realize sustainability goals through its processes—and recognizing such patterns supports targeted intervention instead of generic transformation programs. Claims about the predictive value of specific score levels, however, must await empirical evidence. The profiles described here are hypotheses about what the instrument will reveal, not demonstrated diagnostic outputs. Until the second wave described in Section 5.1 is complete, an organization’s scores support internal discussion, gap identification, and longitudinal self-comparison. They do not support benchmarking against other organizations, classification into a maturity band as a statement of fact, or any predictive claim about transformation outcomes.
5.3. Anticipated Theoretical Relationships
Although empirical validation is still pending, several patterns can be anticipated from the theoretical foundations. Higher digital readiness (DTRI) should correlate positively with integration maturity (IMI), because infrastructure, skills, and supportive attitudes create favorable conditions for orchestrating automation technologies. Organizational size, industry, and strategic emphasis on automation may moderate this association. Organizations with stronger sustainability orientation (SOI) may also exhibit higher IMI if sustainability governance routines—structured KPIs, reporting rhythms, stakeholder engagement—spill over into automation governance. Alternatively, firms may prioritize one agenda over the other, weakening the correlation. Within organizations, IMI scores may vary considerably across processes, reflecting differences in process criticality, ownership strength, automation investment, and local managerial attention—variation that would underscore the importance of process-specific conditions for automation success. Finally, correlation analysis may show which subdimensions contribute most strongly to overall scores and outcomes. Governance components of the IMI, for instance, may prove more strongly associated with process performance than technology synergy, marking governance as the critical bottleneck. Every statement in this subsection is an expectation derived from theory rather than a finding. The subsection is retained because these expectations define in advance what the validation study will treat as disconfirming evidence, and because stating them before data collection guards against their retrospective adjustment.
5.4. Limitations of the Present Instrument-Development Stage
Several limitations deserve acknowledgment and simultaneously define future research avenues. The equal-weighting specification, while transparent and practitioner-friendly, may not mirror the true relative importance of subdimensions. Future work should employ correlation and regression analysis or structured expert-weighting methods (Delphi procedures, the analytic hierarchy process) to calibrate weights empirically, consistent with methodological guidance on composite indicators [18,19]. The planned pilot is cross-sectional and thus precludes causal inference. Longitudinal designs tracking organizations over 24–48 months would allow examining how changes in the DTRI, the IMI, and the SOI relate to changes in process outcomes, transformation success, and sustainability performance—including hypotheses that treat the DTRI as a precondition for the IMI or the SOI as a moderator of IMI–performance relationships. Three further limitations follow from the preceding discussion and are stated here rather than left implicit. First, as Section 3.8 now sets out explicitly, the arithmetic mean is fully compensatory, so a headline index score can conceal a critical deficiency in a single subdimension. The bottleneck flag mitigates this but does not remove it, and a partially non-compensatory aggregation rule may prove preferable once pilot data allow the alternatives to be compared. Second, the item content of the SOI remains weighted toward the environmental and governance dimensions of sustainability relative to the social and economic dimensions discussed in Section 2.2, an imbalance the planned content-validity panel is explicitly charged with correcting before the second wave. Third, and decisively, no claim in this article rests on data: the framework has not yet been applied in a single organization, and until it has been, the questions that matter most—whether the three constructs are empirically separable, whether the resulting profiles identify problems that management had not already identified, and whether the scores correspond to anything observable in process outcomes remain open. The authors regard the first field application, rather than any further conceptual refinement, as the binding constraint on this research program.
Reliance on self-reported survey data introduces well-documented risks of social desirability, common method variance, and respondent knowledge limitations, which the study design must mitigate through procedural remedies and, where feasible, statistical controls [59]. Initial applications will likely concentrate on specific geographic and cultural contexts. Cross-cultural validation studies should therefore test whether the indices function equivalently across national, regulatory, and cultural environments or require adaptation. Finally, future theoretical work could connect the indices explicitly to the dynamic capabilities perspective, examining how the DTRI, the IMI, and the SOI map onto sensing, seizing, and transforming capacities in the context of joint digital and sustainable transformation [48].
5.5. Future Empirical Research
Beyond the two-wave validation program, three lines of empirical work follow directly from the framework. The first is longitudinal: tracking a cohort of organizations over 24–48 months would allow P1-P3 to be tested as change relations rather than as cross-sectional associations and would establish whether movement in the DTRI in fact precedes movement in the IMI as P1 asserts. The second is the detection of twin-transition trade-offs, which joint measurement makes possible at organizational level: pairing IMI movement with energy and emissions data for the same process would show directly whether orchestration gains are accompanied by rebound effects of the kind documented in the digitalization-energy literature [29]. The third concerns generative AI specifically. Because adoption is currently uneven and moving quickly, and because its effects appear to differ systematically with firm size [16,17], the DTRI offers a ready instrument for examining whether organizations scoring highly on skills and attitudes but poorly on infrastructure capture different value from AI adoption than organizations with the opposite profile—a question of direct consequence for the small and medium-sized enterprises that the framework is designed to serve.
6. Conclusions
This article set out to design, rather than merely call for, an integrated diagnostic at the intersection of digital transformation, BPM-anchored intelligent automation, and sustainability governance. Its deliverables are threefold: a conceptual framework, grounded in dynamic capabilities and socio-technical reasoning, that specifies how the Digital Transformation Readiness Index (DTRI), the Integration Maturity Index (IMI), and the Sustainability Orientation Index (SOI) relate to one another and to transformation outcomes (Section 2.8, Figure 1). A documented development pathway from literature-derived construct definitions through item generation and refinement, with explicit choices on unit of analysis, normalization, and weighting (Section 3) and the complete pre-validation specification of all three instruments, including item inventories, formulas, and maturity bands (Section 4, Table 2, Table 3, Table 4 and Table 5), with the complete batteries, anchor rubrics, scoring keys, and development record deposited as Supplementary Materials Files S1–S4.
The honest characterization of the study’s status is that it delivers a theoretically anchored measurement proposal, not yet a validated measurement model. Accordingly, the strongest conclusions the present evidence supports are conceptual: that integration maturity is conceptually specified as a measurable and theoretically motivated connective construct between digital readiness and sustainability governance, and that a jointly scaled, three-index architecture is a coherent and administrable way to operationalize that connection—a proposition the validation program of Section 5.1 is designed to test, not a property already demonstrated. Everything beyond this—reliability, factorial structure, discriminant validity, the anticipated relationships P1–P3, and the predictive value of maturity bands—is delegated to the validation protocol specified in Section 5.1, whose execution across a purposive multi-industry sample constitutes the immediate next step of this research program. If that program succeeds, the framework will give researchers a testable model of how readiness, orchestration, and sustainability governance jointly shape transformation quality, and give practitioners a validated instrument where they currently must rely on fragmented single-domain assessments. The article’s claim is therefore to a specification and to a testable plan, not to a validated instrument. The authors accordingly invite independent use of the Supplementary Materials by other research teams, for whom application of the instruments in their own organizational settings would be the most useful next contribution.
Supplementary Materials
The following supporting information can be downloaded at: https://www.mdpi.com/article/10.3390/systems14101264/s1, File S1: complete DTRI survey, infrastructure maturity checklist, five-level anchor rubrics, and scoring key. File S2: complete IMI survey, architecture maturity checklist, anchor rubrics, and scoring key. File S3: complete SOI survey, documentary triangulation checklist, anchor rubrics, and scoring key. File S4: instrument development record (initial item pool, source-to-construct-to-item mapping, screening decisions and reasons for removal), field protocol, role-to-competence profiling template, and the missing-data, “do not know”, and minimum-respondent rules. All item wording, response anchors, and reverse-coding indications are given in full; nothing is available on request only.
Author Contributions
Conceptualization, P.O.; methodology, P.O. and R.J.; validation, R.J.; supervision, R.J.; project administration, R.J.; funding acquisition, R.J. All authors have read and agreed to the published version of the manuscript.
Funding
Co-financed by the European Union through the Slovakia Programme under project No. NFP401101C360: Research and development of advanced artificial intelligence solutions for the detection of cyber threats and defence against sophisticated attacks.
Institutional Review Board Statement
Not applicable to the present article, which reports no data collection involving human participants. The pilot and validation studies described in Section 5.1 will involve human participants and organizational data; ethical approval will be sought from the responsible ethics committee of the University of Žilina before any data collection begins, and no data will be collected until that approval has been granted.
Informed Consent Statement
Not applicable to the present article. In the planned studies, written informed consent will be obtained from every individual participant and organizational consent from a designated representative of each participating organization. Participants will be informed of the pseudonymous role-level coding described in Section 3.7, of the fact that no individual-level output is returned to their employer, and of their right to withdraw.
Data Availability Statement
No new data were created or analyzed in this study. The complete measurement instruments and the development record are provided as Supplementary Materials Files S1–S4. Data generated by the planned pilot and validation studies will be deposited, in anonymized and organization-de-identified form, in a public repository at the time the corresponding empirical article is published.
Acknowledgments
During the preparation of this manuscript the authors used ChatGPT 5 for language editing and for improving the readability of draft sections. The authors reviewed and edited all output and take full responsibility for the content of this publication.
Conflicts of Interest
The authors declare no conflicts of interest.
Abbreviations
The following abbreviations are used in this manuscript:
| API | Application Programming Interface |
| BPM | Business Process Management |
| BPMN | Business Process Model and Notation |
| CoE | Center of Excellence |
| DTRI | Digital Transformation Readiness Index |
| ESG | Environmental, Social, and Governance |
| IDP | Intelligent Document Processing |
| IMI | Integration Maturity Index |
| KPI | Key Performance Indicator |
| LCA | Life Cycle Assessment |
| RPA | Robotic Process Automation |
| SOI | Sustainability Orientation Index |
| SOP | Standard Operating Procedure |
References
- Verhoef, P.C.; Broekhuizen, T.; Bart, Y.; Bhattacharya, A.; Qi Dong, J.; Fabian, N.; Haenlein, M. Digital transformation: A multidisciplinary reflection and research agenda. J. Bus. Res. 2021, 122, 889–901. [Google Scholar] [CrossRef] [Scilit]
- Christensen, H.B.; Hail, L.; Leuz, C. Mandatory CSR and sustainability reporting: Economic analysis and literature review. Rev. Account. Stud. 2021, 26, 1176–1248. [Google Scholar] [CrossRef] [Scilit]
- Matt, C.; Hess, T.; Benlian, A. Digital transformation strategies. Bus. Inf. Syst. Eng. 2015, 57, 339–343. [Google Scholar] [CrossRef] [Scilit]
- de Souza Barbosa, A.; da Silva, M.C.B.C.; da Silva, L.B.; Morioka, S.N.; de Souza, V.F. Integration of Environmental, Social, and Governance (ESG) criteria: Their impacts on corporate sustainability performance. Humanit. Soc. Sci. Commun. 2023, 10, 410. [Google Scholar] [CrossRef] [Scilit]
- Dumas, M.; La Rosa, M.; Mendling, J.; Reijers, H.A. Fundamentals of Business Process Management, 2nd ed.; Springer: Berlin/Heidelberg, Germany, 2018. [Google Scholar] [CrossRef] [Scilit]
- Kerpedzhiev, G.D.; König, U.M.; Röglinger, M.; Rosemann, M. An exploration into future business process management capabilities in view of digitalization. Bus. Inf. Syst. Eng. 2021, 63, 83–96. [Google Scholar] [CrossRef] [Scilit]
- Syed, R.; Suriadi, S.; Adams, M.; Bandara, W.; Leemans, S.J.J.; Ouyang, C.; Ter Hofstede, A.H.M.; van de Weerd, I.; Wynn, M.T.; Reijers, H.A. Robotic Process Automation: Contemporary themes and challenges. Comput. Ind. 2020, 115, 103162. [Google Scholar] [CrossRef] [Scilit]
- Engel, C.; Ebel, P.; Leimeister, J.M. Cognitive automation. Electron. Mark. 2022, 32, 339–350. [Google Scholar] [CrossRef] [Scilit]
- Khider, H.; Meziane, A.; Hammoudi, S. The future of BPM in the era of Industry 4.0: Exploring new opportunities for innovation. In Proceedings of the 27th International Conference on Enterprise Information Systems, Porto, Portugal, 4–6 April 2025; pp. 915–924. [Google Scholar] [CrossRef] [Scilit]
- Roohy Gohar, S.; Indulska, M. Environmental sustainability through Green Business Process Management. Australas. J. Inf. Syst. 2020, 24, 1–30. [Google Scholar] [CrossRef] [Scilit]
- Purvis, B.; Mao, Y.; Robinson, D. Three pillars of sustainability: In search of conceptual origins. Sustain. Sci. 2019, 14, 681–695. [Google Scholar] [CrossRef] [Scilit]
- Bose, S. Evolution of ESG reporting frameworks. In Values at Work: Sustainable Investing and ESG Reporting; Springer International Publishing: Cham, Switzerland, 2020; pp. 13–33. [Google Scholar] [CrossRef] [Scilit]
- Fischer, M.; Imgrund, F.; Janiesch, C.; Winkelmann, A. Strategy archetypes for digital transformation: Defining meta objectives using business process management. Inf. Manag. 2020, 57, 103262. [Google Scholar] [CrossRef] [Scilit]
- Röglinger, M.; Pöppelbuß, J.; Becker, J. Maturity models in business process management. Bus. Process Manag. J. 2012, 18, 328–346. [Google Scholar] [CrossRef] [Scilit]
- Szelągowski, M.; Lupeikiene, A.; Berniak-Woźny, J. Drivers and evolution paths of BPMS: State-of-the-art and future research directions. Informatica 2022, 33, 399–420. [Google Scholar] [CrossRef] [Scilit]
- Bertomeu, J.; Lin, Y.; Liu, Y.; Ni, Z. The impact of generative AI on information processing: Evidence from the ban of ChatGPT in Italy. J. Account. Econ. 2025, 80, 101782. [Google Scholar] [CrossRef] [Scilit]
- Bertomeu, J.; Lin, Y.; Liu, Y.; Ni, Z. The Economic Consequences of Disrupted Generative AI Adoption. SSRN Working Paper No. 4452670; 2023. Available online: https://ssrn.com/abstract=4452670 (accessed on 5 October 2026). [PubMed]
- OECD; European Commission Joint Research Centre. Handbook on Constructing Composite Indicators: Methodology and User Guide; OECD Publishing: Paris, France, 2008. [Google Scholar] [CrossRef] [Scilit]
- Greco, S.; Ishizaka, A.; Tasiou, M.; Torrisi, G. On the methodological framework of composite indices: A review of the issues of weighting, aggregation, and robustness. Soc. Indic. Res. 2019, 141, 61–94. [Google Scholar] [CrossRef] [Scilit]
- Chinosi, M.; Trombetta, A. BPMN: An introduction to the standard. Comput. Stand. Interfaces 2012, 34, 124–134. [Google Scholar] [CrossRef] [Scilit]
- Clune, W.H.; Zehnder, A.J.B. The three pillars of sustainability framework: Approaches for laws and governance. J. Environ. Prot. 2018, 9, 211–240. [Google Scholar] [CrossRef]
- Amantova-Salmane, L. A new paradigm of sustainable development dimensions. Latg. Natl. Econ. Res. 2018, 1, 5–15. [Google Scholar] [CrossRef] [Scilit]
- Eccles, R.G.; Ioannou, I.; Serafeim, G. The Impact of Corporate Sustainability on Organizational Processes and Performance (March 2012). NBER Working Paper No. w17950. Available online: https://ssrn.com/abstract=2031958 (accessed on 5 October 2026).
- Trizotto, R.C.A.; Nascimento, L.d.S.; da Silva, J.P.T.; Zawislak, P.A. Sustainability, business strategy and innovation: A thematic literature review. Sustain. Account. Manag. Policy J. 2024, 15, 1338–1377. [Google Scholar] [CrossRef] [Scilit]
- Wójcik, P. The business case for corporate social responsibility: A literature overview and integrative framework. J. Manag. Bus. Adm. Cent. Eur. 2018, 26, 121–148. [Google Scholar] [CrossRef] [Scilit]
- Muench, S.; Stoermer, E.; Jensen, K.; Asikainen, T.; Salvi, M.; Scapolo, F. Towards a Green and Digital Future: Key Requirements for Successful Twin Transitions in the European Union; JRC129319; Publications Office of the European Union: Luxembourg, 2022. [Google Scholar]
- Ortega-Gras, J.-J.; Bueno-Delgado, M.-V.; Cañavate-Cruzado, G.; Garrido-Lova, J. Twin transition through the implementation of Industry 4.0 technologies: Desk-research analysis and practical use cases in Europe. Sustainability 2021, 13, 13601. [Google Scholar] [CrossRef] [Scilit]
- Bianchini, S.; Damioli, G.; Ghisetti, C. The environmental effects of the “twin” green and digital transition in European regions. Environ. Resour. Econ. 2023, 84, 877–918. [Google Scholar] [CrossRef] [Scilit] [PubMed]
- Lange, S.; Pohl, J.; Santarius, T. Digitalization and energy consumption: Does ICT reduce energy demand? Ecol. Econ. 2020, 176, 106760. [Google Scholar] [CrossRef] [Scilit]
- Oliveira, A.; Silva, A.; Camara, D.; Silva, E. Process automation with BPM and emerging technologies for service and industrial process optimization: Systematic mapping. In Proceedings of the Brazilian Symposium on Information Systems (SBSI 2025), Recife, PE, Brazil, 19–23 May 2025. [Google Scholar] [CrossRef] [Scilit]
- Siderska, J. Robotic Process Automation—A driver of digital transformation? Eng. Manag. Prod. Serv. 2020, 12, 21–31. [Google Scholar] [CrossRef] [Scilit]
- Sohns, T.M.; Aysolmaz, B.; Figge, L.; Joshi, A. Green business process management for business sustainability: A case study of manufacturing small and medium-sized enterprises (SMEs) from Germany. J. Clean. Prod. 2023, 401, 136667. [Google Scholar] [CrossRef] [Scilit]
- Guerra, J.D.; Palomino, G.; Yildiz, O.; Macassi, I.A.; Alvarez, J.C. Re-designing business process models for enhancing sustainability in spinach production through lean tools with digital transformation. Sustainability 2025, 17, 5673. [Google Scholar] [CrossRef] [Scilit]
- Klessascheck, F.; Weber, I.; Pufahl, L. SOPA: A framework for sustainability-oriented process analysis and re-design in business process management. Inf. Syst. e-Bus. Manag. 2025, 23, 489–537. [Google Scholar] [CrossRef] [Scilit]
- Kovilage, M.P. Influence of lean-green practices on organizational sustainable performance. J. Asian Bus. Econ. Stud. 2021, 28, 121–142. [Google Scholar] [CrossRef] [Scilit]
- Szelągowski, M.; Berniak-Woźny, J.; Zawalich, B.; Radziszewski, B. Leveraging business process management for sustainable transformation: Case study of MECK decarbonization strategy. Decis. Mak. Manuf. Serv. 2024, 18, 107–116. [Google Scholar] [CrossRef] [Scilit]
- Fritsch, A.; von Hammerstein, J.; Schreiber, C.; Betz, S.; Oberweis, A. Pathways to greener pastures: Research opportunities to integrate life cycle assessment and sustainable business process management based on a systematic tertiary literature review. Sustainability 2022, 14, 11164. [Google Scholar] [CrossRef] [Scilit]
- Teichert, R. Digital transformation maturity: A systematic review of literature. Acta Univ. Agric. Silvic. Mendel. Brun. 2019, 67, 1673–1687. [Google Scholar] [CrossRef] [Scilit]
- Flechsig, C.; Lohmer, J.; Voß, R.; Lasch, R. Business process maturity model for digital transformation: An action design research study on the integration of information technology. Int. J. Innov. Manag. 2022, 26, 2240012. [Google Scholar] [CrossRef] [Scilit]
- Bansal, P.; Song, H.-C. Similar but not the same: Differentiating corporate sustainability from corporate responsibility. Acad. Manag. Ann. 2017, 11, 105–149. [Google Scholar] [CrossRef] [Scilit]
- Bux, H.; Zhang, Z.; Ali, A. Corporate social responsibility adoption for achieving economic, environmental, and social sustainability performance. Environ. Dev. Sustain. 2024, 28, 4545–4575. [Google Scholar] [CrossRef] [Scilit]
- Berniak-Woźny, J.; Kwasek, A.; Gąsiński, H.; Maciaszczyk, M.; Kocot, M. Business case for corporate social responsibility in small and medium enterprises—Employees’ perspective. Sustainability 2023, 15, 1660. [Google Scholar] [CrossRef] [Scilit]
- Chavez, C.A.G.; Bärring, M.; Frantzén, M.; Annepavar, A.; Gopalakrishnan, D.; Johansson, B. Achieving sustainable manufacturing by embedding sustainability KPIs in digital twins. In Proceedings of the 2022 Winter Simulation Conference, Singapore, 11–14 December 2022; pp. 1683–1694. [Google Scholar] [CrossRef] [Scilit]
- Wut, T.M.; Lee, D.; Ip, W.M.; Lee, S.W. Digital sustainability in the organization: Scale development and validation. Sustainability 2021, 13, 3530. [Google Scholar] [CrossRef] [Scilit]
- Li, P.; Chen, Y.; Guo, X. Digital transformation and supply chain resilience. Int. Rev. Econ. Financ. 2025, 99, 104033. [Google Scholar] [CrossRef] [Scilit]
- Su, X.; Wang, S.; Li, F. The impact of digital transformation on ESG performance based on the mediating effect of dynamic capabilities. Sustainability 2023, 15, 13506. [Google Scholar] [CrossRef] [Scilit]
- Hanelt, A.; Bohnsack, R.; Marz, D.; Antunes Marante, C. A systematic review of the literature on digital transformation: Insights and implications for strategy and organizational change. J. Manag. Stud. 2021, 58, 1159–1197. [Google Scholar] [CrossRef] [Scilit]
- Teece, D.J. Explicating dynamic capabilities: The nature and microfoundations of (sustainable) enterprise performance. Strateg. Manag. J. 2007, 28, 1319–1350. [Google Scholar] [CrossRef] [Scilit]
- Sarker, S.; Chatterjee, S.; Xiao, X.; Elbanna, A. The sociotechnical axis of cohesion for the IS discipline: Its historical legacy and its continued relevance. MIS Q. 2019, 43, 695–719. [Google Scholar] [CrossRef] [Scilit]
- Davis, F.D. Perceived usefulness, perceived ease of use, and user acceptance of information technology. MIS Q. 1989, 13, 319–340. [Google Scholar] [CrossRef] [Scilit] [PubMed]
- Venkatesh, V.; Morris, M.G.; Davis, G.B.; Davis, F.D. User acceptance of information technology: Toward a unified view. MIS Q. 2003, 27, 425–478. [Google Scholar] [CrossRef] [Scilit]
- Lawshe, C.H. A quantitative approach to content validity. Pers. Psychol. 1975, 28, 563–575. [Google Scholar] [CrossRef] [Scilit]
- Willis, G.B. Cognitive Interviewing: A Tool for Improving Questionnaire Design; Sage Publications: Thousand Oaks, CA, USA, 2005. [Google Scholar] [CrossRef] [Scilit]
- Diamantopoulos, A.; Winklhofer, H.M. Index construction with formative indicators: An alternative to scale development. J. Mark. Res. 2001, 38, 269–277. [Google Scholar] [CrossRef] [Scilit]
- MacKenzie, S.B.; Podsakoff, P.M.; Podsakoff, N.P. Construct measurement and validation procedures in MIS and behavioral research: Integrating new and existing techniques. MIS Q. 2011, 35, 293–334. [Google Scholar] [CrossRef] [Scilit]
- James, L.R.; Demaree, R.G.; Wolf, G. Estimating within-group interrater reliability with and without response bias. J. Appl. Psychol. 1984, 69, 85–98. [Google Scholar] [CrossRef]
- LeBreton, J.M.; Senter, J.L. Answers to 20 questions about interrater reliability and interrater agreement. Organ. Res. Methods 2008, 11, 815–852. [Google Scholar] [CrossRef] [Scilit]
- Burton, S.L. Securing tomorrow: Synergizing change management and cybersecurity in the digital era. HOLISTICA—J. Bus. Public Adm. 2024, 15, 1–20. [Google Scholar] [CrossRef] [Scilit]
- Podsakoff, P.M.; MacKenzie, S.B.; Lee, J.-Y.; Podsakoff, N.P. Common method biases in behavioral research: A critical review of the literature and recommended remedies. J. Appl. Psychol. 2003, 88, 879–903. [Google Scholar] [CrossRef] [Scilit] [PubMed]
- Munda, G. Social Multi-Criteria Evaluation for a Sustainable Economy; Springer: Berlin/Heidelberg, Germany, 2008. [Google Scholar] [CrossRef] [Scilit]
- Saisana, M.; Saltelli, A.; Tarantola, S. Uncertainty and sensitivity analysis techniques as tools for the quality assessment of composite indicators. J. R. Stat. Soc. Ser. A 2005, 168, 307–323. [Google Scholar] [CrossRef] [Scilit]
- Lei, Z.; Wang, D. Digital transformation and total factor productivity: Empirical evidence from China. PLoS ONE 2023, 18, e0292972. [Google Scholar] [CrossRef] [Scilit] [PubMed]
- Cronbach, L.J. Coefficient alpha and the internal structure of tests. Psychometrika 1951, 16, 297–334. [Google Scholar] [CrossRef] [Scilit]
- McDonald, R.P. Test Theory: A Unified Treatment; Lawrence Erlbaum Associates: Mahwah, NJ, USA, 1999. [Google Scholar] [CrossRef] [Scilit]
- Vandenberg, R.J.; Lance, C.E. A review and synthesis of the measurement invariance literature: Suggestions, practices, and recommendations for organizational research. Organ. Res. Methods 2000, 3, 4–70. [Google Scholar] [CrossRef] [Scilit]
- Fornell, C.; Larcker, D.F. Evaluating structural equation models with unobservable variables and measurement error. J. Mark. Res. 1981, 18, 39–50. [Google Scholar] [CrossRef] [Scilit]
- Preacher, K.J.; Zyphur, M.J.; Zhang, Z. A general multilevel SEM framework for assessing multilevel mediation. Psychol. Methods 2010, 15, 209–233. [Google Scholar] [CrossRef] [Scilit] [PubMed]
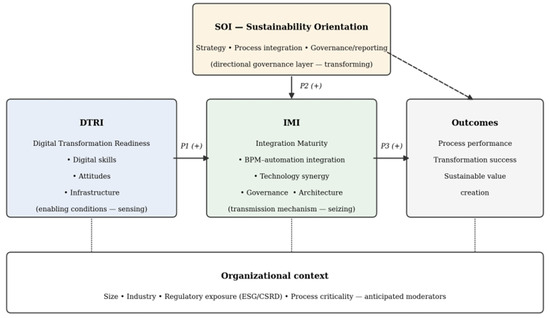
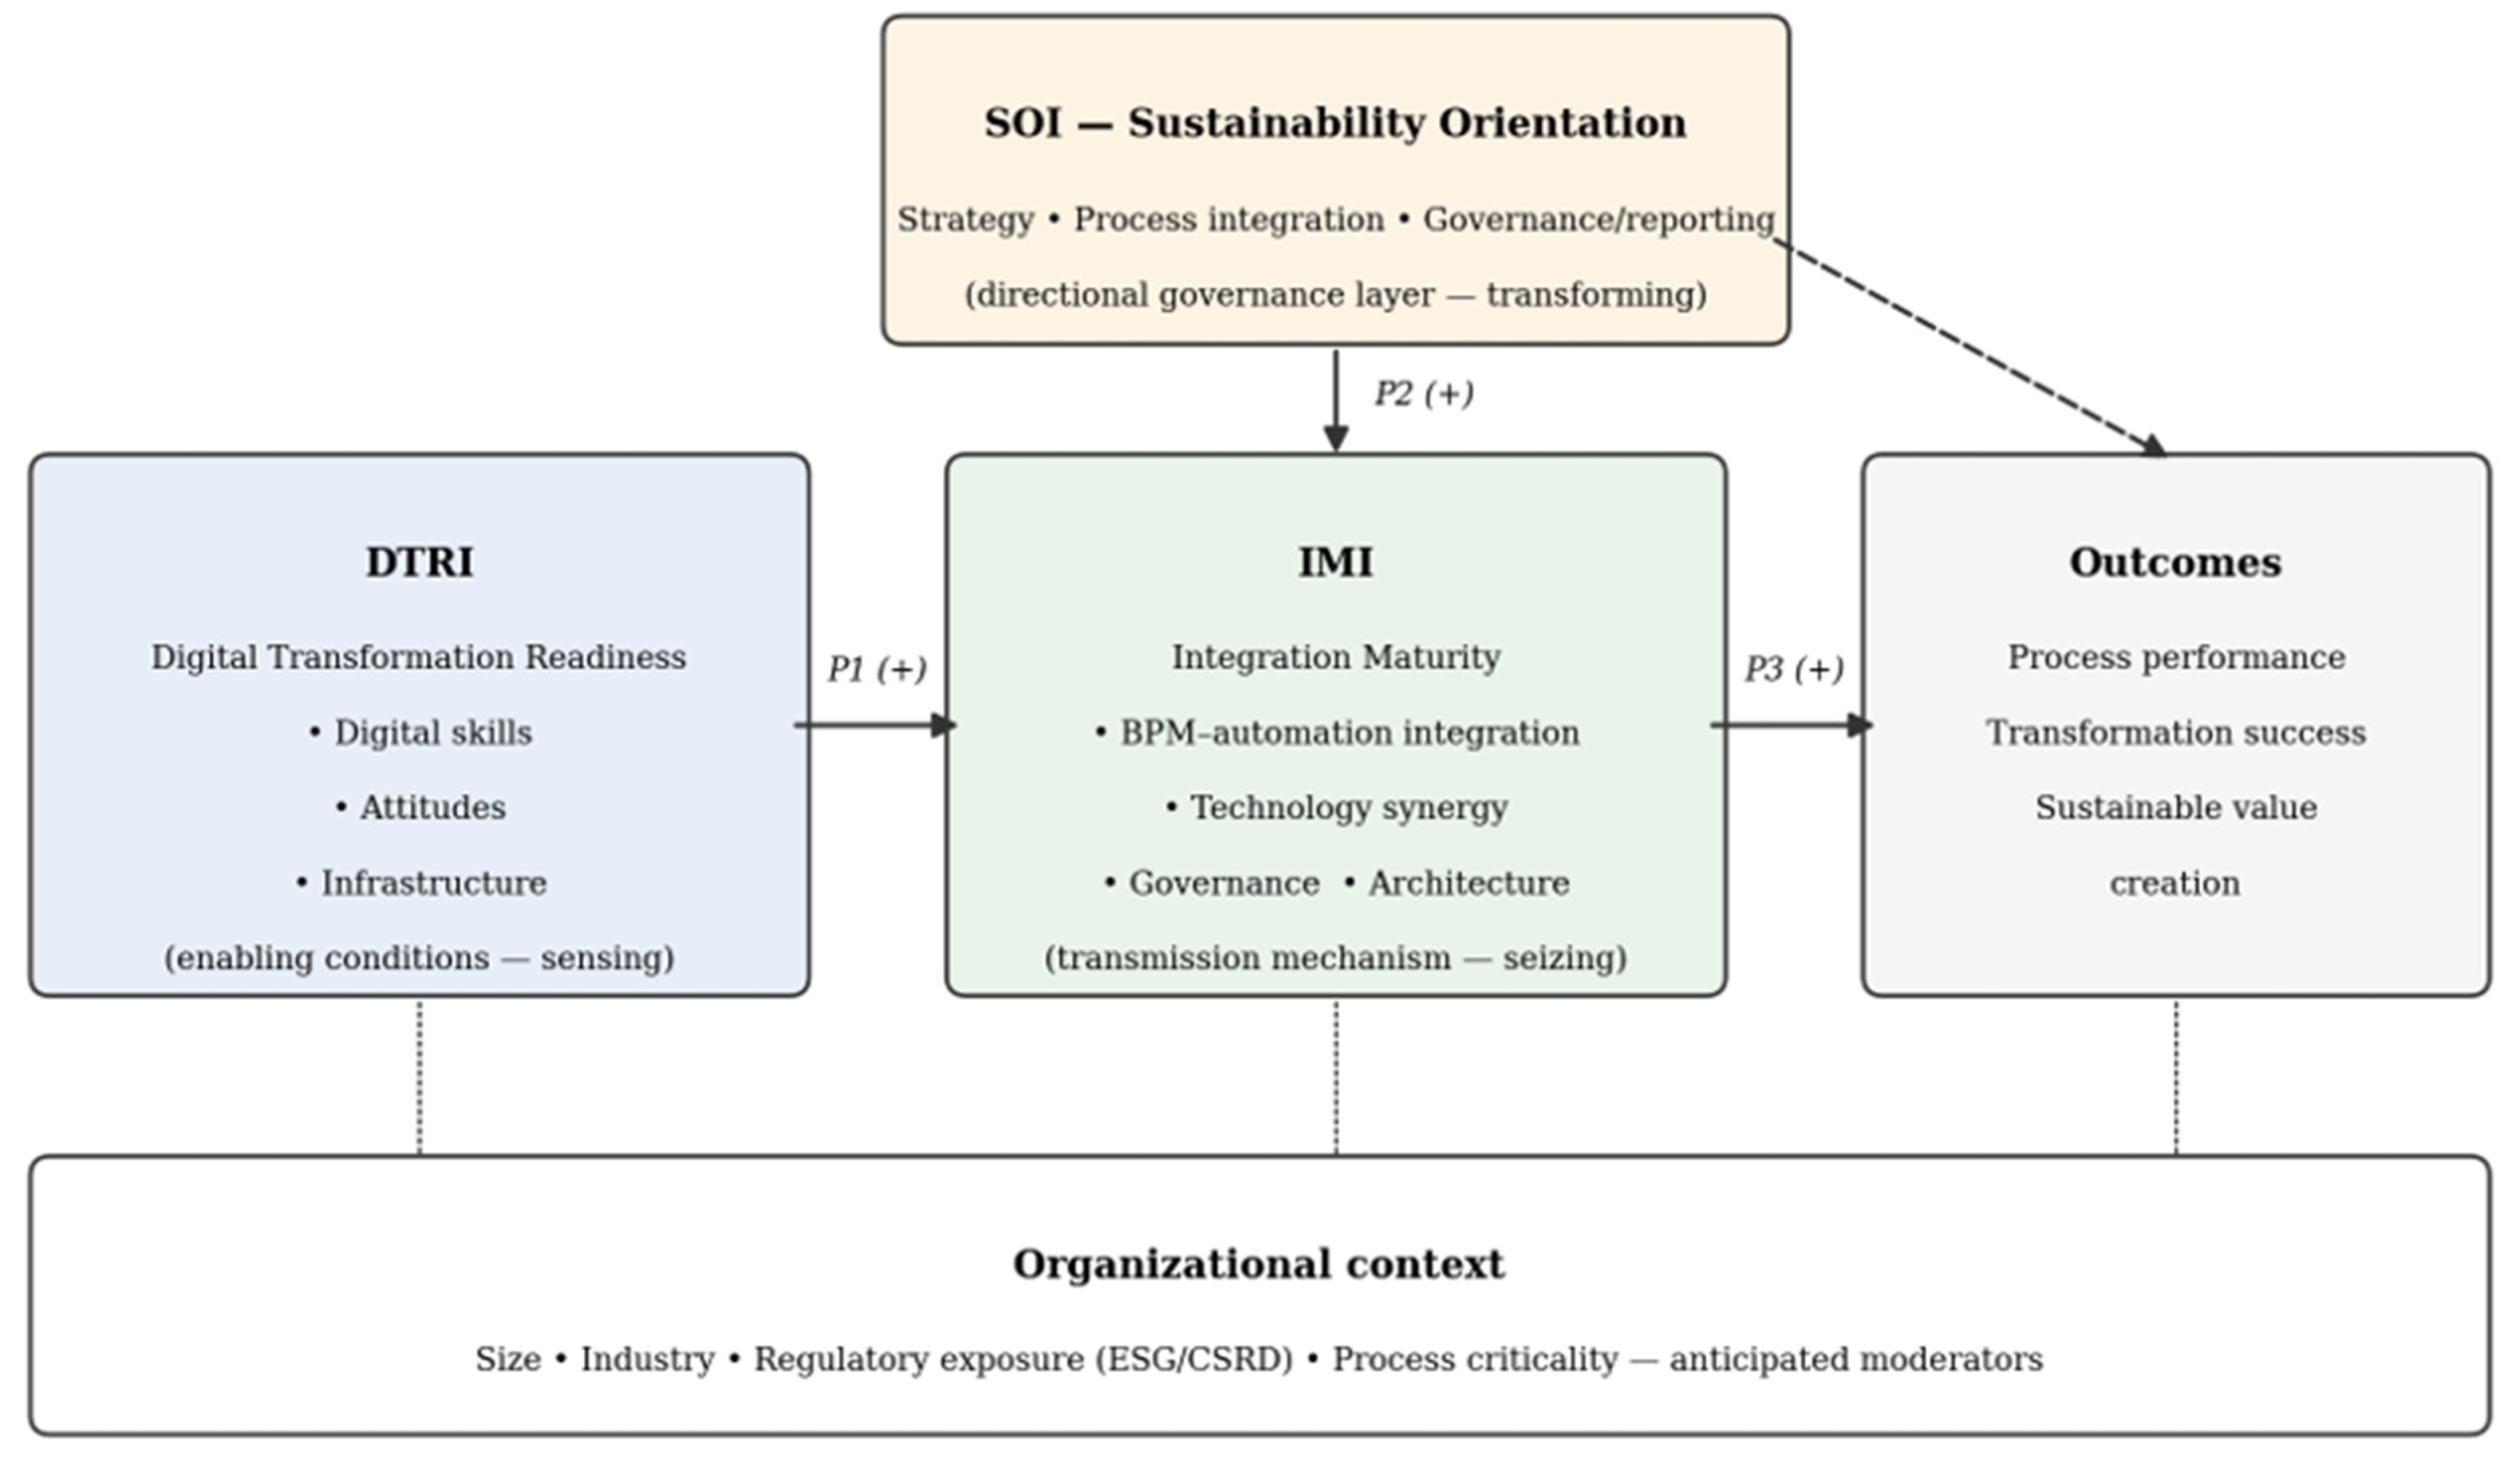

Disclaimer/Publisher’s Note: The statements, opinions and data contained in all publications are solely those of the individual author(s) and contributor(s) and not of MDPI and/or the editor(s). MDPI and/or the editor(s) disclaim responsibility for any injury to people or property resulting from any ideas, methods, instructions or products referred to in the content. |
© 2026 by the authors. Licensee MDPI, Basel, Switzerland. This article is an open access article distributed under the terms and conditions of the Creative Commons Attribution (CC BY) license.