


Highlights
Please indicate how your work links to systems science via your contributions to systems practice, theory, and/or methodology.
- Vertical agglomeration connects agricultural production, processing, and services, while its coupling with horizontal production agglomeration forms the agricultural industry agglomeration subsystem.
- The subsystem, agricultural industry resilience, and digital village development form an integrated analytical framework, with agricultural carbon emission intensity representing environmental performance.
What are the main findings and/or the implications of the main findings?
- Evidence from the indirect association is consistent with agricultural industry resilience serving as one pathway linking system coordination to carbon performance.
- The positive association between agricultural industry agglomeration and agricultural industry resilience is larger at higher levels of digital village development.
Abstract
Decarbonizing agriculture depends not only on the efficiency of individual production activities but also on coordination among production, processing, and service activities. From a systems perspective, this study treats provincial agriculture as an interconnected industrial system and examines the relationship between agricultural industry agglomeration and agricultural carbon emission intensity. Moving beyond conventional measures of production concentration, agricultural industry agglomeration is measured as coordination between horizontal agglomeration in agricultural production and vertical agglomeration across production, processing, and agricultural services. Based on a balanced panel of 390 observations across 30 Chinese provinces from 2011 to 2023, the study uses province and year fixed effects, mediation and moderation analyses, robustness checks, and an endogeneity check. Results show that agricultural industry agglomeration is significantly associated with lower agricultural carbon emission intensity. The mediation results are consistent with a partial intermediary role for agricultural industry resilience in this relationship. The interaction and simple slope results show that the positive association between agricultural industry agglomeration and agricultural industry resilience is larger at higher levels of digital village development. These findings connect subsystem coordination, adaptive capacity, digital conditions, and carbon performance, thereby extending research on agricultural transformation toward lower carbon intensity from a systems perspective.
1. Introduction
Climate change and rising food security risks pose two major challenges to global agriculture. In 2025, the global mean temperature was approximately 1.43 °C above the 1850 to 1900 average [1]. An estimated 645 million people experienced hunger, representing 7.8% of the global population [2]. In China, input-intensive and resource-intensive production has supported agricultural output growth. It has also increased the environmental pressure associated with the transition toward greener agriculture [3]. Agricultural carbon emission intensity measures carbon emissions per unit of agricultural output and is an important indicator of low-carbon performance [4]. From a systems perspective, provincial agriculture comprises interdependent production, processing, and agricultural service activities. Products, production factors, information, and technology connect these activities [5]. Horizontal concentration within agricultural production and vertical linkages across production, processing, and services represent two organizational dimensions of this industrial system. Production agglomeration may improve agricultural environmental efficiency through economies of scale and technology spillovers [6]. However, the relationship between coordination across these organizational dimensions and carbon emissions per unit of output remains insufficiently understood.
Existing research documents nonlinear and negative associations between agricultural industry agglomeration and environmental efficiency, green development, agricultural carbon emissions, and carbon emission intensity [3,7,8,9,10]. Rural industrial integration is also associated with lower agricultural carbon emissions [11]. Differences in the reported patterns may arise from variations in outcome variables, model specifications, spatial scales, and agglomeration measures. A common approach measures agglomeration using location quotients based on agricultural employment or output shares [3,12]. These indicators primarily describe regional specialization in agricultural production. Additional dimensions are therefore needed to characterize coordination among production, processing, and agricultural services. Manufacturing research further distinguishes horizontal from vertical agglomeration and indicates that the two dimensions convey different structural information [13]. Drawing on this distinction, this study measures agricultural industry agglomeration through the coordination between horizontal production agglomeration and vertical agglomeration across production, processing, and agricultural services.
A second strand examines how agglomeration and digitalization relate to the adaptive capacity of agricultural systems. Agricultural industry agglomeration is positively associated with agricultural economic resilience, with socialized services and production efficiency identified as potential channels [14,15]. Farming system research emphasizes robustness, recovery, and adaptation as important system capacities [16]. Infrastructure and material and information flows also shape how agricultural systems respond to disturbances [17]. Digital village development is associated with stronger agricultural resilience [18]. Related digital technologies facilitate information and resource flows [5] and support greener allocation of agricultural water resources [19].
Despite these advances, three questions remain. First, agricultural industry agglomeration is still commonly treated as the horizontal spatial concentration of agricultural production. Limited attention has been given to coordination between horizontal production agglomeration and vertical agglomeration. Existing measures therefore do not fully capture the organizational relationships among production, processing, and agricultural services. Second, studies of agricultural industry agglomeration, agricultural industry resilience, and agricultural carbon emissions usually estimate separate relationships. Agricultural industry resilience has rarely been tested as a transmission pathway operating at the system level between agglomeration coordination and environmental performance. The process linking the two remains insufficiently explained. Third, existing evidence connects digital village development with agricultural resilience. However, there is limited direct evidence on whether digital village development changes the strength of the relationship between agricultural industry agglomeration and agricultural industry resilience. These gaps leave an incomplete systems explanation of how industrial coordination relates to low-carbon performance through adaptive capacity and how digital conditions shape this relationship.
To address these gaps, this study conceptualizes provincial agriculture as an industrial system of interdependent production, processing, and agricultural service activities embedded in a broader digital environment. Agricultural industry agglomeration, agricultural industry resilience, digital village development, and agricultural carbon emission intensity represent system organization, adaptive capacity, digital conditions, and environmental performance, respectively. The analysis examines the association between coordination within the industrial system and carbon emission intensity, together with the possible intermediary role of resilience. It also tests whether the association between agglomeration and resilience varies with digital conditions. The empirical analysis uses a balanced panel of 390 observations covering 30 provincial regions in China from 2011 to 2023. All models include province and year fixed effects. Mediation and moderation analyses are used to examine the proposed pathway and moderating relationship. Robustness and endogeneity checks assess the stability and temporal ordering of the estimates, with the endogeneity check implemented as a temporal falsification test. Comparisons across grain functional zones and unconditional quantile regression examine their empirical scope.
This study makes three contributions. First, it extends conventional concentration measures by operationalizing AGG as the coupling coordination between horizontal production agglomeration and vertical agglomeration across production, processing, and agricultural services. Second, it connects system organization, adaptive capacity, digital conditions, and carbon performance within one testable framework. AR is specified as a possible intermediary pathway, while DV is examined as a condition shaping the relationship between AGG and AR. Third, the study provides provincial evidence and assesses the scope of the estimated relationship between AGG and ACE across grain functional zones and the unconditional distribution of ACE.
2. Theoretical Framework and Hypothesis Development
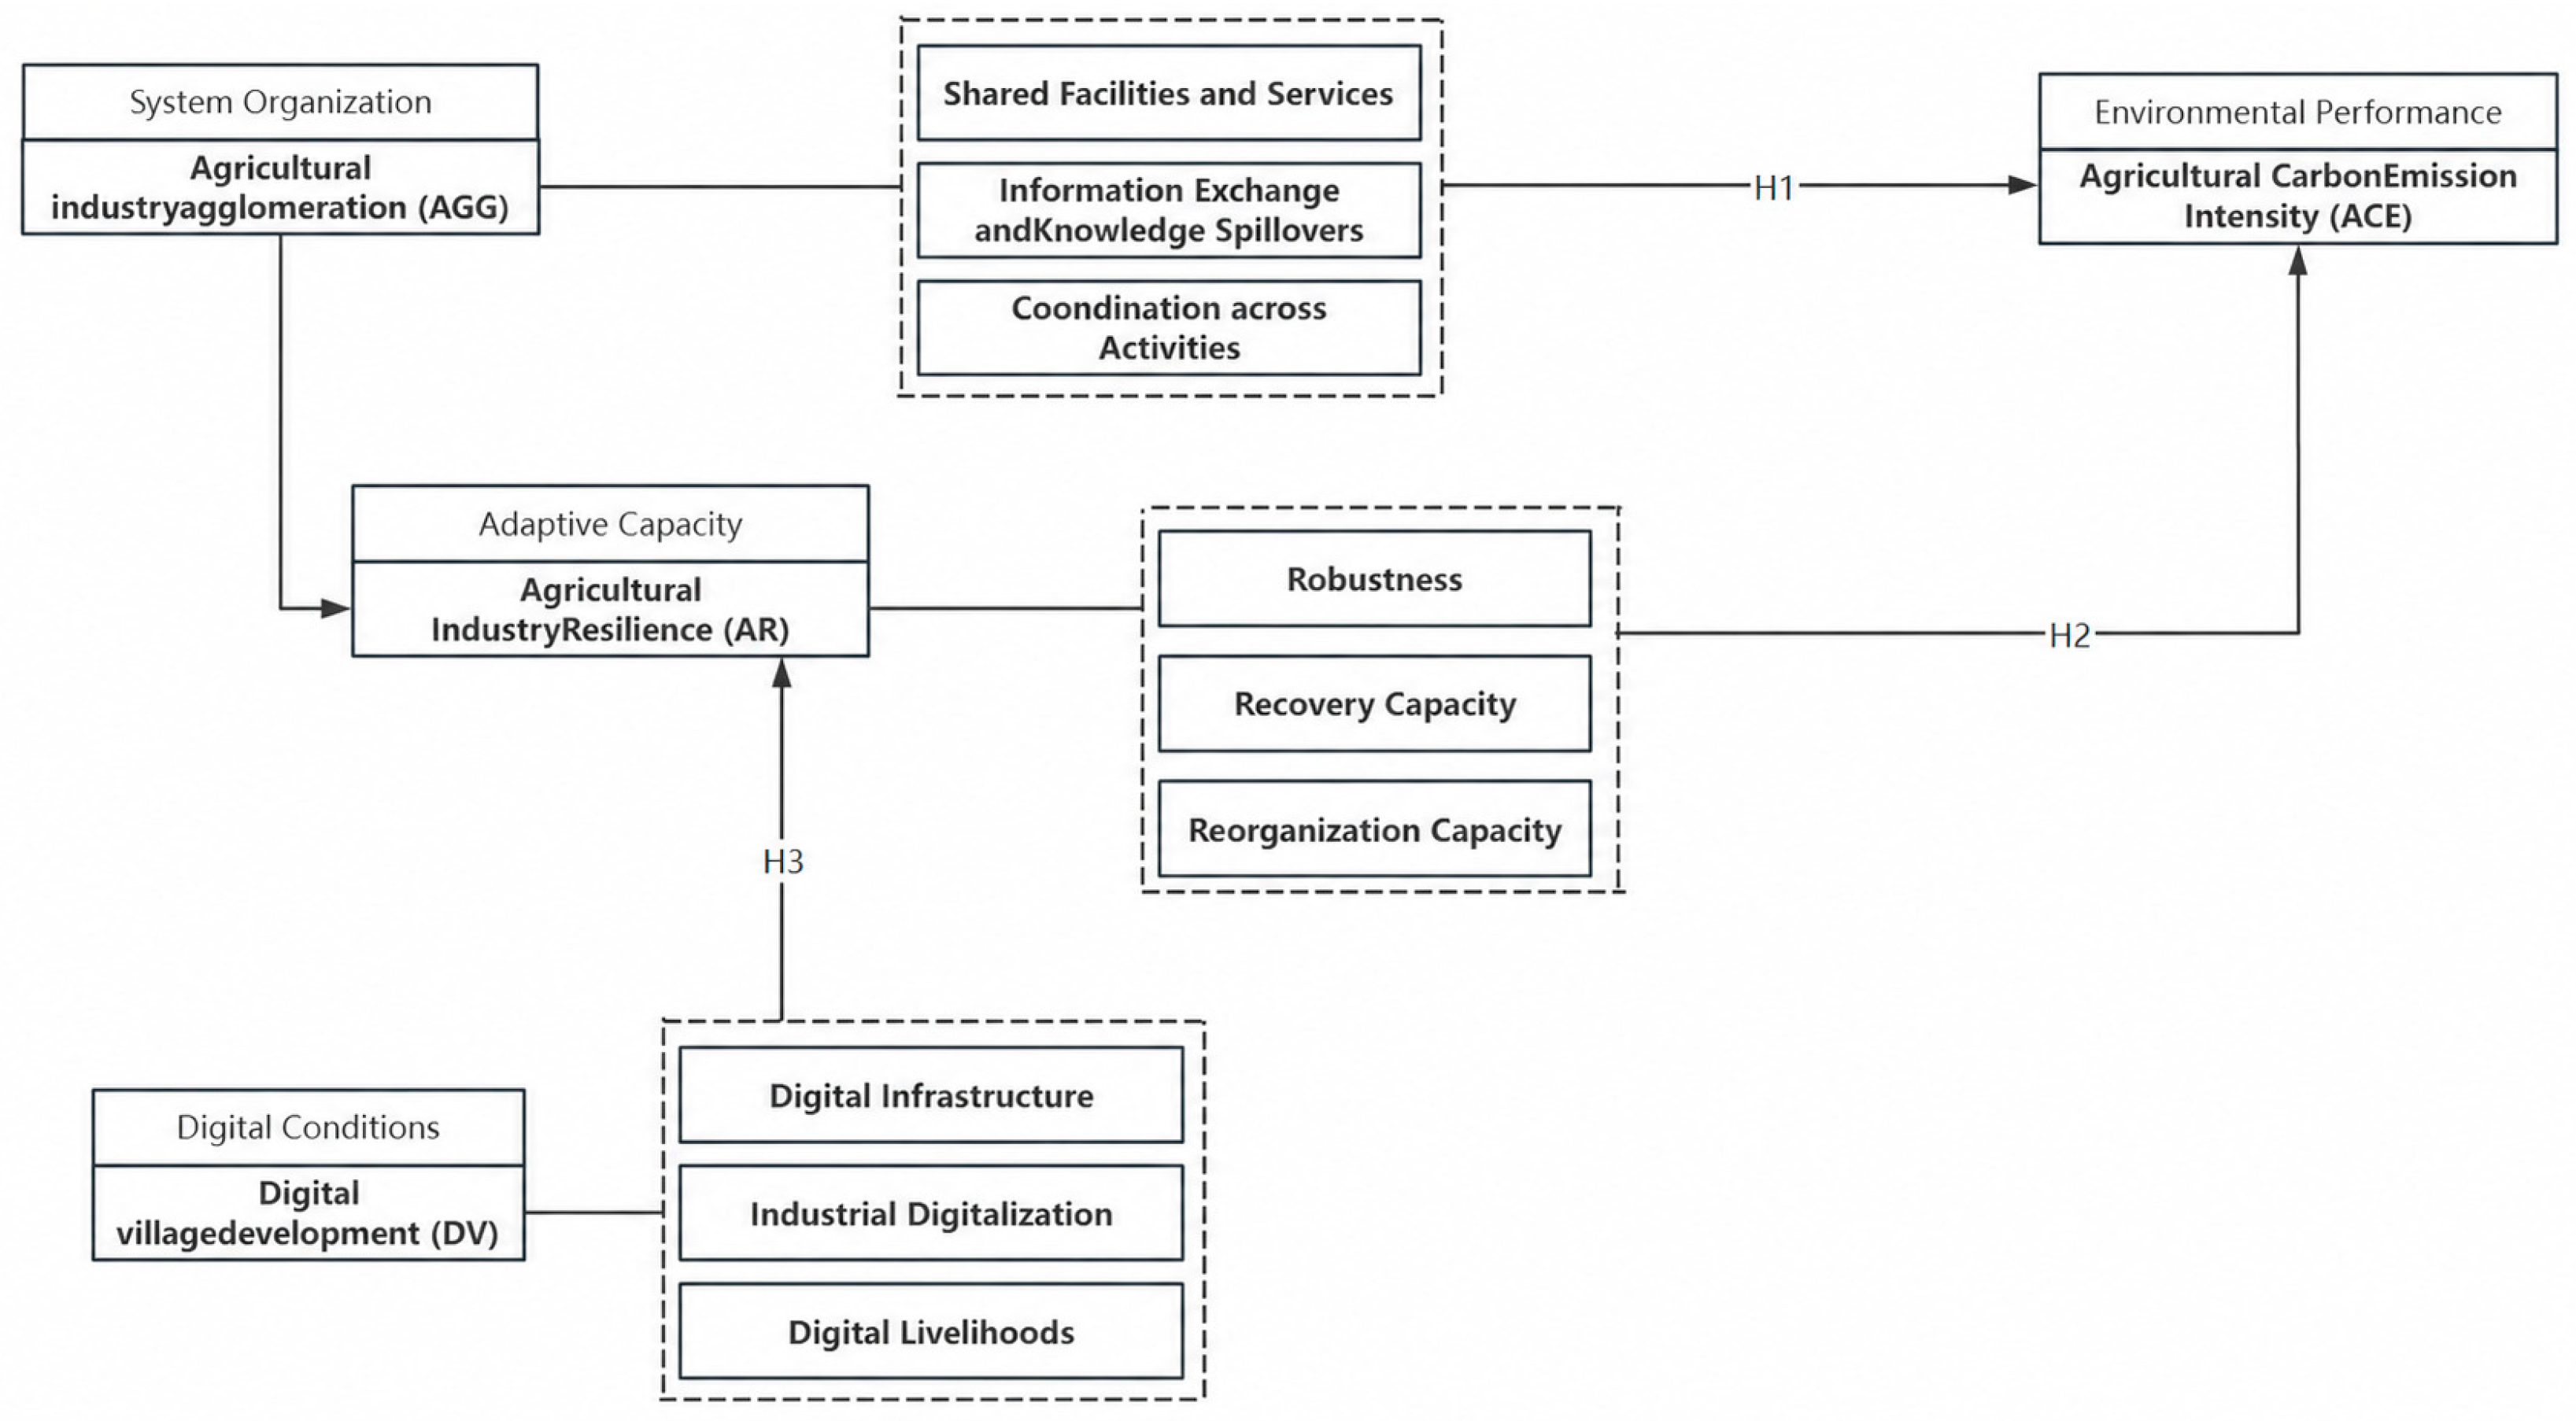
From a systems perspective, provincial agriculture comprises interdependent production, processing, and service activities linked through flows of products, production factors, information, and technology. Within this framework, Agricultural Industry Agglomeration (AGG) captures the coordination between horizontal agglomeration in agricultural production and vertical agglomeration across these activities, Agricultural Industry Resilience (AR) represents adaptive capacity, and Agricultural Carbon Emission Intensity (ACE) indicates carbon performance. Digital village development (DV) reflects the digital conditions affecting information transmission and resource circulation and is examined as a moderator of the association between AGG and AR. These roles provide the basis for the hypotheses developed below.
2.1. The Effect of Agricultural Industry Agglomeration on Agricultural Carbon Emission Intensity
Prior research establishes the spatial concentration of agricultural production and shows that its evolution reflects natural conditions, institutional change, public policy, and neighboring land-use patterns [20,21]. Evidence from agro-industrial clusters further indicates that vertical coordination across production and processing matters alongside spatial concentration [22]. Together, these studies identify spatial concentration and coordination across activities as distinct dimensions of agricultural organization. To capture this additional dimension, this study follows Wang [23] in distinguishing horizontal agglomeration within agricultural production from vertical agglomeration across production, processing, and agricultural services. AGG is measured as the coupling coordination degree between these two subsystems and therefore represents synergistic agglomeration rather than the scale of a single segment. In this study, ACE is operationalized as carbon emissions estimated from six specified agricultural production sources per unit of the real gross output value of agriculture, forestry, animal husbandry, and fishery at 2011 constant prices [4,10,24]. It captures agricultural carbon performance within this defined accounting boundary.
Externality theory provides the primary theoretical basis for explaining the relationship between AGG and ACE. It holds that one actor’s activities can alter the costs or benefits faced by others, while spatial concentration magnifies these interdependencies. Marshall identifies specialized suppliers, labor pooling, and knowledge spillovers as important sources of localized positive externalities [25]. Empirical evidence from U.S. manufacturing supports these mechanisms and identifies input–output linkages as a particularly important driver of coagglomeration [26]. Increasing returns can further reinforce spatial concentration [27]. However, agglomeration may also intensify congestion and competition for local resources [28]. AGG can therefore generate positive and negative environmental externalities at the same time. Previous findings across related environmental outcomes suggest that the efficiency gains and environmental costs of agglomeration may coexist and vary with its degree and organizational form [7,8].
Against this background, the negative externality pathway arises when excessive agglomeration intensifies competition for production factors, exceeds the capacity of local infrastructure, and encourages inefficient resource use [7]. The positive externality pathway, by contrast, operates through three mechanisms that may reduce resource and energy use per unit of real agricultural output. First, spatial proximity facilitates specialization and the shared use of machinery, infrastructure, logistics, and agricultural services, which can reduce duplicated inputs and improve production efficiency [29]. Second, proximity promotes information exchange and knowledge diffusion and may accelerate the adoption of more resource-efficient practices [12,27]. Third, coordination across production, processing, and agricultural services can improve factor matching and support structural upgrading [10]. Through these mechanisms, AGG can lower the carbon burden per unit of real agricultural output when the resulting efficiency gains outweigh the associated resource pressures. Because AGG captures coordination between horizontal and vertical agglomeration rather than production concentration alone, it is more closely aligned with the sharing of resources, the matching of production factors, and specialization across production stages. Over the observed sample range, these positive externalities are expected to generate efficiency gains that outweigh the associated congestion and resource pressures. Accordingly, the following hypothesis is proposed:
H1.
A higher level of agricultural industry agglomeration is associated with lower agricultural carbon emission intensity.
2.2. The Potential Mediating Role of Agricultural Industry Resilience
Agricultural industry resilience (AR) denotes the capacity of an agricultural industrial system to withstand external shocks, restore production and resource flows, and reorganize its internal structure in response to changing conditions. In this study, AR is measured using a composite index constructed with entropy weights and based on ten indicators of robustness, recovery capacity, and reorganization capacity. Robustness refers to the ability to maintain essential agricultural functions during a disturbance. Recovery capacity captures the restoration of production after disruption, whereas reorganization capacity reflects structural adjustment in response to new environmental and market conditions.
Resilience theory provides the complementary theoretical basis for the mediating mechanism. Holling defines resilience as the capacity of a system to absorb disturbance while retaining its essential functions [30]. Subsequent research extends this idea to resistance, recovery, adaptation, and structural renewal in regional systems [31,32]. Research on coupled social and ecological systems further emphasizes adaptability and transformability under changing conditions [33]. Studies of farming systems apply these capacities to the maintenance, adjustment, and transformation of agricultural functions [16,34]. The three dimensions used in this study are empirical expressions of these general resilience capacities, but they do not correspond exactly to the dimensions adopted in every existing framework.
The proposed mediating pathway comprises two relationships. The first concerns the association between AGG and AR. The positive externalities generated by AGG expand the network resources available to agricultural actors during disturbances. Closer linkages among production, processing, and agricultural services facilitate the circulation of information and resources across the value chain [23,35]. Agglomeration also expands access to agricultural socialized services and improves production efficiency [14]. Agricultural technical efficiency provides an additional channel through which agglomeration enhances agricultural economic resilience [15]. Coordination across stages of the agricultural value chain provides agricultural actors with alternative suppliers, services, and market connections when one link is disrupted [23,35]. These mechanisms strengthen robustness, accelerate recovery, and support reorganization following disturbances.
The second relationship concerns the association between AR and ACE. Greater resilience does not necessarily imply lower carbon emissions because buffers and redundant capacity may require additional resources [16,34]. Its environmental effect depends on how the three capacities represented by AR influence the relationship between emissions and output. Robustness limits production losses and reduces imbalances between resource inputs and agricultural output during disturbances. Recovery capacity shortens periods in which resource use remains high relative to agricultural output. Reorganization capacity facilitates the replacement of inefficient production arrangements with alternatives that are more adaptive and use resources more efficiently. When the efficiency gains from avoiding losses caused by disturbances exceed the costs of maintaining resilience, stronger AR is expected to be associated with lower carbon emissions per unit of real agricultural output. Taken together, these capacities may reduce efficiency losses arising from disturbances and facilitate more resource-efficient adjustments in agricultural production.
These arguments suggest that higher AGG is expected to be associated with stronger AR, while stronger AR is, in turn, expected to be associated with lower ACE. AR is therefore examined as one potential intermediary pathway between AGG and ACE. Accordingly, the following hypothesis is proposed:
H2.
A higher level of agricultural industry agglomeration is associated with stronger agricultural industry resilience, which is, in turn, associated with lower agricultural carbon emission intensity.
2.3. The Moderating Role of Digital Village Development
Digital village development (DV) refers to the integration of digital infrastructure, digital technologies, data resources, and digital services into rural production and livelihoods [36]. In this study, DV is measured using a composite index constructed with the entropy weight method and covering digital infrastructure, industrial digitalization, and digital livelihoods. DV is treated as an external development condition rather than a component of AGG or AR.
Externality theory provides the primary entry point for understanding the moderating role of DV. The positive externalities of AGG depend on how efficiently information, knowledge, services, and production factors circulate among agglomerated actors. Weak digital conditions can restrict these flows even when firms and service providers are geographically concentrated. Digital development can reduce these frictions and enable existing agglomeration networks to generate stronger information spillovers, benefits from shared services, and coordination gains [18,37]. Resilience theory explains why these stronger external effects matter for AR. Evidence from organizational settings indicates that digitalization does not automatically generate benefits; its effects depend on whether actors can update existing knowledge and reconfigure resources in response to new information [38]. Faster information transmission and more flexible resource reconfiguration improve the capacity to maintain functions, recover from disruption, and reorganize after shocks. Evidence of a positive association between DV and agricultural resilience supports this connection [18]. This direct association does not by itself establish moderation, which requires the association between AGG and AR to vary with the level of DV.
The positive association between AGG and AR may become stronger as DV advances for three reasons. First, digital platforms improve the timeliness of production, market, weather, and disaster information [18,37]. Information and knowledge spillovers generated by AGG can therefore reach connected actors more quickly. Second, data sharing reduces information asymmetry and improves coordination among farmers, processors, service providers, financial institutions, and public agencies [18,37]. This allows the shared-service and factor-matching benefits of AGG to be used more effectively. Third, digital connectivity reinforces links across production stages and provides alternative channels for resource mobilization during disturbances. Recent evidence based on firm data indicates that integrating digital technologies with real economic activities improves resource allocation and coordination within supply chains, especially in regions with more advanced digital infrastructure [39]. Recent studies generally associate rural digitalization with stronger resilience in agriculture and agricultural supply chains through improved information transmission and resource coordination [18,40,41,42,43]. However, these studies mainly examine direct relationships or individual mechanisms, leaving limited evidence on whether the association between AGG and AR varies with the level of DV. Taken together, these arguments suggest that the positive association between AGG and AR is stronger where DV is more advanced. Accordingly, the following hypothesis is proposed:
H3.
The positive association between agricultural industry agglomeration and agricultural industry resilience is stronger in regions with higher levels of digital village development.
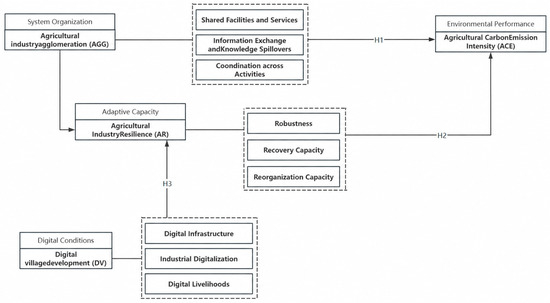
Figure 1 summarizes the proposed systems framework and the three hypotheses.
Figure 1.
Systems framework and hypothesized relationships among system organization, adaptive capacity, digital conditions, and environmental performance. The dashed outlines group the proposed coordination channels for AGG and the components of AR and DV
3. Research Design
3.1. Data Sources and Sample Selection
This study constructs a balanced panel dataset for 30 provincial regions in China from 2011 to 2023, excluding Hong Kong, Macao, Taiwan, and Tibet. The study period was selected for two reasons. First, the underlying data required to construct ACE and AGG are consistently available and sufficiently comparable across provinces during this period. Second, the period captures an important stage in China’s agricultural transformation, beginning with the policy emphasis on sustainable agriculture under the Twelfth Five-Year Plan and extending to the acceleration of the green transition following the announcement of the carbon peaking and carbon neutrality goals in 2020 [44].
Primary data are drawn from the China Statistical Yearbook, China Rural Statistical Yearbook, and provincial statistical yearbooks. Prior to estimation, a standard data preprocessing procedure was applied. Cultivated land area data for 2018 were missing for all provinces and were therefore imputed using linear interpolation. The gross output value of agriculture, forestry, animal husbandry, and fishery used to construct ACE was converted to 2011 constant prices using the corresponding gross output value index, thereby removing the effect of price changes from the denominator of ACE. The disaster variable is transformed using ln(x + 1), while trade openness is transformed using the inverse hyperbolic sine function. The remaining variables enter the regressions in levels.
3.2. Variable Description and Measurement
To ensure the scientific rigor and replicability of the empirical analysis, this section details the definitions, measurement methodologies, and data sources for the primary variables. Table 1 summarizes the definitions and measurement procedures for the variables used in the analysis.
Table 1.
Definitions of the variables.
3.2.1. Agricultural Carbon Emission Intensity (ACE)
Following Li et al. [24] and subsequent provincial studies, aggregate production-related carbon emissions are estimated from six sources: chemical fertilizer, pesticides, agricultural plastic film, agricultural diesel, irrigation, and tillage [4,10,45,46]. Following the specification of Feng et al. [4], ACE is calculated as the ratio of these emissions to the real gross output value of agriculture, forestry, animal husbandry, and fishery at 2011 constant prices. The indicator therefore measures the carbon burden associated with six specified production sources per unit of real provincial agricultural output.
In Equation (1), Cit denotes aggregate carbon emissions from the six agricultural production sources in province i and year t; denotes the emissions generated by carbon source k; represents the corresponding activity level; δk is the emission coefficient for carbon source k. The emission coefficients are reported in Table 2.
Table 2.
Carbon emission coefficients of major agricultural sources.
Based on the total emissions obtained from Equation (1), ACE is calculated as follows:
In Equation (2), ACEit denotes agricultural carbon emission intensity for province i and year t. Cit represents aggregate agricultural carbon emissions from the six specified sources, as calculated using Equation (1). AVit,2011 denotes the real gross output value of agriculture, forestry, animal husbandry, and fishery for province i and year t, expressed at 2011 constant prices. The nominal gross output value is converted to 2011 constant prices using a price index for which 2011 is the base year and the index is set to 100. Equation (2) expresses the emissions estimated from the six specified sources relative to the real gross output value of agriculture, forestry, animal husbandry, and fishery. This treatment reduces the influence of production scale and facilitates comparisons across provinces and years.
3.2.2. Agricultural Industry Agglomeration (AGG)
International studies commonly use the location quotient to measure the relative spatial concentration or specialization of agricultural activities because it facilitates comparisons across regions of different economic sizes [12,20]. At the same time, a provincial agricultural industry system extends beyond primary production and includes vertically connected processing and service activities [5]. The conceptual distinction between horizontal and vertical agglomeration follows Kalathil et al. [13], while the operational coupling procedure is adapted from Wang [23]. Accordingly, this study measures Agricultural Industry Agglomeration (AGG) from two complementary dimensions: horizontal concentration in agricultural production and vertical agglomeration across production, processing, and agricultural services.
The location quotient is calculated separately for the three components of the vertical subsystem. The production location quotient compares the share of agricultural output in provincial GDP with the corresponding share at the national level. The processing location quotient compares revenue from agricultural product processing as a share of provincial industrial revenue with the corresponding national share. The service location quotient compares the output share of specialized and auxiliary activities in agriculture, forestry, animal husbandry, and fishery with the corresponding national share. The inclusion of the service component is also consistent with the use of location quotients to identify the regional concentration of producer services [49]. The three components are combined using weights determined by the entropy method to construct the Vertical Agglomeration Index (VAI), as reported in Table 3.
Table 3.
Measurement Framework for Vertical Agglomeration Indicators (VAI).
Horizontal agglomeration (HAI) is represented by the production location quotient. The production component therefore enters the two subsystems for different analytical purposes. In HAI, it independently measures the relative spatial concentration of primary agricultural production. In VAI, it represents the upstream production component required to evaluate the coordinated concentration of production, processing, and agricultural services. AGG is subsequently calculated as the coupling coordination degree between HAI and VAI using Equations (4)–(6). A higher AGG value indicates stronger coordination between the horizontal concentration of agricultural production and the vertical concentration of activities along the agricultural industry chain.
where wm represents the entropy weight for dimension m. To capture the coordination between horizontal concentration and vertical agglomeration, a coupling coordination model comprising two subsystems is constructed. We define horizontal agglomeration (HAI) using the production location quotient (HAIi = LQ1i), which represents the foundational spatial clustering of agricultural activities. The production location quotient serves different analytical roles in the two subsystems. In HAI, it measures the spatial concentration of primary agricultural production, whereas in VAI, it represents the upstream production component required to evaluate coordination across production, processing, and agricultural services. The comprehensive agglomeration index (AGG) is then computed as the coupling coordination degree (D) between the HAI and VAI subsystems:
VAIi = w1 × LQ1i + w2 × LQ2i + w3 × LQ3i
The coupling degree C measures the mutual reinforcement intensity between the two subsystems:
Finally, the comprehensive coordination index T represents the overall development level of both dimensions, with equal contributions assumed:
Ti = α ⋅ HAIi + β ⋅ VAIi, α = β = 0.5
A higher AGG value indicates a higher level of coordinated development between production-based spatial concentration and the concentration of production, processing, and agricultural service activities.
3.2.3. Explanation of Other Variables
(1) Agricultural Industry Resilience (AR). Agricultural Industry Resilience (AR) is measured using a framework of system capacities derived from research on agricultural and regional resilience. Agricultural resilience studies distinguish the capacity to withstand disturbances from the capacities to adapt operations and transform system structures [16,34]. Regional economic resilience research further emphasizes resistance, recovery, and the reorientation of economic structures following shocks [31]. Adapting these perspectives to the provincial agricultural industry system, this study evaluates AR through three dimensions: robustness, recovery, and reorganization.
Robustness refers to the capacity to maintain core agricultural production functions during disturbances. Recovery captures the capacity to restore production and resource flows after a disruption. Reorganization reflects the capacity to reallocate resources and adjust internal structures in response to changing environmental and market conditions. Consistent with empirical studies published in English that construct multidimensional agricultural resilience indices for Chinese provinces [35,50], the ten indicators reported in Appendix Table A1 are combined using the entropy weight method. The index comprises four indicators of robustness, four indicators of recovery, and two indicators of reorganization. The entropy weight method determines indicator weights from their observed variation, thereby reducing reliance on subjectively assigned weights. Wang [23] is retained as a supplementary reference for adapting the specific indicators to the availability and statistical definitions of Chinese provincial data.
(2) Digital Village Development (DV). Digital Village Development (DV) is measured using a composite index that captures the integration of digital technologies across multiple dimensions of rural systems. Drawing on the framework of Wang and Guo [40], we evaluate DV across three dimensions: digital infrastructure, industrial digitalization, and digital livelihoods. This design aligns with the broader transition toward Digital Agriculture 4.0 [37] and adopts representative metrics tailored to China’s rural context [36]. To mitigate subjective bias in weighting, the composite index is subsequently constructed via the entropy weight method, following Lei et al. [51]. The complete measurement framework for DV is detailed in Appendix Table A2.
(3) Control Variables. To mitigate potential omitted variable bias, this study incorporates a set of control variables grounded in established literature, including Per Capita GDP(PGDP), Urbanization Rate (Urban), Agricultural Fiscal Support Level (Fiscal), Agricultural Disaster Area (Disaster), Rural Human Capital (HC), Effective Irrigation Area (IRR), Trade Openness (Open) and Industrial Structure Upgrading (Indus). These variables capture important economic, structural, environmental, and institutional factors that may simultaneously influence ACE and AGG. Detailed variable definitions, measurement approaches, and expected directional effects are summarized in Table 1. Additionally, HC is calculated as (the number of rural residents with primary education × 6 + the number of rural residents with junior secondary education × 9 + the number of rural residents with senior secondary or technical secondary education × 12 + the number of rural residents with a college degree or above × 16) divided by the total rural population aged six and above.
3.3. Model Specification
3.3.1. Baseline Model Specification
To empirically examine the association between AGG and ACE, this study specifies the following baseline regression model (7):
where i and t index provinces and years, respectively. ACEit denotes agricultural carbon emission intensity for provinces i in year t. AGGit denotes agricultural industry agglomeration and serves as the core explanatory variable. Contit denotes a vector of control variables. μi denotes province fixed effects, which account for unobserved provincial characteristics that do not vary over time. λt denotes year fixed effects, which absorb macroeconomic shocks and other temporal changes common to all provinces. ϵit denotes the idiosyncratic error term.
ACEit = β0 + β1AGGit + β2Contit + μi + λt + ϵit
The parameter of primary interest is β1, which estimates the conditional association between AGG and ACE. If β1 < 0 and is statistically significant, it indicates that a higher level of AGG is negatively associated with ACE. Finally, standard errors are clustered at the provincial level to account for potential heteroskedasticity and serial correlation within each province.
3.3.2. Mediation-Effect Model
To assess whether the estimated relationships are consistent with a mediating role for AR, this study follows the sequential regression procedure discussed by Jiang [52]. Model (8) estimates the association between AGG and AR. Model (9) then estimates the association between AR and ACE after accounting for AGG.
where ARit denotes the index of agricultural industry resilience, which represents the dynamic capacity of the agricultural system to withstand, recover from, and adapt to external shocks. The indirect association is calculated as α1γ2, where α1 represents the estimated association between AGG and AR and γ2 represents the estimated association between AR and ACE after accounting for AGG. It is evaluated using a province-level cluster bootstrap with 1000 replications. Provinces are resampled with replacement, and all annual observations within each selected province are retained. A bias-corrected 95% confidence interval that excludes zero is interpreted as evidence consistent with an intermediary role for AR.
ARit = α0 + α1AGGit + α2Contit + μi + λt + ϵit
ACEit = γ0 + γ1AGGit + γ2ARit + γ3Contit + μi + λt + ϵit
3.3.3. Moderating-Effect Model
Model (10) is constructed to examine whether the association between AGG and AR varies with the level of DV.
where DVit denotes the level of digital village development. A positive and statistically significant η3 indicates that the association between AGG and AR becomes stronger as DV increases. To interpret this interaction, the conditional marginal association between AGG and AR is estimated at the mean of DV and at values one standard deviation below and above the mean. The corresponding 95% confidence intervals are calculated using the delta method and the province-clustered covariance matrix from Model (10).
ARit = η0 + η1AGGit + η2DVit + η3(AGGit × DVit) + η4Contit + μi + λt + ϵit
4. Empirical Results and Analysis
4.1. Descriptive Statistics
Table 4 reports the descriptive statistics for all variables. The dependent variable (ACE) exhibits substantial cross-provincial heterogeneity (mean = 0.113). The key independent variable (AGG) averages 0.446, ranging from 0.029 to 0.774, reflecting substantial differences in AGG across provinces. DV shows a relatively low mean (0.207) but considerable dispersion, underscoring the uneven geographic distribution of rural digitalization. Control variables generally display reasonable distributions without extreme outliers. The descriptive statistics indicate sufficient variation across provinces and years, providing empirical support for subsequent panel regression analysis.
Table 4.
Descriptive statistics for each variable.
Table 5 reports the pairwise correlation coefficients for the study variables. The unconditional correlation between AGG and ACE is negligible and statistically insignificant. AGG and AR exhibit a weak negative correlation, whereas AR is negatively correlated with ACE. These bivariate relationships do not account for observed covariates or unobserved provincial characteristics and therefore should not be interpreted as evidence of conditional or causal relationships. Several covariates exhibit relatively high pairwise correlations. However, the VIF diagnostics for the baseline specification yield a maximum value of 6.22 for Urban and a mean value of 4.02. All VIF values remain below the conventional threshold of 10, suggesting that severe multicollinearity is unlikely to be a dominant concern. Because bivariate correlations do not account for observed covariates, temporal dynamics, or unobserved time-invariant provincial characteristics, the subsequent analysis employs panel fixed-effects models.
Table 5.
Correlation Matrix.
4.2. Baseline Regression Results
Table 6 reports four specifications. Column (1) presents pooled ordinary least squares estimates. This specification stacks all province-year observations and estimates a common relationship without controlling for unobserved province or year effects. Columns (2) and (3) add year and province fixed effects separately, while Column (4) includes both sets of fixed effects and serves as the preferred specification. The coefficient on AGG is negative across all four specifications.
Table 6.
Baseline Regression Results.
4.3. Robustness and Endogeneity Checks
Table 7 presents five robustness tests. Column (1) winsorizes all continuous variables at the 1st and 99th percentiles. Column (2) replaces current AGG with its value from the preceding period. Column (3) excludes observations from 2020 through 2022. The estimate changes little, suggesting that the baseline result is not driven solely by disruptions associated with COVID-19. Column (4) adds a separate linear trend for each province to the model with province and year fixed effects. Column (5) uses an alternative AGG measure. Under this construction, VAI includes only processing and service agglomeration, with equal weights assigned to the two components before VAI is coupled with HAI. The coefficient is −0.276 and remains statistically significant at the 5% level. Overall, the estimates are stable across alternative data treatments, sample periods, model specifications, and AGG constructions.
Table 7.
Robustness test results.
A lead-based falsification test is further conducted to examine potential reverse temporal ordering. The model includes both current AGG and its one-period lead while retaining the baseline control variables, province fixed effects, and year fixed effects. If future AGG is significantly associated with current ACE after current AGG is taken into account, the estimated association may reflect reverse temporal ordering. By contrast, an insignificant coefficient on the lead term would be consistent with the temporal ordering specified in the empirical framework. Table 8 reports the results.
Table 8.
Endogeneity Check Using the One-Period Lead of AGG.
Table 8 shows that current AGG remains negatively associated with ACE at the 1% level, whereas its one-period lead is statistically insignificant, with a p-value of 0.355. This pattern is consistent with the temporal ordering specified in the empirical framework and complements the lagged AGG evidence reported in Table 7.
4.4. Mechanism Analysis
4.4.1. Mediating Effect
Table 9 reports the results from the two mediation equations. In Column (1), the coefficient on AGG is positive and statistically significant. This result indicates that an increase in AGG within a province is associated with higher AR after accounting for the baseline controls, province fixed effects, and year fixed effects. In Column (2), the coefficient on AR is negative and statistically significant. The coefficient on AGG also remains negative and statistically significant, but its absolute magnitude declines from 0.365 in the baseline model to 0.312 after AR is included. These coefficient patterns provide the component relationships used to estimate the indirect association reported in Table 10.
Table 9.
Mediation analysis results.
Table 10.
Province-Level Cluster Bootstrap Results for the Estimated Indirect Association through AR.
Table 10 reports the province-level cluster bootstrap results for the indirect association through AR. The estimated indirect association is −0.053, with a bias-corrected 95% confidence interval of [−0.173, −0.010]. Because this interval excludes zero, the result is consistent with AR serving as a partial intermediary pathway in the association between AGG and ACE. The direct association remains negative, indicating that AR accounts for part of the estimated association between AGG and ACE.
4.4.2. Moderating Effect
Table 11 reports the moderating effect of DV on the relationship between AGG and AR. In Column (3), the coefficient on the interaction between AGG and DV is 1.4923 and statistically significant at the 1% level. This estimate indicates that the conditional association between AGG and AR increases with DV.
Table 11.
Moderating Effect of DV on the Relationship between AGG and AR.
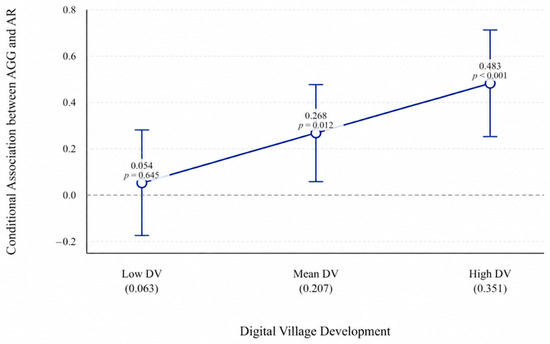
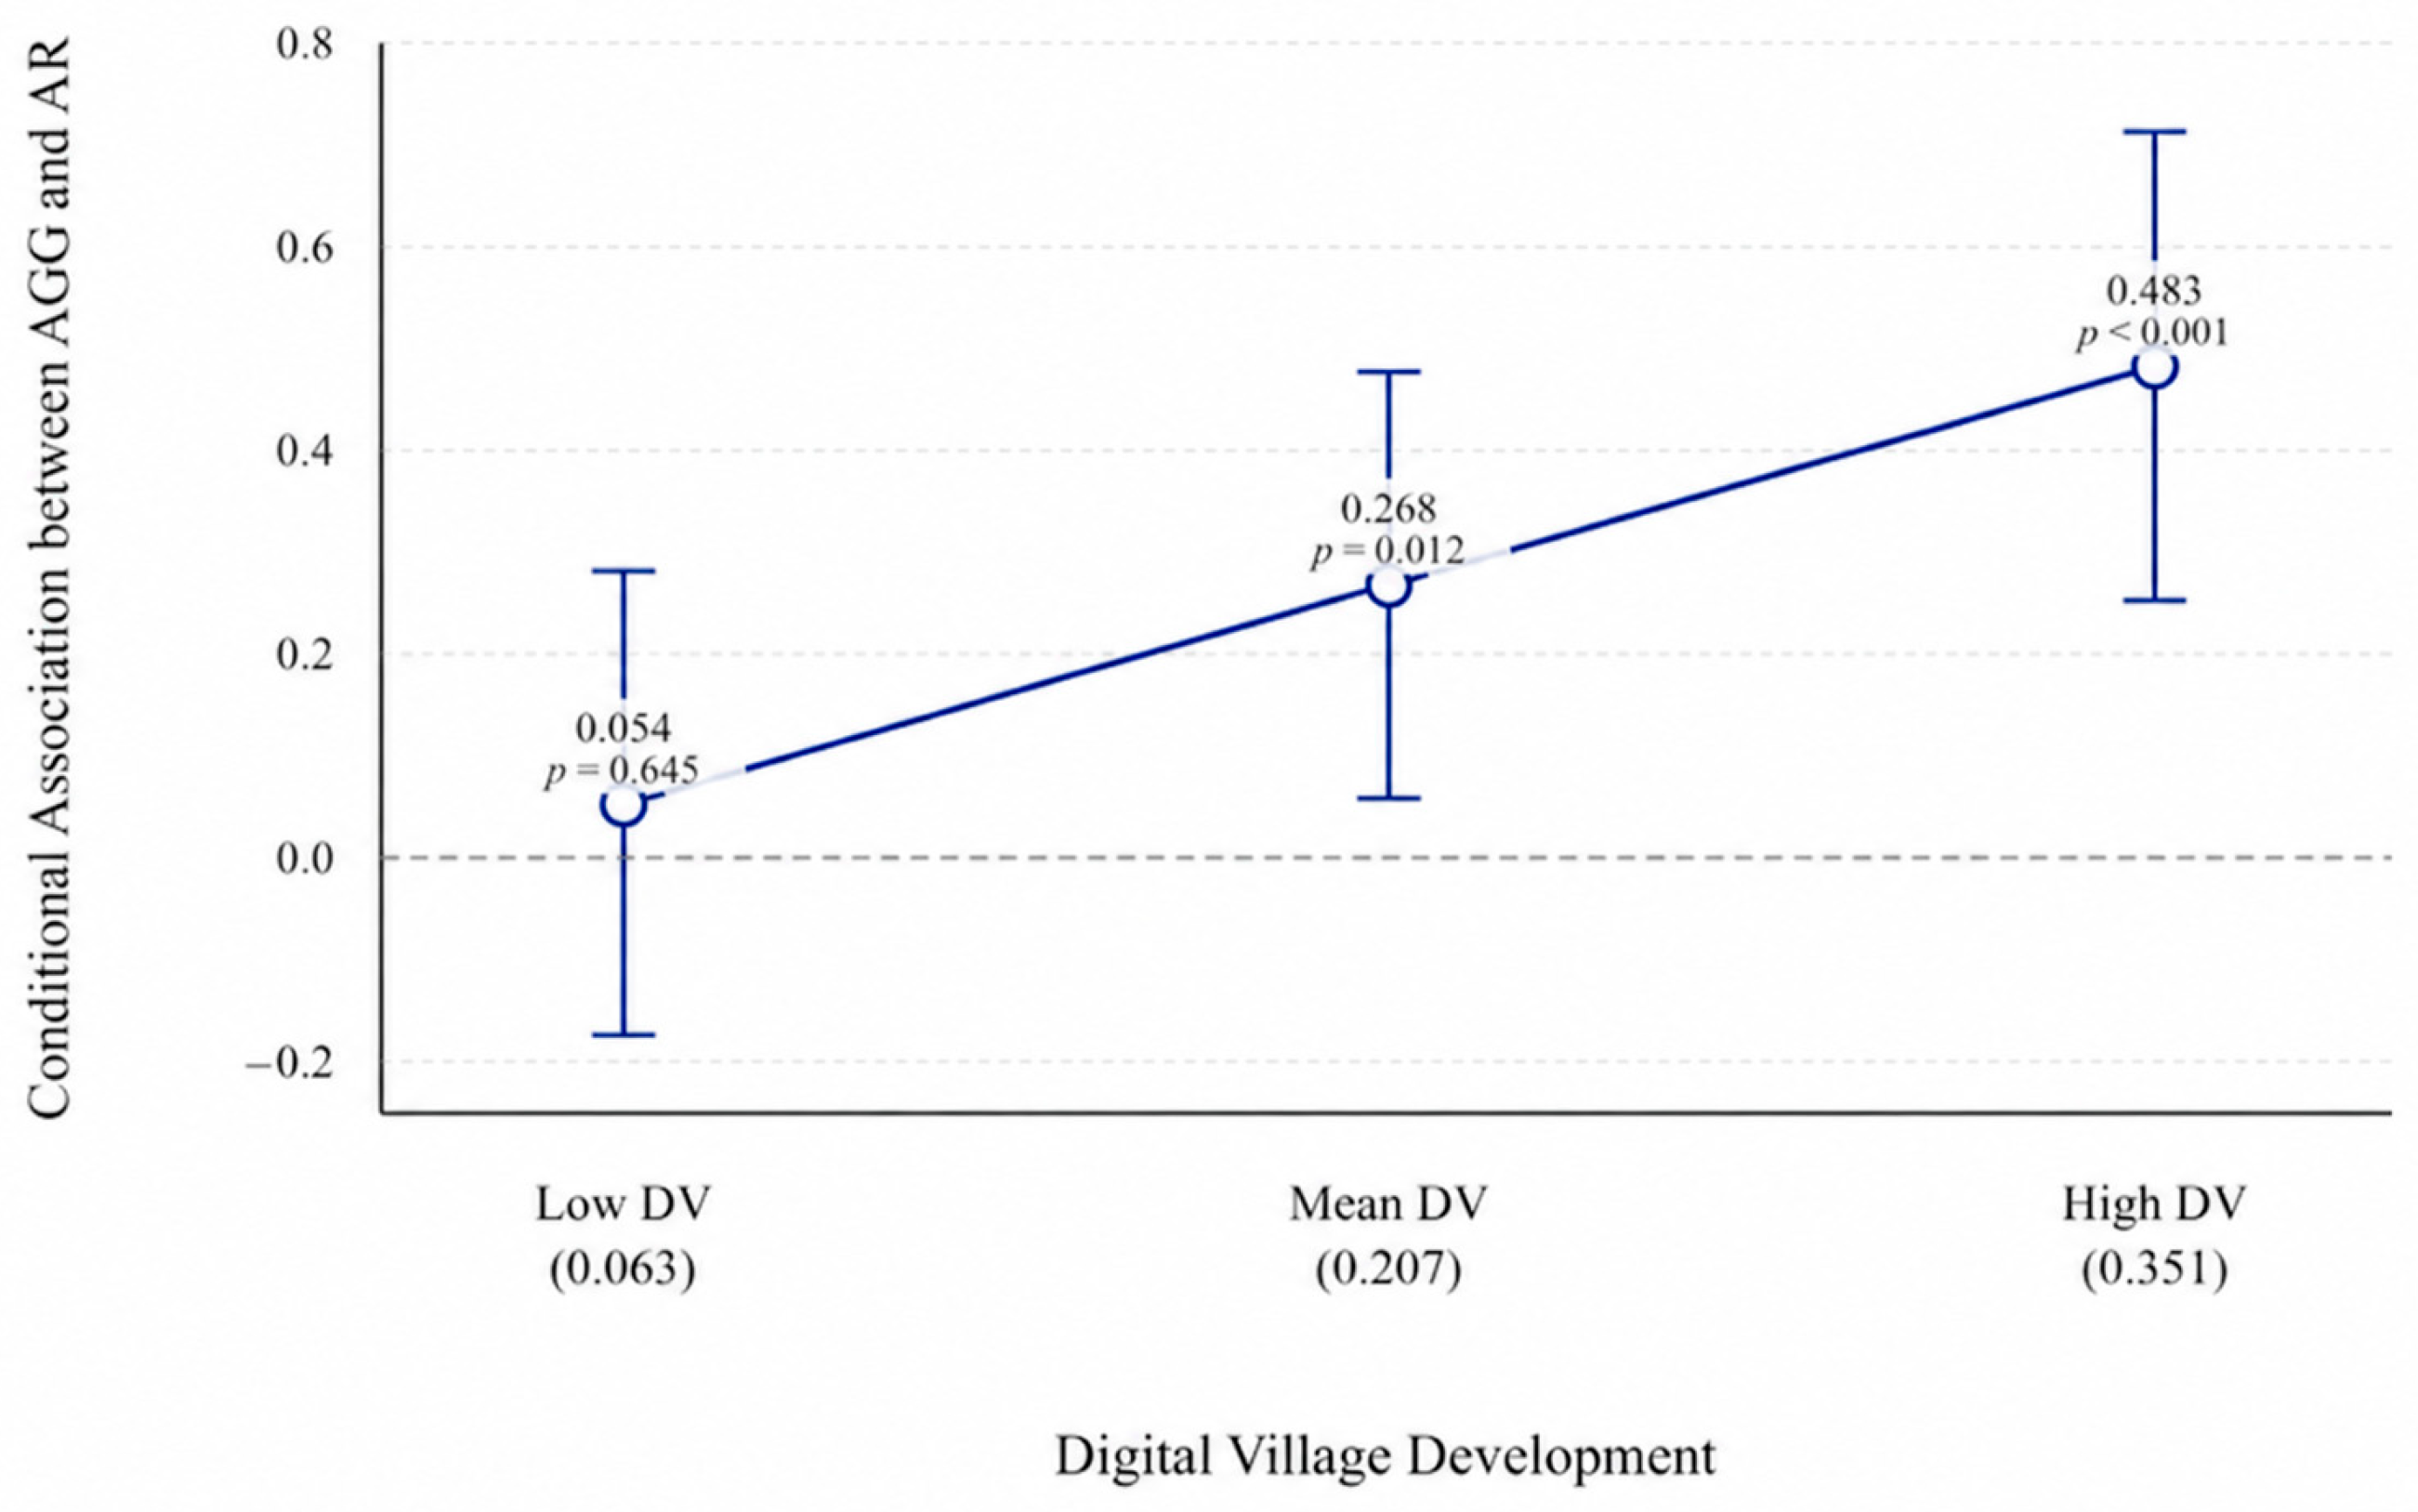
The simple slope estimates clarify the interaction. At one standard deviation below the mean of DV, the estimated association between AGG and AR is 0.054 and statistically insignificant, with a 95% confidence interval from −0.174 to 0.281 and p = 0.645. At the mean and one standard deviation above it, the estimates increase to 0.268 and 0.483, with corresponding 95% confidence intervals from 0.059 to 0.477 and from 0.252 to 0.713; p = 0.012 and p < 0.001, respectively. Figure 2 presents these estimates and confidence intervals. The stronger association at higher levels of DV is consistent with H3.
Figure 2.
Conditional Association between AGG and AR at Selected Levels of DV. Notes: Low, mean, and high DV correspond to values of 0.063, 0.207, and 0.351, respectively, representing one standard deviation below the sample mean, the sample mean, and one standard deviation above it. The 95% confidence intervals are calculated using the delta method and the covariance matrix clustered at the province level in Model (10).
4.5. Heterogeneity Analysis
Following Du [53], provinces are classified according to their grain production and consumption functions into major grain production areas, major grain consumption areas, and grain production and consumption balance areas. Columns (1) to (3) of Table 12 report the corresponding subsample estimates. The coefficient on AGG is negative and statistically significant in the producing and consuming areas, but negative and insignificant in the balance area, with a larger absolute point estimate in consuming areas. Formal coefficient equality tests show that only the difference between the major grain production areas and the balance areas is marginally significant at the 10% level. This difference becomes statistically insignificant when wild cluster bootstrap inference is applied, while the remaining pairwise comparisons and the joint test are also insignificant. Overall, the tests do not establish a stable pattern of heterogeneity across functional zones. The negative relationship between AGG and ACE is therefore not confined to a particular grain production and consumption category, although its magnitude should not be assumed to be identical across regions.
Table 12.
Heterogeneity Analysis across Grain Functional Zones.
Consistent with Ye et al. [54], unconditional quantile regression is employed to examine whether the association between AGG and ACE varies across the unconditional distribution of ACE. Columns (1) to (5) of Table 13 report the estimates at the 10th, 25th, 50th, 75th, and 90th percentiles, denoted by Q10, Q25, Q50, Q75, and Q90, respectively. The estimated AGG coefficients tend to be larger in absolute magnitude at the lower percentiles of ACE. However, the coefficient differences across the quantile pairs for which bootstrap inference is available are not statistically significant. The results therefore do not provide evidence of systematic heterogeneity in the effect of AGG across the ACE distribution. Comparisons involving Q90 should be interpreted cautiously because stable bootstrap standard errors could not be obtained.
Table 13.
Unconditional Quantile Regression Results across the ACE Distribution.
Table 14 summarizes the core empirical relationships and their links to the three hypotheses.
Table 14.
Summary of the Core Empirical Relationships.
5. Discussion and Policy Recommendations
5.1. Discussion
The baseline results show a significant negative association between AGG and ACE. This association remains stable across the alternative specifications, while the insignificant lead term is consistent with the temporal ordering specified in the empirical framework. Previous studies have reported different environmental effects of agricultural industrial agglomeration. Some studies find that agricultural industrial agglomeration improves agricultural green production efficiency [12], whereas others identify U-shaped or inverted U-shaped effects on agricultural green development or environmental efficiency [3,7]. Despite these different findings, the studies share a common measurement feature. They use location quotients to capture the regional specialization of agricultural production or the primary industry, thereby focusing mainly on spatial concentration within the production segment. This study extends that perspective by combining horizontal production concentration with vertical agglomeration across production, processing, and agricultural services and measuring AGG through their coupling coordination. The negative estimate therefore links lower ACE to stronger coordination across the horizontal and vertical agglomeration subsystems, extending the analytical focus beyond production concentration. From a systems perspective, AGG captures structural coordination within the agricultural industrial system. Shared infrastructure, resource circulation, and technological diffusion offer plausible system-level interpretations of this relationship.
The province-level cluster bootstrap results are consistent with an intermediary role for AR in the negative association between AGG and ACE. This finding accords with evidence that agricultural industrial agglomeration strengthens agricultural economic resilience through socialized services and improved production efficiency [14]. It is also consistent with farming systems research that defines resilience as the capacity to maintain essential functions and adapt under disturbances [16]. In the present analysis, higher AGG is associated with stronger AR, which is in turn associated with lower ACE. From a systems perspective, robustness may limit output losses during disturbances, recovery may shorten imbalances between resource use and output, and reorganization may facilitate adjustments that improve resource efficiency. Together, these capacities help interpret the estimated indirect association between AGG and ACE through AR from a systems perspective.
The interaction and simple slope results indicate that the positive association between AGG and AR is larger at higher levels of DV. At the low DV level, the estimated association is small and not statistically significant. At the mean and high DV levels, it is positive and statistically significant. This pattern is consistent with evidence that digital village development improves access to information and resource allocation [18] and that digital technologies strengthen linkages among agricultural production, processing, and services [5]. Digital infrastructure, information sharing, and platform connectivity can accelerate the transmission of production, market, and disaster information. These conditions may facilitate resource flows and coordinated adjustment among agricultural actors. From a systems perspective, DV can be interpreted as an enabling condition under which structural coordination is more strongly associated with adaptive capacity.
The AGG coefficients are negative in all three grain functional zones, although the estimate for the production and consumption balance areas is not statistically significant. Previous studies report regional differences in the nonlinear effects of agricultural industrial agglomeration [8], but the formal coefficient comparison tests and UQR results provide no stable evidence of heterogeneity. The negative association between AGG and ACE therefore does not appear to be confined to a particular type of region and shows a degree of generality within the study sample. However, insignificant differences across groups do not imply that the effect is identical in all regions. Differences in coefficient magnitude and estimation precision, together with the instability of the Q90 results, still require cautious interpretation. From a systems perspective, structural coordination may produce similar environmental benefits across different regional systems, although the strength of these benefits remains dependent on regional conditions.
Taken together, the findings describe an integrated pattern within provincial agricultural industrial systems. Higher AGG is associated with lower ACE partly through AR, and the positive association between AGG and AR is stronger at higher levels of DV. By linking system organization, adaptive capacity, digital conditions, and carbon performance, this framework extends agricultural agglomeration research beyond the environmental implications of production concentration.
5.2. Limitations and Future Research Directions
Several limitations define useful directions for further research. First, provincial data provide a consistent basis for nationwide comparisons, while finer-scale data could reveal variation within provinces. Second, ACE relates emissions from six specified agricultural production sources to the real gross output value of agriculture, forestry, animal husbandry, and fishery. This accounting boundary focuses the analysis on emissions associated with agricultural production inputs. Future research could incorporate rice cultivation, enteric fermentation, manure management, agricultural soils, and straw burning, and examine alternative output denominators [55,56,57]. Third, the fixed-effects specifications, lagged AGG model, and temporal falsification test support the stability and temporal ordering of the estimated association. Research designs drawing on external sources of variation could further strengthen causal identification. Finally, the findings reflect China’s agricultural and institutional context. Comparative studies could assess their applicability under different agricultural structures and institutional arrangements. The baseline framework treats each province as the analytical boundary of the agricultural industry system. This choice aligns the analysis with the available data and the provincial policy context, while leaving interprovincial spillovers for further examination. Spatial econometric models with alternative spatial weight matrices could assess whether the relationship between AGG and ACE extends across provincial boundaries and examine how such spillovers are transmitted. This extension would clarify the spatial scope of the estimated relationship.
Future research can build on the provincial DV index with farm or county data to examine how specific digital services relate to resource coordination, resilience, and carbon intensity [58,59]. It could also test whether these relationships vary by crop and climate. Research on highland barley illustrates why these conditions matter: adaptation measures expanded suitable growing areas on the Tibetan Plateau [60].
5.3. Policy Suggestions
Based on the empirical findings, three policy implications are proposed.
First, policies on agricultural industry agglomeration should focus on coordination among production, processing, and agricultural services. Shared logistics, machinery services, and common resource-use standards can reduce duplicated inputs and improve factor matching. The evaluation of agricultural industrial parks should consider the quality of cross-activity coordination alongside their physical scale. Local pilot evaluation is needed before these measures are replicated more broadly.
Second, resilience-oriented investment should focus on the capacities represented by AR, including maintaining production during disturbances, restoring resource flows, and reorganizing inefficient arrangements. Early-warning systems, resilient irrigation, and agricultural risk-management services are practical priorities. Their implementation should be evaluated through changes in recovery time, output stability, and input efficiency.
Third, digital village policies should improve the information and coordination conditions surrounding existing agglomerations. Priority should be given to interoperable data services, accessible market and disaster information, digital support for efficient agricultural input use, and practical digital training for farmers and service providers. Practice-oriented education has been shown to strengthen engagement with agricultural entrepreneurship, highlighting the value of applied learning in agricultural capacity building [61]. Capacity-building programs should be adapted to participants’ backgrounds and operational needs. These measures are particularly relevant where limited digital access constrains the conversion of agglomeration into resilience.
6. Conclusions
Using provincial panel data from China, this study examines the relationships among AGG, ACE, AR, and DV. Higher AGG is significantly associated with lower ACE. AGG is positively associated with AR, and AR is negatively associated with ACE. The bias-corrected bootstrap confidence interval for the indirect association excludes zero, which is consistent with a partial intermediary role for AR. The interaction and simple slope estimates indicate that the positive association between AGG and AR is larger at higher levels of DV. The negative association between AGG and ACE is broadly observed across grain functional zones and ACE quantiles, while formal comparison tests find no systematic differences across zones or quantiles. Taken together, these findings are consistent with the three proposed hypotheses. By combining a coordination measure of horizontal and vertical agglomeration with a unified systems framework and evidence across zones and quantiles, this study extends research on agricultural decarbonization from a systems perspective.
Author Contributions
Conceptualization, J.H. (Jinghui Hu) and J.H. (Jun He); methodology, J.H. (Jinghui Hu) and J.H. (Jun He); software, J.H. (Jinghui Hu); formal analysis, J.H. (Jinghui Hu); investigation, J.H. (Jinghui Hu); data curation, J.H. (Jinghui Hu); writing—original draft preparation, J.H. (Jinghui Hu); visualization, J.H. (Jinghui Hu); supervision, J.H. (Jinghui Hu); project administration, J.H. (Jinghui Hu); Validation, J.H. (Junzhong He); writing—review and editing, J.H. (Jinghui Hu), J.H. (Jun He) and J.H. (Junzhong He). All authors have read and agreed to the published version of the manuscript.
Funding
This research received no external funding.
Data Availability Statement
The data used in this study were compiled from the China Statistical Yearbook, the China Rural Statistical Yearbook, and provincial statistical yearbooks. The processed panel dataset and Stata code are available from the corresponding author upon reasonable request, subject to the terms of use of the original data sources.
Conflicts of Interest
The authors declare no conflicts of interest.
Appendix A. Measurement Frameworks for Agricultural Industry Resilience and Digital Village Development
Appendix A.1. Agricultural Industry Resilience
Table A1 presents the ten indicators used to measure agricultural industry resilience across robustness, recovery capacity, and reorganization capacity.
Table A1.
Measurement framework for Agricultural Industry Resilience.
Appendix A.2. Digital Village Development
Table A2 presents the ten indicators used to measure digital village development across digital infrastructure, industrial digitalization, and digital livelihoods.
Table A2.
Measurement framework for Digital Village Development.
References
- World Meteorological Organization. State of the Global Climate 2025; WMO-No. 1391; World Meteorological Organization: Geneva, Switzerland, 2026; ISBN 978-92-63-11391-7. [Google Scholar]
- FAO; IFAD; UNICEF; WFP; WHO. The State of Food Security and Nutrition in the World 2026: Understanding and Addressing the High Cost of a Healthy Diet; FAO: Rome, Italy, 2026; ISBN 978-92-5-140461-4. [Google Scholar]
- Xu, P.; Jin, Z.; Tang, H. Influence Paths and Spillover Effects of Agricultural Agglomeration on Agricultural Green Development. Sustainability 2022, 14, 6185. [Google Scholar] [CrossRef] [Scilit]
- Feng, S.; Long, Y.; Yasmeen, R.; Yang, H. The Spatial Spillover Impact of Digital Finance on Agricultural Carbon Emission Intensity: Evidence from China. Sustainability 2025, 17, 8583. [Google Scholar] [CrossRef] [Scilit]
- Zhang, J.; Zhang, W. Harnessing Digital Technologies for Rural Industrial Integration: A Pathway to Sustainable Growth. Systems 2024, 12, 564. [Google Scholar] [CrossRef] [Scilit]
- Lu, H.; Chen, Y.; Luo, J. Development of Green and Low-Carbon Agriculture through Grain Production Agglomeration and Agricultural Environmental Efficiency Improvement in China. J. Clean. Prod. 2024, 442, 141128. [Google Scholar] [CrossRef] [Scilit]
- Ye, R.; Qi, Y.; Zhu, W. Impact of Agricultural Industrial Agglomeration on Agricultural Environmental Efficiency in China: A Spatial Econometric Analysis. Sustainability 2023, 15, 10799. [Google Scholar] [CrossRef] [Scilit]
- Yi, A.; Ji, Z.; Zhou, T.; Qiu, T.; Yin, R.; Li, C. The Impact of Agricultural Industrial Agglomeration on Agricultural Carbon Emissions: Evidence from China. Pol. J. Environ. Stud. 2025, 34, 6449–6464. [Google Scholar] [CrossRef] [Scilit] [PubMed]
- Wang, L.; Ma, J.; Gao, Y. Nonlinear Effect of Agricultural Industry Agglomeration on Carbon Emissions and Energy Consumption: Evidence from China. Sustainability 2026, 18, 6228. [Google Scholar] [CrossRef] [Scilit]
- Zhang, R.; Su, T. Research on the Spatial Impact and Mediating Effects of Agricultural Industry Agglomeration on Agricultural Carbon Emission Intensity. Ecol. Econ. 2025, 41, 112–118. (In Chinese) [Google Scholar]
- Zhang, Y.; Liu, Y. The Impact of Rural Industrial Integration on Agricultural Carbon Emissions Evidence from China Provinces Data. Sustainability 2024, 16, 680. [Google Scholar] [CrossRef] [Scilit]
- Wang, Z.; Zhang, X.; Lu, H.; Kang, X.; Liu, B. The Effect of Industrial Agglomeration on Agricultural Green Production Efficiency: Evidence from China. Sustainability 2023, 15, 12215. [Google Scholar] [CrossRef] [Scilit]
- Kalathil, N.; Lanahan, L.; Feldman, M.; Fuchs, E.R.H. Varieties of Agglomeration: Disentangling Horizontal and Vertical Agglomeration within the Manufacturing Sector in the United States. Res. Policy 2025, 54, 105272. [Google Scholar] [CrossRef] [Scilit]
- Yao, R.; Ma, Z.; Wu, H.; Xie, Y. Mechanism and Measurement of the Effects of Industrial Agglomeration on Agricultural Economic Resilience. Agriculture 2024, 14, 337. [Google Scholar] [CrossRef] [Scilit]
- Li, Y.; Yan, F. The Effect of Agricultural Industry Agglomeration on Agricultural Economic Resilience: A Case Study of 77 Cities in the Middle and Lower Reaches of the Yangtze River. J. Agrotech. Econ. 2025, 4, 38–53. (In Chinese) [Google Scholar] [CrossRef]
- Meuwissen, M.P.M.; Feindt, P.H.; Spiegel, A.; Termeer, C.J.A.M.; Mathijs, E.; de Mey, Y.; Finger, R.; Balmann, A.; Wauters, E.; Urquhart, J.; et al. A Framework to Assess the Resilience of Farming Systems. Agric. Syst. 2019, 176, 102656. [Google Scholar] [CrossRef] [Scilit]
- Li, J.; Zhang, C.; Huang, Q.; Ding, M.; He, Y.; Liu, M.; Yang, C. Water Infrastructure Impacts of Agricultural Industry in China Under Extreme Weather: A System Dynamics Model of a Multi-Level, Climate Resilience Perspective. Systems 2024, 12, 562. [Google Scholar] [CrossRef] [Scilit]
- Zhao, X.; Zhao, R. The Impact and Mechanism of Digital Villages on Agricultural Resilience in Ecologically Fragile Ethnic Areas: Evidence from China’s Provinces. Agriculture 2024, 14, 221. [Google Scholar] [CrossRef] [Scilit]
- Zhao, L.; Chen, H.; Ding, X.; Chen, Y. Does Digital Village Construction Empower the Green Allocation of Agricultural Water Resources? Systems 2024, 12, 214. [Google Scholar] [CrossRef] [Scilit]
- Li, E.; Coates, K.; Li, X.; Ye, X.; Leipnik, M. Analyzing Agricultural Agglomeration in China. Sustainability 2017, 9, 313. [Google Scholar] [CrossRef] [Scilit]
- Richards, P. It’s Not Just Where You Farm; It’s Whether Your Neighbor Does Too. How Agglomeration Economies Are Shaping New Agricultural Landscapes. J. Econ. Geogr. 2018, 18, 87–110. [Google Scholar] [CrossRef] [Scilit]
- Boboyev, S.; Ibragimov, L.; Sergeyeva, A.; Danshin, A.; Nazarov, M.; Abduvaliev, K.; Fozilov, K.; Do’sbekov, S. The Spatial Concentration of Emerging Forms of Agro-Industrial Integration (Clusters) in the Samarkand Region, Uzbekistan. Geographies 2026, 6, 87. [Google Scholar] [CrossRef] [Scilit]
- Wang, S. Research on the Impact and Mechanisms of Agricultural Industry Agglomeration on Agricultural Industry Resilience. Ph.D. Thesis, Shenyang Agricultural University, Shenyang, China, 2025. (In Chinese) [Google Scholar]
- Li, B.; Zhang, J.; Li, H. Research on Spatial-Temporal Characteristics and Affecting Factors Decomposition of Agricultural Carbon Emission in China. China Popul. Resour. Environ. 2011, 21, 80–86. (In Chinese) [Google Scholar]
- Marshall, A. Principles of Economics, 1st ed.; Macmillan and Co.: London, UK, 1890. [Google Scholar]
- Ellison, G.; Glaeser, E.L.; Kerr, W.R. What Causes Industry Agglomeration? Evidence from Coagglomeration Patterns. Am. Econ. Rev. 2010, 100, 1195–1213. [Google Scholar] [CrossRef] [Scilit]
- Krugman, P. Increasing Returns and Economic Geography. J. Political Econ. 1991, 99, 483–499. [Google Scholar] [CrossRef] [Scilit] [PubMed]
- Fujita, M.; Thisse, J.-F. Economics of Agglomeration. J. Jpn. Int. Econ. 1996, 10, 339–378. [Google Scholar] [CrossRef] [Scilit]
- Hailu, G.; Deaton, B.J. Agglomeration Effects in Ontario’s Dairy Farming. Am. J. Agric. Econ. 2016, 98, 1055–1073. [Google Scholar] [CrossRef] [Scilit]
- Holling, C.S. Resilience and Stability of Ecological Systems. Annu. Rev. Ecol. Syst. 1973, 4, 1–23. [Google Scholar] [CrossRef] [Scilit]
- Martin, R.; Sunley, P. On the Notion of Regional Economic Resilience: Conceptualization and Explanation. J. Econ. Geogr. 2015, 15, 1–42. [Google Scholar] [CrossRef] [Scilit]
- Boschma, R. Towards an Evolutionary Perspective on Regional Resilience. Reg. Stud. 2015, 49, 733–751. [Google Scholar] [CrossRef] [Scilit]
- Folke, C.; Biggs, R.; Norström, A.V.; Reyers, B.; Rockström, J. Social-Ecological Resilience and Biosphere-Based Sustainability Science. Ecol. Soc. 2016, 21, 41. [Google Scholar] [CrossRef] [Scilit]
- Darnhofer, I. Resilience and Why It Matters for Farm Management. Eur. Rev. Agric. Econ. 2014, 41, 461–484. [Google Scholar] [CrossRef] [Scilit]
- Zhou, J.; Chen, H.; Bai, Q.; Liu, L.; Li, G.; Shen, Q. Can the Integration of Rural Industries Help Strengthen China’s Agricultural Economic Resilience? Agriculture 2023, 13, 1813. [Google Scholar] [CrossRef] [Scilit]
- Cui, K.; Feng, X. Research on the Indicator System Design for Rural Digital Economy from the Perspective of Digital Village Construction. Res. Agric. Mod. 2020, 41, 899–909. (In Chinese) [Google Scholar] [CrossRef]
- Klerkx, L.; Jakku, E.; Labarthe, P. A Review of Social Science on Digital Agriculture, Smart Farming and Agriculture 4.0: New Contributions and a Future Research Agenda. NJAS Wagening. J. Life Sci. 2019, 90–91, 100315. [Google Scholar] [CrossRef] [Scilit]
- Jiang, H.; Chen, C.; Yuan, Y. How Digital Orientation Promotes Technology Standard Innovation: The Serial Mediating Role of Organizational Unlearning and Knowledge Re-Orchestration. Systems 2026, 14, 1032. [Google Scholar] [CrossRef] [Scilit]
- Li, X.; Zhang, M. Digital–Real Fusion and Global Value Chain Upgrading in Manufacturing Firms: From a Socio-Technical Systems Perspective. Systems 2026, 14, 977. [Google Scholar] [CrossRef] [Scilit]
- Wang, Y.; Guo, L. Digital Rural Construction, Relative Poverty Alleviation, and Common Prosperity for Farmers and Rural Areas. Inq. Into Econ. Issues 2024, 45, 37–50. (In Chinese) [Google Scholar]
- Yang, H.; Ma, W. The Impact Mechanism and Spatial Spillover Effect of Digital Economy on the Resilience of Agricultural Industry Chain. Price Theory Pract. 2025, 5, 210–215. (In Chinese) [Google Scholar] [CrossRef]
- Zeng, X.; Zhang, X.; Li, Z.; Yang, Y.; Yang, W. Spatial Effect of Digital Inclusive Finance on the Resilience of Agricultural Industry Chain. Econ. Geogr. 2025, 45, 183–191. (In Chinese) [Google Scholar] [CrossRef]
- Li, Y.; He, X. Can the Digital Transformation of Agriculture Enhance the Resilience of China’s Agricultural Industry Chain and Supply Chain? An Analysis Based on Multiple Intermediary Effects and Moderating Effects. Southwest Finance 2025, 90–104. (In Chinese) [Google Scholar]
- Yin, Y.; He, K.; Chen, Z.; Li, Y.; Ren, F.; Wang, Z.; Wang, Y.; Gong, H.; Zhu, Q.; Shen, J.; et al. Agricultural Green Development to Achieve Food Security and Carbon Reduction in the Context of China’s Dual Carbon Goals. Front. Agr. Sci. Eng. 2023, 10, 262–267. [Google Scholar] [CrossRef] [Scilit]
- Chen, Z.; Tang, C.; Liu, B.; Liu, P.; Zhang, X. Can Socialized Services Reduce Agricultural Carbon Emissions in the Context of Appropriate Scale Land Management? Front. Environ. Sci. 2022, 10, 1039760. [Google Scholar] [CrossRef] [Scilit]
- Li, J.; Li, S.; Liu, Q.; Ding, J. Agricultural Carbon Emission Efficiency Evaluation and Influencing Factors in Zhejiang Province, China. Front. Environ. Sci. 2022, 10, 1005251. [Google Scholar] [CrossRef] [Scilit]
- West, T.O.; Marland, G. A Synthesis of Carbon Sequestration, Carbon Emissions, and Net Carbon Flux in Agriculture: Comparing Tillage Practices in the United States. Agric. Ecosyst. Environ. 2002, 91, 217–232. [Google Scholar] [CrossRef] [Scilit]
- Dubey, A.; Lal, R. Carbon Footprint and Sustainability of Agricultural Production Systems in Punjab, India, and Ohio, USA. J. Crop Improv. 2009, 23, 332–350. [Google Scholar] [CrossRef] [Scilit]
- Mi, K.; Zhuang, R. Producer Services Agglomeration and Carbon Emission Reduction—An Empirical Test Based on Panel Data from China. Sustainability 2022, 14, 3618. [Google Scholar] [CrossRef] [Scilit]
- Luo, L.; Nie, Q.; Jiang, Y.; Luo, F.; Wei, J.; Cui, Y. Spatiotemporal Dynamics and Spatial Spillover Effects of Resilience in China’s Agricultural Economy. Agriculture 2024, 14, 1522. [Google Scholar] [CrossRef] [Scilit]
- Lei, Z.; Qi, C.; Wang, L. Can the Construction of Digital Village Drive High-Quality Growth in Agricultural Economy? J. Huazhong Agric. Univ. (Soc. Sci. Ed.) 2023, 54–66. (In Chinese) [Google Scholar] [CrossRef]
- Jiang, T. Mediating Effects and Moderating Effects in Causal Inference. China Ind. Econ. 2022, 100–120. (In Chinese) [Google Scholar] [CrossRef]
- Du, X. Household Income and Income Distribution of Rural Residents in China: An Additional Analysis of Income Differentials of Rural Households in Various Functional Areas for Grain Production in China. Chin. Rural Econ. 2021, 84–99. (In Chinese) [Google Scholar] [CrossRef]
- Ye, F.; Qin, S.; Nisar, N.; Zhang, Q.; Tong, T.; Wang, L. Does Rural Industrial Integration Improve Agricultural Productivity? Implications for Sustainable Food Production. Front. Sustain. Food Syst. 2023, 7, 1191024. [Google Scholar] [CrossRef] [Scilit]
- Huang, S.; Qin, M. Impact of Green Finance on Agricultural Carbon Emissions: From the Perspective of Industrial Agglomera-tion and Technology Spillover. Econ. Rev. J. 2026, 118–128. (In Chinese) [Google Scholar] [CrossRef]
- Tian, Y.; Yin, M. Re-evaluation of China’s agricultural carbon emissions: Basic status, dynamic evolution and spatial spillover effects. Chin. Rural Econ. 2022, 3, 104–127. (In Chinese) [Google Scholar]
- Ministry of Ecology and Environment of the People’s Republic of China. Provincial Greenhouse Gas Inventory Compilation Guidelines (2025 Edition); Ministry of Ecology and Environment of the People’s Republic of China: Beijing, China, 2026. Available online: https://www.mee.gov.cn/xxgk2018/xxgk/xxgk05/202601/t20260104_1139798.html (accessed on 26 September 2026). (In Chinese)
- Yu, Y.; Zhang, R. Can Digital Village Construction Promote Sustainable Agricultural Development in China? PLoS ONE 2025, 20, e0329206. [Google Scholar] [CrossRef] [Scilit] [PubMed]
- Guo, H.; Wang, X.; Xia, H.; Jiang, W. Digital Villages and Agricultural Green Total Factor Productivity: A Supply-Side and Demand-Side Mechanism Analysis. Front. Sustain. Food Syst. 2026, 10, 1831978. [Google Scholar] [CrossRef] [Scilit]
- Liu, Y.; Zhang, E.; Pan, T.; Chen, J.; Gao, Y.; Peñuelas, J. Anthropogenic Adaptation Measures Expand Suitable Area for Highland Barley in Tibetan Plateau. Sci. Bull. 2025, 70, 1504–1512. [Google Scholar] [CrossRef] [Scilit] [PubMed]
- Hou, W.; Song, H.; Yang, Q.; Luo, L.; Ding, J.; Cao, Y.; Hu, R.; Li, G.; Ma, H. Promoting Agricultural Entrepreneurship through Practical Education in Chinese Universities. PLoS ONE 2026, 21, e0340670. [Google Scholar] [CrossRef] [Scilit] [PubMed]

Disclaimer/Publisher’s Note: The statements, opinions and data contained in all publications are solely those of the individual author(s) and contributor(s) and not of MDPI and/or the editor(s). MDPI and/or the editor(s) disclaim responsibility for any injury to people or property resulting from any ideas, methods, instructions or products referred to in the content. |
© 2026 by the authors. Licensee MDPI, Basel, Switzerland. This article is an open access article distributed under the terms and conditions of the Creative Commons Attribution (CC BY) license.