


Highlights
Please indicate how your work links to systems science via your contributions to systems practice, theory, and/or methodology.
- The NRBO–P-Median framework matches exhaustive enumeration accuracy at a computational cost over two orders of magnitude lower.
- Optimizing ten shelter sites increased 500 m population coverage by 27% while keeping over 80% of sites outside collapse risk zones.
What are the main findings and/or the implications of the main findings?
- Coordinated, cross-subsystem optimization effectively balances the competing demands of coverage, safety, and evacuation accessibility in dense urban cores.
- The scalable framework offers planners a transferable decision-support tool to embed disaster resilience into urban green infrastructure governance.
Abstract
High-density cities are complex, tightly coupled systems in which ecological infrastructure, disaster-resilience capacity, and transportation networks interact and constrain one another under intensifying climate-driven hazards and urbanization pressure. Urban green spaces sit at the intersection of these subsystems, offering dual ecological and emergency-shelter value, yet their siting is rarely optimized as a system-level problem: coverage, structural safety, and evacuation accessibility are typically treated in isolation, and classical heuristic solvers struggle to reconcile these interdependent, competing objectives at city scale. This study reframes green-space shelter siting as a socio-technical urban system problem and develops a multi-criteria geospatial decision-support framework that couples a Newton–Raphson-based Optimizer (NRBO) with a P-Median (minimum-weighted-distance) formulation, integrating nine quantitative indicators across the three interacting subsystems above into a single decision-theoretic model. Benchmarked against exhaustive enumeration, the framework reproduces identical system-optimal solutions at a computational cost more than two orders of magnitude lower, demonstrating that intelligent optimization can scale system-level decision-making to city-wide planning problems. By applying this framework to the historic core of Nanjing, this study demonstrates how coordinated, cross-subsystem optimization—rather than single-objective design—can resolve conflicting spatial constraints and yield highly resilient urban outcomes. The empirical findings validate the framework’s capacity to significantly enhance coverage, safety, and accessibility simultaneously. The proposed NRBO–P-Median framework is data-driven, computationally scalable, and structurally transferable to other dense urban systems, offering planners and policymakers a generalizable decision-support tool for embedding disaster-resilience functions into intelligent urban green-infrastructure governance.
1. Introduction
Quantitative assessment of urban exposure to natural and anthropogenic hazards has become a central concern of environmental modeling [1,2,3]. Cities now concentrate populations, capital, and risk within increasingly constrained spatial envelopes, and the frequency of extreme weather events and public-safety incidents continues to rise [4,5,6]. The combined pressures of climate variability, rapid urbanization, and demographic concentration mean that even short-duration events can generate cascading impacts on housing, mobility, and emergency services [7,8]. In high-density built environments, vulnerability is further shaped by population concentration, limited open space, narrow road networks, and aging infrastructure [9]. Urban green spaces occupy a distinctive position in this setting. Under normal conditions they provide ecosystem services such as microclimate regulation, stormwater attenuation, and recreational amenity, and when appropriately configured they can also serve as environmental infrastructure for emergency sheltering and evacuation [10,11,12,13]. This dual functionality is particularly valuable in compact cities, where land for purpose-built shelters is scarce and where green spaces are often among the few land uses with the openness, accessibility, and capacity required for rapid assembly. Their spatial optimization can therefore be understood as an environmental decision problem that requires balancing three objectives—reducing population exposure, maintaining evacuation accessibility, and ensuring service equity—under the limited land and structural conditions of dense urban settings [14,15]. To ensure conceptual consistency with standardized protective structure definitions, this study adopts the term ‘emergency green-space shelters’ to denote multi-functional urban open spaces (e.g., parks, plazas, and recreational grounds) that are structurally and geographically capable of serving as immediate safe assembly zones during disaster events.
The siting of emergency facilities belongs to a well-established family of operations-research problems. Classical formulations include the P-Center problem, which minimizes the maximum distance between demand points and facilities [16]; the P-Median problem, which minimizes total weighted travel distance [17,18,19]; the Set Covering model, which seeks to cover all demand points with the fewest facilities [20,21]; and the Maximum Covering model, which maximizes coverage under resource constraints [22,23]. Although these formulations differ in their objective functions, they share a common analytical structure in which demand, supply, and accessibility are represented through weighted distances on a spatial network. Of these, the P-Median formulation is particularly well suited to emergency-shelter planning, since minimizing weighted evacuation distance offers a direct way to reduce aggregate exposure across the population [24,25]. Building on this foundation, later studies have extended the model to accommodate multiple objectives and to incorporate hazard probability, vulnerability, and socio-environmental factors into the siting process [26,27,28,29,30]. In parallel, multi-criteria decision-making (MCDM) techniques such as AHP [31,32,33], TOPSIS [34], and VIKOR [35] have come to function as a suitability-screening layer that feeds spatial indicators into the optimization step [36], with Geographic Information Systems supporting the underlying data integration and risk assessment [37,38,39,40,41]. The indicators used in these methods have also broadened over time, moving beyond evacuation distance and population coverage to include land use, ecological function, social equity, and resilience [42,43,44]. Richer indicator sets have made siting models more realistic, but they have also increased the cost of solving them, particularly in studies with large sets of candidate locations and indicators.
In response to this growing computational burden, heuristic and learning-based solvers have come into wider use for high-dimensional siting problems. To address this computational burden, various heuristic and learning-based algorithms have been introduced, though each presents distinct operational trade-offs when applied to high-density urban systems. For instance, while Particle Swarm Optimization [45] and Ant Colony Optimization [46] offer flexibility in handling non-convex multi-objective functions, their population-based search mechanisms frequently exhibit premature convergence and acute sensitivity to initial parameter settings when scaling up to massive combinatorial grid spaces. Similarly, recent advancements integrating graph attention networks with deep reinforcement learning [47,48] yield powerful data-driven allocation policies; however, these ‘black-box’ neural architectures often lack the deterministic interpretability required by statutory urban planning protocols. In contrast, the Newton–Raphson-based Optimizer (NRBO) effectively bridges this methodological gap. More recent contributions have moved further in a data-driven direction, exploring AI-enhanced optimization [49] and combinations of graph attention networks with deep reinforcement learning that learn siting policies directly from spatial data [50,51,52,53]. These methods, however, exhibit two recurring limitations, particularly in applications to dense urban cores. First, convergence can become slow and unstable when the combinatorial search space is very large, in part because population-based heuristics are sensitive to parameter settings and to the initial distribution of candidate solutions [54,55]. Second, learning-based approaches sometimes lack the interpretability that formal planning contexts require, since their recommendations are difficult to trace back to specific indicators or constraints [56,57]. The Newton–Raphson-based Optimizer (NRBO), recently proposed by Sowmya et al. [58], offers a potential response to both. By pairing a Newton–Raphson search rule with a trap-avoidance operator, the algorithm achieves more rapid and stable convergence than conventional metaheuristics, while retaining a transparent mathematical structure grounded in classical numerical analysis. This combination of efficiency and analytical transparency is well suited to siting problems where planners need to justify each recommended location against explicit criteria. Although NRBO has been applied to engineering problems such as path planning [59,60] and energy-storage placement in distribution networks [61], it has not, to the authors’ knowledge, been embedded within classical location-allocation formulations such as the P-Median model, nor used for emergency shelter siting in urban environments.
Two further gaps shape the present study. The first concerns where shelter-siting models have been applied. Although green spaces have received growing attention as sheltering infrastructure [62,63,64,65], most applications focus on newly developed or low-density districts, while dense historic cores remain comparatively under-represented in the modeling literature [66,67]. These older urban areas combine land scarcity, population concentration, and structural-hazard exposure, making them a particularly demanding context for shelter-siting models. The second concerns how indicators represent the physics of evacuation. Existing systems generally capture distance and capacity but offer limited representation of what happens within the road network during an emergency, including the throughput constraints imposed by narrow streets [68], the threat of debris from collapsing high-rise buildings [69], and the counterflow generated by rescue traffic and inbound movement [70]. Taken together, these gaps point to the need for a framework that represents the physical conditions of evacuation more fully and is evaluated in the dense urban environments where those conditions are most acute.
While the P-Median formulation and foundational spatial indicators constitute well-established paradigms in classical shelter-siting research, the core innovation of this study does not lie in redefining basic indicator categories, but rather in advanced methodological integration and algorithm coupling. Specifically, the contributions of this framework are twofold: (1) Algorithmic Coupling Innovation: By embedding the Newton–Raphson-based Optimizer (NRBO) into the discrete P-Median problem, the framework resolves the computational bottlenecks of high-dimensional urban combinatorial optimization, demonstrating superior convergence and statistical stability over conventional metaheuristics (e.g., GA and PSO). (2) Evacuation Physics Innovation: The study constructs a novel Road Emergency Evacuation Index based on Kirchhoff’s circuit laws. This approach transcends conventional geometric distance metrics by mathematically capturing the dynamic throughput constraints, network redundancy, and non-linear bottlenecks inherent to densely built historic districts.
Building on this background, the present study develops an integrated optimization framework for siting emergency green-space shelters in dense urban cores. The framework embeds the Newton–Raphson-based Optimizer within a P-Median formulation and integrates nine indicators spanning facility coverage, facility safety, and transportation accessibility. To represent the physical mechanisms of evacuation within this indicator system, a Road Emergency Evacuation Index is introduced that draws an analogy between pedestrian flow on the street network and electrical current in a circuit, treating road intersections as nodes and road segments as resistors, and applying Kirchhoff’s laws to derive route-level resistance coefficients. The framework is evaluated in the historic core of Nanjing (~45 km2), and the paper closes with planning recommendations for integrating disaster-resilience functions into urban green-infrastructure policy. The remainder of the paper is organized as follows. Section 2 describes the study area, the data sources, and the modeling methodology. Section 3 presents the optimization results for two- and ten-location scenarios. Section 4 discusses the implications of the results for urban planning and notes the framework’s limitations. Section 5 concludes the paper.
2. Materials and Methods
2.1. Study Area and Data Sources
2.1.1. Study Area
Nanjing is located in the southwestern part of Jiangsu Province, in the downstream area of the Yangtze River, adjacent to the river and close to the sea. Its geographical coordinates range from 31°14′ N to 32°37′ N and from 118°22′ E to 119°14′ E. As one of the central cities in the East China region, Nanjing is renowned as a national historical and cultural city and a national ecological garden city. The topography of Nanjing is diverse, encompassing mountains, hills, and plains. The city is characterized by numerous rivers and lakes, with a well-developed and intricate water network, providing abundant water resources. In 2022, Nanjing’s permanent resident population reached 9.49 million, with an urbanization rate of 87.01%, making it one of the megacities in the Yangtze River Delta urban agglomeration. This study selects the old urban area of Nanjing as the research area (Figure 1). According to the “Regulations on Further Strengthening the Management of Old City Appearance and Strictly Controlling the Height of Buildings in the Old City,” the old urban area of Nanjing refers to the area within the Ming Dynasty city walls, bounded by the moat (lake), and includes Gulou District, Qinhuai District, and Xuanwu District, with a total area of approximately 45 km2.
Figure 1.
Study site. (a) Position of Nanjing within Jiangsu Province. (b) The old urban core of Nanjing.
In recent years, Nanjing has witnessed an accelerated urbanization process, rapid construction development, and a yearly increase in its permanent resident population. However, this progress has been accompanied by a rise in the frequency of natural disasters and emergencies, posing severe threats to the lives and property of the city’s residents. Up to now, Nanjing has established 324 emergency shelters with a total area of 30.98 km2, yet these facilities still fall short of fully meeting the city residents’ demand for shelter space. Against this backdrop, green spaces in the city have increasingly drawn attention as vital components of emergency shelters. At present, the green spaces in the old urban area of Nanjing are mainly distributed along the old city boundary, namely the Ming City Wall Scenic Belt. The distribution of green spaces in other areas is relatively sparse, especially in the commercial center of Xinjiekou, where there is a lack of green spaces. This uneven distribution makes it difficult for the existing green spaces to adequately cope with sudden disasters. Characterized by high population density, a concentration of historic districts, and unevenly distributed public green space, the area faces acute sheltering pressure during sudden-onset events and thus represents a paradigmatic case for emergency siting optimization [71,72,73].
2.1.2. Data Sources
The population data used in this study is obtained from the 2019 China Population Spatial Distribution Dataset published by the Resource and Environmental Science and Data Center of the Chinese Academy of Sciences, which is a raster dataset with a resolution of 100 m. The green space data is derived from the 2020 Nanjing City Park Directory published by the Nanjing Greening and Gardening Bureau, which includes information on names, locations, and areas. To ensure precise spatial accuracy in structural safety assessments, building heights and locations were extracted using high-precision building footprint vector data, replacing the previous coarse raster datasets. This vector format enables exact spatial joins and distance calculations within the 100 m analytical buffers. The road network data, administrative division data, and vector data of the old urban area of Nanjing are sourced from the Yangtze River Delta Sub-center of the National Earth System Science Data Center. The geographic coordinate system for all data is unified to the WGS-84 coordinate system, with the projection coordinate set to WGS 1984/UTM zone 51N (Table 1).
Table 1.
Data sources.
2.2. Research Methodology
To strengthen urban resilience against emergencies and natural disasters, this study develops an emergency shelter site selection model for green spaces, leveraging the Newton–Raphson-based Optimizer (NRBO) to optimize their spatial distribution from an emergency evacuation perspective Figure 2). This study centres on the old urban core of Nanjing, where population density is high, historic districts are concentrated, and public green space is unevenly distributed—conditions that generate acute shelter demand during sudden-onset events. After assembling and pre-processing geospatial layers in QGIS through vector cleaning, coordinate unification, clipping and rasterisation, we build a nine-criterion evaluation system for emergency-shelter siting, rasterise each indicator and visualise its spatial pattern. A P-Median-based optimization model that incorporates the NRBO and GIS (ArcGIS 10.4) spatial analytics. The model’s performance is benchmarked against exhaustive enumeration for computational speed and solution accuracy, and the optimized layout is validated through empirical analysis to confirm its plausibility and practical value.
Figure 2.
Research framework.
Before detailing the indicator evaluation system, it is necessary to explicitly define the hazard scenario and temporal assumptions bounding this framework. While the proposed NRBO–P-Median architecture is structurally adaptable to various urban emergencies, the specific indicator system developed in this study is calibrated for sudden-onset, no-notice hazards, with a primary focus on seismic events and their secondary structural hazards (e.g., building collapse and falling debris). In such zero-warning scenarios, early notification windows are virtually non-existent, rendering regional vehicular evacuation infeasible. Consequently, localized, pedestrian-based sheltering within immediate walking distance becomes the only viable survival strategy. In this context, the temporal dimension of evacuation is implicitly captured through spatial impedance and short-range network accessibility metrics, rather than the extended time-window routing used for advance-warning disasters (e.g., hurricanes or slow-onset floods).
2.2.1. Evaluation System of Site Selection Indicators
In this study, the construction of the site selection evaluation system comprehensively considers multiple requirements for emergency refuge facilities. It is structured around three dimensions: facility coverage, facility safety, and transportation accessibility, and five core indicators are selected to assess site suitability (Population Density, Distance to Existing Green Spaces, Distance to High-Rise Buildings, Distance to Major Roads, and Road Emergency Evacuation Index).
Specifically, facility coverage focuses on the coverage area of green spaces and the level of service to surrounding populations; transportation accessibility considers residents’ convenience and evacuation efficiency in emergency situations; and facility safety emphasizes the security of refuge green spaces and the mitigation of potential risks. The combined evaluation using these five indicators provides a comprehensive assessment of site selection rationality and effectiveness, offering a reliable basis for the subsequent optimization model.
- (1)
- Population Density
When considering the disaster prevention attributes of green spaces, their distribution should prioritize areas with high population density and significant foot traffic. On one hand, densely populated areas have a greater demand for emergency shelters [74]; on the other hand, such areas often lack sufficient shelter facilities [75]. Therefore, population density is one of the critical indicators for optimizing the spatial distribution of green spaces from a disaster prevention perspective.
- (2)
- Distance to Existing Green Spaces
Existing green spaces can be regarded as areas already equipped with disaster prevention functions. During spatial optimization, regions not covered by existing green spaces should be prioritized, or areas too close to existing green spaces should be avoided to expand coverage, reduce resource waste, and achieve better site selection outcomes, thereby enhancing the city’s disaster prevention capabilities [76,77,78,79].
- (3)
- Distance to High-Rise Buildings
In the event of natural disasters such as earthquakes, high-rise buildings pose risks of falling debris or collapse, which may indirectly harm urban residents [80]. If newly established green spaces are located too close to high-rise buildings, their disaster prevention risks will significantly increase [81]. Therefore, green space site selection should avoid proximity to high-rise buildings, making the distance to such structures a crucial factor in the decision-making process.
- (4)
- Distance to Major Roads
During disasters, green spaces with convenient transportation access facilitate efficient evacuation of people and vehicles. Therefore, the distance to major roads should be considered in site selection. The closer a green space is to a major road, the higher the evacuation efficiency, and the more favorable the location [82,83,84].
- (5)
- Road Emergency Evacuation Index
This study introduces the “Road Emergency Evacuation Index” as one of the key indicators for site selection. This index measures potential traffic obstacles during emergency evacuations, including road width and connectivity, threats posed by buildings to roads, and pedestrian interference [85,86,87].
The following five variables are used to calculate the Road Emergency Evacuation Index:
Road Width: The width of evacuation roads directly affects the number and speed of people passing through, especially during earthquakes [29,88]. Wider roads can accommodate more people for rapid evacuation. Road width constitutes the most immediate physical determinant of evacuation capacity, serving as a direct proxy for the upper bound of corridor throughput. This study defines road width as the ratio of road area to length, calculated as follows:
where represents the average road width; denotes the road area; denotes the road length.
Road Node Degree: The road node degree reflects the number of connections a road has with other roads [89]. A higher node degree indicates stronger evacuation capabilities during emergencies. This indicator captures the connectivity of the street network and functions as a key metric for assessing regional accessibility and the diversity of available evacuation paths. For example, as shown in Figure 3, point A is a T-junction with three connecting road segments, giving it a node degree of 3. Similarly, point B has a node degree of 4. Thus, the total node degree for segment AB is 7. During emergency evacuations, a higher road node degree enhances safety, as it allows evacuees to converge more easily on that road segment.
Figure 3.
The schematic diagram of road node degree.
Road Resistance Coefficient: This study analogizes the road network to an electrical circuit, applying Kirchhoff’s laws to calculate the road resistance coefficient [90,91,92]. In this analogy, road intersections are treated as circuit nodes, road segments are treated as resistors between nodes, and the flow of people is equivalent to electric current. The road resistance coefficient reflects the difficulty of evacuation along a given road. By analogizing pedestrian flow to electric current, this indicator simulates crowd movement within the transport network, thereby providing an integrative assessment of congestion levels and traversal difficulty across alternative routes. The specific calculation formula is as follows:
where represents the road resistance coefficient, denotes the road length, and indicates the road width. The theoretical rationale for this Kirchhoff-based analogy lies in the physical similarity between pedestrian evacuation dynamics and electrical currents. In high-density urban cores, evacuation efficiency is strictly governed by spatial bottlenecks. Just as electrical resistance is directly proportional to a conductor’s length and inversely proportional to its cross-sectional area, the evacuation impedance of a road segment increases with its length () and decreases with its effective width (). By adopting this circuit analogy, the framework inherently captures the physical capacity constraints and congestion bottlenecks of narrow historic streets, offering a more rigorous representation of actual evacuation difficulty than conventional distance metrics.
Threat from high-rise buildings: During an earthquake, the collapse of high-rise buildings may obstruct road traffic and increase the difficulty of evacuation [69]. Therefore, the closer the evacuation routes are to high-rise buildings, the greater the evacuation risk. Incorporating this metric effectively mitigates the threat posed by potential falling debris or structural collapse along evacuation routes, thereby enhancing overall evacuation safety. In this study, the threat posed by high-rise buildings to roads is quantified using the following formula:
where denotes the number of high-rise buildings adjacent to the evacuation routes, represents the height of building and indicates the distance from building to the road.
Pedestrian counterflow: During emergency evacuation, although the majority of people move towards the safe direction, counterflow may occur, such as rescue personnel and vehicles entering the area or people searching for missing family members [70]. This counterflow can interfere with the evacuation process. Consequently, this indicator captures the real-world perturbations inherent in evacuation scenarios, and its inclusion facilitates a more accurate assessment of both the throughput efficiency and the operational stability of evacuation routes. In this study, the impact of pedestrian counterflow is quantified using the following formula:
where represents the pedestrian counterflow impact index, and denotes the width of the evacuation route.
Based on these five variables, this study constructs a mathematical model for the Road Emergency Evacuation Index. To eliminate typographical redundancies and clearly integrate the road resistance coefficient (), the index for a given evacuation route is formally defined as:
where is the total number of segments along the evacuation route. The term represents the baseline road resistance (which inherently incorporates road length and width), denotes the threat from high-rise buildings, accounts for pedestrian counterflow interference, and is the road node degree. The parameters and are proportionality coefficients, empirically set to and [14]. To verify the robustness of these literature-derived values against potential subjective bias, a systematic non-linear sensitivity analysis of and under continuous parameter perturbations is conducted in Section 3.4.
2.2.2. Optimization Model for Site Selection
The site selection optimization model developed in this study is based on the P-Median problem and is solved using the NRBO. Under multiple objective constraints, the model can efficiently address urban site selection issues and demonstrates significant advantages in both computational efficiency and optimization performance.
- (1)
- P-Median Problem
The objective of the P-Median problem is to identify p locations that minimize the total cost for all regions to reach these points. Depending on the problem and scenario, the cost can be distance, time, or expense, making the P-Median problem also known as the minimum-sum problem. The new location problem studied in this paper falls under the P-Median problem, which requires consideration of the spatial distribution of existing green spaces, as well as factors such as safety and coverage of the selected sites [21]. Its complete mathematical formulation is defined as follows:
Subject to:
where represents the total weighted cost of site selection; denotes the number of demand points; denotes the number of candidate locations; represents the population of demand point ; and represents the evacuation cost from demand point to candidate location . The decision variable if a shelter is opened at candidate location , and otherwise. The allocation variable if demand point is assigned to shelter , and otherwise. The constraints ensure that each demand point is assigned to exactly one facility, demand can only be assigned to an open facility, and exactly facilities are selected.
In this framework, the distance parameter is not a simple Euclidean metric; rather, it is calculated as the impedance-weighted network distance, explicitly incorporating the Road Emergency Evacuation Index to reflect actual disaster routing conditions. Furthermore, existing green spaces are not treated as pre-selected facilities () in the classic P-Median sense. Instead, they act as spatial distance indicators () integrated into the comprehensive objective function (Equation (10)) to penalize candidate sites that are too close to current facilities, thereby prioritizing under-served regions and maximizing service gap coverage.
- (2)
- Newton–Raphson-based Optimizer
The Newton–Raphson-based optimizer (NRBO) is a novel intelligent optimization algorithm [23]. It explores and identifies the search domain by employing the Newton–Raphson search rule and a trap avoidance operator, thereby defining the search path. Compared with traditional heuristic methods, this algorithm exhibits faster convergence and higher computational efficiency, enabling precise and stable solutions even for large-scale datasets. The NRBO starts from an initial guess and updates the position along a specific direction. It approximates the root of the function by using the first few terms of the Taylor series expansion of the objective function around the assumed root. Accordingly, the root position in the Newton–Raphson search rule is updated as:
where and represent the current and updated positions, respectively, is the objective function, and is its derivative.
To further balance diversification and intensification, ensuring the identification of the optimal solution in the search space and eventual convergence to the global solution, an adaptive coefficient is designed as follows:
where denotes the current iteration number, and is the maximum allowed number of iterations. Additionally, the Newton–Raphson search rule incorporates a parameter to enhance diversity and reduce the risk of falling into local optima. The parameter is defined as:
where and are random numbers between 0 and 1, and and is a randomly selected position from the population from 1 to .
This study employs the NRBO to solve the P-Median problem and construct a site selection model, thereby achieving the corresponding algorithmic functionality. The algorithm’s workflow is illustrated in Figure 4.
Figure 4.
The schematic diagram of NRBO.
- (3)
- Objective Function
This paper incorporates the above five indicators into the NRBO’s objective function, taking into account population density, the distribution of existing green spaces, the risk of high-rise building collapse, and the difficulty of road evacuation, to improve the accuracy of the site selection results [93,94,95]. The calculation formula for the objective function is as follows:
where denotes the number of valid grid cells within the study area, represents the number of target grid cells within the study area, is the population density of grid cell , is the weighted distance from grid cell to grid cell , is the distance from grid cell to the nearest major road, is the distance from grid cell to the nearest high-rise building, is the distance from grid cell to the nearest existing green space. A lower value of the objective function indicates a more reasonable site selection result.
The mathematical rationale for employing a multiplicative-divisional structure in Equation (10), rather than a conventional additive multi-objective formulation (e.g., a weighted linear sum), is to enforce a strictly non-compensatory evaluation mechanism. In disaster shelter siting, structural safety and evacuation accessibility act as critical physical bottlenecks. A traditional additive model risks ‘false compensation,’ wherein an exceptionally high score in one dimension (e.g., proximity to high demand) could mathematically offset a fatal deficiency in another (e.g., extreme building-collapse risk). The ratio structure ensures that if a candidate site is critically unsafe () or highly inaccessible (), the overall cost function amplifies multiplicatively, effectively vetoing the location regardless of other favorable attributes. This mechanism guarantees that safety and accessibility prerequisites are satisfied simultaneously. Furthermore, to prevent the objective function from being erroneously dominated by variables with larger numerical scales, all raw spatial metrics (e.g., population counts, Euclidean distances in meters, and topological degrees) are strictly processed using boundary Min-Max normalization prior to integration. This transformation converts every heterogeneous metric into a dimensionless pure number within a standardized interval. Consequently, the resulting Road Emergency Evacuation Index and the global objective function operate as fully dimensionless, mathematically stable comparative indices.
- (4)
- Discrete Adaptation and Constraint Handling of NRBO
Because the standard NRBO is designed for continuous domains, applying it to the P-Median facility location problem requires a rigorous continuous-to-discrete mapping mechanism. In our -facility siting model, each search agent is encoded as a continuous -dimensional vector , where each dimension corresponds to a candidate facility and is bounded within the continuous range ().
To evaluate the objective function, the continuous position of the agent is dynamically transformed into discrete grid IDs using the following steps during each iteration:
- Boundary Handling and Discretization: Any dimension exceeding the boundaries is clamped to . The continuous value is then mapped to a discrete grid index using a nearest-integer rounding function: .
- Duplicate Repair Mechanism: Since rounding may result in identical grid IDs within the same agent (i.e., proposing multiple shelters at the exact same grid), a duplication-check filter is applied. If , the duplicated is randomly re-sampled from the pool of currently unselected valid grid IDs to ensure exactly distinct locations are generated.
- Minimum Separation Penalty: To avoid the inefficient and unscientific practice of manually filtering clustered sites post-optimization, a minimum spatial separation constraint ( m) is directly embedded into the objective function via a massive penalty method. The modified fitness function evaluated by the NRBO is defined as:
The integrated discrete NRBO execution process is summarized in Algorithm 1.
| Algorithm 1 Discrete NRBO for P-Median Site Selection |
| Input:.
Output:. . do do ; ; do ; do then ; ; ; (Equations (8) and (9)); positions of all agents using NRSR and Trap Avoidance Operator; |
3. Results
Before conducting the site selection experiments, this study first analyzed the spatial distribution of existing green spaces in Nanjing’s old city and their corresponding emergency shelter demand. By integrating indicators such as population distribution, green space layout, road accessibility, and building risk, the analysis examined the spatial heterogeneity of shelter demand. This assessment provided a practical background and research foundation for the subsequent site optimization experiments.
Following this, two optimization scenarios are designed. The two-location scenario (k = 2) is employed to verify the feasibility and numerical accuracy of the proposed model and the NRBO, serving as a benchmark through comparison with the exhaustive method. The ten-location scenario (k = 10) focuses on optimizing the spatial configuration of urban green spaces in the old city of Nanjing, with the spatial rationality of the results further examined against the multi-dimensional constraint layers. In both scenarios, the decision factor of the NRBO is set to 0.6, the population size to 30, and the maximum number of iterations to 1250.
3.1. Current Distribution of Green Spaces and Demand Analysis
To systematically evaluate emergency shelter demand in the old urban area, this study integrates multi-source data, including population distribution, green space layout, building height, and road networks. The assessment focuses on three dimensions: facility coverage, facility safety, and transportation accessibility. Figure 5 presents the standardized and rasterized spatial distribution of each indicator.
Figure 5.
Graded distance from main roads and distribution map of road emergency evacuation index: (a) Population density; (b) Distance from existing green space; (c) Average height of the buildings; (d) Collapse impact range of high-rise buildings; (e) Distance from the main road; (f) Road emergency evacuation index.
- (1)
- Facility Coverage
Figure 5a shows the population distribution, which is mainly concentrated in the central and southern parts of the old urban area. The central area, especially the Xinjiekou business district, is the city’s most prosperous commercial hub, while the south hosts major scenic spots such as the Confucius Temple, resulting in the highest population density. The northern part also contains a relatively large population, with many old residential communities and schools, whereas the eastern part has lower density. These regions therefore have high demand for emergency shelters.
Figure 5b illustrates the distribution of green spaces, concentrated on the western (about 35%) and eastern (about 25%) sides, but sparse in the central part. In terms of area coverage, existing green spaces cover about 91% of the old urban area within a 1 km service radius, but only 48% within 500 m. In terms of population coverage, 69% of residents are covered within 1 km, dropping to 31% within 500 m. These results indicate that while area coverage is relatively high, population coverage remains insufficient.
- (2)
- Facility Safety
Figure 5c depicts the spatial distribution of building heights in the old urban area. On average, building height is 21 m, with high-rise buildings exceeding 30 m primarily concentrated in the central area from Xinjiekou to Sanshan Street, forming a dense cluster of tall buildings. In contrast, the peripheral areas are generally characterized by lower buildings, with scattered buildings above 20 m but lacking overall continuity.
Buildings over 24 m are defined as high-risk, with half their height taken as the collapse radius (Figure 5d). Results show that central areas contain large contiguous high-risk zones, while peripheral risks are more scattered. Overall, more than 70% of the old urban area falls within risk zones. Notably, nearly 75% of existing green spaces are located outside these zones, suggesting that most green spaces are relatively safe and suitable for emergency refuge.
- (3)
- Transportation Accessibility
Figure 5e shows the distribution of major roads in the old urban area. Although the number of major roads is limited and most other roads are two-lane with relatively low grades, these main roads still connect different parts of the old urban area. In terms of spatial variation, the northern and eastern areas contain more major roads with broader coverage, whereas the southern part has a weaker road network. In addition, due to the concentration of scenic and commercial areas, traffic in the south is more complex, consisting largely of pedestrian and bicycle lanes.
Figure 5f illustrates the evacuation index of major roads, where higher values indicate greater evacuation difficulty. Roads radiating from the city center have higher values, reflecting greater congestion risk, while peripheral roads show lower values due to lower density and better connectivity. Some eastern roads also have relatively low index values owing to their higher density. Overall, the old urban area has a well-developed road network with strong accessibility, though certain areas still offer room for optimization.
3.2. Results of Two-Location Scenario Analysis
This study adopts a strategy of conducting multiple repeated experiments, saving the results of each run and recording the location combinations and objective function values. After multiple experiments, the most frequent location result, after removing combinations with locations that are too close, is (3713, 4589), with an objective function value of 459,224. The specific location is shown in Figure 6a, and the average computation time is 5.83 s.
Figure 6.
Site selection results by NRBO and exhaustive method with two choices. (a) Site selection results of NRBO; (b) Site selection of Exhaustive Method.
To verify the accuracy of the NRBO, the exhaustive method is used for comparison in the scenario of locating 2 green spaces. Since the exhaustive method is computationally intensive and time-consuming, it is only applied in smaller scenarios. There are 4231 valid grid cells in the old urban area of Nanjing, resulting in a total of = 8,948,565 possible location combinations. By calculating the objective function value for each combination and screening out combinations with locations that are too close, the top 10 combinations with the smallest objective function values are obtained. The location results are shown in Table 2, and the total computation time is 644 s.
Table 2.
Enumeration method with 10 site selection combinations and objective function values.
Overlaying these location results on the map (Figure 6), it can be seen that the selected sites are mainly concentrated in three areas. Area 1 includes site (3713), Area 2 includes sites (3687, 3688, 3689), and Area 3 includes sites (4589, 4590, 4670). The location combinations in Areas 1 and 3 have the lowest objective function values, indicating that they are the optimal location combinations. In contrast, the location combinations in Areas 2 and 3 have slightly higher objective function values, making them the second-best choices.
In the experiment with two locations, the results of the NRBO are compared with those of the exhaustive method. The location result of the Newton–Raphson optimization algorithm is (3713, 4589), which belongs to Areas 1 and 3 and is consistent with the optimal result of the exhaustive method. These findings demonstrate that the NRBO exhibits high accuracy and robust stability when embedded in spatial-location models, rendering it well-suited to complex siting tasks within high-density urban contexts. Computationally, the algorithm preserves solution fidelity while substantially reducing resource expenditure, thereby evidencing strong scalability and substantial practical potential. This characteristic renders the approach particularly advantageous for addressing large-scale or high-dimensional location-optimization problems.
3.3. Results of Ten-Location Scenario Analysis
For the optimization of locating 10 green spaces, the computational demand of the exhaustive method, which would require calculating combinations, is prohibitively large (Table 3). Therefore, only the NRBO is employed. After conducting multiple experiments and eliminating some location combinations that are overly concentrated in space, the final location result with an objective function value of 224,280 is obtained, as shown in Figure 7. Multistage experimental results reveal that the model converges consistently to statistically indistinguishable optima across diverse random seeds and initialization configurations, thereby attesting to its stability and robustness. To rigorously evaluate the performance superiority and stability of the NRBO in the ten-location scenario, horizontal comparative experiments were conducted against two well-established metaheuristic algorithms: the Genetic Algorithm (GA) and Particle Swarm Optimization (PSO). All algorithms were executed under identical parameter settings (population size = 30, maximum iterations = 40) across 30 independent runs to eliminate random bias. As detailed in Table 3, NRBO significantly outperformed both GA and PSO in terms of solution quality. NRBO achieved the lowest optimal objective value (22,550.86) and the lowest mean objective value (24,186.23) across 30 runs, demonstrating a stronger capability to identify high-quality global optima. Furthermore, the statistical distribution (standard deviation = 410.40) validates the robust stability of NRBO in navigating complex, high-dimensional discrete search spaces. As illustrated in the average convergence curves (Figure 7), while GA and PSO were prone to premature convergence and became trapped in local optima early in the search process, NRBO maintained a steep descent gradient, effectively escaping local traps. Although NRBO’s average computation time (0.0777 s) was marginally higher than GA (0.0542 s) and PSO (0.0596 s), the substantial gain in optimization accuracy makes it highly justifiable for urban planning applications. These findings furnish a reliable empirical basis for subsequent field validation and analytical extension.
Table 3.
Statistical performance comparison of NRBO, GA, and PSO over 30 independent runs.
Figure 7.
Convergence curves comparison of NRBO, GA, and PSO (averaged over 30 independent runs).
As shown in Figure 8, the ten selected sites are mainly distributed in the southeastern and northern parts of the old urban area, forming a relatively balanced spatial pattern. Most sites are located in densely populated areas and are surrounded by key facilities. For example, some are near major hospitals such as Nanjing Red Cross Hospital and the Eastern Theater General Hospital, while others are adjacent to educational clusters including Nanjing Normal University, Hohai University, Southeast University, and several primary and secondary schools. In addition, certain sites are close to residential neighborhoods or public facilities such as Jiangsu Wutaishan Sports Center and Jiangsu Science and Technology Museum. The presence of schools, hospitals, and dense residential areas indicates high potential demand for emergency shelters. Placing green spaces at these sites not only enhances urban green coverage but also improves emergency shelter capacity and disaster resilience in the old urban area.
Figure 8.
Site selection results by NRBO with 10 choices.
On this basis, the study further analyzed the selected sites from the following three dimensions:
- (1)
- Facility Coverage
The optimization results show that all selected sites are located in densely populated areas of the old urban area, covering most high-density population zones (Figure 9a,b). Specifically, from the perspective of area coverage, the coverage of green spaces within a 500 m service radius increased from 48% before site selection to 66% after optimization. From the perspective of population coverage, the coverage within a 1 km service radius increased from 69% to 82%, while within 500 m it increased from 31% to 58%. This configuration effectively meets the actual demand for emergency shelter space in high-density areas, significantly enhances the coverage of shelter services, and demonstrates the population-demand-oriented optimization capability of the model.
Figure 9.
Site selection results and indicators: (a) Site selection results and population density; (b) Site selection results and existing green spaces; (c) Site selection results and collapse impact range; (d) Site selection results and main road.
- (2)
- Facility Safety
The results indicate that 9 of the 10 selected sites are located outside collapse risk zones, with no high-rise buildings within a 100 m radius; only Site 2 is situated within a collapse risk area, surrounded by a building of 39 m height (Figure 9c). On average, the buildings within 100 m of the selected sites have a height of 13.3 m, indicating a generally low risk of high-rise building collapse. After site selection, the proportion of green spaces located outside collapse risk zones increased to over 80%. Overall, the site layout avoids areas with concentrated tall buildings, effectively reducing the risk of falling debris or structural collapse during earthquakes and ensuring the safety of emergency shelters. These results indicate that safety factors were adequately incorporated into the site selection process.
- (3)
- Transportation Accessibility
All 10 selected sites are within 100 m of major roads, with 7 sites located within 50 m. The proximity to major roads determines the accessibility of the sites, and good transportation conditions facilitate rapid evacuation and assembly during disasters (Figure 9d). Among the 10 sites, 5 are located in areas with low emergency evacuation index values, where road conditions are favorable and evacuation is efficient. The remaining 5 sites are situated in areas with relatively higher evacuation index values, where evacuation conditions are less favorable; however, considering facility coverage and safety, these locations are still suitable as emergency shelter sites. Overall, the selected sites exhibit good transportation accessibility, which enhances emergency response efficiency and confirms the feasibility of the siting scheme in terms of evacuation conditions.
In summary, an internal consistency evaluation across three key dimensions—facility coverage, facility safety, and transport accessibility—demonstrates that the selected sites mathematically satisfy the defined spatial constraints. While these spatial configuration results confirm that the model successfully balances the given objective parameters, we acknowledge that full operational validation would require future integration with dynamic evacuation simulations or expert planning assessments. Currently, the model serves as a quantitative and scientifically grounded baseline for emergency green-space spatial configuration.
3.4. Parameter Sensitivity Analysis
To evaluate the stability of the optimized shelter layout against empirical parameter uncertainties in the Road Emergency Evacuation Index, a non-linear sensitivity analysis was conducted on the proportionality coefficients and (Equation (5)). Both parameters were subjected to simultaneous perturbations ranging from to in increments of . Two complementary metrics were evaluated across the perturbation spectrum: the Site Selection Overlap Rate (%) (the proportion of identical candidate sites retained among the optimal ten shelters relative to the baseline configuration) and the Objective Value Variation (%) (the percentage deviation of the global cost function from the baseline).
As illustrated in Figure 10, the spatial configuration of the ten selected shelters demonstrated remarkable structural resilience. Across mild perturbations (), the overlap rate remained at , indicating that 9 out of the 10 facilities remained strictly unchanged. Even under extreme parameter variations of and , the overlap rate consistently remained at , with only two marginal facilities being substituted by adjacent sub-optimal alternatives. Concurrently, the objective function value exhibited a smooth and bounded monotonic response, varying strictly within . These quantitative findings confirm that the NRBO–P-Median siting framework is predominantly governed by the macroscopic physical constraints of the urban fabric (e.g., high-density demand centers and structural hazard zones) rather than being over-fitted to empirical parameter specifications.
Figure 10.
Non-linear parameter sensitivity analysis of external coefficients ( and ) under perturbations from to .
4. Discussion
4.1. Solver Efficiency and the Design of the Indicator System
The benchmark against exhaustive enumeration establishes the numerical basis of the framework. In the two-site scenario, repeated NRBO runs converged most frequently on the combination (3713, 4589), which is the lowest-cost pair among the 8,948,565 combinations evaluated by enumeration. Each NRBO run required 5.83 s on average, whereas the full enumeration required 644 s. The solver therefore identified the enumerated optimum at a per-run cost roughly two orders of magnitude below that of the complete search, although the reported protocol relies on repeated runs, so the aggregate saving depends on the number of replications required to stabilise the modal solution. The relative advantage should nevertheless widen as p increases, since enumeration scales combinatorially while the NRBO scales with population size and iteration count, and it is this property that makes the ten-site scenario tractable. Two features of the algorithm plausibly contribute. The Newton–Raphson search rule uses local curvature rather than random perturbation, which shortens the approach to a basin of attraction, and the trap-avoidance operator limits premature convergence. Population-based heuristics applied to comparable siting problems, including MPSO-GA and LMPSO, perform adequately at smaller scales but converge more slowly as the candidate set and the number of constraints grow. The behaviour observed here is consistent with the convergence properties reported for NRBO in other constrained spatial problems [96,97,98,99], though no direct comparison on the same objective function was undertaken.
The enumeration output also characterises the objective surface. The ten best pairs span values from 459,224 to 468,689, a range of about 2%, and they fall into only three spatial groups. The surface is therefore locally flat, in the sense that a set of nearby candidate cells yields near-equivalent objective values. Two consequences follow. The flatness is favourable for a stochastic solver, since terminating near rather than exactly at the optimum carries little cost, which may help explain the stability of the modal result across runs. For planning, it implies that the output is better interpreted as a set of priority zones than as a set of specific parcels, since the ranking among cells within a group is unlikely to be robust to modest changes in the input data.
The formulation and the indicators determine what this surface represents. The P-Median criterion was adopted because minimising population-weighted distance corresponds directly to reducing aggregate evacuation travel, and it has performed well in comparable emergency applications. The optimized ambulance deployment used a hierarchical P-Median model, and Bera et al. combined the P-Median structure with random forest methods for flood-shelter allocation [100]. P-Center formulations minimise the maximum service distance and so protect the worst-served demand point, but they do so at the expense of aggregate accessibility, which is a less attractive trade-off in a district where demand is spatially concentrated. The nine indicators are then arranged at two levels. Four are evaluated at the candidate site, namely population density, distance to existing green spaces, distance to high-rise buildings, and distance to major roads. Five further variables are evaluated along the road network and aggregated into the Road Emergency Evacuation Index. This two-level arrangement is the substantive design choice, because it distinguishes the suitability of a location from the condition of the corridors that serve it. Population density and accessibility remain core determinants of shelter performance [101,102,103], and the value of coupling hazard exposure with mobility factors has been noted previously [76]. The contribution lies less in the indicators themselves than in their combination, since demand, structural safety, and route conditions are treated together rather than as sequential screening filters.
4.2. Coverage Gains and Residual Trade-Offs in the Optimized Layout
As established by the spatial metrics in Section 3.3, the optimized layout successfully addressed the most critical binding constraints of the historic district, particularly the severe coverage deficit at the 500-m short-range radius. By targeting this critical pedestrian-scale threshold, the model rectified historical spatial inequities rather than merely inflating aggregate facility counts. However, this optimized layout also exposes underlying urban tensions that a single-objective formulation would typically conceal. These findings support the argument that shelter system performance depends on spatial configuration and not on facility count alone [104,105,106,107], since ten additional sites produced substantial coverage gains within an already partially served district.
The optimised layout also exposes tensions that a single-objective formulation would conceal. Population density peaks around Xinjiekou, which should attract sites under the demand term, yet the same central belt from Xinjiekou to Sanshan Street contains the densest concentration of buildings above 30 m and the largest contiguous collapse-risk zone. In the resolved layout the safety term appears to dominate, since the selected sites concentrate in the southeastern and northern parts of the district rather than within the central high-rise cluster, while still serving most high-density zones from adjacent positions. Given that more than 70% of the old urban area falls within a collapse-risk zone, the placement of nine of the ten sites outside such zones is unlikely to be incidental, and the mean height of buildings within 100 m of the selected sites, 13.3 m, is well below the district-wide mean of 21 m. Site 2 is the single exception, lying within a risk zone beside a building of 39 m, which suggests the point at which the demand term outweighs the safety penalty and identifies a location where the model output warrants qualification in practice.
A comparable tension appears in accessibility. All ten sites lie within 100 m of a major road and seven within 50 m, so site-level accessibility is uniformly favourable, yet five sites fall in areas with relatively high evacuation index values. The two measures describe different properties. Proximity concerns the connection between a shelter and the network, whereas the evacuation index concerns conditions along the network itself, and Section 3.1 shows that the radial corridors leaving the city centre carry the highest index values. Favourable proximity therefore does not guarantee favourable evacuation conditions, and for these five sites the limiting factor lies in corridor capacity rather than in the choice of location.
4.3. Planning Implications for Dual-Use Green Infrastructure
These findings support three planning positions. Green spaces serve ecological and disaster-mitigation functions simultaneously [108], and well-configured parks can provide evacuation routes, buffer zones, and assembly points while retaining their recreational role [109,110]. Realising that potential requires, first, that the sheltering function be recorded in statutory spatial plans rather than left to emergency-management guidance. Because objective values are near-equivalent across neighbouring candidate cells, designation is better applied to priority zones than to individual parcels, an approach that also accords with the incremental way land becomes available in historic districts. Micro-green parcels released through renewal can then be assessed against their zone assignment and connected to arterial roads and medical facilities.
Second, shelter-capable green spaces should be incorporated into hierarchical shelter master plans, supported by classification standards based on service radius, accessibility, and capacity [111,112]. Since the principal coverage deficiency in this district lay at the 500 m radius, the short radius rather than the 1 km radius is the more informative standard for high-density historic cores. Technical guidelines for adaptive upgrading, together with targeted funding, streamlined land-use approvals, and public engagement, would sustain the dual-use function in operation. Third, siting decisions should be coordinated with road management, since the five sites in high-index areas indicate that performance is constrained as much by corridor conditions as by shelter position. Measures such as designated one-way evacuation protocols and priority debris clearance address a limitation that relocation cannot. Treating green spaces as multifunctional assets also reduces the cost of constructing stand-alone shelters, and embedding the model within municipal investment frameworks could direct resources toward the zones it identifies [113,114].
Furthermore, beyond greenfield site selection, this framework offers a highly practical ‘reverse-diagnosis’ application for highly urbanized historic centers where severe land scarcity prohibits the creation of new shelters. By inverting the analytical lens, urban planners can evaluate existing green spaces to pinpoint specific vulnerabilities within their surrounding evacuation networks. For instance, the model can identify instances where a park’s sheltering functionality is severely degraded by local access bottlenecks, such as exceptionally narrow historic alleys or high-risk structural pinch points. In such formulations, rather than expropriating land to relocate or build new shelters, municipal investments can be precisely directed toward targeted urban renewal—such as retrofitting specific vulnerable high-rises, widening critical access corridors, or establishing dedicated pedestrian emergency routes—thereby unlocking the latent sheltering capacity of existing green infrastructure.
The framework appears transferable on these terms. Optimising green-space configuration is central to safety resilience in compact cities, and integrating emergency functions into green infrastructure at the design stage in new districts helps prevent redundant later investment [112,114]. Since the old core of Nanjing combines high population density, limited open space, uneven green-space distribution, and extensive collapse-risk exposure, it constitutes a demanding rather than a favourable test case, which provides some basis for expecting comparable performance in less constrained settings.
4.4. Limitations and Future Work
Several limitations qualify these conclusions. Equation (10) combines the site-level terms as a ratio rather than as an additive weighted sum, so the relative influence of demand, safety, and accessibility follows from the algebraic structure rather than from explicit weights. Although the parameter sensitivity of the empirical coefficients and has been rigorously confirmed in Section 3.4, sensitivity tests on the algebraic ratio structure itself and the NRBO decision factor were not explored. Alternative formulations based on set covering, construction cost, or explicit risk thresholds were not examined. The P-Median formulation also allocates demand without a capacity constraint, so the reported coverage figures measure geographic accessibility rather than absorbable demand, and a capacitated extension would be required before the layout could be used to size individual shelters.
Data constraints impose further qualifications. The input layers date from 2019 to 2021 and predate recent urban renewal activity. Demographically, the spatial allocation relies on the residential population dataset, which captures baseline nighttime permanent residents but omits transient daytime workers and tourists in commercial cores such as Xinjiekou and southern scenic zones. This modeling premise is practically and methodologically justified in urban disaster mitigation planning: statutory seismic shelter codes conventionally adopt nighttime residential density as the baseline “worst-case scenario,” given that sleeping residents exhibit the lowest situational awareness and self-rescue mobility. Furthermore, high-density commercial cores like Xinjiekou are dominated by dense high-rise clusters that fall squarely within contiguous building-collapse risk zones; establishing open-air surface green-space shelters directly within these collapse envelopes is physically constrained and safety-prohibitive. In urban operational reality, daytime peak crowd evacuations in such commercial hubs rely primarily on underground civil air defense networks (such as Xinjiekou’s subterranean transit complex) and internal structural refuge floors, rendering surface green spaces complementary rather than exhaustive. Due to the current unavailability of dynamic mobile-signaling or daytime trajectory data, this framework is explicitly defined as a baseline static optimization model founded on permanent-resident distribution. Indicators such as soil suitability, microclimatic conditions, and emergency-service capacity were omitted for similar reasons, and validation was confined to a single city and to a hazard framing dominated by structural collapse. Finally, as a baseline static model, the framework does not explicitly represent the temporal dimension of evacuation: time enters only indirectly through spatial impedance and near-field shelter availability, and the available evacuation time window or the duration of warning/notification is not modeled. This is a deliberate simplifying assumption; the results therefore characterize spatial evacuation capacity and accessibility under a given hazard extent rather than whether evacuation can be completed within a specific time window, and transferring the framework to scenarios with explicit time-window constraints would require a temporal component.
These constraints indicate the direction of further work. A capacitated multi-objective formulation reporting a Pareto set would make the trade-offs identified above explicit for planners rather than resolving them within a single composite score [46]. Coupling the framework with dynamic evacuation simulation and time-varying population data would allow the Road Emergency Evacuation Index to be validated against modelled flow and would test whether the selected layout remains adequate under daytime peak loads. While the algorithmic superiority and 30-run statistical stability of NRBO have been demonstrated in Section 3.3, testing across cities with differing morphologies, governance systems, and hazard profiles would further clarify its generalizability.
5. Conclusions
This paper proposes a site selection model for green spaces from the perspective of emergency management, aiming to optimize the spatial planning of green spaces to ensure urban safety. The model is based on the NRBO and is empirically tested in the old urban area of Nanjing to verify its feasibility and analyze the rationality of the site selection plan, providing references for urban planning departments. The main research findings are as follows:
- (1)
- Based on the timeliness requirements of emergency evacuation, this study constructs a model prototype based on the P-Median problem to minimize the distance residents need to travel to reach shelter spaces. From the perspectives of facility coverage, facility safety, and transportation accessibility, nine site selection indicators are used to construct the objective function to evaluate the suitability of green space locations. The NRBO is employed to build the site selection model, achieving fast and accurate solutions.
- (2)
- Comparative analyses between the proposed model and exhaustive enumeration demonstrate that the former excels in both solution accuracy and practical applicability, consistently generating spatial configurations that are operationally feasible. Moreover, the model exhibits marked advantages in computational efficiency and resource utilization, rendering it well-suited for larger-scale and higher-complexity optimization tasks. Collectively, these findings demonstrate the model’s computational feasibility and theoretical validity, providing a quantitative spatial configuration baseline to support urban emergency planning workflows.
- (3)
- The results indicate that the site selection scheme is overall reasonable, maintaining appropriate spacing from existing green spaces and thereby avoiding resource redundancy. In terms of facility coverage, the addition of 10 new sites increased the area coverage within a 500 m service range by 18% and the population coverage by 27%. Regarding facility safety, the average building height within 100 m of the selected sites is 13.3 m, with more than 80% of the green spaces located outside collapse-risk zones, suggesting a generally low level of risk. In terms of transportation accessibility, all selected sites are within 100 m of major roads, with 70% located within 50 m, and the overall emergency evacuation index of the surrounding road network remains low, providing favorable evacuation conditions. Overall, the optimized site selection demonstrates strong performance in coverage, safety, and accessibility, significantly enhancing the disaster prevention and mitigation capacity of green spaces in the old urban area.
Author Contributions
G.S.: conceptualization, methodology, software, formal analysis, writing—original draft, writing—review & editing, project administration, supervision. H.T.: methodology, software, writing-original draft; J.L.: data curation, software, visualization, writing—original draft. W.W.: supervision, writing—review & editing, funding acquisition. L.S.: investigation, writing—review & editing. C.C.: software, validation. J.S.: software, validation, formal analysis. All authors have read and agreed to the published version of the manuscript.
Funding
This research was funded by the Open Fund of Key Lab of Natural Resources Monitoring, Department of Natural Resources of Jiangsu Province (Grant No. JSNRM-2025A08); Natural Resources Science and Technology Project of Jiangsu Province (Grant No. JSZRKJ202517); Jiangsu Province Youth Science and Technology Talent Support Project under Grant JSTJ-2025-537; and Science and Technology Project of Xizang Autonomous Region: XZ202601ZY0171.
Institutional Review Board Statement
Not applicable.
Informed Consent Statement
Not applicable.
Data Availability Statement
Data is available on request by the corresponding author.
Acknowledgments
The authors are grateful for the data support from the “National Earth System Science Data Center, National Science & Technology Infrastructure of China (http://www.geodata.cn)” and for the policy consulting support from the Institute for Emergency Governance and Policy in Nanjing Tech University.
Conflicts of Interest
The authors declare no conflicts of interest.
References
- Reimuth, A.; Hagenlocher, M.; Yang, L.E.; Katzschner, A.; Harb, M.; Garschagen, M. Urban growth modeling for the assessment of future climate and disaster risks: Approaches, gaps and needs. Environ. Res. Lett. 2024, 19, 013002. [Google Scholar] [CrossRef] [Scilit]
- Wang, Y.; Li, Y.; Liang, J.; Bi, Y.; Wang, S.; Shang, Y. Climatic Changes and Anthropogenic Activities Driving the Increase in Nitrogen: Evidence from the South-to-North Water Diversion Project. Water 2021, 13, 2517. [Google Scholar] [CrossRef] [Scilit]
- Xie, C.; Cui, B.; Xie, T.; Yu, S.; Ning, Z. Evolution of a Tidal Channel Network in the Yellow River Delta, China, and Simulation of Optimization Scenarios. J. Environ. Manag. 2024, 353, 120215. [Google Scholar] [CrossRef] [Scilit] [PubMed]
- Ji, L.; Li, Y.; Zhang, G.; Bi, Y. Anthropogenic Disturbances Have Contributed to Degradation of River Water Quality in Arid Areas. Water 2021, 13, 3305. [Google Scholar] [CrossRef] [Scilit]
- Yang, G.; Xia, S.; Huo, L.; Li, M.; Zhang, C.; Su, Y.; Guo, D. Two-Stage Multiobjective Decision-Making Method Based on Agricultural Water-Energy-Food Nexus: Case Study in Hetao Irrigation District, China. J. Water Resour. Plan. Manag. 2023, 149, 05023006. [Google Scholar] [CrossRef] [Scilit]
- Gao, H.; Shi, J.; Cheng, H.; Zhang, Y.; Zhang, Y. The Impact of Long- and Short-Term Exposure to Different Ambient Air Pollutants on Cognitive Function in China. Environ. Int. 2021, 151, 106416. [Google Scholar] [CrossRef] [Scilit] [PubMed]
- Pescaroli, G.; Alexander, D. Critical infrastructure, panarchies and the vulnerability paths of cascading disasters. Nat. Hazards 2016, 82, 175–192. [Google Scholar] [CrossRef] [Scilit]
- Shi, G.; Sun, L.; Sun, Q.C.; Shi, J.; Chen, C.; Sun, X.; Xiao, Y. Spatiotemporal Evolution and Determinant Analysis of Energy-Related Carbon Emissions in Jiangsu Province Using Interpretable Machine Learning. Appl. Spat. Anal. Policy 2026, 19, 136. [Google Scholar] [CrossRef] [Scilit]
- Lillywhite, B.; Wolbring, G. Risk Narrative of Emergency and Disaster Management, Preparedness, and Planning (EDMPP): The Importance of the ‘Social’. Sustainability 2023, 15, 387. [Google Scholar] [CrossRef] [Scilit]
- Shi, G.; Liu, J.; Yang, C.; An, Q.; Tian, Z.; Chen, C.; Zhang, J.; Li, X.; Zhang, Y.; Xu, J. Study on the Spatiotemporal Evolution of Urban Spatial Structure in Nanjing’s Main Urban Area: A Coupling Study of POI and Nighttime Light Data. Front. Archit. Res. 2025, 14, 1780–1793. [Google Scholar] [CrossRef] [Scilit]
- Jiang, R.; Tong, S.; Wu, J.; Hu, H.; Zhang, R.; Wang, H.; Zhao, Y.; Zhu, W.; Li, S.; Zhang, X. A Novel EEG Artifact Removal Algorithm Based on an Advanced Attention Mechanism. Sci. Rep. 2025, 15, 19419. [Google Scholar] [CrossRef] [Scilit] [PubMed]
- Li, Y.; Qu, K.; Jiang, R.; Wang, H.; Zhao, X.; Yang, Z.; Tian, B.; Tao, J.; Chu, J.; Duan, C. Atomic-Scale Defect Reconfiguration via Thermally Induced Structural Ordering for High-Efficiency Sb2Se3 Solar Cells. ACS Nano 2025, 19, 33460–33472. [Google Scholar] [CrossRef] [Scilit] [PubMed]
- Yu, S.; Qian, Y.; Xie, C.; Sun, S. Revisiting the Effectiveness of Biodiversity Offsets in Coastal Wetlands of China through Landscape Connectivity. Ecol. Indic. 2024, 160, 111902. [Google Scholar] [CrossRef] [Scilit]
- Shao, B. Discussion on Construction Planning Method of Emergency Shelter for Implementation Guidance: A Case Study of Changning District in Shanghai. Shanghai Urban Plan. Rev. 2020, 6, 112–116. [Google Scholar] [CrossRef]
- Wang, L.; Ma, Y.; Yan, Z.; Zhang, L.; Hu, Y.; Zhao, S. Giving or Receiving: Impact of Online Socializing in Online Fitness Community on Physical Activity and Emotional State. Comput. Hum. Behav. 2025, 169, 108669. [Google Scholar] [CrossRef] [Scilit]
- Li, Z.; Luo, Y.; Wang, S.; Xue, D.; Zhang, Y. Molecular Mechanisms of 6PPD and 6PPD-Q Toxicity in Neurodegenerative Diseases: A Network Toxicology and Experimental Validation Study. Toxics 2026, 14, 504. [Google Scholar] [CrossRef] [Scilit] [PubMed]
- Alisan, O.; Ghorbanzadeh, M.; Ulak, M.B.; Kocatepe, A.; Ozguven, E.E.; Horner, M.; Huang, W. Extending Interdiction and Median Models to Identify Critical Hurricane Shelters. Int. J. Disaster Risk Reduct. 2020, 43, 101380. [Google Scholar] [CrossRef] [Scilit]
- Wang, Z.; Wang, X.; Xu, S.; Zhou, R.; Zhang, M.; Li, W.; Zhang, Z.; Wang, L.; Chen, J.; Zhang, J.; et al. Off-Site Production of Plasma-Activated Water for Efficient Disinfection: The Crucial Role of High Valence NOx and New Chemical Pathways. Water Res. 2024, 267, 122541. [Google Scholar] [CrossRef] [Scilit] [PubMed]
- Yang, Y.; Hou, J.; Yu, Q.; Zhang, T. Exploring the interactive effects of speed and slope on pollutant emissions from light-duty vehicles based on big data. Atmos. Pollut. Res. 2026, 17, 102962. [Google Scholar] [CrossRef] [Scilit]
- Rahman, M.; Chen, N.; Islam, M.M.; Dewan, A.; Pourghasemi, H.R.; Washakh, R.M.A.; Nepal, N.; Tian, S.; Faiz, H.; Alam, M.; et al. Location-Allocation Modeling for Emergency Evacuation Planning with GIS and Remote Sensing: A Case Study of Northeast Bangladesh. Geosci. Front. 2021, 12, 101095. [Google Scholar] [CrossRef] [Scilit]
- Wang, W.; Van Deelen, T.; Wei, F.; Li, S.; Wang, L. Anthropogenic Habitat Loss and Fragmentation May Alter Coevolutionary Progress as Examined in a Brood Parasitism Model. Ecol. Evol. 2025, 15, e71721. [Google Scholar] [CrossRef] [Scilit] [PubMed]
- Wang, W.; Lu, B.; Li, Y.; Ji, F. A Quantitative Assessment of the Inconsistency Between Waterbody Segmentation and Shoreline Positioning in Deep Learning Models. Geomatics 2026, 6, 21. [Google Scholar] [CrossRef] [Scilit]
- Li, M.; Wang, F.; Kwan, M.-P.; Chen, J.; Wang, J. Equalizing the Spatial Accessibility of Emergency Medical Services in Shanghai: A Trade-Off Perspective. Comput. Environ. Urban Syst. 2022, 92, 101745. [Google Scholar] [CrossRef] [Scilit]
- Shi, G.; Tang, H.; Wang, W.; Chen, C.; Shi, J.; Wang, B.; Sun, L. Fine-Scale Mapping of Built-Environment Carbon Emissions: A Multi-Source Data Fusion and Explainable Machine Learning Framework for High-Density Urban Regions. Build. Environ. 2026, 305, 115199. [Google Scholar] [CrossRef] [Scilit]
- Tian, X.; Jin, Y.; Zhang, Z.; Liu, P.; Ni, F. A Knowledge-Guided Multimodal Network for Video Summarization. Expert Syst. Appl. 2026, 324, 132566. [Google Scholar] [CrossRef] [Scilit]
- Li, Y.; Li, Z.; Peng, C. A Stretchable Wearable Doppler Ultrasound Patch for Continuous Vascular Monitoring. Measurement 2026, 266, 120490. [Google Scholar] [CrossRef] [Scilit]
- Zhang, J.; Hu, Y.; Qin, H.; Pu, C.; Zhang, T.; Sun, J.; Peng, C. Flexible Skull-Conformal Phased Array for Aberration-Corrected Transcranial Focused Ultrasound Therapy. Ultrasonics 2026, 165, 108089. [Google Scholar] [CrossRef] [Scilit]
- Zhang, Z.; Xu, C.; Jiang, C. Privacy-Preserving Electricity Trading Matching Based on Blockchain in Smart Grid. Expert Syst. Appl. 2026, 303, 130682. [Google Scholar] [CrossRef] [Scilit]
- Wang, W.; Lu, B.; Li, Y.; Ji, F. Multiscale Morphology-Based Detection of Shoreline Change Hotspots from Aerial Imagery Under Fluctuating Water Levels. Remote Sens. 2026, 18, 1148. [Google Scholar] [CrossRef] [Scilit]
- Zhang, D.; Guo, X.; Zhang, R.; Zhang, S.; Zhao, B.; Wu, H.; Li, Q.; Li, Z.; Ye, L.; Zhang, T.; et al. Design and Validation of a Compact Focusing Mechanism for Space Optical Cameras with MTF-Based Defocus Analysis. Aerospace 2026, 13, 624. [Google Scholar] [CrossRef] [Scilit]
- Wang, H.; Wang, Y.; Li, Y.; Wang, X.; Chen, X.; Yu, S.; Wang, X. Spatial Risk Prediction and Serological Validation of Emerging Wild Boar-Borne Diseases in Eastern Heilongjiang, China. Pak. Vet. J. 2025, 45, 1721–1732. [Google Scholar] [CrossRef] [Scilit]
- Scheihing, K.W.; Kübeck, C.; Sütering, U. GIS-AHP Ensembles for Multi-Actor Multi-Criteria Site Selection Processes: Application to Groundwater Management under Climate Change. Water 2022, 14, 1793. [Google Scholar] [CrossRef] [Scilit]
- Wang, W.; Xu, Y.; Zhang, S.; Xu, Y.; Xue, X. Bibliometric Insights into Pollution Research: Trends, Geographic Disparities, and Emerging Environmental Challenges. Environ. Res. Commun. 2025, 7, 075026. [Google Scholar] [CrossRef] [Scilit]
- Zhang, H.; Bai, X.; Hong, X. Site selection of nursing homes based on interval type-2 fuzzy AHP, CRITIC and improved TOPSIS methods. J. Intell. Fuzzy Syst. 2022, 42, 3789–3804. [Google Scholar] [CrossRef] [Scilit]
- Lei, F.; Cai, Q.; Liao, N.; Wei, G.; He, Y.; Wu, J.; Wei, C. TODIM-VIKOR method based on hybrid weighted distance under probabilistic uncertain linguistic information and its application in medical logistics center site selection. Soft Comput. 2023, 27, 8541–8559. [Google Scholar] [CrossRef] [Scilit] [PubMed]
- Saraswat, S.K.; Digalwar, A.K.; Yadav, S.S.; Kumar, G. MCDM and GIS based modelling technique for assessment of solar and wind farm locations in India. Renew. Energy 2021, 169, 865–884. [Google Scholar] [CrossRef] [Scilit]
- Jia, Q.; Zhang, T.; Cheng, L.; Cheng, G.; Jin, M. The impact of the neighborhood built environment on the walking activity of older adults: A multi-scale spatial heterogeneity analysis. Sustainability 2022, 14, 13927. [Google Scholar] [CrossRef] [Scilit]
- Qin, Z.; Sha, Z. Optimizing anthropogenic management practices can effectively enhance the vegetation carbon sequestration in China. J. Environ. Manag. 2026, 411, 130196. [Google Scholar] [CrossRef] [Scilit] [PubMed]
- Guo, D.-P.; Han, T.-X.; Yang, F.; Li, Y.-P.; Zhang, J.-F.; Wang, X.-F. Numerical simulation studies of the flow field and pollutant diffusion around street canyons under different thermal stratifications. Atmos. Pollut. Res. 2023, 14, 101829. [Google Scholar] [CrossRef] [Scilit]
- Guo, D.; Zhao, J.; Zhang, Z.; Yang, G.; Li, Y.; Zhang, J.; Wang, X. Large eddy simulation of flow field and pollutant diffusion around buildings with different thermal stratifications. Process Saf. Environ. Prot. 2024, 190, 885–901. [Google Scholar] [CrossRef] [Scilit]
- Feng, L.; Guo, M.; Wang, W.; Chen, Y.; Shi, Q.; Guo, W.; Lou, Y.; Kang, H.; Chen, Z.; Zhu, Y. Comparative analysis of machine learning methods and a physical model for shallow landslide risk modeling. Sustainability 2023, 15, 6. [Google Scholar] [CrossRef] [Scilit]
- Dulebenets, M.A.; Pasha, J.; Kavoosi, M.; Abioye, O.F.; Ozguven, E.E.; Moses, R.; Boot, W.R.; Sando, T. Multiobjective optimization model for emergency evacuation planning in geographical locations with vulnerable population groups. J. Manag. Eng. 2020, 36, 04019043. [Google Scholar] [CrossRef] [Scilit]
- Wang, X.; Guan, M.; Dong, C.; Wang, J.; Fan, Y.; Xin, F.; Lian, G. A multi-indicator evaluation method for spatial distribution of urban emergency shelters. Remote Sens. 2022, 14, 4649. [Google Scholar] [CrossRef] [Scilit]
- Yu, Q.; Yang, Y.; Xiong, X.; Sun, S.; Liu, Y.; Wang, Y. Assessing the impact of multi-dimensional driving behaviors on link-level emissions based on a Portable Emission Measurement System (PEMS). Atmos. Pollut. Res. 2021, 12, 414–424. [Google Scholar] [CrossRef] [Scilit]
- Zhao, X.; Coates, G.; Xu, W. A hierarchical mathematical model of the earthquake shelter location-allocation problem solved using an interleaved MPSO–GA. Geomat. Nat. Hazards Risk 2019, 10, 1712–1737. [Google Scholar] [CrossRef] [Scilit]
- Ahmadi, H.; Jelokhani-Niaraki, M.; Argany, M.; Ghanbari, A. Optimizing locations of emergency medical stations for rural areas: A case study in Iran. Int. J. Disaster Risk Reduct. 2024, 103, 104336. [Google Scholar] [CrossRef] [Scilit]
- Huang, Y.; Yu, D.; Mao, B.; Li, F.; Qu, J. Bioinspired morphology-decoupled soft gripper with enhanced bidirectional grasping capability. Adv. Sci. 2026, 13, e75073. [Google Scholar] [CrossRef] [Scilit] [PubMed]
- Jia, B.; Wang, S.; Huang, Z. A multi-grid descriptor method for 3D digital rock microstructure reconstruction. Comput. Geosci. 2026, 30, 65. [Google Scholar] [CrossRef] [Scilit]
- Amiran, A.; Behnam, B.; Seyedin, S. AI-based model for site-selecting earthquake emergency shelters. Sci. Rep. 2024, 14, 29033. [Google Scholar] [CrossRef] [Scilit] [PubMed]
- Jia, B.; Huang, Z. Thermophysical, multiphase-flow, geochemical, and microbial controls on combined H2–CO2 storage in depleted gas reservoirs and saline aquifers. Fuel 2027, 429, 140747. [Google Scholar] [CrossRef] [Scilit]
- Wang, L.; Zhang, L.; Chen, H.; Zhang, T.; Yi, J.; Zhang, J.; Zhou, T.; Chen, L.; Xu, Y.; Tian, Y.; et al. Combined effects of anchor geometry and soil spatial variability on the probabilistic pullout capacity of helical anchors. Comput. Geotech. 2026, 200, 108482. [Google Scholar] [CrossRef] [Scilit]
- Chen, X.; Huang, L.; Zhou, S.; Xiong, S.; Zhang, Y.; Geng, L.; Tian, H. Superior creep resistance of multiscale architectural titanium matrix composites: Insights from microscale internal stress. Compos. Commun. 2025, 59, 102576. [Google Scholar] [CrossRef] [Scilit]
- Sörensen, K. Metaheuristics—The metaphor exposed. Int. Trans. Oper. Res. 2015, 22, 3–18. [Google Scholar] [CrossRef] [Scilit]
- Wang, X.; Zhang, R.; Wu, L.-Y. Performance evaluation of PBFT-based blockchain via a stage-informed queueing model. J. King Saud Univ. Comput. Inf. Sci. 2026, 38, 507. [Google Scholar] [CrossRef] [Scilit]
- Hua, C.; Ma, W.; Zheng, F.; Zhang, Y.; Xie, J.; Ma, L.; Song, B.; Yan, C.; Li, H.; Liu, Z.; et al. Health risks and sources of trace elements and black carbon in PM2.5 from 2019 to 2021 in Beijing. J. Environ. Sci. 2024, 142, 69–82. [Google Scholar] [CrossRef] [Scilit] [PubMed]
- Wagner, F.; Milojevic-Dupont, N.; Franken, L.; Zekar, A.; Thies, B.; Koch, N.; Creutzig, F. Using explainable machine learning to understand how urban form shapes sustainable mobility. Transp. Res. Part D Transp. Environ. 2022, 111, 103442. [Google Scholar] [CrossRef] [Scilit]
- Li, Y.; Shi, J.; Li, C.; Zhang, K.; Xie, Y.; Zhu, L.; Yu, G.; Liu, B.; Wang, X.; Zhang, G. Synergistic improvement of strength and toughness of zirconia ceramics by introducing zirconia nanofibers. J. Alloys Compd. 2026, 1056, 186592. [Google Scholar] [CrossRef] [Scilit]
- Sowmya, R.; Premkumar, M.; Jangir, P. Newton-Raphson-based optimizer: A new population-based metaheuristic algorithm for continuous optimization problems. Eng. Appl. Artif. Intell. 2024, 128, 107532. [Google Scholar] [CrossRef] [Scilit]
- Luo, H.; Deng, J.; Zhou, J.; Cui, T.; Zhang, Y.; Huang, J.; Fu, L.; Bu, Y.; Wang, R.; Shi, M.; et al. High-accuracy hyperspectro-polarimetric real-time imaging via a deep learning empowered infrared meta-sensor. Light Sci. Appl. 2026, 15, 352. [Google Scholar] [CrossRef] [Scilit] [PubMed]
- Guo, Z.; Xia, Y.; Liu, J.; Gao, J.; Wan, P.; Xu, K. Path planning design and experiment for a recirculating aquaculture AGV based on hybrid NRBO-ACO with dueling DQN. Drones 2025, 9, 476. [Google Scholar] [CrossRef] [Scilit]
- Nguyen, H.D.; Le, P.M.; Truong, K.H. Searching optimal placement and operations of energy storage systems based on equilibrium optimizer. Eng. Technol. Appl. Sci. Res. 2025, 15, 24174–24180. [Google Scholar] [CrossRef] [Scilit]
- Shi, G.; Chen, C.; Cao, Q.; Zhang, J.; Xu, J.; Chen, Y.; Wang, Y.; Liu, J. Spatiotemporal Dynamics and Prediction of Habitat Quality Based on Land Use and Cover Change in Jiangsu, China. Remote Sens. 2024, 16, 4158. [Google Scholar] [CrossRef] [Scilit]
- Ye, D.; Fu, L. Planning of urban public disaster-prevention green spaces: A case study of Living Water Park in Chengdu City. J. Landsc. Res. 2013, 5, 17–20. [Google Scholar] [CrossRef]
- Chen, X.; Deng, Y.; He, J.; Han, M.; Liu, Y.; Wu, X.; Zhen, Z. Blind area and layout optimization of parks based on the spatial supply-demand evaluation in Taiyuan city, China. Chin. J. Appl. Ecol. 2023, 34, 2739–2746. [Google Scholar] [CrossRef] [Scilit] [PubMed]
- He, S.; Wang, T.; Spicer, R.A.; Farnsworth, A.; Mulch, A.; Widdowson, M.; Zhang, Q.; Cai, F.; Valdes, P.J.; Wang, C.; et al. Back to an ice-free future: Early Cretaceous seasonal cycles of sea surface temperature and glacier ice. Sci. Adv. 2025, 11, eadr9417. [Google Scholar] [CrossRef] [Scilit] [PubMed]
- Guo, D.; Zhao, P.; Wang, R.; Yao, R.; Hu, J. Numerical simulations of the flow field and pollutant dispersion in an idealized urban area under different atmospheric stability conditions. Process Saf. Environ. Prot. 2020, 136, 310–323. [Google Scholar] [CrossRef] [Scilit]
- Huang, X.; Kang, N.; Wang, Q.; El Mansori, M.; Guittonneau, F. Wear of directed energy deposited H13 steel as a function of its graded microstructure. Tribol. Int. 2025, 207, 110617. [Google Scholar] [CrossRef] [Scilit]
- Wang, Z.; Cao, K. An intelligent site selection approach for public service facilities coupled with improved graph attention network and deep reinforcement learning. J. Geo-Inf. Sci. 2024, 26, 2452–2464. [Google Scholar] [CrossRef]
- Akar, A.; Akar, Ö.; Konakoğlu, B. Analysis of emergency assembly points for post-earthquake disaster management: A case study of Erzincan, Türkiye. Nat. Hazards 2024, 120, 11791–11824. [Google Scholar] [CrossRef] [Scilit]
- Jin, J.G.; Shen, Y.; Hu, H.; Fan, Y.; Yu, M. Optimizing underground shelter location and mass pedestrian evacuation in urban community areas: A case study of Shanghai. Transp. Res. Part A Policy Pract. 2021, 149, 124–138. [Google Scholar] [CrossRef] [Scilit]
- Zheng, Y.; Ye, R.; Hong, X.; Tao, Y.; Li, Z. What factors revitalize the street vitality of old cities? A case study in Nanjing, China. ISPRS Int. J. Geo-Inf. 2024, 13, 282. [Google Scholar] [CrossRef] [Scilit]
- Hu, X.; Zhu, W.; Shen, X.; Bai, R.; Shi, Y.; Li, C.; Zhao, L. Exploring the predictive ability of the CA–Markov model for urban functional area in Nanjing old city. Sci. Rep. 2024, 14, 18453. [Google Scholar] [CrossRef] [Scilit] [PubMed]
- Chen, P.; Nie, X.; Ning, Y.; Zhang, Y. Learning efficient and adaptive cross-channel dependencies for weakly-supervised object detection. IEEE Trans. Multimed. 2025, 27, 8954–8966. [Google Scholar] [CrossRef] [Scilit]
- Gong, Z.; Wang, L.; Yang, J.; Wang, Y.; Zhang, L. Urban flood risk assessment and optimization of shelter site selection following a pre-expropriation system. Nat. Hazards Rev. 2025, 26, 04025013. [Google Scholar] [CrossRef] [Scilit]
- Jiao, Y.; Li, Z.; Ge, W.; Jing, L.; Wu, M.; Wang, T.; Sun, H.; Wang, J.; Zhang, X.; van Gelder, P. A study on siting of emergency shelters for dam failure floods considering population distribution and weather effects. Sci. Total Environ. 2024, 914, 169901. [Google Scholar] [CrossRef] [Scilit] [PubMed]
- Bakhshi Lomer, A.R.; Rezaeian, M.; Rezaei, H.; Lorestani, A.; Mijani, N.; Mahdad, M.; Raeisi, A.; Arsanjani, J.J. Optimizing emergency shelter selection in earthquakes using a risk-driven large group decision-making support system. Sustainability 2023, 15, 4019. [Google Scholar] [CrossRef] [Scilit]
- Geng, S.; Hou, H.; Zhou, Z. A dynamic multi-objective model for emergency shelter relief system design integrating the supply and demand sides. Nat. Hazards 2024, 120, 2379–2402. [Google Scholar] [CrossRef] [Scilit]
- Liu, S.; Zhang, J.; Lin, Z.; Wang, J. Assessment of rockburst proneness in thermally-damaged fractured granite: A quantitative analysis of energy evolution and strain localization intensity. Theor. Appl. Fract. Mech. 2026, 145, 105677. [Google Scholar] [CrossRef] [Scilit]
- Weng, Y.; Yang, K.; Liu, Z.; He, W.; Tang, X. LGVLM-mIoT: A lightweight generative visual-language model for multilingual IoT applications. IEEE Internet Things J. 2025, 12, 13311–13326. [Google Scholar] [CrossRef] [Scilit]
- Alawi, M.; Chu, D. Assessing and enhancing public space resilience to pandemics and earthquakes: A case study of Chongqing, China. Nat. Hazards 2025, 121, 2023–2052. [Google Scholar] [CrossRef] [Scilit]
- Nayyeri, H.; Zandi, S.; Souri, M. Location of disaster management bases using spatial analysis. J. Syst. Sci. Syst. Eng. 2024, 33, 1–29. [Google Scholar] [CrossRef] [Scilit]
- Wu, J.; Wei, Z.; Liu, C.; Ma, Q.; Wei, Z.; Cui, T.; Li, Q.; Wu, X.; Ye, J.; Wu, S.; et al. Ad-SACNet: Spatial attention compression network for atmospheric duct inversion with radar sea clutter data. IEEE Trans. Antennas Propag. 2026, 74, 7967–7981. [Google Scholar] [CrossRef] [Scilit]
- Bao, N.; Chen, J.; Wang, G.; Sun, R.; Yan, K. Pseudo-dynamic lateral earth pressure on stabilizing piles in sandy slopes considering arching effect. J. Rock Mech. Geotech. Eng. 2026, in press. [Google Scholar] [CrossRef] [Scilit]
- Zhang, T.; Wang, L.; Chen, L.; Lu, W.; Hao, D.; Shao, W.; Zhang, C.; Tian, Y. Numerical analysis of post-cyclic ultimate bearing capacity of helical anchors in clay. Ocean Eng. 2026, 352, 124583. [Google Scholar] [CrossRef] [Scilit]
- Mou, X.; Fan, J.; Zhang, J.; Duan, P. Porosity-driven aerothermal-mechanical coupling for high-performance transpiration-cooled turbine blades. Case Stud. Therm. Eng. 2026, 85, 108359. [Google Scholar] [CrossRef] [Scilit]
- Liu, W.; Zhu, L.; Huo, X.-J.; Ma, X.-W.; Li, J.-H.; Cheng, X.-X. Shape-finding for a triple-tower spatial double-cable suspension bridge with upper hangers. Eng. Struct. 2026, 366, 123403. [Google Scholar] [CrossRef] [Scilit]
- Zhou, A.; Zhang, J.; Zhang, Y.; Fu, X. Study on the emergency shelter accessibility and distribution in Beijing based on the GIS. Bull. Surv. Mapp. 2016, 111–114. [Google Scholar] [CrossRef]
- Li, S.; He, Y.; Liu, N.; Huang, Y.; Pi, M.; Yao, J.; Fu, W.; Zhang, D.; Xu, H.; Cheng, Z. Photoinduced anion exchange for spatially patterned perovskite ASE: Enabling full-color pixelated lasing displays. Sci. Adv. 2026, 12, eaef5186. [Google Scholar] [CrossRef] [Scilit] [PubMed]
- Lu, W.; Wang, F.; Liu, L.; Hu, G.; Mao, J. Pedestrian–bus route and pickup location planning for emergency evacuation. Transport 2021, 36, 176–184. [Google Scholar] [CrossRef] [Scilit]
- Dai, Q.; Huang, Z.; Ma, Y.; Chen, H.; Liang, S.; Li, N.; Gachot, C.; Hu, C.; Huang, W.; Wang, X. Enhancing the heat mitigation, vibration damping, and anti-wear performances of aviation gears via tailored surface texturing. Tribol. Int. 2027, 226, 112488. [Google Scholar] [CrossRef] [Scilit]
- Zhang, Z.; Xu, C.; Ma, C. Efficient multi-designated receiver authenticated broadcast encryption for group messaging. IEEE Trans. Netw. 2026, 34, 3449–3459. [Google Scholar] [CrossRef] [Scilit]
- Wang, W.-L.; Wan, F.-F.; Lo, S.-M. Game theory model of exit selection in pedestrian evacuation considering visual range and choice firmness. Chin. Phys. B 2020, 29, 084502. [Google Scholar] [CrossRef] [Scilit]
- Cao, K.; Liu, M.; Wang, S.; Liu, M.; Zhang, W.; Meng, Q.; Huang, B. Spatial multi-objective land use optimization toward livability based on boundary-based genetic algorithm: A case study in Singapore. ISPRS Int. J. Geo-Inf. 2020, 9, 40. [Google Scholar] [CrossRef] [Scilit]
- Guo, J.; Li, J. Efficiency evaluation and influencing factors of energy saving and emission reduction: An empirical study of China’s three major urban agglomerations from the perspective of environmental benefits. Ecol. Indic. 2021, 133, 108410. [Google Scholar] [CrossRef] [Scilit]
- Huang, X.; Gao, L.; Guo, D.; Yao, R. Impacts of high-rise building on urban airflows and pollutant dispersion under different temperature stratifications: Numerical investigations. Atmos. Pollut. Res. 2021, 12, 100–112. [Google Scholar] [CrossRef] [Scilit]
- Samany, N.N.; Sheybani, M.; Zlatanova, S. Detection of safe areas in flood as emergency evacuation stations using modified particle swarm optimization with local search. Appl. Soft Comput. 2021, 111, 107681. [Google Scholar] [CrossRef] [Scilit]
- Zhang, Y.; Liu, F.; Zhou, H.; Chen, J.; Jiang, L.; Yan, C.; Li, X.; Xue, D.; Wang, J. Long-Term Oral Exposure to Chlorophenylacetonitrile Induces Gastrointestinal Morphological Alterations and Splenic Transcriptomic Reprogramming in Mice. Toxics 2026, 14, 647. [Google Scholar] [CrossRef] [Scilit] [PubMed]
- Ren, X.; Wen, Y.; He, Q.; Cui, Y.; Gao, X.; Li, F.; Wang, Y.; Guo, L.; Li, H.; Wang, X. Higher contribution of coking sources to ozone formation potential from volatile organic compounds in summer in Taiyuan, China. Atmos. Pollut. Res. 2021, 12, 101083. [Google Scholar] [CrossRef] [Scilit]
- Gao, M.; Zhou, S.; Gu, W.; Fan, J.; Guan, A.; Zhu, H. Enhancing distribution system state estimation under limited measurements: Leveraging large language model and multimodal information. CSEE J. Power Energy Syst. 2026, 12, 622–631. [Google Scholar] [CrossRef] [Scilit]
- Bera, S.; Gnyawali, K.; Dahal, K.; Melo, R.; Li-Juan, M.; Guru, B.; Ramana, G.V. Assessment of shelter location-allocation for multi-hazard emergency evacuation. Int. J. Disaster Risk Reduct. 2023, 84, 103435. [Google Scholar] [CrossRef] [Scilit]
- Liu, S.; Lin, R.; Jia, Y.; Wu, Q.; Chen, C. Competitive crack evolution in flawed rocks under thermal–mechanical coupling: A tangential stress and displacement decomposition approach. J. Rock Mech. Geotech. Eng. 2026, in press. [Google Scholar] [CrossRef] [Scilit]
- Wang, L.; Zhang, B.; Li, Y.; Liu, B.; Tong, C.; Xiong, H.; Chen, G.; Hong, Z.; Zhang, C.; Tian, Y. Uplift resistance mechanism of pipes in lightweight backfill material of ceramsite. Comput. Geotech. 2026, 192, 107927. [Google Scholar] [CrossRef] [Scilit]
- Zhong, Y.; Li, Y.; He, L.; Tang, Y.; Yang, Z.; Yu, X.; Zhang, J.; Li, W. Heavy-metal-free ZnSeTe quantum dots-based liquid scintillators for scalable X-ray imaging. Small 2026, 22, e13925. [Google Scholar] [CrossRef] [Scilit] [PubMed]
- He, Y.; Liu, X.; Yang, R.; Chen, Q.; Deng, B.; Jin, M.; Wang, F. Deblur of infrared thermal images of in-service wind turbine blade based on rotational motion flow. Measurement 2026, 287, 122462. [Google Scholar] [CrossRef] [Scilit]
- Hu, P.; Zhang, R.; Chen, L.; Li, L.; Tang, Q.; Hewitt, A.J. Atomization index to bridge the physicochemical properties of polymer–surfactant adjuvants and multivariate spray metrics: Guiding pesticide formulation efficient design. Engineering 2026, in press. [Google Scholar] [CrossRef] [Scilit]
- Li, H.; Gao, P.; Tan, H.; Li, H.; Zhu, H.; Jiang, M.; Ni, Y.; He, Y.; Huang, J.; Zhu, Y.; et al. Interaction-aware dexterous robot for minimally invasive transcanal inner ear interventions. Nat. Commun. 2026, 17, 5658. [Google Scholar] [CrossRef] [Scilit] [PubMed]
- Lin, W.; Wang, Y.; Zhang, Q.; Peron, M.; Lu, J. Emerging opportunities or paradoxes: Assessing the effect of digital technology adoption on corporate carbon performance. J. Environ. Manag. 2025, 391, 126399. [Google Scholar] [CrossRef] [Scilit] [PubMed]
- Cetin, M.; Kaya, A.Y.; Elmastas, N.; Adiguzel, F.; Siyavus, A.E.; Kocan, N. Assessment of emergency gathering points and temporary shelter areas for disaster resilience in Elazıg, Turkey. Nat. Hazards 2024, 120, 1925–1949. [Google Scholar] [CrossRef] [Scilit]
- Lv, J.; Wang, C.; Xie, L. Adaptive distributed observer design for nonlinear multiagent systems. Automatica 2026, 183, 112625. [Google Scholar] [CrossRef] [Scilit]
- Yang, G.Q.; Li, M.; Guo, P. Monte Carlo-based agricultural water management under uncertainty: A case study of Shijin irrigation district, China. J. Environ. Inform. 2022, 39, 152. [Google Scholar] [CrossRef] [Scilit]
- Yan, Y.; He, Q.; Song, Q.; Guo, L.; He, Q.; Wang, X. Exposure to hazardous air pollutants in underground car parks in Guangzhou, China. Air Qual. Atmos. Health 2017, 10, 555–563. [Google Scholar] [CrossRef] [Scilit]
- Zhou, C. Toward Human-AI collaboration for sustainable development: Unveiling the drives of artificial intelligence adoption in environmental governance. Sustain. Dev. 2026, 34, 1–14. [Google Scholar] [CrossRef] [Scilit]
- Qi, Y.; Hu, Z.; Lu, H.; Xie, P.; Tang, Z.; Wang, J.; Chen, F.; Han, C.; Li, W. Magneto-electric coupling effects enable structurally and electrochemically stable interface for long-lasting anode-free sodium metal batteries. Nano Lett. 2026, 26, 6972–6982. [Google Scholar] [CrossRef] [Scilit] [PubMed]
- Ren, M.; Guo, L.; Cui, Y.; He, Q.; Ji, D.; Wang, Y. Characteristics, regional transport and control strategies of atmospheric ammonia in urban Taiyuan, Fenwei Plain, China. Atmos. Pollut. Res. 2025, 16, 102505. [Google Scholar] [CrossRef] [Scilit]
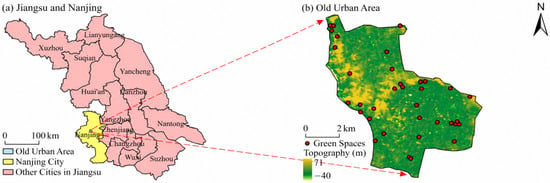
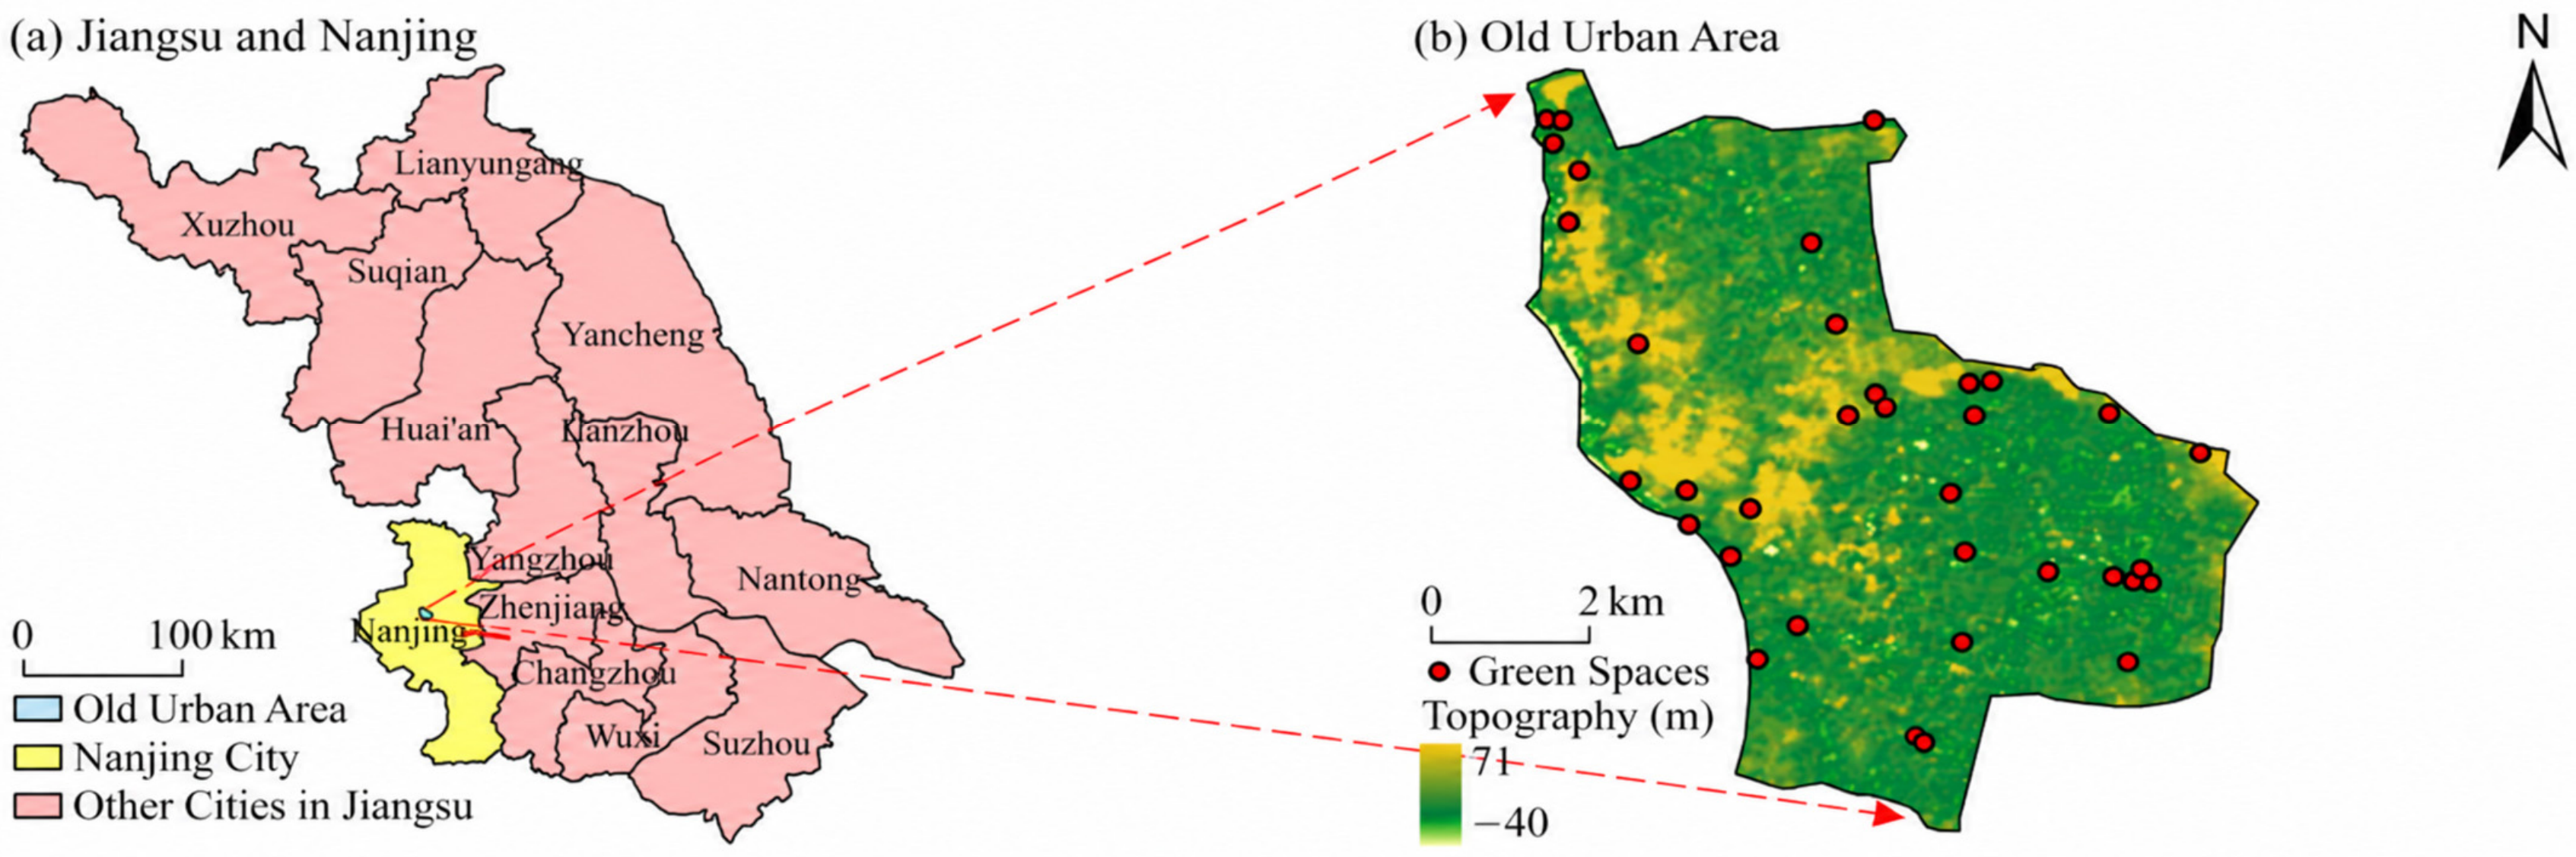
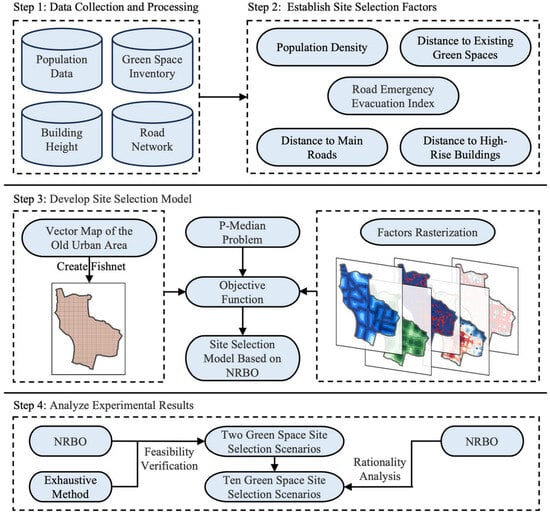
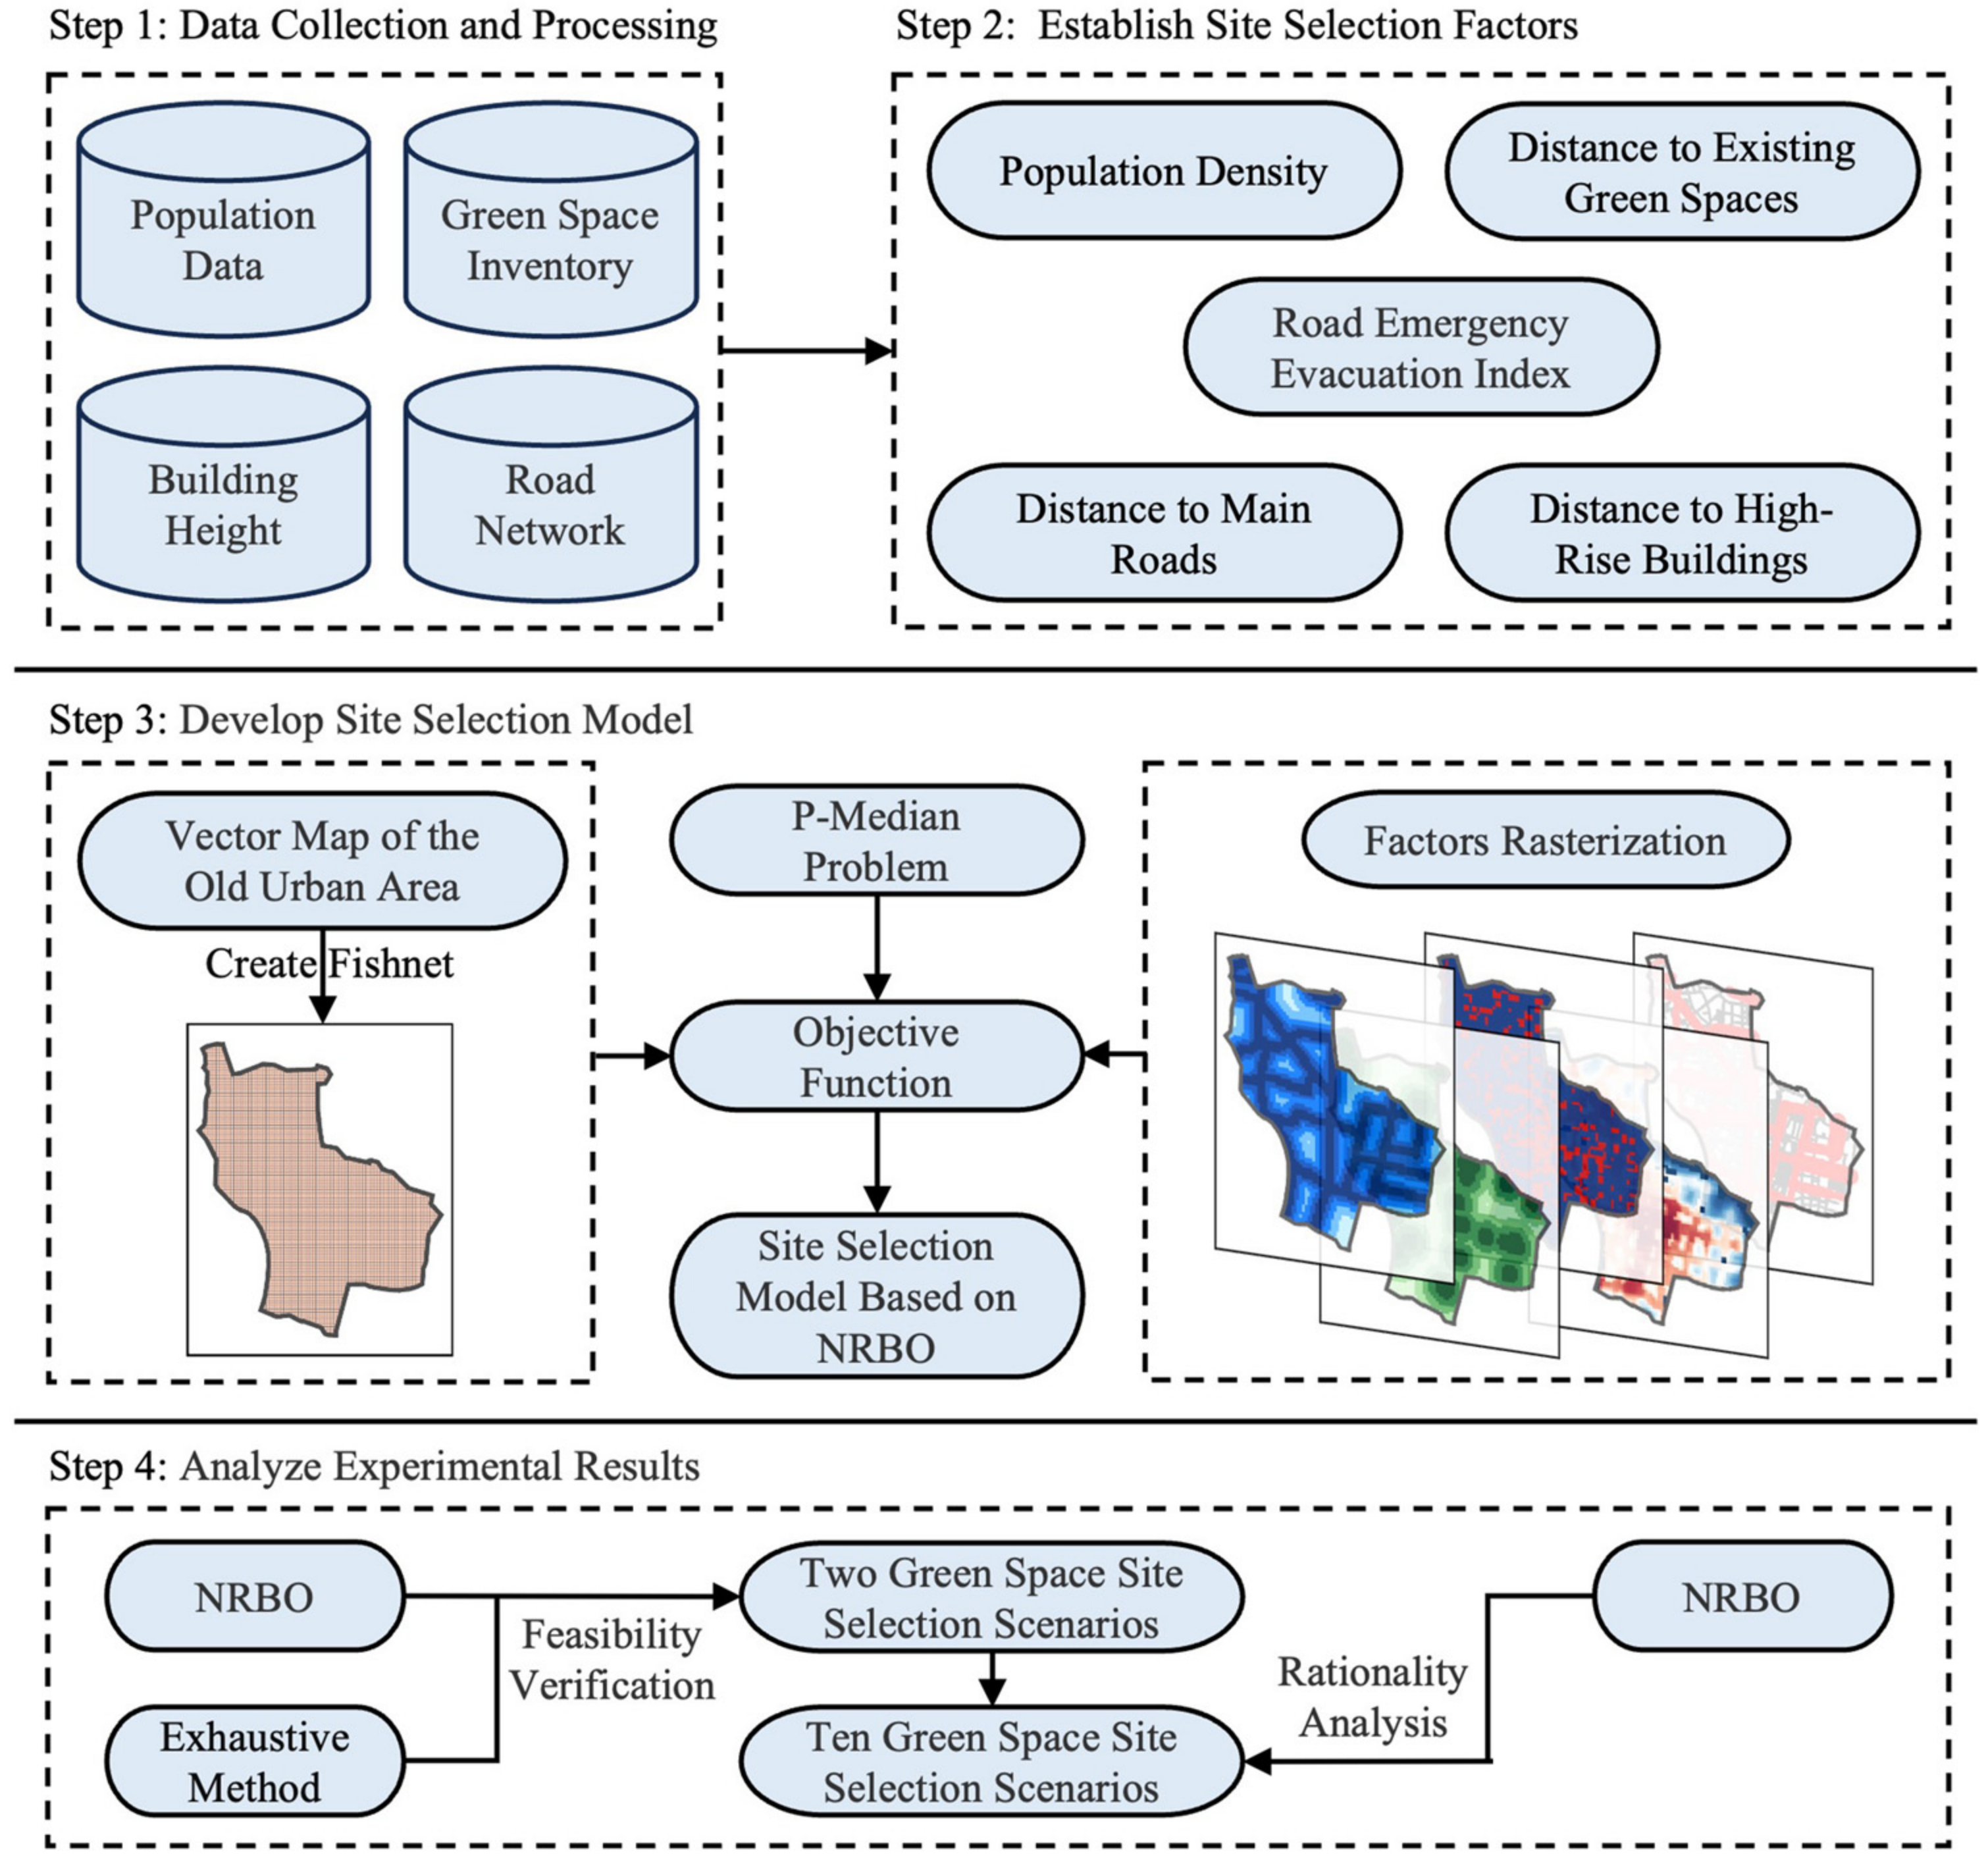
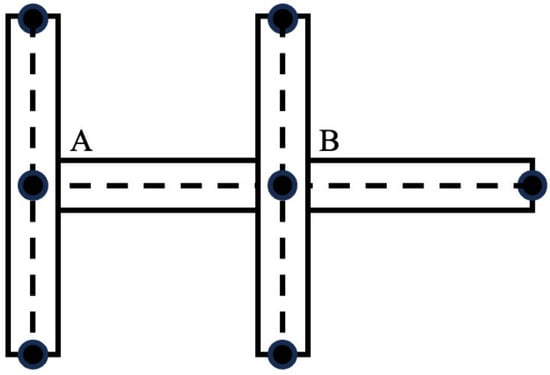
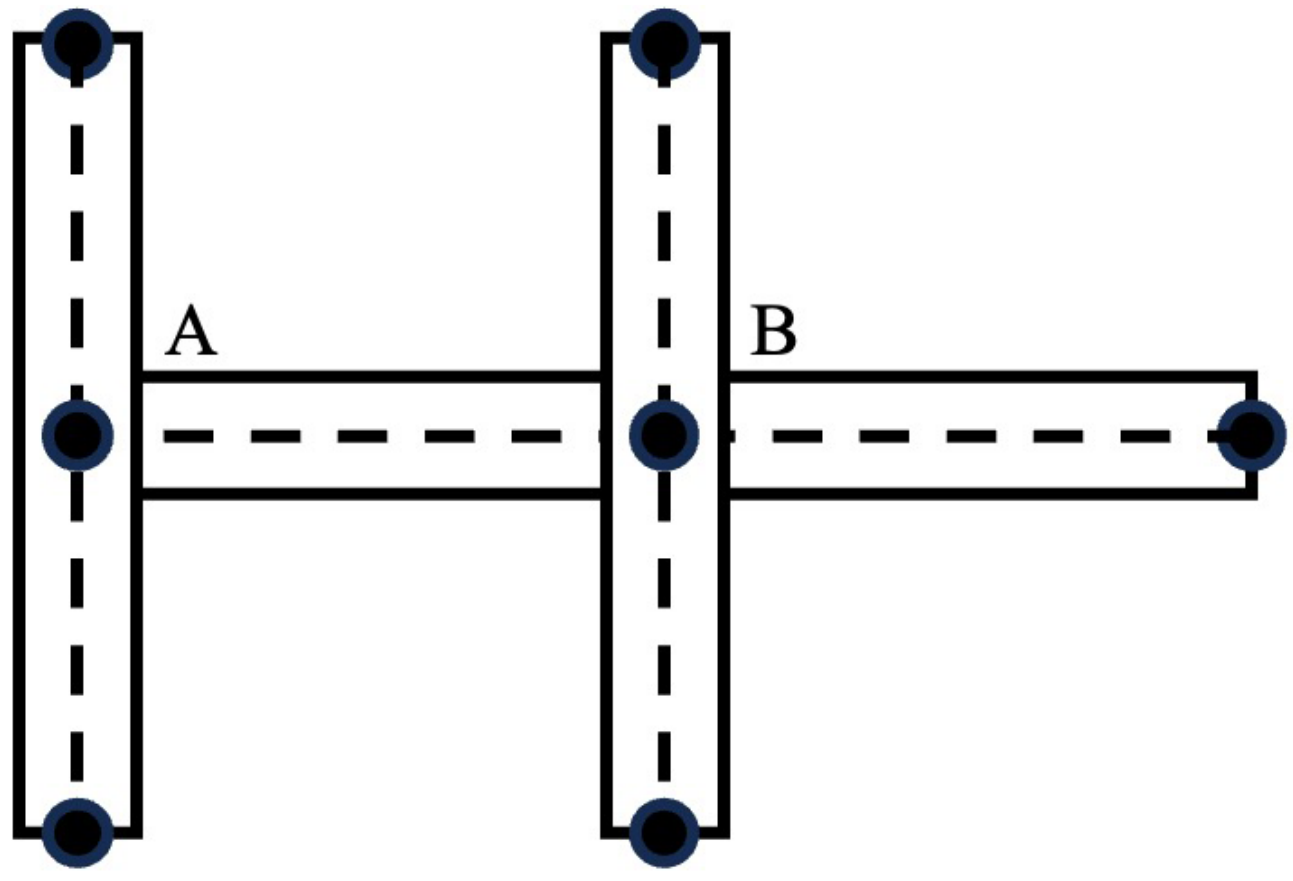
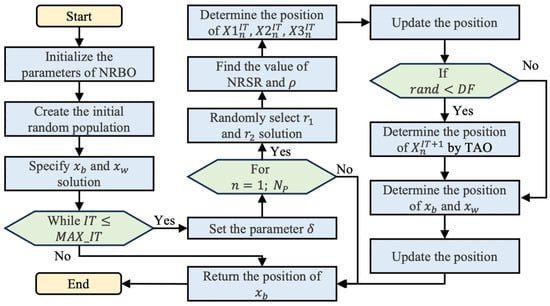
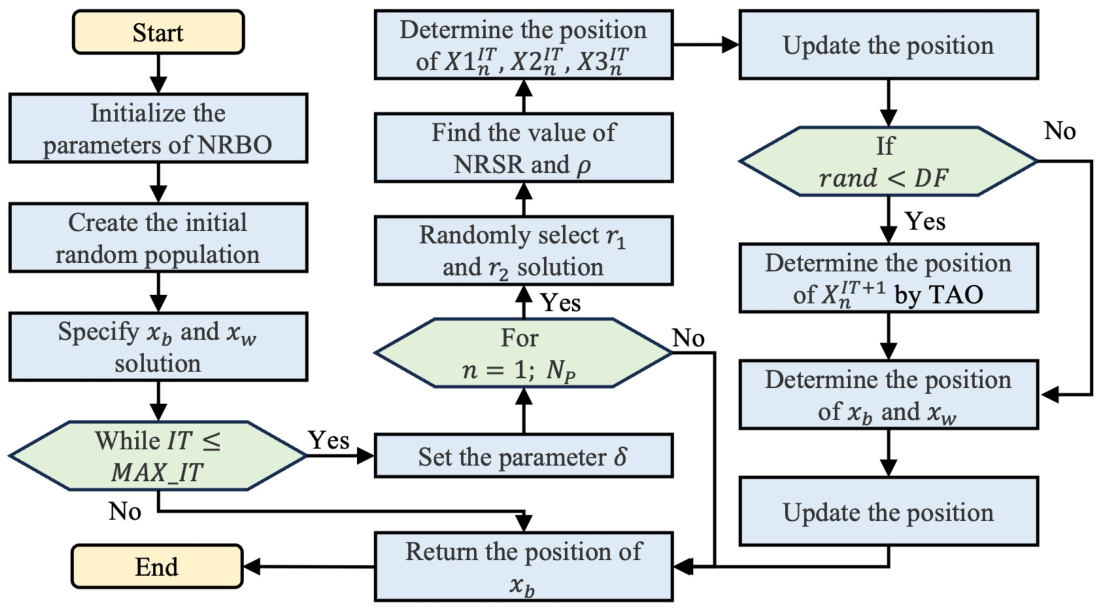
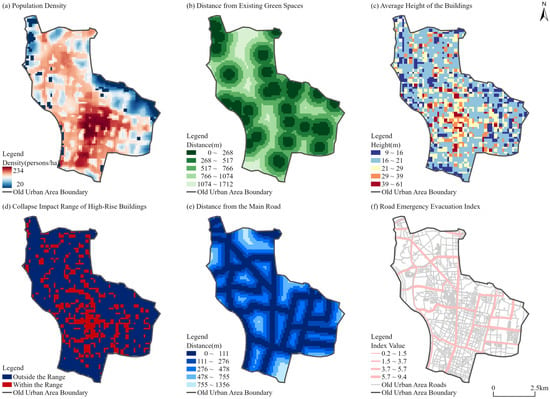
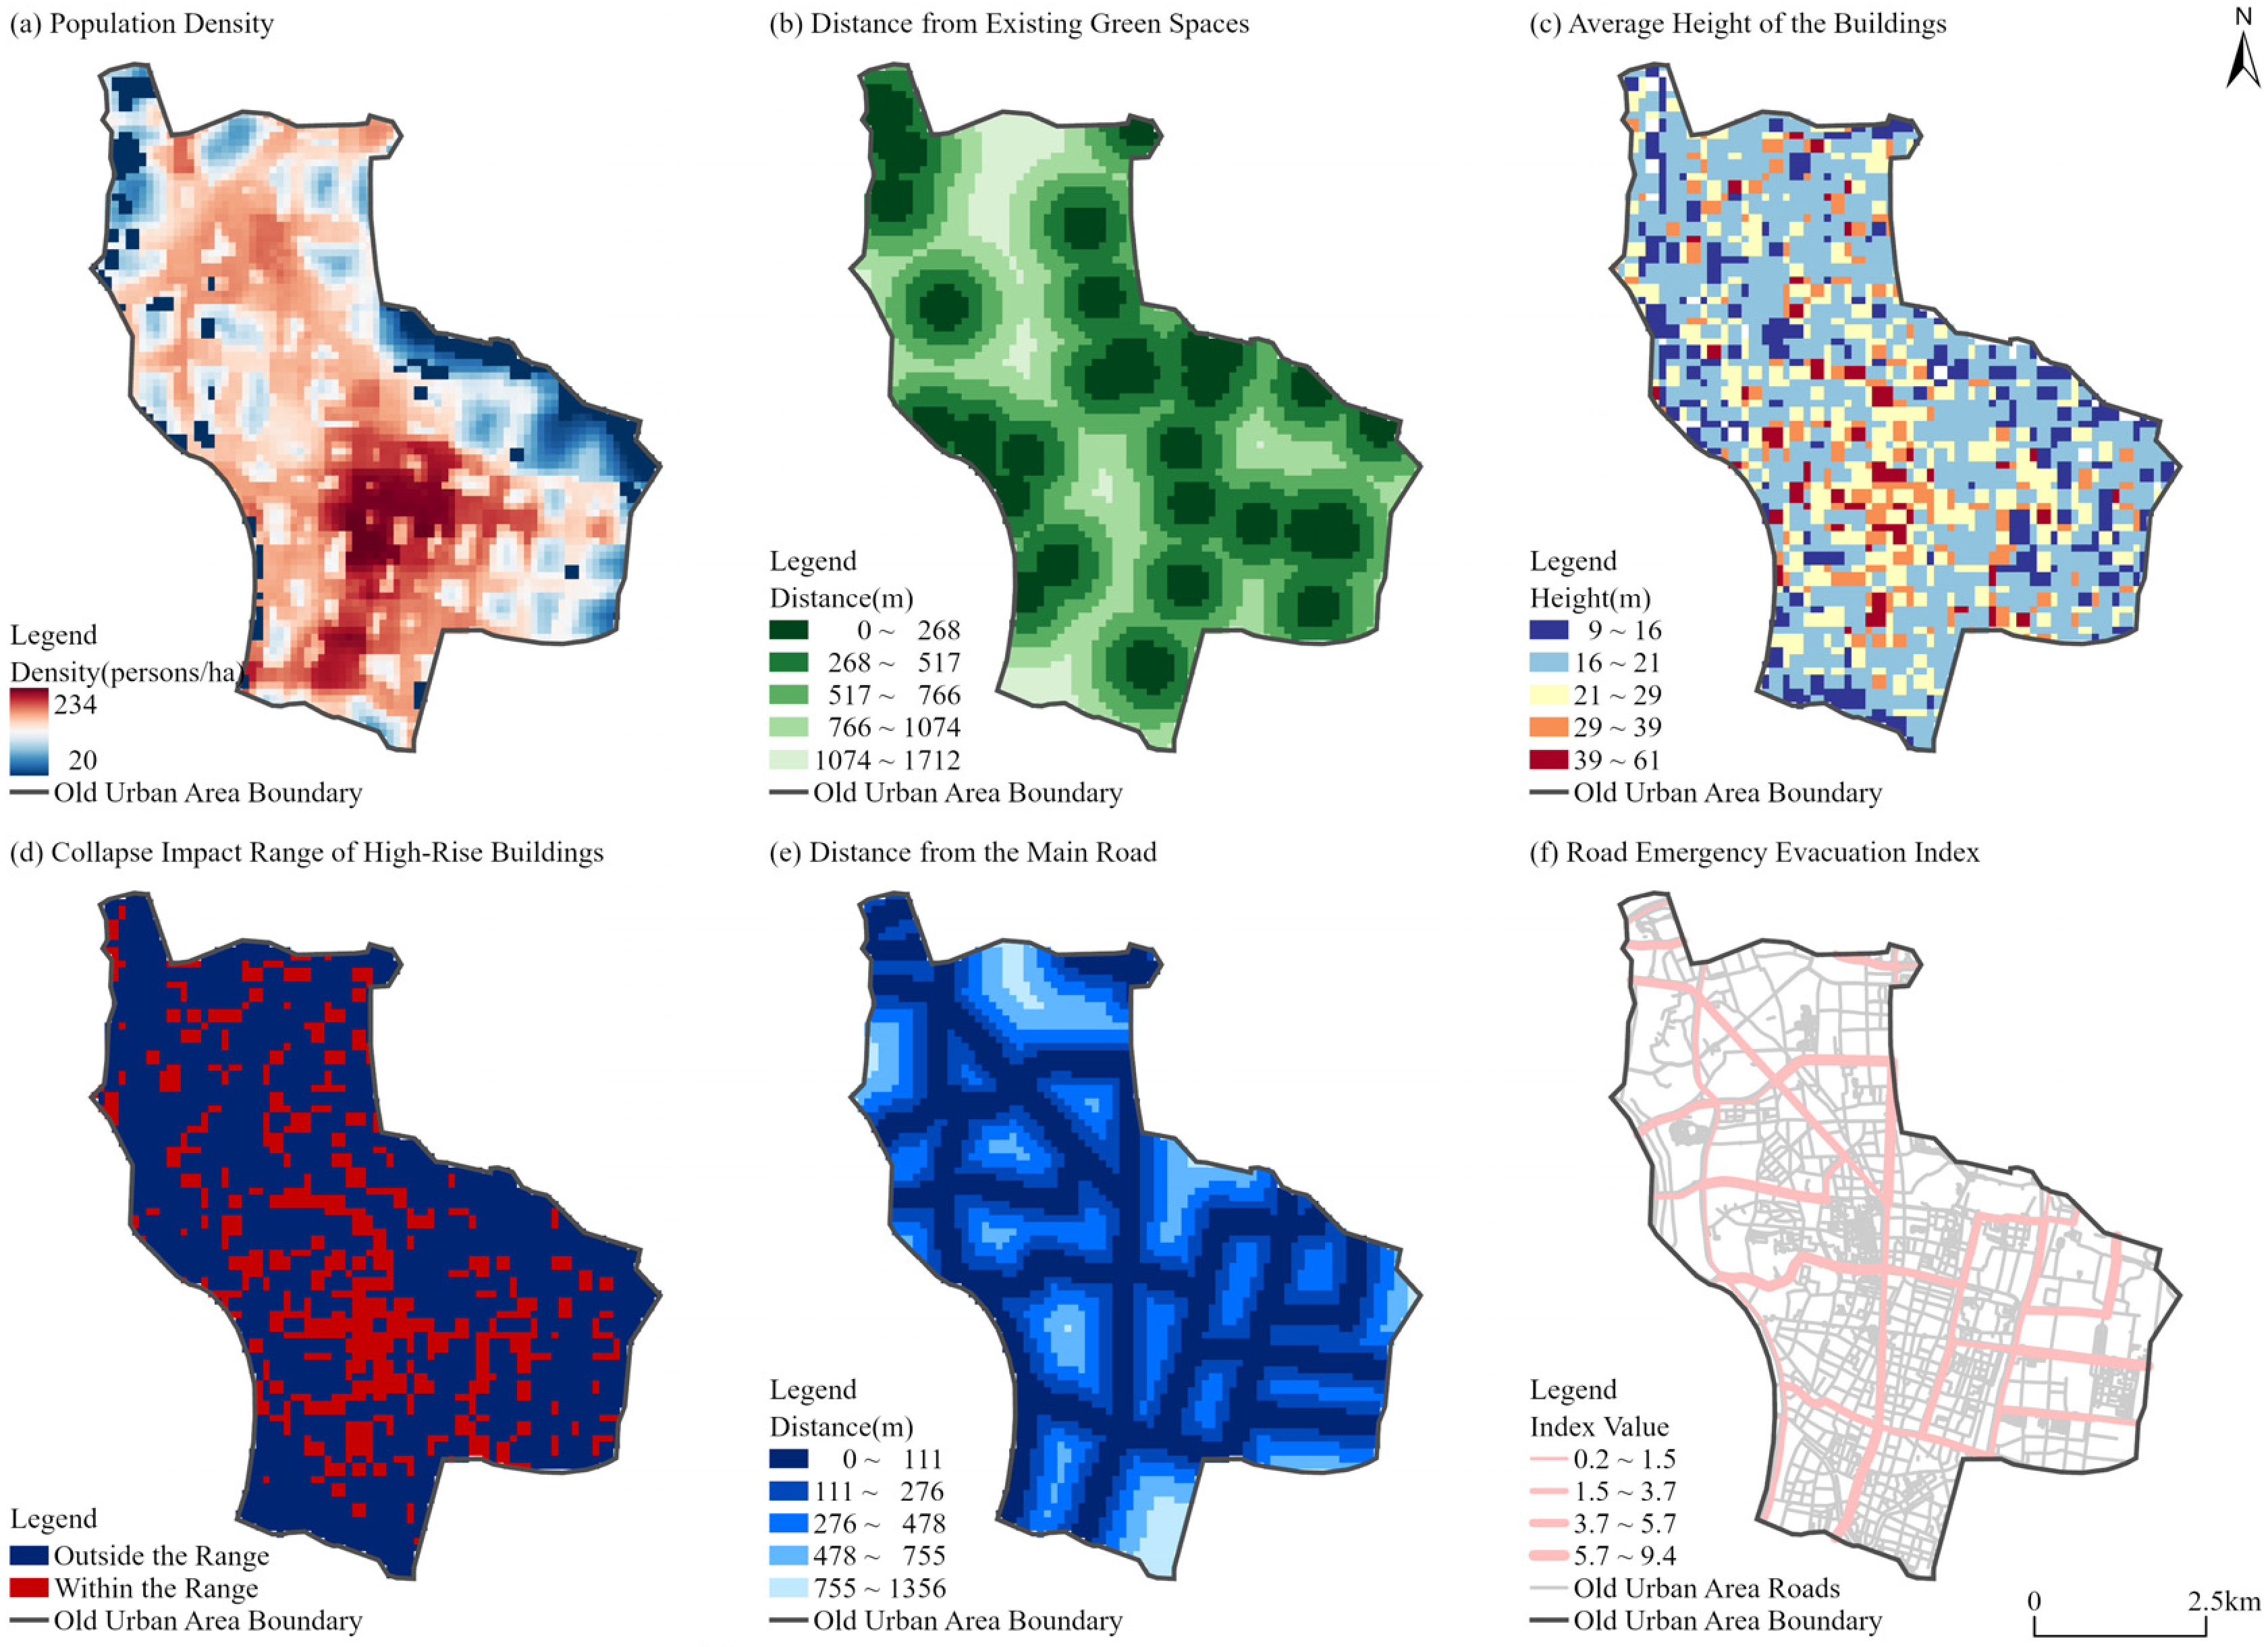
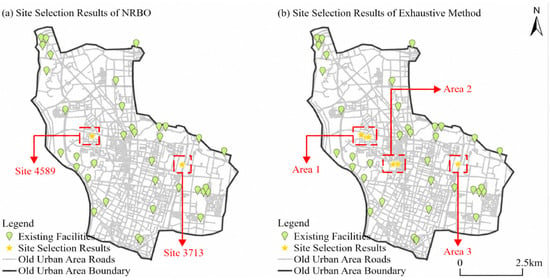
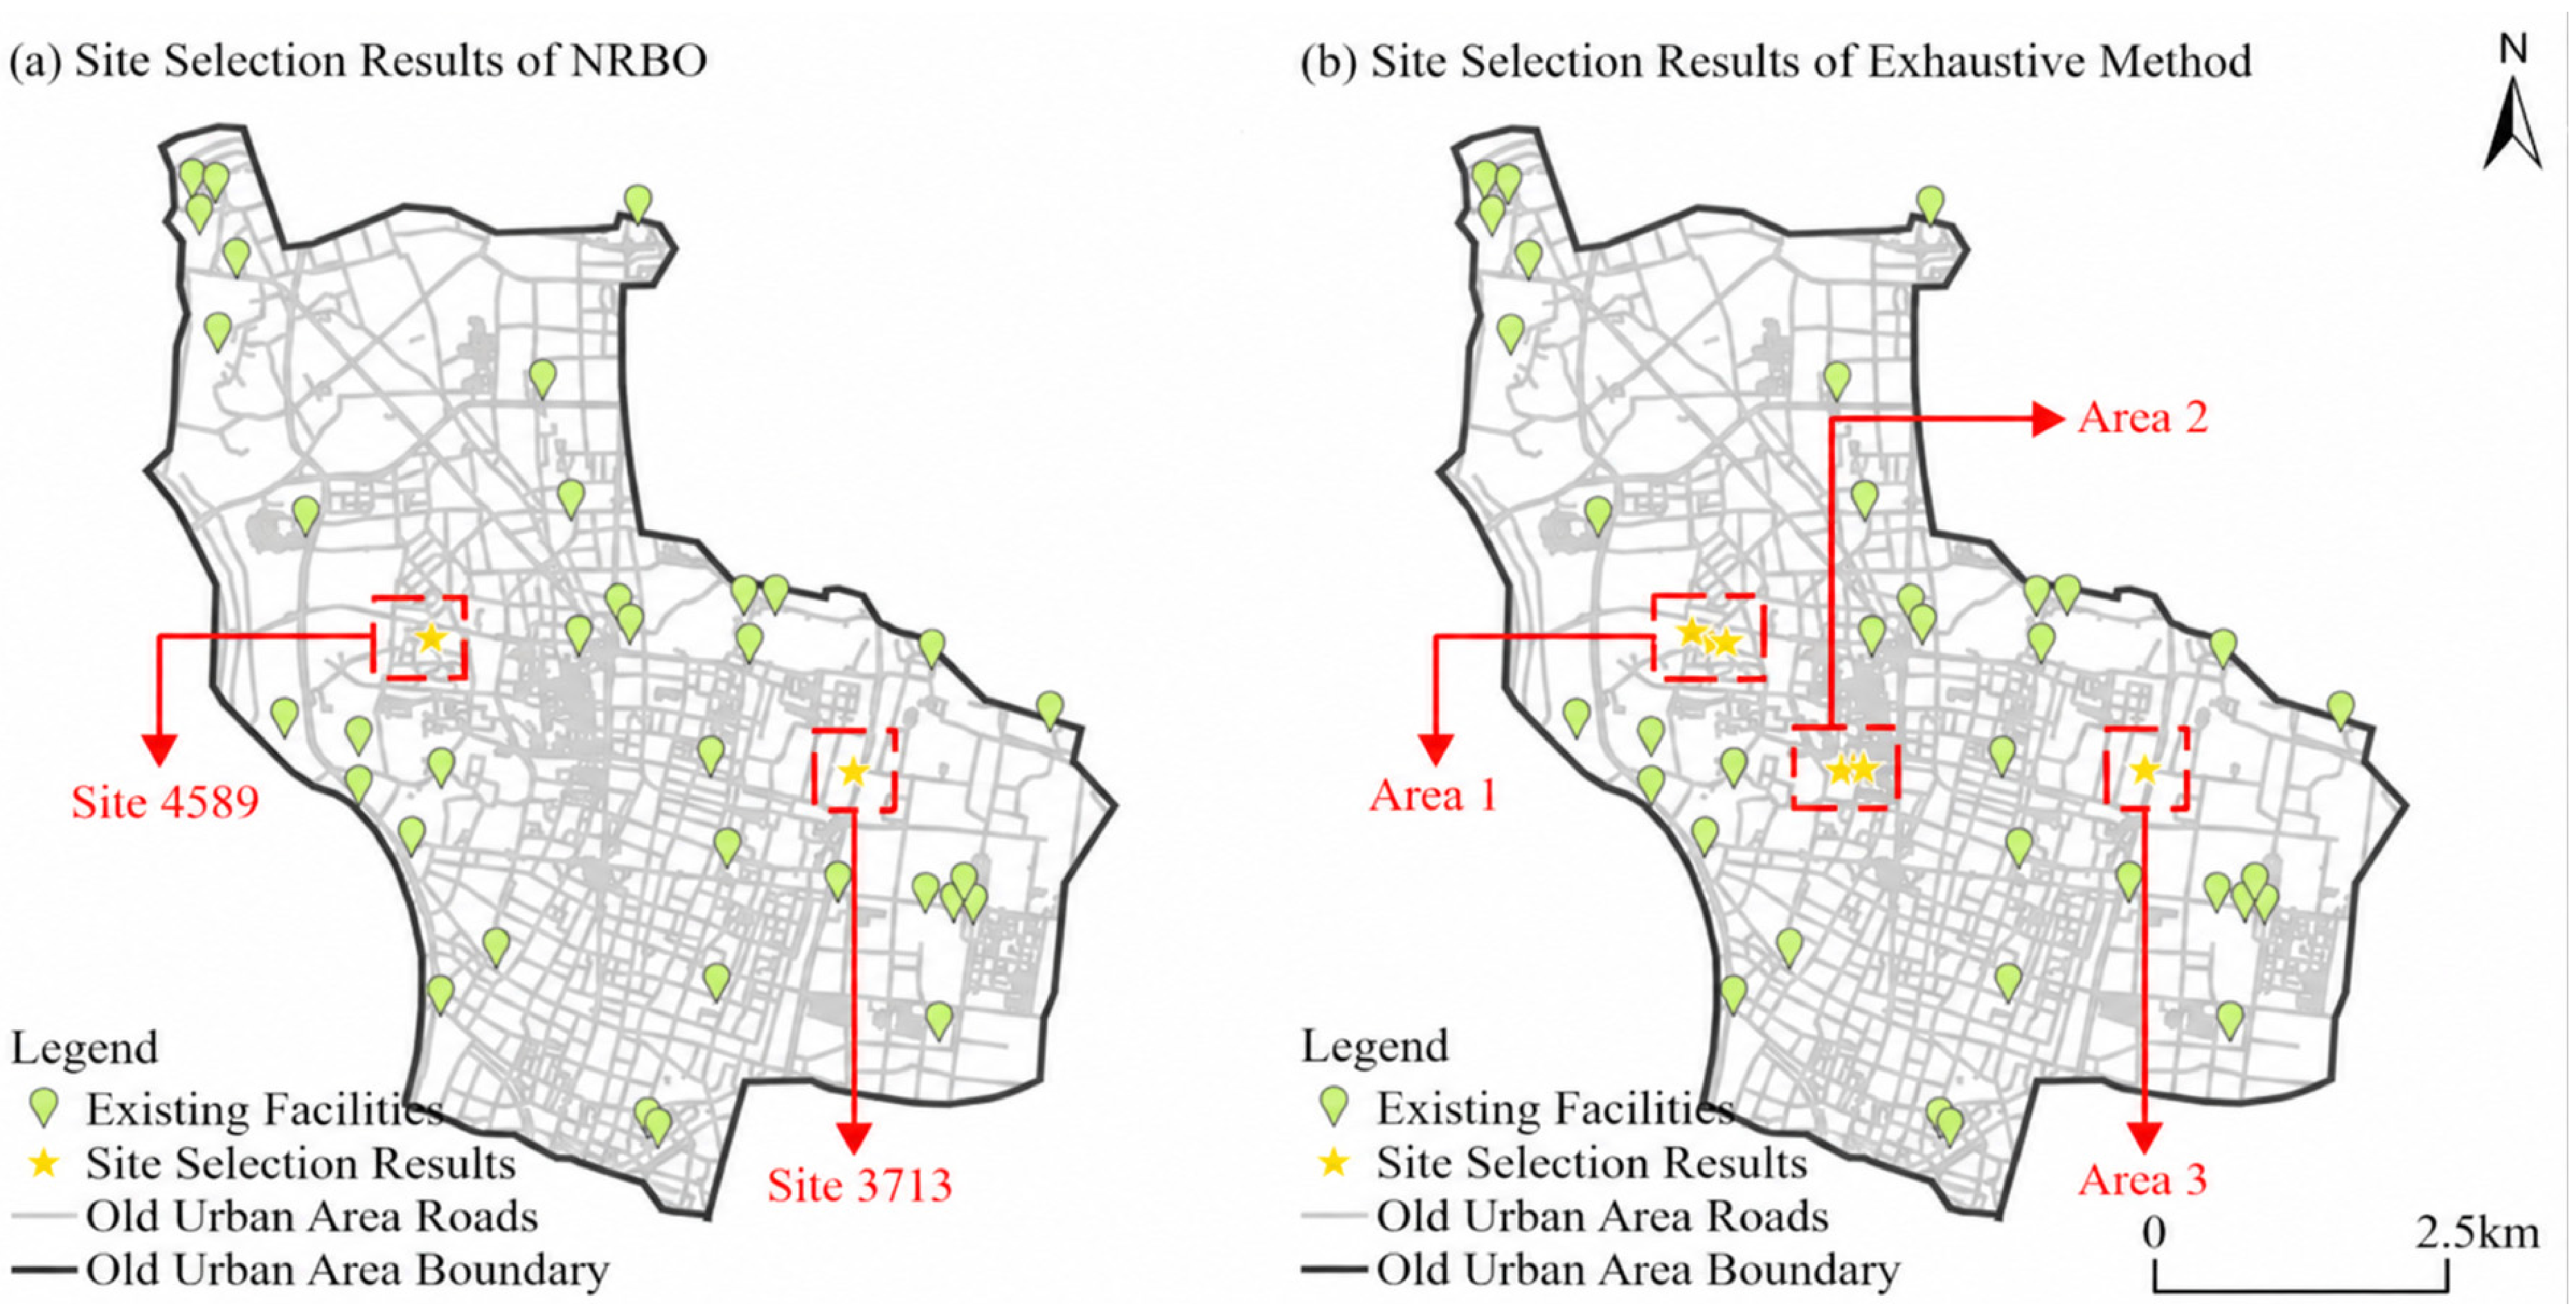
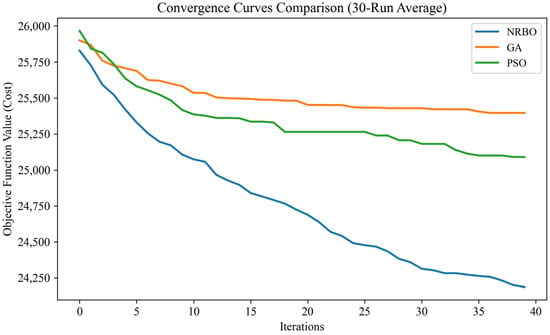
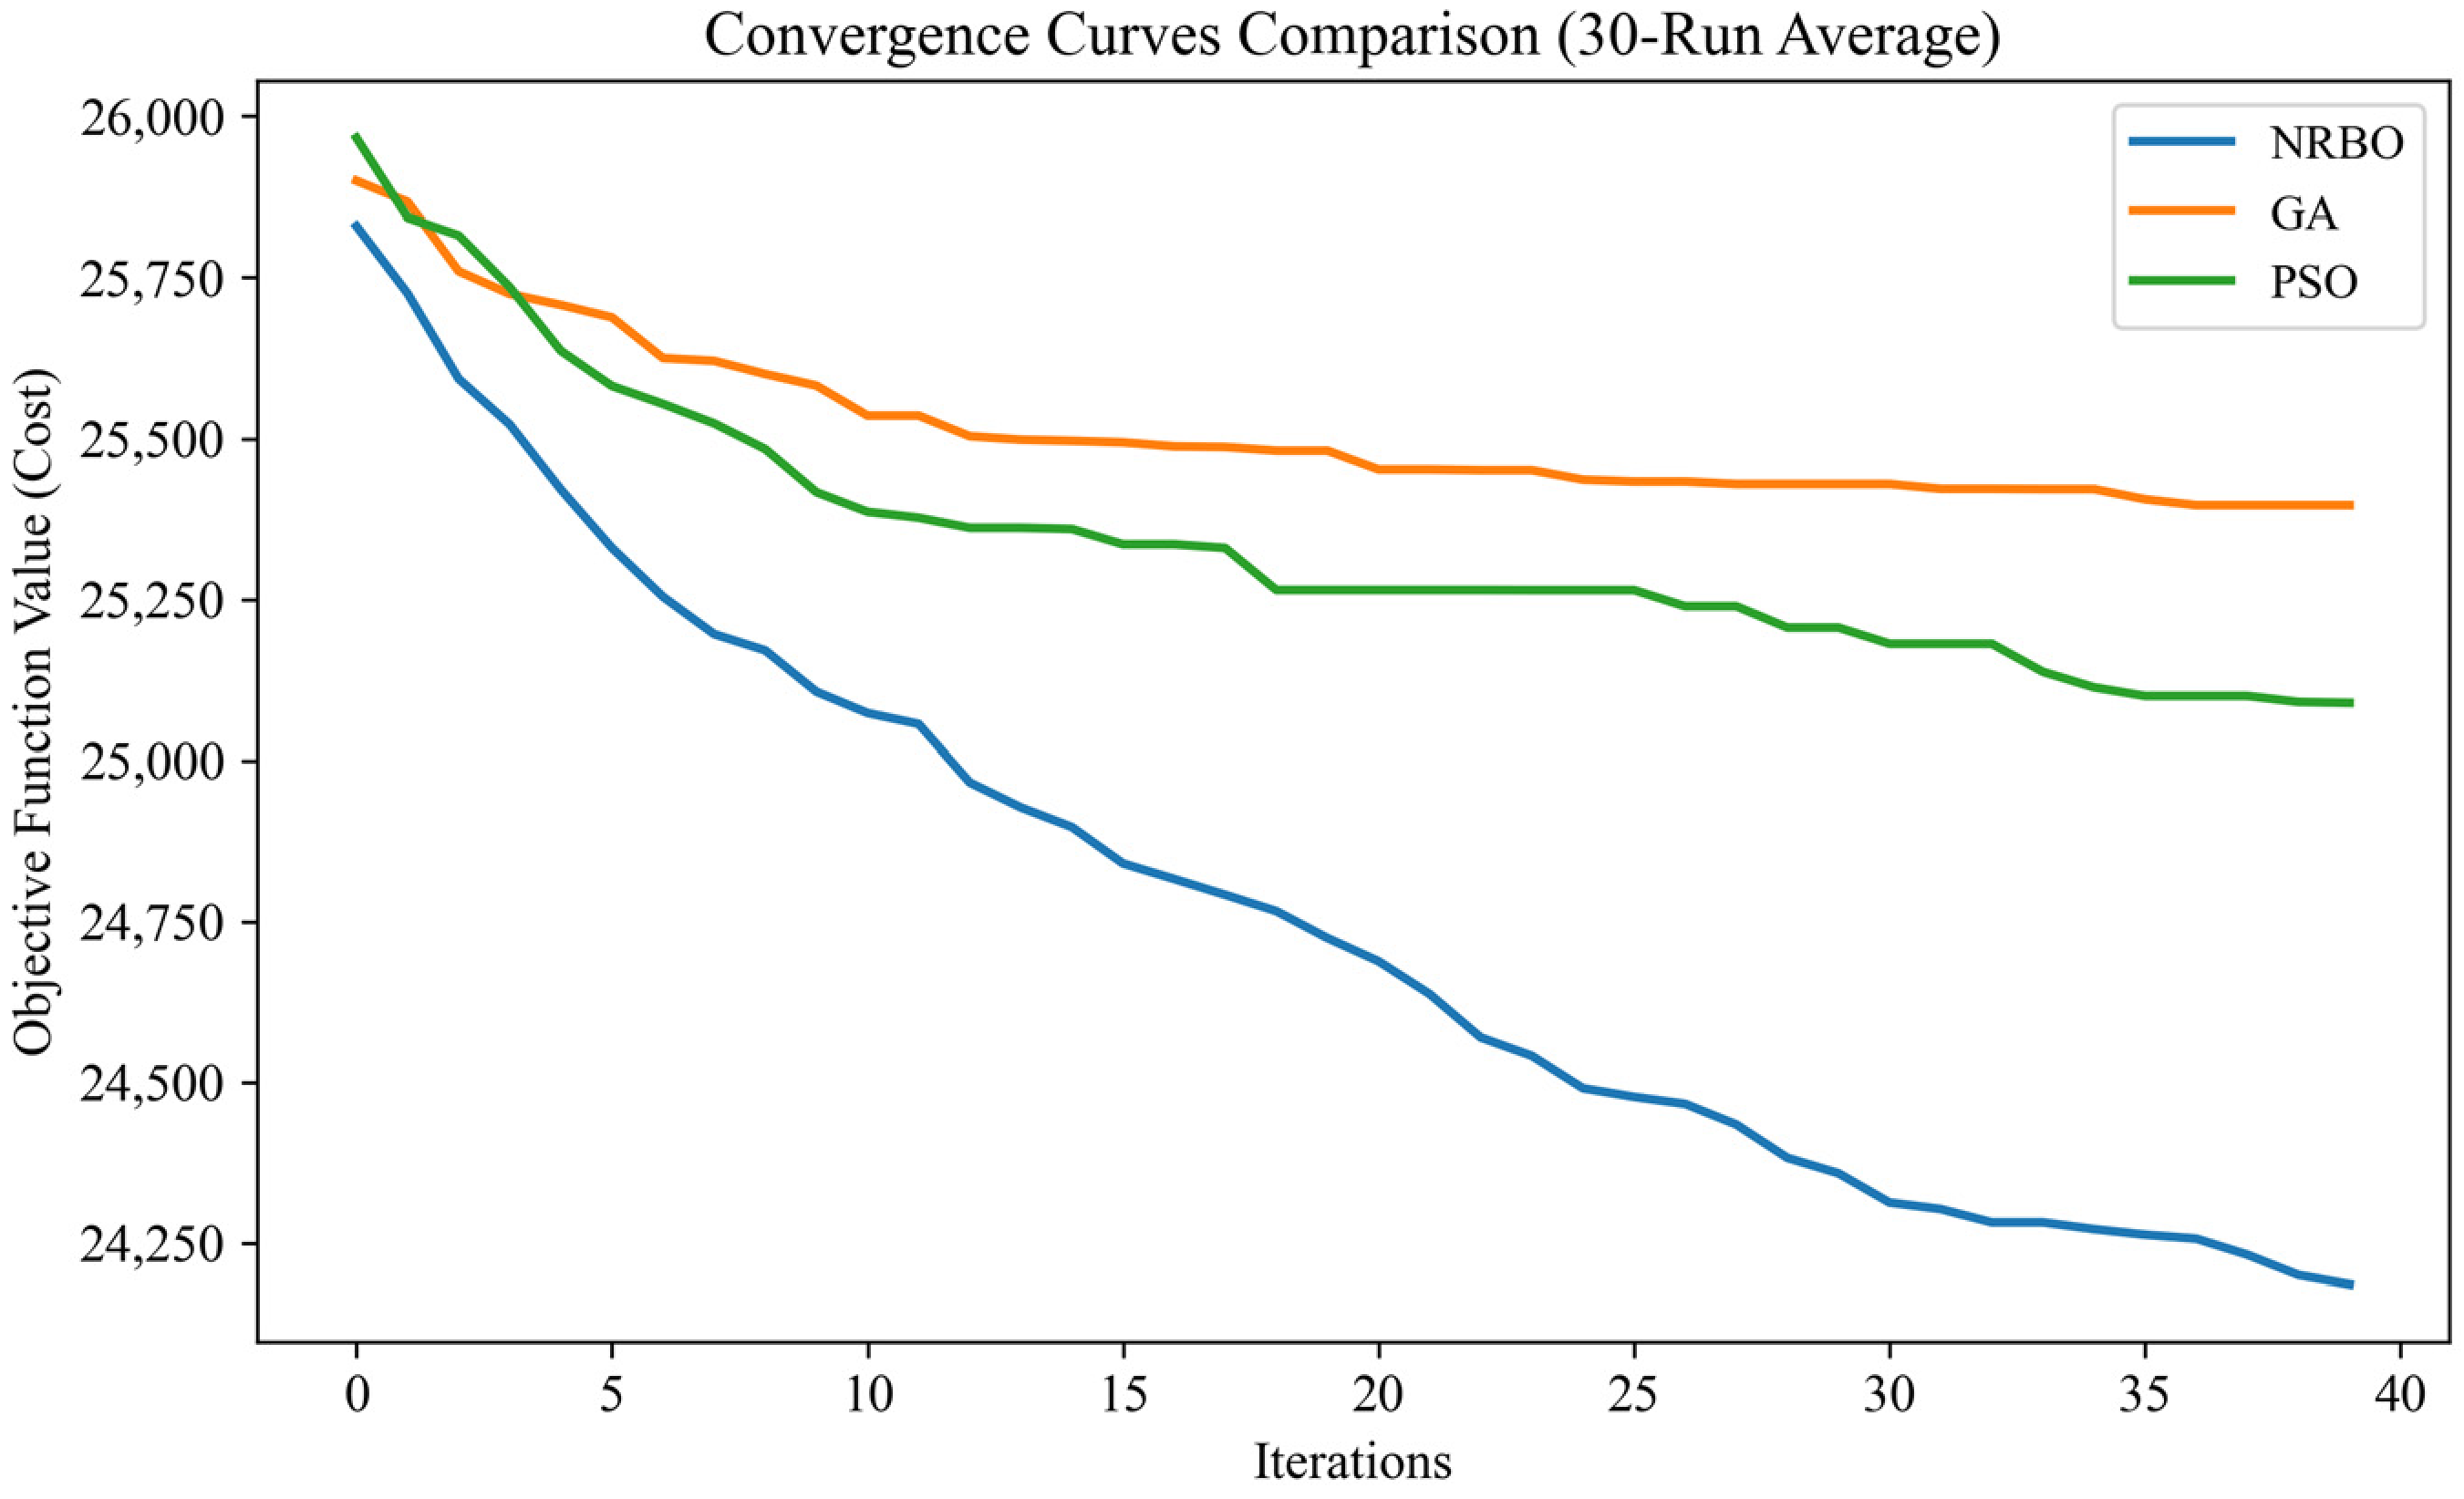
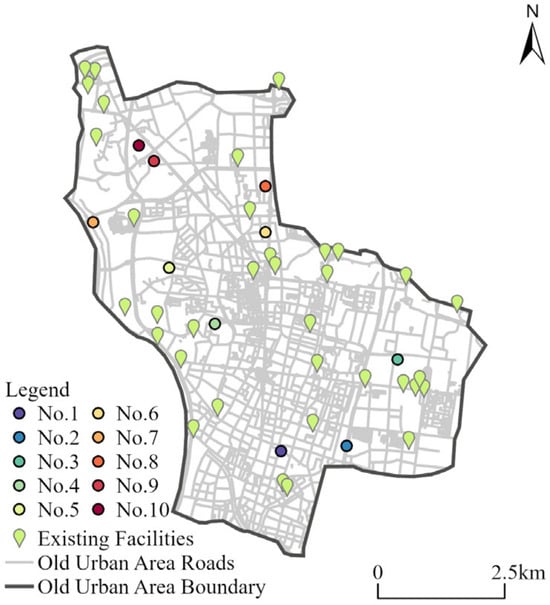
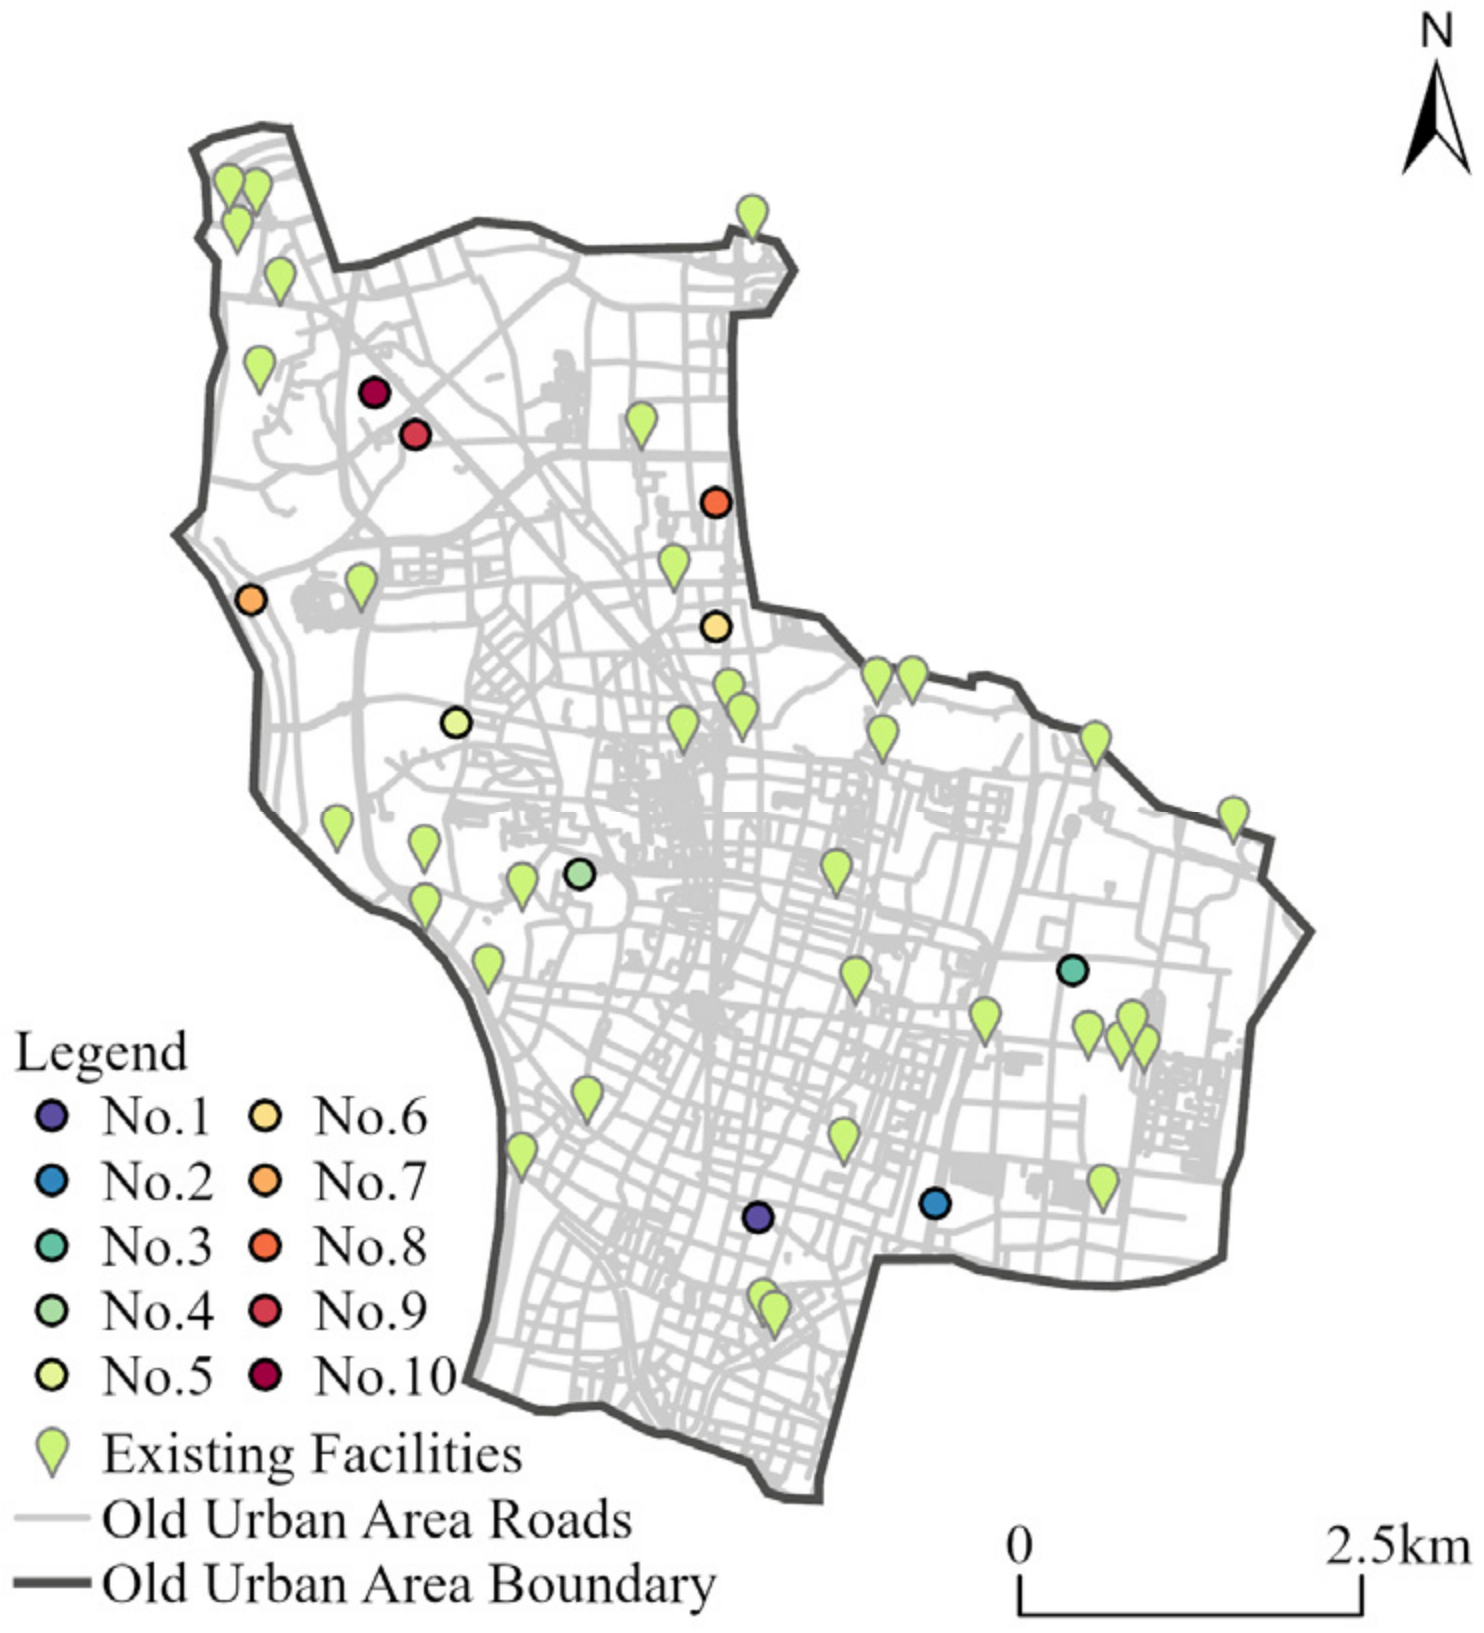
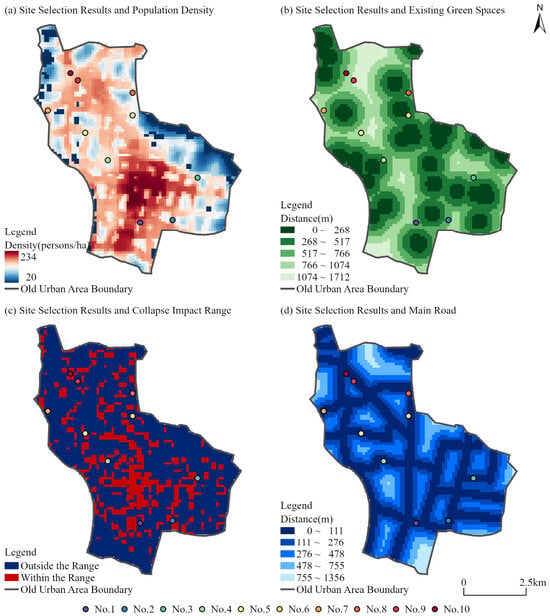
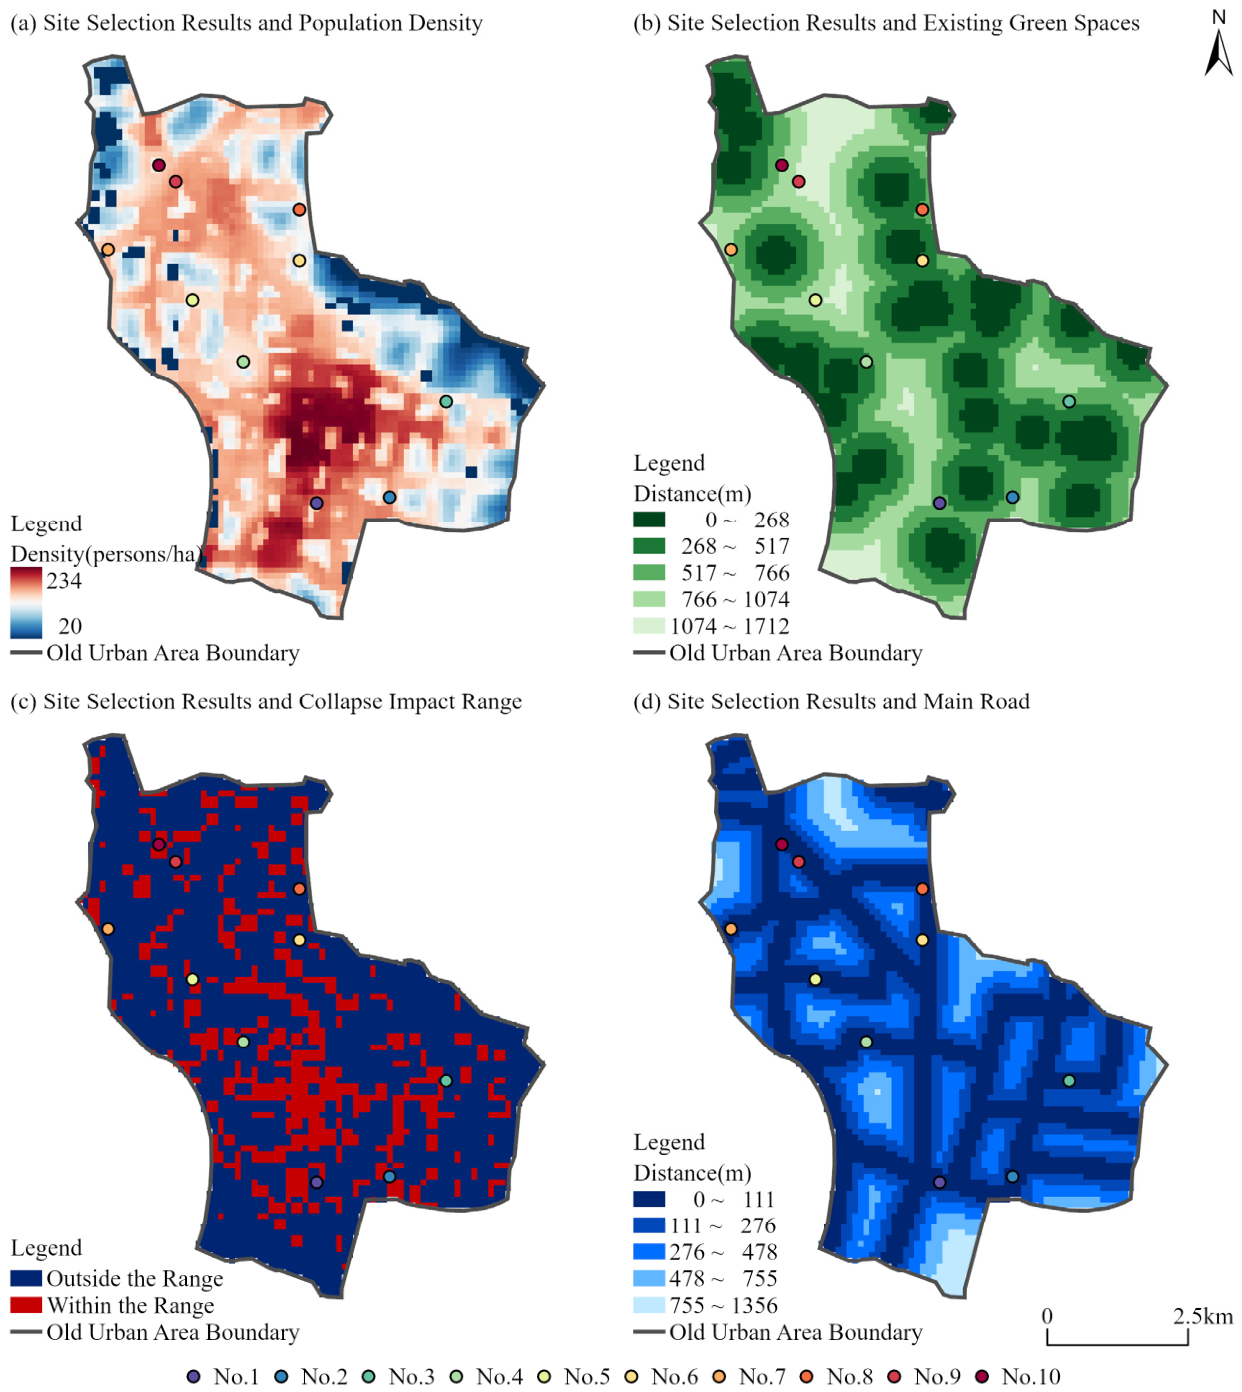
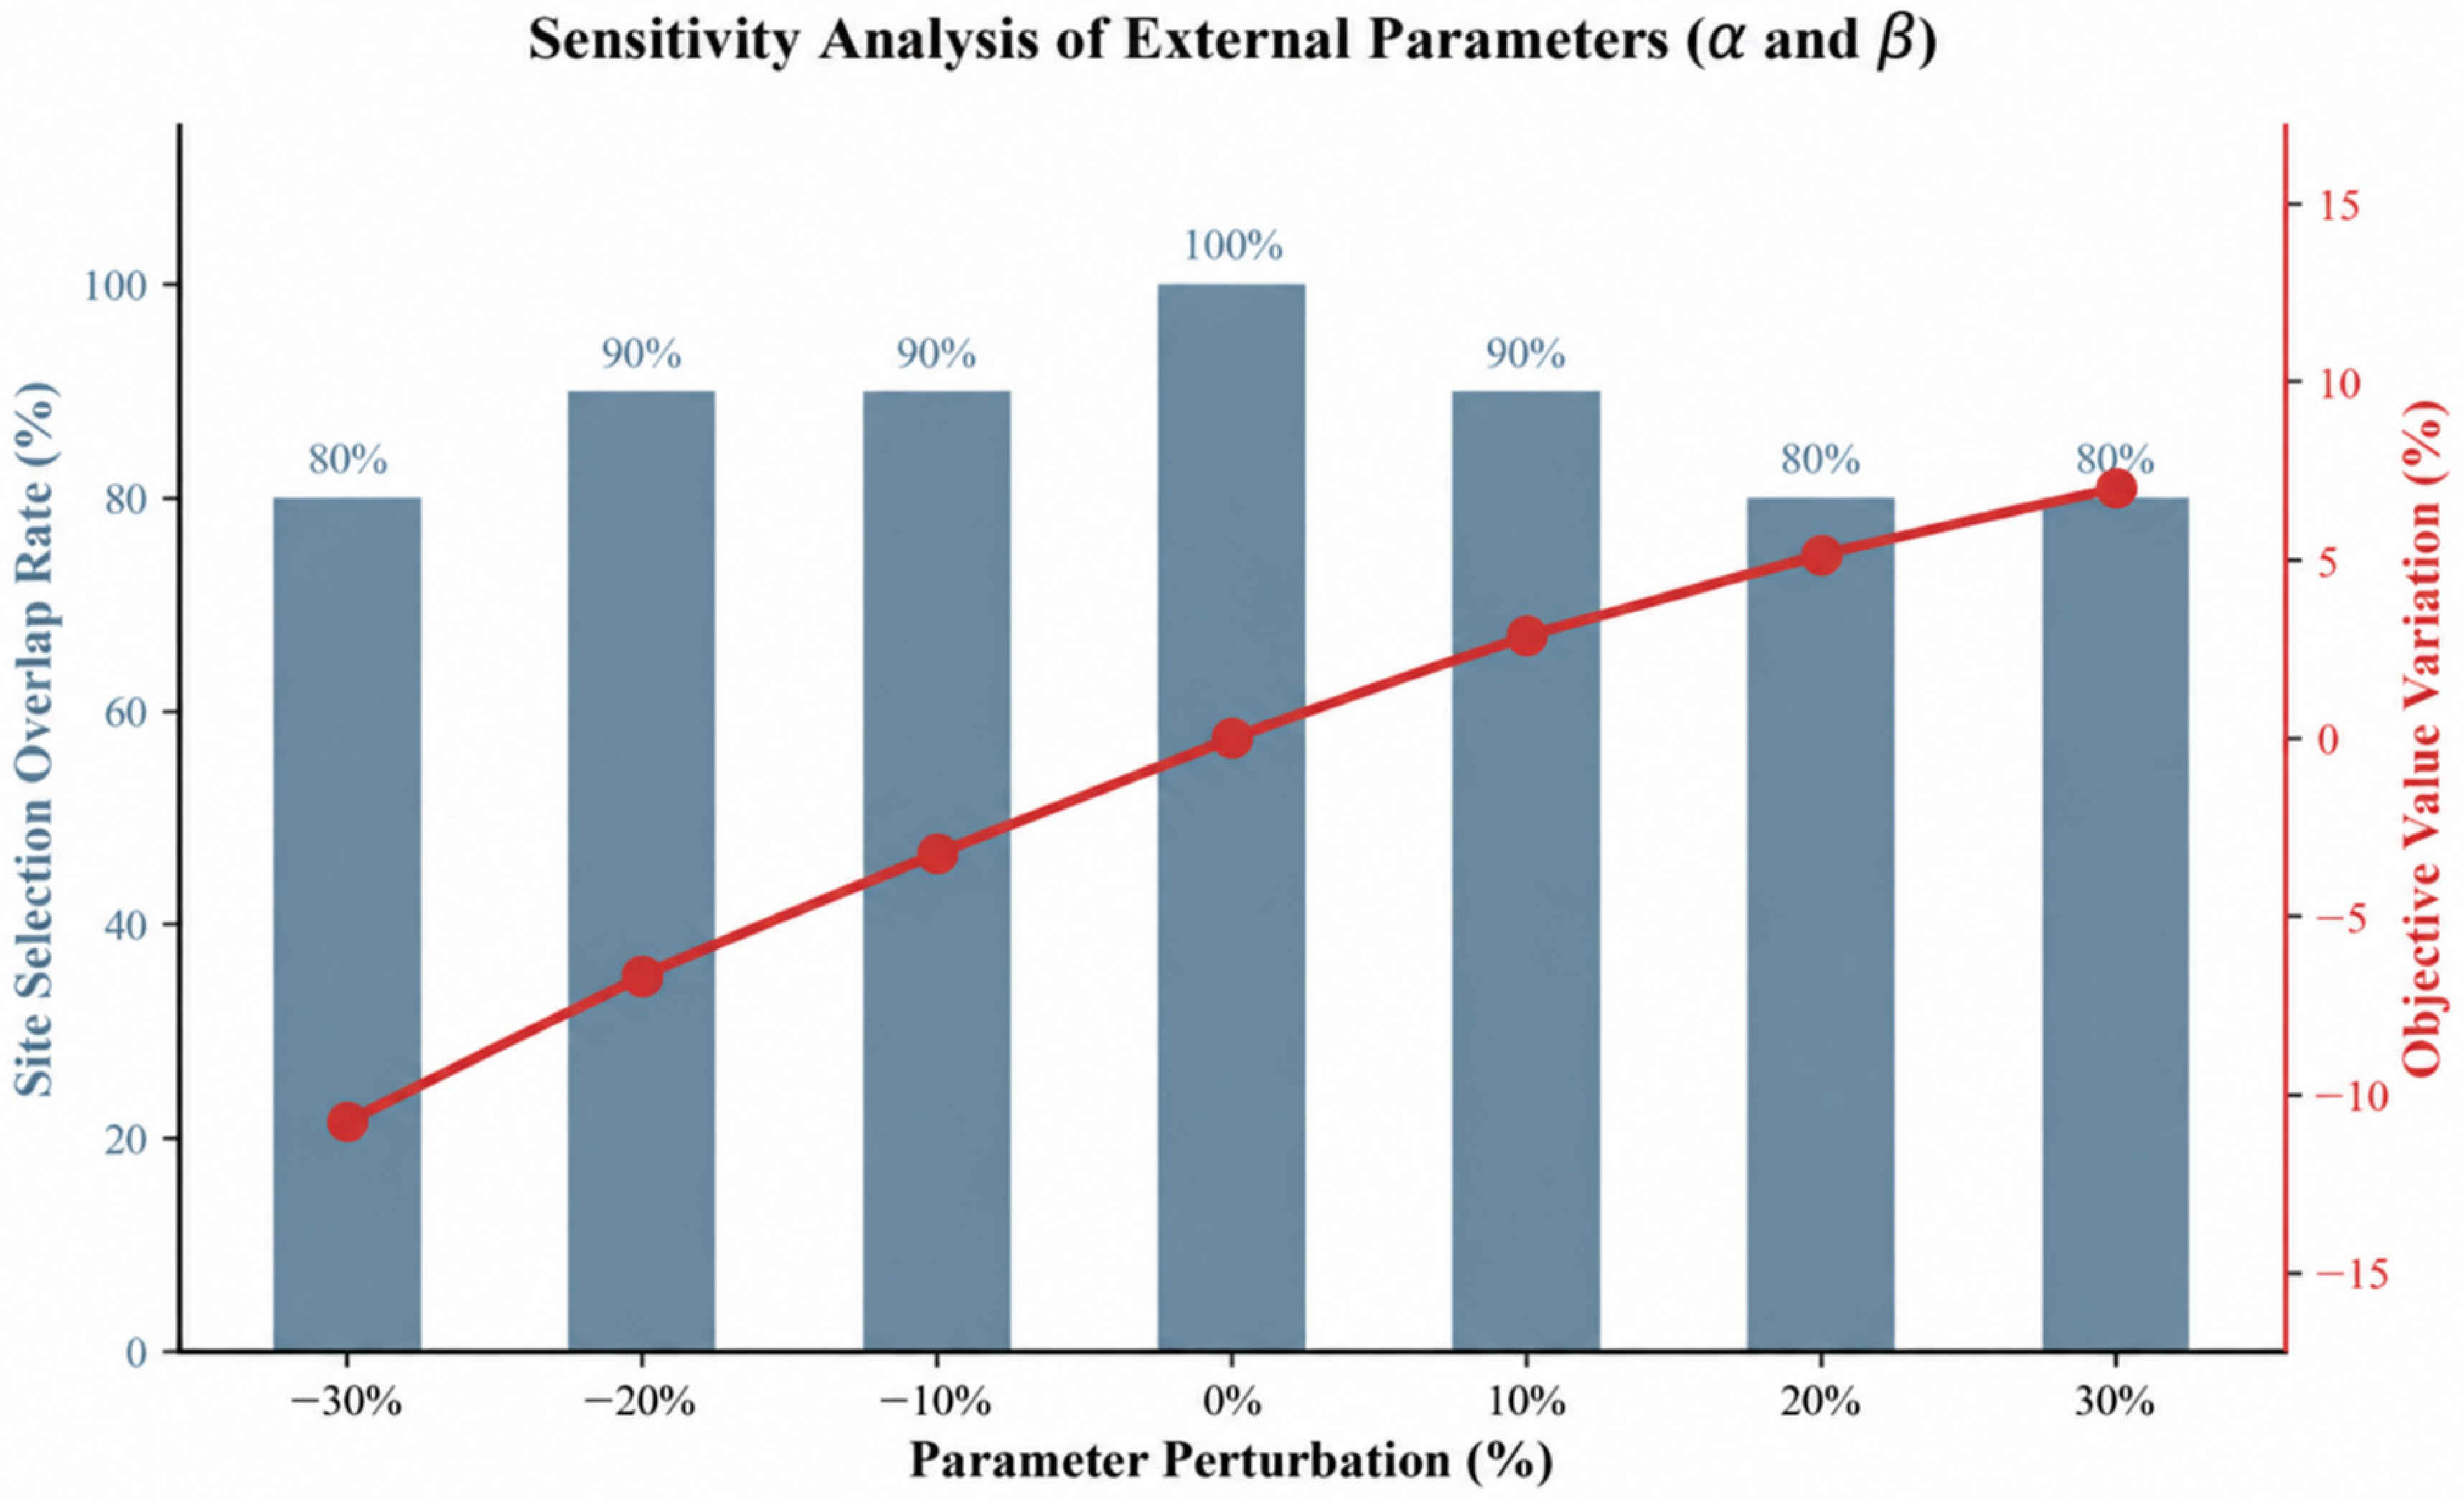

Disclaimer/Publisher’s Note: The statements, opinions and data contained in all publications are solely those of the individual author(s) and contributor(s) and not of MDPI and/or the editor(s). MDPI and/or the editor(s) disclaim responsibility for any injury to people or property resulting from any ideas, methods, instructions or products referred to in the content. |
© 2026 by the authors. Licensee MDPI, Basel, Switzerland. This article is an open access article distributed under the terms and conditions of the Creative Commons Attribution (CC BY) license.