


Simple Summary
Listening to music helps people keep exercising longer, but how the brain produces this benefit is unclear. We asked 34 healthy young men to hold a 10 kg handgrip until they could no longer continue, once with their favorite music and once without, while recording their brain activity (EEG). As fatigue built up, we tracked how brain networks supporting attention, effort, and movement communicated with each other. With music, participants held on 20.6 s longer on average, and their brain networks exchanged information more efficiently among neighboring regions, a change seen across all the brain rhythms we recorded. Two nearly independent signals, one reflecting this local efficiency and one reflecting effort-related communication, were associated with how much longer a person could continue. Music therefore appears to help the brain spend its resources more wisely rather than simply energizing the body, pointing to new ways to manage fatigue in sport, rehabilitation, and demanding work.
Abstract
Although music reliably prolongs time to exhaustion (TTE), the neural mechanisms behind this benefit remain unclear. We examined whether self-selected preferred music alters task-related electroencephalographic (EEG) network reorganization during a sustained handgrip to exhaustion. Thirty-four healthy young men completed a fixed-load (10 kg) handgrip task with and without music in a within-subject design, with each trial divided into early, middle, and late phases (0–30%, 30–70%, 70–100% of individual TTE). Source-localized EEG from three networks (central executive, salience, sensorimotor) was analyzed with phase-locking value and graph-theoretical metrics in four frequency bands. Music prolonged TTE by 20.6 s (t(33) = 4.67, p < 0.001, dz = 0.80) and raised local efficiency and the clustering coefficient in all four bands. Beta- and gamma-band coupling was lower in the middle phase than in the early and late phases under both conditions, with no condition × phase interaction. Although none of the 40 exploratory index-level correlations survived false discovery rate correction, the hypothesis-guided two-pathway model accounted for 36.1% of the variance in ΔTTE (F(2,31) = 8.76, p < 0.001; cross-validated Q2 = 0.233): both expressed as the change from no music to music, the increase in alpha-band local efficiency (β = 11.58 s/SD, 95% CI 4.50–19.15) and the reduction in gamma-band coupling (β = 11.92 s/SD, 95% CI 4.94–18.51) were each independently associated with the TTE gain (VIF = 1.01). The size of the benefit therefore tracked two dissociable pathways of comparable weight, an alpha-band efficiency pathway and a gamma-band effort-attenuation pathway.
1. Introduction
Music is among the most widely applicable ergogenic aids in sport: it is low-cost, non-invasive, and easy to implement [1]. Across a variety of endurance tasks, music reliably prolongs time to exhaustion [2,3]. It also reduces ratings of perceived exertion [4,5,6]. Its benefits extend beyond subjective experience: auditory input can directly speed reaction times and modulate motor output [7], and rhythmic stimulation entrains rhythmic expectancies in attention and modulates motor cortical excitability [8,9,10]. The action of music on motor behavior thus has a measurable neural basis. However, the central mechanisms through which music benefits endurance performance remain unclear: previous accounts have largely remained at the psychological level, such as arousal optimization, distraction, and affective regulation, and can explain only whether the benefit occurs, not at what neural cost and with what network organization it is achieved. Clarifying the neurobiological basis of these effects is therefore a key step toward advancing music from an effective but mechanistically opaque aid to a controllable, optimizable one.
The central mechanisms of exercise-induced fatigue have attracted increasing attention. Early studies attributed exhaustion primarily to peripheral factors such as depletion of energy substrates and accumulation of metabolic by-products; however, accumulating evidence indicates that exhaustion emerges before peripheral resources are fully depleted, suggesting that the central nervous system exerts an active, protective regulation of motor output [11,12]. Acute exhaustion impairs cognitive control and is accompanied by alterations in event-related potentials and oscillatory power [13]; neural oscillatory activity is systematically shaped by neuromodulation [14]; and, importantly, elevated corticospinal inhibition can coexist with efficient motor responses: inhibitory changes do not necessarily imply functional deterioration but may reflect a regulatory strategy that maintains output at a lower neural cost [15]. Together, these advances indicate that exercise-induced fatigue is a multifactorial process whose core question has shifted from when exhaustion occurs to how the central nervous system weighs neural cost against motor output; fatigue is therefore better understood as a continuous reorganization of network organization during task execution rather than a monotonic decline of any single index.
This reorganization can be quantified by two classes of indices: coupling strength and network topology. Source-level phase-locking value (PLV) reflects the strength of functional connections by estimating oscillatory phase relationships between brain regions, combining millisecond-scale temporal resolution with high spatial specificity, and is well suited to the dynamic analysis of continuous task-related data [16,17]. Graph-theoretical analysis further converts the connection matrix into topological indices such as global and local efficiency, simultaneously characterizing the functional integration and segregation of the network [18,19]. Source-level network analysis based on this combination has shown predictive value for behavioral outcomes in cognitive and motor contexts [20,21,22].
Two gaps remain in the existing evidence. First, fatigue studies are mostly based on pre- to post-exercise resting-state comparisons [23], a static form of measurement that cannot capture the nonlinear characteristics of the fatigue process. Second, music studies have mostly adopted behavioral or peripheral physiological outcomes, and direct within-task evidence of central mechanisms is still lacking. In other words, music, brain networks, and endurance behavior have never been measured simultaneously within the same task-based framework. Accordingly, the present study adopted a within-subject design: participants performed a fixed-load sustained handgrip task to exhaustion with and without self-selected preferred music while 64-channel EEG was recorded, and the functional connection strength and global graph metrics of the central executive (CEN), salience (SN), and sensorimotor (SMN) networks were estimated across early, middle, and late fatigue phases to examine how music modulates network coupling. We hypothesized that (H1) music significantly prolongs time to exhaustion relative to the no-music condition; (H2) music-induced changes in brain networks explain the behavioral gains, such that increments in local indices reflecting neural efficiency correlate positively with ΔTTE, whereas increments in long-range coupling reflecting neural effort correlate negatively with ΔTTE; and (H3) the pattern of music-induced modulation of network coupling changes dynamically as fatigue progresses.
2. Materials and Methods
2.1. Participants
This was a within-subjects repeated-measures study. The sample size was determined a priori by a power analysis using G*Power (version 3.1) [24]. The effect size was anchored to the music main effects reported by two within-subject isometric handgrip studies (partial η2 = 0.13; [25,26]); because the primary test was the condition × phase interaction and EEG metrics show lower test–retest reliability than behavioral measures, this was conservatively reduced to partial η2 = 0.06 (Cohen’s f = 0.253). With α = 0.05, 1 − β = 0.80, a correlation of ρ = 0.5 among repeated measurements, and a sphericity correction of ε = 1, the minimum required sample size was 18 participants. Given the data-quality requirements of task-related EEG, 34 participants were ultimately recruited (age 22 ± 2 years), all of whom completed the experiment and were included in the analysis.
Inclusion criteria were: (1) good health, right-handed, and no history of hereditary disease, traumatic brain injury, cardiovascular disease, or psychiatric or neurological disorders; (2) no recent sports injury or excessive fatigue; (3) no vigorous exercise within 24 h before the experiment and no intake of alcohol, caffeine, or other substances affecting the nervous system, with a stable emotional state; and (4) voluntary participation with signed informed consent and remuneration upon completion.
2.2. Experimental Procedure
The experiment was conducted in a physiology laboratory. Each participant performed one fixed-load (10 kg) sustained handgrip task to exhaustion under each of the no-music and self-selected preferred music conditions; condition order was counterbalanced across participants, and the two sessions were separated by ≥48 h and scheduled at the same time of day. During testing, participants sat upright with the right elbow flexed at 90° and the forearm in a neutral position and maintained the 10 kg target load as displayed in real time by an FZY-262 electronic hand dynamometer; failure to maintain the load was judged as exhaustion. The interval from the “start” command to exhaustion was recorded as time to exhaustion (TTE) and synchronized with EEG via event markers. In both conditions, participants wore Bose QuietComfort Ultra Headphones (2nd gen) with active noise cancelation (Quiet mode) enabled to balance perceived wearing and residual ambient noise across conditions: in the music condition, tracks were self-selected by the participant immediately before testing and played continuously from task onset; in the no-music condition, the setup was identical except that no audio was played. Sound level was set by the participant to a comfortable level and was not measured.
2.3. EEG Acquisition and Preprocessing
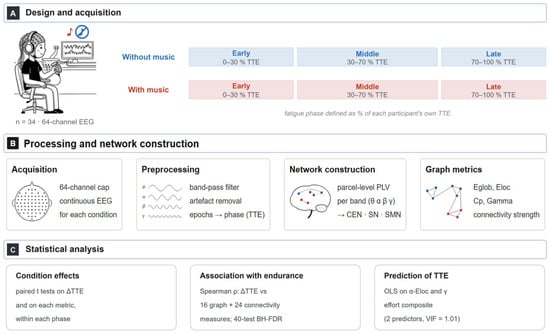
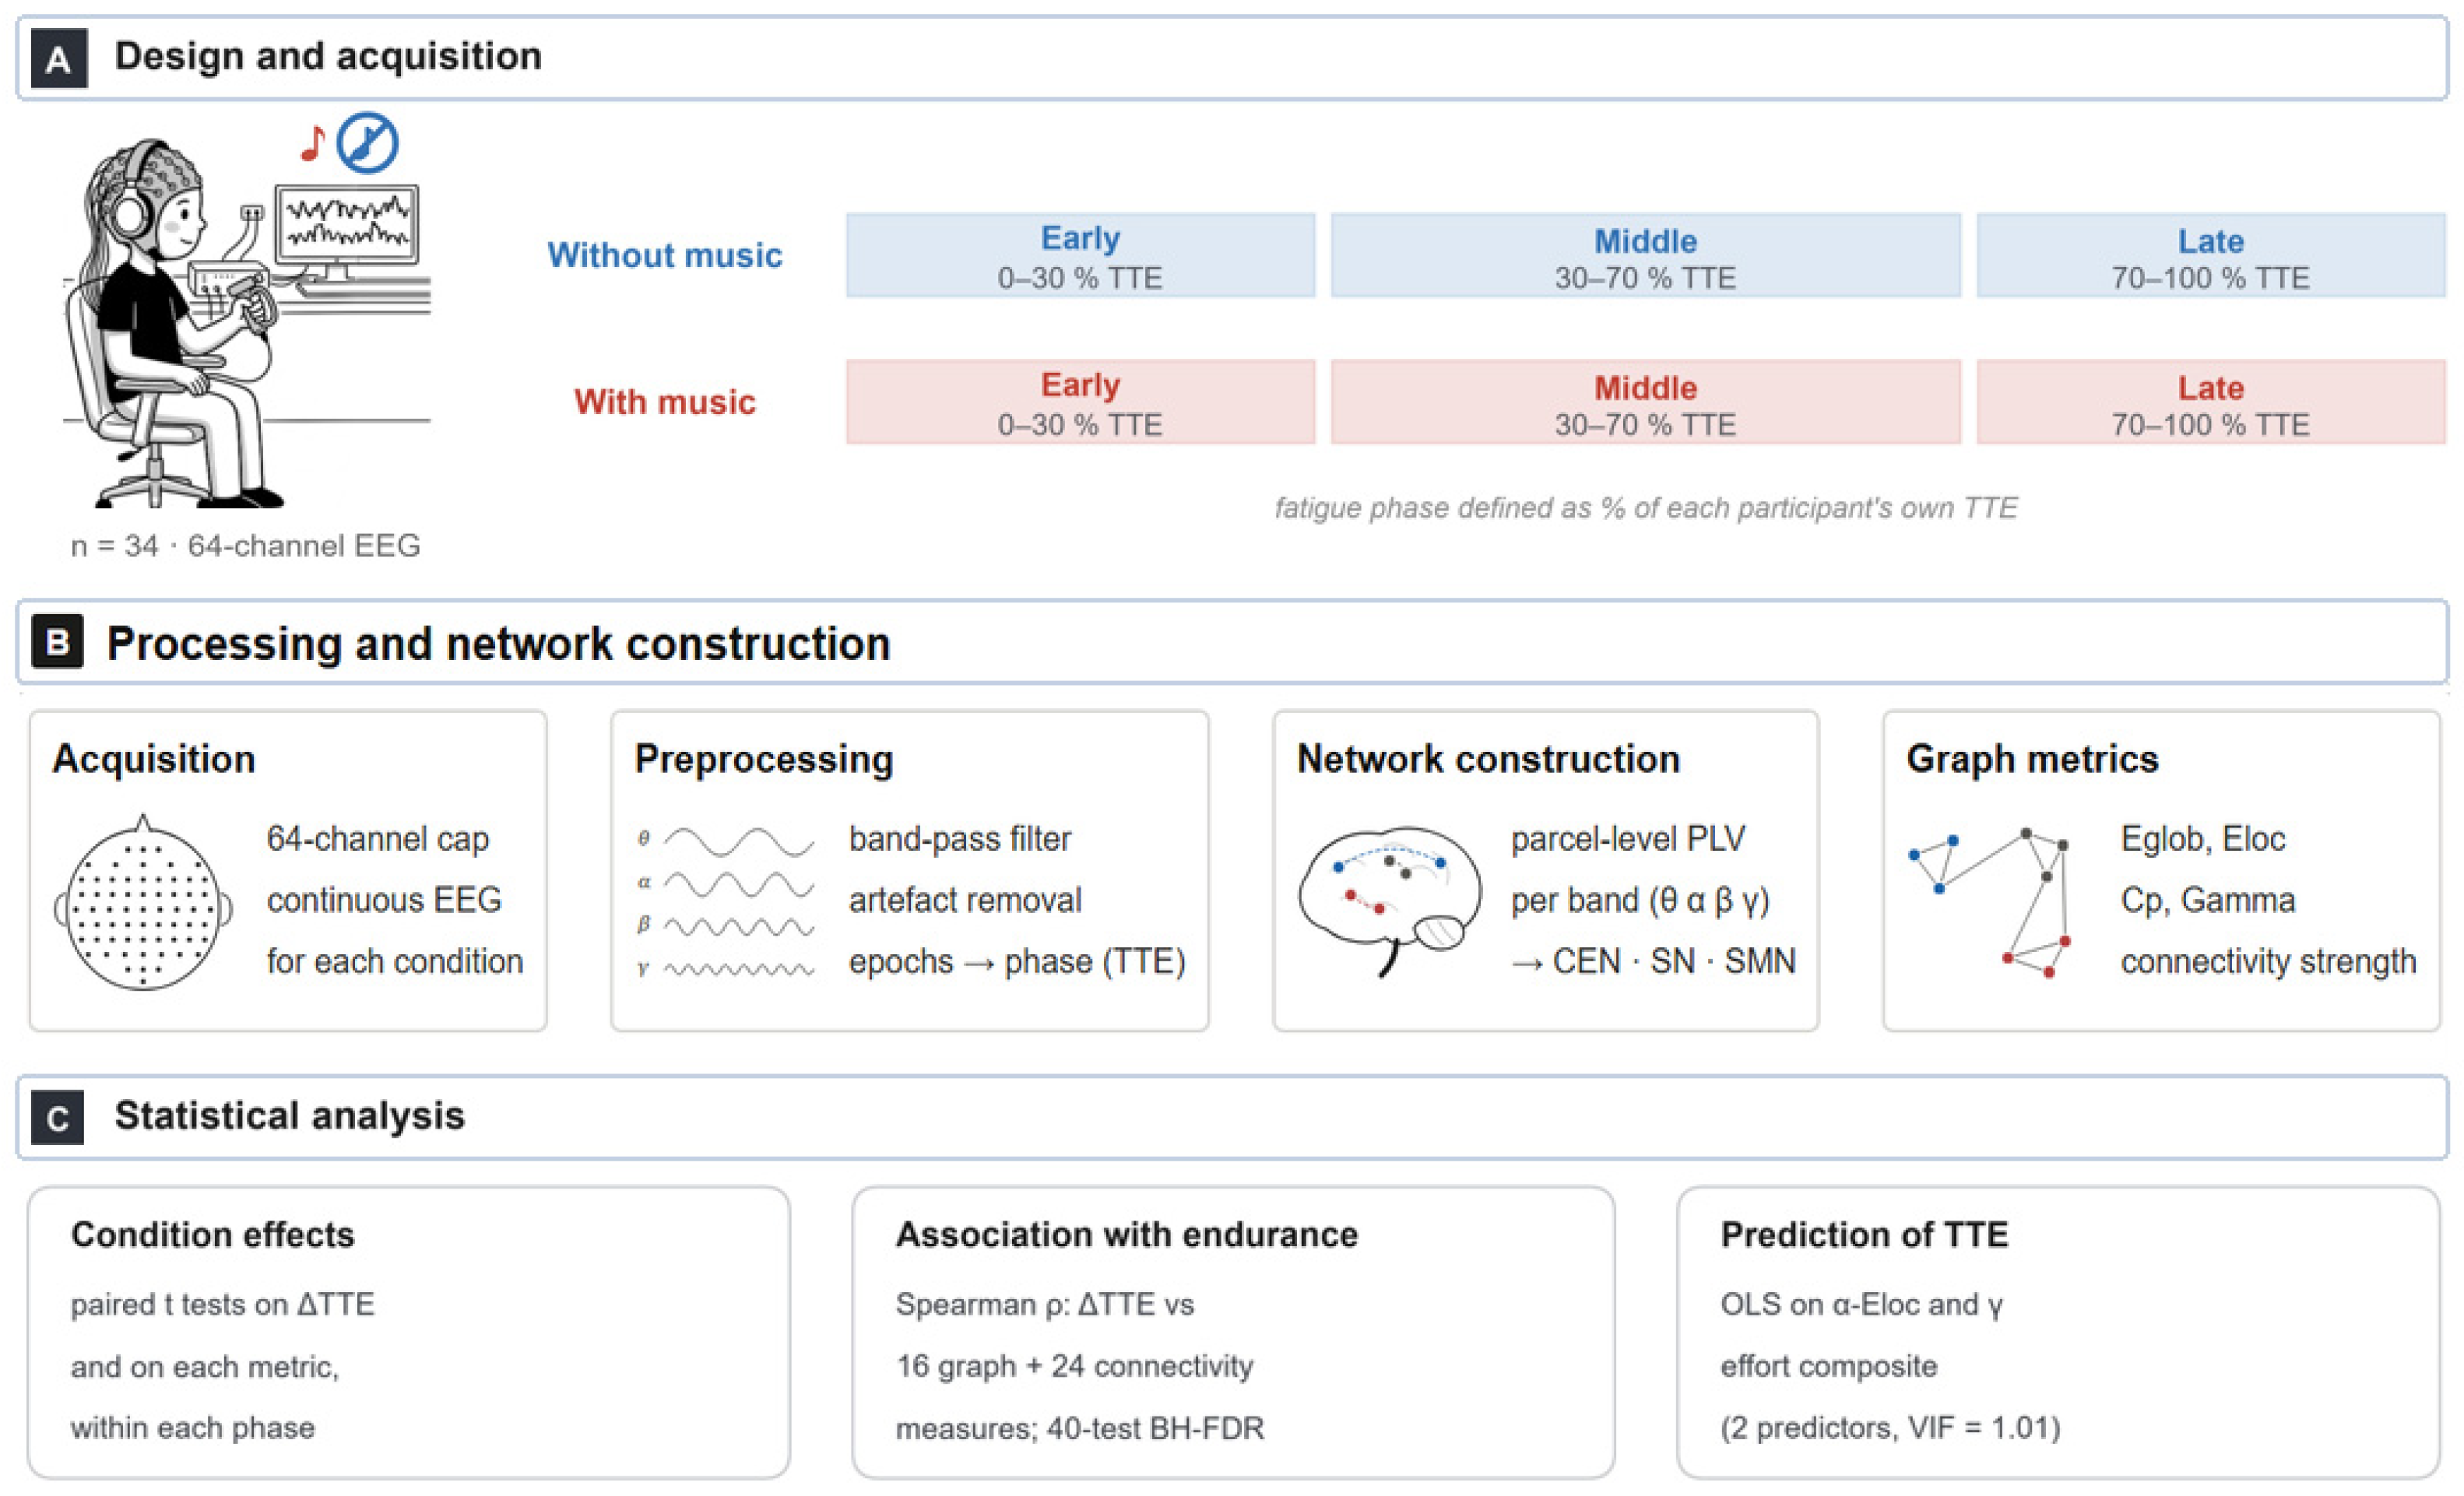
Task-related EEG was continuously recorded in both conditions with a 64-channel EEG system (SAGA, TMSi, Oldenzaal, The Netherlands) at a sampling rate of 1000 Hz, with electrodes positioned according to the international 10–10 system [27] and impedances kept below 10 kΩ. Participants were instructed to keep their trunk stable and to minimize eye movements, teeth clenching, and swallowing. The recording and analysis pipeline is shown in Figure 1.
Figure 1.
Data processing and analysis flow ((A) Design and acquisition; (B) Processing and network construction; (C) Statistical analysis).
Preprocessing was performed in MATLAB R2024b: channel locations were set and the signals re-referenced to the common average in EEGLAB 2023 [28], band-pass-filtered at 1–45 Hz and downsampled to 500 Hz, after which independent component analysis was used to remove ocular, cardiac, and muscular artifact components [29]. Based on each participant’s own TTE, the task was divided into an early (0–30% TTE), middle (30–70%), and late (70–100%) fatigue phase, and within-phase data were segmented into 6 s epochs. Source analysis was then completed in Brainstorm 2023 [30], including head-model registration (ICBM152), estimation of data and noise covariances, functional connectivity computation, and matching to the brain-network template. Analysis parameters were set as follows: theta (4–8 Hz), alpha (8–13 Hz), beta (13–30 Hz), and gamma (30–45 Hz) bands [31]; source localization used sLORETA; and the network template was the Schaefer-100 parcellation based on the Yeo-7 network scheme [32,33,34]. The regions of interest (ROIs) belonged to the central executive network (CEN), salience network (SN), and sensorimotor network (SMN), totaling 39 regions.
2.4. Connectivity and Graph-Theoretical Analysis of Brain Functional Networks
Phase-locking value (PLV) was used as the functional connectivity index. PLV quantifies the phase consistency between the neural oscillatory signals of two brain regions within a given time window and ranges from 0 to 1: constant phase differences yield values approaching 1, whereas random phase distributions yield values approaching 0, with larger values indicating stronger phase synchronization and functional connectivity [16]. Based on the time series of the 39 source-level ROIs, PLV was computed for all pairs of regions in the theta, alpha, beta, and gamma bands, yielding a 39 × 39 symmetric connectivity matrix (diagonal-zeroed), which was imported into GRETNA 2.0.0 for graph-theoretical analysis [35].
- (1)
- Global network topology. Small-world properties were computed over sparsity thresholds from 0.10 to 0.50 in steps of 0.02 (21 sparsity levels) and were summarized using the area under the curve (AUC) [36]. If the small-world index σ > 1, the global network metrics were further computed, including global efficiency (Eglob), local efficiency (Eloc), the global clustering coefficient (Cp), and the normalized clustering coefficient (γ). The definitions and formulas are as follows.
① Clustering coefficient (Cp)
The clustering coefficient reflects the degree of local clustering of nodes in the network and measures its capacity for functional segregation. The clustering coefficient of node i is defined as the ratio of the number of edges actually present among its neighbors to the maximum possible number of such edges:
The global clustering coefficient Cp is the average clustering coefficient over all nodes of the network:
where N is the total number of nodes in the network, Ei is the number of edges actually present among the neighbors of node i, and Di is the degree of node i. A larger Cp indicates stronger local interconnectivity of the network.
② Normalized clustering coefficient (γ)
The normalized clustering coefficient γ is the ratio of the clustering coefficient of the empirical network, Cp, to the mean clustering coefficient of 100 matched random networks, Crandom:
γ > 1 indicates that the empirical network exhibits stronger local clustering than random networks.
③ Characteristic path length (Lp)
The characteristic path length Lp is defined as the mean shortest path length over all pairs of nodes in the network and reflects the efficiency of global information transmission:
where dij is the shortest path length between nodes i and j. A smaller Lp indicates higher efficiency of global information transmission.
④ Normalized characteristic path length (λ)
The normalized characteristic path length λ is the ratio of the characteristic path length of the empirical network, Lp, to the mean characteristic path length of 100 matched random networks, Lrandom:
⑤ Small-world index (σ)
The small-world index σ is used to determine whether the network exhibits small-world properties and is computed as
When σ > 1, the network simultaneously exhibits high local clustering and a short global path length, i.e., small-world topology.
⑥ Global efficiency (Eglob)
Global efficiency Eglob is defined as the mean of the inverse shortest path length over all pairs of nodes, reflecting the capacity of the network for parallel information transmission and global integration:
where Lij is the shortest path length between nodes i and j. A higher Eglob indicates higher information-integration efficiency of the network. Because this metric is defined via the inverse of the shortest path length, it is also applicable to networks that are not fully connected.
⑦ Local efficiency (Eloc)
Local efficiency Eloc measures the fault tolerance of the network to local damage and reflects the efficiency of information transmission within the neighborhood subgraph of each node:
where Gi is the neighborhood subgraph of node i, NGi is the number of nodes in that subgraph, and Lj,k is the shortest path length between nodes j and k within the subgraph. Eloc is closely related to the clustering coefficient and reflects the functional segregation capacity of the network.
- (2)
- Network connection strength analysis. Min–max normalization was applied to standardize the connectivity strength coefficients. Within-network functional connection strength was computed among the nodes of the central executive network (CEN), which is involved in the maintenance of effort and task goals under mounting discomfort; the salience network (SN), which is involved in the detection and prioritization of interoceptive fatigue signals; and the sensorimotor network (SMN), which is involved in the generation and regulation of motor commands. Between-network connectivity strength was computed for the CEN–SN, CEN–SMN, and SN–SMN pairs [37,38].
2.5. Statistical Analysis
Statistical analyses were performed in SPSS 27.0. The significance level was α = 0.05 throughout. Normality was assessed with the Shapiro–Wilk test: normally distributed variables are reported as mean ± standard deviation and non-normally distributed variables as median (interquartile range). The difference in TTE between the two music conditions was compared with a paired-samples t test, with Cohen’s dz as the effect size. Global topological metrics (Eglob, Eloc, Cp, and γ) were analyzed with a 2 (condition: no music, music) × 3 (fatigue phase: early, middle, late) repeated-measures ANOVA, reporting both main effects and the interaction effect, with partial η2 as the effect size; when the sphericity test was significant, Greenhouse–Geisser correction was applied to the degrees of freedom, and post hoc comparisons were Bonferroni-corrected. Because PLV was not normally distributed, within- and between-network functional connection strengths were analyzed non-parametrically: Friedman tests were used for the overall test across the six condition, and when the omnibus effect was significant, Dunn tests with Bonferroni correction were used for post hoc pairwise comparisons.
To examine the relationship between brain-network changes and behavioral gains, the TTE difference (ΔTTE = music–no music) was correlated (Spearman) with the differences of 40 brain-network metrics (16 global graph metrics and 24 within- and between-network connection strengths), and the Benjamini–Hochberg procedure was applied across all 40 tests to control the false discovery rate (FDR), with both p and q reported. To test the two a priori pathways of H2, the indicator selection and compositing scheme of the two constructs was fixed before the analysis and was not adjusted according to the correlation results: neural efficiency was defined as the z-score of the alpha-band ΔEloc, and neural effort as the equally weighted mean of the z-scores of the gamma-band ΔSMN, ΔCEN–SMN, and ΔSN–SMN coupling increments. A least-squares regression was run with ΔTTE as the dependent variable and the z-scores of the two constructs as predictors; b1 and b2 quantify the effects of the two pathways (the change in TTE per 1 SD of the construct, in seconds) and are directly comparable because they share the same unit. Collinearity was assessed with the variance inflation factor (VIF; <5 acceptable); the 95% confidence intervals of the regression coefficients were estimated by percentile bootstrap with 5000 resamples; predictive performance was assessed by Q2 from repeated 10-fold cross-validation (100 repetitions); and the residuals showed no violations of normality or homoscedasticity.
3. Results
3.1. Behavioral Performance
All 34 participants completed the sustained handgrip task under both the music and no-music conditions. TTE was significantly longer under the music condition (247.48 ± 71.71 s) than under the no-music condition (226.92 ± 71.98 s). Music prolonged TTE by 20.56 s (t(33) = 4.67, p < 0.001, Cohen’s dz = 0.80).
3.2. Global Network Topology
Descriptive statistics of the global network metrics (Eglob, Eloc, Cp, and γ) in each frequency band are shown in Table 1. Each metric was tested with a 2 (condition: no music, music) × 3 (fatigue phase: early, middle, late) two-way repeated-measures ANOVA, with the results shown in Table 2.
Table 1.
Descriptive statistics of global network metrics across frequency bands (mean ± SD).
Table 2.
Two-way repeated-measures ANOVA results for global network metrics across frequency bands.
Theta band: The main effect of the music condition was significant for Eloc (F(1,33) = 8.109, p = 0.008, η2 = 0.197) and Cp (F(1,33) = 5.071, p = 0.031, η2 = 0.133), with both Eloc and Cp significantly higher under music than without music; the main effect of condition was not significant for Eglob (F(1,33) = 0.531, p = 0.471, η2 = 0.016) or γ (F(1,33) = 0.795, p = 0.379, η2 = 0.024). The main effect of fatigue phase was not significant for any of the four metrics (p > 0.05), nor was the condition × phase interaction (p > 0.05).
Alpha band: The main effect of condition was significant for Eloc (F(1,33) = 10.731, p = 0.002, η2 = 0.245) and Cp (F(1,33) = 8.699, p = 0.006, η2 = 0.209), with both metrics significantly higher under music; the main effect of condition was not significant for Eglob (F(1,33) = 0.640, p = 0.430, η2 = 0.019) or γ (F(1,33) = 1.064, p = 0.310, η2 = 0.031). The main effect of phase and the interaction were not significant for any metric (p > 0.05).
Beta band: The main effect of condition was significant, with Eloc (F(1,33) = 7.539, p = 0.010, η2 = 0.186) and Cp (F(1,33) = 7.560, p = 0.010, η2 = 0.186) significantly higher under music; Eglob (F(1,33) = 0.076, p = 0.784, η2 = 0.002) and γ (F(1,33) = 0.106, p = 0.747, η2 = 0.003) showed no significant main effect of condition. The main effect of phase and the interaction were not significant for any metric (p > 0.05).
Gamma band: The main effect of condition was significant, with Eloc (F(1,33) = 8.474, p = 0.006, η2 = 0.204) and Cp (F(1,33) = 8.694, p = 0.006, η2 = 0.209) significantly higher under music; Eglob (F(1,33) = 1.159, p = 0.289, η2 = 0.034) and γ (F(1,33) = 0.343, p = 0.562, η2 = 0.010) showed no significant main effect of condition. The main effect of phase and the interaction were not significant for any metric (p > 0.05).
3.3. Within-Network Functional Connectivity Strength
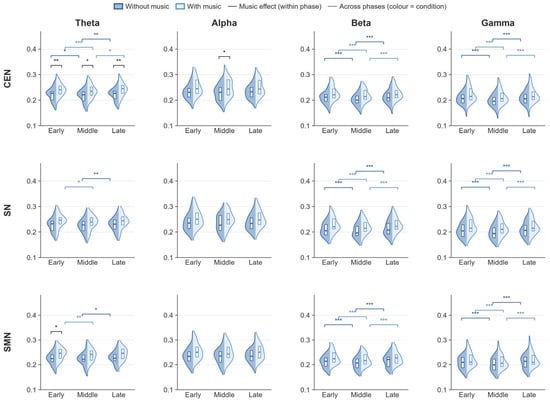
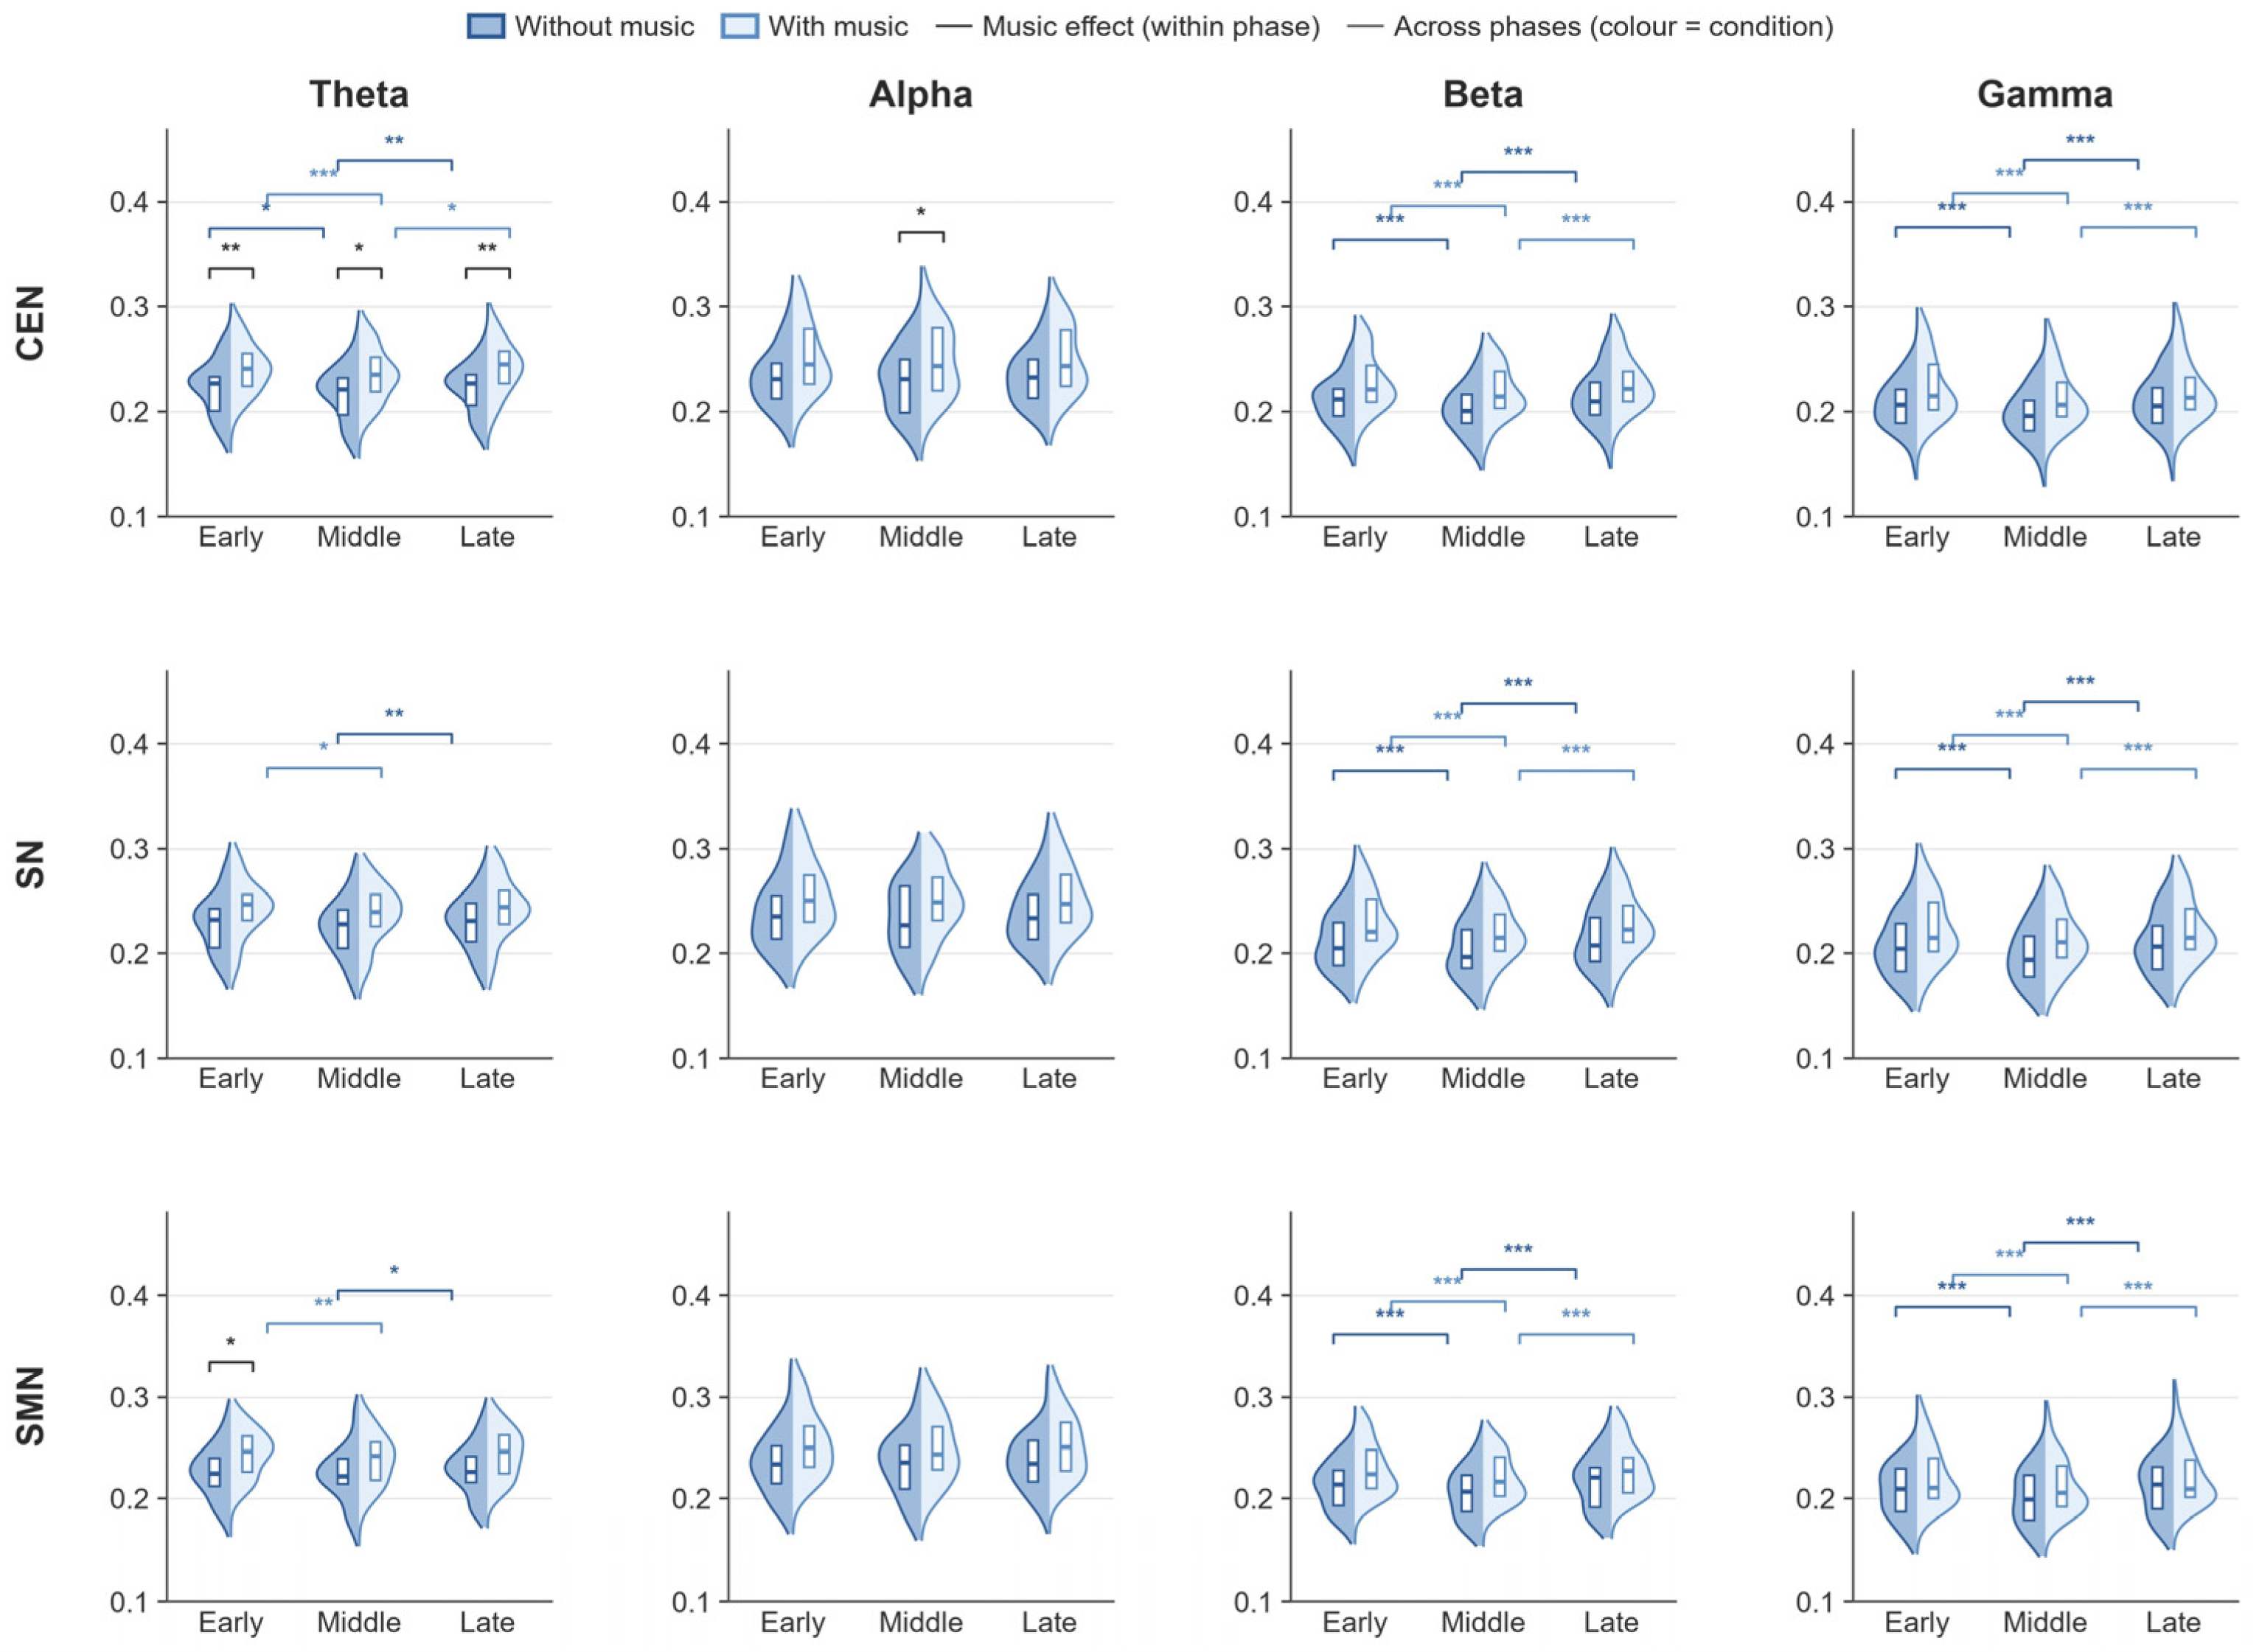
Friedman tests compared the within-network functional connection strength of CEN, SN, and SMN across the six condition × phase combinations in the theta, alpha, beta, and gamma bands; when the omnibus effect was significant, Dunn tests with Bonferroni correction were used for post hoc pairwise comparisons, and corrected p values are reported (Figure 2).
Figure 2.
Within-network functional connectivity strength across frequency bands and conditions. * p < 0.05, ** p < 0.01, *** p < 0.001.
Theta band: Friedman tests revealed significant omnibus differences in within-network strength for CEN (χ2(5) = 45.378, p < 0.001), SN (χ2(5) = 24.941, p = 0.027), and SMN (χ2(5) = 31.731, p < 0.001). Post hoc (Bonferroni) comparisons showed the following: In CEN, within-network strength was higher with music than without music in the early (p = 0.008), middle (p = 0.036), and late (p = 0.008) phases; in both conditions, middle-phase strength was significantly lower than early-phase (no music: p = 0.020; music: p < 0.001) and late-phase (no music: p = 0.006; music: p = 0.023) strength. In SN, no-music late-phase strength was significantly higher than no-music middle-phase strength (p = 0.005), and music middle-phase strength was significantly lower than music early-phase strength (p = 0.021). In SMN, music early-phase strength was significantly higher than no-music early-phase (p = 0.016) and music middle-phase (p = 0.003) strength, and no-music late-phase strength was significantly higher than no-music middle-phase strength (p = 0.021).
Alpha band: Friedman tests revealed significant omnibus differences for CEN (χ2(5) = 31.479, p < 0.001), SN (χ2(5) = 26.840, p < 0.001), and SMN (χ2(5) = 19.832, p = 0.001). Post hoc comparisons showed that in CEN, music middle-phase strength was significantly higher than no-music middle-phase strength (p = 0.034).
Beta band: Friedman tests revealed significant omnibus differences for CEN (χ2(5) = 53.160, p < 0.001), SN (χ2(5) = 40.050, p < 0.001), and SMN (χ2(5) = 58.269, p < 0.001). Post hoc comparisons showed that, in all three networks and under both conditions, middle-phase within-network strength was significantly lower than early- and late-phase strength (all p < 0.001).
Gamma band: Friedman tests revealed significant omnibus differences for CEN (χ2(5) = 44.319, p < 0.001), SN (χ2(5) = 37.210, p < 0.001), and SMN (χ2(5) = 43.412, p < 0.001). Post hoc comparisons showed that, in all three networks and under both conditions, middle-phase within-network strength was significantly lower than early- and late-phase strength (all p < 0.001).
Apart from the differences described above, all other pairwise comparisons of within-network strength across conditions in each band and network were not significant (p > 0.05).
3.4. Between-Network Functional Connectivity Strength
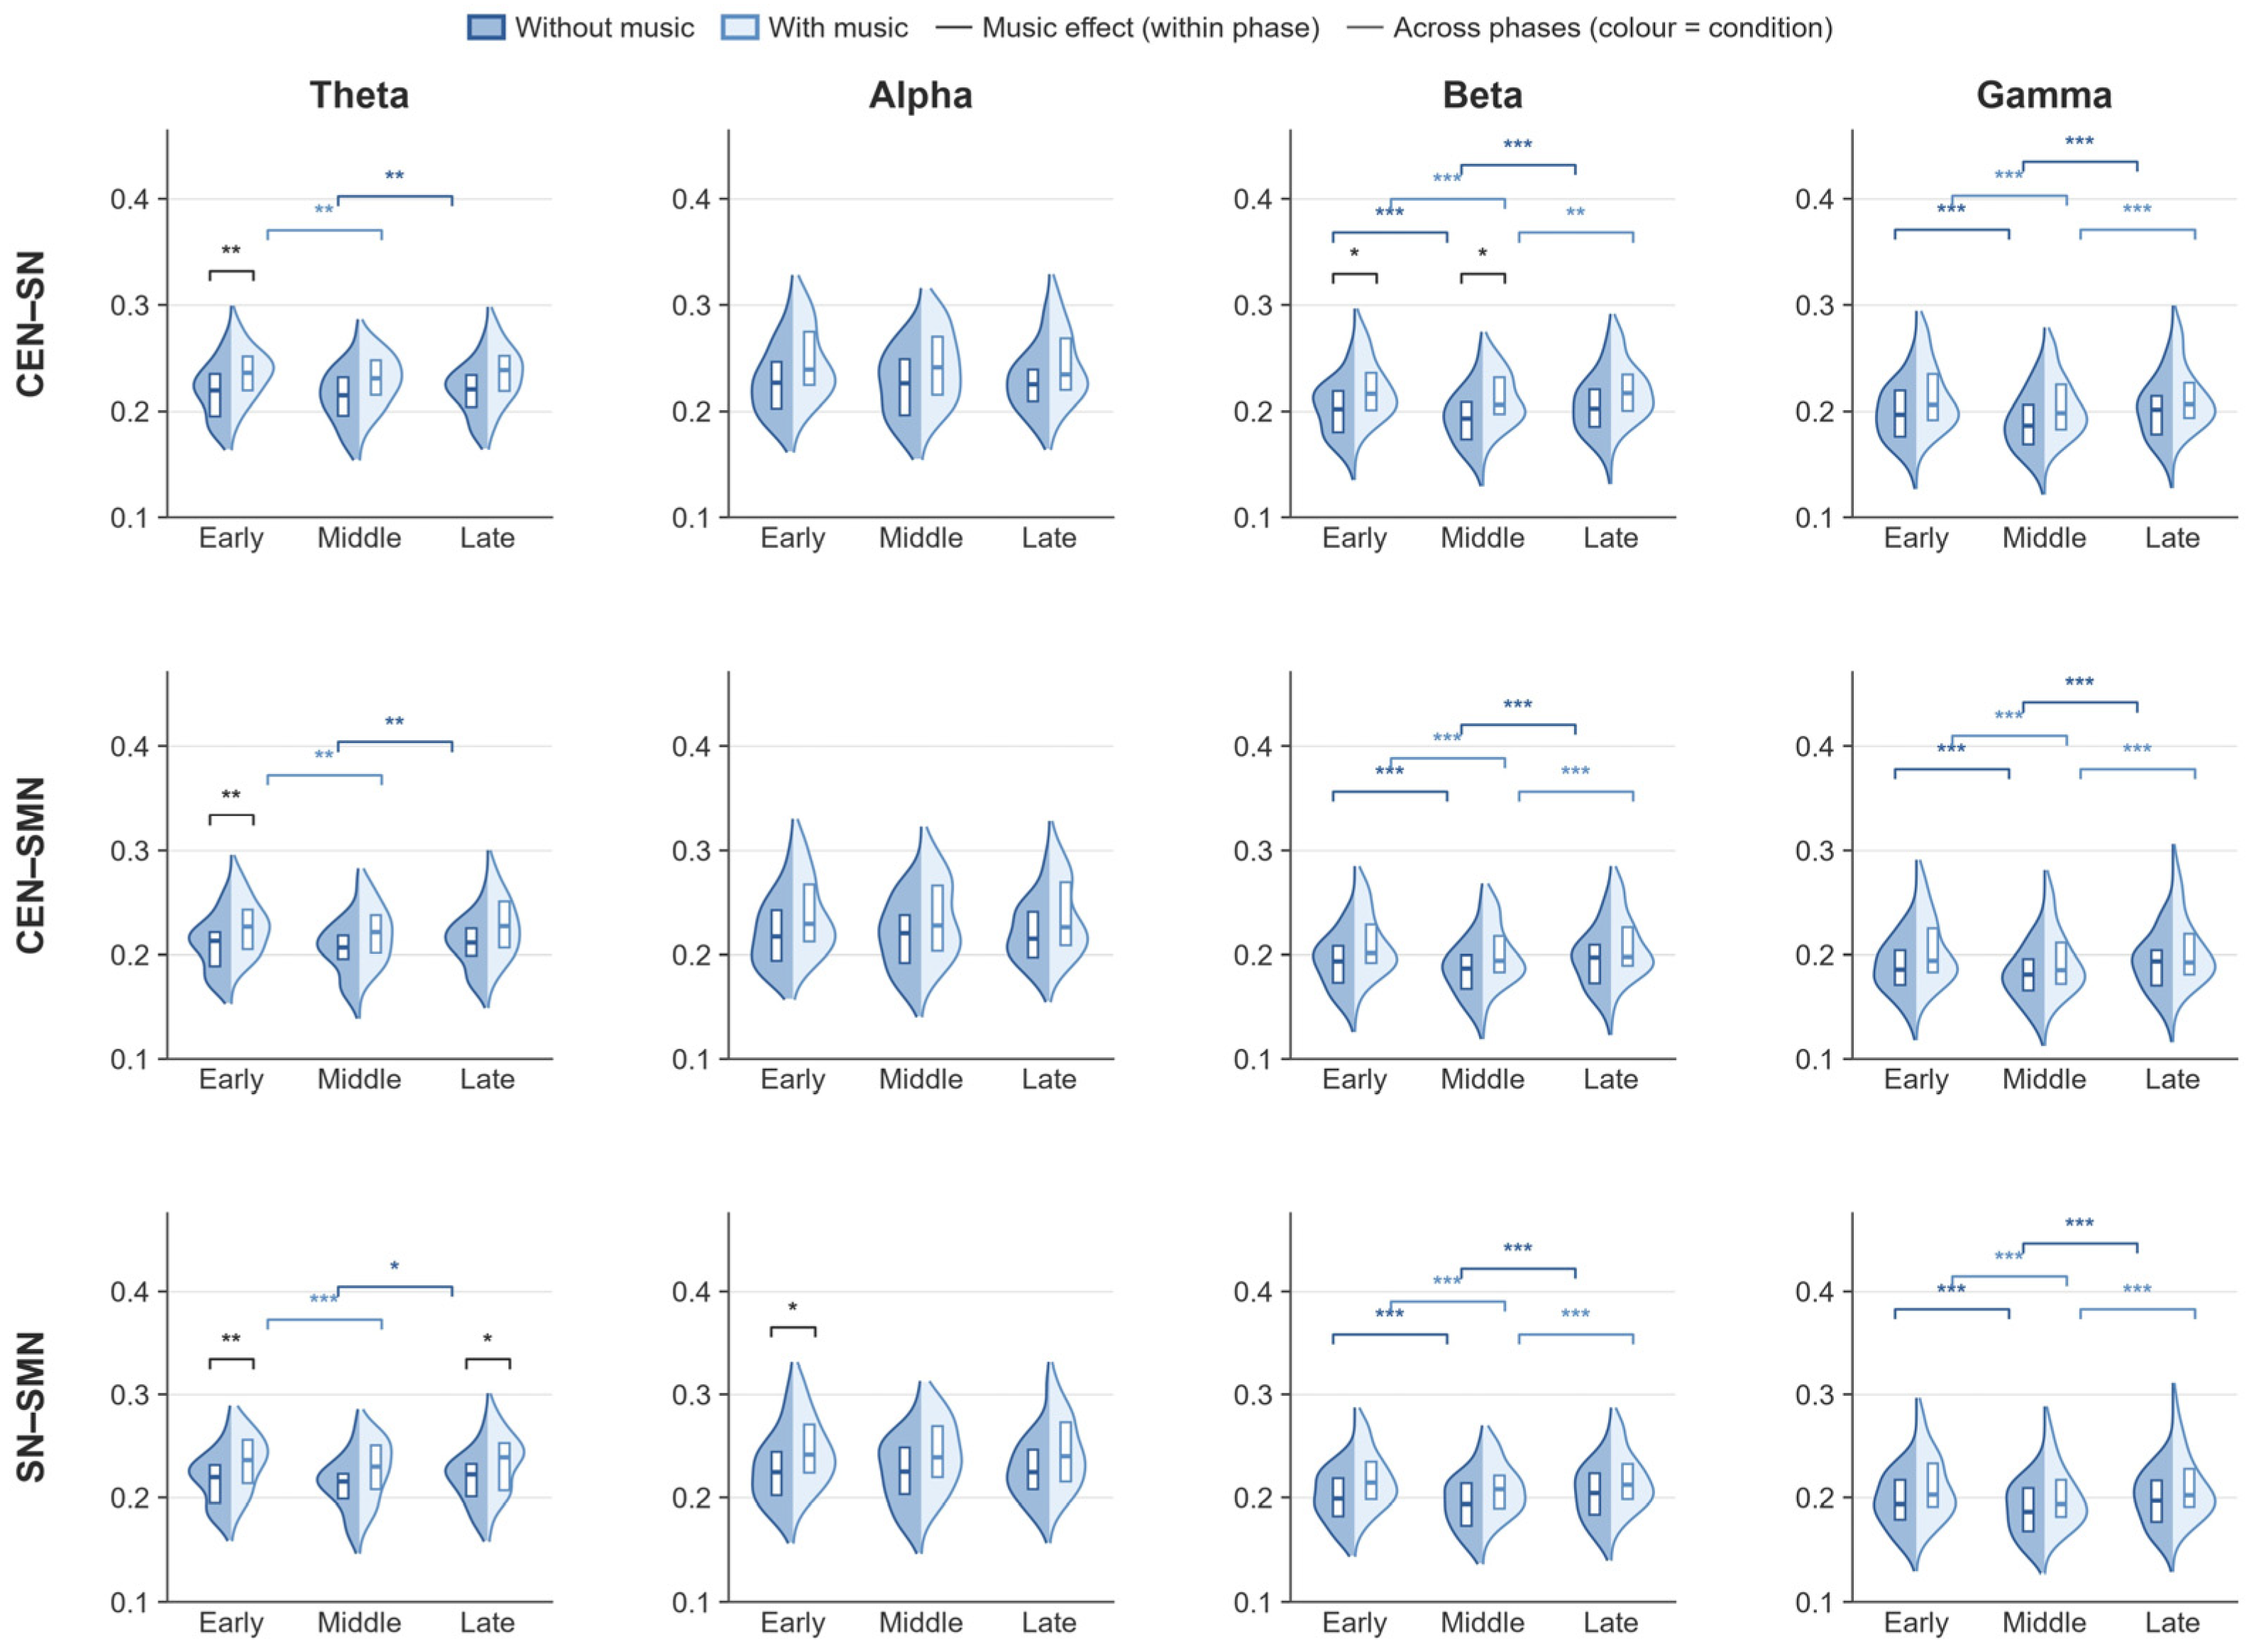
Friedman tests compared the between-network functional connection strength of CEN–SN, CEN–SMN, and SN–SMN across the six condition × phase combinations in the four frequency bands; for network pairs with significant omnibus effects, Dunn tests with Bonferroni correction were used for post hoc pairwise comparisons, and corrected p values are reported (Figure 3).
Figure 3.
Between-network functional connectivity strength across frequency bands and conditions. * p < 0.05, ** p < 0.01, *** p < 0.001.
Theta band: Friedman tests revealed significant omnibus differences for CEN–SN (χ2(5) = 36.992, p < 0.001), CEN–SMN (χ2(5) = 36.706, p < 0.001), and SN–SMN (χ2(5) = 35.025, p < 0.001). Post hoc (Bonferroni) comparisons showed the following: In CEN–SN, music early-phase strength was significantly higher than no-music early-phase (p = 0.008) and music middle-phase (p = 0.001) strength, and no-music late-phase strength was significantly higher than no-music middle-phase strength (p = 0.001). In CEN–SMN, music early-phase strength was significantly higher than no-music early-phase (p = 0.008) and music middle-phase (p = 0.001) strength, and no-music late-phase strength was significantly higher than no-music middle-phase strength (p = 0.005). In SN–SMN, music-condition strength was significantly higher than no-music in the early (p = 0.003) and late (p = 0.036) phases, no-music late-phase strength was significantly higher than no-music middle-phase strength (p = 0.011), and music middle-phase strength was significantly lower than music early-phase strength (p < 0.001).
Alpha band: Friedman tests revealed significant omnibus differences for CEN–SN (χ2(5) = 33.278, p < 0.001), CEN–SMN (χ2(5) = 22.790, p < 0.001), and SN–SMN (χ2(5) = 29.546, p < 0.001). Post hoc (Bonferroni) comparisons showed that in SN–SMN, music early-phase strength was significantly higher than no-music early-phase strength (p = 0.034).
Beta band: Friedman tests revealed significant omnibus differences for CEN–SN (χ2(5) = 45.546, p < 0.001), CEN–SMN (χ2(5) = 38.857, p < 0.001), and SN–SMN (χ2(5) = 47.126, p < 0.001). Post hoc (Bonferroni) comparisons showed that in CEN–SN, music-condition strength was significantly higher than no-music in the early (p = 0.032) and middle (p = 0.042) phases. In all three network pairs and under both conditions, middle-phase strength was significantly lower than early- and late-phase strength (all p < 0.001).
Gamma band: Friedman tests revealed significant omnibus differences for CEN–SN (χ2(5) = 48.824, p < 0.001), CEN–SMN (χ2(5) = 50.168, p < 0.001), and SN–SMN (χ2(5) = 48.740, p < 0.001). Post hoc (Bonferroni) comparisons showed that, in all three network pairs and under both conditions, middle-phase strength was significantly lower than early- and late-phase strength (all p < 0.001).
Apart from the differences described above, all other pairwise comparisons of between-network strength across conditions in each band and network pair were not significant (p > 0.05).
3.5. Associations Between Network Changes and Behavioral Gains
Spearman rank correlations were computed between ΔTTE (music–no music) and the differences of all 40 network metrics (16 global graph metrics: ΔEglob, ΔEloc, ΔCp, and Δγ across bands; and 24 within- and between-network connection-strength differences).
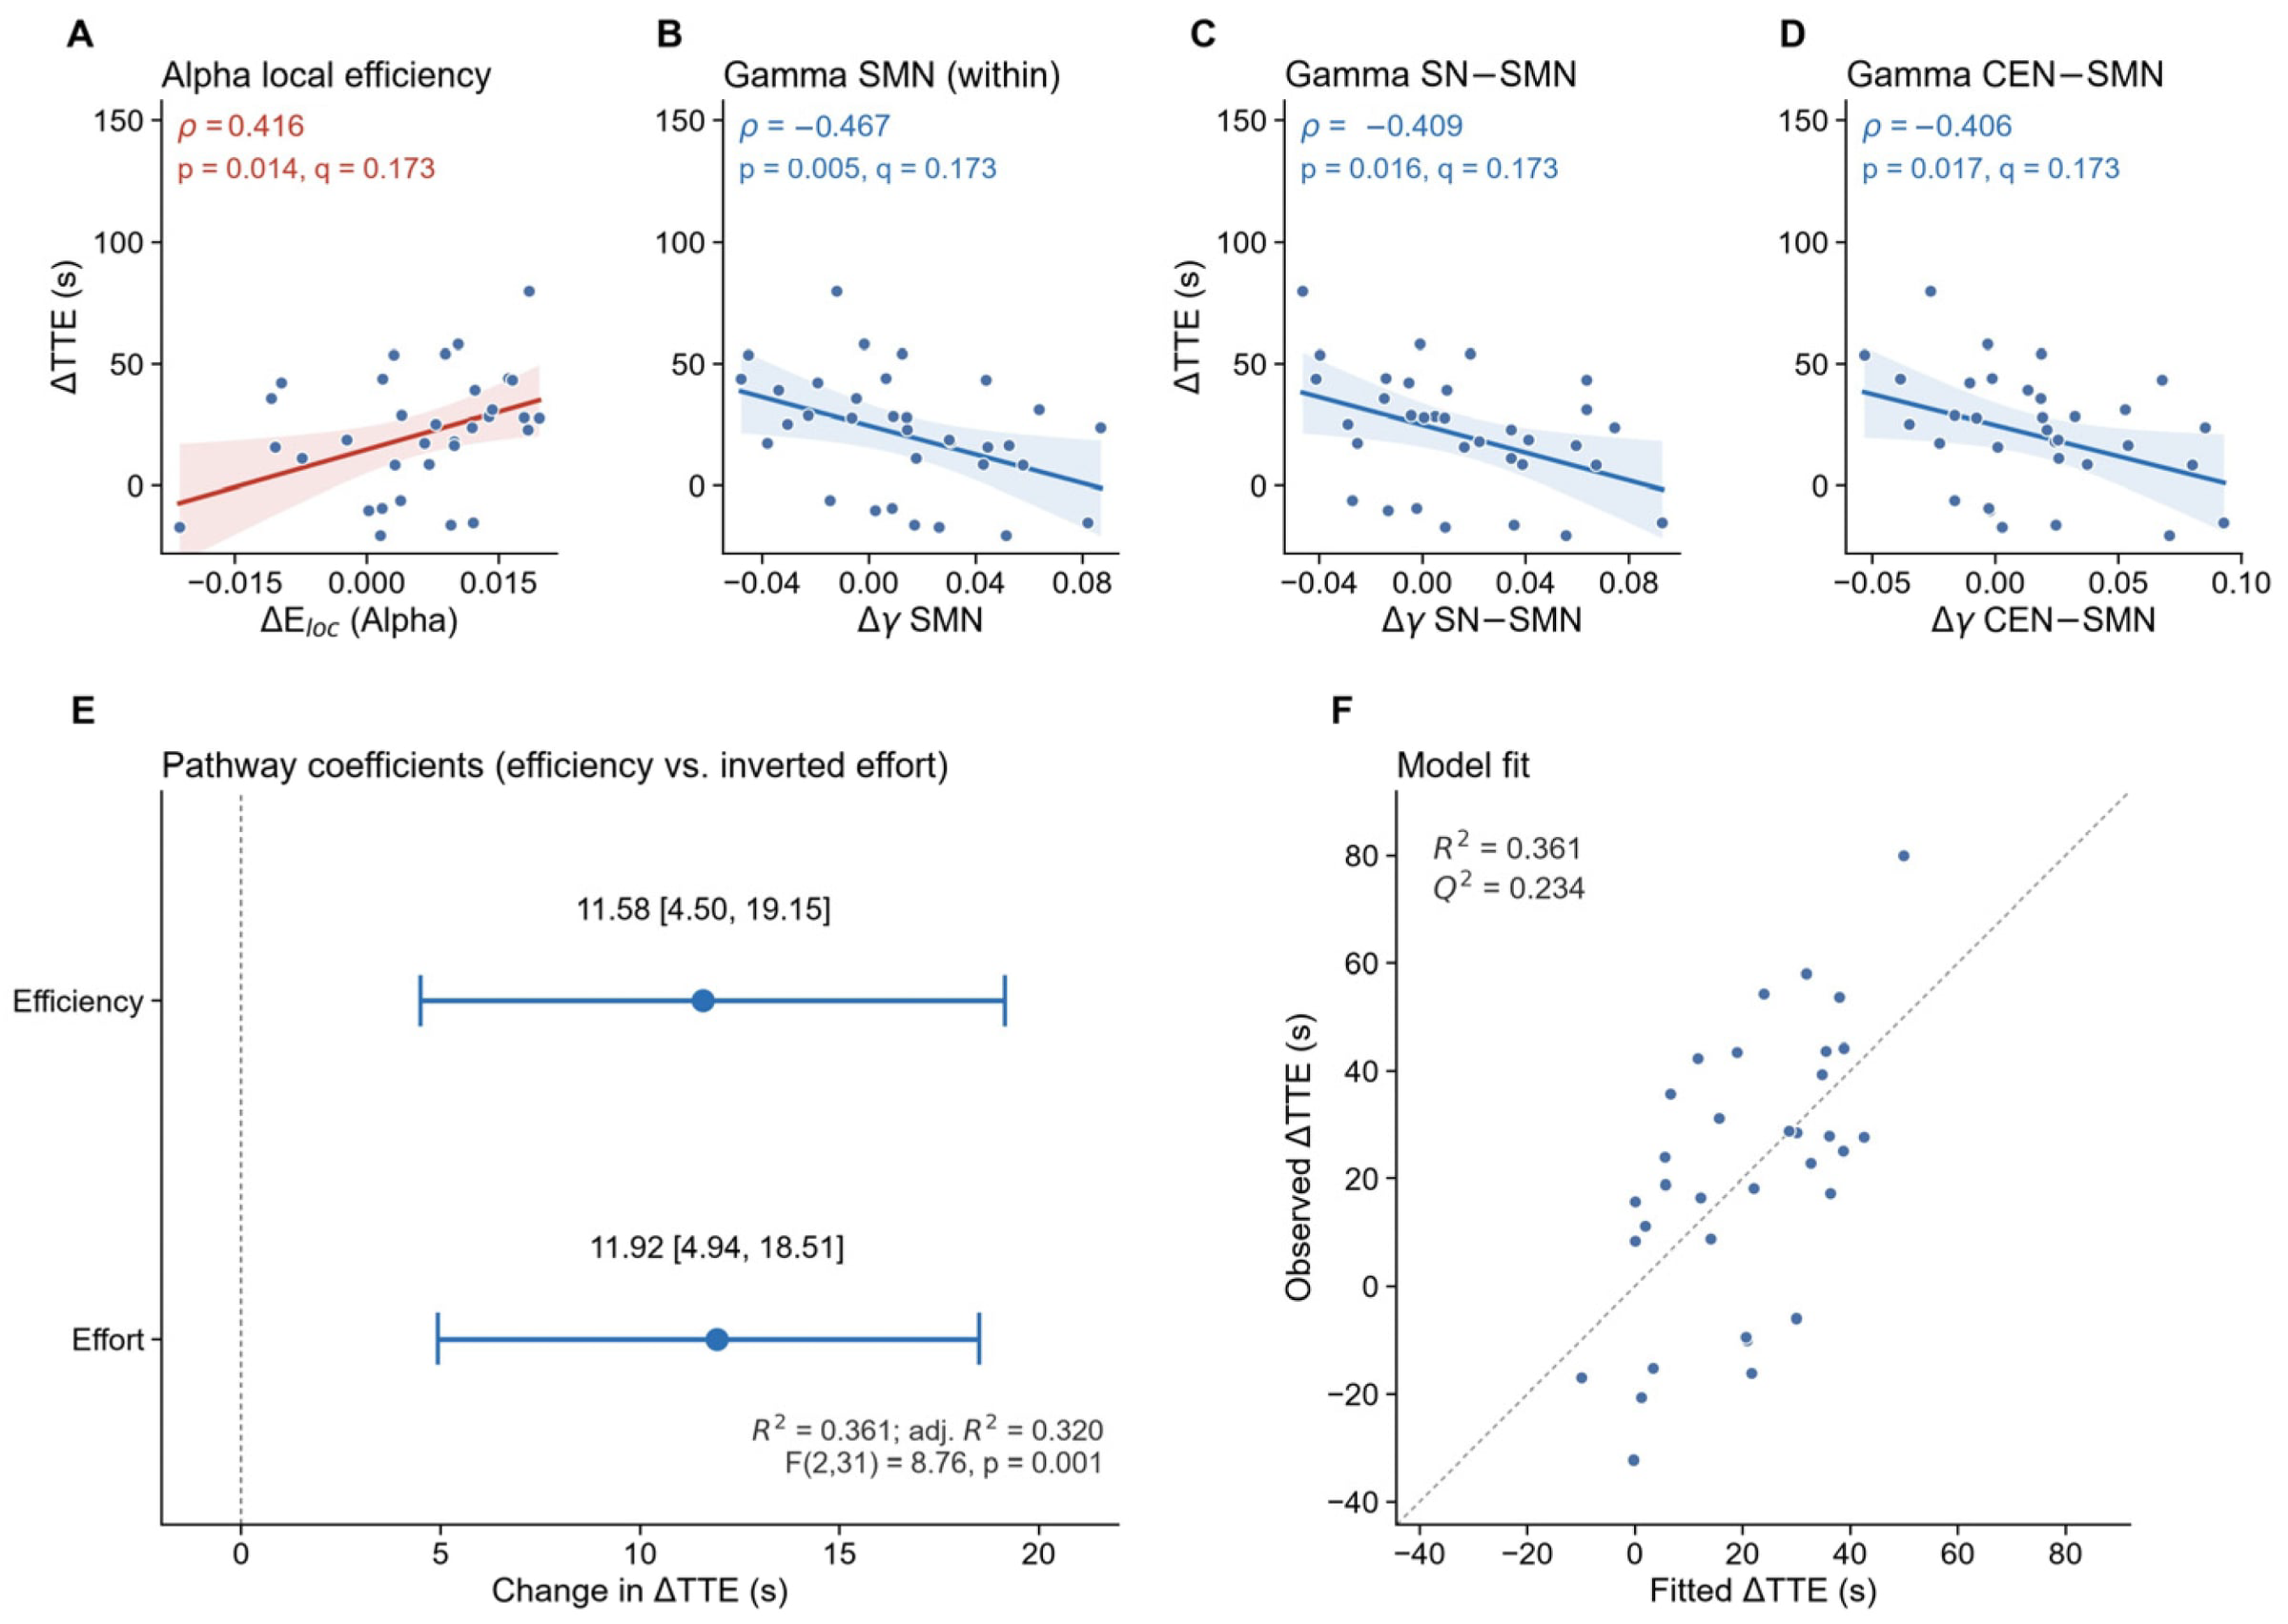
Global network topology: The alpha-band ΔEloc correlated positively with ΔTTE (ρ = 0.416, p = 0.014, q = 0.173), suggesting that individuals with larger music-induced increases in alpha-band local efficiency gained more endurance. No other metric reached significance (uncorrected p > 0.05).
Functional connectivity: The increments of gamma-band SMN within-network coupling (ρ = −0.467, p = 0.005, q = 0.173), SN–SMN between-network coupling (ρ = −0.409, p = 0.016, q = 0.173), and CEN–SMN between-network coupling (ρ = −0.406, p = 0.017, q = 0.173) correlated negatively with ΔTTE, and the beta-band SMN within-network increment was also negatively correlated (ρ = −0.341, p = 0.049, q = 0.390). These results suggest that larger increases in gamma-band sensorimotor coupling were associated with smaller behavioral gains. It should be noted that, after FDR correction across all 40 metrics, none of the correlations reached significance (minimum q = 0.173); all 40 correlations are shown in Figure S1, and these index-level results should therefore be regarded as exploratory findings.
To further examine the relationship between neural changes and behavioral gains, a multiple linear regression was constructed at the construct level, based on the correlation results in combination with the a priori two-pathway hypothesis (shown in Figure 4): the alpha-band ΔEloc (neural-efficiency pathway) and the standardized, negatively scored composite of the gamma-band SMN, CEN–SMN, and SN–SMN coupling increments (neural-effort pathway) served as predictors, and ΔTTE as the outcome. The model was statistically significant (R2 = 0.361, adjusted R2 = 0.320, F(2,31) = 8.76, p = 0.001): each 1 SD increase in the efficiency pathway was associated with an 11.58 s longer ΔTTE (95% CI [4.50, 19.15], t = 3.13, p = 0.004), and each 1 SD decrease in the effort pathway with an 11.92 s longer ΔTTE (95% CI [4.94, 18.51], t = 3.12, p = 0.004); the two predictors were nearly free of collinearity (VIF = 1.01, Pearson r = −0.113). Repeated 10-fold cross-validation gave Q2 = 0.233 with the two composites fixed, and 0.180 when their metrics were re-selected strictly inside each training fold. The fitted R2 of 0.361 is therefore optimistically biased by the metric selection, and the construct-level conclusions warrant replication in an independent sample.
Figure 4.
Music-induced changes in brain-network metrics and their association with endurance gains. (A) Alpha-band local efficiency increment; (B–D) gamma-band within-network (SMN) and between-network (SMN–SN, SMN–CEN) coupling increments, all plotted against ΔTTE (=music–no music). Spearman ρ, uncorrected p, and Benjamini–Hochberg q (40-metric family) are given in each panel; shaded bands indicate the 95% CI of the OLS trend line and are shown for visual guidance only. (E) OLS coefficients of the two hypothesis-guided pathways with percentile-bootstrap 95% CIs (5000 resamples); (F) fitted versus observed ΔTTE. n = 34.
4. Discussion
Music prolonged time to exhaustion without increasing whole-brain integration: it raised Eloc, a graph-topological index of local clustering, and the size of the benefit was tracked by two dissociable neural routes, an increase in alpha-band local efficiency and a reduction in gamma-band coupling. The present study collected its measurements during the task: 34 healthy young men performed a fixed-load handgrip to exhaustion with and without self-selected music while source-level EEG was recorded, and functional coupling and graph-topological metrics of the central executive, salience, and sensorimotor networks were estimated in four frequency bands across early, middle, and late phases. The most salient finding was that music raised local efficiency and the clustering coefficient in all four bands while leaving global efficiency and the normalized clustering coefficient unchanged. Alongside this, beta- and gamma-band coupling was lower in the middle phase than in the early and late phases in both conditions, and this course did not differ between conditions. The two indices that tracked the behavioral gain moved in opposite directions, and each contributed independently. These results suggest that the ergogenic effect of music is not a global reorganization of the brain but a shift toward denser local clustering within cortical networks, one that leaves the time course of fatigue-related coupling unchanged and whose size was accounted for by two dissociable neural routes.
4.1. Music Enhances Local Efficiency Without Changing Global Integration
This study found that music prolonged time to exhaustion, and the topological changes were confined to the local indices: Eloc and Cp rose in all four bands, whereas Eglob and the normalized clustering coefficient γ did not change. Cp quantifies how densely the neighbors of a node are interconnected and Eloc how efficiently information is exchanged among them, whereas Eglob reflects the mean of the inverse shortest path lengths across the whole network [35]. A rise in the two local indices with the global index unchanged therefore indicates denser connections around each node and more efficient exchange within those neighborhoods, while whole-brain routing capacity is preserved. The pattern thus reflects a shift toward a more specialized local organization rather than a global enhancement. Graph-theoretical EEG studies have shown that music perception modulates the topological organization of functional networks [39]; the present study applies music as an intervention in exhaustive handgrip exercise. The neural efficiency hypothesis holds that economical task performance is supported by more specialized, locally organized processing rather than by a globally elevated level of activity [40], and our results are consistent with it. Functionally, this enhanced local processing capacity may contribute to prolonging time to exhaustion under music.
Music had limited influence on topological properties across the fatigue phases. Neither the main effect of phase nor the condition × phase interaction reached significance, indicating that the topology of the three networks remained relatively stable across the fatigue process. Graph metrics summarize network organization but do not reflect how it changes across phases. A fatiguing cycling study shows that coherence between the mid/anterior insular and motor cortex increased while other connections were largely unaffected [41]. Graph metrics alone therefore do not give a complete picture of fatigue-related reorganization, and network-level connectivity analyses are required.
4.2. Fatigue-Related Coupling Changes Occur Independently of Music
The connectivity results provide a window into the neural dynamics underlying central fatigue. Under both conditions, beta- and gamma-band within-network strength of CEN, SN, and SMN and between-network strength of CEN–SN, CEN–SMN, and SN–SMN were significantly lower in the middle phase than in the early and late phases, indicating that music did not alter the basic form of this system-wide reorganization; the dynamics of the fatigue process ran their course regardless of condition. H3, which predicted that music would modulate the phase profile itself, was therefore not supported. Beta and gamma oscillations are involved in maintaining current motor commands, binding information, and encoding effort signals [42,43,44]. The widespread reduction in coupling strength during the middle phase may therefore reflect weakened central regulation of motor output or a transient withdrawal of effort signaling. The mid-task trough with end-phase recovery is consistent with the end-spurt described by pacing and anticipatory-regulation theories [11,12]: as the anticipated endpoint approaches, participants reinvest effort and network coupling recovers. Moreover, because the task used a fixed isometric load and motor output was held constant throughout, these coupling changes can be attributed to central processes rather than to differences in force output.
4.3. Dual Pathways Linking Network Modulation to Endurance Gains
Under music, theta-band CEN within-network coupling was higher than without music in all three fatigue phases, and theta-band SN and SMN within-network coupling showed music-related elevations in the early phase. The theta rhythm has been associated with cognitive control, working-memory maintenance, and top-down task-set configuration [45]; the sustained theta-coupling enhancement in CEN may therefore reflect music helping to maintain a relatively stable investment of task goals and attentional resources. The alpha-band music effect appeared in CEN during the middle phase. The alpha (mu) rhythm has been linked to excitability regulation and information gating in sensorimotor cortex [46,47], and the middle phase is also the period in which beta- and gamma-band coupling declines most markedly; the relative rise in alpha coupling may therefore represent a compensatory gating mechanism that suppresses irrelevant input and maintains synchronization of task-relevant pathways to safeguard motor output at a reduced cost. Overall, theta and alpha oscillations have been implicated in state-like regulation of arousal, attention, and gating and appear to be readily modulated by external rhythmic stimulation: music has been reported to shape motor cortical excitability and rhythmic expectancy via auditory–motor pathways [10], and these bands are among those most sensitive to rhythmic input. Beta- and gamma-band coupling strength, in contrast, appears to be more closely tied to motor execution and to the internal fatigue process, showing little modulation by auditory stimulation in the present data. Taken together, the alpha-band local-efficiency increment, which may reflect processing efficiency, correlated positively with behavioral gains, whereas the gamma-band coupling increment, which may reflect effort signaling, correlated negatively.
Regression analysis showed that the alpha-band local-efficiency increment and the gamma-band coupling increment were each independently associated with ΔTTE, with minimal collinearity (VIF = 1.01); per-SD increments corresponded to 11.58 s (95% CI 4.50–19.15) and 11.92 s (95% CI 4.94–18.51) of TTE, respectively, and the model accounted for 36.1% of the variance. The nearly identical magnitudes of the two coefficients suggest that the two pathways may operate as parallel mechanisms of comparable contribution rather than as a single dominant effect. Reading the gamma-band coupling increment as a signature of neural effort, however, is an inference, not a measurement: perceived effort, motivation, arousal and fatigue were not assessed, and tempo was not recorded, so affective and auditory–motor routes to the same gamma-band increase cannot be excluded.
4.4. Theoretical and Practical Implications
The present findings carry implications for how the ergogenic effect of music is conceptualized. Existing accounts of this effect have centered chiefly on attentional, affective, and sensorimotor processes such as distraction, mood regulation, arousal optimization, and rhythmic entrainment [1,2]. The network-level reorganization documented above adds the neural level of description that these accounts leave open: rather than acting solely through motivation or distraction, music was accompanied by measurable changes in cortical network organization. This pattern is consistent with models that treat fatigue as an actively regulated brain state rather than a monotonic depletion of peripheral resources [11,12], and with the economy of brain network organization [19]. These results are also consistent with the neural-efficiency hypothesis in the motor domain, in that individuals with higher task efficiency tend to invest fewer neural resources [40,41,48], and listening to music may transiently reduce cortical resource investment during fatiguing exercise [49]. Graph metrics alone, however, cannot demonstrate that the same behavioral output was produced at lower metabolic cost, so this interpretation remains indirect.
At the practical level, these results suggest that music prescription can move from generic arousal stimulation toward mechanism-informed selection. If the benefit arises mainly through the efficiency pathway, selection should prioritize the features that stabilize auditory attention and rhythmic expectancy, such as a clear beat and a tempo matched to movement frequency [50,51], with individual preference as a further criterion [50]. Two handgrip studies indicate that the effective variable is the configuration of features rather than any single dimension of the stimulus. Karageorghis et al. [25] found that the tempo and loudness of music heard before the task acted jointly on maximal grip strength, so that the advantage of a fast tempo appeared only when loudness was high. Kırış et al. [26] derived rhythm, melody, and their combination from a single musical structure and presented them during maximal contractions; force was highest under rhythm alone, whereas the rhythm × melody interaction was significant and neither main effect was.
What the present data add is a within-task neural readout of which mechanism is engaged. Alpha-band local efficiency and gamma-band coupling each accounted for an independent share of the behavioral gain with minimal collinearity, so a recording obtained during the fatiguing task separates individuals in whom the efficiency pathway predominates from those in whom the effort pathway does. Because individual differences in cortical connectivity are stable enough at baseline to predict subsequent skill acquisition [21], and network efficiency nonetheless remains modifiable by training [22], such a measure is a candidate index for matching music to the individual. Where fatigue tolerance is low and output must nonetheless be maintained, music is best combined with pacing or rest-scheduling strategies rather than used alone [11].
Because these metrics describe general properties of cortical network organization rather than features of the handgrip task, the same reasoning applies wherever sustained force output must be maintained under fatigue, including rehabilitation training, physically demanding occupations, and competitive sport [20].
4.5. Limitations
Several limitations of this study should be considered when interpreting the results. First, peripheral measures such as surface electromyography, maximal voluntary contraction force, or electrically evoked twitch force were not collected, so the central and peripheral components of fatigue could not be quantitatively dissociated at the individual level [52]; future studies could pair EEG recordings with these peripheral measures to quantify the peripheral contribution directly. Second, source-space reconstruction mitigates volume conduction but not spatial leakage, which can spuriously generate zero-phase-lag coupling in PLV; leakage-attenuating indices such as imaginary coherence or the weighted phase lag index [53] would provide a complementary test, and the gamma-band coupling composite should be interpreted with caution. PLV was retained for its invariance to the sign of the source orientation [16] and the use of phase-synchronization indices in the source-level fatigue literature [41]. Third, although a uniform exhaustion criterion was used to control fatigue level, participants completed a larger total amount of work under music; future studies could adopt an iso-work control design to separate the direct neural effects of music from the indirect effects of greater fatigue. Fourth, the music was participant-selected, with large individual differences in rhythm, tonality, familiarity, and preference, and musical structure was not experimentally manipulated. Tempo, genre, familiarity, lyrical content and self-reported valence and arousal were not recorded and the number of distinct tracks was not logged, so the results speak to self-selected preferred music as a whole and cannot identify which features carry the effect; future studies could therefore manipulate these feature variables and compare standardized with individualized music conditions. Fifth, subjective exertion (RPE) [54], affective valence and arousal, and heart-rate variability were not collected, so the relative contributions of arousal, distraction, and mood pathways could not be disentangled. Sixth, the sample consisted of 34 male physical-education undergraduates with a concentrated age range, a high fitness level, and uniform right-handedness; generalization to women, older adults, clinical populations, and the non-dominant hand requires caution. Seventh, a unilateral isometric handgrip task differs markedly from whole-body endurance tasks in motor-unit recruitment, cardiorespiratory load, and central regulation [55]; the present conclusions should therefore not be extrapolated directly to whole-body exercise such as running or cycling. Eighth, the correlation and regression analyses are based on cross-sectional data from only 34 participants; 63.9% of the variance remains unexplained, and none of the bivariate correlations survived FDR correction [56]; therefore, all associative conclusions should be regarded as exploratory and do not support causal inference.
5. Conclusions
In young, healthy men performing a fixed-load handgrip to exhaustion, music increased the local efficiency of cortical networks without changing whole-brain integration, and the size of the resulting benefit tracked two dissociable pathways of comparable weight: an increase in alpha-band local efficiency and a relative reduction in gamma-band coupling. Beta/gamma coupling did not fall monotonically as fatigue accumulated: it was lower in the middle phase than at either end of the task under both conditions, which suggests that central fatigue involves a phase-dependent reorganization of network coupling rather than a monotonic depletion of resources. The alpha-band local-efficiency increment and the relative reduction in gamma-band coupling were each independently associated with larger TTE gains, indicating that the neural basis of the ergogenic effect is not unitary but comprises at least two separable routes with distinct electrophysiological signatures.
Supplementary Materials
The following supporting information can be downloaded at https://www.mdpi.com/article/10.3390/biology15222125/s1, Figure S1: Spearman correlations between all 40 network metrics and ΔTTE, with 95% CIs (Fisher z). Key metrics are highlighted; none survived FDR correction (minimum q = 0.173); Table S1: Original behavioral data and network connection data.
Author Contributions
Conceptualization, S.Z. and A.C.; methodology, S.Z. and A.C.; software, S.Z. and C.Y.; validation, X.L.; formal analysis, S.Z.; investigation, S.Z. and C.Y.; resources, A.C. and X.L.; data curation, S.Z., C.Y. and A.C.; writing—original draft preparation, S.Z.; writing—review and editing, S.Z.; visualization, T.X.; supervision, A.C.; project administration, S.Z., T.X. and A.C.; funding acquisition, A.C. All authors have read and agreed to the published version of the manuscript.
Funding
This work was supported by the National Education Science Planning Foundation of China (BLA230107).
Institutional Review Board Statement
This study was conducted in accordance with the Declaration of Helsinki and was approved by the Institutional Review Board of the Academic Committee of Shaanxi Normal University (Protocol Code 202516035 and date of approval: 29 May 2025).
Informed Consent Statement
Informed consent was obtained from all subjects involved in the study.
Data Availability Statement
The original contributions presented in this study are included in the article/Supplementary Material, https://doi.org/10.6084/m9.figshare.34799682. Further inquiries can be directed to the corresponding authors.
Acknowledgments
The authors thank Siying Technology Co., Ltd. and Mingchuang Technology Co., Ltd. for providing MATLAB codes.
Conflicts of Interest
The authors declare no conflicts of interest. The company had no role in the study design, data analysis, interpretation, or the decision to publish.
Abbreviations
The following abbreviations are used in this manuscript:
| CEN | Central executive network |
| SMN | Sensorimotor network |
| SN | Salience network |
| EEG | Electroencephalography |
| PLV | Phase-locking value |
| ROI | Region of interest |
| sLORETA | Standardized LORETA |
| Cp | Clustering coefficient |
| Eglob | Global efficiency |
| Eloc | Local efficiency |
| ANOVA | Analysis of variance |
| CI | Confidence interval |
| FDR | False discovery rate |
| OLS | Ordinary least squares |
| RPE | Rating of perceived exertion |
| TTE | Time to exhaustion |
| VIF | Variance inflation factor |
References
- Karageorghis, C.I.; Priest, D.L. Music in the exercise domain: A review and synthesis (Part I). Int. Rev. Sport Exerc. Psychol. 2012, 5, 44–66. [Google Scholar] [CrossRef] [Scilit] [PubMed]
- Terry, P.C.; Karageorghis, C.I.; Curran, M.L.; Martin, O.V.; Parsons-Smith, R.L. Effects of music in exercise and sport: A meta-analytic review. Psychol. Bull. 2020, 146, 91–117. [Google Scholar] [CrossRef] [Scilit] [PubMed]
- Jebabli, N.; Ben Aabderrahman, A.; Boullosa, D.; Chtourou, H.; Ouerghi, N.; Rhibi, F.; Govindasamy, K.; Saeidi, A.; Clark, C.C.T.; Granacher, U.; et al. Listening to music during a repeated sprint test improves performance and psychophysiological responses in healthy and physically active male adults. BMC Sports Sci. Med. Rehabil. 2023, 15, 21. [Google Scholar] [CrossRef] [Scilit] [PubMed]
- Pusey, C.G.; Haugen, T.; Høigaard, R.; Ivarsson, A.; Røshol, A.W.; Laxdal, A. Put some music on: The effects of pre-task music tempo on arousal, affective state, perceived exertion, and anaerobic performance. Music Sci. 2023, 6, 20592043231174388. [Google Scholar] [CrossRef] [Scilit]
- Sreepetch, S.; Ramyarangsi, P.; Mukda, S.; Siripornpanich, V.; Ajjimaporn, A. Recovery effects of slow-tempo preferred music on brain activity, physiological and psychological responses following high-intensity interval exercise in healthy male adults. Acta Psychol. 2025, 259, 105456. [Google Scholar] [CrossRef] [Scilit] [PubMed]
- Qiu, B.; Wang, Z.; Zhang, Y.; Cui, Y.; Diao, P.; Liu, K.; Del Coso, J.; Liu, C. Effects of caffeine intake combined with self-selected music during warm-up on anaerobic performance: A randomized, double-blind, crossover study. Nutrients 2025, 17, 351. [Google Scholar] [CrossRef] [Scilit] [PubMed]
- Pérez-Pacheco, A.; Rodríguez Morales, F.Y.; Misaghian, K.; Faubert, J.; Lugo Arce, J.E. Auditory noise facilitates lower visual reaction times in humans. Biology 2024, 13, 631. [Google Scholar] [CrossRef] [Scilit] [PubMed]
- Fukuie, T.; Suwabe, K.; Kawase, S.; Shimizu, T.; Ochi, G.; Kuwamizu, R.; Sakairi, Y.; Soya, H. Groove rhythm stimulates prefrontal cortex function in groove enjoyers. Sci. Rep. 2022, 12, 7377. [Google Scholar] [CrossRef] [Scilit] [PubMed]
- Pranjić, M.; Braun Janzen, T.; Vukšić, N.; Thaut, M. From sound to movement: Mapping the neural mechanisms of auditory–motor entrainment and synchronization. Brain Sci. 2024, 14, 1063. [Google Scholar] [CrossRef] [Scilit] [PubMed]
- Repp, B.H.; Su, Y.-H. Sensorimotor synchronization: A review of recent research (2006–2012). Psychon. Bull. Rev. 2013, 20, 403–452. [Google Scholar] [CrossRef] [Scilit] [PubMed]
- St Clair Gibson, A.; Lambert, E.V.; Rauch, L.H.G.; Tucker, R.; Baden, D.A.; Foster, C.; Noakes, T.D. The role of information processing between the brain and peripheral physiological systems in pacing and perception of effort. Sports Med. 2006, 36, 705–722. [Google Scholar] [CrossRef] [Scilit] [PubMed]
- Noakes, T.D. Fatigue is a brain-derived emotion that regulates the exercise behavior to ensure the protection of whole body homeostasis. Front. Physiol. 2012, 3, 82. [Google Scholar] [CrossRef] [Scilit] [PubMed]
- Yao, S.; Lu, H.; Zhang, L.; Liu, F.; Ma, F.; Chi, A. Acute exercise fatigue impairs cognitive control: Neurophysiological mechanisms revealed by ERP and ERSP analyses. Biology 2025, 14, 1688. [Google Scholar] [CrossRef] [Scilit] [PubMed]
- Weiss, E.; Kann, M.; Wang, Q. Neuromodulation of neural oscillations in health and disease. Biology 2023, 12, 371. [Google Scholar] [CrossRef] [Scilit] [PubMed]
- Betti, S.; Zani, G.; Guerra, S.; Granziol, U.; Castiello, U.; Begliomini, C.; Sartori, L. When corticospinal inhibition favors an efficient motor response. Biology 2023, 12, 332. [Google Scholar] [CrossRef] [Scilit] [PubMed]
- Lachaux, J.-P.; Rodriguez, E.; Martinerie, J.; Varela, F.J. Measuring phase synchrony in brain signals. Hum. Brain Mapp. 1999, 8, 194–208. [Google Scholar] [CrossRef] [Scilit]
- Oknina, L.B.; Strelnikova, E.V.; Lin, L.-F.; Kashirina, M.; Slezkin, A.; Zakharov, V. Alterations in functional connectivity of the brain during postural balance maintenance with auditory stimuli: A stabilometry and electroencephalogram study. Biomed. Phys. Eng. Express 2025, 11, 035006. [Google Scholar] [CrossRef] [Scilit] [PubMed]
- Watts, D.J.; Strogatz, S.H. Collective dynamics of ‘small-world’ networks. Nature 1998, 393, 440–442. [Google Scholar] [CrossRef] [Scilit] [PubMed]
- Bullmore, E.; Sporns, O. The economy of brain network organization. Nat. Rev. Neurosci. 2012, 13, 336–349. [Google Scholar] [CrossRef] [Scilit] [PubMed]
- Lee, J.; Eom, T.-H. From EEG source localization to brain network analysis: A computational neuroscience perspective. Biology 2026, 15, 1622. [Google Scholar] [CrossRef] [Scilit] [PubMed]
- Wu, J.; Srinivasan, R.; Kaur, A.; Cramer, S.C. Resting-state cortical connectivity predicts motor skill acquisition. NeuroImage 2014, 91, 84–90. [Google Scholar] [CrossRef] [Scilit] [PubMed]
- Langer, N.; von Bastian, C.C.; Wirz, H.; Oberauer, K.; Jäncke, L. The effects of working memory training on functional brain network efficiency. Cortex 2013, 49, 2424–2438. [Google Scholar] [CrossRef] [Scilit] [PubMed]
- Fan, J.; Li, B.; Liu, F.; Jiao, F.; Chi, A.; Yao, S. The effect of music stimulation on resting-state brain functional networks following exhaustive endurance exercise: An EEG study. Brain Sci. 2026, 16, 258. [Google Scholar] [CrossRef] [Scilit] [PubMed]
- Faul, F.; Erdfelder, E.; Buchner, A.; Lang, A.-G. Statistical power analyses using G*Power 3.1: Tests for correlation and regression analyses. Behav. Res. Methods 2009, 41, 1149–1160. [Google Scholar] [CrossRef] [Scilit] [PubMed]
- Karageorghis, C.I.; Cheek, P.; Simpson, S.D.; Bigliassi, M. Interactive effects of music tempi and intensities on grip strength and subjective affect. Scand. J. Med. Sci. Sports 2018, 28, 1166–1175. [Google Scholar] [CrossRef] [Scilit] [PubMed]
- Kırış, O.B.; Erik, E.; Özbay, C.; Azaklı, A.E. Acute differences in isometric handgrip strength across conditions derived from a single musical structure. Audit. Percept. Cogn. 2026, 2732844. [Google Scholar] [CrossRef] [Scilit]
- Jurcak, V.; Tsuzuki, D.; Dan, I. 10/20, 10/10, and 10/5 systems revisited: Their validity as relative head-surface-based positioning systems. NeuroImage 2007, 34, 1600–1611. [Google Scholar] [CrossRef] [Scilit] [PubMed]
- Delorme, A.; Makeig, S. EEGLAB: An open source toolbox for analysis of single-trial EEG dynamics including independent component analysis. J. Neurosci. Methods 2004, 134, 9–21. [Google Scholar] [CrossRef] [Scilit] [PubMed]
- Pion-Tonachini, L.; Kreutz-Delgado, K.; Makeig, S. ICLabel: An automated electroencephalographic independent component classifier, dataset, and website. NeuroImage 2019, 198, 181–197. [Google Scholar] [CrossRef] [Scilit] [PubMed]
- Tadel, F.; Baillet, S.; Mosher, J.C.; Pantazis, D.; Leahy, R.M. Brainstorm: A user-friendly application for MEG/EEG analysis. Comput. Intell. Neurosci. 2011, 2011, 879716. [Google Scholar] [CrossRef] [Scilit] [PubMed]
- Buzsáki, G. Rhythms of the Brain; Oxford University Press: New York, NY, USA, 2006. [Google Scholar] [CrossRef] [Scilit]
- Yeo, B.T.T.; Krienen, F.M.; Sepulcre, J.; Sabuncu, M.R.; Lashkari, D.; Hollinshead, M.; Roffman, J.L.; Smoller, J.W.; Zöllei, L.; Polimeni, J.R.; et al. The organization of the human cerebral cortex estimated by intrinsic functional connectivity. J. Neurophysiol. 2011, 106, 1125–1165. [Google Scholar] [CrossRef] [Scilit] [PubMed]
- Schaefer, A.; Kong, R.; Gordon, E.M.; Laumann, T.O.; Zuo, X.-N.; Holmes, A.J.; Eickhoff, S.B.; Yeo, B.T.T. Local-global parcellation of the human cerebral cortex from intrinsic functional connectivity MRI. Cereb. Cortex 2018, 28, 3095–3114. [Google Scholar] [CrossRef] [Scilit] [PubMed]
- Wu, X.; Liang, C.; Bustillo, J.; Kochunov, P.; Wen, X.; Sui, J.; Jiang, R.; Yang, X.; Fu, Z.; Zhang, D.; et al. The impact of atlas parcellation on functional connectivity analysis across six psychiatric disorders. Hum. Brain Mapp. 2025, 46, e70206. [Google Scholar] [CrossRef] [Scilit] [PubMed]
- Rubinov, M.; Sporns, O. Complex network measures of brain connectivity: Uses and interpretations. NeuroImage 2010, 52, 1059–1069. [Google Scholar] [CrossRef] [Scilit] [PubMed]
- Wang, J.; Wang, X.; Xia, M.; Liao, X.; Evans, A.; He, Y. GRETNA: A graph theoretical network analysis toolbox for imaging connectomics. Front. Hum. Neurosci. 2015, 9, 386. [Google Scholar] [CrossRef] [Scilit] [PubMed]
- Zalesky, A.; Fornito, A.; Bullmore, E.T. Network-based statistic: Identifying differences in brain networks. NeuroImage 2010, 53, 1197–1207. [Google Scholar] [CrossRef] [Scilit] [PubMed]
- Zalesky, A.; Cocchi, L.; Fornito, A.; Murray, M.M. Connectivity differences in brain networks. NeuroImage 2012, 60, 1055–1062. [Google Scholar] [CrossRef] [Scilit] [PubMed]
- Wu, J.; Zhang, J.; Liu, C.; Liu, D.; Ding, X.; Zhou, C. Graph theoretical analysis of EEG functional connectivity during music perception. Brain Res. 2012, 1483, 71–81. [Google Scholar] [CrossRef] [Scilit] [PubMed]
- Neubauer, A.C.; Fink, A. Intelligence and neural efficiency. Neurosci. Biobehav. Rev. 2009, 33, 1004–1023. [Google Scholar] [CrossRef] [Scilit] [PubMed]
- Hilty, L.; Langer, N.; Pascual-Marqui, R.; Boutellier, U.; Lutz, K. Fatigue-induced increase in intracortical communication between mid/anterior insular and motor cortex during cycling exercise. Eur. J. Neurosci. 2011, 34, 2035–2042. [Google Scholar] [CrossRef] [Scilit] [PubMed]
- Engel, A.K.; Fries, P. Beta-band oscillations—Signalling the status quo? Curr. Opin. Neurobiol. 2010, 20, 156–165. [Google Scholar] [CrossRef] [Scilit] [PubMed]
- Fries, P. Rhythms for cognition: Communication through coherence. Neuron 2015, 88, 220–235. [Google Scholar] [CrossRef] [Scilit] [PubMed]
- Tallon-Baudry, C.; Bertrand, O. Oscillatory gamma activity in humans and its role in object representation. Trends Cogn. Sci. 1999, 3, 151–162. [Google Scholar] [CrossRef] [Scilit] [PubMed]
- Cavanagh, J.F.; Frank, M.J. Frontal theta as a mechanism for cognitive control. Trends Cogn. Sci. 2014, 18, 414–421. [Google Scholar] [CrossRef] [Scilit] [PubMed]
- Pfurtscheller, G.; Lopes da Silva, F.H. Event-related EEG/MEG synchronization and desynchronization: Basic principles. Clin. Neurophysiol. 1999, 110, 1842–1857. [Google Scholar] [CrossRef] [Scilit] [PubMed]
- Jensen, O.; Mazaheri, A. Shaping functional architecture by oscillatory alpha activity: Gating by inhibition. Front. Hum. Neurosci. 2010, 4, 186. [Google Scholar] [CrossRef] [Scilit] [PubMed]
- Del Percio, C.; Infarinato, F.; Iacoboni, M.; Marzano, N.; Soricelli, A.; Aschieri, P.; Eusebi, F.; Babiloni, C. Movement-related desynchronization of alpha rhythms is lower in athletes than non-athletes: A high-resolution EEG study. Clin. Neurophysiol. 2010, 121, 482–491. [Google Scholar] [CrossRef] [Scilit] [PubMed]
- Bigliassi, M.; Karageorghis, C.I.; Nowicky, A.V.; Orgs, G.; Wright, M.J. Cerebral mechanisms underlying the effects of music during a fatiguing isometric ankle-dorsiflexion task. Psychophysiology 2016, 53, 1472–1483. [Google Scholar] [CrossRef] [Scilit] [PubMed]
- Karageorghis, C.I.; Terry, P.C. Inside Sport Psychology; Human Kinetics: Champaign, IL, USA, 2010. [Google Scholar] [CrossRef] [Scilit]
- Karageorghis, C.I.; Jones, L.; Low, D.C. Relationship between exercise heart rate and music tempo preference. Res. Q. Exerc. Sport 2006, 77, 240–250. [Google Scholar] [CrossRef] [PubMed]
- Gandevia, S.C. Spinal and supraspinal factors in human muscle fatigue. Physiol. Rev. 2001, 81, 1725–1789. [Google Scholar] [CrossRef] [Scilit] [PubMed]
- Vinck, M.; Oostenveld, R.; van Wingerden, M.; Battaglia, F.; Pennartz, C.M.A. An improved index of phase-synchronization for electrophysiological data in the presence of volume-conduction, noise and sample-size bias. NeuroImage 2011, 55, 1548–1565. [Google Scholar] [CrossRef] [Scilit] [PubMed]
- Borg, G.A. Psychophysical bases of perceived exertion. Med. Sci. Sports Exerc. 1982, 14, 377–381. [Google Scholar] [CrossRef] [Scilit]
- Enoka, R.M.; Duchateau, J. Translating fatigue to human performance. Med. Sci. Sports Exerc. 2016, 48, 2228–2238. [Google Scholar] [CrossRef] [Scilit] [PubMed]
- Benjamini, Y.; Hochberg, Y. Controlling the false discovery rate: A practical and powerful approach to multiple testing. J. R. Stat. Soc. Ser. B 1995, 57, 289–300. [Google Scholar] [CrossRef] [Scilit]

Disclaimer/Publisher’s Note: The statements, opinions and data contained in all publications are solely those of the individual author(s) and contributor(s) and not of MDPI and/or the editor(s). MDPI and/or the editor(s) disclaim responsibility for any injury to people or property resulting from any ideas, methods, instructions or products referred to in the content. |
© 2026 by the authors. Licensee MDPI, Basel, Switzerland. This article is an open access article distributed under the terms and conditions of the Creative Commons Attribution (CC BY) license.